Tropical Cyclone Initialization with Dynamical Retrieval · PDF fileTropical Cyclone...
20
Journal of the Meteorological Society of Japan, Vol. 88, No. 5, pp. 827--846, 2010. 827 DOI:10.2151/jmsj.2010-504 Tropical Cyclone Initialization with Dynamical Retrieval from a Modified UWPBL Model Lei-Ming MA Laboratory of Typhoon Forecast Technique/CMA, Shanghai Typhoon Institute, Shanghai, China Key Laboratory of Mesoscale Severe Weather/MOE, School of Atmospheric Sciences, Nanjing University, Nanjing, China and Zhe-Min TAN Key Laboratory of Mesoscale Severe Weather/MOE, School of Atmospheric Sciences, Nanjing University, Nanjing, China (Manuscript received 29 September 2009, in final form 28 June 2010) Abstract A new scheme, termed Vortex Initialization with the Assimilation of Retrieved Variables (VIRV), is presented to improve the initialization of regional numerical model for Tropical Cyclone (TC) prediction. In this scheme, the horizontal winds in Planetary Boundary Layer (PBL) and the sea level pressure (SLP), retrieved from Quick Scatterometer (QuikSCAT) data obtained using a modified University of Washington Planetary Boundary Layer (UWPBL) model, are assimilated with a cycled three-dimensional variational (3DVAR) technique to produce the initialized analysis. The procedures of retrieval are implemented under the joint dynamical constraints of the gra- dient wind, secondary circulation, and thermal stratification. Moreover, in order to improve the analysis of TC intensity, the roughness parameterization in the UWPBL model was modified for the case of strong surface wind. The sensitivities of the structure, intensity, and track of TC to the VIRV are then examined by two numer- ical experiments for TC Bilis (2006) and TC Fung-wong (2008). The maximum Wind Speed (MWS) and minimum Sea Level Pressure (MSLP) retrieved from the QuikSCAT data obtained using the modified UWPBL model show more agreement with the observations relative to those derived from the analysis of the National Center for Environmental Prediction (NCEP global model). The anal- ysis of TC intensity cfm enhanced using VIRV by modifying the low-level (upper-level) convergence (divergence), vertical shear of horizontal wind, transportation of moisture. Significant improvement on 48-h TC simulation is identified in the MWS, with 22.8% error reduction. In particular, the Modification of Roughness Parameteriza- tion (MRP) enhanced the simulation of MWS by 6.9%. Finally, the VIRV also reduces the simulation error in the track of TC by a¤ecting the steering flow throughout the troposphere. Key words: Tropical cyclone; QuikSCAT; Boundary layer; Retrieval; Data assimilation; Model initializa- tion. 1. Introduction In contrast to the recent rapid advances in the numerical models study and forecast for tropical cyclone (hereafter, TC), the advance in vortex initi- alization for TC is relatively slow. Because of the insu‰cient observations over the ocean, the ap- proaches that mainly rely on bogus vortex was designed for TC vortex initialization on the basis Corresponding author: Lei-Ming Ma, Laboratory of Typhoon Forecast Technique/CMA, Shanghai Typhoon Institute, 166 Puxi Rd., Shanghai 200030, P. R. China. E-mail: [email protected] 6 2010, Meteorological Society of Japan
Transcript of Tropical Cyclone Initialization with Dynamical Retrieval · PDF fileTropical Cyclone...

Journal of the Meteorological Society of Japan, Vol. 88, No. 5, pp. 827--846, 2010. 827
DOI:10.2151/jmsj.2010-504
Tropical Cyclone Initialization with Dynamical Retrieval from a Modified UWPBL Model
Lei-Ming MA
Laboratory of Typhoon Forecast Technique/CMA, Shanghai Typhoon Institute, Shanghai, China
Key Laboratory of Mesoscale Severe Weather/MOE, School of Atmospheric Sciences, Nanjing University,
Nanjing, China
and
Zhe-Min TAN
Key Laboratory of Mesoscale Severe Weather/MOE, School of Atmospheric Sciences, Nanjing University,
Nanjing, China
(Manuscript received 29 September 2009, in final form 28 June 2010)
Abstract
A new scheme, termed Vortex Initialization with the Assimilation of Retrieved Variables (VIRV), is presentedto improve the initialization of regional numerical model for Tropical Cyclone (TC) prediction. In this scheme,the horizontal winds in Planetary Boundary Layer (PBL) and the sea level pressure (SLP), retrieved from QuickScatterometer (QuikSCAT) data obtained using a modified University of Washington Planetary Boundary Layer(UWPBL) model, are assimilated with a cycled three-dimensional variational (3DVAR) technique to produce theinitialized analysis. The procedures of retrieval are implemented under the joint dynamical constraints of the gra-dient wind, secondary circulation, and thermal stratification. Moreover, in order to improve the analysis of TCintensity, the roughness parameterization in the UWPBL model was modified for the case of strong surfacewind. The sensitivities of the structure, intensity, and track of TC to the VIRV are then examined by two numer-ical experiments for TC Bilis (2006) and TC Fung-wong (2008).
The maximum Wind Speed (MWS) and minimum Sea Level Pressure (MSLP) retrieved from the QuikSCATdata obtained using the modified UWPBL model show more agreement with the observations relative to thosederived from the analysis of the National Center for Environmental Prediction (NCEP global model). The anal-ysis of TC intensity cfm enhanced using VIRV by modifying the low-level (upper-level) convergence (divergence),vertical shear of horizontal wind, transportation of moisture. Significant improvement on 48-h TC simulation isidentified in the MWS, with 22.8% error reduction. In particular, the Modification of Roughness Parameteriza-tion (MRP) enhanced the simulation of MWS by 6.9%. Finally, the VIRV also reduces the simulation error in thetrack of TC by a¤ecting the steering flow throughout the troposphere.
Key words: Tropical cyclone; QuikSCAT; Boundary layer; Retrieval; Data assimilation; Model initializa-tion.
1. Introduction
In contrast to the recent rapid advances in thenumerical models study and forecast for tropicalcyclone (hereafter, TC), the advance in vortex initi-alization for TC is relatively slow. Because of theinsu‰cient observations over the ocean, the ap-proaches that mainly rely on bogus vortex wasdesigned for TC vortex initialization on the basis
Corresponding author: Lei-Ming Ma, Laboratoryof Typhoon Forecast Technique/CMA, ShanghaiTyphoon Institute, 166 Puxi Rd., Shanghai 200030,P. R. China.E-mail: [email protected] 2010, Meteorological Society of Japan
of limited observations, for example: 1) implantingthe model’s initial fields into a synthetic (bogus)vortex (i.e., Kurihara et al. 1990; Leslie and Hol-land 1995) or a ‘‘spin-up’’ vortex produced by aprevious forecast of numerical model (Kurihara etal. 1995); 2) vortex initialization with the BogusData Assimilation (BDA) during the minimizationof a cost function (i.e., Zou and Xiao 2000; Xiaoet al. 2000). In these schemes, however, the empiri-cal assumption of TC structure will ultimately leadto unrealistic analysis and forecast of TC.
In recent years, to avoid the deficiency of bogusassumption, more and more data assimilation tech-niques, focusing on newly-developed datasets andobservational strategies, have been applied in TCinitialization. For example, Chen et al. (2008) ex-plored hurricane initialization and simulation withthe application of precipitable water derived fromthe Moderate Resolution Imaging Spectroradio-meter (MODIS). Ma et al. (2006, 2007) initiatedTC through Four-Dimensional Variational data as-similation (4DVAR) and adjustment of adiabaticheating with Tropical Rainfall Measuring Mission(TRMM) rainfall data on the basis of the ideaof physical initialization (i.e., Krishnamurti et al.1991, 1996, 1998). A number of studies found thepositive e¤ects of data assimilation on TC nu-merical prediction with Airborne Doppler Radar(ADR) (Zhao and Jin 2008; Xiao et al. 2009),Dropwindsonde Observations for Typhoon Surveil-lance near the Taiwan Region (DOTSTAR) (Wuet al. 2007; Chuo and Wu 2008; Yamaguchi et al.2009), and aircraft observation with subjective opti-mal observing strategies (Aberson 2003).
Despite these successful applications, nearly allthe above datasets provide negligible or very lim-ited information of Plane Boundary Layer (PBL)of TC, which, acting as the interface for ocean-atmosphere energy exchange, plays a dominantrole in TC development (Emanuel 1986; Ma et al.2002; Powell et al. 2003; Tang and Tan 2006; Blacket al. 2007). Fortunately, the global sea-level windsobtained from QuikSCAT provide a good opportu-nity to understand the role of ocean-atmosphere in-teraction in TC development. Pu and Braun (2001)suggested the QuikSCAT satellite data has a poten-tial for TC initialization, particularly when sea sur-face pressure information is unavailable. Recently,the University of Washington Planetary BoundaryLayer (UWPBL) model (Patoux et al. 2003, 2008),relating the surface pressure gradients to surfacewinds, which is based on a mixed-layer theory, is
used to retrieve dynamical-balanced PBL windsand SLP from QuikSCAT wind vectors (Stevenset al. 2002). By reducing the negative e¤ects ofrainfall contamination on the original QuikSCATwinds (Stiles and Yueh 2002), the derivation andanalysis of TC dynamic structure using the UWPBLshould be helpful for TC initialization and predic-tion.
Before using the UWPBL model, however, acontroversial relationship between roughness (dragcoe‰cient) and surface wind in the parameteriza-tion of the UWPBL is noticed, which contradictsthe results of recent observational (e.g., Powell etal. 2003) and numerical studies (e.g., Moon et al.2007; hereafter, M07). On the basis of modifica-tion of roughness parameterization (MRP) of theUWPBL model, this study attempts to improvethe model initialization by using the winds andSea Level Pressure (SLP) fields retrieved fromQuikSCAT data. The initialization method istermed Vortex Initialization with the Assimilationof Retrieved Variables (VIRV). Section 2 describesthe data and methodology. The numerical verifica-tions of the new scheme, as well as the sensitivitiesof the TC structure, track, and intensity to the newinitialization scheme are examined in Section 3 and4. The summary is finally given in Section 5.
2. Data and methodology
2.1 Data
The QuikSCAT level-2B surface wind datasetswere provided by the Physical OceanographyDistributed Active Archive Center (PODAAC) ofUSA JPL/NASA. The surface winds are griddedevery 25 km, and postprocessing has produced12.5 km retrievals in near-real time since theyear 2003. The swath of QuikSCAT retrievals is1800 km, resulting in a coverage of about 90% ofthe global oceans each day. A detailed descriptionof the QuikSCAT platform is given in Ho¤manand Leidner (2005). Most recently, Chou et al.(2010) verified QuikSCAT wind vectors near TCsagainst soundings of GPS dropwindsondes de-ployed by DOTSTAR during 2003 and 2007. Theyfound that the QuikSCAT data slightly underesti-mates the wind speed of medium-wind regime (be-tween 10 and 17.2 m s�1) and possesses clockwisedirectional bias in the high-wind regime (above17.2 m s�1). Moreover, the QuikSCAT wind vec-tors below tropical storm wind strength are accu-rate enough for forecasters to determine the criticalwind radius (Chou et al. 2010).
828 Journal of the Meteorological Society of Japan Vol. 88, No. 5

In this study, the QuikSCAT wind vectors areinterpolated onto the grid on which the UWPBLmodel is run. The reference pressure data for theUWPBL model is obtained from the NationalData Buoy Center (NDBC) of NOAA. The back-ground field of mesoscale model for TC simulationis provided by the NCEP Global Forecast System(GFS) (horizontal resolution is 1.0�). The observedTC intensity is issued by the Joint Typhoon Warn-ing Center (JTWC). Instead of monthly-meanwinds obtained from the NOAA Climate Diagnos-tics Center (CDC), the 925-hPa winds analyzed byGFS/NCEP model are used to estimate the free-tropospheric wind according to the deficiency ofclimatological data (Patoux et al. 2003). Instead ofTRMM (for its limitation of spatial coverage),Infrared (IR) cloud top temperature data fromFengYun-2C (FY-2C) geostationary meteorologi-cal satellite (Xu et al. 2006), operated by ChinaMeteorological Administration (CMA), is used toverify the simulated TC structure. In addition, theNCEP reanalysis data (resolution of 2.5�) is em-ployed for the verification on the simulation ofConvective Available Potential Energy (CAPE).
The TC Bilis (2006) and TC Fung-wong (2008)that occurred over the northwestern Pacific in 2006and 2008, respectively, are selected for evaluationof the VIRV. There are two reasons for selectingthese TC cases: 1) Bilis (2006) maintained its inten-sity (about 975 hPa) for an unexpectedly longperiod when it passed through Taiwan island andultimately made landfall on China mainland andbrought to China the most serious TC disaster inthe last 50 years; 2) in contrast to Bilis (2006), themore intensive TC Fung-wong (2008) experienceda rapid-weakening phase when it passed throughTaiwan island. The two cases are therefore appro-priate for the verification of VIRV for the analysisand simulation of TC intensity.
2.2 Methodology
The methodologies of dynamical retrieval withthe UWPBL model, MRP of UWPBL in the caseof strong wind, and the design of VIRV are partic-ularly introduced in this section.
a. Dynamical retrieval using the UWPBL model
For strongly curved flows such as TC circulation,the centrifugal acceleration is as important as thepressure gradient force. Therefore, a three-forcebalance, referred to as the gradient wind (e.g.,Holton 1992), must be established to calculate theactual wind vector. In this study, the UWPBL
model and its inverse model is used to calculate thegradient wind vectors using the surface wind vec-tors. In this model, at each model grid for which aQuikSCAT surface wind vector is available, a PBLwind profile is approximated by patching a modi-fied Ekman spiral to a logarithmic surface layerwith the special treatment of stratification and bar-oclinicity (Foster et al. 1999). Derived from thiswind profile, the PBL flow is separated into pri-mary flow (or mean flow) or secondary flow (orzero-mean finite perturbation flow). Here, the sec-ondary flow is parameterized as an equilibriumperturbation to represent the activity of PBL rolls(Brown 1970, 1981; Black et al. 2007). The ampli-tude of this perturbation is determined by an equi-librium energy balance. The consequence of thisparameterized secondary flow is more thoroughmixing throughout the PBL with higher gradientsnear the bottom and top; therefore, the UWPBLmodel produces higher surface winds and heatfluxes than di¤usion models (Patoux et al. 2003).The ocean mixing beneath TC circulation thensignificantly reduces sea surface temperatures andenthalpy flux (Black et al. 2007).
The retrieval of oceanic surface pressure field isimplemented in four steps (Patoux 2000): 1) in themid-latitudes, the surface pressure gradients are ob-tained with an inversed two-layer-similarity PBLmodel; 2) in the tropics, an inversed mixed-layermodel is employed to estimate the pressure gra-dients; 3) the surface pressure fields are then derivedfrom the pressure gradient fields by least-squaresoptimization; 4) the tropical PBL model is thencombined with the mid-latitude model to provide acontinuous global surface pressure.
In the two-layer-similarity PBL model designedfor the mid-latitudes (Patoux 2000), the geostrophicwind ðGÞ at the top of PBL can be calculated oncethe surface wind ðUhÞ is given, as below:
Uh
G¼ VT
Gþ 1
G
qV2
qxþ cos aþ sin a; ð1Þ
where VT is the thermal wind correction, V2 thesecondary circulation, a the wind turning anglewithin the PBL. Gradient wind vector can then beestimated from G using the gradient wind correc-tion approach (Patoux and Brown 2002).
In the tropics, a simple mixed-layer model isemployed to integrate the steady-state balanceequations over the depth of the boundary layer.To obtain the first wind profile, the first guess onthe pressure gradient is assumed to be constant
October 2010 L.-M. MA and Z.-M. TAN 829
throughout the boundary layer. The bulk wind iscalculated by integration of this profile, and a newestimate of the pressure gradient is obtained fromthe bulk force balance as follows,
Px
r¼ fV � we
hðUT �UÞ þ u2�
h
u10
ju10j;
Py
r¼ �fU � we
hðVT � VÞ þ u2�
h
v10
ju10j:
ð2Þ
where h is 500 m, and we is 1.00 cm s�1. The finalvalue for the pressure gradient is obtained by con-vergence from a few iterations.
These two models yield pressure gradients in themid-latitudes (60�S to 10�S and from 10�N to60�N) and the tropics (from 20�S to 20�N). Ateach point of the corresponding grids, the pressuregradient is connected to the pressure by least-squares optimization (Brown and Zeng 1994). Thepressure fields are finally blended in the overlap-ping latitudinal bands between the tropical andmid-latitudes (Patoux et al. 2003).
b. MRP in the high wind speed
Numerical experiments indicate that the simu-lated TC intensity is largely determined by sea-surface fluxes (e.g., Braun and Tao 2000). AlthoughTC intensity increases with the ratio between theexchange coe‰cients for enthalpy and momentum,the simulated TC intensity varies depending on therelationship between the wind speed, surface rough-ness, and drag coe‰cient ðCdÞ. Generally, Cd is as-sumed to increase linearly with weak-to-moderatewind speed. In strong wind conditions, the Cd -wind relationship is derived by linear extrapolationfrom weak-to-moderate wind regimes, which arecurrently used in the UWPBL.
However, by using the wind profiles measured bythe Global Positioning System (GPS) in the vicinityof the hurricane eyewalls, Powell et al. (2003) foundthat surface momentum flux levels o¤ as the surfacewind speeds increase above the hurricane force.This result has been supported by more and moretheoretical and numerical studies (e.g., Emanuel2003; Makin 2005; Moon et al. 2004a, b, c; Blacket al. 2007). An explanation for this result, as givenby Powell et al. (2003), is the development of a seafoam layer at the air-sea interface. This sea foamlayer, as the intensity of surface wind approaches acertain value, will impede the air-sea momentumexchange. Nevertheless, the amount of ‘‘level o¤ ’’and the wind speed at which the ‘‘level o¤ ’’ occurs
remains uncertain (French et al. 2007). For exam-ple, Black et al. (2007) suggest ‘‘level o¤ ’’ with thesurface wind speed near 22–23 m s�1, which is sig-nificantly lower than that (i.e., 33 m s�1) of Powellet al. (2003).
The neutral Cd as a function of the roughnesslength z0 is defined as:
Cd ¼ k2 ln10
z0
� ��2
; ð3Þ
where k is the von Karman constant. In the presentstudy, k ¼ 0:4.
In the UWPBL, z0 is parameterized by:
z0 ¼ au2�gþ b
v
u�; ð4Þ
where a and b are constant and given bydata statistics (Miller and Katsaros 1992; Smith1988), v is the dynamical frictional coe‰cient(1:34� 10�5 m2s�1).
According to the ‘‘level-o¤ ’’ phenomenon, M07presented a new roughness parameterization schemeon the basis of numerical experiments using anatmosphere-ocean coupled model. z0 is parameter-ized as:
z0 ¼0:0185
gu2� ; W a 12:5 ms�1;
z0 ¼ ½0:085ð�0:56u2� þ 20:255u� þ 2:458Þ
� 0:58� � 10�3; W > 12:5 ms�1:
ð5Þ
where W is the surface wind speed.Cd is then calculated by an iteration procedure
using stability parameters and universal functionson the basis of the Monin-Obukhov similaritytheory (Liu et al. 1979). Experiments using the op-erational Geophysical Fluid Dynamics Laboratory(GFDL) hurricane model show the advantages ofthe M07 scheme in the prediction of MWS. There-fore, the M07 scheme is used in this study to updatethe UWPBL model.
c. The VIRV scheme
For its successful application in TC prediction(Xiao et al. 2009), the Weather Research and Fore-casting model/Three-Dimensional Variational dataassimilation system (WRF/3DVAR, Skamarocket al. 2005), developed by the National Center forAtmospheric Research (NCAR), is used for the de-sign of VIRV. The WRF/3DVAR can produce bal-anced multivariate analysis subject to embeddeddynamical and statistical constraints. The WRF/
830 Journal of the Meteorological Society of Japan Vol. 88, No. 5

3DVAR is achieved by the minimization of a pre-defined cost function JðxÞ, combined by observa-tional and background error, to get an optimalanalysis for the initial condition ðxÞ. The precondi-tioning control variables in WRF/3DVAR includestreamfunction, unbalanced velocity potential, un-balanced temperature, pseudo–relative humidity,and unbalanced surface pressure.
The cost function JðxÞ for the assimilation ofSLP and horizontal winds is defined in this studyas:
JðxÞ ¼ Jb þ Jp þ Jv; ð6Þ
where,
Jb ¼1
2ðx� xbÞTB�1ðx� xbÞ;
Jp ¼XW
ðP� PoÞTW�1p ðP� PoÞ;
Jv ¼XW
ðV � VoÞTW�1v ðV � VoÞ;
and xb is the background field; Po is the SLP re-trieved from QuikSCAT sea winds Vo is the hori-zontal wind fields (u and v components) retrievedfrom QuikSCAT. Wp and Wv are the diagonal er-ror variance matrices for the SLP and horizontalwind fields retrieved using the UWPBL, respec-tively. W is the region covered by QuikSCAT data.The observational operator for SLP is designed onthe basis of Dudhia et al. (2002).
The observational and background error co-variance assumes Gaussian probability distribution,ignoring the relationship between the observationand background error. A quasi-newton method(Liu and Nocedal 1989) is used to minimize thecost function to make an optimal analysis. Sincethe background error covariance produced by theNMC method (Parrish and Derber 1992) mightnot be appropriate for the case of TCs (Xiao et al.2006), it is estimated by ensemble predictionsbased on WRF model (12 ensemble members con-sidering the uncertainties of PBL parameterizationschemes). The variable adjustment and the propa-gation of information from one variable to anotherare based on the background error covariancestructure, and balance equations in the 3DVARsystem (Barker et al. 2004). The observation errorsfor the retrieved SLP and wind are subjectivelyassigned similar to the scheme of Xiao et al. (2006)in which a smaller error is specified in the vicinityof the TC center, which implies more contribution
from the data retrieved near the TC center. TheSLP and winds retrieved from the UWPBL are si-multaneously assimilated in this study. AlthoughWu et al. (2006, hereafter, W06) suggest that, dueto the geostrophic adjustment, the assimilation ofwind fields is more e‰cient than that of pressurefields in improving the initial structure of TCs;both pressure and wind observation data are stillnecessary for vortex initialization to obtain a betterforecast (Xiao et al. 2000). Pu and Braun (2001)also found that only when both the bogus SLP andwind are assimilated does the model produce a vor-tex consistent with the actual intensity. A cycled-3DVAR procedure is designed for VIRV and illus-trated in Fig. 1. In this scheme, the assimilation ofretrieved variables is performed twice during the12-h initialization cycle. The forecast from the pre-vious 12-h cycle serves as the background for thesecond time of assimilation. Once the VIRV proce-dure is completed, a 48-h simulation is performedto examine its impacts on TC prediction.
3. Retrieval and analysis with the VIRV
3.1 Design of numerical experiments
Numerical experiments using the WRF modelhave shown some promise in forecasting TCs nearlandfall (Davis et al. 2008). In this study, a seriesof numerical experiments are designed and per-formed with the WRF model Version 3.1. The con-trol experiment (CTRL) uses the background fieldsfrom NCEP/GFS with no additional observationassimilated. Two sensitivity experiments (REXP1:initialization with the retrieval from the originalUWPBL model; REXP2: initialization with the re-trieval from the modified UWPBL model in thepresent study) were conducted for comparison. Thetimes for analysis are 1200 UTC on July 27, 2008and 1200 UTC on July 12, 2006 for the TC Fung-wong (2008) and TC Bilis (2006), respectively.
A total of 27 sigma ðsÞ levels were designed, withthe model top at 10 hPa. More than seven sigmalayers are located between the sea surface and1.5 km height for a detailed description of the PBLstructure. The model has a single fixed domain(Fig. 2) with dimension of 271� 271 and horizon-tal resolution of 12 km. The model water cycleprocesses are represented by Kain–Fritsch cumulusparameterization scheme and Single-Moment three-class (WSM3) microphysics scheme (Hong et al.2004). Yonsei University (YSU) scheme is em-ployed to describe the PBL processes (Noh et al.2003; Hong et al. 2006). This scheme is a first-order
October 2010 L.-M. MA and Z.-M. TAN 831

closure scheme similar in concept to the Medium-Range Forecast (MRF) PBL scheme (Hong andPan 1996) but less biased toward excessive vertical
mixing (Braun and Tao 2000). In particular, with arevised vertical di¤usion package, the YSU PBLscheme increases (decreases) the boundary-layermixing in the thermally induced free convection re-gime (the mechanically induced forced convectionregime), in comparison with that of the MRFscheme.
3.2 Retrieval with the VIRV
The retrieved wind in the PBL (Fig. 3) and SLPfields reveal an evident depression to Taiwan Islandand a subtropical high to the north of the depres-sion. The retrieved SLP also indicates a southwarddisplacement of subtropical high in comparisonwith that of NCEP/GFS (not given). The intensitiesof the TCs Fung-wong and Bilis are reproducedwell by the modified UWPBL model. Specifically,the magnitude (coverage) of the retrieved maximumwind in the vicinity of the TC center is significantlylarger than the original QuikSCAT observation.The maximum wind observed by QuikSCAT andretrieved using the UWPBL model for Fung-wongat 1000 UTC on July 27, 2008 is 24 m s�1 and33 m s�1, respectively, while for TC Bilis, at 1000UTC on July 12, 2006, the retrieved maximum
Fig. 1. Diagram of the VIRV scheme. NCEP/GFS Global Forecast provides the background field for TCinitialization, which is interpolated into the 12 km grid of WRF-3DVAR that is consistent with the WRFmodel. At the 12 hours (denoted by ‘‘�12 h’’) prior to the initial time for prediction, the PBL winds as wellas the SLP fields, retrieved from QuikSCAT data with the modified UWPBL model, are assimilated intothe WRF-3DVAR system. The WRF model is then initialized the first time at ‘‘�12 h’’. A subsequent12 hours forecast is made following this initialization. At the end of the 12 hours simulation (also the initialtime denoted by ‘‘0 h’’), the retrieved PBL wind and SLP fields are assimilated the second time to make thefinal analysis for the WRF mesoscale 48 h forecast.
Fig. 2. The model domain designed for nu-merical experiments. The lateral boundaryof the domain is indicated by the thicklines, with the terrain heights 0.5 km,1.0 km, 1.5 km, 2.0 km, and 3.0 km shownin contours.
832 Journal of the Meteorological Society of Japan Vol. 88, No. 5
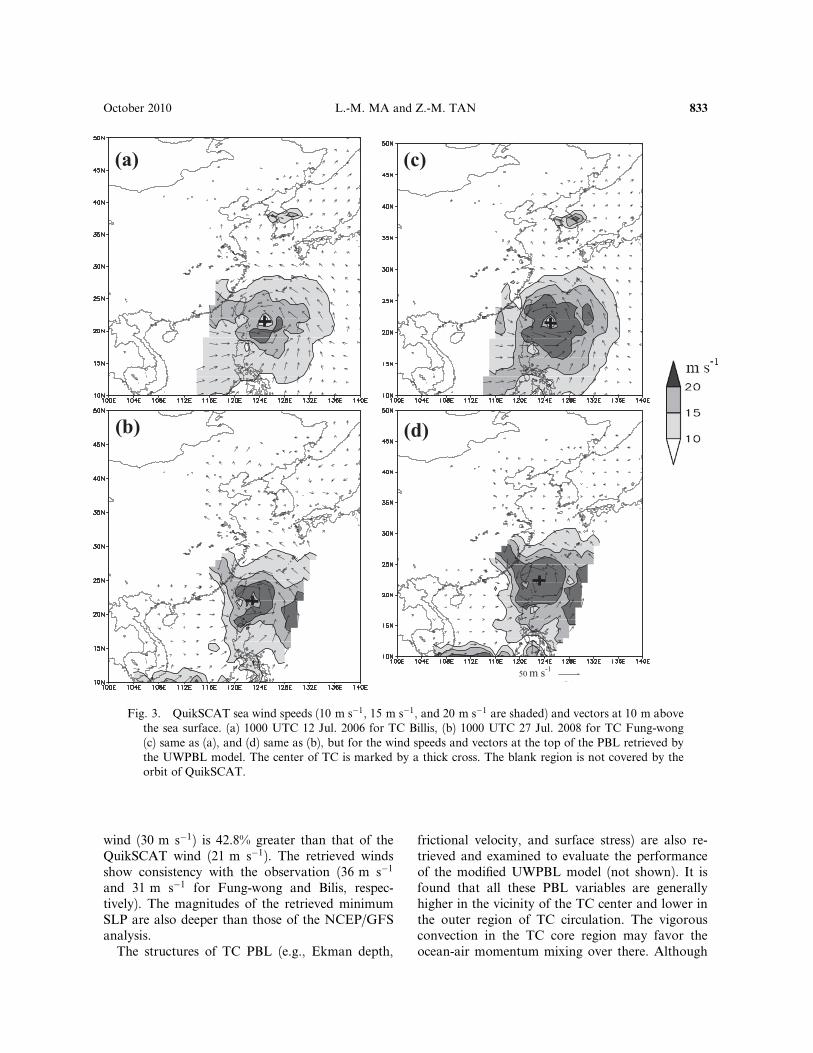
wind (30 m s�1) is 42.8% greater than that of theQuikSCAT wind (21 m s�1). The retrieved windsshow consistency with the observation (36 m s�1
and 31 m s�1 for Fung-wong and Bilis, respec-tively). The magnitudes of the retrieved minimumSLP are also deeper than those of the NCEP/GFSanalysis.
The structures of TC PBL (e.g., Ekman depth,
frictional velocity, and surface stress) are also re-trieved and examined to evaluate the performanceof the modified UWPBL model (not shown). It isfound that all these PBL variables are generallyhigher in the vicinity of the TC center and lower inthe outer region of TC circulation. The vigorousconvection in the TC core region may favor theocean-air momentum mixing over there. Although
Fig. 3. QuikSCAT sea wind speeds (10 m s�1, 15 m s�1, and 20 m s�1 are shaded) and vectors at 10 m abovethe sea surface. (a) 1000 UTC 12 Jul. 2006 for TC Billis, (b) 1000 UTC 27 Jul. 2008 for TC Fung-wong(c) same as (a), and (d) same as (b), but for the wind speeds and vectors at the top of the PBL retrieved bythe UWPBL model. The center of TC is marked by a thick cross. The blank region is not covered by theorbit of QuikSCAT.
October 2010 L.-M. MA and Z.-M. TAN 833

more intensive ocean-atmosphere dynamical mix-ing is identified for Bilis, the intensity of Fung-wong was much stronger (than Bilis) due to thefollowing two-fold e¤ects of the ocean (Powell et al.2003; Black et al. 2007): 1) intensifying of the TCby the surface heat flux; 2) weakening of the TCby ocean spray and overturning (either weakensthe PBL wind or cools the PBL atmosphere). TheMRP intensifies the sensible heating flux mainly inthe area of intensive wind. The reduction of ocean-air PBL momentum mixing intensifies the ocean-atmosphere humidity gradient, favoring the latentheating flux from the ocean to the air. However,the sensible heating flux (nearly 30% of latent heat-ing) exhibits negligible change due to the MRP ofthe UWPBL model. One of the reasons might bethat the decrease of ocean-atmosphere vertical mo-mentum flux favors the accumulation of ocean-atmosphere temperature gradient. As a result, thebalance between the enhanced temperature gradientand the weakened ocean-atmosphere mixing ensurethe temperature advection an approximate con-stant.
3.3 Analysis with the VIRV
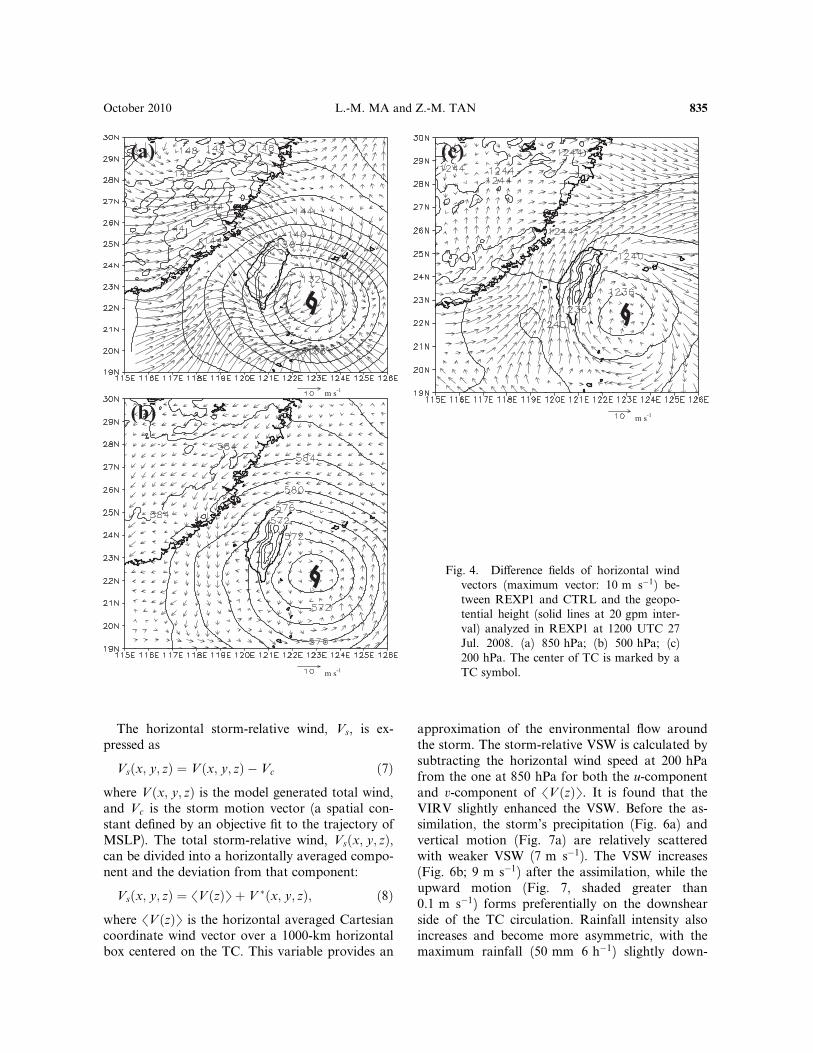
In a previous study on bogus vortex 4DVAR, Puand Braun (2001; hereafter, PB01) suggested thatthe e¤ects of including gradient wind informationare equivalent to introducing a gradient balanceconstraint during data assimilation. It forces thevortex wind field to be consistent with the gradientbalance relationship, and allows the system to re-produce both rotational and convergent compo-nents of the wind field. In this sense, the VIRV, al-though using the constraint of 3DVAR, has somesimilar e¤ect as that of 4DVAR, because the fullmodel dynamics is introduced within the 12-h initi-alization cycle of VIRV. Figures 4a–c shows thedi¤erence fields of wind between REXP1 andCTRL (REXP1 minus CTRL) at various pressurelevels. It indicates that the convergence is enhancedaround the TC center at 850 hPa (Fig. 4a) and500 hPa (Fig. 4b). In response to this enhancedconvergence, a divergent circulation is generatedover the high troposphere (Fig. 4c). Meanwhile, anumber of mesoscale cyclonical vortices are alsogenerated to the south and southwest of the TCcenter (Fig. 4b).
Figures 5a–d show the vertical cross sections ofthe di¤erence fields of horizontal wind, potentialtemperature, and vertical velocities between CTRLand REXP2 (REXP2 minus CTRL) through the
center of Fung-wong (2006). Consistent with theasymmetric structure of wind (Fig. 3) and the deep-ened SLP retrieved by the modified UWPBLmodel, the di¤erence field of U-wind (Fig. 5a)depicts stronger convergence (divergence) below(above) 400 hPa, with intensified U-wind to theeast of the TC center. Moreover, under the con-straint of assimilation, the radius of the maximumwind is reduced by about 10%.
The V-wind di¤erence fields also show strongerconvergence surrounding the TC center due toVIRV (Fig. 5b), with a well-developed asymmetricvortex. The horizontal wind di¤erence is greaterthan 16 m s�1 at the southern portion, and only10 m s�1 at the northern portion of TC. VIRVleads to warmer potential temperature anomaly(Fig. 5c) and stronger upward motion (Fig. 5d)around the center of the storm; with the maximumupward motion is about 1.8 m s�1 at 200–300 hPaand the maximum warm anomaly is about 1.5 K at300–400 hPa. Six hours later, the low-level (high-level) convergence (divergence), vertical motion, aswell as the TC warm core, is significantly enhanced(figure is not given). This similar change of warmcore and vertical motion due to the assimilation ofwind and pressure was also noticed by PB01, whichis more evident than that of the assimilation ofwind only (Xiao et al. 2000; hearafter, X00).
It is widely accepted that Vertical Shear of Hori-zontal wind (hereafter, VSW) is a major factor inthe intensity change of TCs (e.g., DeMaria andKaplan 1999; Fitzpatrick 1997; Hanley et al. 2001;Paterson 2005). As suggested by Paterson (2005),typically a critical VSW of 10 m s�1 represents atransition from intensification to weakening (i.e.,VSW values of less than 10 m s�1 favor intensifica-tion). The VSW is also a dominant factor in the for-mation of precipitation asymmetries in TCs (e.g.,Willoughby et al. 1984; Marks et al. 1992; Franklinet al. 1993; Bender 1997; Frank and Ritchie 1999,2001, 2002). The precipitation in TCs (away fromthe land) tends to be maximized on the left side ofthe VSW vector (i.e., downshear left). FollowingMarks et al. (1992) and Rogers et al. (2003), thestorm-scale VSW is examined in this study. Tolocate the TC center, a technique similar to thesimplex algorithm of Neldar and Mead (1965) andMarks et al. (1992) is used to locate where theeyewall vorticity is greatest. The vortex winds arethen Fourier decomposed into azimuthally aver-aged (i.e., symmetric) and asymmetric fields (e.g.,Marks et al. 1992; Reasor et al. 2000).
834 Journal of the Meteorological Society of Japan Vol. 88, No. 5
The horizontal storm-relative wind, Vs, is ex-pressed as
Vsðx; y; zÞ ¼ Vðx; y; zÞ � Vc ð7Þ
where Vðx; y; zÞ is the model generated total wind,and Vc is the storm motion vector (a spatial con-stant defined by an objective fit to the trajectory ofMSLP). The total storm-relative wind, Vsðx; y; zÞ,can be divided into a horizontally averaged compo-nent and the deviation from that component:
Vsðx; y; zÞ ¼ hVðzÞiþ V �ðx; y; zÞ; ð8Þ
where hVðzÞi is the horizontal averaged Cartesiancoordinate wind vector over a 1000-km horizontalbox centered on the TC. This variable provides an
approximation of the environmental flow aroundthe storm. The storm-relative VSW is calculated bysubtracting the horizontal wind speed at 200 hPafrom the one at 850 hPa for both the u-componentand v-component of hVðzÞi. It is found that theVIRV slightly enhanced the VSW. Before the as-similation, the storm’s precipitation (Fig. 6a) andvertical motion (Fig. 7a) are relatively scatteredwith weaker VSW (7 m s�1). The VSW increases(Fig. 6b; 9 m s�1) after the assimilation, while theupward motion (Fig. 7, shaded greater than0.1 m s�1) forms preferentially on the downshearside of the TC circulation. Rainfall intensity alsoincreases and become more asymmetric, with themaximum rainfall (50 mm 6 h�1) slightly down-
Fig. 4. Di¤erence fields of horizontal windvectors (maximum vector: 10 m s�1) be-tween REXP1 and CTRL and the geopo-tential height (solid lines at 20 gpm inter-val) analyzed in REXP1 at 1200 UTC 27Jul. 2008. (a) 850 hPa; (b) 500 hPa; (c)200 hPa. The center of TC is marked by aTC symbol.
October 2010 L.-M. MA and Z.-M. TAN 835

stream of the upward motion. The region of maxi-mum rainfall shifts from the south (Fig. 6a; CTRL;122�E–124�E) to the southeast side of the TC circu-lation (Fig. 6b; REXP2; 124�E–126�E), generallyconsistent with the structure of cloud top tempera-ture as captured by the Chinese satellite FY-2C at aclose time (Fig. 8). Because of VIRV, the upwardmotion becomes more organized and slightly inten-sified with stronger VSW and adjacent evidentdownward motion just downstream (in a cyclonicsense) of the updraft (Figs. 6, 7). These distributionpatterns of vertical motion under the influence ofVSW are similar to the results of observation(Marks et al. 1992; Black et al. 2002) and simula-tion (Braun and Wu 2007). As simulated byCTRL, the TC circulation contains several scat-tered areas of concentrated vorticity, with closedcirculations in the asymmetric flow field. While inthe case of the stronger VSW as reproduced by
REXP2, the mesovortices move cyclonically, mix-ing and coalescing, and they ultimately form aset of larger scale vortices around the TC center(not given). This e¤ect of VSW was also noticedby Kossin and Schubert (2001) and Montgomeryet al. (2002). The process of vortex merger can beunderstood through the upscale growth of vorticity(well known in two-dimensional turbulence), andhas been recognized as an important factor forstorm development in western Pacific Ocean(Ritchie and Holland 1997). In contrast to CTRL,REXP2 with strong VSW produces an asymmetricflow across the TC center with considerable mixingof vorticity southwest of TC into the TC center.The asymmetric flow implies that when the shear-induced wavenumber-1 asymmetry becomes large,significant low-level ventilation of the TC circula-tion (Braun and Wu 2007) occurs (on the southwestof the TC in this study). The vorticity to the east
Fig. 5. Cross sections for the di¤erence fields between the CTRL and REXP2 at 1200 UTC 27 Jul. 2008along the TC center. (a) u-component (along 22.2�N, at interval of 1 m s�1); (b) v-component (along123.2�E, at interval of 1 m s�1); (c) potential temperature (along 22.2�N, at interval of 0.5 K); and (d)vertical motion (along 22.2�N, at interval of 0.2 m s�1). Solid (dashed) lines for positive (negative) values.
836 Journal of the Meteorological Society of Japan Vol. 88, No. 5

side of the TC circulation increases significantly,suggestive of strong vorticity mixing from thesouthwestern portion to the TC center, favoringthe ultimate intensification of the TC. The CAPEis also examined to evaluate the e¤ect of VIRV onthe change of distribution of TC convection. TheCAPE simulated in the REXP2 (Fig. 9c) is alsocompared with that in CTRL (Fig. 9b) and NCEPreanalysis (Fig. 9a). The distribution of CAPEsimulated in REXP2 agrees well with that ofNCEP reanalysis (especially the low CAPE valuewithin the TC center), although the maximumCAPE of the latter is somewhat underestimated be-cause of the coarse resolution of NCEP reanalysis.In consistency with that of rainfall distribution
(Figs. 6a, b), the CAPE also intensifies at the east-ern portion of the TC circulation due to VIRV (notgiven).
4. Impacts of VIRV on the Intensity and Track of
the Simulated TCs
Figures 10a–d shows the improvement of 0–48 hintensity of simulated Bilis and Fung-wong withVIRV. In particular, the simulation of intensitycaptures most of the features of the observedintensity change. For example, the deepening-then-
Fig. 6. Total surface rainfall during 1200UTC–1800 UTC 27 Jul. 2008 for TCFung-wong (shaded at 5, 10, 25, 50 mm)simulated by experiments. (a) CTRL; (b)REXP2. Arrows show the 6-h-averaged850–200-hPa vertical wind shear vector(the reference shear vector is 10 m s�1).The center of TC is marked by a TC sym-bol.
Fig. 7. Simulated 500-hPa vertical motion at1800 UTC 27 Jul. 2008 for Fung-wong. (a)CTRL; (b) REXP2. The areas of signifi-cant upward motion greater than 0.1 ms�1
are shaded, and the downward motionat �0.01 ms�1 is indicated by the dashedlines. Arrows show the 6-h-averaged 850–200-hPa vertical wind shear vector. Thecenter of TC is marked by a TC symbol.
October 2010 L.-M. MA and Z.-M. TAN 837

weakening phase of Bilis and the generally weaken-ing tendency of Fung-wong are well simulated. Thetemporal variations of MSLP/MWS for Bilis agreewell with the observations (Figs. 10a, b), except fora slower tendency of decrease/increase during the0–24 h phase. For Fung-wong, the simulated TCintensity shows the growing agreement with the ob-servation with model time (Figs. 10c, d, especiallyafter 18 h). Admittedly, there is discrepancy be-tween REXP1 and REXP2. In comparison withREXP1, REXP2 enhanced the intensity of Bilis,with the most evident e¤ect in the later (i.e., 8-hPadecrease of MSLP at 42 h). The positive e¤ect ofMRP on Fung-wong’s intensity is also shown inFigs. 10c, d, with more significant improvementduring 0–30 h (i.e., 5-hPa about decrease of MSLPat 18 h) of model integration.
To better understand the performance of VIRV,a series of numerical experiments were further per-formed (ten 48-h phases of simulation are listed inTable 1). Similar to that in section 3.1, for eachphase of simulation, three experiments (CTRL,REXP1, and REXP2) were conducted for compari-son. The statistics of the error of track and intensity(MSLP, MWS) for each of the experiments arecalculated by taking an average of the errors of
Fig. 8. Cloud-top temperature (�C) derivedfrom the Chinese Geostationary InfraredSatellite FY2C at 1201 UTC 27 Jul. 2008for Fung-wong. The center of TC ismarked by a TC symbol.
Fig. 9. The surface CAPE at 1800 UTC 27Jul. 2008 for Fung-wong. (a) NCEP rean-alysis; (b) CTRL; (c) REXP2. The intervalis 100 J kg�1 in (a), and 400 J kg�1 in (b)and (c), respectively. The NCEP reanalysisare archived on a 2:5� 2:5 degree lat/longrid. The thick dashed lines indicate thedistribution pattern of high CAPE thatcontributes to the heavy rainfall shown inFigs. 6a–b. The center of TC is marked bya TC symbol.
838 Journal of the Meteorological Society of Japan Vol. 88, No. 5

the ten phases (or case-averaged) at the 12 h, 24 h,36 h, and 48 h of model integration, respectively. Itshows that the errors of REXP1 and REXP2 areless than those of CTRL for all of the verifiedparameters (Figs. 11a, b). The largest reduction oferror by VIRV is in the simulation of MWS, with22.8% and 29.7% of reduction in REXP1 andREXP2; respectively (Fig. 11a). The improvementin MSLP is also considerable (the reduction oferror is 15.7%/17.1% in REXP1/REXP2, Fig. 11b).In comparison with REXP1, REXP2 improves thesimulation of MWS (6.9%) more significantly thanthat of MSLP (1.4%), due to the MRP’s direct ef-fect on roughness and its subsequent impact on thechange of PBL winds.
Because of the spinup of model, all the experi-ments present smaller MWS (Fig. 11a) and MSLPerrors (Fig. 11b) at 24 h than at 12 h. Assimilationalleviates the spinup problem and produces moresignificant improvement at 12 h than at 24 h. How-ever, the positive e¤ect of VIRV on the intensity ofsimulated TC becomes more significant after 24 h.The di¤erence between MSLP of REXP1, REXP2,and CTRL increases with the model integration,reflecting that the simulation of MSLP at longertimes is more sensitive to initial conditions thanthat at shorter times. This result agrees well withthat of PB01 and W06. As suggested by W06, dur-ing the cycle of assimilation of wind and pressure,the assimilated wind information has a longer mem-ory after the assimilation than the surface pressureinformation does. In this study, similar to W06,the relative importance of assimilating wind andpressure fields is examined on the basis of thegeostrophic adjustment argument (Schubert et al.
Fig. 10. TC MSLP and MWS evolutionwith the time at the lowest model level(approximately 50 m) simulated by CTRL,REXP1, and REXP2, compared to JTWCobservations (OBS). (a, c) for MSLP; (b, d)for MWS. 0 h denotes the initial time forsimulation. (a, b) for TC Bilis, and the ini-tial time is 1200 UTC 12 Jul. 2006. (c, d)for Fung-wong, and the initial time is 1200UTC 27 Jul. 2008.
Table 1. The simulation phases for each of the TC cases(e.g., for the simulation phase 12/12@12/14 of TC Bi-lis, the initial time of simulation is 1200 UTC 12 July,2006, the end of time of simulation is 1200 UTC 14July, 2006; for the simulation phase 00/26@00/28 ofTC Fung-wong, the initial time of simulation is 0000UTC 26 July, 2008, the end of time of simulation is0000 UTC 28 July, 2006).
TC name Bilis Fung-wong
Simulation phases(hour UTC/dayof month@hourUTC/day ofmonth, Month,Year)
12/12@12/14,00/13@00/15,12/13@12/15,00/14@00/16,12/14@12/16,July, 2006
00/26@00/28,12/26@12/28,00/27@00/29,12/27@12/29,00/28@00/30,July, 2008
October 2010 L.-M. MA and Z.-M. TAN 839

1980). If the radius of maximum wind ðLÞ is smallcompared to the local Rossby radius LR, that is,L=LR a 1, the initial tangential wind and vorticityfields would have little change (pressure adjusts towind). Using the definition of the local Rossby ra-dius LR ¼ NH=ðhxÞ1=2, where N is the buoyancy(Brunt–Vaisala) frequency and H is the verticalscale of the motion from Shapiro and Montgomery(1993), we can estimate the value of L=LR in eachexperiment (see Table 2). Notice that the low valueof L=LRð0:30Þ in this study (MT10 in Table 2) isless than that of PB01 (0.34) and slightly greaterthan that of W06 (0.29), favoring a geostrophic
adjustment of pressure fields toward the wind fields.This might be the reason why MSLP changesslower than MWS during the simulation.
The sensitivity of the simulated TC track toVIRV is also illustrated in Figs. 11c, 12. All the ex-periments reproduced the processes that TCs Bilis(Fig. 12a) and Fung-wong (Fig. 12b) moving north-westward, passing through Taiwan Island, andultimately making landfall at Fujian province inChina. Nevertheless, the simulated TC tracks withthe VIRV (both REXP1 and REXP2) show moreconsistency with the observation than those inCTRL. For instance, a northward drift of TC trackis noticed in the simulation of REXP1, which couldbe understood by the strengthening of the south-erly steering flow, with the most, medium, and leastchange at the lower, middle, and upper tropo-sphere, respectively (not shown). The MRP modi-fies the track especially during the period that Bilispasses through Taiwan Island (Fig. 12a). ForFung-wong, MRP also improves the track simula-tion, with the most significant e¤ect indicated pre-landfall on Taiwan Island and Fujian Province(Fig. 12b).
To better understand the interaction between to-pography and TC structure and its impact on theTC intensity and track, the horizontal wind vectorand relative humidity (RH) fields at low level isexamined (not given). As Fung-wong approachesTaiwan at 9 h, evident cyclonic wind is noticedwithin the TC region of high RH. In the simulationof CTRL, a tongue of low-RH flow extends intothe inner circulation of the TC through the northof the TC circulation. This is an early sign that thedrier air in the mountainous region of Taiwan has
Table 2. Estimation of the ratio of L to LR, PB01 isbased on Pu and Braun (2001), X00 denotes the resultbased on Xiao et al. (2000), W06 is the estimationwith the definition of Wu et al. (2006), MT10 is the re-sult of this study. Here N is the static stability, H isthe vertical scale, Vmax is the maximum surface windspeed, and L is estimated by the radius of Vmax.
PB01 X00 W06 MT10
Latitude 18�N 23�N 22�N 22�NN 0.015 s�1 0.015 s�1 0.015 s�1 0.015 s�1
H 10 km 10 km 10 km 10 kmVmax 20 m s�1 12 m s�1 13 m s�1 20 m s�1
L 230 km 280 km 330 km 240 kmLR 680 km 1050 km 1120 km 810 kmL=LR 0.34 0.27 0.29 0.30
Fig. 11. The simulation error statistics case-averaged among each of the 10 phases asdescribed in Table 1 for the CTRL,REXP1 and REXP2 at 12 h, 24 h, 36 h,and 48 h respectively. (a) MWS (m s�1);(b) MSLP (hPa); and (c) track (km).
840 Journal of the Meteorological Society of Japan Vol. 88, No. 5

begun to interact with the TC circulation. How-ever, in the simulation of REXP2, the distributionof high RH (above 90%) in the northern region ofTC circulation seems not evidently a¤ected bythe topography of Taiwan. As the TC simulatedby REXP2 moves slower than that of CTRL, thestorm center located far from the Taiwan topogra-phy and remains well organized with moist air (RHabove 90%) to the east of Taiwan. As no additionaldry air intrudes into the core region of the TC, themaintenance of an intensive TC is favored (Figs.10a, d). At 15 h of CTRL, as the TC moves acrossthe topography of Taiwan, a large area of down-
slope dry air (similar to that of Lin et al. 1999) in-trudes into the northwest quardrant of the TC. Af-ter that, the intensity of the TC simulated in CTRLrapidly weakens, suggesting that the Taiwan terraina¤ects the storm intensity by cutting o¤ the watersupply. This result also agrees with the idealizedsimulation in Bender et al. (1987). In comparison,REXP2 shows no clear evidence of dry e¤ect fromthe Taiwan topography (not given).
It is also interesting to note that the simulatedtrack with VIRV (i.e., REXP1 and REXP2 in Fig.12) turned northward prelandfall on Taiwan island,instead of passing through the southern portion ofTaiwan as in CTRL. One likely answer is that thisis related to the moist dynamics. In REXP2, rightbefore landfall, the adequate moisture supply tothe north of Fung-wong might favor new convec-tion to the north quadrant of TC. The upslope lift-ing of the moisture-laden air then produces heavyprecipitation over the north quadrant of Fung-wong (not given). However in CTRL, downslopedry air is dominant at the north portion of TC,which tends to inhibit the development of vorticityand convective activity over there. We believe suchan asymmetric feature, suggested by Wu et al.(2001), might lead to the di¤erence in of stormtracks between CTRL and REXP2.
The zonal cross sections of vertical velocity andrelative humidity fields are analyzed during theperiod Fung-wong hits Taiwan. At 12 h of integra-tion ( just 6 hours before landfall), the vertical ve-locity (Fig. 13a) in CTRL displays an eyewall-likestructure with asymmetric updrafts around the TCcenter. Comparison between Figs. 13a, b indicatesthat the maximum vertical velocity around the TCcenter increases significantly with the VIRV. Incomparison with the dry simulated in CTRL withinthe inner 150 km around the storm center (Fig.13a), the air is almost saturated in REXP2 (Fig.13b). At 18 h when the TC makes landfall, the ver-tical velocity (Figs. 13c–d) intensifies with the max-imum being above 1.2 m s�1 to the west of the TCcenter, around which the saturated air still remains(Fig. 13d). As Fung-wong reaches central Taiwanat 18 h, (Fig. 13c), the distribution of RH becomesmore organized, while the two peaks of verticalvelocity are present at 500 hPa and 300 hPa. Theeyewall in REXP2 is more contracted than that inCTRL (Figs. 13c, d), which might favor the intensi-fication of TC (Willoughby et al. 1982; Willoughby1990; Black and Willoughby 1992; Blackwell 2000).Moreover, as in CTRL, the maximum upward
Fig. 12. Simulated and observed TC tracks.The OBS is the best track provided byJTWC. (a) TC Bilis, initial time at 1200UTC 12 July, 2006, time interval of 12 h.(b) TC Fung-Wong, initial time at 1200UTC 27 July, 2008, time interval of 12 h.
October 2010 L.-M. MA and Z.-M. TAN 841

motion at the west portion of TC eyewall tilts in-ward toward the TC center with the height, which,however, does not appear in REXP2, might preventthe downdraft within TC eyewall and the ultimatedevelopment of TC.
5. Summary
This study presents a new scheme, termed VIRV,for TC initialization. In VIRV, a cycled-3DVARscheme is designed to assimilate the SLP and PBLwinds retrieved from QuikSCAT data using amodified UWPBL model for the case of strongsurface wind, into the WRF model in a high-
resolution. In comparison with the bogus vortextechniques (i.e., BDA) that are widely used in re-search and operational forecasting for TC, theVIRV attempts to reproduce a more realistic struc-ture of TC with the joint application of PBL obser-vation and the advanced PBL dynamical constraintinstead of using a bogus vortex.
The VIRV was tested for two realistic TC Bilis(2006) and TC Fung-wong (2008) with a series ofnumerical experiments. It is found that the re-trieved SLP and horizontal wind can be reasonablyincorporated into the numerical model to recoverthe initial TC structure. On the basis of this, the
Fig. 13. The west–east cross section for the vertical velocity and relative humidity cutting through center ofTC Fung-wong. (a) vertical velocity (�10�1 ms�1, contour interval of 2� 10�1 m s�1) and relative humid-ity (%, shaded, interval of 5%) simulated by CTRL at 12 h. (b) same as (a), but for REXP2; (c) same as (a),but for 18 h; (d) same as (b), but for 18 h. The blank region indicates the topography of Taiwan.
842 Journal of the Meteorological Society of Japan Vol. 88, No. 5

VIRV enhances the low-level (high-level) conver-gence and inflow (divergence and outflow), warmcore, as well as the merger of mesoscale vorticessurrounding the core of TC due to the slightly-enhanced VSW. As a result, the simulated TCMWS, MSLP, and track are improved. The largestimprovement is in MWS, with 22.8% reductionof error for a 48-hour simulation. The MRP forUWPBL enhanced the simulation of MWS by6.9%. The change in MSLP (15.7%) is also consid-erable. In addition, the calculation of the radius ofdeformation indicates that in VIRV a geostrophicadjustment of pressure fields is favored toward thewind fields. This might be the reason why MSLPchanges much slower than MWS in response toVIRV. Although the MRP of the UWPBL modelintensifies the latent heating flux in the case ofstrong winds, the reduction of ocean-atmospherePBL momentum mixing due to the MRP yields thesurface sensible heating flux an approximate con-stant. VIRV also reduces the error of TC trackabout 20.1% by modifying the steering flowthroughout the whole troposphere. In particular,the low-troposphere moisture structure is evidentlya¤ected by VIRV during the TC initialization,which, in association with its interaction with theperturbations over Taiwan topography, is believedto be responsible for the change in the intensityand movement of TC.
For the future study, a growing number of obser-vations and simulations have noticed that the vari-ation in the drag coe‰cient with wind speed isclosely associated with the location relative to theTC center (Powell et al. 2003). Research is requiredto address this issue in improving the performanceof MRP and PBL parameterization within VIRV.Moreover, the behavior of other advanced assimila-tion techniques, e.g., 4DVAR (Zou et al. 1997; Zouand Xiao 2000), Ensemble Kalman Filter (EnKF)(Houtekamer and Mitchell 1998, 2005; Anderson2001), as well as additional observations (e.g.,DOTSTAR data: Wu et al. 2007; Yamaguchi et al.2009) based on special observational strategies(e.g., Aberson 2003) and multi-datasets (e.g., Chouet al. 2010), are also deserving to be verified inVIRV. Most importantly, much detailed physicaland dynamical reasoning is desired for a compre-hensive evaluation of VIRV in TC initialization,with emphasis on air-sea interaction (Black et al.2007; Terill et al. 2007) and PBL processes (e.g.,Braun and Tao 2000; Hong et al. 2006; Frenchet al. 2007).
Acknowledgements
This study was jointly supported by the National973 Project (No. 2009CB421500, 2009CB421502),grant from the National Natural Science Founda-tion (under 40705024, 40828005, 40921160382, theNational Special Funding Project for MeteorologyGYHY200706033, GYHY200706020 and the Insti-tutional Fundamental Research and OperationalProject of China. The authors wish to express theirspecial gratitude to Dr. Patoux of University ofWashington for his valuable suggestions on the useof the UWPBL model. The much valuable com-ments and suggestions of the three anonymous re-viewers are greatly appreciated.
References
Aberson, S. D., 2003: Targeted observations to improveoperational tropical cyclone track forecast guid-ance. Mon. Wea. Rev., 131, 1613–162.
Anderson, J. L., 2001: An ensemble adjustment Kalmanfilter for data assimilation. Mon. Wea. Rev., 129,2884–2903.
Bender, M. A., 1997: The e¤ect of relative flow on theasymmetric structure of the interior of hurricanes.J. Atmos. Sci., 54, 703–724.
Bender, M. A., R. E. Tuleya, and Y. Kurihara, 1987:A numerical study of the e¤ect of island terrainon tropical cyclones. Mon. Wea. Rev., 115, 130–155.
Bishop, C. H., B. J. Etherton, and S. J. Majumdar, 2001:Adaptive sampling with the ensemble transformKalman filter. Part I: Theoretical aspects. Mon.
Wea. Rev., 129, 420–436.Black, M. L., and H. E. Willoughby, 1992: The concen-
tric eyewall cycle of Hurricane Gilbert. Mon. Wea.
Rev., 120, 947–957.Black, M. L., J. F. Gamache, F. D. Marks Jr., C. E.
Samsury, and H. E. Willoughby, 2002: EasternPacific hurricanes Jimena of 1991 and Olivia of1994: The e¤ect of vertical shear on structure andintensity. Mon. Wea. Rev., 130, 2291–2312.
Black, P. G., E. A. D’Asaro, W. M. Drennan, J. R.French, P. P. Niiler, T. B. Sanford, E. J. Terill,E. J. Walsh, and J.-A. Zhang, 2007: Air-sea ex-change in hurrinces—Synthesis of observationfrom the coupled boundary layer air-sea transferexperiment. Bull. Amer. Metero. Soc., 88, 357–374.
Blackwell, K. G., 2000: The evolution of HurricaneDanny (1997) at landfall: Doppler-observed eyewallreplacement, vortex contraction/intensification,and low-level wind maxima. Mon. Wea. Rev., 128,4002–4016.
Braun, S. A., and W.-K. Tao, 2000: Sensitivity of high-resolution simulations of Hurricane Bob (1991) to
October 2010 L.-M. MA and Z.-M. TAN 843
planetary boundary layer parameterizations. Mon.
Wea. Rev., 128, 3941–3961.Braun, S. A., and L. Wu, 2007: A Numerical study of
hurricane Erin (2001). Part II: Shear and the orga-nization of eyewall vertical motion. Mon. Wea.
Rev., 135, 1179–1194.Brown, R. A., 1970: A secondary flow model for the plan-
etary boundary layer. J. Atmos. Sci., 27, 742–757.Brown, R. A., 1981: Modeling the geostrophic drag coef-
ficient for AIDJEX. J. Geophys. Res., 86, 1989–1994.
Brown, R. A., and L. Zeng, 1994: Estimating centralpressures of oceanic midlatitude cyclones. J. Appl.Meteor., 33, 1088–1095.
Chen, S. -H., Z. Zhao, J. S. Haase, et al., 2008: A studyof the characteristics and assimilation of retrievedMODIS total precipitable water data in severeweather simulations. Mon. Wea. Rev., 136, 3608–3628.
Chou, K.-H., and C.-C. Wu, 2008: Development of thetyphoon initialization in a mesoscale model—Combination of the bogused vortex with the drop-windsonde data in DOTSTAR. Mon. Wea. Rev.,136, 865–879.
Chou, K.-H., C.-C. Wu, P.-H. Lin, and S. Majumdar,2010: Validation of QuikSCAT wind vectors bydropwindsonde data from Dropwindsonde Obser-vations for Typhoon Surveillance Near the TaiwanRegion (DOTSTAR). J. Geophys. Res., 115,D02109, doi:10.1029/2009JD012131.
Davis, C., and L. F. Bosart, 2001: Numerical simulationsof the genesis of Hurricane Diana (1984) Part I:Control simulation. Mon. Wea. Rev., 129, 1859–1881.
Davis, C., W. Wang, S. Y. Chen, Y. Chen, et al., 2008:Prediction of Landfalling Hurricanes with the Ad-vanced Hurricane WRF Model. Mon. Wea. Rev.,136, 1990–2005.
DeMaria, M., and J. Kaplan, 1999: An updated statisti-cal hurricane intensity prediction scheme (SHIPS)for the Atlantic and eastern North Pacific basins.Wea. Forecasting, 14, 326–337.
Dudhia, J., 2002: PSU/NCAR Mesoscale Modeling Sys-tem Tutorial Class Notes and User’s Guide: MM5Modeling System Version 3, NCAR Tech. Note,2002.
Emanuel, K. A., 1986: An air-sea interaction theory fortropical cyclones. Part I: Steady-state maintenance.J. Atmos. Sci., 43, 585–604.
Emanuel, K. A., 2003: A similarity hypothesis for air–seaexchange at extreme wind speeds. J. Atmos. Sci.,60, 1420–1428.
Fitzpatrick, P. J., 1997: Understanding and forecastingtropical cyclone intensity change with the TyphoonIntensity Predictions Scheme (TIPS). Wea. Fore-
casting, 12, 826–846.
Foster, R. C., R. A. Brown, and A. Enloe, 1999: Baro-clinic modifications of midlatitude marine surfacewind vectors observed by the NASA scatterometer.J. Geophys. Res., 104, 31225–31237.
Frank, W. M., and E. A. Ritchie, 1999: E¤ects of envi-ronmental flow upon tropical cyclone structure.Mon. Wea. Rev., 127, 2044–2061.
Franklin, J. L., S. J. Lord, S. E. Feuer, and F. D. MarksJr., 1993: The kinematic structure of HurricaneGloria (1985) determined from nested analysis ofdropwindsonde and Doppler radar data. Mon.
Wea. Rev., 121, 2433–2451.French, J. R., W. M. Drennan, J.-A. Zhang, and P. G.
Black, 2007: Turbulent fluxes in the hurricaneboundary layer. Part I: momentum flux. J. Atm-
mos. Soc., 64, 1089–1102.Hanley, D., J. Molinari, and D. Keyser, 2001: A compos-
ite study of the interactions between tropicalcyclones and uppertropospheric troughs. Mon.
Wea. Rev., 129, 2570–2584.Ho¤man, R. N., and S. M. Leidner, 2005: An introduc-
tion to the near-real-time QuikSCAT data. Wea.
Forecasting, 20, 476–493.Holton, J. R., 1992: An Introduction to Dynamic Meteo-
rology. 3d ed. Academic Press, 511 pp.Hong, S.-Y., and H. -L. Pan, 1996: Nonlocal boundary
layer vertical di¤usion in a medium-range forecastmodel. Mon. Wea. Rev., 124, 2322–2339.
Hong, S.-Y., J. Dudhia, and S.-H. Chen, 2004: A revisedapproach to ice microphysical processes for thebulk parameterization of clouds and precipitation.Mon. Wea. Rev., 132, 103–120.
Hong, S.-Y., Y. Noh, and J. Dudhia, 2006: A new verti-cal di¤usion package with an explicit treatmentof entrainment processes. Mon. Wea. Rev., 134,2318–2341.
Houtekamer, P. L., and H. L. Mitchell, 1998: Data as-similation using an ensemble Kalman filter tech-nique. Mon. Wea. Rev., 126, 796–811.
Houtekamer, P. L., and H. L. Mitchell, 2005: EnsembleKalman filtering. Quart. J. Roy. Meteor. Soc.,131, 3269–3289.
Kossin, J. P., and W. H. Schubert, 2001: Mesovortices,polygonal flow patterns, and rapid pressure falls inhurricane-like vortices. J. Atmos. Sci., 58, 2196–2209.
Krishnamurti, T. N., J. Xue, H. S. Bedi, K. Ingles, andD. Oosterhof, 1991: Physical initialization for nu-merical weather prediction over the tropics. Tellus,43AB, 53–81.
Krishnamurti, T. N., H. S. Bedi, G. D. Rohaly, D. K.Oosterhof, R. C. Torres, E. Williford, and N.Surgi, 1996: Physical initialization. J. Atmos.
Oceans, 35, 369–398.Krishnamurti, T. N., W. Han, and D. K. Oosterhof,
1998: Sensitivity of hurricane intensity forecasts to
844 Journal of the Meteorological Society of Japan Vol. 88, No. 5

physical initialization. Meteor. Atmos. Phys., 65,171–181.
Kurihara, Y., M. A. Bender, R. E. Tuleya, and R. J.Ross, 1990: Prediction experiments of HurricaneGloria (1985) using a multiply nested movablemesh model. Mon. Wea. Rev., 118, 2185–2198.
Kurihara, Y., M. A. Bender, R. E. Tuleya, and R. J. Ross,1995: Improvements in the GFDL hurricane predic-tion system. Mon. Wea. Rev., 123, 2791–2801.
Leslie, L. M., and G. J. Holland, 1995: On the bogussingof tropical cyclones in numerical models—A com-parison of vortex profiles. Meteor. Atmos. Phys.,56, 101–110.
Lin, Y. -L., J. Han, D. W. Hamilton, and C.-Y. Huang,1999: Orographic influence on a drifting cyclone. J.Atmos. Sci., 56, 534–562.
Liu, W. T., K. B. Katsaros, and J. A. Businger, 1979:Bulk parameterization of air-sea exchange of heatand water vapor including the molecular con-straints at the interface. J. Atmos. Sci., 36, 1722–1735.
Liu, D. C., and J. Nocedel, 1989: On the limited memoryBFGS method for large scale optimization. Math.
Program., 45, 503–528.Ma, L. -M., Z. Qin, Y. Duan, B. -Y. Du, 2002: Numeri-
cal experiments for the impact of ocean heat fluxon the development of cyclones in East China Sea.Acta Oceanol. Sinica (in Chinese), 24, 112–121.
Ma, L. -M., Z. Qin, Y. Duan, et al., 2006: Impacts ofTRMM SRR assimilation on the numerical predic-tion of tropical cyclone. Acta. Oceanol. Sinica, 25,14–26.
Ma, L. -M., J. C. L. Chan, N. Davidson, and J. Turk,2007: Initialization with diabatic heating fromsatellite-derived rainfall. Atmos. Res., 85, 148–158.
Makin, V. K., 2005: A note on the drag of the sea surfaceat hurricane winds. Bound.-Layer Meteor., 115,169–176.
Marks, F., Jr., R. A. Houze Jr., and J. F. Gamache,1992: Dualaircraft investigation of the inner coreof Hurricane Norbert. Part I: Kinematic structure.J. Atmos. Sci., 49, 919–942.
Miller, D. K., and K. B. Katsaros, 1992: Satellite-derivedsurface latent heat fluxes in a rapidly intensifyingmarine cyclone, Mon. Wea. Rev., 120, 1093–1107.
Montgomery, M. T., and J. Enagonio, 1998: Tropicalcyclogenesis via convectively forced vortex Rossbywaves in a three-dimensional quasigeostrophicmodel. J. Atmos. Sci., 55, 3176–3207.
Montgomery, M. T., V. A. Vladimirov, and P. V. Denis-senko, 2002: An experimental study on hurricanemesovortices. J. Fluid Mech., 471, 1–32.
Moon, I.-J., T. Hara, I. Ginis, S. E. Belcher, and H. Tol-man, 2004a: E¤ect of surface waves on air–seamomentum exchange. Part I: E¤ect of mature andgrowing seas. J. Atmos. Sci., 61, 2321–2333.
Moon, I.-J., I. Ginis, and T. Hara, 2004b: E¤ect of sur-face waves on air–sea momentum exchange. PartII: Behavior of drag coe‰cient under tropical cy-clones. J. Atmos. Sci., 61, 2334–2348.
Moon, I.-J., I. Ginis, and T. Hara, 2004c: E¤ect ofsurface waves on Charnock coe‰cient under tropi-cal cyclones. Geophys. Res. Lett., 31, L20302,Doi:10.1029/2004GL020988.
Moon, I.-J., I. Ginis, T. Hara, and B. Thomas, 2007: Aphysics-based parameterization of air-sea momen-tum flux at high wind speeds and its impact on hur-ricane intensity predictions. Mon. Wea. Rev., 135,2869–2878.
Neldar, J. A., and R. Mead, 1965: A simplex method forfunction minimization. Comput. J., 7, 308–313.
Noh, Y., W. G. Cheon, S. Y. Hong, and S. Raasch,2003: Improvement of the K-profile model forthe planetary boundary layer based on large eddysimulation sata. Bound.-Layer Meteor., 107, 401–427.
Parrish, D. F., and J. C. Derber, 1992: The National Me-teorological Center’s Spectral Statistical Interpola-tion analysis system. Mon. Wea. Rev., 120, 1747–1763.
Paterson, L. A., N. B. Hanstrum, N. E. Davidson, andH. C. Weber, 2005: Influence of environmentalvertical wind shear on the intensity of hurricane-strength tropical cyclones in the Australian region.Mon. Wea. Rev., 133, 3644–3660.
Patoux, J., 2000: UWPBL 3.0, The University ofWashington Planetary Boundary Layer (UWPBL)Model. Tech. Note, University of Washington, 54pp.
Patoux, J., and R. A. Brown, 2002: A gradient wind cor-rection for surface pressure fields retrieved fromscatterometer winds. J. Appl. Meteor., 41, 133–143.
Patoux, J., R. C. Foster, and R. A. Brown, 2003: Globalpressure fields from scatterometer winds. J. Appl.Meteor., 42, 813–826.
Patoux, J., R. C. Foster, and R. A. Brown, 2008: Anevaluation of scatterrometer-derived oceanic sur-face pressure fields. J. Appl. Meteor. Climat., 47,835–852.
Powell, M. D., P. J. Vickery, and T. A. Reinhold, 2003:Reduced drag coe‰cient for high wind speeds intropical cyclones. Nature, 422, 279–283.
Pu, Z.-X., and S. A. Braun, 2001: Evaluation of bogusvortex techniques with four-dimensional varia-tional data assimilation. Mon. Wea. Rev., 129,2023–2039.
Reasor, P. D., M. T. Montgomery, F. D. Marks Jr., andJ. F. Gamache, 2000: Low-wavenumber structureand evolution of the hurricane inner core observedby airborne dual-Doppler radar. Mon. Wea. Rev.,128, 1653–1680.
October 2010 L.-M. MA and Z.-M. TAN 845
Ritchie, E. A., and G. J. Holland, 1997: Scale interac-tions during the formation of Typhoon Irving.Mon. Wea. Rev., 125, 1377–1396.
Rogers, R., S. Chen, J. Tenerelli, and H. Willoughby,2003: A numerical study of the impact of verticalshear on the distribution of rainfall in HurricaneBonnie (1998). Mon. Wea. Rev., 131, 1577–1599.
Schubert, W. H., J. J. Hack, P. L. Silva Dias, and S. R.Fulton, 1980: Geostrophic adjustment in anaxisymmetric vortex. J. Atmos. Sci., 37, 1464–1484.
Schubert, W. H., M. T. Montgomery, R. K. Taft, T. A.Guinn, S. R. Fulton, J. P. Kossin, and J. P. Ed-wards, 1999: Polygonal eyewalls, asymmetric eyecontraction, and potential vorticity mixing in hur-ricanes. J. Atmos. Sci., 56, 1197–1223.
Shapiro, L. J., and M. T. Montgomery, 1993: A three-dimensional balance theory for rapidly rotatingvortices. J. Atmos. Sci., 50, 3322–3335.
Skamarock, W. C., J. B. Klemp, J. Dudhia, D. O. Gill,D. M. Barker, W. Wang, and J. G. Powers,2005: A description of the Advanced ResearchWRF version 2. NCAR Tech. Note TN-4681STR,88 pp.
Smith, S. D., 1988: Coe‰cients for sea surface windstress, heat flux, and wind profiles as a functionof wind speed and temperature, J. Geophys. Res.,93(C12), 15467–15472.
Stevens, B., J. Duan, J. C. McWilliams, M. Munnich,and J. D. Neelin, 2002: Entrainment, Rayleigh fric-tion, and boundary layer winds over the tropicalPacific. J. Climate, 15, 30–44.
Stiles, B. W., and S. Yueh, 2002: Impact of rain on space-borne Kuband scatterometer data. IEEE Trans.
Geosci. Remote Sens., 40, 1973–1983.Terill, E. J. Walsh, and J.-A. Zhang, 2007: Air-sea
exchange in hurrinces—Synthesis of observationfrom the coupled boundary layer air-sea trans-fer experiment. Bull. Amer. Metero. Soc., 88, 357–374.
Tang, X. D., and Z.-M. Tan, 2006: Boundary-layer windstructure in a landfalling tropical cyclone. Adv.
Atmos. Sci., 23, 737–749.Wentz, F., and D. K. Smith, 1998: Rain e¤ect on
NSCAT sigma-0 measurements. Proc. NSCAT/
Quikscat Science Team Meeting, Kona, HI, JetPropulsion Laboratory.
Willoughby, H. E., J. A. Clos, and M. G. Shoreibah,1982: Concentric eyewalls, secondary wind max-ima, and the evolution of the hurricane vortex. J.Atmos. Sci., 39, 395–411.
Willoughby, H. E., F. D. Marks Jr., and R. J. Feinberg,1984: Stationary and moving convective bands inhurricanes. J. Atmos. Sci., 41, 3189–3211.
Willoughby, H. E., 1990: Temporal changes in the pri-mary circulation in tropical cyclones. J. Atmos.
Sci., 47, 242–264.Wu, C.-C., 2001: Numerical simulation of Typhoon Gla-
dys (1994) and its interaction with Taiwan terrainusing GFDL hurricane model. Mon. Wea. Rev.,129, 1533–1549.
Wu, C.-C., K.-H. Chou, Y. Wang, and Y.-H. Kuo, 2006:Tropical cyclone initialization and prediction basedon four-dimensional variational data assimilation.J. Atmos. Sci., 63, 2383–2395.
Wu, C.-C., K.-H. Chou, P.-H. Lin, S. D. Aberson, M. S.Peng, and T. Nakazawa, 2007: The impact ofdropwindsonde data on typhoon track forecasts inDOTSTAR. Wea. Forecasting, 22, 1157–1176.
Xiao, Q., X. Zou, and B. Wang, 2000: Initialization andSimulation of a Landfalling Hurricane Using aVariational Bogus Data Assimilation Scheme.Mon. Wea. Rev., 128, 2252–2269.
Xiao, Q., Y. -H. Kuo, Y. Zhang, D. M. Barker, 2006: Atropical cyclone bogus data assimilation scheme inthe MM5 3D-Var system and numerical experi-ments with typhoon Rusa (2002) near landfall. J.Meteor. Soc. Japan, 84, 671–689.
Xiao, Q., L. Chen, and X. Zhang, 2009: Evaluations ofBDA Scheme Using the Advanced Research WRF(ARW) Model. J. Appl. Meteorol. Climat., 48,680–689.
Xu, J., Q. Zhang, X. Zhang, S. Wang, and F. Lu, 2006:Status of Operational AMVs from FY-2C, Pro-
ceedings of the 8th International Winds, Beijing,China, 24–28 April, 2006.
Yamaguchi, M., T. Iriguchi, T. Nakazawa, and C.-C.Wu, 2009: An observing system experiment forTyphoon Conson (2004) using a singular vectormethod and DOTSTAR data. Mon. Wea. Rev.,137, 2801–2816.
Zhao, Q., and Y. Jin, 2008: High-resolution radar dataassimilation for Hurricane Isabel (2003) at landfall.Bull. Amer. Meteor. Soc., 89, 1355–1372.
Zou, X., F. Vandenberghe, M. Pondeca, and Y. -H.Kuo, 1997: Introduction to adjoint techniques andthe MM5 Adjoint Modeling System. NCAR Tech.
Note NCAR/TN-435þSTR, 110 pp.Zou, X., and Q. Xiao, 2000: Studies on the initialization
and simulation of a mature hurricane using avariational bogus data assimilation scheme. J. At-mos. Sci, 57, 836–860.
846 Journal of the Meteorological Society of Japan Vol. 88, No. 5