
TRISTATE CAPITAL HOLDINGS, INC.
87
Table of Contents UNITED STATES SECURITIES AND EXCHANGE COMMISSION Washington, D.C. 20549 ___________ FORM 10-Q ___________ ☒ QUARTERLY REPORT PURSUANT TO SECTION 13 OR 15(d) OF THE SECURITIES EXCHANGE ACT OF 1934 For the quarterly period ended September 30, 2020 ☐ TRANSITION REPORT PURSUANT TO SECTION 13 OR 15(d) OF THE SECURITIES EXCHANGE ACT OF 1934 For the transition period from ____ to ____ Commission file number: 001-35913 ___________ TRISTATE CAPITAL HOLDINGS, INC. (Exact name of registrant as specified in its charter) ___________ Pennsylvania 20-4929029 (State or other jurisdiction of incorporation or organization) (I.R.S. Employer Identification No.) One Oxford Centre (412) 304-0304 301 Grant Street, Suite 2700 (Registrant’s telephone number, including area code) Pittsburgh, Pennsylvania 15219 (Address of principal executive offices) (Zip Code) ___________ Securities registered pursuant to Section 12(b) of the Act: Title of each class Trading Symbol(s) Name of each exchange on which registered Common Stock, no par value TSC Nasdaq Global Select Market Depositary Shares, Each Representing a 1/40th Interest in a Share of 6.75% Fixed-to-Floating Rate Series A Non-Cumulative Perpetual Preferred Stock TSCAP Nasdaq Global Select Market Depositary Shares, Each Representing a 1/40th Interest in a Share of 6.375% Fixed-to-Floating Rate Series B Non-Cumulative Perpetual Preferred Stock TSCBP Nasdaq Global Select Market ___________ Indicate by check mark whether the registrant (1) has filed all reports required to be filed by Section 13 or 15(d) of the Securities Exchange Act of 1934 during the preceding 12 months (or for such shorter period that the registrant was required to file such reports), and (2) has been subject to such filing requirements for the past 90 days. ý Yes ¨ No Indicate by check mark whether the registrant has submitted electronically every Interactive Data File required to be submitted pursuant to Rule 405 of Regulation S-T (§ 232.405) during the preceding 12 months (or for such shorter period that the registrant was required to submit such files). ý Yes ¨ No
Transcript of TRISTATE CAPITAL HOLDINGS, INC.

Table of Contents
UNITED STATESSECURITIES AND EXCHANGE COMMISSION
Washington, D.C. 20549___________
FORM 10-Q___________
☒ QUARTERLY REPORT PURSUANT TO SECTION 13 OR 15(d) OF THE SECURITIES EXCHANGE ACT OF 1934
For the quarterly period ended September 30, 2020
☐ TRANSITION REPORT PURSUANT TO SECTION 13 OR 15(d) OF THE SECURITIES EXCHANGE ACT OF 1934
For the transition period from ____ to ____
Commission file number: 001-35913___________
TRISTATE CAPITAL HOLDINGS, INC.(Exact name of registrant as specified in its charter)
___________
Pennsylvania 20-4929029(State or other jurisdiction of incorporation or organization) (I.R.S. Employer Identification No.)
One Oxford Centre (412) 304-0304301 Grant Street, Suite 2700 (Registrant’s telephone number, including area code)
Pittsburgh, Pennsylvania 15219(Address of principal executive offices) (Zip Code)
___________
Securities registered pursuant to Section 12(b) of the Act:
Title of each class Trading Symbol(s) Name of each exchange on which registeredCommon Stock, no par value TSC Nasdaq Global Select Market
Depositary Shares, Each Representing a 1/40th Interest in a Shareof 6.75% Fixed-to-Floating Rate Series A Non-Cumulative
Perpetual Preferred StockTSCAP Nasdaq Global Select Market
Depositary Shares, Each Representing a 1/40th Interest in a Shareof 6.375% Fixed-to-Floating Rate Series B Non-Cumulative
Perpetual Preferred StockTSCBP Nasdaq Global Select Market
___________
Indicate by check mark whether the registrant (1) has filed all reports required to be filed by Section 13 or 15(d) of the Securities Exchange Act of 1934 during thepreceding 12 months (or for such shorter period that the registrant was required to file such reports), and (2) has been subject to such filing requirements for thepast 90 days. ý Yes ¨ No
Indicate by check mark whether the registrant has submitted electronically every Interactive Data File required to be submitted pursuant to Rule 405 of RegulationS-T (§ 232.405) during the preceding 12 months (or for such shorter period that the registrant was required to submit such files). ý Yes ¨ No

Table of Contents
Indicate by check mark whether the registrant is a large accelerated filer, an accelerated filer, a non-accelerated filer, smaller reporting company, or an emerginggrowth company. See the definitions of “large accelerated filer,” “accelerated filer,” “smaller reporting company,” and “emerging growth company” in Rule 12b-2of the Exchange Act.
Large accelerated filer ☐ Accelerated filer ýNon-accelerated filer ☐ Smaller reporting company ☐
Emerging growth company ☐
If an emerging growth company, indicate by check mark if the registrant has elected not to use the extended transition period for complying with any new orrevised financial accounting standards provided pursuant to Section 13(a) of the Exchange Act. ¨
Indicate by check mark whether the registrant is a shell company (as defined in Rule 12b-2 of the Exchange Act). ☐ Yes ý No___________
As of October 31, 2020, there were 29,825,057 shares of the registrant’s common stock, no par value, outstanding.
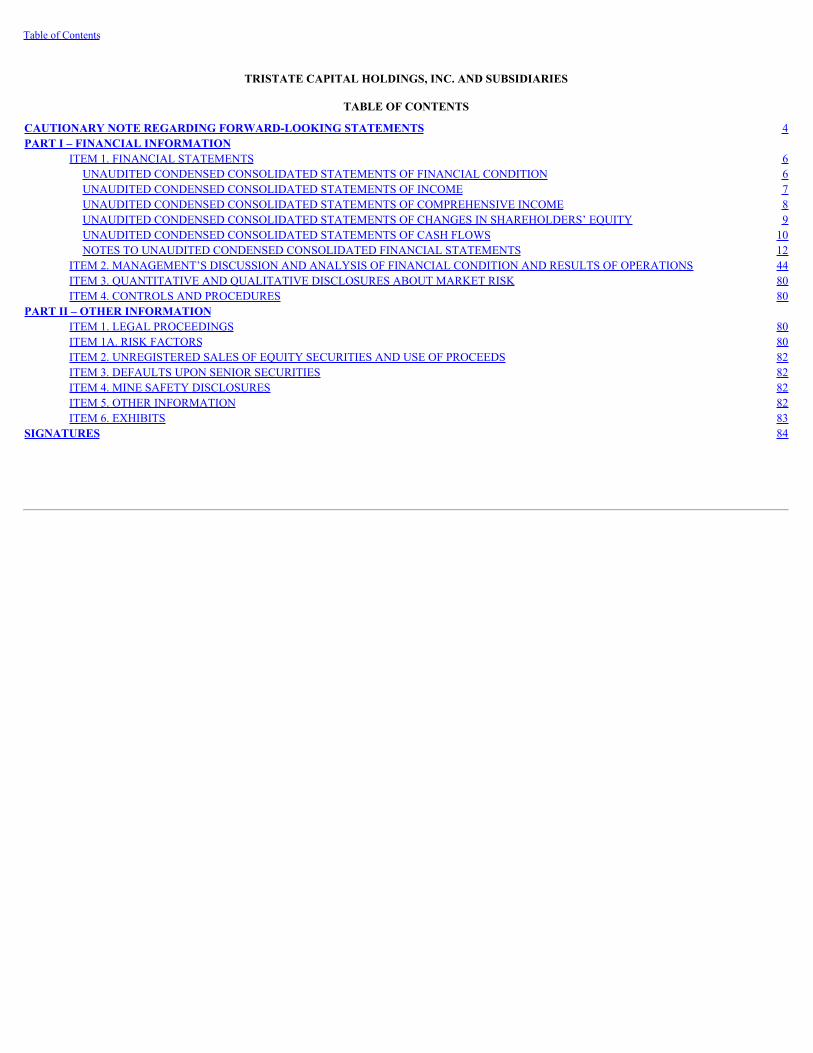
Table of Contents
TRISTATE CAPITAL HOLDINGS, INC. AND SUBSIDIARIES
TABLE OF CONTENTS
CAUTIONARY NOTE REGARDING FORWARD-LOOKING STATEMENTS 4PART I – FINANCIAL INFORMATION
ITEM 1. FINANCIAL STATEMENTS 6UNAUDITED CONDENSED CONSOLIDATED STATEMENTS OF FINANCIAL CONDITION 6UNAUDITED CONDENSED CONSOLIDATED STATEMENTS OF INCOME 7UNAUDITED CONDENSED CONSOLIDATED STATEMENTS OF COMPREHENSIVE INCOME 8UNAUDITED CONDENSED CONSOLIDATED STATEMENTS OF CHANGES IN SHAREHOLDERS’ EQUITY 9UNAUDITED CONDENSED CONSOLIDATED STATEMENTS OF CASH FLOWS 10NOTES TO UNAUDITED CONDENSED CONSOLIDATED FINANCIAL STATEMENTS 12
ITEM 2. MANAGEMENT’S DISCUSSION AND ANALYSIS OF FINANCIAL CONDITION AND RESULTS OF OPERATIONS 44ITEM 3. QUANTITATIVE AND QUALITATIVE DISCLOSURES ABOUT MARKET RISK 80ITEM 4. CONTROLS AND PROCEDURES 80
PART II – OTHER INFORMATIONITEM 1. LEGAL PROCEEDINGS 80ITEM 1A. RISK FACTORS 80ITEM 2. UNREGISTERED SALES OF EQUITY SECURITIES AND USE OF PROCEEDS 82ITEM 3. DEFAULTS UPON SENIOR SECURITIES 82ITEM 4. MINE SAFETY DISCLOSURES 82ITEM 5. OTHER INFORMATION 82ITEM 6. EXHIBITS 83
SIGNATURES 84

Table of Contents
CAUTIONARY NOTE REGARDING FORWARD-LOOKING STATEMENTS
This Quarterly Report on Form 10-Q contains “forward-looking statements” within the meaning of Section 27A of the Securities Act of 1933, as amended, andSection 21E of the Securities Exchange Act of 1934, as amended (the “Exchange Act”). These forward-looking statements reflect our current views with respect to,among other things, future events and our financial performance, as well as our goals and objectives for future operations, financial and business trends, businessprospects, our expected sale of securities to Stone Point Capital LLC and management’s outlook or expectations for earnings, revenues, expenses, capital levels,liquidity levels, asset quality or other measures of future financial or business performance, strategies or expectations. These statements are often, but not always,indicated through the use of words or phrases such as “achieve,” “anticipate,” “believe,” “continue,” “could,” “estimate,” “expect,” “intend,” “maintain,” “may,”“opportunity,” “outlook,” “plan,” “potential,” “predict,” “projection,” “seek,” “should,” “sustain,” “target,” “trend,” “will,” “will likely result,” and “would,” or thenegative version of those words or other comparable statements of a future or forward-looking nature. These forward-looking statements are not historical facts,and are based on current expectations, estimates and projections about our industry and beliefs or assumptions made by management, many of which, by theirnature, are inherently uncertain. Although we believe that the expectations reflected in these forward-looking statements are reasonable as of the date made, actualresults may prove to be materially different from the results expressed or implied by the forward-looking statements. Accordingly, we caution you that any suchforward-looking statements are not guarantees of future performance and are subject to risks, assumptions and uncertainties that change over time and are difficultto predict, including, but not limited to, the following:
• risks associated with COVID-19 and their expected impact and duration, including effects on our operations, our clients, economic conditions and thedemand for our products and services;
• the failure or inability to complete our recently announced private placement of securities due to the failure to satisfy any conditions to closing of thetransaction or otherwise;
• our ability to prudently manage our growth and execute our strategy; including the successful integration of past and future acquisitions, our ability tofully realize the cost savings and other benefits of our acquisitions, manage risks related to business disruption following those acquisitions, and managecustomer disintermediation;
• deterioration of our asset quality;
• our level of non-performing assets and the costs associated with resolving problem loans, including litigation and other costs;
• possible additional loan and lease losses and impairment, changes in the value of collateral securing our loans and leases and the collectability of loansand leases; particularly as a result of the COVID-19 pandemic and the programs implemented by the Coronavirus Aid, Relief, and Economic Security(“CARES”) Act, including its automatic loan forbearance provisions;
• possible changes in the speed of loan prepayments by customers and loan origination or sales volumes;
• business and economic conditions and trends generally and in the financial services industry, nationally and within our local market areas, including theeffects of an increase in unemployment levels, slowdowns in economic growth and changes in demand for products or services or the value of assetsunder management;
• our ability to maintain important deposit customer relationships, our reputation and otherwise avoid liquidity risks;
• changes in management personnel;
• our ability to recruit and retain key employees;
• volatility and direction of interest rates;
• risks related to the phasing out of LIBOR and changes in the manner of calculating reference rates, as well as the impact of the phase out of LIBOR andintroduction of alternative reference rates on the value of loans and other financial instruments we hold that are linked to LIBOR;
• changes in accounting policies, accounting standards, or authoritative accounting guidance, including the current expected credit loss (“CECL”) model,which may increase the level of our allowance for credit losses upon adoption;
• any impairment of our goodwill or other intangible assets;
• our ability to develop and provide competitive products and services that appeal to our customers and target markets;
• our ability to provide investment management performance competitive with our peers and benchmarks;
• fluctuations in the carrying value of the assets under management held by our Chartwell Investment Partners, LLC subsidiary, as well as the relative andabsolute investment performance of such subsidiary’s investment products;
• operational risks associated with our business, including technology and cyber-security related risks;
4

Table of Contents
• increased competition in the financial services industry, particularly from regional and national institutions;
• negative perceptions or publicity with respect to any products or services we offer;
• adverse judgments or other resolutions of pending and future legal proceedings, and costs incurred in defending such proceedings;
• changes in the laws, rules, regulations, interpretations or policies relating to financial institutions, accounting, tax, trade, monetary and fiscal matters,including economic stimulus programs, and potential expenses associated with complying with such laws and regulations;
• our ability to comply with applicable capital and liquidity requirements, including our ability to generate liquidity internally or raise capital on favorableterms;
• regulatory limits on our ability to receive dividends from our subsidiaries and pay dividends to shareholders;
• changes and direction of government policy toward and intervention in the U.S. financial system;
• natural disasters and adverse weather, acts of terrorism, regional or national civil unrest, cyber-attacks, an outbreak of hostilities, a public health outbreak(such as COVID-19) or other international or domestic calamities, and other matters beyond our control;
• the effects of any reputation, credit, interest rate, market, operational, legal, liquidity, regulatory or compliance risk resulting from developments related toany of the risks discussed above; and
• other factors that are discussed in the section entitled “Risk Factors” in our Annual Report on Form 10-K, filed with the SEC, which is accessible atwww.sec.gov.
The foregoing factors should not be construed as exhaustive and should be read together with the other cautionary statements included in this document. If one ormore events related to these or other risks or uncertainties materialize, or if our underlying assumptions prove to be incorrect, actual results may differ materiallyfrom what we anticipate. Accordingly, you should not place undue reliance on any such forward-looking statements. New factors emerge from time to time, and itis not possible for us to predict which will arise. Any forward-looking statement speaks only as of the date on which it is made, and we do not undertake anyobligation to update or review any forward-looking statement, whether as a result of new information, future developments or otherwise. In addition, we cannotassess the impact of each factor on our business or the extent to which any factor, or combination of factors, may cause actual results to differ materially fromthose contained in any forward-looking statements.
5
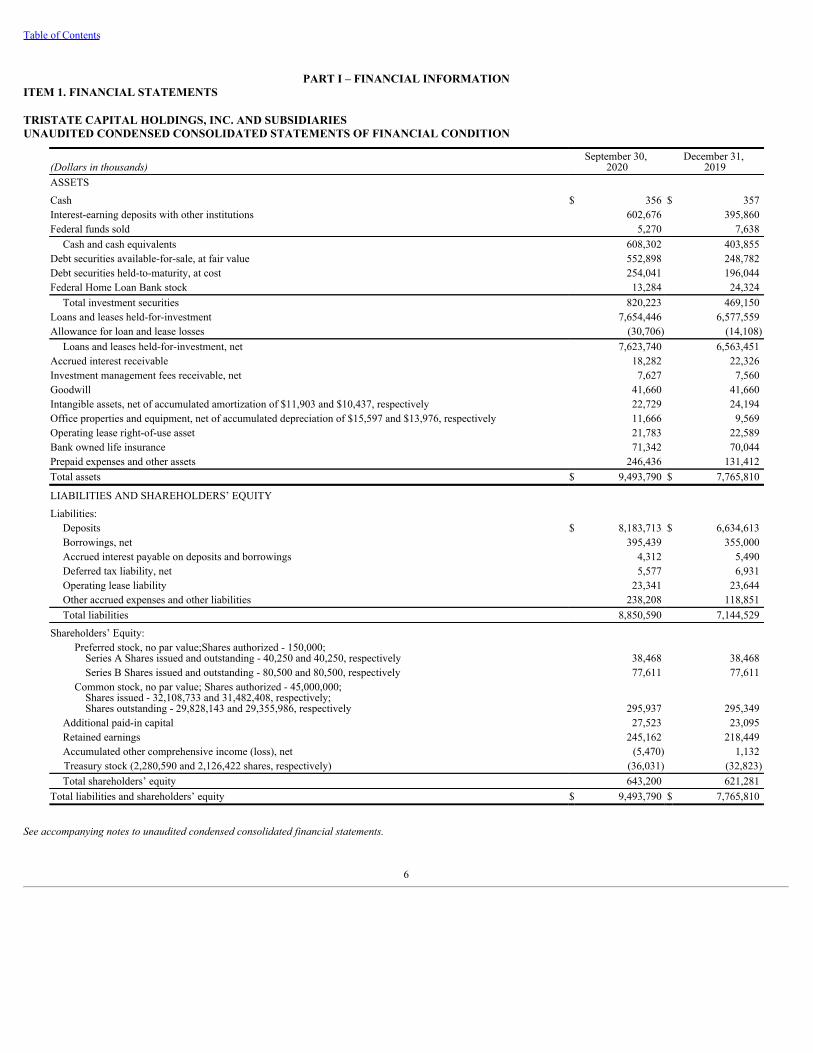
Table of Contents
PART I – FINANCIAL INFORMATIONITEM 1. FINANCIAL STATEMENTS
TRISTATE CAPITAL HOLDINGS, INC. AND SUBSIDIARIESUNAUDITED CONDENSED CONSOLIDATED STATEMENTS OF FINANCIAL CONDITION
(Dollars in thousands)September 30,
2020December 31,
2019ASSETS
Cash $ 356 $ 357 Interest-earning deposits with other institutions 602,676 395,860 Federal funds sold 5,270 7,638
Cash and cash equivalents 608,302 403,855 Debt securities available-for-sale, at fair value 552,898 248,782 Debt securities held-to-maturity, at cost 254,041 196,044 Federal Home Loan Bank stock 13,284 24,324
Total investment securities 820,223 469,150 Loans and leases held-for-investment 7,654,446 6,577,559 Allowance for loan and lease losses (30,706) (14,108)
Loans and leases held-for-investment, net 7,623,740 6,563,451 Accrued interest receivable 18,282 22,326 Investment management fees receivable, net 7,627 7,560 Goodwill 41,660 41,660 Intangible assets, net of accumulated amortization of $11,903 and $10,437, respectively 22,729 24,194 Office properties and equipment, net of accumulated depreciation of $15,597 and $13,976, respectively 11,666 9,569 Operating lease right-of-use asset 21,783 22,589 Bank owned life insurance 71,342 70,044 Prepaid expenses and other assets 246,436 131,412 Total assets $ 9,493,790 $ 7,765,810
LIABILITIES AND SHAREHOLDERS’ EQUITY
Liabilities:Deposits $ 8,183,713 $ 6,634,613 Borrowings, net 395,439 355,000 Accrued interest payable on deposits and borrowings 4,312 5,490 Deferred tax liability, net 5,577 6,931 Operating lease liability 23,341 23,644 Other accrued expenses and other liabilities 238,208 118,851 Total liabilities 8,850,590 7,144,529
Shareholders’ Equity:Preferred stock, no par value;Shares authorized - 150,000;
Series A Shares issued and outstanding - 40,250 and 40,250, respectively 38,468 38,468 Series B Shares issued and outstanding - 80,500 and 80,500, respectively 77,611 77,611
Common stock, no par value; Shares authorized - 45,000,000;Shares issued - 32,108,733 and 31,482,408, respectively;Shares outstanding - 29,828,143 and 29,355,986, respectively 295,937 295,349
Additional paid-in capital 27,523 23,095 Retained earnings 245,162 218,449 Accumulated other comprehensive income (loss), net (5,470) 1,132 Treasury stock (2,280,590 and 2,126,422 shares, respectively) (36,031) (32,823)Total shareholders’ equity 643,200 621,281
Total liabilities and shareholders’ equity $ 9,493,790 $ 7,765,810
See accompanying notes to unaudited condensed consolidated financial statements.
6
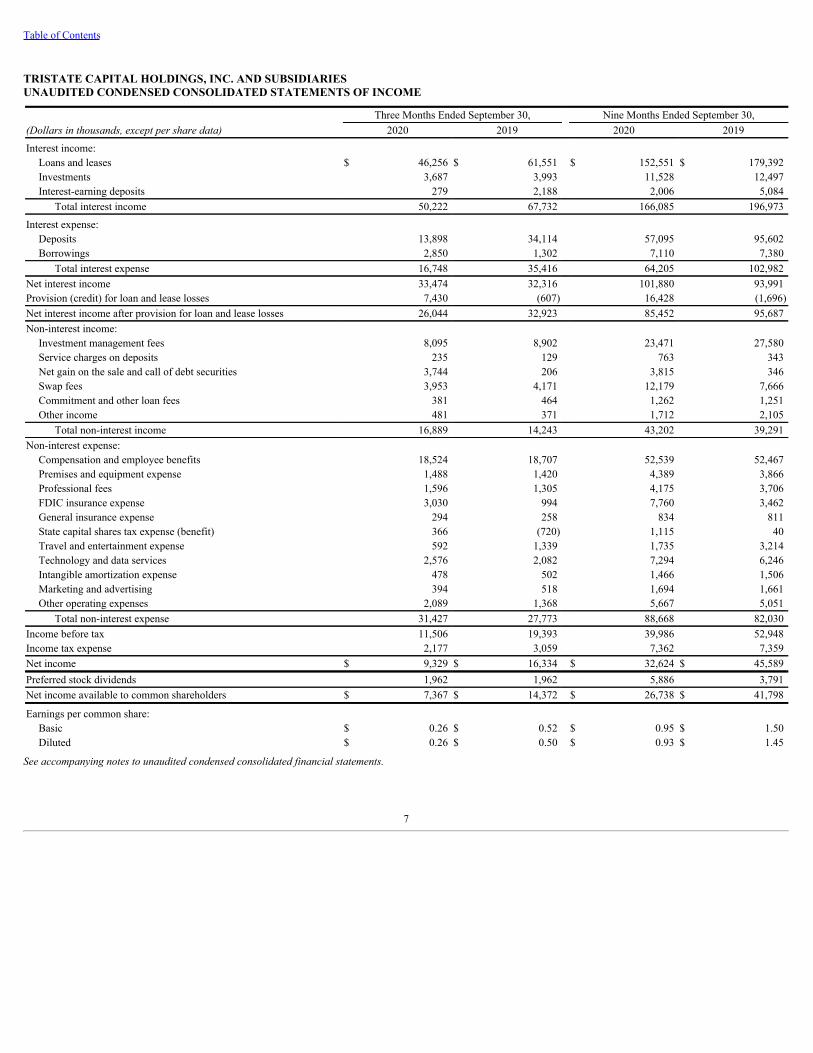
Table of Contents
TRISTATE CAPITAL HOLDINGS, INC. AND SUBSIDIARIESUNAUDITED CONDENSED CONSOLIDATED STATEMENTS OF INCOME
Three Months Ended September 30, Nine Months Ended September 30,(Dollars in thousands, except per share data) 2020 2019 2020 2019
Interest income:Loans and leases $ 46,256 $ 61,551 $ 152,551 $ 179,392 Investments 3,687 3,993 11,528 12,497 Interest-earning deposits 279 2,188 2,006 5,084
Total interest income 50,222 67,732 166,085 196,973
Interest expense:Deposits 13,898 34,114 57,095 95,602 Borrowings 2,850 1,302 7,110 7,380
Total interest expense 16,748 35,416 64,205 102,982 Net interest income 33,474 32,316 101,880 93,991 Provision (credit) for loan and lease losses 7,430 (607) 16,428 (1,696)Net interest income after provision for loan and lease losses 26,044 32,923 85,452 95,687 Non-interest income:
Investment management fees 8,095 8,902 23,471 27,580 Service charges on deposits 235 129 763 343 Net gain on the sale and call of debt securities 3,744 206 3,815 346 Swap fees 3,953 4,171 12,179 7,666 Commitment and other loan fees 381 464 1,262 1,251 Other income 481 371 1,712 2,105
Total non-interest income 16,889 14,243 43,202 39,291 Non-interest expense:
Compensation and employee benefits 18,524 18,707 52,539 52,467 Premises and equipment expense 1,488 1,420 4,389 3,866 Professional fees 1,596 1,305 4,175 3,706 FDIC insurance expense 3,030 994 7,760 3,462 General insurance expense 294 258 834 811 State capital shares tax expense (benefit) 366 (720) 1,115 40 Travel and entertainment expense 592 1,339 1,735 3,214 Technology and data services 2,576 2,082 7,294 6,246 Intangible amortization expense 478 502 1,466 1,506 Marketing and advertising 394 518 1,694 1,661 Other operating expenses 2,089 1,368 5,667 5,051
Total non-interest expense 31,427 27,773 88,668 82,030 Income before tax 11,506 19,393 39,986 52,948 Income tax expense 2,177 3,059 7,362 7,359 Net income $ 9,329 $ 16,334 $ 32,624 $ 45,589 Preferred stock dividends 1,962 1,962 5,886 3,791 Net income available to common shareholders $ 7,367 $ 14,372 $ 26,738 $ 41,798
Earnings per common share:Basic $ 0.26 $ 0.52 $ 0.95 $ 1.50 Diluted $ 0.26 $ 0.50 $ 0.93 $ 1.45
See accompanying notes to unaudited condensed consolidated financial statements.
7

Table of Contents
TRISTATE CAPITAL HOLDINGS, INC. AND SUBSIDIARIESUNAUDITED CONDENSED CONSOLIDATED STATEMENTS OF COMPREHENSIVE INCOME
Three Months Ended September 30, Nine Months Ended September 30,(Dollars in thousands) 2020 2019 2020 2019
Net income $ 9,329 $ 16,334 $ 32,624 $ 45,589
Other comprehensive income (loss):
Unrealized holding gains on debt securities, net of tax expense of$856, $272, $651 and $1,466, respectively 3,088 787 2,041 4,477
Reclassification adjustment for gains included in net income on debtsecurities, net of tax expense of $(904), $(32), $(909) and $(62),respectively (2,835) (101) (2,852) (198)
Unrealized holding gains (losses) on derivatives, net of tax expense(benefit) of $5, $(231), $(2,218) and $(787), respectively 27 (736) (7,040) (2,506)
Reclassification adjustment for losses (gains) included in net incomeon derivatives, net of tax benefit (expense) of $248, $(37), $398 and$(305), respectively 780 (120) 1,249 (972)
Other comprehensive income (loss) 1,060 (170) (6,602) 801
Total comprehensive income $ 10,389 $ 16,164 $ 26,022 $ 46,390
See accompanying notes to unaudited condensed consolidated financial statements.
8

Table of Contents
TRISTATE CAPITAL HOLDINGS, INC. AND SUBSIDIARIESUNAUDITED CONDENSED CONSOLIDATED STATEMENTS OF CHANGES IN SHAREHOLDERS’ EQUITY
(Dollars in thousands) Preferred StockCommon
StockAdditional
Paid-in-CapitalRetainedEarnings
Accumulated OtherComprehensive
Income (Loss), Net Treasury StockTotal Shareholders’
EquityBalance, June 30, 2019 $ 116,142 $ 293,837 $ 19,182 $ 191,435 $ (360) $ (31,255) $ 588,981 Net income — — — 16,334 — — 16,334 Other comprehensive loss — — — — (170) — (170)Issuance of preferred stock (net of offeringcosts of $78) (78) — — — — — (78)Preferred stock dividends — — — (1,962) — — (1,962)Exercise of stock options — 351 (150) — — — 201 Purchase of treasury stock — — — — — (1,247) (1,247)Stock-based compensation — — 2,448 — — — 2,448 Balance, September 30, 2019 $ 116,064 $ 294,188 $ 21,480 $ 205,807 $ (530) $ (32,502) $ 604,507
Balance, June 30, 2020 $ 116,079 $ 295,820 $ 25,088 $ 237,795 $ (6,530) $ (35,422) $ 632,830 Net income — — — 9,329 — — 9,329 Other comprehensive income — — — — 1,060 — 1,060 Preferred stock dividends — — — (1,962) — — (1,962)Exercise of stock options — 117 (43) — — — 74 Purchase of treasury stock — — — — — (609) (609)Stock-based compensation — — 2,478 — — — 2,478 Balance, September 30, 2020 $ 116,079 $ 295,937 $ 27,523 $ 245,162 $ (5,470) $ (36,031) $ 643,200
(Dollars in thousands) Preferred StockCommon
StockAdditional
Paid-in-CapitalRetainedEarnings
Accumulated OtherComprehensive
Income (Loss), Net Treasury StockTotal Shareholders’
EquityBalance, December 31, 2018 $ 38,468 $ 293,355 $ 15,364 $ 164,009 $ (1,331) $ (30,511) $ 479,354 Net income — — — 45,589 — — 45,589 Other comprehensive income — — — — 801 — 801 Issuance of preferred stock (net of offeringcosts of $2,904) 77,596 — — — — — 77,596 Preferred stock dividends — — — (3,791) — — (3,791)Exercise of stock options — 833 (375) — — — 458 Purchase of treasury stock — — — — — (1,991) (1,991)Stock-based compensation — — 6,491 — — — 6,491 Balance, September 30, 2019 $ 116,064 $ 294,188 $ 21,480 $ 205,807 $ (530) $ (32,502) $ 604,507
Balance, December 31, 2019 $ 116,079 $ 295,349 $ 23,095 $ 218,449 $ 1,132 $ (32,823) $ 621,281 Net income — — — 32,624 — — 32,624 Other comprehensive loss — — — — (6,602) — (6,602)Preferred stock dividends — — — (5,886) — — (5,886)Exercise of stock options — 588 (303) — — — 285 Purchase of treasury stock — — — — — (3,343) (3,343)Treasury stock reissuance — — — (25) — 135 110 Cancellation of stock options — — (2,484) — — — (2,484)Stock-based compensation — — 7,215 — — — 7,215 Balance, September 30, 2020 $ 116,079 $ 295,937 $ 27,523 $ 245,162 $ (5,470) $ (36,031) $ 643,200
See accompanying notes to unaudited condensed consolidated financial statements.
9
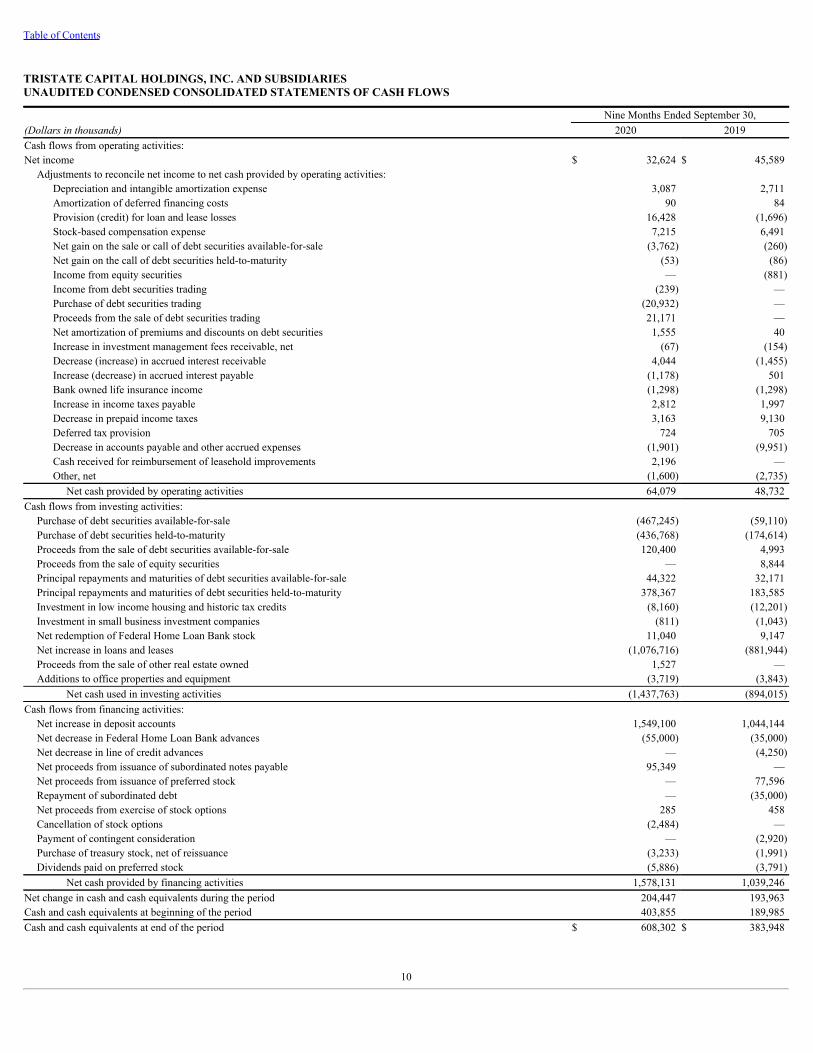
Table of Contents
TRISTATE CAPITAL HOLDINGS, INC. AND SUBSIDIARIESUNAUDITED CONDENSED CONSOLIDATED STATEMENTS OF CASH FLOWS
Nine Months Ended September 30,(Dollars in thousands) 2020 2019Cash flows from operating activities:Net income $ 32,624 $ 45,589
Adjustments to reconcile net income to net cash provided by operating activities:Depreciation and intangible amortization expense 3,087 2,711 Amortization of deferred financing costs 90 84 Provision (credit) for loan and lease losses 16,428 (1,696)Stock-based compensation expense 7,215 6,491 Net gain on the sale or call of debt securities available-for-sale (3,762) (260)Net gain on the call of debt securities held-to-maturity (53) (86)Income from equity securities — (881)Income from debt securities trading (239) — Purchase of debt securities trading (20,932) — Proceeds from the sale of debt securities trading 21,171 — Net amortization of premiums and discounts on debt securities 1,555 40 Increase in investment management fees receivable, net (67) (154)Decrease (increase) in accrued interest receivable 4,044 (1,455)Increase (decrease) in accrued interest payable (1,178) 501 Bank owned life insurance income (1,298) (1,298)Increase in income taxes payable 2,812 1,997 Decrease in prepaid income taxes 3,163 9,130 Deferred tax provision 724 705 Decrease in accounts payable and other accrued expenses (1,901) (9,951)Cash received for reimbursement of leasehold improvements 2,196 — Other, net (1,600) (2,735)
Net cash provided by operating activities 64,079 48,732 Cash flows from investing activities:
Purchase of debt securities available-for-sale (467,245) (59,110)Purchase of debt securities held-to-maturity (436,768) (174,614)Proceeds from the sale of debt securities available-for-sale 120,400 4,993 Proceeds from the sale of equity securities — 8,844 Principal repayments and maturities of debt securities available-for-sale 44,322 32,171 Principal repayments and maturities of debt securities held-to-maturity 378,367 183,585 Investment in low income housing and historic tax credits (8,160) (12,201)Investment in small business investment companies (811) (1,043)Net redemption of Federal Home Loan Bank stock 11,040 9,147 Net increase in loans and leases (1,076,716) (881,944)Proceeds from the sale of other real estate owned 1,527 — Additions to office properties and equipment (3,719) (3,843)
Net cash used in investing activities (1,437,763) (894,015)Cash flows from financing activities:
Net increase in deposit accounts 1,549,100 1,044,144 Net decrease in Federal Home Loan Bank advances (55,000) (35,000)Net decrease in line of credit advances — (4,250)Net proceeds from issuance of subordinated notes payable 95,349 — Net proceeds from issuance of preferred stock — 77,596 Repayment of subordinated debt — (35,000)Net proceeds from exercise of stock options 285 458 Cancellation of stock options (2,484) — Payment of contingent consideration — (2,920)Purchase of treasury stock, net of reissuance (3,233) (1,991)Dividends paid on preferred stock (5,886) (3,791)
Net cash provided by financing activities 1,578,131 1,039,246 Net change in cash and cash equivalents during the period 204,447 193,963 Cash and cash equivalents at beginning of the period 403,855 189,985 Cash and cash equivalents at end of the period $ 608,302 $ 383,948
10
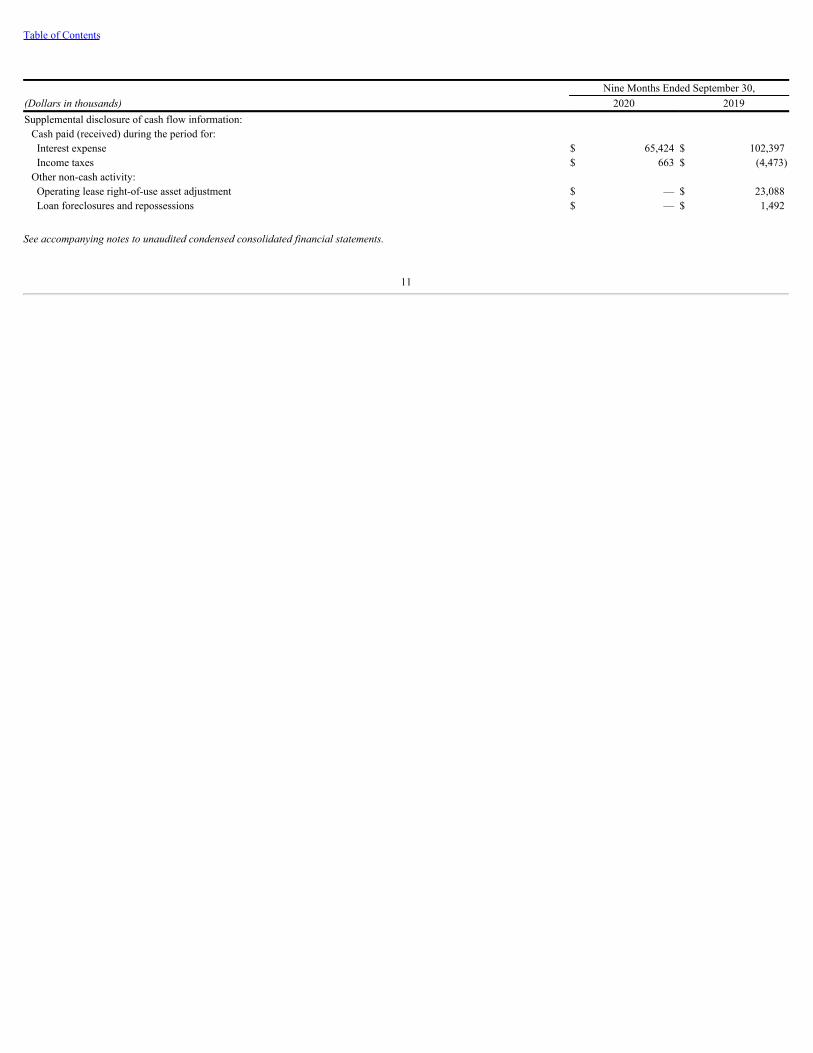
Table of Contents
Nine Months Ended September 30,(Dollars in thousands) 2020 2019Supplemental disclosure of cash flow information:
Cash paid (received) during the period for:Interest expense $ 65,424 $ 102,397 Income taxes $ 663 $ (4,473)
Other non-cash activity:Operating lease right-of-use asset adjustment $ — $ 23,088 Loan foreclosures and repossessions $ — $ 1,492
See accompanying notes to unaudited condensed consolidated financial statements.
11

Table of Contents
TRISTATE CAPITAL HOLDINGS, INC. AND SUBSIDIARIESNOTES TO UNAUDITED CONDENSED CONSOLIDATED FINANCIAL STATEMENTS
[1] BASIS OF INFORMATION AND SUMMARY OF SIGNIFICANT ACCOUNTING POLICIES
NATURE OF OPERATIONTriState Capital Holdings, Inc. (“we,” “us,” “our,” the “holding company,” the “parent company,” or the “Company”) is a registered bank holding companypursuant to the Bank Holding Company Act of 1956, as amended. The Company has three wholly owned subsidiaries: TriState Capital Bank, a Pennsylvania-chartered state bank (the “Bank”); Chartwell Investment Partners, LLC, a registered investment adviser (“Chartwell”); and Chartwell TSC Securities Corp., aregistered broker/dealer (“CTSC Securities”).
The Bank was established to serve the commercial banking needs of regionally located middle-market businesses and financial services providers and theprivate banking needs of high-net-worth individuals nation-wide. The Bank has two wholly owned subsidiaries: TSC Equipment Finance LLC (“TSCEquipment Finance”), established to hold and manage loans and leases of our equipment finance business, and Meadowood Asset Management, LLC(“Meadowood”), established to hold and manage other real estate owned by the bank and/or foreclosed properties for the Bank.
Chartwell provides investment management services primarily to institutional investors, mutual funds and individual investors. CTSC Securities supportsmarketing efforts for the proprietary investment products provided by Chartwell, including shares of mutual funds advised and/or administered by Chartwell.
The Company and the Bank are subject to regulatory examination by the Federal Deposit Insurance Corporation (“FDIC”), the Pennsylvania Department ofBanking and Securities and the Board of Governors of the Federal Reserve System and its Reserve Banks, which we refer to as the Federal Reserve. Chartwellis a registered investment adviser regulated by the Securities and Exchange Commission (“SEC”). CTSC Securities is regulated by the SEC and the FinancialIndustry Regulatory Authority, Inc. (“FINRA”).
The Bank conducts business through its main office located in Pittsburgh, Pennsylvania, as well as its four additional representative offices in Cleveland,Ohio; Philadelphia, Pennsylvania; Edison, New Jersey; and New York, New York. Chartwell conducts business through its office located in Berwyn,Pennsylvania, and CTSC Securities conducts business through its office located in Pittsburgh, Pennsylvania.
USE OF ESTIMATESThe preparation of financial statements in conformity with generally accepted accounting principles (“GAAP”) in the United States of America requiresmanagement to make estimates and assumptions that affect the reported amounts of certain assets and liabilities, disclosure of contingent assets and liabilitiesas of the date of the financial statements, and the reported amounts of related revenues and expenses during the reporting period. Although our currentestimates contemplate current conditions and how we expect them to change in the future, it is reasonably possible that actual conditions could be differentthan those anticipated in the estimates, which could materially affect the financial results of our operations and financial condition.
Material estimates that are particularly susceptible to significant changes relate to the determination of the allowance for loan and lease losses, valuation ofgoodwill and other intangible assets and their evaluation for impairment, and deferred income taxes and their related recoverability, each of which is discussedlater in this section.
CONSOLIDATIONOur consolidated financial statements include the accounts of the Company and its wholly owned subsidiaries, the Bank, Chartwell and CTSC Securities, afterelimination of inter-company accounts and transactions. The accounts of the Bank, in turn, include its wholly owned subsidiaries, TSC Equipment Finance andMeadowood, after elimination of inter-company accounts and transactions. The unaudited condensed consolidated financial statements of the Companypresented herein have been prepared pursuant to SEC rules for Quarterly Reports on Form 10-Q and do not include all of the information and note disclosuresrequired by GAAP for a full year presentation. In the opinion of management, all adjustments (consisting of normal, recurring adjustments) and disclosuresconsidered necessary for the fair presentation of the accompanying unaudited condensed consolidated financial statements have been included. Interim resultsare not necessarily reflective of the results of the entire year. The accompanying unaudited condensed consolidated financial statements should be read inconjunction with the audited consolidated financial statements of the Company and the related notes for the fiscal year ended December 31, 2019, included inthe Company’s Annual Report on Form 10-K filed with the SEC on February 24, 2020.
12

Table of Contents
CASH AND CASH EQUIVALENTSFor purposes of reporting cash flows, the Company has defined cash and cash equivalents as cash, interest-earning deposits with other institutions, federalfunds sold and short-term investments that have an original maturity of 90 days or less. Under agreements with certain of its derivative counterparties, theCompany is required to maintain minimum cash collateral posting thresholds with such counterparties. The cash subject to these agreements is consideredrestricted for these purposes.
BUSINESS COMBINATIONSThe Company accounts for business combinations using the acquisition method of accounting. Under this method of accounting, the acquired company’s netassets are recorded at fair value as of the date of acquisition, and the results of operations of the acquired company are combined with our results from thatdate forward. Acquisition costs are expensed when incurred. The difference between the purchase price, which includes an initial measurement of anycontingent earn out, and the fair value of the net assets acquired (including identified intangibles) is recorded as goodwill in the consolidated statements offinancial condition. A change in the initial estimate of any contingent earn out amount is recorded to non-interest expense in the consolidated statements ofincome.
INVESTMENT SECURITIESThe Company’s investments are classified as either: (1) held-to-maturity, which are debt securities that the Company intends to hold until maturity and arereported at amortized cost; (2) trading, which are debt securities bought and held principally for the purpose of selling them in the near term and reported atfair value, with unrealized gains and losses included in non-interest income; (3) available-for-sale, which are debt securities not classified as either held-to-maturity or trading securities and reported at fair value, with unrealized gains and losses reported as a component of accumulated other comprehensive income(loss), on an after-tax basis; or (4) equity securities, which are reported at fair value, with unrealized gains and losses included in non-interest income.
The cost of securities sold is determined on a specific identification basis. Amortization of premiums and accretion of discounts are recorded to interestincome on investments over the estimated life of the security utilizing the level yield method. We evaluate impaired investment securities quarterly todetermine if impairments are temporary or other-than-temporary. For impaired debt and equity securities, management first determines whether it intends tosell or if it is more likely than not that it will be required to sell the impaired securities. This determination considers current and forecasted liquidityrequirements, regulatory and capital requirements, and securities portfolio management. If the Company intends to sell a security with a fair value belowamortized cost or if it is more likely than not that it will be required to sell such a security before recovery, an other-than-temporary impairment (“OTTI”)charge is recorded through current period earnings for the full decline in fair value below amortized cost. For debt securities that the Company does not intendto sell or it is more likely than not that it will not be required to sell before recovery, an OTTI charge is recorded through current period earnings for theamount of the valuation decline below amortized cost that is attributable to credit losses. The remaining difference between the security’s fair value andamortized cost (that is, the decline in fair value not attributable to credit losses) is recognized in other comprehensive income (loss), in the consolidatedstatements of comprehensive income and the shareholders’ equity section of the consolidated statements of financial condition, on an after-tax basis.
FEDERAL HOME LOAN BANK STOCKThe Company is a member of the Federal Home Loan Bank (“FHLB”) of Pittsburgh. Member institutions are required to invest in FHLB stock. The stock iscarried at cost, which approximates its liquidation value, and it is evaluated for impairment based on the ultimate recoverability of the par value. The followingmatters are considered by management when evaluating the FHLB stock for impairment: the ability of the FHLB to make payments required by law orregulation and the level of such payments in relation to the operating performance of the FHLB; the impact of legislative and regulatory changes on theinstitution and its customer base; and the Company’s intent and ability to hold its FHLB stock for the foreseeable future. Management believes the Company’sholdings in the FHLB stock were recoverable at par value as of September 30, 2020 and December 31, 2019. Cash and stock dividends are reported as interestincome on investments in the consolidated statements of income.
LOANS AND LEASESLoans and leases held-for-investment are stated at unpaid principal balances, net of deferred loan fees and costs. Loans held-for-sale are stated at the lower ofcost or fair value. Interest income on loans is accrued at the contractual rate on the principal amount outstanding. Deferred loan fees and costs are amortized tointerest income over the estimated life of the loan, taking into consideration scheduled payments and prepayments.
The Company considers a loan to be a troubled debt restructuring (“TDR”) when there is a concession made to a financially troubled borrower withoutadequate consideration provided to the Company. Once a loan is deemed to be a TDR, the Company considers whether the loan should be placed on non-accrual status. In assessing accrual status, the Company considers the likelihood that repayment and performance according to the original contractual termswill be achieved, as well as the borrower’s historical payment performance. A loan is designated and reported as a TDR until such loan is either paid off orsold, unless the
13

Table of Contents
restructuring agreement specifies an interest rate equal to or greater than the rate that would be accepted at the time of the restructuring for a new loan withcomparable risk and it is fully expected that the remaining principal and interest will be collected according to the restructured agreement.
The recognition of interest income on a loan is discontinued when, in management’s opinion, it is probable the borrower is unable to meet payments as theybecome due or when the loan becomes 90 days past due, whichever occurs first, at which time the loan is placed on non-accrual status. All accrued and unpaidinterest on such loans is then reversed. The interest ultimately collected is applied to reduce principal if there is doubt about the collectability of principal. If aborrower brings a loan current for which accrued interest has been reversed, then the recognition of interest income on the loan is resumed once the loan hasbeen current for a period of six consecutive months or greater.
The Company is a party to financial instruments with off-balance sheet risk, such as commitments to extend credit, in the normal course of business to meetthe financing needs of its customers. Commitments to extend credit are agreements to lend to a customer as long as there is no violation of any conditionestablished in the lending agreement with such customer. Commitments generally have fixed expiration dates or other termination clauses (i.e., loans due ondemand) and may require payment of a fee. Since some of the commitments are expected to expire without being drawn upon, the unfunded commitmentamount does not necessarily represent future cash requirements. The Company evaluates each customer’s credit-worthiness on a case-by-case basis using thesame credit policies in making commitments and conditional obligations as it does for on-balance sheet instruments. The amount of collateral obtained, ifdeemed necessary by the Company upon extension of a commitment, is based on management’s credit evaluation of the borrower.
OTHER REAL ESTATE OWNEDReal estate owned, other than bank premises, is recorded at fair value less estimated selling costs. Fair value is determined based on an independent appraisal.Expenses related to holding the property are charged against earnings when incurred. Depreciation is not recorded on other real estate owned (“OREO”)properties.
ALLOWANCE FOR LOAN AND LEASE LOSSESThe allowance for loan and lease losses is established through provisions for loan and lease losses that are recorded in the consolidated statements of income.Loans and leases are charged off against the allowance for loan and lease losses when management believes that the principal is uncollectible. If, at a latertime, amounts are recovered with respect to loans and leases previously charged off, the recovered amount is credited to the allowance for loan and leaselosses.
In management’s judgment, the allowance was appropriate to cover probable losses inherent in the loan and lease portfolio as of September 30, 2020 andDecember 31, 2019. Management’s judgment takes into consideration general economic conditions, diversification and seasoning of the loan portfolio,historic loss experience, identified credit problems, delinquency levels and adequacy of collateral. Although management believes it has used the bestinformation available to it in making such determinations, and that the present allowance for loan and lease losses is adequate, future adjustments to theallowance may be necessary, and net income may be adversely affected if circumstances differ substantially from the assumptions used in determining thelevel of the allowance. In addition, as an integral part of their periodic examination, certain regulatory agencies review the adequacy of the Bank’s allowancefor loan and lease losses and may direct the Bank to make additions to the allowance based on their judgments about information available to them at the timeof their examination.
The two components of the allowance for loan and lease losses represent estimates of general reserves based upon Accounting Standards Codification(“ASC”) Topic 450, Contingencies; and specific reserves based upon ASC Topic 310, Receivables. ASC Topic 450 applies to homogeneous loan pools suchas commercial loans, consumer lines of credit and residential mortgages that are not individually evaluated for impairment. ASC Topic 310 is applied tocommercial and consumer loans that are individually evaluated for impairment.
In management’s opinion, a loan or lease is impaired, based upon current information and events, when it is probable that the loan or lease will not be repaidaccording to its original contractual terms, including both principal and interest, or if a loan is designated as a TDR. Management performs individualassessments of impaired loans and leases to determine the existence of loss exposure based upon a discounted cash flows method or where a loan is collateraldependent, based upon the fair value of the collateral less estimated selling costs. During the nine months ended September 30, 2020, certain loanmodifications were done in accordance with Section 4013 of the CARES Act and the Interagency Statement on Loan Modifications and Reporting forFinancial Institutions Working with Customers Affected by the Coronavirus. Accordingly, these loans and leases were not categorized as TDRs.
In estimating probable loan and lease loss of general reserves, management considers numerous factors, including historical charge-offs and subsequentrecoveries. Management also considers qualitative factors that influence our credit quality, including, but not limited to, delinquency and non-performing loantrends, changes in loan underwriting guidelines and credit policies, and
14

Table of Contents
the results of internal loan reviews. Finally, management considers the impact of changes in current local and regional economic conditions in the markets thatwe serve.
Management bases the computation of the allowance for loan and lease losses of general reserves on two factors: the primary factor and the secondary factor.The primary factor is based on the inherent risk identified by management within each of the Company’s three loan portfolios based on the historical lossexperience of each loan portfolio in addition to the loss emergence period. Management has developed a methodology that is applied to each of the threeprimary loan portfolios: private banking loans, commercial and industrial (“C&I”) loans and leases, and commercial real estate (“CRE”) loans. As the loanloss history, mix and risk ratings of each loan portfolio change, the primary factor adjusts accordingly. The allowance for loan and lease losses related to theprimary factor is based on our estimates as to probable losses for each loan portfolio. The secondary factor is intended to capture risks related to events andcircumstances that management believes have an impact on the future performance of the loan portfolio. Although this factor is more subjective in nature, themethodology focuses on internal and external trends in pre-specified categories, or risk factors, and applies a quantitative percentage that drives the secondaryfactor. Nine risk factors have been identified and each risk factor is assigned a reserve level based on management’s judgment as to the probable impact ofeach risk factor on each loan portfolio and is monitored on a quarterly basis. As the trend in any risk factor changes, a corresponding change occurs in thereserve associated with each respective risk factor, such that the secondary factor remains current to changes in each loan portfolio.
The Company also maintains a reserve for losses on unfunded commitments. This reserve is reflected as a component of other liabilities and, in management’sjudgment, is sufficient to cover probable losses inherent in the loan commitments. Management tracks the level and trends in unused commitments and takesinto consideration the same factors as those considered for purposes of the allowance for loan and lease losses on outstanding loans.
INVESTMENT MANAGEMENT FEESThe Company recognizes investment management fee revenue when advisory services are performed. Fees are based on assets under management and arecalculated pursuant to individual client contracts. Investment management fees are generally received on a quarterly basis. Certain incremental costs incurredto acquire some of our investment management contracts are deferred and amortized to non-interest expense over the estimated life of the contract.
Investment management fees receivable represent amounts due for contractual investment management services provided to the Company’s clients, primarilyinstitutional investors, mutual funds and individual investors. Management performs credit evaluations of its customers’ financial condition when it is deemedto be necessary and does not require collateral. The Company provides an allowance for uncollectible accounts based on specifically identified receivables.Bad debt expense is recorded to other non-interest expense on the consolidated statements of income and the allowance for uncollectible accounts is recordedto investment management fees receivable, net on the consolidated statements of financial position. Investment management fees receivable are considereddelinquent when payment is not received within contractual terms and are charged off against the allowance for uncollectible accounts when managementdetermines that recovery is unlikely and the Company ceases its collection efforts. There was no bad debt expense recorded for the nine months endedSeptember 30, 2020, and 2019 and no allowance for uncollectible accounts as of September 30, 2020 and December 31, 2019.
GOODWILL AND OTHER INTANGIBLE ASSETSGoodwill represents the excess of the cost of an acquisition over the fair value of the net assets acquired. Goodwill is not amortized and is subject to at leastannual assessments for impairment by applying a fair value based test. The Company reviews goodwill annually and again at any quarter-end if a materialevent occurs during the quarter that may affect goodwill. If goodwill testing is required, an assessment of qualitative factors can be completed beforeperforming a goodwill impairment test. If an assessment of qualitative factors determines it is more likely than not that the fair value of a reporting unitexceeds its carrying amount, then a goodwill impairment test is not required. Goodwill is evaluated for potential impairment by determining if the fair valuehas fallen below carrying value.
Other intangible assets represent purchased assets that may lack physical substance but can be distinguished from goodwill because of contractual or otherlegal rights. The Company has determined that certain of its acquired mutual fund client relationships meet the criteria to be considered indefinite-lived assetsbecause the Company expects both the renewal of these contracts and the cash flows generated by these assets to continue indefinitely. Accordingly, theCompany does not amortize these intangible assets, but instead reviews these assets annually or more frequently whenever events or circumstances occurindicating that the recorded indefinite-lived assets may be impaired. Each reporting period, the Company assesses whether events or circumstances haveoccurred which indicate that the indefinite life criteria are no longer met. If the indefinite life criteria are no longer met, the Company assesses whether thecarrying value of these assets exceeds its fair value. If the carrying value exceeds the fair value of the asset, an impairment loss is recorded in an amount equalto any such excess and the assets are reclassified to finite-lived. Other intangible assets that the Company has determined to have finite lives, such as its tradenames, client lists and non-compete agreements are amortized over their estimated useful lives. These finite-lived intangible assets are
15

Table of Contents
amortized on a straight-line basis over their estimated useful lives, which range from four to 25 years. Finite-lived intangibles are evaluated for impairment onan annual basis or more frequently whenever events or circumstances occur indicating that the carrying amount may not be recoverable.
OFFICE PROPERTIES AND EQUIPMENTOffice properties and equipment are stated at cost less accumulated depreciation. Office properties include furniture, fixtures and leasehold improvements.Equipment includes computer equipment and internal use software. Depreciation is computed utilizing the straight-line method over the estimated useful livesof the related assets, except for leasehold improvements, which are amortized over the terms of the respective leases or the estimated useful lives of theimprovements, whichever is shorter. Estimated useful lives are dependent upon the nature and condition of the asset and range from three to 10 years. Repairsand maintenance are charged to expense as incurred, while improvements that extend the useful life are capitalized and depreciated to non-interest expenseover the estimated remaining life of the asset.
OPERATING LEASESThe Company is a lessee in noncancellable operating leases, primarily for its office spaces and other office equipment. The Company accounts for leases inaccordance with ASC Topic 842, “Leases,” and records operating leases as a right-of-use asset and an offsetting lease liability in the consolidated statementsof financial condition at the present value of the unpaid lease payments. The Company generally uses its incremental borrowing rate as the discount rate foroperating leases. The right-of-use asset is initially measured at cost, which comprises the initial amount of the lease liability adjusted for lease payments madeat or before the lease commencement date, plus any initial direct costs incurred less any lease incentives received. For operating leases, the right-of-use asset issubsequently measured throughout the lease term at the carrying amount of the lease liability, plus initial direct costs, plus (minus) any prepaid (accrued) leasepayments, less the unamortized balance of lease incentives received. Lease expense for lease payments is recognized on a straight-line basis over the leaseterm.
BANK OWNED LIFE INSURANCEBank owned life insurance (“BOLI”) policies on certain officers and employees are recorded at net cash surrender value on the consolidated statements offinancial condition. Upon termination of a BOLI policy, the Company receives the cash surrender value. BOLI benefits are payable to the Company upon thedeath of the insured. Changes in net cash surrender value are recognized as non-interest income in the consolidated statements of income.
DEPOSITSDeposits are stated at principal outstanding. Interest on deposits is accrued and charged to interest expense daily and is paid or credited in accordance with theterms of the respective accounts.
BORROWINGSThe Company records FHLB advances, line of credit borrowings and subordinated notes payable at their principal amount net of debt issuance costs. Interestexpense is recognized based on the coupon rate of the obligations. Costs associated with the acquisition of subordinated notes payable are amortized to interestexpense over the expected term of the borrowing.
INCOME TAXESThe Company utilizes the asset and liability method of accounting for income taxes. Under this method, deferred tax assets and liabilities are recognized forthe tax effects of differences between the financial statement and tax basis of assets and liabilities. Deferred tax assets and liabilities are measured using theenacted tax rates expected to apply to taxable income in the years in which those temporary differences are expected to be recovered or settled. The effect ondeferred tax assets and liabilities with regard to a change in tax rates is recognized in income in the period that includes the enactment date. Managementassesses all available evidence to determine the amount of deferred tax assets that are more likely than not to be realized. The available evidence used inconnection with the assessments includes taxable income in prior periods, projected taxable income, potential tax planning strategies and projected reversals ofdeferred tax items. These assessments involve a degree of subjectivity and may undergo significant change. Changes to the evidence used in the assessmentscould have a material adverse effect on the Company’s results of operations in the period in which they occur. The Company considers uncertain tax positionsthat it has taken or expects to take on a tax return. Any interest and penalties related to unrecognized tax benefits would be recognized in income tax expensein the consolidated statements of income.
EARNINGS PER COMMON SHAREEarnings per common share (“EPS”) is computed using the two-class method, where net income is reduced by dividends declared on our preferred stock toderive net income available to common shareholders. Basic EPS is computed by dividing net income available to common shareholders by the weightedaverage number of common shares outstanding for the period, excluding non-vested restricted stock. Diluted EPS reflects the potential dilution upon theexercise of stock options and the vesting of restricted stock awards granted utilizing the treasury stock method.
16

Table of Contents
STOCK-BASED COMPENSATIONThe Company accounts for its stock-based compensation awards based on estimated fair values of stock-based awards made to employees and directors.Compensation cost for all stock-based payments is based on the estimated grant-date fair value. The value of the portion of the award that is ultimatelyexpected to vest is included in compensation and employee benefits expense in the consolidated statements of income and recorded as a component ofadditional paid-in capital. Compensation expense for all awards is recognized on a straight-line basis over the requisite service period for the entire grant.
DERIVATIVES AND HEDGING ACTIVITIESAll derivatives are evaluated at inception as to whether or not they are hedging or non-hedging activities. All derivatives are recognized as either assets orliabilities on the consolidated statements of financial condition and measured at fair value. For derivatives designated as fair value hedges, changes in the fairvalue of the derivative and the hedged item related to the hedged risk are recognized in earnings. Any hedge ineffectiveness would be recognized in theincome statement line item pertaining to the hedged item. For derivatives designated as cash flow hedges, changes in fair value of the effective portion of thecash flow hedges are reported in accumulated other comprehensive income (loss). When the cash flows associated with the hedged item are realized, the gainor loss included in accumulated other comprehensive income (loss) is recognized in the consolidated statements of income. The Company also has interest ratederivative positions that are not designated as hedging instruments. Changes in the fair value of derivatives not designated in hedging relationships arerecorded directly in earnings. The Company is required to have minimum collateral posting thresholds with certain of its derivative counterparties which isconsidered restricted cash.
The Company executes interest rate derivatives with its commercial banking customers to facilitate their respective risk management strategies which generateswap fee income. Those derivatives are simultaneously and economically hedged by offsetting derivatives that the Company executes with a third party, suchthat the Company eliminates its interest rate exposure resulting from such transactions and are not designated as hedging instruments. Swap fees are based onthe notional amount and weighted maturity of each individual transaction and are collected and recorded to non-interest income in the consolidated statementsof income when the transaction is executed.
FAIR VALUE MEASUREMENTFair value is defined as the exchange price that would be received to sell an asset or paid to transfer a liability in a principal or most advantageous market forthe asset or liability in an orderly transaction between market participants as of the measurement date, using assumptions market participants would use whenpricing such an asset or liability. An orderly transaction assumes exposure to the market for a customary period for marketing activities prior to themeasurement date and not a forced liquidation or distressed sale. Fair value measurement and disclosure guidance provides a three-level hierarchy thatprioritizes the inputs of valuation techniques used to measure fair value into three broad categories:
• Level 1 – Unadjusted quoted prices in active markets for identical assets or liabilities.
• Level 2 – Observable inputs such as quoted prices for similar assets and liabilities in active markets, quoted prices for similar assets and liabilities inmarkets that are not active, or other inputs that are observable or can be corroborated by observable market data.
• Level 3 – Unobservable inputs that are supported by little or no market activity and that are significant to the fair value of the assets or liabilities. Thisincludes certain pricing models, discounted cash flow methodologies, and similar techniques that use significant unobservable inputs.
Fair value must be recorded for certain assets and liabilities every reporting period on a recurring basis or, under certain circumstances, on a non-recurringbasis.
ACCUMULATED OTHER COMPREHENSIVE INCOME (LOSS)Unrealized holding gains and the non-credit component of unrealized losses on the Company’s debt securities available-for-sale are included in accumulatedother comprehensive income (loss), net of applicable income taxes. Also included in accumulated other comprehensive income (loss) is the remainingunamortized balance of the unrealized holding gains (non-credit losses) net of applicable income taxes, that existed on the transfer date for debt securitiesreclassified into the held-to-maturity category from the available-for-sale category.
Unrealized holding gains (losses) on the effective portion of the Company’s cash flow hedge derivatives are included in accumulated other comprehensiveincome (loss), net of applicable income taxes, which will be reclassified to interest expense as interest payments are made on the Company’s debt.
Income tax effects in accumulated other comprehensive income (loss) are released as investments are sold or matured and as liabilities are extinguished.
17

Table of Contents
TREASURY STOCKThe repurchase of the Company’s common stock is recorded at cost. At the time of reissuance, the treasury stock account is reduced using the average costmethod. Gains and losses on the reissuance of common stock are recorded in additional paid-in capital, to the extent additional paid-in capital from anyprevious net gains on treasury share transactions exists. Any net deficiency is charged to retained earnings.
RECLASSIFICATIONCertain items previously reported have been reclassified to conform with the current year’s reporting presentation and are considered immaterial.
During the nine months ended September 30, 2020, the Company made changes to certain Non-Interest Expense line items appearing on the UnauditedCondensed Consolidated Statement of Income to better align with and provide additional clarity on how management views the business. All prior periodshave been adjusted to conform the changes and provide comparability to the new presentation.
Marketing and Advertising, which was previously a component of Other Operating Expenses, is now presented separately.
Technology and Data Services is also presented separately and includes data processing expense, data and information services and certain software costs.These costs were previously included in Premises and Equipment.
Telephone expense, which was previously reported as Other Operating Expense, is now presented in Premises and Equipment Expense. Finally Premises andOccupancy Costs was renamed to Premise and Equipment Expense.
18
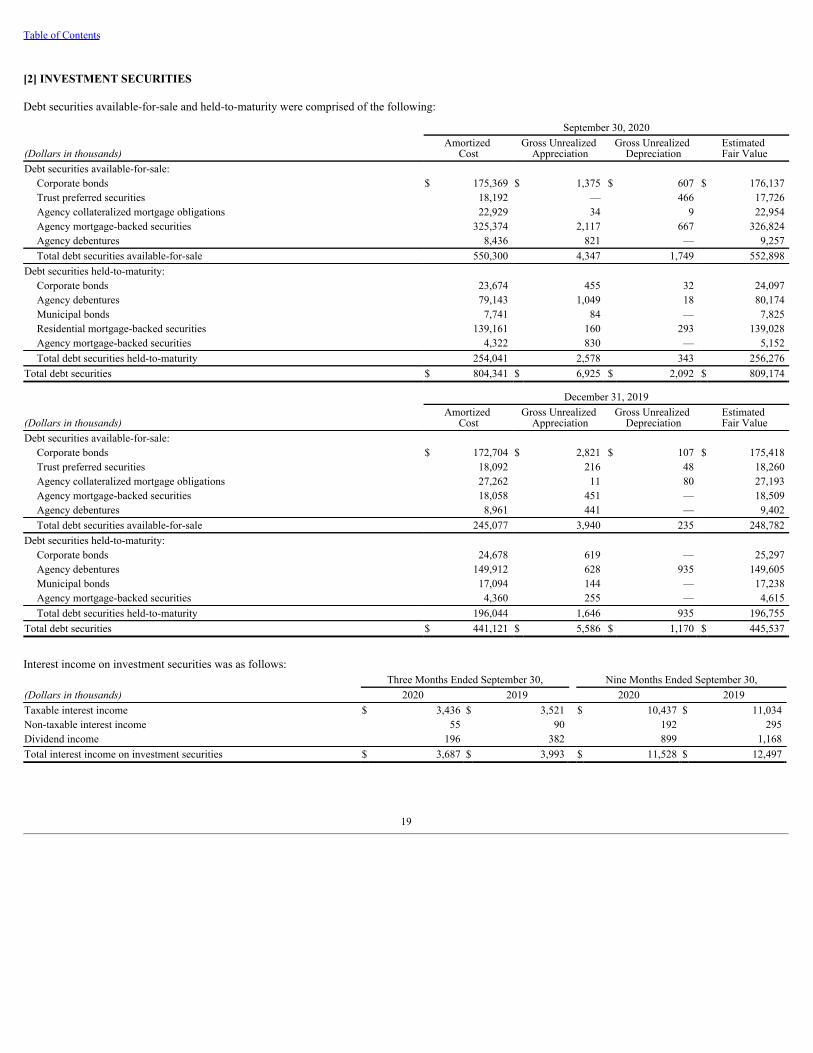
Table of Contents
[2] INVESTMENT SECURITIES
Debt securities available-for-sale and held-to-maturity were comprised of the following:
September 30, 2020
(Dollars in thousands)Amortized
CostGross Unrealized
AppreciationGross Unrealized
DepreciationEstimated Fair Value
Debt securities available-for-sale:Corporate bonds $ 175,369 $ 1,375 $ 607 $ 176,137 Trust preferred securities 18,192 — 466 17,726 Agency collateralized mortgage obligations 22,929 34 9 22,954 Agency mortgage-backed securities 325,374 2,117 667 326,824 Agency debentures 8,436 821 — 9,257 Total debt securities available-for-sale 550,300 4,347 1,749 552,898
Debt securities held-to-maturity:Corporate bonds 23,674 455 32 24,097 Agency debentures 79,143 1,049 18 80,174 Municipal bonds 7,741 84 — 7,825 Residential mortgage-backed securities 139,161 160 293 139,028 Agency mortgage-backed securities 4,322 830 — 5,152 Total debt securities held-to-maturity 254,041 2,578 343 256,276
Total debt securities $ 804,341 $ 6,925 $ 2,092 $ 809,174
December 31, 2019
(Dollars in thousands)Amortized
CostGross Unrealized
AppreciationGross Unrealized
DepreciationEstimated Fair Value
Debt securities available-for-sale:Corporate bonds $ 172,704 $ 2,821 $ 107 $ 175,418 Trust preferred securities 18,092 216 48 18,260 Agency collateralized mortgage obligations 27,262 11 80 27,193 Agency mortgage-backed securities 18,058 451 — 18,509 Agency debentures 8,961 441 — 9,402 Total debt securities available-for-sale 245,077 3,940 235 248,782
Debt securities held-to-maturity:Corporate bonds 24,678 619 — 25,297 Agency debentures 149,912 628 935 149,605 Municipal bonds 17,094 144 — 17,238 Agency mortgage-backed securities 4,360 255 — 4,615 Total debt securities held-to-maturity 196,044 1,646 935 196,755
Total debt securities $ 441,121 $ 5,586 $ 1,170 $ 445,537
Interest income on investment securities was as follows:Three Months Ended September 30, Nine Months Ended September 30,
(Dollars in thousands) 2020 2019 2020 2019Taxable interest income $ 3,436 $ 3,521 $ 10,437 $ 11,034 Non-taxable interest income 55 90 192 295 Dividend income 196 382 899 1,168 Total interest income on investment securities $ 3,687 $ 3,993 $ 11,528 $ 12,497
19

Table of Contents
As of September 30, 2020, the contractual maturities of the debt securities were:
September 30, 2020Available-for-Sale Held-to-Maturity
(Dollars in thousands)Amortized
CostEstimated Fair Value
Amortized Cost
Estimated Fair Value
Due in less than one year $ 31,732 $ 31,915 $ 2,142 $ 2,164 Due from one to five years 71,226 72,002 14,114 14,433 Due from five to ten years 100,560 100,069 86,052 86,322 Due after ten years 346,782 348,912 151,733 153,357 Total debt securities $ 550,300 $ 552,898 $ 254,041 $ 256,276
The $348.9 million fair value of debt securities available-for-sale with a contractual maturity due after 10 years as of September 30, 2020, included $32.7 million,or 9.4%, that are floating-rate securities. The $86.1 million amortized cost of debt securities held-to-maturity with a contractual maturity due from five to 10 yearsas of September 30, 2020, included $14.3 million that have call provisions within the next five years that would either mature, if called, or become floating-ratesecurities after the call date.
Prepayments may shorten the contractual lives of the collateralized mortgage obligations, mortgage-backed securities and collateralized loan obligations.
Proceeds from the sale and call of debt securities available-for-sale and held-to-maturity and related gross realized gains and losses were:
Available-for-Sale Held-to-Maturity Available-for-Sale Held-to-MaturityThree Months Ended September
30,Three Months Ended September
30,Nine Months Ended September
30,Nine Months Ended September
30,(Dollars in thousands) 2020 2019 2020 2019 2020 2019 2020 2019Proceeds from sales $ 64,363 $ — $ — $ — $ 120,400 $ 4,993 $ — $ — Proceeds from calls — 9,435 118,745 63,529 3,580 13,517 366,503 180,824 Total proceeds $ 64,363 $ 9,435 $ 118,745 $ 63,529 $ 123,980 $ 18,510 $ 366,503 $ 180,824
Gross realized gains $ 3,740 $ 134 $ 4 $ 72 $ 3,762 $ 260 $ 53 $ 86 Gross realized losses — — — — — — — — Net realized gains $ 3,740 $ 134 $ 4 $ 72 $ 3,762 $ 260 $ 53 $ 86
Debt securities available-for-sale of $2.4 million as of September 30, 2020, were held in safekeeping at the FHLB and were included in the calculation ofborrowing capacity. Additionally, there were $28.8 million of debt securities held-to-maturity that were pledged as collateral for certain deposit relationships.
20

Table of Contents
The following tables show the fair value and gross unrealized losses on temporarily impaired debt securities available-for-sale and held-to-maturity, by investmentcategory and length of time that the individual securities have been in a continuous unrealized loss position as of September 30, 2020 and December 31, 2019,respectively:
September 30, 2020Less than 12 Months 12 Months or More Total
(Dollars in thousands) Fair valueUnrealized
losses Fair valueUnrealized
losses Fair valueUnrealized
lossesDebt securities available-for-sale:
Corporate bonds $ 29,771 $ 172 $ 19,565 $ 435 $ 49,336 $ 607 Trust preferred securities 17,726 466 — — 17,726 466 Agency collateralized mortgage obligations — — 10,279 9 10,279 9 Agency mortgage-backed securities 155,074 667 — — 155,074 667 Total debt securities available-for-sale 202,571 1,305 29,844 444 232,415 1,749
Debt securities held-to-maturity:Corporate bonds 5,968 32 — — 5,968 32 Agency debentures 20,032 18 — — 20,032 18 Residential mortgage-backed securities 75,405 293 — — 75,405 293 Agency mortgage-backed securities — — — — — — Total debt securities held-to-maturity 101,405 343 — — 101,405 343
Total temporarily impaired debt securities $ 303,976 $ 1,648 $ 29,844 $ 444 $ 333,820 $ 2,092
The number of investment positions with unrealized losses totaled 29 for available-for-sale securities and 10 for held-to-maturity securities.
December 31, 2019Less than 12 Months 12 Months or More Total
(Dollars in thousands) Fair valueUnrealized
losses Fair valueUnrealized
losses Fair valueUnrealized
lossesDebt securities available-for-sale:
Corporate bonds $ 4,942 $ 58 $ 19,951 $ 49 $ 24,893 $ 107 Trust preferred securities — — 4,417 48 4,417 48 Agency collateralized mortgage obligations 22,117 66 2,544 14 24,661 80 Total debt securities available-for-sale 27,059 124 26,912 111 53,971 235
Debt securities held-to-maturity:Agency debentures 87,879 935 — — 87,879 935 Total debt securities held-to-maturity 87,879 935 — — 87,879 935
Total temporarily impaired debt securities $ 114,938 $ 1,059 $ 26,912 $ 111 $ 141,850 $ 1,170
The number of investment positions with unrealized losses totaled 86 for available-for-sale securities and 53 for held-to-maturity securities.
The changes in the fair values of our municipal bonds, agency debentures, agency collateralized mortgage obligations and agency mortgage-backed securities areprimarily the result of interest rate fluctuations. To assess for credit impairment, management evaluates the underlying issuer’s financial performance and therelated credit rating information through a review of publicly available financial statements and other publicly available information. The most recent assessmentfor credit impairment did not identify any issues related to the ultimate repayment of principal and interest on these debt securities. In addition, the Company hasthe ability and intent to hold debt securities in an unrealized loss position until recovery of their amortized cost. Based on this, the Company considers all of theunrealized losses to be temporary.
There were no outstanding debt securities classified as trading as of September 30, 2020 and December 31, 2019.
There was $13.3 million and $24.3 million in FHLB stock outstanding as of September 30, 2020 and December 31, 2019, respectively.
[3] LOANS AND LEASES
The Company generates loans through the private banking and middle-market banking channels. The private banking channel primarily includes loans made tohigh-net-worth individuals, trusts and businesses that are typically secured by cash, marketable
(1)
(1)
(1)
(1)
21

Table of Contents
securities and/or cash value life insurance. The middle-market banking channel consists of our C&I loan and lease portfolio and CRE loan portfolio, which servemiddle-market businesses and real estate developers in our primary markets and certain financial services companies with whom we have multiple relationshipcomponents.
Loans and leases held-for-investment were comprised of the following:
September 30, 2020
(Dollars in thousands)Private Banking
Commercial and
IndustrialCommercial Real Estate Total
Loans and leases held-for-investment, before deferred fees and costs $ 4,449,714 $ 1,133,478 $ 2,062,290 $ 7,645,482 Deferred loan costs (fees) 9,053 4,810 (4,899) 8,964
Loans and leases held-for-investment, net of deferred fees and costs 4,458,767 1,138,288 2,057,391 7,654,446 Allowance for loan and lease losses (2,210) (7,772) (20,724) (30,706)
Loans and leases held-for-investment, net $ 4,456,557 $ 1,130,516 $ 2,036,667 $ 7,623,740
December 31, 2019
(Dollars in thousands)Private Banking
Commercial and
IndustrialCommercial Real Estate Total
Loans and leases held-for-investment, before deferred fees and costs $ 3,688,779 $ 1,080,767 $ 1,801,375 $ 6,570,921 Deferred loan costs (fees) 6,623 4,942 (4,927) 6,638
Loans and leases held-for-investment, net of deferred fees and costs 3,695,402 1,085,709 1,796,448 6,577,559 Allowance for loan and lease losses (1,973) (5,262) (6,873) (14,108)
Loans and leases held-for-investment, net $ 3,693,429 $ 1,080,447 $ 1,789,575 $ 6,563,451
The Company’s customers have unused loan commitments or other line of credit availability based on the value of eligible collateral or other terms and conditionsunder their loan agreements. Often these commitments or other line of credit availability are not fully utilized and therefore the total amount does not necessarilyrepresent future cash requirements. The amount of unfunded commitments or other line of credit availability, including standby letters of credit, as ofSeptember 30, 2020 and December 31, 2019, was $6.25 billion and $4.91 billion, respectively. These unfunded commitments included $5.09 billion and $3.87billion of commitments that were due on demand with no stated maturity as of September 30, 2020 and December 31, 2019, respectively. The interest rate for eachcommitment and demand line of credit is established at origination and may be based on the prevailing index rate market conditions at the time of funding. Thereserve for losses on unfunded commitments was $1.4 million and $645,000 as of September 30, 2020 and December 31, 2019, respectively, which includesreserves for probable losses on unfunded loan commitments, including standby letters of credit and also risk participations.
The total unfunded commitments above included loans in the process of origination totaling approximately $61.4 million and $20.7 million as of September 30,2020 and December 31, 2019, respectively, which extend over varying periods of time.
The Company issues standby letters of credit in the normal course of business. Standby letters of credit are conditional commitments issued to guarantee theperformance of a customer to a third party. Standby letters of credit generally are contingent upon the failure of the customer to perform according to the terms ofthe underlying contract with the third party. The Company would be required to perform under a standby letter of credit when drawn upon by the guaranteed partyin the case of non-performance by the Company’s customer. Collateral may be obtained based on management’s credit assessment of the customer. The amount ofunfunded commitments related to standby letters of credit as of September 30, 2020 and December 31, 2019, included in the total unfunded commitments above,was $73.1 million and $72.8 million, respectively. Should the Company be obligated to perform under any standby letters of credit, the Company will seekrepayment from the customer for amounts paid. During the nine months ended September 30, 2020 and 2019, there were draws on letters of credit totaling $49,000and $135,000, respectively, which were repaid by the borrowers. Most of these commitments are expected to expire without being drawn upon and the totalamount does not necessarily represent future cash requirements. The potential liability for losses on standby letters of credit was included in the reserve for losseson unfunded commitments.
The Company has entered into risk participation agreements with financial institution counterparties for interest rate swaps related to loans in which we are aparticipant. The risk participation agreements provide credit protection to the financial institution counterparties should the customers fail to perform on theirinterest rate derivative contracts. The potential liability for outstanding obligations was included in the reserve for losses on unfunded commitments.
22

Table of Contents
[4] ALLOWANCE FOR LOAN AND LEASE LOSSES
Our allowance for loan and lease losses represents our estimate of probable loan and lease losses inherent in the portfolio at a specific point in time. This estimateincludes losses associated with specifically identified loans and leases, as well as estimated probable credit losses inherent in the remainder of the loan and leaseportfolio. Additions are made to the allowance through both periodic provisions recorded in the consolidated statements of income and recoveries of lossespreviously incurred. Reductions to the allowance occur as loans and leases are charged off or when the credit history of any of the Company’s three loan portfolios(private banking loans, C&I loans and leases, and CRE loans) improves. Management evaluates the adequacy of the allowance quarterly, and in doing so relies onvarious factors including, but not limited to, assessment of historical loss experience, delinquency and non-accrual trends, portfolio growth, underlying collateralcoverage and current economic conditions. This evaluation is subjective and requires material estimates that may change over time. In addition, managementevaluates the overall methodology for the allowance for loan and lease losses on an annual basis. The calculation of the allowance for loan and lease losses takesinto consideration the inherent risk identified within each of the Company’s three loan portfolios. In addition, management considers the historical loss experienceof each loan portfolio to ensure that the allowance for loan and lease losses is sufficient to cover probable losses inherent in such loan portfolios. Refer to Note 1,Summary of Significant Accounting Policies, to our unaudited condensed consolidated financial statements for more details on the Company’s allowance for loanand lease losses policy.
The following discusses key characteristics and risks within each primary loan portfolio:
Private Banking LoansOur private banking lending activities are conducted on a national basis. This loan portfolio primarily includes loans made to high-net-worth individuals, trustsand businesses that are typically secured by cash, marketable securities and/or cash value life insurance. This portfolio also has some loans that are secured byresidential real estate or other financial assets, lines of credit and unsecured loans. The primary sources of repayment for these loans are the income and/orassets of the borrower.
The underlying collateral is the most important indicator of risk for this loan portfolio. The overall lower risk profile of this portfolio is driven by loanssecured by cash, marketable securities and/or cash value life insurance, which were 98.2% and 97.4% of total private banking loans as of September 30, 2020and December 31, 2019, respectively.
Commercial Banking: Commercial and Industrial Loans and LeasesThis loan portfolio primarily includes loans and leases made to financial and other service companies or manufacturers generally for the purposes of financingproduction, operating capacity, accounts receivable, inventory, equipment, acquisitions and recapitalizations. Cash flow from the borrower’s operations is theprimary source of repayment for these loans and leases, except for certain commercial loans that are secured by marketable securities.
The borrower’s industry and local and regional economic conditions are important indicators of risk for this loan portfolio. Collateral for these types of loansat times does not have sufficient value in a distressed or liquidation scenario to satisfy the outstanding debt. C&I loans collateralized by marketable securitiesare treated the same as private banking loans for purposes of the allowance for loan and lease loss calculation.
Commercial Banking: Commercial Real Estate LoansThis loan portfolio includes loans secured by commercial purpose real estate, including both owner-occupied properties and investment properties for variouspurposes including office, industrial, multifamily, retail, hospitality, healthcare and self-storage. The primary source of repayment for CRE loans secured byowner-occupied properties is cash flow from the borrower’s operations. Individual project cash flows, global cash flows and liquidity from the developer, orthe sale of the property are the primary sources of repayment for CRE loans secured by investment properties. Also included are commercial constructionloans to finance the construction or renovation of structures as well as to finance the acquisition and development of raw land for various purposes. Theincreased level of risk for these loans is generally confined to the construction period. If problems arise, the project may not be completed, and as such, maynot provide sufficient cash flow on its own to service the debt or have sufficient value in a liquidation to cover the outstanding principal.
The underlying purpose and collateral of the loans are important indicators of risk for this loan portfolio. Additional risks exist and are dependent on severalfactors such as the condition of the local and regional economies, whether or not the project is owner-occupied, the type of project, and the experience andresources of the developer.
On a monthly basis, management monitors various credit quality indicators for the loan portfolio, including delinquency, non-performing status, changes in riskratings, changes in the underlying performance of the borrowers and other relevant factors. On a daily basis, the Company monitors the collateral of loans securedby cash, marketable securities and/or cash value life insurance within the private banking portfolio, which further reduces the risk profile of that portfolio. Refer toNote 1, Summary of Significant
23

Table of Contents
Accounting Policies, to our unaudited condensed consolidated financial statements for the Company’s policy for determining past due status of loans.
Loan risk ratings are assigned based upon the creditworthiness of the borrower and the quality of the collateral for loans secured by marketable securities. Loanrisk ratings are reviewed on an ongoing basis according to internal policies. Loans within the pass rating are believed to have a lower risk of loss than loans that arerisk rated as special mention, substandard or doubtful, which are believed to have an increasing risk of loss. Our internal risk ratings are consistent with regulatoryguidance. Management also monitors the loan portfolio through a formal periodic review process. All non-pass rated loans are reviewed monthly and higher risk-rated loans within the pass category are reviewed at least annually.
The Company’s risk ratings are consistent with regulatory guidance and are as follows:
Pass – The loan is currently performing in accordance with its contractual terms.
Special Mention – A special mention loan has potential weaknesses that warrant management’s close attention. If left uncorrected, these potential weaknessesmay result in deterioration of the repayment prospects or in our credit position at some future date. Economic and market conditions beyond the customer’scontrol may in the future necessitate this classification.
Substandard – A substandard loan is not adequately protected by the net worth and/or paying capacity of the obligor or by the collateral pledged, if any.Substandard loans have a well-defined weakness or weaknesses that jeopardize the liquidation of the debt. These loans are characterized by the distinctpossibility that the Company will sustain some loss if the deficiencies are not corrected.
Doubtful – A doubtful loan has all the weaknesses inherent in a loan categorized as substandard with the added characteristic that the weaknesses makecollection or liquidation in full, on the basis of currently existing facts, conditions and values, highly questionable and improbable.
The following tables present the recorded investment in loans by credit quality indicator:
September 30, 2020
(Dollars in thousands)Private Banking
Commercial and
IndustrialCommercial Real Estate Total
Pass $ 4,458,228 $ 1,121,372 $ 2,036,007 $ 7,615,607 Special mention — 16,458 4,639 21,097 Substandard 539 458 16,745 17,742 Loans and leases held-for-investment $ 4,458,767 $ 1,138,288 $ 2,057,391 $ 7,654,446
December 31, 2019
(Dollars in thousands)Private Banking
Commercial and
IndustrialCommercial Real Estate Total
Pass $ 3,691,866 $ 1,069,932 $ 1,780,768 $ 6,542,566 Special mention — 15,777 14,284 30,061 Substandard 3,536 — 1,396 4,932 Loans and leases held-for-investment $ 3,695,402 $ 1,085,709 $ 1,796,448 $ 6,577,559
Changes in the allowance for loan and lease losses were as follows for the three months ended September 30, 2020 and 2019:
Three Months Ended September 30, 2020
(Dollars in thousands)Private Banking
Commercial and
IndustrialCommercial Real Estate Total
Balance, beginning of period $ 2,151 $ 7,546 $ 13,579 $ 23,276 Provision for loan and lease losses 59 226 7,145 7,430 Charge-offs — — — — Recoveries — — — — Balance, end of period $ 2,210 $ 7,772 $ 20,724 $ 30,706
24

Table of Contents
Three Months Ended September 30, 2019
(Dollars in thousands)Private Banking
Commercial and
IndustrialCommercial Real Estate Total
Balance, beginning of period $ 2,140 $ 5,911 $ 5,965 $ 14,016 Provision (credit) for loan and lease losses (177) (672) 242 (607)Charge-offs (112) — — (112)Recoveries — 77 — 77 Balance, end of period $ 1,851 $ 5,316 $ 6,207 $ 13,374
Changes in the allowance for loan and lease losses were as follows for the nine months ended September 30, 2020 and 2019:
Nine Months Ended September 30, 2020
(Dollars in thousands)Private Banking
Commercial and
IndustrialCommercial Real Estate Total
Balance, beginning of period $ 1,973 $ 5,262 $ 6,873 $ 14,108 Provision for loan and lease losses 408 2,169 13,851 16,428 Charge-offs (171) — — (171)Recoveries — 341 — 341 Balance, end of period $ 2,210 $ 7,772 $ 20,724 $ 30,706
Nine Months Ended September 30, 2019
(Dollars in thousands)Private Banking
Commercial and
IndustrialCommercial Real Estate Total
Balance, beginning of period $ 1,942 $ 5,764 $ 5,502 $ 13,208 Provision (credit) for loan and lease losses 21 (2,422) 705 (1,696)Charge-offs (112) — — (112)Recoveries — 1,974 — 1,974 Balance, end of period $ 1,851 $ 5,316 $ 6,207 $ 13,374
The following tables present the age analysis of past due loans and leases segregated by class:
September 30, 2020
(Dollars in thousands)30-59 Days
Past Due60-89 Days
Past Due90 Days or More
Past Due Total Past Due Current TotalPrivate banking $ — $ — $ — $ — $ 4,458,767 $ 4,458,767 Commercial and industrial — — 458 458 1,137,830 1,138,288 Commercial real estate — — 6,296 6,296 2,051,095 2,057,391 Loans and leases held-for-investment $ — $ — $ 6,754 $ 6,754 $ 7,647,692 $ 7,654,446
December 31, 2019
(Dollars in thousands)30-59 Days Past
Due60-89 Days Past
Due90 Days or More
Past Due Total Past Due Current TotalPrivate banking $ 261 $ — $ 184 $ 445 $ 3,694,957 $ 3,695,402 Commercial and industrial — — — — 1,085,709 1,085,709 Commercial real estate — — — — 1,796,448 1,796,448 Loans and leases held-for-investment $ 261 $ — $ 184 $ 445 $ 6,577,114 $ 6,577,559
Non-Performing and Impaired Loans
Management monitors the delinquency status of the Company’s loan portfolio on a monthly basis. Loans are considered non-performing when interest andprincipal are 90 days or more past due or management has determined that it is probable the borrower is unable to meet payments as they become due. The risk ofloss is generally highest for non-performing loans.
25

Table of Contents
Management determines loans to be impaired when, based upon current information and events, it is probable that the loan will not be repaid according to theoriginal contractual terms of the loan agreement, including both principal and interest, or if a loan is designated as a TDR. Refer to Note 1, Summary of SignificantAccounting Policies, to our unaudited condensed consolidated financial statements for the Company’s policy on evaluating loans for impairment and interestincome.
The following tables present the Company’s investment in loans considered to be impaired and related information on those impaired loans:
As of and for the Nine Months Ended September 30, 2020
(Dollars in thousands)Recorded
InvestmentUnpaid Principal
Balance Related AllowanceAverage Recorded
InvestmentInterest Income
RecognizedWith a related allowance recorded:
Private banking $ — $ — $ — $ — $ — Commercial and industrial 458 457 103 458 — Commercial real estate 6,296 6,317 1,417 6,300 —
Total with a related allowance recorded 6,754 6,774 1,520 6,758 — Without a related allowance recorded:
Private banking — — — — — Commercial and industrial — — — — — Commercial real estate — — — — —
Total without a related allowance recorded — — — — — Total:
Private banking — — — — — Commercial and industrial 458 457 103 458 — Commercial real estate 6,296 6,317 1,417 6,300 —
Total $ 6,754 $ 6,774 $ 1,520 $ 6,758 $ —
As of and for the Twelve Months Ended December 31, 2019
(Dollars in thousands)Recorded
InvestmentUnpaid Principal
Balance Related AllowanceAverage Recorded
InvestmentInterest Income
RecognizedWith a related allowance recorded:
Private banking $ 171 $ 193 $ 171 $ 171 $ — Commercial and industrial — — — — — Commercial real estate — — — — —
Total with a related allowance recorded 171 193 171 171 — Without a related allowance recorded:
Private banking 13 13 — 13 — Commercial and industrial — — — — — Commercial real estate — — — — —
Total without a related allowance recorded 13 13 — 13 — Total:
Private banking 184 206 171 184 — Commercial and industrial — — — — — Commercial real estate — — — — —
Total $ 184 $ 206 $ 171 $ 184 $ —
Impaired loans as of September 30, 2020 and December 31, 2019, were $6.8 million and $184,000, respectively. There was no interest income recognized onimpaired loans that were also on non-accrual status for the nine months ended September 30, 2020, and the twelve months ended December 31, 2019. As ofSeptember 30, 2020 and December 31, 2019, there were no loans 90 days or more past due and still accruing interest income.
26

Table of Contents
Impaired loans are evaluated using a discounted cash flow method or based on the fair value of the collateral less estimated selling costs. Based on thoseevaluations there were specific reserves totaling $1.5 million and $171,000 as of September 30, 2020 and December 31, 2019, respectively.
The following tables present the allowance for loan and lease losses and recorded investment in loans by class:
September 30, 2020
(Dollars in thousands)Private Banking
Commercial and
IndustrialCommercial Real Estate Total
Allowance for loan and lease losses:Individually evaluated for impairment $ — $ 103 $ 1,417 $ 1,520 Collectively evaluated for impairment 2,210 7,669 19,307 29,186
Total allowance for loan and lease losses $ 2,210 $ 7,772 $ 20,724 $ 30,706 Loans and leases held-for-investment:
Individually evaluated for impairment $ — $ 458 $ 6,296 $ 6,754 Collectively evaluated for impairment 4,458,767 1,137,830 2,051,095 7,647,692
Loans and leases held-for-investment $ 4,458,767 $ 1,138,288 $ 2,057,391 $ 7,654,446
December 31, 2019
(Dollars in thousands)Private Banking
Commercial and
IndustrialCommercial Real Estate Total
Allowance for loan and lease losses:Individually evaluated for impairment $ 171 $ — $ — $ 171 Collectively evaluated for impairment 1,802 5,262 6,873 13,937
Total allowance for loan and lease losses $ 1,973 $ 5,262 $ 6,873 $ 14,108 Loans and leases held-for-investment:
Individually evaluated for impairment $ 184 $ — $ — $ 184 Collectively evaluated for impairment 3,695,218 1,085,709 1,796,448 6,577,375
Loans and leases held-for-investment $ 3,695,402 $ 1,085,709 $ 1,796,448 $ 6,577,559
Troubled Debt Restructuring
The aggregate recorded investment of impaired loans with terms modified through a TDR was $0 and $171,000 as of September 30, 2020 and December 31, 2019,respectively, which were also on non-accrual. There were no unused commitments on loans designated as TDRs as of September 30, 2020 and December 31, 2019.
The modifications made to restructured loans typically consist of an extension of the payment terms or the deferral of principal payments. There were no loansmodified as TDRs within 12 months of the corresponding balance sheet date with a payment default during the three and nine months ended September 30, 2020and 2019.
There were no loans newly designated as TDRs during the three and nine months ended September 30, 2020 and 2019.
Other Real Estate Owned
As of September 30, 2020 and December 31, 2019, the balance of the OREO was $2.7 million and $4.3 million, respectively. During the nine months endedSeptember 30, 2020, a property was sold from OREO for $1.5 million with a net gain of $65,000. There were no residential mortgage loans in the process offoreclosure as of September 30, 2020.
27
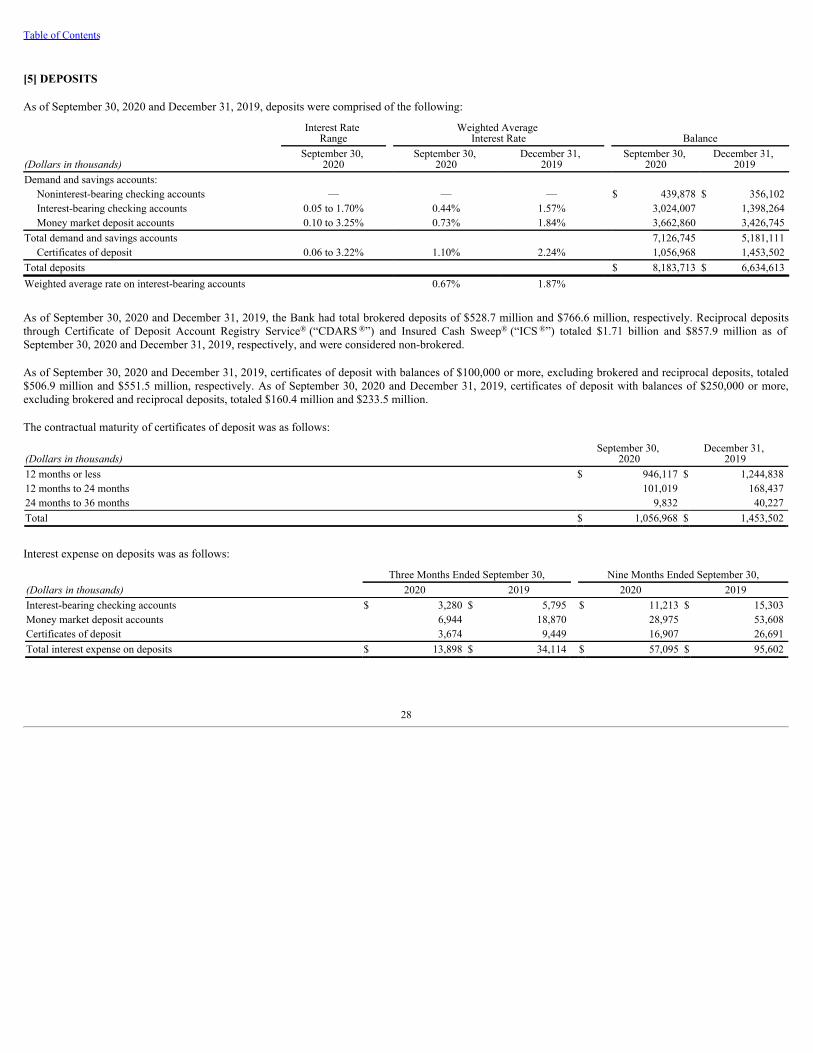
Table of Contents
[5] DEPOSITS
As of September 30, 2020 and December 31, 2019, deposits were comprised of the following:
Interest Rate Range
Weighted Average Interest Rate Balance
(Dollars in thousands)September 30,
2020September 30,
2020December 31,
2019September 30,
2020December 31,
2019Demand and savings accounts:
Noninterest-bearing checking accounts — — — $ 439,878 $ 356,102 Interest-bearing checking accounts 0.05 to 1.70% 0.44% 1.57% 3,024,007 1,398,264 Money market deposit accounts 0.10 to 3.25% 0.73% 1.84% 3,662,860 3,426,745
Total demand and savings accounts 7,126,745 5,181,111 Certificates of deposit 0.06 to 3.22% 1.10% 2.24% 1,056,968 1,453,502
Total deposits $ 8,183,713 $ 6,634,613 Weighted average rate on interest-bearing accounts 0.67% 1.87%
As of September 30, 2020 and December 31, 2019, the Bank had total brokered deposits of $528.7 million and $766.6 million, respectively. Reciprocal depositsthrough Certificate of Deposit Account Registry Service (“CDARS ”) and Insured Cash Sweep (“ICS ”) totaled $1.71 billion and $857.9 million as ofSeptember 30, 2020 and December 31, 2019, respectively, and were considered non-brokered.
As of September 30, 2020 and December 31, 2019, certificates of deposit with balances of $100,000 or more, excluding brokered and reciprocal deposits, totaled$506.9 million and $551.5 million, respectively. As of September 30, 2020 and December 31, 2019, certificates of deposit with balances of $250,000 or more,excluding brokered and reciprocal deposits, totaled $160.4 million and $233.5 million.
The contractual maturity of certificates of deposit was as follows:
(Dollars in thousands)September 30,
2020December 31,
201912 months or less $ 946,117 $ 1,244,838 12 months to 24 months 101,019 168,437 24 months to 36 months 9,832 40,227 Total $ 1,056,968 $ 1,453,502
Interest expense on deposits was as follows:
Three Months Ended September 30, Nine Months Ended September 30,(Dollars in thousands) 2020 2019 2020 2019Interest-bearing checking accounts $ 3,280 $ 5,795 $ 11,213 $ 15,303 Money market deposit accounts 6,944 18,870 28,975 53,608 Certificates of deposit 3,674 9,449 16,907 26,691 Total interest expense on deposits $ 13,898 $ 34,114 $ 57,095 $ 95,602
® ® ® ®
28

Table of Contents
[6] BORROWINGS
As of September 30, 2020 and December 31, 2019, borrowings were comprised of the following:
September 30, 2020 December 31, 2019(Dollars in thousands) Interest Rate Ending Balance Maturity Date Interest Rate Ending Balance Maturity DateFHLB borrowings:
FHLB line of credit —% $ — 1.81% $ 55,000 5/1/2020Issued 7/8/2020 0.46% 50,000 10/8/2020 —% — Issued 9/1/2020 0.40% 150,000 12/1/2020 —% — Issued 9/2/2020 0.40% 50,000 12/2/2020 —% — Issued 9/21/2020 0.39% 50,000 12/21/2020 —% — Issued 12/12/2019 —% — 1.85% 100,000 1/13/2020Issued 12/2/2019 —% — 1.91% 150,000 3/2/2020Issued 10/8/2019 —% — 2.00% 50,000 1/8/2020
Subordinated notes payable (net of debt issuance costs of$1,948 and $0, respectively) 5.75% 95,439 5/15/2030 —% — Total borrowings, net $ 395,439 $ 355,000
During the three months ended June 30, 2020, the Company completed a private placement of subordinated notes payable, raising aggregate proceeds of $97.5million. The subordinated notes have a term of 10 years at a fixed-to-floating rate of 5.75%. The subordinated notes qualify under federal regulatory rules as Tier 2capital for the holding company.
The Bank’s FHLB borrowing capacity is based on the collateral value of certain securities held in safekeeping at the FHLB and loans pledged to the FHLB. TheBank submits a quarterly Qualifying Collateral Report (“QCR”) to the FHLB to update the value of the loans pledged. As of September 30, 2020, the Bank’sborrowing capacity is based on the information provided in the June 30, 2020, QCR filing. As of September 30, 2020, the Bank had securities held in safekeepingat the FHLB with a fair value of $2.4 million, combined with pledged loans of $1.28 billion, for a gross borrowing capacity of $914.3 million, of which $300.0million was outstanding in advances. As of December 31, 2019, there was $355.0 million outstanding in advances from the FHLB. When the Bank borrows fromthe FHLB, interest is charged at the FHLB’s posted rates at the time of the borrowing.
The Bank maintains an unsecured line of credit of $10.0 million with M&T Bank and an unsecured line of credit of $20.0 million with Texas Capital Bank. As ofSeptember 30, 2020 and December 31, 2019, there were no outstanding borrowings under these lines of credit and they are available to the Bank at the lenders’discretion. In addition, the Bank maintains an $8.0 million unsecured line of credit with PNC Bank for private label credit card facilities for certain existingcommercial clients of the Bank, of which $2.6 million in notional value of credit cards have been issued. The clients of the Bank are responsible for repaying anybalances due on these credit cards directly to PNC, however if the customer fails to repay PNC, the Bank could be required to satisfy the obligation to PNC andinitiate collection from our customer as part of the existing credit facility of that customer.
The holding company maintains an unsecured line of credit with Texas Capital Bank. As of September 30, 2020 and December 31, 2019, the unsecured line was$75.0 million with no outstanding balance. In October 2020, this line of credit was reduced to $50.0 million.
Interest expense on borrowings was as follows:
Three Months Ended September 30, Nine Months Ended September 30,(Dollars in thousands) 2020 2019 2020 2019FHLB borrowings $ 1,392 $ 1,302 $ 4,711 $ 6,222 Line of credit borrowings — — 261 68 Subordinated notes payable 1,458 — 2,138 1,090 Total interest expense on borrowings $ 2,850 $ 1,302 $ 7,110 $ 7,380
[7] STOCK TRANSACTIONS
In May 2019, the Company completed the issuance and sale of a registered, underwritten public offering of 3,220,000 depositary shares, each representing a 1/40thinterest in a share of its 6.375% Fixed-to-Floating Rate Series B Non-Cumulative Perpetual
29

Table of Contents
Preferred Stock, no par value (the “Series B Preferred Stock”), with a liquidation preference of $1,000 per share (equivalent to $25 per depository share). TheCompany received net proceeds of $77.6 million from the sale of 80,500 shares of its Series B Preferred Stock (equivalent to 3,220,000 depositary shares), afterdeducting underwriting discounts, commissions and direct offering expenses. The preferred stock provides Tier 1 capital for the holding company under federalregulatory capital rules.
When, as, and if declared by the board of directors (the “Board”) of the Company, dividends will be payable on the Series B Preferred Stock from the date ofissuance to, but excluding July 1, 2026, at a rate of 6.375% per annum, payable quarterly, in arrears, and from and including July 1, 2026, dividends will accrueand be payable at a floating rate equal to three-month LIBOR plus a spread of 408.8 basis points per annum (subject to potential adjustment as provided in thedefinition of three-month LIBOR), payable quarterly, in arrears. The Company may redeem the Series B Preferred Stock at its option, subject to regulatoryapproval, on or after July 1, 2024, as described in the prospectus supplement relating to the offering filed with the SEC on May 23, 2019.
In March 2018, the Company completed the issuance and sale of a registered, underwritten public offering of 1,610,000 depositary shares, each representing a1/40th interest in a share of its 6.75% Fixed-to-Floating Rate Series A Non-Cumulative Perpetual Preferred Stock, no par value (the “Series A Preferred Stock”),with a liquidation preference of $1,000 per share (equivalent to $25 per depository share). The Company received net proceeds of $38.5 million from the sale of40,250 shares of its Series A Preferred Stock (equivalent to 1,610,000 depositary shares), after deducting underwriting discounts, commissions and direct offeringexpenses. The preferred stock provides Tier 1 capital for the holding company under federal regulatory capital rules.
When, as, and if declared by the Board, dividends will be payable on the Series A Preferred Stock from the date of issuance to, but excluding April 1, 2023, at arate of 6.75% per annum, payable quarterly, in arrears, and from and including April 1, 2023, dividends will accrue and be payable at a floating rate equal to three-month LIBOR plus a spread of 398.5 basis points per annum (subject to potential adjustment), payable quarterly, in arrears. The Company may redeem the SeriesA Preferred Stock at its option, subject to regulatory approval, on or after April 1, 2023, as described in the prospectus supplement relating to the offering filedwith the SEC on March 19, 2018.
During the nine months ended September 30, 2020, the Company paid dividends of $2.0 million on its Series A Preferred Stock and $3.8 million on its Series BPreferred Stock. During the nine months ended September 30, 2019, the Company paid dividends of $2.0 million on its Series A Preferred Stock and $1.8 millionon its Series B Preferred Stock.
Under authorization by the Board, the Company is permitted to repurchase its common stock up to prescribed amounts, of which $9.8 million remained availableas of September 30, 2020. The Board also authorized the Company to utilize some of the share repurchase program authorizations to cancel certain options topurchase shares of its common stock granted by the Company. During the nine months ended September 30, 2020, the Company repurchased 40,000 shares forapproximately $670,000, at an average cost of $16.76 per share, which are held as treasury stock. During the nine months ended September 30, 2019, the Companyrepurchased 90,000 shares for approximately $1.8 million, at an average cost of $20.21 per share, which are held as treasury stock.
In addition to the shares purchased in the market, treasury shares increased 126,148, or approximately $2.7 million, in connection with the net settlement of equityawards exercised or vested during the nine months ended September 30, 2020. The Company also reissued 8,500 shares of treasury stock for approximately$135,000 during the nine months ended September 30, 2020.
Under prior authorization of the Board, stock option cancellation programs were approved to allow for certain outstanding and vested stock option awards to becanceled by the option holder at a price based on the closing day’s stock price less the option exercise price. During the nine months ended September 30, 2020,there were 212,447 options canceled for approximately $2.5 million, which was recorded as a reduction to additional paid-in capital.
30

Table of Contents
The tables below show the changes in the Company’s preferred and common shares outstanding during the periods indicated:
Number of Preferred Shares
Outstanding
Number of Common Shares
OutstandingNumber of
Treasury SharesBalance, December 31, 2018 40,250 28,878,674 2,014,910
Issuance of preferred stock 80,500 — — Issuance of restricted common stock — 550,453 — Forfeitures of restricted common stock — (74,355) — Exercise of stock options — 40,580 — Purchase of treasury stock through open market transactions — (90,000) 90,000 Increase in treasury stock related to equity awards — (8,382) 8,382
Balance, September 30, 2019 120,750 29,296,970 2,113,292
Balance, December 31, 2019 120,750 29,355,986 2,126,422 Issuance of restricted common stock — 607,323 — Forfeitures of restricted common stock — (11,018) — Exercise of stock options — 33,500 — Purchase of treasury stock through open market transactions — (40,000) 40,000 Increase in treasury stock related to equity awards — (126,148) 126,148 Reissuance of treasury stock — 8,500 (8,500)
Balance, September 30, 2020 120,750 29,828,143 2,284,070
[8] REGULATORY CAPITAL
The Company and the Bank are subject to various regulatory capital requirements administered by the federal banking agencies. Failure to meet minimum capitalrequirements can initiate certain mandatory – and possibly additional discretionary – actions by regulators that, if undertaken, could have a direct material effect onthe Company’s and the Bank’s financial statements. Under capital adequacy guidelines and the regulatory framework for prompt corrective action, the Companyand the Bank must meet specific capital guidelines that involve quantitative measures of the Company’s and the Bank’s assets, liabilities, and certain off-balancesheet items as calculated under regulatory accounting practices. The Company’s and the Bank’s capital amounts and classification are also subject to qualitativejudgments by the regulators about components, risk weighting and other factors.
Quantitative measures established by regulation to ensure capital adequacy require the Company and the Bank to maintain minimum amounts and ratios (set forthin the tables below) of Common Equity Tier 1 (“CET 1”), Tier 1 and Total risk-based capital (as defined in the regulations) to risk-weighted assets (as defined),and of Tier 1 capital to average assets (as defined). As of September 30, 2020 and December 31, 2019, TriState Capital Holdings, Inc. and TriState Capital Bankexceeded all capital adequacy requirements to which they were subjected.
Financial depository institutions are categorized as well capitalized if they meet minimum capital ratios as set forth in the tables below. The Bank exceeded thecapital ratios necessary to be well capitalized under the regulatory framework for prompt corrective action. There have been no conditions or events since the filingof the most recent Call Report that management believes have changed the Bank’s capital, as presented in the tables below.
A banking organization is also subject to certain limitations on capital distributions and discretionary bonus payments to executive officers if the organization doesnot maintain the necessary capital conservation buffer - a common equity tier 1 risk-based capital ratio of 2.5% or more, in addition to the minimum capitaladequacy levels shown in the tables below. Both the Company and the Bank were above the levels required to avoid limitations on capital distributions anddiscretionary bonus payments.
31

Table of Contents
The following tables set forth certain information concerning the Company’s and the Bank’s regulatory capital as of September 30, 2020 and December 31, 2019:
September 30, 2020
Actual For Capital Adequacy Purposes
To be Well Capitalized UnderPrompt Corrective Action
Provisions(Dollars in thousands) Amount Ratio Amount Ratio Amount RatioTotal risk-based capital ratio
Company $ 716,731 12.85 % $ 446,355 8.00 % N/A N/ABank $ 692,957 12.46 % $ 444,791 8.00 % $ 555,989 10.00 %
Tier 1 risk-based capital ratioCompany $ 589,176 10.56 % $ 334,766 6.00 % N/A N/ABank $ 660,841 11.89 % $ 333,593 6.00 % $ 444,791 8.00 %
Common equity tier 1 risk-based capital ratioCompany $ 473,097 8.48 % $ 251,075 4.50 % N/A N/ABank $ 660,841 11.89 % $ 250,195 4.50 % $ 361,393 6.50 %
Tier 1 leverage ratioCompany $ 589,176 6.23 % $ 378,310 4.00 % N/A N/ABank $ 660,841 7.00 % $ 377,750 4.00 % $ 472,187 5.00 %
December 31, 2019
Actual For Capital Adequacy Purposes
To be Well Capitalized UnderPrompt Corrective Action
Provisions(Dollars in thousands) Amount Ratio Amount Ratio Amount RatioTotal risk-based capital ratio
Company $ 572,221 12.05 % $ 379,911 8.00 % N/A N/ABank $ 547,532 11.57 % $ 378,623 8.00 % $ 473,279 10.00 %
Tier 1 risk-based capital ratioCompany $ 558,068 11.75 % $ 284,933 6.00 % N/A N/ABank $ 532,779 11.26 % $ 283,967 6.00 % $ 378,623 8.00 %
Common equity tier 1 risk-based capital ratioCompany $ 442,385 9.32 % $ 213,700 4.50 % N/A N/ABank $ 532,779 11.26 % $ 212,975 4.50 % $ 307,631 6.50 %
Tier 1 leverage ratioCompany $ 558,068 7.54 % $ 296,038 4.00 % N/A N/ABank $ 532,779 7.22 % $ 295,277 4.00 % $ 369,097 5.00 %
32

Table of Contents
[9] EARNINGS PER COMMON SHARE
The computation of basic and diluted earnings per common share for the periods presented was as follows:
Three Months Ended September 30, Nine Months Ended September 30,(Dollars in thousands, except per share data) 2020 2019 2020 2019
Net income available to common shareholders $ 7,367 $ 14,372 $ 26,738 $ 41,798 Weighted average common shares outstanding:
Basic 28,286,250 27,863,767 28,230,180 27,861,515 Restricted stock - dilutive 303,138 600,985 313,726 569,260 Stock options - dilutive 85,055 313,919 135,377 328,633
Diluted 28,674,443 28,778,671 28,679,283 28,759,408
Earnings per common share:Basic $ 0.26 $ 0.52 $ 0.95 $ 1.50 Diluted $ 0.26 $ 0.50 $ 0.93 $ 1.45
Three Months Ended September 30, Nine Months Ended September 30,2020 2019 2020 2019
Anti-dilutive shares 791,262 9,000 566,498 13,000
Includes stock options and/or restricted stock not considered for the calculation of diluted EPS as their inclusion would have been anti-dilutive.
[10] DERIVATIVES AND HEDGING ACTIVITY
RISK MANAGEMENT OBJECTIVE OF USING DERIVATIVES
The Company is exposed to certain risks arising from both its business operations and economic conditions. The Company principally manages its exposures to awide variety of business and operational risks through management of its core business activities. The Company manages economic risks, including interest rate,liquidity and credit risk, primarily by managing the amount, sources and duration of its debt funding and through the use of derivative financial instruments.Specifically, the Company enters into derivative financial instruments to manage exposures that arise from business activities that result in the receipt or paymentof future known and uncertain cash amounts, the value of which are determined by interest rates. The Company’s derivative financial instruments are used tomanage differences in the amount, timing and duration of the Company’s known or expected cash payments related to certain of the Company’s FHLB borrowingsand to manage the volatility of the change in fair value related to certain of the Company’s equity investments. The Company also has derivatives that are a resultof a service the Company provides to certain qualifying customers while at the same time the Company enters into an offsetting derivative transaction in order toeliminate its interest rate risk exposure resulting from such transactions.
FAIR VALUES OF DERIVATIVE INSTRUMENTS ON THE STATEMENTS OF FINANCIAL CONDITION
The tables below present the fair value of the Company’s derivative financial instruments as well as their classification on the unaudited condensed consolidatedstatements of financial condition as of September 30, 2020 and December 31, 2019:
Asset Derivatives Liability Derivativesas of September 30, 2020 as of September 30, 2020
(Dollars in thousands) Balance Sheet Location Fair Value Balance Sheet Location Fair ValueDerivatives designated as hedging instruments:
Interest rate products Other assets $ — Other liabilities $ 10,239
Derivatives not designated as hedging instruments:Interest rate products Other assets 166,153 Other liabilities 166,241
Total Other assets $ 166,153 Other liabilities $ 176,480
(1)
(1)
33
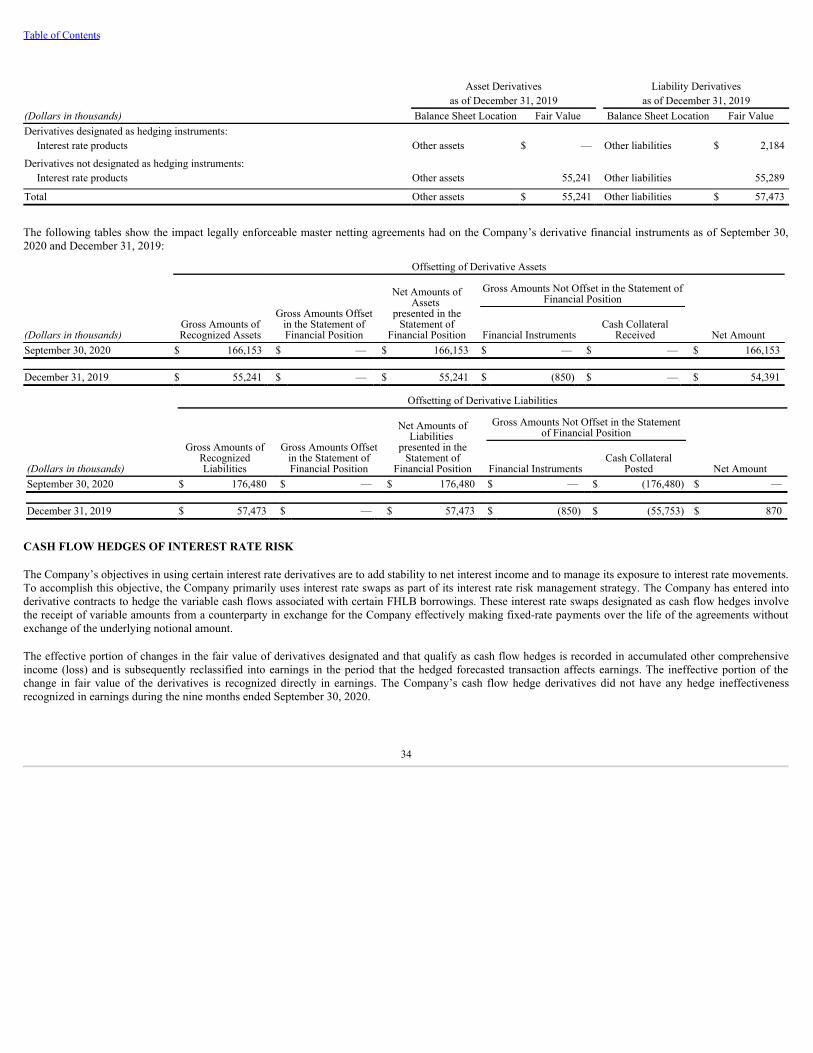
Table of Contents
Asset Derivatives Liability Derivativesas of December 31, 2019 as of December 31, 2019
(Dollars in thousands) Balance Sheet Location Fair Value Balance Sheet Location Fair ValueDerivatives designated as hedging instruments:
Interest rate products Other assets $ — Other liabilities $ 2,184
Derivatives not designated as hedging instruments:Interest rate products Other assets 55,241 Other liabilities 55,289
Total Other assets $ 55,241 Other liabilities $ 57,473
The following tables show the impact legally enforceable master netting agreements had on the Company’s derivative financial instruments as of September 30,2020 and December 31, 2019:
Offsetting of Derivative Assets
Gross Amounts ofRecognized Assets
Gross Amounts Offsetin the Statement ofFinancial Position
Net Amounts ofAssets
presented in theStatement of
Financial Position
Gross Amounts Not Offset in the Statement ofFinancial Position
Net Amount(Dollars in thousands) Financial InstrumentsCash Collateral
ReceivedSeptember 30, 2020 $ 166,153 $ — $ 166,153 $ — $ — $ 166,153
December 31, 2019 $ 55,241 $ — $ 55,241 $ (850) $ — $ 54,391
Offsetting of Derivative Liabilities
Gross Amounts ofRecognizedLiabilities
Gross Amounts Offsetin the Statement ofFinancial Position
Net Amounts ofLiabilities
presented in theStatement of
Financial Position
Gross Amounts Not Offset in the Statementof Financial Position
Net Amount(Dollars in thousands) Financial InstrumentsCash Collateral
PostedSeptember 30, 2020 $ 176,480 $ — $ 176,480 $ — $ (176,480) $ —
December 31, 2019 $ 57,473 $ — $ 57,473 $ (850) $ (55,753) $ 870
CASH FLOW HEDGES OF INTEREST RATE RISK
The Company’s objectives in using certain interest rate derivatives are to add stability to net interest income and to manage its exposure to interest rate movements.To accomplish this objective, the Company primarily uses interest rate swaps as part of its interest rate risk management strategy. The Company has entered intoderivative contracts to hedge the variable cash flows associated with certain FHLB borrowings. These interest rate swaps designated as cash flow hedges involvethe receipt of variable amounts from a counterparty in exchange for the Company effectively making fixed-rate payments over the life of the agreements withoutexchange of the underlying notional amount.
The effective portion of changes in the fair value of derivatives designated and that qualify as cash flow hedges is recorded in accumulated other comprehensiveincome (loss) and is subsequently reclassified into earnings in the period that the hedged forecasted transaction affects earnings. The ineffective portion of thechange in fair value of the derivatives is recognized directly in earnings. The Company’s cash flow hedge derivatives did not have any hedge ineffectivenessrecognized in earnings during the nine months ended September 30, 2020.
34

Table of Contents
Characteristics of the Company’s interest rate derivative transactions designated as cash flow hedges of interest rate risk as of September 30, 2020, were asfollows:
(Dollars in thousands)Notional Amount
EffectiveRate
Estimated Increase/ (Decrease) to Interest Expense in the Next
Twelve MonthsMaturity
DateRemaining Term
(in Months)Interest rate products:
Issued 1/8/2018 $ 50,000 2.21% $ 271 1/8/2021 3Issued 5/30/2019 50,000 2.05% 926 6/1/2022 20Issued 5/30/2019 50,000 2.03% 919 6/1/2023 32Issued 5/30/2019 50,000 2.04% 925 6/1/2024 44Issued 3/2/2020 50,000 0.98% 387 3/2/2025 53Issued 3/20/2020 50,000 0.60% 196 3/20/2025 54
Total $ 300,000 $ 3,624
The effective rate is adjusted for the difference between the three-month FHLB advance rate and three-month LIBOR.
The tables below present the effective portion of the Company’s cash flow hedge instruments in the unaudited condensed consolidated statements of income andaccumulated other comprehensive income (loss):
Three Months Ended September 30, Three Months Ended September 30,(Dollars in thousands) 2020 2019 2020 2019
Derivatives designated as hedginginstruments:
Location of Gain (Loss) Recognized inIncome on Derivatives
Realized Gain (Loss) Recognized inIncome on Derivatives
Unrealized Gain (Loss) Recognized inAccumulated Other Comprehensive Income
on DerivativesInterest rate products Interest expense $ (1,028) $ 156 $ 32 $ (967)
Nine Months Ended September 30, Nine Months Ended September 30,(Dollars in thousands) 2020 2019 2020 2019
Derivatives designated as hedginginstruments:
Location of Gain (Loss) Recognized inIncome on Derivatives
Realized Gain (Loss) Recognized inIncome on Derivatives
Unrealized Gain (Loss) Recognized inAccumulated Other Comprehensive Income
on DerivativesInterest rate products Interest expense $ (1,647) $ 1,277 $ (9,258) $ (3,293)
NON-DESIGNATED HEDGES
The Company does not use derivatives for trading or speculative purposes. Derivatives not designated as hedges are not speculative and primarily result from aservice the Company provides to certain customers. The Company executes interest rate derivatives with its commercial banking customers to facilitate theirrespective risk management strategies. Those derivatives are simultaneously and economically hedged by offsetting derivatives that the Company executes with athird party, such that the Company eliminates its interest rate exposure resulting from such transactions. Changes in the fair value of derivatives not designated inhedging relationships are recorded directly in earnings. As of September 30, 2020, the Company had interest rate derivative transactions with an aggregate notionalamount of $3.52 billion related to this program.
(1)
(1)
35
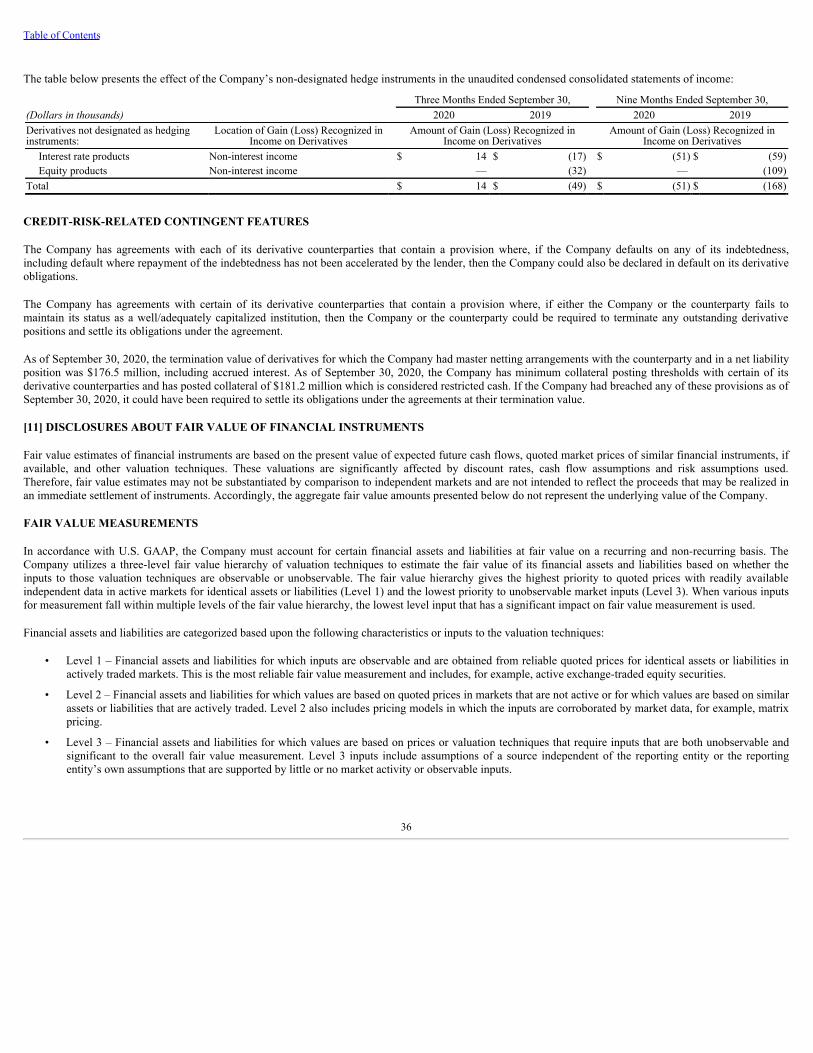
Table of Contents
The table below presents the effect of the Company’s non-designated hedge instruments in the unaudited condensed consolidated statements of income:
Three Months Ended September 30, Nine Months Ended September 30,(Dollars in thousands) 2020 2019 2020 2019Derivatives not designated as hedginginstruments:
Location of Gain (Loss) Recognized inIncome on Derivatives
Amount of Gain (Loss) Recognized inIncome on Derivatives
Amount of Gain (Loss) Recognized inIncome on Derivatives
Interest rate products Non-interest income $ 14 $ (17) $ (51) $ (59)Equity products Non-interest income — (32) — (109)
Total $ 14 $ (49) $ (51) $ (168)
CREDIT-RISK-RELATED CONTINGENT FEATURES
The Company has agreements with each of its derivative counterparties that contain a provision where, if the Company defaults on any of its indebtedness,including default where repayment of the indebtedness has not been accelerated by the lender, then the Company could also be declared in default on its derivativeobligations.
The Company has agreements with certain of its derivative counterparties that contain a provision where, if either the Company or the counterparty fails tomaintain its status as a well/adequately capitalized institution, then the Company or the counterparty could be required to terminate any outstanding derivativepositions and settle its obligations under the agreement.
As of September 30, 2020, the termination value of derivatives for which the Company had master netting arrangements with the counterparty and in a net liabilityposition was $176.5 million, including accrued interest. As of September 30, 2020, the Company has minimum collateral posting thresholds with certain of itsderivative counterparties and has posted collateral of $181.2 million which is considered restricted cash. If the Company had breached any of these provisions as ofSeptember 30, 2020, it could have been required to settle its obligations under the agreements at their termination value.
[11] DISCLOSURES ABOUT FAIR VALUE OF FINANCIAL INSTRUMENTS
Fair value estimates of financial instruments are based on the present value of expected future cash flows, quoted market prices of similar financial instruments, ifavailable, and other valuation techniques. These valuations are significantly affected by discount rates, cash flow assumptions and risk assumptions used.Therefore, fair value estimates may not be substantiated by comparison to independent markets and are not intended to reflect the proceeds that may be realized inan immediate settlement of instruments. Accordingly, the aggregate fair value amounts presented below do not represent the underlying value of the Company.
FAIR VALUE MEASUREMENTS
In accordance with U.S. GAAP, the Company must account for certain financial assets and liabilities at fair value on a recurring and non-recurring basis. TheCompany utilizes a three-level fair value hierarchy of valuation techniques to estimate the fair value of its financial assets and liabilities based on whether theinputs to those valuation techniques are observable or unobservable. The fair value hierarchy gives the highest priority to quoted prices with readily availableindependent data in active markets for identical assets or liabilities (Level 1) and the lowest priority to unobservable market inputs (Level 3). When various inputsfor measurement fall within multiple levels of the fair value hierarchy, the lowest level input that has a significant impact on fair value measurement is used.
Financial assets and liabilities are categorized based upon the following characteristics or inputs to the valuation techniques:
• Level 1 – Financial assets and liabilities for which inputs are observable and are obtained from reliable quoted prices for identical assets or liabilities inactively traded markets. This is the most reliable fair value measurement and includes, for example, active exchange-traded equity securities.
• Level 2 – Financial assets and liabilities for which values are based on quoted prices in markets that are not active or for which values are based on similarassets or liabilities that are actively traded. Level 2 also includes pricing models in which the inputs are corroborated by market data, for example, matrixpricing.
• Level 3 – Financial assets and liabilities for which values are based on prices or valuation techniques that require inputs that are both unobservable andsignificant to the overall fair value measurement. Level 3 inputs include assumptions of a source independent of the reporting entity or the reportingentity’s own assumptions that are supported by little or no market activity or observable inputs.
36

Table of Contents
The Company is responsible for the valuation process and as part of this process may use data from outside sources in establishing fair value. The Companyperforms due diligence to understand the inputs used or how the data was calculated or derived and corroborates the reasonableness of external inputs in thevaluation process.
RECURRING FAIR VALUE MEASUREMENTS
The following tables represent assets and liabilities measured at fair value on a recurring basis as of September 30, 2020 and December 31, 2019:
September 30, 2020
(Dollars in thousands) Level 1 Level 2 Level 3
Total Assets / Liabilities
at Fair ValueFinancial assets:
Debt securities available-for-sale:Corporate bonds $ — $ 176,137 $ — $ 176,137 Trust preferred securities — 17,726 — 17,726 Agency collateralized mortgage obligations — 22,954 — 22,954 Agency mortgage-backed securities — 326,824 — 326,824 Agency debentures — 9,257 — 9,257
Interest rate swaps — 166,153 — 166,153 Total financial assets — 719,051 — 719,051
Financial liabilities:Interest rate swaps — 176,480 — 176,480
Total financial liabilities $ — $ 176,480 $ — $ 176,480
December 31, 2019
(Dollars in thousands) Level 1 Level 2 Level 3
Total Assets / Liabilities
at Fair ValueFinancial assets:
Debt securities available-for-sale:Corporate bonds $ — $ 175,418 $ — $ 175,418 Trust preferred securities — 18,260 — 18,260 Agency collateralized mortgage obligations — 27,193 — 27,193 Agency mortgage-backed securities — 18,509 — 18,509 Agency debentures — 9,402 — 9,402
Interest rate swaps — 55,241 — 55,241 Total financial assets — 304,023 — 304,023
Financial liabilities:Interest rate swaps — 57,473 — 57,473
Total financial liabilities $ — $ 57,473 $ — $ 57,473
INVESTMENT SECURITIESGenerally, debt securities are valued using pricing for similar securities, recently executed transactions, and other pricing models utilizing observable inputsand therefore are classified as Level 2.
INTEREST RATE SWAPSThe fair value of interest rate swaps is estimated using inputs that are observable or that can be corroborated by observable market data and therefore areclassified as Level 2. These fair value estimations include primarily market observable inputs such as the forward LIBOR swap curve or its ongoingreplacement.
37

Table of Contents
NON-RECURRING FAIR VALUE MEASUREMENTS
Certain financial assets and financial liabilities are measured at fair value on a non-recurring basis; that is, the instruments are not measured at fair value on anongoing basis but are subject to fair value adjustments in certain circumstances, such as when there is evidence of impairment.
The following tables represent the balances of assets measured at fair value on a non-recurring basis as of September 30, 2020 and December 31, 2019:
September 30, 2020
(Dollars in thousands) Level 1 Level 2 Level 3Total Assets at Fair Value
Loans measured for impairment, net $ — $ — $ 5,234 $ 5,234 Other real estate owned — — 2,724 2,724 Total assets $ — $ — $ 7,958 $ 7,958
December 31, 2019
(Dollars in thousands) Level 1 Level 2 Level 3Total Assets at Fair Value
Loans measured for impairment, net $ — $ — $ 13 $ 13 Other real estate owned — — 4,250 4,250 Total assets $ — $ — $ 4,263 $ 4,263
As of September 30, 2020 and December 31, 2019, the Company recorded $1.5 million and $171,000, respectively, of specific reserves to allowance for loan andlease losses as a result of adjusting the fair value of impaired loans.
IMPAIRED LOANSA loan is considered impaired when management determines it is probable that all of the principal and interest due under the original terms of the loan may notbe collected or if a loan is designated as a TDR. Impairment is measured based on a discounted cash flow of ongoing operations, discounted at the loan’soriginal effective interest rate, or a calculation of the fair value of the underlying collateral less estimated selling costs. Our policy is to obtain appraisals oncollateral supporting impaired loans on an annual basis, unless circumstances dictate a shorter time frame. Appraisals are reduced by estimated costs to sell thecollateral, and, under certain circumstances, additional factors that may arise and cause us to believe our recoverable value may be less than the independentappraised value. Accordingly, impaired loans are classified as Level 3. The Company measures impairment on all loans as part of the allowance for loan andlease losses.
OTHER REAL ESTATE OWNEDOREO is comprised of property acquired through foreclosure or voluntarily conveyed by borrowers. These assets are recorded on the date acquired at fairvalue, less estimated disposition costs, with the fair value being determined by appraisal. Our policy is to obtain appraisals on collateral supporting OREO onan annual basis, unless circumstances dictate a shorter time frame. Appraisals are reduced by estimated costs to sell the collateral and, under certaincircumstances, additional factors that may arise and cause us to believe our recoverable value may be less than the independent appraised value. Accordingly,OREO is classified as Level 3.
38
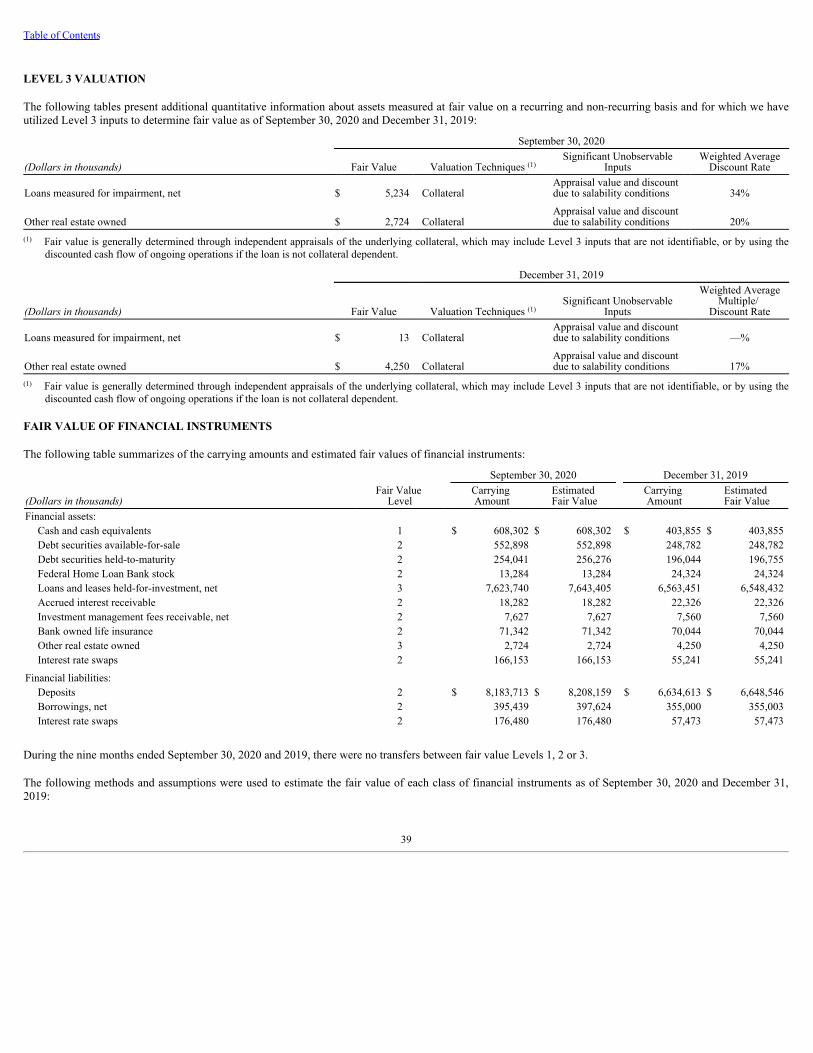
Table of Contents
LEVEL 3 VALUATION
The following tables present additional quantitative information about assets measured at fair value on a recurring and non-recurring basis and for which we haveutilized Level 3 inputs to determine fair value as of September 30, 2020 and December 31, 2019:
September 30, 2020
(Dollars in thousands) Fair Value Valuation Techniques Significant Unobservable
InputsWeighted Average
Discount Rate
Loans measured for impairment, net $ 5,234 CollateralAppraisal value and discountdue to salability conditions 34%
Other real estate owned $ 2,724 CollateralAppraisal value and discountdue to salability conditions 20%
Fair value is generally determined through independent appraisals of the underlying collateral, which may include Level 3 inputs that are not identifiable, or by using thediscounted cash flow of ongoing operations if the loan is not collateral dependent.
December 31, 2019
(Dollars in thousands) Fair Value Valuation Techniques Significant Unobservable
Inputs
Weighted AverageMultiple/
Discount Rate
Loans measured for impairment, net $ 13 CollateralAppraisal value and discountdue to salability conditions —%
Other real estate owned $ 4,250 CollateralAppraisal value and discountdue to salability conditions 17%
Fair value is generally determined through independent appraisals of the underlying collateral, which may include Level 3 inputs that are not identifiable, or by using thediscounted cash flow of ongoing operations if the loan is not collateral dependent.
FAIR VALUE OF FINANCIAL INSTRUMENTS
The following table summarizes of the carrying amounts and estimated fair values of financial instruments:
September 30, 2020 December 31, 2019
(Dollars in thousands)Fair Value
LevelCarrying Amount
Estimated Fair Value
Carrying Amount
Estimated Fair Value
Financial assets:Cash and cash equivalents 1 $ 608,302 $ 608,302 $ 403,855 $ 403,855 Debt securities available-for-sale 2 552,898 552,898 248,782 248,782 Debt securities held-to-maturity 2 254,041 256,276 196,044 196,755 Federal Home Loan Bank stock 2 13,284 13,284 24,324 24,324 Loans and leases held-for-investment, net 3 7,623,740 7,643,405 6,563,451 6,548,432 Accrued interest receivable 2 18,282 18,282 22,326 22,326 Investment management fees receivable, net 2 7,627 7,627 7,560 7,560 Bank owned life insurance 2 71,342 71,342 70,044 70,044 Other real estate owned 3 2,724 2,724 4,250 4,250 Interest rate swaps 2 166,153 166,153 55,241 55,241
Financial liabilities:Deposits 2 $ 8,183,713 $ 8,208,159 $ 6,634,613 $ 6,648,546 Borrowings, net 2 395,439 397,624 355,000 355,003 Interest rate swaps 2 176,480 176,480 57,473 57,473
During the nine months ended September 30, 2020 and 2019, there were no transfers between fair value Levels 1, 2 or 3.
The following methods and assumptions were used to estimate the fair value of each class of financial instruments as of September 30, 2020 and December 31,2019:
(1)
(1)
(1)
(1)
39

Table of Contents
CASH AND CASH EQUIVALENTSThe carrying amount approximates fair value.
INVESTMENT SECURITIESThe fair values of debt securities available-for-sale, debt securities held-to-maturity, debt securities trading and equity securities are based on quoted marketprices for the same or similar securities, recently executed transactions and pricing models.
FEDERAL HOME LOAN BANK STOCKThe carrying value of our FHLB stock, which is carried at cost, approximates fair value.
LOANS AND LEASES HELD-FOR-INVESTMENTThe fair value of loans and leases held-for-investment is estimated by discounting the future cash flows using market rates (utilizing both unobservable andcertain observable inputs when applicable) at which similar loans would be made to borrowers with similar credit ratings over the estimated remainingmaturities. Impaired loans are generally valued at the fair value of the associated collateral.
ACCRUED INTEREST RECEIVABLEThe carrying amount approximates fair value.
INVESTMENT MANAGEMENT FEES RECEIVABLEThe carrying amount approximates fair value.
BANK OWNED LIFE INSURANCEThe fair value of the general account BOLI is based on the insurance contract net cash surrender value.
OTHER REAL ESTATE OWNEDOREO is recorded at fair value, less estimated disposition costs, with the fair value being determined by appraisal.
DEPOSITSThe fair value of demand deposits is the amount payable on demand as of the reporting date, i.e., their carrying amounts. The fair value of fixed maturitydeposits is estimated using a discounted cash flow calculation that applies the rates currently offered for deposits of similar remaining maturities.
BORROWINGSThe fair value of borrowings is calculated by discounting scheduled cash flows through the estimated maturity using period end market rates for borrowings ofsimilar remaining maturities.
INTEREST RATE SWAPSThe fair value of interest rate swaps is estimated through the assistance of an independent third party and compared to the fair value determined by the swapcounterparty to establish reasonableness.
OFF-BALANCE SHEET INSTRUMENTSFair values for the Company’s off-balance sheet instruments, which consist of unfunded lending commitments, demand lines of credit, standby letters of creditand risk participation agreements related to interest rate swap agreements, are based on fees currently charged to enter into similar agreements, taking intoaccount the remaining terms of the agreements and the counterparties’ credit standing. Management believes that the fair value of these off-balance sheetinstruments is not significant.
40
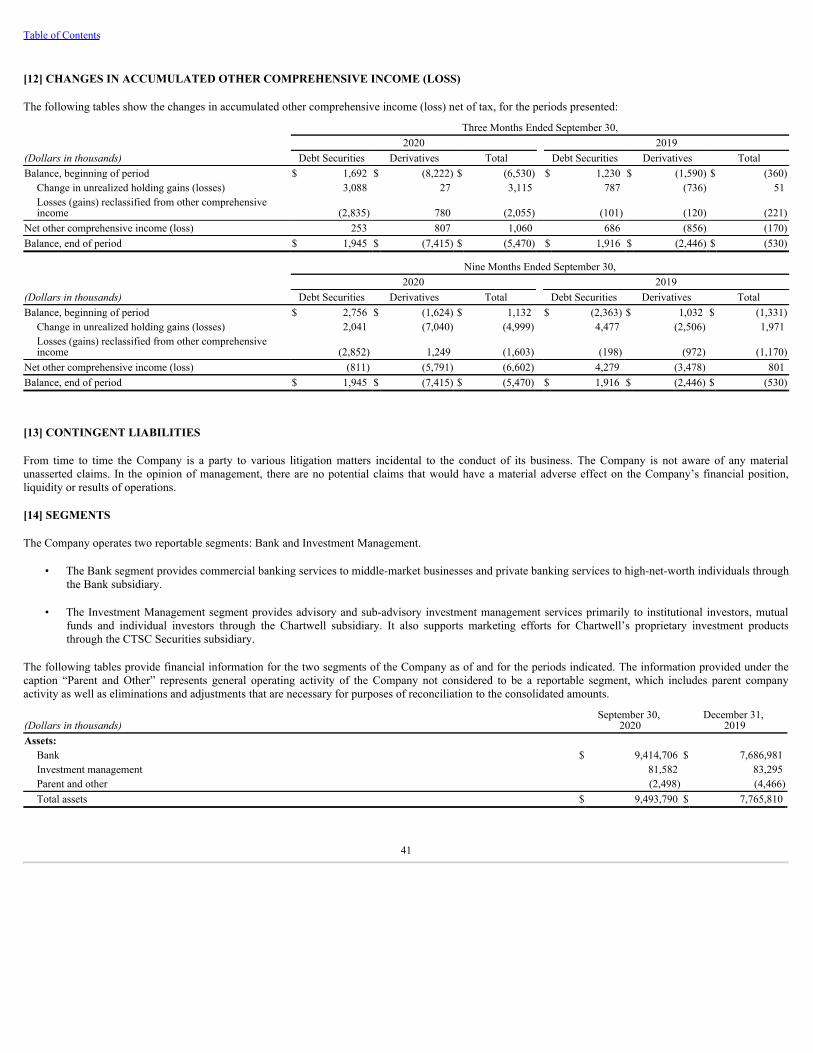
Table of Contents
[12] CHANGES IN ACCUMULATED OTHER COMPREHENSIVE INCOME (LOSS)
The following tables show the changes in accumulated other comprehensive income (loss) net of tax, for the periods presented:
Three Months Ended September 30,2020 2019
(Dollars in thousands) Debt Securities Derivatives Total Debt Securities Derivatives TotalBalance, beginning of period $ 1,692 $ (8,222) $ (6,530) $ 1,230 $ (1,590) $ (360)
Change in unrealized holding gains (losses) 3,088 27 3,115 787 (736) 51 Losses (gains) reclassified from other comprehensiveincome (2,835) 780 (2,055) (101) (120) (221)
Net other comprehensive income (loss) 253 807 1,060 686 (856) (170)Balance, end of period $ 1,945 $ (7,415) $ (5,470) $ 1,916 $ (2,446) $ (530)
Nine Months Ended September 30,2020 2019
(Dollars in thousands) Debt Securities Derivatives Total Debt Securities Derivatives TotalBalance, beginning of period $ 2,756 $ (1,624) $ 1,132 $ (2,363) $ 1,032 $ (1,331)
Change in unrealized holding gains (losses) 2,041 (7,040) (4,999) 4,477 (2,506) 1,971 Losses (gains) reclassified from other comprehensiveincome (2,852) 1,249 (1,603) (198) (972) (1,170)
Net other comprehensive income (loss) (811) (5,791) (6,602) 4,279 (3,478) 801 Balance, end of period $ 1,945 $ (7,415) $ (5,470) $ 1,916 $ (2,446) $ (530)
[13] CONTINGENT LIABILITIES
From time to time the Company is a party to various litigation matters incidental to the conduct of its business. The Company is not aware of any materialunasserted claims. In the opinion of management, there are no potential claims that would have a material adverse effect on the Company’s financial position,liquidity or results of operations.
[14] SEGMENTS
The Company operates two reportable segments: Bank and Investment Management.
• The Bank segment provides commercial banking services to middle-market businesses and private banking services to high-net-worth individuals throughthe Bank subsidiary.
• The Investment Management segment provides advisory and sub-advisory investment management services primarily to institutional investors, mutualfunds and individual investors through the Chartwell subsidiary. It also supports marketing efforts for Chartwell’s proprietary investment productsthrough the CTSC Securities subsidiary.
The following tables provide financial information for the two segments of the Company as of and for the periods indicated. The information provided under thecaption “Parent and Other” represents general operating activity of the Company not considered to be a reportable segment, which includes parent companyactivity as well as eliminations and adjustments that are necessary for purposes of reconciliation to the consolidated amounts.
(Dollars in thousands)September 30,
2020December 31,
2019Assets:
Bank $ 9,414,706 $ 7,686,981 Investment management 81,582 83,295 Parent and other (2,498) (4,466)Total assets $ 9,493,790 $ 7,765,810
41

Table of Contents
Three Months Ended September 30, 2020 Three Months Ended September 30, 2019
(Dollars in thousands) BankInvestment
ManagementParent
and Other Consolidated BankInvestment
ManagementParent
and Other ConsolidatedIncome statement data:
Interest income $ 50,222 $ — $ — $ 50,222 $ 67,720 $ — $ 12 $ 67,732 Interest expense 15,297 — 1,451 16,748 35,455 — (39) 35,416 Net interest income (loss) 34,925 — (1,451) 33,474 32,265 — 51 32,316 Provision (credit) for loan and lease losses 7,430 — — 7,430 (607) — — (607)Net interest income (loss) after provisionfor loan and lease losses 27,495 — (1,451) 26,044 32,872 — 51 32,923 Non-interest income:Investment management fees — 8,293 (198) 8,095 — 9,016 (114) 8,902 Net gain on the sale and call of debtsecurities 3,744 — — 3,744 206 — — 206 Other non-interest income 5,027 23 — 5,050 5,113 (9) 31 5,135
Total non-interest income (loss) 8,771 8,316 (198) 16,889 5,319 9,007 (83) 14,243 Non-interest expense:Intangible amortization expense — 478 — 478 — 502 — 502 Other non-interest expense 23,462 6,868 619 30,949 18,949 8,186 136 27,271
Total non-interest expense 23,462 7,346 619 31,427 18,949 8,688 136 27,773 Income (loss) before tax 12,804 970 (2,268) 11,506 19,242 319 (168) 19,393 Income tax expense (benefit) 2,357 251 (431) 2,177 3,142 3 (86) 3,059 Net income (loss) $ 10,447 $ 719 $ (1,837) $ 9,329 $ 16,100 $ 316 $ (82) $ 16,334
Nine Months Ended September 30, 2020 Nine Months Ended September 30, 2019
(Dollars in thousands) BankInvestment
ManagementParent
and Other Consolidated BankInvestment
ManagementParent
and Other ConsolidatedIncome statement data:
Interest income $ 166,085 $ — $ — $ 166,085 $ 196,862 $ — $ 111 $ 196,973 Interest expense 61,844 — 2,361 64,205 101,891 — 1,091 102,982 Net interest income (loss) 104,241 — (2,361) 101,880 94,971 — (980) 93,991 Provision (credit) for loan and lease losses 16,428 — — 16,428 (1,696) — — (1,696)Net interest income (loss) after provisionfor loan and lease losses 87,813 — (2,361) 85,452 96,667 — (980) 95,687 Non-interest income:Investment management fees — 23,955 (484) 23,471 — 27,912 (332) 27,580 Net gain on the sale and call of debtsecurities 3,815 — — 3,815 346 — — 346 Other non-interest income 15,893 23 — 15,916 10,467 17 881 11,365
Total non-interest income (loss) 19,708 23,978 (484) 43,202 10,813 27,929 549 39,291 Non-interest expense:Intangible amortization expense — 1,466 — 1,466 — 1,506 — 1,506 Other non-interest expense 64,462 20,498 2,242 87,202 56,872 23,174 478 80,524
Total non-interest expense 64,462 21,964 2,242 88,668 56,872 24,680 478 82,030 Income (loss) before tax 43,059 2,014 (5,087) 39,986 50,608 3,249 (909) 52,948 Income tax expense (benefit) 7,878 381 (897) 7,362 6,825 830 (296) 7,359 Net income (loss) $ 35,181 $ 1,633 $ (4,190) $ 32,624 $ 43,783 $ 2,419 $ (613) $ 45,589
42

Table of Contents
[15] SUBSEQUENT EVENTS
On October 10, 2020, the Company entered into an Investment Agreement with T-VIII PubOpps LP (“T-VIII PubOpps”), an affiliate of investment funds managedby Stone Point Capital LLC. The Company agreed to issue and sell in a private placement to T-VIII PubOpps (i) 2,770,083 shares of common stock for$40.0 million, (ii) 650 shares of Series C Perpetual Non-Cumulative Convertible Preferred Stock (the “Series C Preferred Stock”) for $65.0 million, and (iii)warrants to purchase up to 922,438 shares of a future series of non-voting common stock or, in certain cases subject to certain voting ownership restrictions, votingcommon stock at an exercise price of $17.50 per share. The Series C Preferred Stock will have a liquidation preference of $100,000 per share, will pay a quarterlydividend at an annualized rate of 6.75% and, subject to shareholder approval, will be convertible into 4,727,273 shares of common stock of a future series of non-voting common stock or, in certain cases subject to certain voting ownership restrictions, voting common stock. A total of 8,419,794 shares of common stockreferenced above will be issued or convertible and included in the computation of earnings per share as contemplated by the transaction. The Company expects toreceive gross proceeds of $105.0 million, and up to an additional $16.1 million if the warrants are exercised in full. The closing of the transaction is conditioned oncustomary closing conditions, including the Pennsylvania Department of Banking and Securities approving the transaction or confirming that no such approval isrequired. The Company expects to complete the transaction in the fourth quarter of 2020.
On October 13, 2020, the Board declared a dividend payable of approximately $679,000, or $0.42 per depositary share, on the Company’s Series A Preferred Stockand a dividend payable of approximately $1.3 million, or $0.40 per depositary share, on the Company’s Series B Preferred Stock, each of which is payable onJanuary 4, 2021, to preferred shareholders of record as of the close of business on December 15, 2020.
43

Table of Contents
ITEM 2. MANAGEMENT’S DISCUSSION AND ANALYSIS OF FINANCIAL CONDITION AND RESULTS OF OPERATIONS
This section presents management’s perspective on our financial condition and results of operations and highlights material changes to our financial conditionand results of operations as of and for the three and nine months ended September 30, 2020. The following discussion and analysis should be read in conjunctionwith our unaudited condensed consolidated financial statements and related notes contained in Item 1 of this quarterly report and our consolidated financialstatements and notes thereto and Management’s Discussion and Analysis of Financial Condition and Results of Operations for the fiscal year ended December 31,2019, included in the Company’s Annual Report on Form 10-K, which was filed with the Securities and Exchange Commission (the “SEC”) on February 24, 2020.
To the extent that this discussion describes prior performance, the descriptions relate only to the periods listed, which may not be indicative of our future financialoutcomes. In addition to historical information, this discussion contains forward-looking statements that involve risks, uncertainties and assumptions that couldcause results to differ materially from management’s expectations. Factors that could cause such differences are discussed in the sections titled “Cautionary NoteRegarding Forward-Looking Statements” at the beginning of this document and “Item 1A. Risk Factors.”
General
We are a bank holding company that operates through two reportable segments: Bank and Investment Management. Through TriState Capital Bank, aPennsylvania chartered bank (the “Bank”), the Bank segment provides commercial banking services to middle-market and financial services businesses and privatebanking services to high-net-worth individuals and trusts. The Bank segment generates most of its revenue from interest on loans and investments, swap fees, loanfees, and liquidity and treasury management related fees. Its primary source of funding for loans is deposits and its secondary source of funding is borrowings. TheBank’s largest expenses are interest on these deposits and borrowings, and salaries and related employee benefits. Through Chartwell Investment Partners, LLC, anSEC-registered investment adviser (“Chartwell”), the Investment Management segment provides advisory and sub-advisory investment management servicesprimarily to institutional investors, mutual funds and individual investors. It also supports marketing efforts for Chartwell’s proprietary investment productsthrough Chartwell TSC Securities Corp., our registered broker/dealer subsidiary (“CTSC Securities”). The Investment Management segment generates its revenuefrom investment management fees earned on assets under management, and its largest expenses are salaries and related employee benefits.
This discussion and analysis presents our financial condition and results of operations on a consolidated basis, except where significant segment disclosures arenecessary to better explain the operations of each segment and related variances. In particular, the discussion and analysis of non-interest income and non-interestexpense is reported by segment.
We measure our performance primarily through our net income available to common shareholders, earnings per common share (“EPS”) and total revenue (which isa non-GAAP financial measure). Other salient metrics include the ratio of allowance for loan and lease losses to loans; net interest margin; the efficiency ratio ofthe Bank segment; return on average assets; return on average common equity; regulatory leverage and risk-based capital ratios, assets under management andEBITDA of the Investment Management segment.
Executive Overview
TriState Capital Holdings, Inc. (“we,” “us,” “our,” the “holding company,” the “parent company,” or the “Company”) is a bank holding company headquartered inPittsburgh, Pennsylvania. The Company has three wholly owned subsidiaries: the Bank, Chartwell and CTSC Securities. Through the Bank, we serve middle-market and financial services businesses in our primary markets throughout the states of Pennsylvania, Ohio, New Jersey and New York. We also serve high-net-worth individuals and trusts on a national basis through our private banking channel. We market and distribute our products and services through a scalable,branchless banking model, which creates significant operating leverage throughout our business as we continue to grow. Through Chartwell, our investmentmanagement subsidiary, we provide investment management services primarily to institutional investors, mutual funds and individual investors on a national basis.Chartwell’s assets under management were $9.65 billion as of September 30, 2020. CTSC Securities, our broker/dealer subsidiary, supports marketing efforts forChartwell’s proprietary investment products that require SEC or Financial Industry Regulatory Authority, Inc. (“FINRA”) licensing.
Recent Business Developments
On October 10, 2020, we entered into an Investment Agreement (the “Investment Agreement”) with T-VIII PubOpps LP (“T-VIII PubOpps”), an affiliate ofinvestment funds managed by Stone Point Capital LLC. The Company agreed to issue and sell in a private placement to T-VIII PubOpps (i) 2,770,083 shares ofcommon stock for $40.0 million, (ii) 650 shares of Series C Perpetual Non-Cumulative Convertible Preferred Stock (the “Series C Preferred Stock”) for$65.0 million (iii) warrants to purchase up to 922,438
44

Table of Contents
shares of a future series of non-voting common stock or, in certain cases subject to certain voting ownership restrictions, voting common stock at an exercise priceof $17.50 per share. The Series C Preferred Stock will have a liquidation preference of $100,000 per share, will pay a quarterly dividend at an annualized rate of6.75% and, subject to shareholder approval, will be convertible into 4,727,273 shares of common stock of a future series of non-voting common stock or, in certaincases subject to certain voting ownership restrictions, voting common stock. A total of 8,419,794 shares of common stock referenced above will be issued orconvertible and included in the computation of earnings per share as contemplated by the transaction. The Company expects to receive gross proceeds of$105.0 million, and up to an additional $16.1 million if the warrants are exercised in full. The closing of the transaction is conditioned on customary closingconditions, including the Pennsylvania Department of Banking and Securities approving the transaction or confirming that no such approval is required. TheCompany expects to complete the transaction in the fourth quarter of 2020.
Developments Related to COVID-19
In March 2020, the World Health Organization declared the outbreak of the novel coronavirus (“COVID-19”) as a global pandemic. This public health crisis hasresulted in unprecedented uncertainty, volatility and disruption in financial markets and in governmental, commercial and consumer activity in the United Statesand globally, including the markets that we serve. In responses to the crisis, the Board of Governors of the Federal Reserve (the “Federal Reserve”) cut interestrates to near zero. In addition, in March 2020, the Coronavirus Aid, Relief, and Economic Security (“CARES”) Act was enacted. The CARES Act containssubstantial tax and spending provisions intended to address the impact of the COVID-19 pandemic.
At the onset of the pandemic, we pro-actively conducted outreach to all commercial loan customers to understand the potential impact that COVID-19 could haveon their business. Through September 2020, we implemented deferral arrangements in accordance with the CARES Act and bank regulatory guidance thatrepresent about 6% of our loan and lease portfolio. Just under half, or $223.8 million of these loans have already started resuming payment which was ahead of ourprevious forecasts. While this crisis may have substantial impact on many businesses, we have maintained our disciplined approach of focusing on commerciallending opportunities within our four-state Mid-Atlantic region and financial services companies where our team has deep experience and relationships.Additionally, we have worked to keep our commercial loan sizes predominately below our preferred hold level of $10.0 million. The Bank is not a qualified lenderor additional lender registered with the Small Business Administration and is not participating in the Paycheck Protection Program, established by the CARES Act.We have also deliberately increased our balance sheet liquidity to provide for potential or unforeseen needs of our clients’ during this public health and economiccrisis and increased our allowance for loan and lease losses due to the economic uncertainty surrounding COVID-19.
Performance
For the three months ended September 30, 2020, our net income available to common shareholders was $7.4 million compared to $14.4 million for the same periodin 2019, a decrease of $7.0 million, or 48.7%. The decrease was due to the following: An increase in net interest income of $1.2 million, or 3.6%; an increase innon-interest income of $2.6 million, or 18.6%; a decrease of $882,000 in income tax expense; more than offset by higher provision for loan and lease losses of $8.0million and an increase of $3.7 million, or 13.2%, in non-interest expense.
For the nine months ended September 30, 2020, our net income available to common shareholders was $26.7 million compared to $41.8 million for the sameperiod in 2019, a decrease of $15.1 million, or 36.0%. The decrease was due to the following: An increase in net interest income of $7.9 million, or 8.4%; anincrease in non-interest income of $3.9 million, or 10.0%; more than offset by higher provision for loan and lease losses of $18.1 million; an increase of $6.6million, or 8.1%, in non-interest expense; and an increase in preferred stock dividends of $2.1 million.
Our diluted EPS was $0.26 for the three months ended September 30, 2020, compared to $0.50 for the same period in 2019, and $0.93 for the nine months endedSeptember 30, 2020, compared to $1.45 for the same period in 2019. The decrease in diluted EPS for the nine months ended September 30, 2020, was a result of adecline in our net income available to common shareholders.
For the three months ended September 30, 2020, total revenue increased $266,000, or 0.6%, to $46.6 million from $46.4 million for the same period in 2019. Forthe nine months ended September 30, 2020, total revenue increased $8.3 million, or 6.3%, to $141.3 million from $132.9 million for the same period in 2019. Theincrease in total revenue for the nine months ended September 30, 2020, was driven largely by higher net interest income and swap fees for the Bank, both drivenby loan growth, partially offset by lower investment management fees.
Our annualized net interest margin was 1.46% and 1.94% for the three months ended September 30, 2020 and 2019, respectively, and 1.60% and 2.02% for thenine months ended September 30, 2020 and 2019, respectively. The decrease in net interest margin for the three months ended September 30, 2020, was driven bya decrease of 174 basis points in the yield on loans, partially offset by a decrease of 157 basis points in the cost of interest-bearing liabilities. The decrease in netinterest margin for the nine months ended
45

Table of Contents
September 30, 2020, was driven by a decrease of 149 basis points in the yield on loans, partially offset by a decrease of 135 basis points in the cost of interest-bearing liabilities.
The significant reduction in interest rates by the Federal Reserve in response to the COVID-19 pandemic impacted our interest-earning assets and interest-bearingliabilities. Our loans are predominantly variable rate loans indexed to 1-month LIBOR. At the end of the first quarter 2020, we placed interest rate floors on manyof these floating rate loans, particularly for private banking loans. Our deposits are a combination of fixed-rate time deposits and variable rate deposits, many ofwhich are indexed to the Effective Federal Funds Rate and others that are priced at the Bank’s discretion. The majority of the floating rate deposits were repriced inMarch in line with the Federal Reserve rate reduction. In addition, we intentionally increased our liquid assets for the express purpose of carrying more on balancesheet liquidity in anticipation of clients’ needs during the COVID-19 pandemic. These carrying costs resulted in marginally lower returns based on the interest rateenvironment.
Our non-interest income is largely comprised of investment management fees for Chartwell, which totaled $8.1 million for the three months ended September 30,2020, as compared to $8.9 million for the same period in 2019, and $23.5 million for the nine months ended September 30, 2020, as compared to $27.6 million forthe same period in 2019. Assets under management were $9.65 billion as of September 30, 2020, an increase of $38.0 million from September 30, 2019, driven bynet inflows of $71.0 million, partially offset by market depreciation of $33.0 million.
Another large component of our non-interest income are swap fees at the Bank, which totaled $4.0 million for the three months ended September 30, 2020, ascompared to $4.2 million for the same period in 2019, and $12.2 million for the nine months ended September 30, 2020, as compared to $7.7 million for the sameperiod in 2019. The increase in swap fees for the nine months ended September 30, 2020 was due to an increase of customer swap transactions from both new andexisting customers.
We recorded a $3.7 million net gain on the sale and call of debt securities during the three months ended September 30, 2020, compared to primarily attributable tothe repositioning of a portion of the corporate bond portfolio into government agency securities to take advantage of market appreciation and enhance the overallquality of the investment portfolio. Net gain on the sale and call of debt securities was $206,000 in the prior year quarter.
Our annualized ratio of non-interest expense to average assets was 1.31% and 1.59% for the three months ended September 30, 2020 and 2019, respectively, and1.33% and 1.69% for the nine months ended September 30, 2020 and 2019, respectively. The Bank’s efficiency ratio was 58.73% and 50.70% for the three monthsended September 30, 2020 and 2019, respectively, and 53.66% and 53.94% for the nine months ended September 30, 2020 and 2019, respectively. The Bank’sefficiency ratio reflects growth in the Bank’s total revenue of 13.9% partially offset by the growth in the Bank’s non-interest expense of 13.3% for the nine monthsended September 30, 2020.
Our annualized return on average assets (net income to average total assets) was 0.39% and 0.94% for the three months ended September 30, 2020 and 2019,respectively, and 0.49% and 0.94% for the nine months ended September 30, 2020 and 2019, respectively. Our annualized return on average common equity (netincome available to common shareholders to average common equity) was 5.56% and 11.82% for the three months ended September 30, 2020 and 2019,respectively, and 6.90% and 11.97% for the nine months ended September 30, 2020 and 2019, respectively. Both ratios declined due to a reduction in earningsduring the three and nine months ended September 30, 2020 compared to the same period in 2019.
Our total assets were $9.49 billion as of September 30, 2020, an increase of $1.73 billion, or 29.7% on an annualized basis, from December 31, 2019, primarily dueto an increase in cash and cash equivalents, growth in our loan and lease portfolio and growth in our investment portfolio. Loans and leases held-for-investmentgrew by $1.08 billion to $7.65 billion as of September 30, 2020, an annualized increase of 21.9%, from December 31, 2019, as a result of growth in ourcommercial and private banking loan portfolios. Cash and cash equivalents increased $204.4 million, or 67.6% on an annualized basis, to $608.3 million due to thepreviously mentioned intentional increase in liquid assets. Total investment securities increased $351.1 million, or 100.0% on an annualized basis to $820.2 millionas of September 30, 2020, from December 31, 2019. Total deposits increased $1.55 billion, or 31.2% on an annualized basis, to $8.18 billion as of September 30,2020, from December 31, 2019. We focus only on high quality loan growth and in the absence of this, we increase our assets through cash and cash equivalents aswell as adding to our investment portfolio as part of our strategy to build greater on balance sheet liquidity funded through our deposits.
Our ratio of adverse rated credits to total loans declined to 0.51% at September 30, 2020, from 0.53% at December 31, 2019. Our ratio of allowance for loan andlease losses to loans was 0.40% and 0.21% as of September 30, 2020 and December 31, 2019, respectively. We had provision expense for loan and lease losses of$16.4 million for the nine months ended September 30, 2020, primarily due to an increase in general reserves in response to the unprecedented speed of theeconomic slowdown associated with the COVID-19 pandemic and an increase in specific reserves due to an addition of a non-accrual loan, compared to a credit toprovision of $1.7 million for the nine months ended September 30, 2019.
46

Table of Contents
Our book value per common share increased $0.46 to $17.67 as of September 30, 2020, from $17.21 as of December 31, 2019, largely as a result of net incomeavailable to common shareholders, partially offset by the issuance of restricted stock during the nine months ended September 30, 2020.
CECL Implementation
The CARES Act provided financial institutions with the option to delay the adoption of Accounting Standards Update No. 2016-13, Financial Instruments-CreditLosses, Topic 326: Measurement of Credit Losses on Financial Instruments (“ASU 2016-13”), which requires companies to replace the incurred loss accountingmethod for estimating credit losses with the current expected credit losses (“CECL”) method. Relief from implementation of ASU 2016-13 ends on the earlier ofthe termination date of the national emergency declaration by the President or December 31, 2020. In response to the unprecedented nature of the COVID-19pandemic and uncertainty regarding its duration and ultimate impact on economic activity, we elected to delay our implementation of the CECL accountingstandard. See “Recent Accounting Pronouncements and Developments” for more information on our decision to delay implementation of CECL. We are preparingto implement the CECL accounting standard on December 31, 2020.
Non-GAAP Financial Measures
We report certain financial information determined by methods other than in accordance with GAAP. These non-GAAP financial measures are “tangible commonequity,” “tangible book value per common share,” “tangible assets,” “tangible assets excluding private banking loans,” “tangible common equity ratio,” “tangiblecommon equity ratio excluding private banking loans,” “total revenue,” “pre-tax, pre-provision net revenue,” “efficiency ratio” and “EBITDA.” These non-GAAPfinancial measures are supplemental measures that we believe provide management and our investors with a more detailed understanding of our performance,although these measures are not necessarily comparable to similar measures that may be presented by other companies. These disclosures should not be viewed asa substitute for financial measures in accordance with GAAP.
The non-GAAP financial measures presented herein are calculated as follows:
“Tangible common equity” is defined as common shareholders’ equity reduced by intangible assets, including goodwill. We believe this measure is important tomanagement and investors so that they can better understand and assess changes from period to period in common shareholders’ equity exclusive of changes inintangible assets associated with prior acquisitions. Intangible assets are created when we buy businesses that add relationships and revenue to our Company.Intangible assets have the effect of increasing both equity and assets, while not increasing our tangible equity or tangible assets.
“Tangible book value per common share” is defined as common shareholders’ equity reduced by intangible assets, including goodwill, divided by common sharesoutstanding. We believe this measure is important to many investors who are interested in changes from period to period in book value per common shareexclusive of changes in intangible assets associated with prior acquisitions.
“Tangible assets” is defined as total assets reduced by intangible assets, including goodwill. We believe this measure is important to many investors who areinterested in changes from period to period in total assets exclusive of changes in intangible assets.
“Tangible assets excluding private banking loans” is defined as total assets reduced by intangible assets, including goodwill, and private banking loans. We believethis measure is important to many investors who are interested in changes from period to period in total assets exclusive of changes in intangible assets and privatebanking loans.
“Tangible common equity ratio” is defined as (i) common shareholders’ equity reduced by intangible assets, including goodwill, divided by (ii) total assets reducedby intangible assets, including goodwill. We believe this measure is important to many investors who are interested in changes from period to period in the ratio ofcommon shareholders’ equity to total assets exclusive of changes in intangible assets.
“Tangible common equity ratio excluding private banking loans” is defined as (i) common shareholders’ equity reduced by intangible assets, including goodwill,divided by (ii) total assets reduced by intangible assets, including goodwill, and private banking loans. We believe this measure is important to many investors whoare interested in changes from period to period in the ratio of common shareholders’ equity to total assets exclusive of changes in intangible assets and privatebanking loans.
“EBITDA” is defined as net income before interest expense, income tax expense, depreciation expense and intangible amortization expense. We use EBITDAparticularly to assess the strength of our investment management business. We believe this measure is important because it allows management and investors tobetter assess our investment management performance in relation to our core operating earnings by excluding certain non-cash items and the volatility that isassociated with certain discrete items that are unrelated to our core business.
47
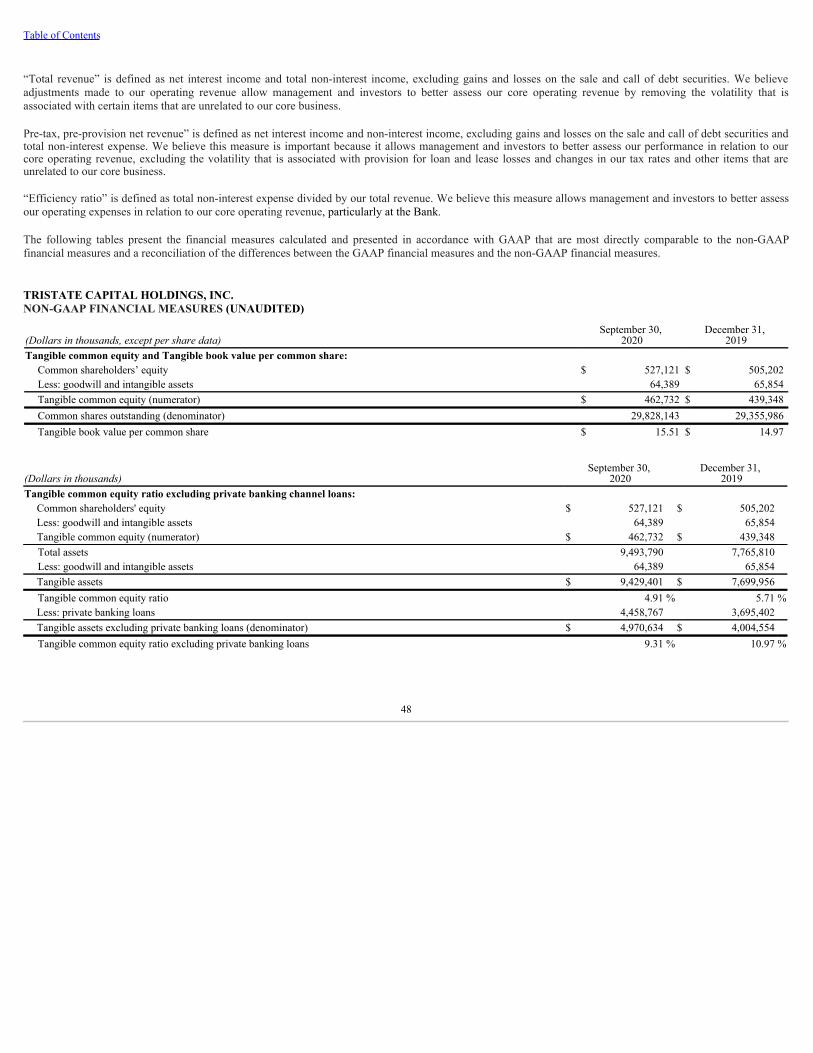
Table of Contents
“Total revenue” is defined as net interest income and total non-interest income, excluding gains and losses on the sale and call of debt securities. We believeadjustments made to our operating revenue allow management and investors to better assess our core operating revenue by removing the volatility that isassociated with certain items that are unrelated to our core business.
Pre-tax, pre-provision net revenue” is defined as net interest income and non-interest income, excluding gains and losses on the sale and call of debt securities andtotal non-interest expense. We believe this measure is important because it allows management and investors to better assess our performance in relation to ourcore operating revenue, excluding the volatility that is associated with provision for loan and lease losses and changes in our tax rates and other items that areunrelated to our core business.
“Efficiency ratio” is defined as total non-interest expense divided by our total revenue. We believe this measure allows management and investors to better assessour operating expenses in relation to our core operating revenue, particularly at the Bank.
The following tables present the financial measures calculated and presented in accordance with GAAP that are most directly comparable to the non-GAAPfinancial measures and a reconciliation of the differences between the GAAP financial measures and the non-GAAP financial measures.
TRISTATE CAPITAL HOLDINGS, INC.NON-GAAP FINANCIAL MEASURES (UNAUDITED)
(Dollars in thousands, except per share data)September 30,
2020December 31,
2019Tangible common equity and Tangible book value per common share:
Common shareholders’ equity $ 527,121 $ 505,202 Less: goodwill and intangible assets 64,389 65,854 Tangible common equity (numerator) $ 462,732 $ 439,348 Common shares outstanding (denominator) 29,828,143 29,355,986 Tangible book value per common share $ 15.51 $ 14.97
(Dollars in thousands)September 30,
2020December 31,
2019Tangible common equity ratio excluding private banking channel loans:
Common shareholders' equity $ 527,121 $ 505,202 Less: goodwill and intangible assets 64,389 65,854 Tangible common equity (numerator) $ 462,732 $ 439,348 Total assets 9,493,790 7,765,810 Less: goodwill and intangible assets 64,389 65,854 Tangible assets $ 9,429,401 $ 7,699,956 Tangible common equity ratio 4.91 % 5.71 %Less: private banking loans 4,458,767 3,695,402 Tangible assets excluding private banking loans (denominator) $ 4,970,634 $ 4,004,554 Tangible common equity ratio excluding private banking loans 9.31 % 10.97 %
48

Table of Contents
TRISTATE CAPITAL HOLDINGS, INC.NON-GAAP FINANCIAL MEASURES (UNAUDITED)
Three Months Ended September 30, Nine Months Ended September 30,(Dollars in thousands) 2020 2019 2020 2019Total revenue and Pre-tax, pre-provision net revenue:
Net interest income $ 33,474 $ 32,316 $ 101,880 $ 93,991 Total non-interest income 16,889 14,243 43,202 39,291 Less: net gain on the sale and call of debt securities 3,744 206 3,815 346 Total revenue $ 46,619 $ 46,353 $ 141,267 $ 132,936 Less: total non-interest expense 31,427 27,773 88,668 82,030 Pre-tax, pre-provision net revenue $ 15,192 $ 18,580 $ 52,599 $ 50,906
BANK SEGMENT
Three Months Ended September 30, Nine Months Ended September 30,(Dollars in thousands) 2020 2019 2020 2019Bank total revenue:
Net interest income $ 34,925 $ 32,265 $ 104,241 $ 94,971 Total non-interest income 8,771 5,319 19,708 10,813 Less: net gain on the sale and call of debt securities 3,744 206 3,815 346 Bank total revenue $ 39,952 $ 37,378 $ 120,134 $ 105,438
Bank efficiency ratio:Total non-interest expense (numerator) $ 23,462 $ 18,949 $ 64,462 $ 56,872 Total revenue (denominator) $ 39,952 $ 37,378 $ 120,134 $ 105,438 Bank efficiency ratio 58.73 % 50.70 % 53.66 % 53.94 %
INVESTMENT MANAGEMENT SEGMENT
Three Months Ended September 30, Nine Months Ended September 30,(Dollars in thousands) 2020 2019 2020 2019Investment Management EBITDA:
Net income $ 719 $ 316 $ 1,633 $ 2,419 Interest expense — — — — Income tax expense 251 3 381 830 Depreciation expense 103 111 319 355 Intangible amortization expense 478 502 1,466 1,506 EBITDA $ 1,551 $ 932 $ 3,799 $ 5,110
49
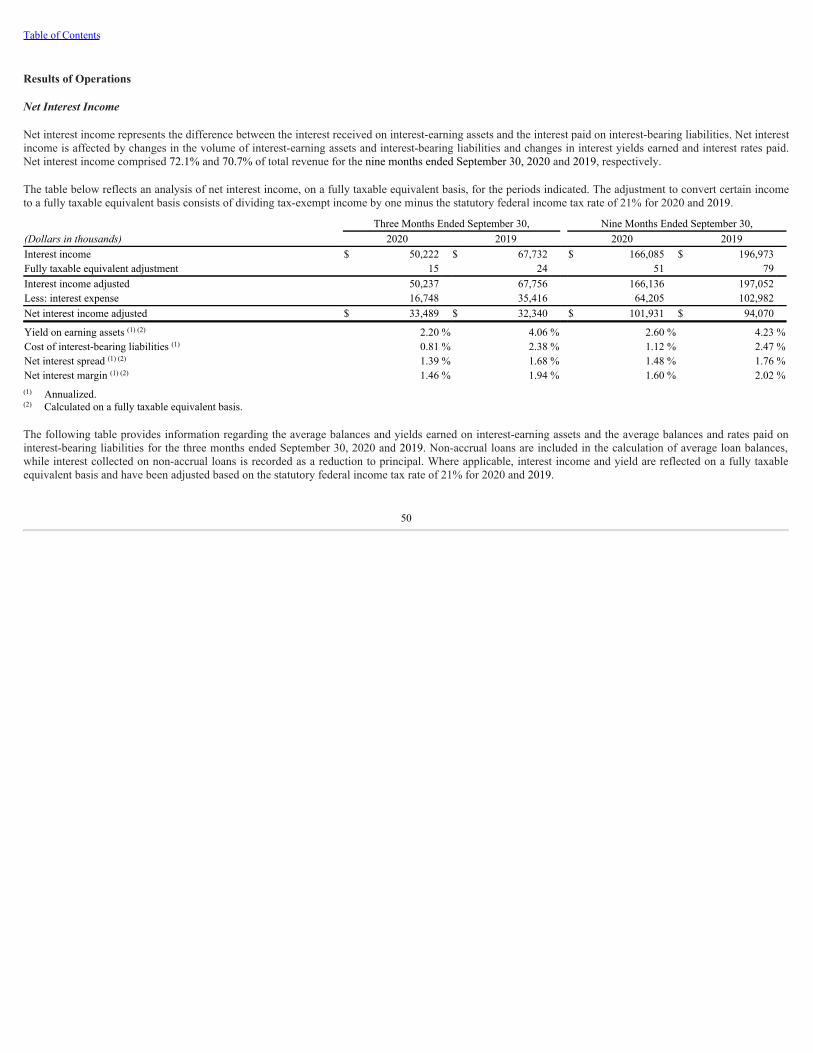
Table of Contents
Results of Operations
Net Interest Income
Net interest income represents the difference between the interest received on interest-earning assets and the interest paid on interest-bearing liabilities. Net interestincome is affected by changes in the volume of interest-earning assets and interest-bearing liabilities and changes in interest yields earned and interest rates paid.Net interest income comprised 72.1% and 70.7% of total revenue for the nine months ended September 30, 2020 and 2019, respectively.
The table below reflects an analysis of net interest income, on a fully taxable equivalent basis, for the periods indicated. The adjustment to convert certain incometo a fully taxable equivalent basis consists of dividing tax-exempt income by one minus the statutory federal income tax rate of 21% for 2020 and 2019.
Three Months Ended September 30, Nine Months Ended September 30,(Dollars in thousands) 2020 2019 2020 2019Interest income $ 50,222 $ 67,732 $ 166,085 $ 196,973 Fully taxable equivalent adjustment 15 24 51 79 Interest income adjusted 50,237 67,756 166,136 197,052 Less: interest expense 16,748 35,416 64,205 102,982 Net interest income adjusted $ 33,489 $ 32,340 $ 101,931 $ 94,070
Yield on earning assets 2.20 % 4.06 % 2.60 % 4.23 %Cost of interest-bearing liabilities 0.81 % 2.38 % 1.12 % 2.47 %Net interest spread 1.39 % 1.68 % 1.48 % 1.76 %Net interest margin 1.46 % 1.94 % 1.60 % 2.02 %
Annualized.Calculated on a fully taxable equivalent basis.
The following table provides information regarding the average balances and yields earned on interest-earning assets and the average balances and rates paid oninterest-bearing liabilities for the three months ended September 30, 2020 and 2019. Non-accrual loans are included in the calculation of average loan balances,while interest collected on non-accrual loans is recorded as a reduction to principal. Where applicable, interest income and yield are reflected on a fully taxableequivalent basis and have been adjusted based on the statutory federal income tax rate of 21% for 2020 and 2019.
(1) (2)
(1)
(1) (2)
(1) (2)
(1)
(2)
50

Table of Contents
Three Months Ended September 30,2020 2019
(Dollars in thousands)Average Balance
Interest Income/
Expense
AverageYield/Rate
Average Balance
Interest Income/
Expense
AverageYield/Rate
AssetsInterest-earning deposits $ 866,502 $ 278 0.13 % $ 388,274 $ 2,144 2.19 %Federal funds sold 9,071 2 0.09 % 8,424 44 2.07 %Debt securities available-for-sale 561,378 1,804 1.28 % 262,665 2,085 3.15 %Debt securities held-to-maturity 262,128 1,701 2.58 % 174,331 1,537 3.50 %Equity securities — — — % 4,720 12 1.01 %FHLB stock 13,284 196 5.87 % 10,585 382 14.32 %Total loans and leases 7,386,265 46,256 2.49 % 5,776,652 61,552 4.23 %
Total interest-earning assets 9,098,628 50,237 2.20 % 6,625,651 67,756 4.06 %Other assets 420,887 288,216
Total assets $ 9,519,515 $ 6,913,867
Liabilities and Shareholders’ EquityInterest-bearing deposits:
Interest-bearing checking accounts $ 2,866,303 $ 3,280 0.46 % $ 1,116,624 $ 5,795 2.06 %Money market deposit accounts 3,811,100 6,944 0.72 % 3,106,186 18,870 2.41 %Certificates of deposit 1,121,824 3,674 1.30 % 1,462,521 9,449 2.56 %
Borrowings:FHLB borrowings 300,000 1,392 1.85 % 224,130 1,302 2.30 %Subordinated notes payable, net 95,601 1,458 6.07 % — — — %Total interest-bearing liabilities 8,194,828 16,748 0.81 % 5,909,461 35,416 2.38 %
Noninterest-bearing deposits 407,079 268,013 Other liabilities 274,480 137,934 Shareholders’ equity 643,128 598,459
Total liabilities and shareholders’ equity $ 9,519,515 $ 6,913,867
Net interest income $ 33,489 $ 32,340 Net interest spread 1.39 % 1.68 %Net interest margin 1.46 % 1.94 %
Calculated on a fully taxable equivalent basis.Annualized.
Net Interest Income for the Three Months Ended September 30, 2020 and 2019. Net interest income, calculated on a fully taxable equivalent basis, increased $1.1million, or 3.6%, to $33.5 million for the three months ended September 30, 2020, from $32.3 million for the same period in 2019. The increase in net interestincome for the three months ended September 30, 2020, was primarily attributable to a decrease of $18.7 million, or 52.7%, in interest expense, partially offset bya decrease of $17.5 million, or 25.9%, in interest income. Net interest margin decreased to 1.46% for the three months ended September 30, 2020, as compared to1.94% for the same period in 2019, driven by a lower yield on our loan portfolio, partially offset by a lower cost of funds.
The decrease in interest income on interest-earning assets was primarily the result of a decrease of 174 basis points in yield on our loans, partially offset by anincrease in average total loans, which is our primary earning asset, of $1.61 billion, or 27.9%, for the three months ended September 30, 2020, compared to thesame period in 2019. The most significant factor driving the yield on our loan portfolio was the impact of the decrease to the Federal Reserve’s target federal fundsrate on our floating-rate loans as well as increased on balance sheet liquidity. The change in yield is also attributable to our lower-risk, lower-yielding marketable-securities-backed private banking loans and commercial loans. The overall yield on interest-earning assets declined 186 basis points to 2.20% for the three monthsended September 30, 2020, as compared to 4.06% for the same period in 2019, primarily due to the lower yield on loans.
The decrease in interest expense on interest-bearing liabilities was primarily the result of a decrease of 157 basis points in the average rate paid on our interest-bearing liabilities. partially offset by an increase of $2.29 billion, or 38.7%, in average interest-bearing liabilities for the three months ended September 30, 2020,compared to the same period in 2019. The decrease in the average rate paid
(1)(2)
(1)(2)
(1)
(1)
(1)
(1)
(2)
51

Table of Contents
on our interest-bearing liabilities reflected decreases in rates paid in all deposit categories and FHLB borrowings, which was largely driven by the recent decreaseof the Federal Reserve’s target Federal Funds Rate, which impacted our variable-rate liabilities. The change in yield is also a result of our increased on balancesheet liquidity. The increase in average interest-bearing liabilities was driven primarily by an increase of $1.75 billion in average interest-bearing checkingaccounts and an increase of $704.9 million in average money market deposit accounts, partially offset by a decrease of $340.7 million in average certificates ofdeposits.
The following table analyzes the dollar amount of the changes in interest income and interest expense with respect to the primary components of interest-earningassets and interest-bearing liabilities. The table shows the amount of the change in interest income or interest expense caused by either changes in outstandingbalances or changes in interest rates for the three months ended September 30, 2020, compared to the same period in 2019. The effect of a change in balances ismeasured by applying the average rate during the first period to the balance (“volume”) change between the two periods. The effect of changes in interest rate ismeasured by applying the change in rate between the two periods to the average volume during the first period.
Three Months Ended September 30,2020 over 2019
(Dollars in thousands) Yield/Rate Volume ChangeIncrease (decrease) in:Interest income:
Interest-earning deposits $ (3,097) $ 1,231 $ (1,866)Federal funds sold (45) 3 (42)Debt securities available-for-sale (1,726) 1,445 (281)Debt securities held-to-maturity (476) 640 164 Equity securities — (12) (12)FHLB stock (266) 80 (186)Total loans (29,595) 14,299 (15,296)
Total decrease in interest income (35,205) 17,686 (17,519)
Interest expense:Interest-bearing deposits:
Interest-bearing checking accounts (6,869) 4,354 (2,515)Money market deposit accounts (15,474) 3,548 (11,926)Certificates of deposit (3,922) (1,853) (5,775)
Borrowings:FHLB borrowings (295) 385 90 Subordinated notes payable, net — 1,458 1,458
Total decrease in interest expense (26,560) 7,892 (18,668)Total increase (decrease) in net interest income $ (8,645) $ 9,794 $ 1,149
The change in interest income and interest expense due to changes in both composition and applicable yields/rates has been allocated to volume and rate changes inproportion to the relationship of the absolute dollar amounts of the change in each.
The following table provides information regarding the average balances and yields earned on interest-earning assets and the average balances and rates paid oninterest-bearing liabilities for the nine months ended September 30, 2020 and 2019. Non-accrual loans are included in the calculation of average loan balances,while interest payments collected on non-accrual loans are recorded as a reduction to principal. Where applicable, interest income and yield are reflected on a fullytaxable equivalent basis and have been adjusted based on the statutory federal income tax rate of 21% for 2020 and 2019.
(1)
(1)
52

Table of Contents
Nine Months Ended September 30,2020 2019
(Dollars in thousands)Average Balance
Interest Income/
Expense
AverageYield/Rate
Average Balance
Interest Income/
Expense
AverageYield/Rate
AssetsInterest-earning deposits $ 809,978 $ 1,983 0.33 % $ 282,828 $ 4,942 2.34 %Federal funds sold 8,022 23 0.38 % 9,412 142 2.02 %Debt securities available-for-sale 391,377 5,874 2.00 % 249,490 6,125 3.28 %Debt securities held-to-maturity 252,296 4,805 2.54 % 189,083 5,267 3.72 %Debt securities trading 76 1 1.76 % — — — %Equity securities — — — % 8,363 112 1.79 %FHLB stock 15,569 899 7.71 % 17,069 1,072 8.40 %Total loans and leases 7,052,457 152,551 2.89 % 5,474,522 179,392 4.38 %
Total interest-earning assets 8,529,775 166,136 2.60 % 6,230,767 197,052 4.23 %Other assets 380,908 266,059
Total assets $ 8,910,683 $ 6,496,826
Liabilities and Shareholders’ EquityInterest-bearing deposits:
Interest-bearing checking accounts $ 2,224,827 $ 11,213 0.67 % $ 927,198 $ 15,303 2.21 %Money market deposit accounts 3,740,968 28,975 1.03 % 2,883,009 53,608 2.49 %Certificates of deposit 1,297,637 16,907 1.74 % 1,375,324 26,691 2.59 %
Borrowings:FHLB borrowings 340,493 4,711 1.85 % 370,550 6,222 2.24 %Line of credit borrowings 8,047 261 4.33 % 1,650 68 5.51 %Subordinated notes payable, net 46,851 2,138 6.10 % 23,178 1,090 6.29 %Total interest-bearing liabilities 7,658,823 64,205 1.12 % 5,580,909 102,982 2.47 %
Noninterest-bearing deposits 391,689 262,056 Other liabilities 226,838 113,331 Shareholders’ equity 633,333 540,530
Total liabilities and shareholders’ equity $ 8,910,683 $ 6,496,826
Net interest income $ 101,931 $ 94,070 Net interest spread 1.48 % 1.76 %Net interest margin 1.60 % 2.02 %
Calculated on a fully taxable equivalent basis.Annualized.
Net Interest Income for the Nine Months Ended September 30, 2020 and 2019. Net interest income, calculated on a fully taxable equivalent basis, increased $7.9million, or 8.4%, to $101.9 million for the nine months ended September 30, 2020, from $94.1 million for the same period in 2019. This increase in net interestincome for the nine months ended September 30, 2020 was primarily attributable to a decrease of $38.8 million, or 37.7%, in interest expense, partially offset by adecrease of $30.9 million, or 15.7%, in interest income. Net interest margin was 1.60% for the nine months ended September 30, 2020, compared to 2.02% for thesame period in 2019, driven by a lower yield on our loan portfolio, partially offset by a lower cost of funds.
The decrease in interest income on interest-earning assets was primarily the result of a decrease of 149 basis points in yield on our loans, partially offset by anincrease in average total loans, which is our primary earning assets, of $1.58 billion, or 28.8% for the nine months ended September 30, 2020, compared to thesame period in 2019. The most significant factor driving the yield on our loan portfolio was the impact of the decrease to the Federal Reserve’s target federal fundsrate on our floating-rate loans as well as increased on balance sheet liquidity. The change in yield is also attributable to our lower-risk, lower-yielding marketable-securities-backed private banking loans and commercial loans. The overall yield on interest-earning assets declined 163 basis points to 2.60% for the nine monthsended September 30, 2020, as compared to 4.23% for the same period in 2019, primarily due to the lower loan yields.
(1)(2)
(1)(2)
(1)
(1)
(1)
(1)
(2)
53
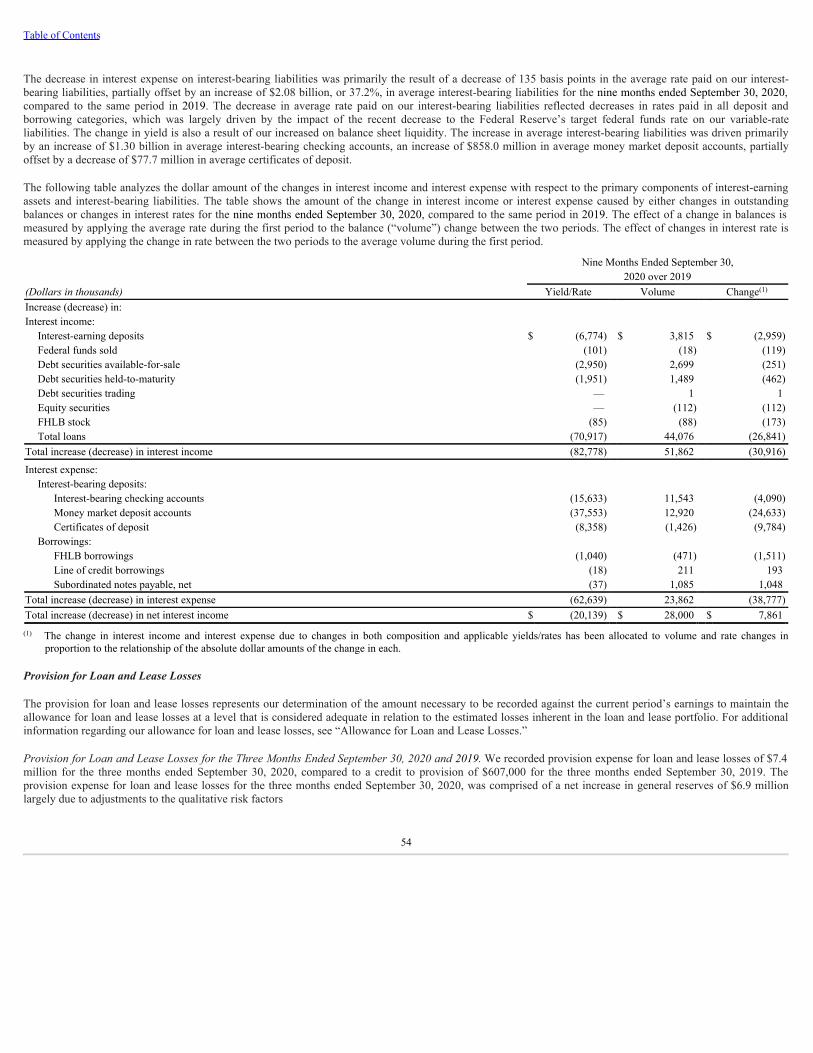
Table of Contents
The decrease in interest expense on interest-bearing liabilities was primarily the result of a decrease of 135 basis points in the average rate paid on our interest-bearing liabilities, partially offset by an increase of $2.08 billion, or 37.2%, in average interest-bearing liabilities for the nine months ended September 30, 2020,compared to the same period in 2019. The decrease in average rate paid on our interest-bearing liabilities reflected decreases in rates paid in all deposit andborrowing categories, which was largely driven by the impact of the recent decrease to the Federal Reserve’s target federal funds rate on our variable-rateliabilities. The change in yield is also a result of our increased on balance sheet liquidity. The increase in average interest-bearing liabilities was driven primarilyby an increase of $1.30 billion in average interest-bearing checking accounts, an increase of $858.0 million in average money market deposit accounts, partiallyoffset by a decrease of $77.7 million in average certificates of deposit.
The following table analyzes the dollar amount of the changes in interest income and interest expense with respect to the primary components of interest-earningassets and interest-bearing liabilities. The table shows the amount of the change in interest income or interest expense caused by either changes in outstandingbalances or changes in interest rates for the nine months ended September 30, 2020, compared to the same period in 2019. The effect of a change in balances ismeasured by applying the average rate during the first period to the balance (“volume”) change between the two periods. The effect of changes in interest rate ismeasured by applying the change in rate between the two periods to the average volume during the first period.
Nine Months Ended September 30,2020 over 2019
(Dollars in thousands) Yield/Rate Volume ChangeIncrease (decrease) in:Interest income:
Interest-earning deposits $ (6,774) $ 3,815 $ (2,959)Federal funds sold (101) (18) (119)Debt securities available-for-sale (2,950) 2,699 (251)Debt securities held-to-maturity (1,951) 1,489 (462)Debt securities trading — 1 1 Equity securities — (112) (112)FHLB stock (85) (88) (173)Total loans (70,917) 44,076 (26,841)
Total increase (decrease) in interest income (82,778) 51,862 (30,916)
Interest expense:Interest-bearing deposits:
Interest-bearing checking accounts (15,633) 11,543 (4,090)Money market deposit accounts (37,553) 12,920 (24,633)Certificates of deposit (8,358) (1,426) (9,784)
Borrowings:FHLB borrowings (1,040) (471) (1,511)Line of credit borrowings (18) 211 193 Subordinated notes payable, net (37) 1,085 1,048
Total increase (decrease) in interest expense (62,639) 23,862 (38,777)Total increase (decrease) in net interest income $ (20,139) $ 28,000 $ 7,861
The change in interest income and interest expense due to changes in both composition and applicable yields/rates has been allocated to volume and rate changes inproportion to the relationship of the absolute dollar amounts of the change in each.
Provision for Loan and Lease Losses
The provision for loan and lease losses represents our determination of the amount necessary to be recorded against the current period’s earnings to maintain theallowance for loan and lease losses at a level that is considered adequate in relation to the estimated losses inherent in the loan and lease portfolio. For additionalinformation regarding our allowance for loan and lease losses, see “Allowance for Loan and Lease Losses.”
Provision for Loan and Lease Losses for the Three Months Ended September 30, 2020 and 2019. We recorded provision expense for loan and lease losses of $7.4million for the three months ended September 30, 2020, compared to a credit to provision of $607,000 for the three months ended September 30, 2019. Theprovision expense for loan and lease losses for the three months ended September 30, 2020, was comprised of a net increase in general reserves of $6.9 millionlargely due to adjustments to the qualitative risk factors
(1)
(1)
54
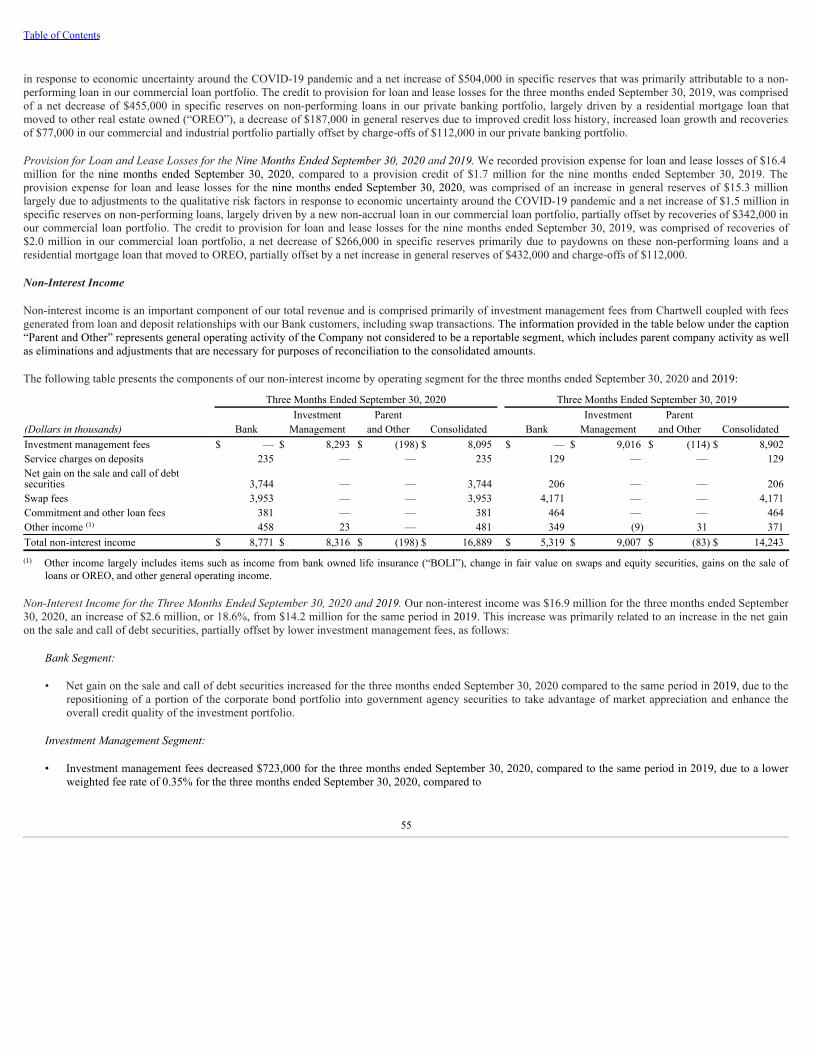
Table of Contents
in response to economic uncertainty around the COVID-19 pandemic and a net increase of $504,000 in specific reserves that was primarily attributable to a non-performing loan in our commercial loan portfolio. The credit to provision for loan and lease losses for the three months ended September 30, 2019, was comprisedof a net decrease of $455,000 in specific reserves on non-performing loans in our private banking portfolio, largely driven by a residential mortgage loan thatmoved to other real estate owned (“OREO”), a decrease of $187,000 in general reserves due to improved credit loss history, increased loan growth and recoveriesof $77,000 in our commercial and industrial portfolio partially offset by charge-offs of $112,000 in our private banking portfolio.
Provision for Loan and Lease Losses for the Nine Months Ended September 30, 2020 and 2019. We recorded provision expense for loan and lease losses of $16.4million for the nine months ended September 30, 2020, compared to a provision credit of $1.7 million for the nine months ended September 30, 2019. Theprovision expense for loan and lease losses for the nine months ended September 30, 2020, was comprised of an increase in general reserves of $15.3 millionlargely due to adjustments to the qualitative risk factors in response to economic uncertainty around the COVID-19 pandemic and a net increase of $1.5 million inspecific reserves on non-performing loans, largely driven by a new non-accrual loan in our commercial loan portfolio, partially offset by recoveries of $342,000 inour commercial loan portfolio. The credit to provision for loan and lease losses for the nine months ended September 30, 2019, was comprised of recoveries of$2.0 million in our commercial loan portfolio, a net decrease of $266,000 in specific reserves primarily due to paydowns on these non-performing loans and aresidential mortgage loan that moved to OREO, partially offset by a net increase in general reserves of $432,000 and charge-offs of $112,000.
Non-Interest Income
Non-interest income is an important component of our total revenue and is comprised primarily of investment management fees from Chartwell coupled with feesgenerated from loan and deposit relationships with our Bank customers, including swap transactions. The information provided in the table below under the caption“Parent and Other” represents general operating activity of the Company not considered to be a reportable segment, which includes parent company activity as wellas eliminations and adjustments that are necessary for purposes of reconciliation to the consolidated amounts.
The following table presents the components of our non-interest income by operating segment for the three months ended September 30, 2020 and 2019:
Three Months Ended September 30, 2020 Three Months Ended September 30, 2019Investment Parent Investment Parent
(Dollars in thousands) Bank Management and Other Consolidated Bank Management and Other ConsolidatedInvestment management fees $ — $ 8,293 $ (198) $ 8,095 $ — $ 9,016 $ (114) $ 8,902 Service charges on deposits 235 — — 235 129 — — 129 Net gain on the sale and call of debtsecurities 3,744 — — 3,744 206 — — 206 Swap fees 3,953 — — 3,953 4,171 — — 4,171 Commitment and other loan fees 381 — — 381 464 — — 464 Other income 458 23 — 481 349 (9) 31 371 Total non-interest income $ 8,771 $ 8,316 $ (198) $ 16,889 $ 5,319 $ 9,007 $ (83) $ 14,243
Other income largely includes items such as income from bank owned life insurance (“BOLI”), change in fair value on swaps and equity securities, gains on the sale ofloans or OREO, and other general operating income.
Non-Interest Income for the Three Months Ended September 30, 2020 and 2019. Our non-interest income was $16.9 million for the three months ended September30, 2020, an increase of $2.6 million, or 18.6%, from $14.2 million for the same period in 2019. This increase was primarily related to an increase in the net gainon the sale and call of debt securities, partially offset by lower investment management fees, as follows:
Bank Segment:
• Net gain on the sale and call of debt securities increased for the three months ended September 30, 2020 compared to the same period in 2019, due to therepositioning of a portion of the corporate bond portfolio into government agency securities to take advantage of market appreciation and enhance theoverall credit quality of the investment portfolio.
Investment Management Segment:
• Investment management fees decreased $723,000 for the three months ended September 30, 2020, compared to the same period in 2019, due to a lowerweighted fee rate of 0.35% for the three months ended September 30, 2020, compared to
(1)
(1)
55
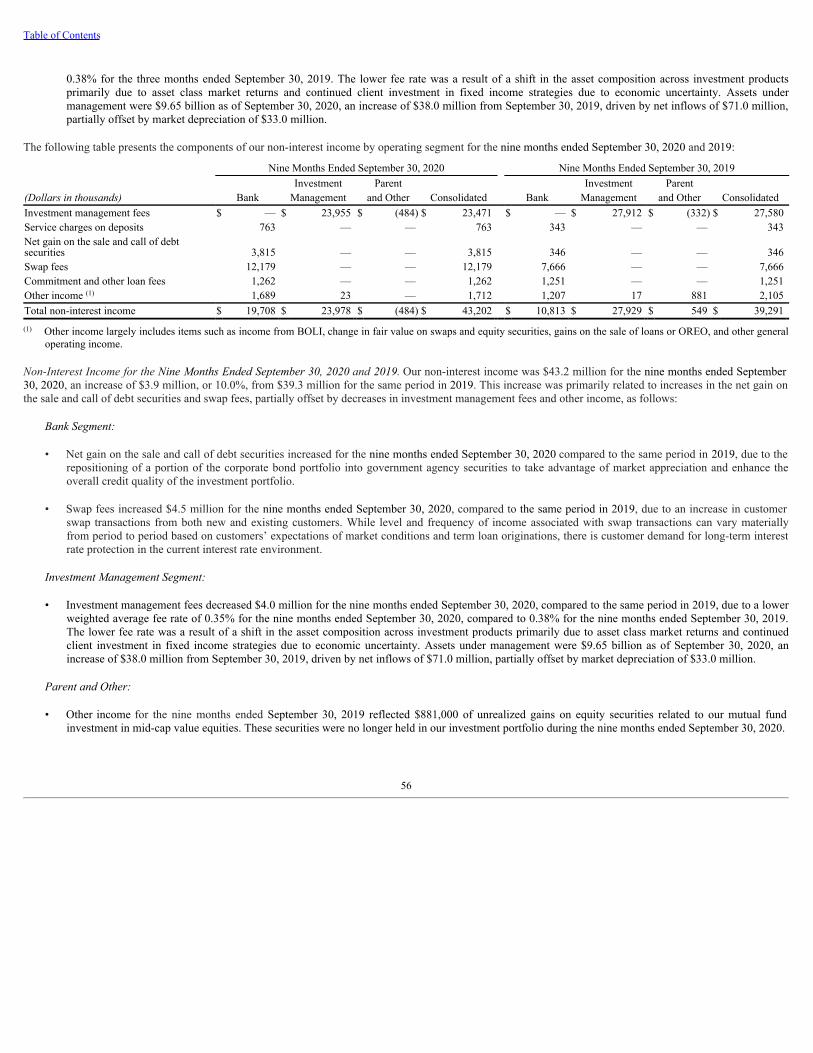
Table of Contents
0.38% for the three months ended September 30, 2019. The lower fee rate was a result of a shift in the asset composition across investment productsprimarily due to asset class market returns and continued client investment in fixed income strategies due to economic uncertainty. Assets undermanagement were $9.65 billion as of September 30, 2020, an increase of $38.0 million from September 30, 2019, driven by net inflows of $71.0 million,partially offset by market depreciation of $33.0 million.
The following table presents the components of our non-interest income by operating segment for the nine months ended September 30, 2020 and 2019:
Nine Months Ended September 30, 2020 Nine Months Ended September 30, 2019Investment Parent Investment Parent
(Dollars in thousands) Bank Management and Other Consolidated Bank Management and Other ConsolidatedInvestment management fees $ — $ 23,955 $ (484) $ 23,471 $ — $ 27,912 $ (332) $ 27,580 Service charges on deposits 763 — — 763 343 — — 343 Net gain on the sale and call of debtsecurities 3,815 — — 3,815 346 — — 346 Swap fees 12,179 — — 12,179 7,666 — — 7,666 Commitment and other loan fees 1,262 — — 1,262 1,251 — — 1,251 Other income 1,689 23 — 1,712 1,207 17 881 2,105 Total non-interest income $ 19,708 $ 23,978 $ (484) $ 43,202 $ 10,813 $ 27,929 $ 549 $ 39,291
Other income largely includes items such as income from BOLI, change in fair value on swaps and equity securities, gains on the sale of loans or OREO, and other generaloperating income.
Non-Interest Income for the Nine Months Ended September 30, 2020 and 2019. Our non-interest income was $43.2 million for the nine months ended September30, 2020, an increase of $3.9 million, or 10.0%, from $39.3 million for the same period in 2019. This increase was primarily related to increases in the net gain onthe sale and call of debt securities and swap fees, partially offset by decreases in investment management fees and other income, as follows:
Bank Segment:
• Net gain on the sale and call of debt securities increased for the nine months ended September 30, 2020 compared to the same period in 2019, due to therepositioning of a portion of the corporate bond portfolio into government agency securities to take advantage of market appreciation and enhance theoverall credit quality of the investment portfolio.
• Swap fees increased $4.5 million for the nine months ended September 30, 2020, compared to the same period in 2019, due to an increase in customerswap transactions from both new and existing customers. While level and frequency of income associated with swap transactions can vary materiallyfrom period to period based on customers’ expectations of market conditions and term loan originations, there is customer demand for long-term interestrate protection in the current interest rate environment.
Investment Management Segment:
• Investment management fees decreased $4.0 million for the nine months ended September 30, 2020, compared to the same period in 2019, due to a lowerweighted average fee rate of 0.35% for the nine months ended September 30, 2020, compared to 0.38% for the nine months ended September 30, 2019.The lower fee rate was a result of a shift in the asset composition across investment products primarily due to asset class market returns and continuedclient investment in fixed income strategies due to economic uncertainty. Assets under management were $9.65 billion as of September 30, 2020, anincrease of $38.0 million from September 30, 2019, driven by net inflows of $71.0 million, partially offset by market depreciation of $33.0 million.
Parent and Other:
• Other income for the nine months ended September 30, 2019 reflected $881,000 of unrealized gains on equity securities related to our mutual fundinvestment in mid-cap value equities. These securities were no longer held in our investment portfolio during the nine months ended September 30, 2020.
(1)
(1)
56

Table of Contents
Non-Interest Expense
Our non-interest expense represents the operating cost of maintaining and growing our business. The largest portion of non-interest expense for each segment iscompensation and employee benefits, which include employee payroll expense as well as the cost of incentive compensation, benefit plans, health insurance andpayroll taxes, all of which are impacted by the growth in our employee base, coupled with increases in the level of compensation and benefits of our existingemployees. The information provided in the table below under the caption “Parent and Other” represents general operating activity of the Company not consideredto be a reportable segment, which includes parent company activity as well as eliminations and adjustments that are necessary for purposes of reconciliation to theconsolidated amounts.
The following table presents the components of our non-interest expense by operating segment for the three months ended September 30, 2020 and 2019:
Three Months Ended September 30, 2020 Three Months Ended September 30, 2019Investment Parent Investment Parent
(Dollars in thousands) Bank Management and Other Consolidated Bank Management and Other ConsolidatedCompensation and employee benefits $ 13,246 $ 5,014 $ 264 $ 18,524 $ 12,805 $ 5,902 $ — $ 18,707 Premises and equipment expense 1,095 393 — 1,488 981 439 — 1,420 Professional fees 1,367 160 69 1,596 1,237 141 (73) 1,305 FDIC insurance expense 3,030 — — 3,030 994 — — 994 General insurance expense 225 69 — 294 190 68 — 258 State capital shares tax 366 — — 366 (720) — — (720)Travel and entertainment expense 524 30 38 592 1,053 286 — 1,339 Technology and data services 1,847 729 — 2,576 1,323 759 — 2,082 Intangible amortization expense — 478 — 478 — 502 — 502 Marketing and advertising 84 310 — 394 324 194 — 518 Other operating expenses 1,678 163 248 2,089 762 397 209 1,368 Total non-interest expense $ 23,462 $ 7,346 $ 619 $ 31,427 $ 18,949 $ 8,688 $ 136 $ 27,773
Full-time equivalent employees 243 55 — 298 219 57 — 276
Other operating expenses include items such as organizational dues and subscriptions, charitable contributions, investor relations fees, sub-advisory fees, employee-relatedexpenses, provision for unfunded commitments and other general operating expenses.Full-time equivalent employees shown are as of the end of the periods presented.
Non-Interest Expense for the Three Months Ended September 30, 2020 and 2019. Our non-interest expense for the three months ended September 30, 2020,increased $3.7 million, or 13.2%, as compared to the same period in 2019, which included a $4.5 million increase in expenses of the Bank segment and a $1.3million decrease in expenses of the Investment Management segment. Notable changes in each segment’s expenses are as follows:
Bank Segment:
• Federal Deposit Insurance Corporation (“FDIC”) insurance expense increased $2.0 million for the three months ended September 30, 2020 compared tothe same period in 2019 due to a credit that was received in the prior year.
• State capital shares tax increased $1.1 million for the three months ended September 30, 2020 compared to the same period in 2019, primarily due to afavorable ruling that the Company received in prior year that resulted in a tax benefit.
• Travel and entertainment expense for the three months ended September 30, 2020 decreased by $529,000 compared to the same period in 2019, primarilydue to decreased travel and in person meetings as a result of the current COVID-19 pandemic.
• Other operating expenses increased $916,000 for the three months ended September 30, 2020 compared to the same period in 2019 primarily driven by anincrease in provision for unfunded commitments.
(1)
(2)
(1)
(2)
57
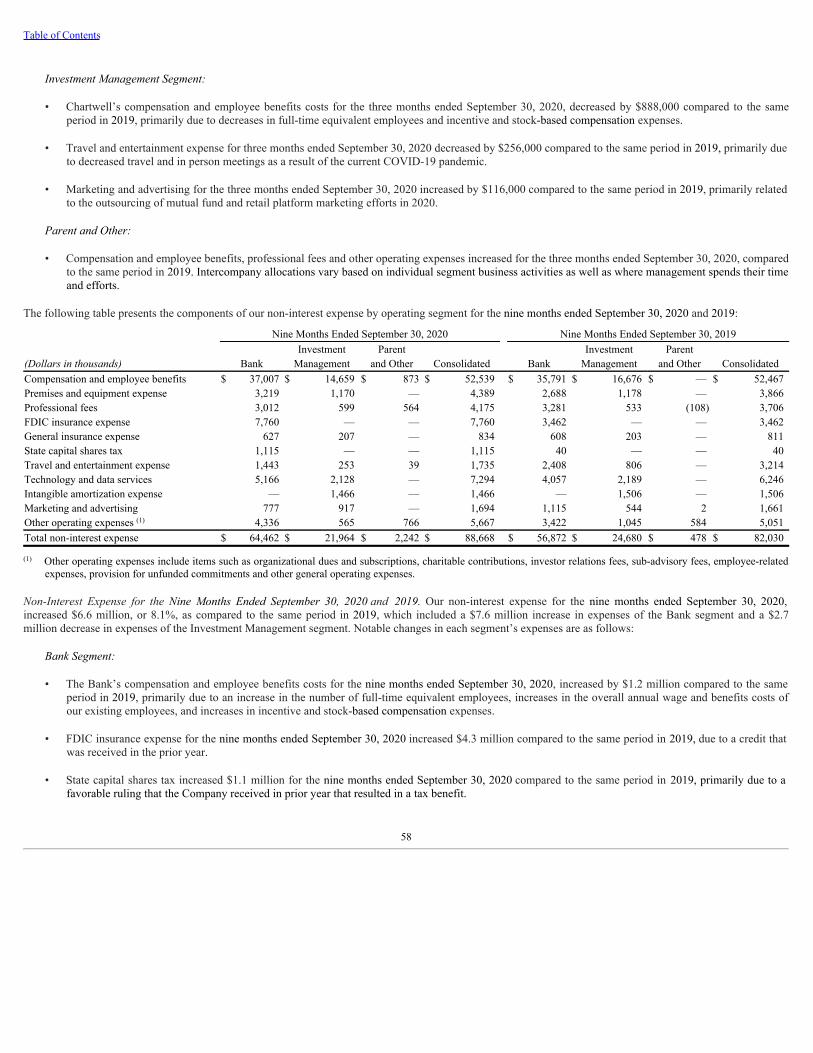
Table of Contents
Investment Management Segment:
• Chartwell’s compensation and employee benefits costs for the three months ended September 30, 2020, decreased by $888,000 compared to the sameperiod in 2019, primarily due to decreases in full-time equivalent employees and incentive and stock-based compensation expenses.
• Travel and entertainment expense for three months ended September 30, 2020 decreased by $256,000 compared to the same period in 2019, primarily dueto decreased travel and in person meetings as a result of the current COVID-19 pandemic.
• Marketing and advertising for the three months ended September 30, 2020 increased by $116,000 compared to the same period in 2019, primarily relatedto the outsourcing of mutual fund and retail platform marketing efforts in 2020.
Parent and Other:
• Compensation and employee benefits, professional fees and other operating expenses increased for the three months ended September 30, 2020, comparedto the same period in 2019. Intercompany allocations vary based on individual segment business activities as well as where management spends their timeand efforts.
The following table presents the components of our non-interest expense by operating segment for the nine months ended September 30, 2020 and 2019:
Nine Months Ended September 30, 2020 Nine Months Ended September 30, 2019Investment Parent Investment Parent
(Dollars in thousands) Bank Management and Other Consolidated Bank Management and Other ConsolidatedCompensation and employee benefits $ 37,007 $ 14,659 $ 873 $ 52,539 $ 35,791 $ 16,676 $ — $ 52,467 Premises and equipment expense 3,219 1,170 — 4,389 2,688 1,178 — 3,866 Professional fees 3,012 599 564 4,175 3,281 533 (108) 3,706 FDIC insurance expense 7,760 — — 7,760 3,462 — — 3,462 General insurance expense 627 207 — 834 608 203 — 811 State capital shares tax 1,115 — — 1,115 40 — — 40 Travel and entertainment expense 1,443 253 39 1,735 2,408 806 — 3,214 Technology and data services 5,166 2,128 — 7,294 4,057 2,189 — 6,246 Intangible amortization expense — 1,466 — 1,466 — 1,506 — 1,506 Marketing and advertising 777 917 — 1,694 1,115 544 2 1,661 Other operating expenses 4,336 565 766 5,667 3,422 1,045 584 5,051 Total non-interest expense $ 64,462 $ 21,964 $ 2,242 $ 88,668 $ 56,872 $ 24,680 $ 478 $ 82,030
Other operating expenses include items such as organizational dues and subscriptions, charitable contributions, investor relations fees, sub-advisory fees, employee-relatedexpenses, provision for unfunded commitments and other general operating expenses.
Non-Interest Expense for the Nine Months Ended September 30, 2020 and 2019. Our non-interest expense for the nine months ended September 30, 2020,increased $6.6 million, or 8.1%, as compared to the same period in 2019, which included a $7.6 million increase in expenses of the Bank segment and a $2.7million decrease in expenses of the Investment Management segment. Notable changes in each segment’s expenses are as follows:
Bank Segment:
• The Bank’s compensation and employee benefits costs for the nine months ended September 30, 2020, increased by $1.2 million compared to the sameperiod in 2019, primarily due to an increase in the number of full-time equivalent employees, increases in the overall annual wage and benefits costs ofour existing employees, and increases in incentive and stock-based compensation expenses.
• FDIC insurance expense for the nine months ended September 30, 2020 increased $4.3 million compared to the same period in 2019, due to a credit thatwas received in the prior year.
• State capital shares tax increased $1.1 million for the nine months ended September 30, 2020 compared to the same period in 2019, primarily due to afavorable ruling that the Company received in prior year that resulted in a tax benefit.
(1)
(1)
58

Table of Contents
• Technology and data services for the nine months ended September 30, 2020, increased $1.1 million compared to the same period in 2019, primarily dueincreased software licensing fees and software depreciation expense as a result of our enhancements in technology.
• Other operating expenses increased $914,000 for the nine months ended September 30, 2020 compared to the same period in 2019 primarily driven by anincrease in provision for unfunded commitments.
Investment Management Segment:
• Chartwell’s compensation and employee benefits costs for the nine months ended September 30, 2020, decreased by $2.0 million compared to the sameperiod in 2019, primarily due to decreases in full-time equivalent employees and incentive and stock-based compensation expenses.
• Marketing and advertising for the nine months ended September 30, 2020 increased by $373,000 compared to the same period in 2019, primarily relatedto the outsourcing of mutual fund and retail platform marketing efforts in 2020.
• Other operating expenses for the nine months ended September 30, 2020, decreased by $480,000 compared to the same period in 2019, primarily due tolower mutual fund platform distribution expense and lower organizational dues and subscriptions.
Parent and Other:
• Compensation and employee benefits, professional fees, travel and entertainment expenses and other operating expenses increased for the nine monthsended September 30, 2020, compared to the same period in 2019. Intercompany allocations vary based on individual segment business activities as wellas where management spends their time and efforts.
Income Taxes
We utilize the asset and liability method of accounting for income taxes. Under this method, deferred tax assets and liabilities are recognized for the tax effects ofdifferences between the financial statement and tax basis of assets and liabilities. Deferred tax assets and liabilities are measured using the enacted tax ratesexpected to apply to taxable income in the years in which those temporary differences are expected to be recovered or settled. The effect on deferred tax assets andliabilities with regard to a change in tax rates is recognized in income in the period that includes the enactment date. We evaluate whether it is more likely than notthat we will be able to realize the benefit of identified deferred tax assets.
Income Taxes for the Three Months Ended September 30, 2020 and 2019. For the three months ended September 30, 2020, we recognized income tax expense of$2.2 million, or 18.9% of income before tax, as compared to income tax expense of $3.1 million, or 15.8% of income before tax, for the same period in 2019. Oureffective tax rate of 18.9% for the three months ended September 30, 2020, increased compared to the same period in the prior year primarily due to the amountand timing of tax credits recognized in 2020 compared to 2019.
Income Taxes for the Nine Months Ended September 30, 2020 and 2019. For the nine months ended September 30, 2020, we recognized income tax expense of$7.4 million, or 18.4% of income before tax, as compared to income tax expense of $7.4 million, or 13.9% of income before tax, for the same period in 2019. Oureffective tax rate of 18.4% for the nine months ended September 30, 2020, increased compared to the same period in the prior year primarily due to the amount andtiming of tax credits recognized in 2020 compared to 2019.
Financial Condition
Our total assets as of September 30, 2020, were $9.49 billion, an increase of $1.73 billion, or 29.7% on an annualized basis, from December 31, 2019, drivenprimarily by growth in our loan portfolio, investment portfolio and cash and cash equivalents. As of September 30, 2020, our loan portfolio totaled $7.65 billion,an increase of $1.08 billion, or 21.9% on an annualized basis, from December 31, 2019. Total investment securities increased $351.1 million, or 100.0% on anannualized basis, to $820.2 million as of September 30, 2020, from December 31, 2019. Cash and cash equivalents increased $204.4 million to $608.3 million as ofSeptember 30, 2020, from December 31, 2019. Our Asset and Liability Committee (“ALCO”) is responsible for managing the investment portfolio and liquidity ofthe Bank, among other responsibilities. Given the current overall interest rate environment, the strength of our loan growth, and in anticipation of clients’ creditneeds during the COVID-19 crisis, our ALCO has kept excess liquidity in interest-bearing cash deposits and investments.
59

As of September 30, 2020, our total deposits were $8.18 billion, an increase of $1.55 billion, or 31.2% annualized, from December 31, 2019. We focus only onhigh quality loan growth and in the absence of this, we increase our assets through cash and cash equivalents as well as adding to our investment portfolio as partof our strategy to build greater on balance sheet liquidity funded through our deposits. Net borrowings increased $40.4 million to $395.4 million as ofSeptember 30, 2020, from December 31, 2019. Our shareholders’ equity increased $21.9 million to $643.2 million as of September 30, 2020, from December 31,2019, primarily due to net income of $32.6 million and $7.2 million in stock-based compensation, partially offset by a decrease of $6.6 million in accumulatedother comprehensive income (loss), preferred stock dividends paid of $5.9 million, the purchase of $3.3 million in treasury stock, and $2.5 million in cancellationof stock options.
Loans and Leases
Our loan and lease portfolio, which represents our largest earning asset, primarily consists of loans to our private banking clients, commercial and industrial loansand leases, and real estate loans secured by commercial properties. As of September 30, 2020, 93.4% of our loans had a floating interest rate.
The following table presents the composition of our loan portfolio as of the dates indicated:
September 30, 2020 December 31, 2019
(Dollars in thousands) OutstandingPercent of
Loans OutstandingPercent of
LoansPrivate banking loans $ 4,458,767 58.3 % $ 3,695,402 56.2 %Middle-market banking loans:
Commercial and industrial 1,138,288 14.9 % 1,085,709 16.5 %Commercial real estate 2,057,391 26.8 % 1,796,448 27.3 %
Total middle-market banking loans 3,195,679 41.7 % 2,882,157 43.8 %Loans and leases held-for-investment $ 7,654,446 100.0 % $ 6,577,559 100.0 %
Loans and Leases Held-for-Investment. Loans and leases held-for-investment increased by $1.08 billion, or 21.9% on an annualized basis, to $7.65 billion as ofSeptember 30, 2020, from December 31, 2019. Our growth for the nine months ended September 30, 2020, was comprised of an increase in private banking loansof $763.4 million, an increase in commercial and industrial loans and leases of $52.6 million and an increase in commercial real estate loans of $260.9 million.
Primary Loan Categories
Private Banking Loans. Our private banking loans include personal and commercial loans that are sourced through our private banking channel (which operates ona national basis), including referral relationships with financial intermediaries. These loans primarily consist of loans made to high-net-worth individuals, trusts andbusinesses that are secured by cash and marketable securities. We also originate loans that are secured by cash value life insurance and to a lessor extent residentialproperty or other financial assets. The primary source of repayment for these loans is the income and assets of the borrower. We also have a limited number ofunsecured loans and lines of credit in our private banking loan portfolio.
As of September 30, 2020, $4.38 billion, or 98.2%, of our private banking loans were secured by cash, marketable securities and/or cash value life insurance ascompared to $3.60 billion, or 97.4%, as of December 31, 2019. Our private banking lines of credit are typically due on demand. We expect the growth in theseloans to continue as a result of our focus on this portion of our private banking business. We believe we have strong competitive advantages in this line of businessgiven our proprietary technology and distribution channels. These loans usually have a lower risk profile and are an efficient use of capital because they typicallyare zero percent risk-weighted for regulatory capital purposes. On a daily basis, we monitor the collateral of the loans secured by cash, marketable securities and/orcash value life insurance, which further reduces the risk profile of the private banking portfolio. Since inception, we have had no charge-offs related to our loanssecured by cash, marketable securities and/or cash value life insurance.
60
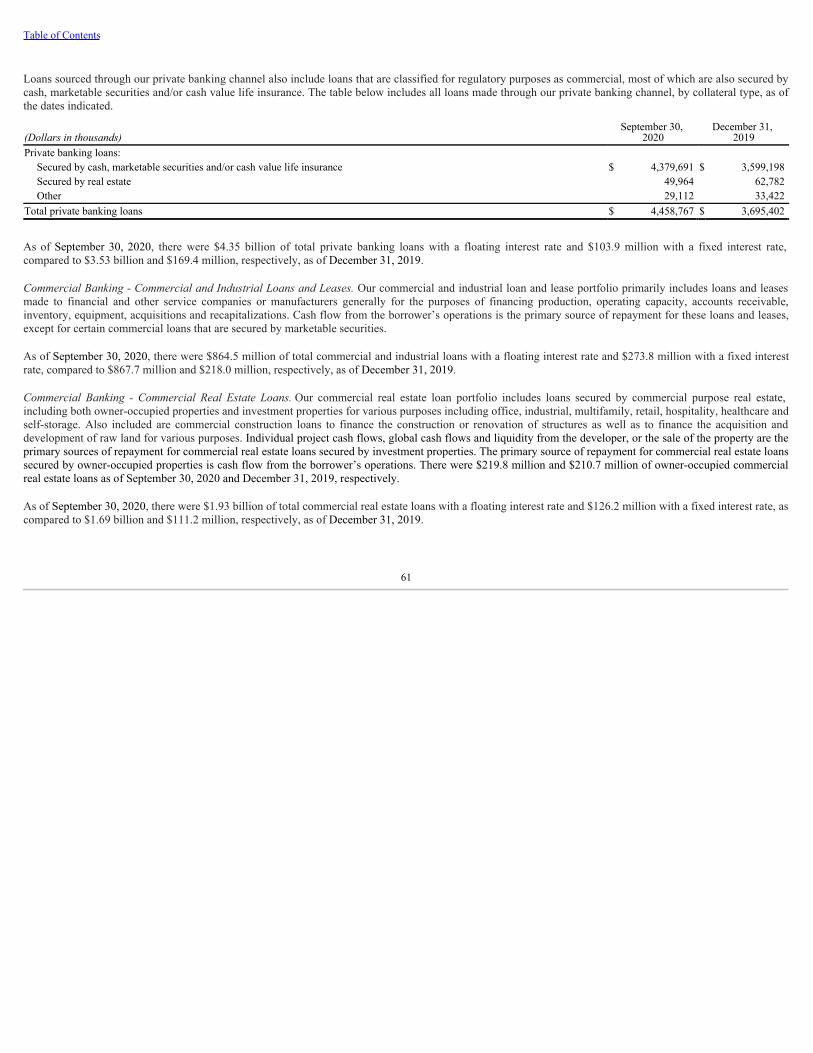
Table of Contents
Loans sourced through our private banking channel also include loans that are classified for regulatory purposes as commercial, most of which are also secured bycash, marketable securities and/or cash value life insurance. The table below includes all loans made through our private banking channel, by collateral type, as ofthe dates indicated.
(Dollars in thousands)September 30,
2020December 31,
2019Private banking loans:
Secured by cash, marketable securities and/or cash value life insurance $ 4,379,691 $ 3,599,198 Secured by real estate 49,964 62,782 Other 29,112 33,422
Total private banking loans $ 4,458,767 $ 3,695,402
As of September 30, 2020, there were $4.35 billion of total private banking loans with a floating interest rate and $103.9 million with a fixed interest rate,compared to $3.53 billion and $169.4 million, respectively, as of December 31, 2019.
Commercial Banking - Commercial and Industrial Loans and Leases. Our commercial and industrial loan and lease portfolio primarily includes loans and leasesmade to financial and other service companies or manufacturers generally for the purposes of financing production, operating capacity, accounts receivable,inventory, equipment, acquisitions and recapitalizations. Cash flow from the borrower’s operations is the primary source of repayment for these loans and leases,except for certain commercial loans that are secured by marketable securities.
As of September 30, 2020, there were $864.5 million of total commercial and industrial loans with a floating interest rate and $273.8 million with a fixed interestrate, compared to $867.7 million and $218.0 million, respectively, as of December 31, 2019.
Commercial Banking - Commercial Real Estate Loans. Our commercial real estate loan portfolio includes loans secured by commercial purpose real estate,including both owner-occupied properties and investment properties for various purposes including office, industrial, multifamily, retail, hospitality, healthcare andself-storage. Also included are commercial construction loans to finance the construction or renovation of structures as well as to finance the acquisition anddevelopment of raw land for various purposes. Individual project cash flows, global cash flows and liquidity from the developer, or the sale of the property are theprimary sources of repayment for commercial real estate loans secured by investment properties. The primary source of repayment for commercial real estate loanssecured by owner-occupied properties is cash flow from the borrower’s operations. There were $219.8 million and $210.7 million of owner-occupied commercialreal estate loans as of September 30, 2020 and December 31, 2019, respectively.
As of September 30, 2020, there were $1.93 billion of total commercial real estate loans with a floating interest rate and $126.2 million with a fixed interest rate, ascompared to $1.69 billion and $111.2 million, respectively, as of December 31, 2019.
61

Table of Contents
Loan and Lease Maturities and Interest Rate Sensitivity
The following table presents the contractual maturity ranges and the amount of such loans and leases with fixed and adjustable rates in each maturity range as ofthe date indicated.
September 30, 2020
(Dollars in thousands) Due on DemandOne Year
or LessOne to
Five YearsGreater Than
Five Years TotalMaturity:
Private banking $ 4,215,454 $ 56,530 $ 83,177 $ 103,606 $ 4,458,767 Commercial and industrial 6,282 313,702 651,844 166,460 1,138,288 Commercial real estate — 375,805 798,556 883,030 2,057,391
Loans and leases held-for-investment $ 4,221,736 $ 746,037 $ 1,533,577 $ 1,153,096 $ 7,654,446
Interest rate sensitivity:Fixed interest rates $ 76,019 $ 33,260 $ 226,591 $ 168,071 $ 503,941 Floating or adjustable interest rates 4,145,717 712,777 1,306,986 985,025 7,150,505
Loans and leases held-for-investment $ 4,221,736 $ 746,037 $ 1,533,577 $ 1,153,096 $ 7,654,446
Interest Reserve Loans
As of September 30, 2020, loans with interest reserves totaled $327.8 million, which represented 4.3% of loans and leases held-for-investment, compared to $348.0million, or 5.3%, as of December 31, 2019. Certain loans reserve a portion of the proceeds to be used to pay interest due on the loan. These loans with interestreserves are common for construction and land development loans. The use of interest reserves is based on the project budget and schedule for completion, thefeasibility of the project, the creditworthiness of the borrower and guarantors, and the loan to value coverage of the collateral. The interest reserve may be used bythe borrower, when certain financial conditions are met, to draw loan funds to pay interest charges on the outstanding balance of the loan. When drawn, the interestis capitalized and added to the loan balance, subject to conditions specified during the initial underwriting and at the time the credit is approved. We haveprocedures and controls for monitoring compliance with loan covenants, advancing funds and determining default conditions.
Allowance for Loan and Lease Losses
Our allowance for loan and lease losses represents our estimate of probable losses inherent in the loan and lease portfolio at a specific point in time. This estimateincludes losses associated with specifically identified loans, as well as estimated probable credit losses inherent in the remainder of the loan and lease portfolio.Additions are made to the allowance through both periodic provisions recorded in the consolidated statements of income and recoveries of losses previouslyincurred. Reductions to the allowance occur as loans and lease are charged off or when the credit history of any of the three loan portfolios improves. Refer to Note1, Summary of Significant Accounting Policies and Note 4, Allowance for Loan and Lease Losses, to our unaudited condensed consolidated financial statementsfor more details on the Company’s allowance for loan and lease losses.
The following table summarizes the allowance for loan and lease losses, as of the dates indicated:
(Dollars in thousands)September 30,
2020December 31,
2019General reserves $ 29,186 $ 13,937 Specific reserves 1,520 171 Total allowance for loan and lease losses $ 30,706 $ 14,108 Allowance for loan and lease losses to loans and leases 0.40 % 0.21 %
As of September 30, 2020, we had specific reserves totaling $1.5 million related to impaired loans with an aggregated total outstanding balance of $6.8 million. Asof December 31, 2019, we had specific reserves totaling $171,000 related to impaired loans with an aggregated total outstanding balance of $171,000. These loanswere on non-accrual status as of September 30, 2020 and December 31, 2019, respectively.
62

Table of Contents
The following table summarizes allowance for loan and lease losses and the percentage of loans and leases by category, as of the dates indicated:
September 30, 2020 December 31, 2019(Dollars in thousands) Reserve Percent of Loans Reserve Percent of LoansPrivate banking $ 2,210 58.3 % $ 1,973 56.2 %Commercial and industrial 7,772 14.9 % 5,262 16.5 %Commercial real estate 20,724 26.8 % 6,873 27.3 %Total allowance for loan and lease losses $ 30,706 100.0 % $ 14,108 100.0 %
Allowance for Loan and Lease Losses as of September 30, 2020 and December 31, 2019. Our allowance for loan and lease losses increased to $30.7 million, or0.40% of loans as of September 30, 2020, compared to $14.1 million, or 0.21% of loans, as of December 31, 2019. Our allowance for loan and lease lossesincreased to 0.96% of commercial loans (excluding private banking loans primarily collateralized by liquid, marketable securities) as of September 30, 2020,compared to 0.49% of commercial loans as of December 31, 2019. Our allowance for loan and lease losses increased due to adjustments to the qualitative riskfactors in response to economic uncertainty around the COVID-19 pandemic as well as the growth in our loan portfolio. Our allowance related to private bankingloans increased $237,000 from December 31, 2019 to September 30, 2020, primarily due to an increase in general reserves attributable to growth and qualitativeadjustments in the portfolio, partially offset by decreased specific reserves related to a charge-off. Our allowance for loan and lease losses related to commercialand industrial loans increased $2.5 million from December 31, 2019 to September 30, 2020, which was attributable to higher general reserves due to growth andqualitative adjustments in our portfolio. Our allowance for loan and lease losses related to commercial real estate loans increased by $13.9 million fromDecember 31, 2019 to September 30, 2020, due to increased general reserves due to growth and qualitative adjustments in addition to increased specific reservesrelated to the addition of a non-accrual loan. As previously mentioned, we have elected to delay implementation of CECL, in accordance with relief provided bythe CARES Act. See “Recent Accounting Pronouncements and Developments” for more information on our decision to delay implementation of CECL.
Charge-Offs and Recoveries
Our charge-off policy for commercial and private banking loans and leases requires that obligations that are not collectible be promptly charged off in the monththe loss becomes probable, regardless of the delinquency status of the loan or lease. We recognize a partial charge-off when we have determined that the value ofthe collateral is less than the remaining ledger balance at the time of the evaluation. An obligation is not required to be charged off, regardless of delinquencystatus, if we have determined there exists sufficient collateral to protect the remaining loan or lease balance and there exists a strategy to liquidate the collateral.We may also consider a number of other factors to determine when a charge-off is appropriate, including: the status of a bankruptcy proceeding, the value ofcollateral and probability of successful liquidation, and the status of adverse proceedings or litigation that may result in collection.
63

Table of Contents
The following table provides an analysis of the allowance for loan and lease losses, charge-offs, recoveries and provision for loan and lease losses for the periodsindicated:
Three Months Ended September 30, Nine Months Ended September 30,(Dollars in thousands) 2020 2019 2020 2019Beginning balance $ 23,276 $ 14,016 $ 14,108 $ 13,208 Charge-offs:
Private banking — (112) (171) (112)Commercial and industrial — — — — Commercial real estate — — — —
Total charge-offs — (112) (171) (112)Recoveries:
Private banking — — — — Commercial and industrial — 77 341 1,974 Commercial real estate — — — —
Total recoveries — 77 341 1,974 Net recoveries (charge-offs) — (35) 170 1,862 Provision (credit) for loan and lease losses 7,430 (607) 16,428 (1,696)Ending balance $ 30,706 $ 13,374 $ 30,706 $ 13,374
Net loan charge-offs (recoveries) to average total loans, annualized — % — % — % (0.05)%Provision (credit) for loan and lease losses to average total loans, annualized 0.40 % (0.04)% 0.31 % (0.04)%
Non-Performing Assets
Non-performing assets consist of non-performing loans and OREO. Non-performing loans are loans that are on non-accrual status. OREO is real property acquiredthrough foreclosure on the collateral underlying defaulted loans and includes in-substance foreclosures. We record OREO at fair value, less estimated costs to sellthe assets.
Our policy is to place loans in all categories on non-accrual status when collection of interest or principal is doubtful, or when interest or principal payments are 90days or more past due. There were no loans 90 days or more past due and still accruing interest as of September 30, 2020 and December 31, 2019, and there was nointerest income recognized on loans while on non-accrual status for the nine months ended September 30, 2020 and 2019. As of September 30, 2020, non-performing loans were $6.8 million, or 0.09% of total loans, compared to $184,000, or 0.00% of total loans, as of December 31, 2019. We had specific reserves of$1.5 million and $171,000 as of September 30, 2020 and December 31, 2019, respectively, on these non-performing loans. The net loan balance of our non-performing loans was 77.3% and 6.3% of the customer’s outstanding balance after payments, charge-offs and specific reserves as of September 30, 2020 andDecember 31, 2019, respectively.
For additional information on our non-performing loans as of September 30, 2020 and December 31, 2019, refer to Note 4, Allowance for Loan and Lease Losses,to our unaudited condensed consolidated financial statements.
Once the determination is made that a foreclosure is necessary, the loan is reclassified as “in-substance foreclosure” until a sale date and title to the property isfinalized. Once we own the property, it is maintained, marketed, and rented or sold to repay the original loan. Historically, foreclosure trends in our loan portfoliohave been low due to the credit quality of the real estate portfolio. Any loans that are modified or extended are reviewed for potential classification as a troubleddebt restructuring (“TDR”) loan. For borrowers that are experiencing financial difficulty, we complete a process that outlines the terms of the modification, thereasons for the proposed modification, and documents the current status of the borrower.
In response to the COVID-19 pandemic and its economic impact on our customers, we implemented a short-term loan modification program in compliance withthe CARES Act and applicable regulatory guidance to provide temporary payment relief to those borrowers directly impacted by COVID-19. Through September30, 2020, we granted temporary modifications on approximately 115 loans totaling approximately $467.2 million, of which just under half or $223.8 million hasalready resumed payment as of September 30, 2020. Under the applicable guidance, these loan modifications were not considered TDRs. The vast majority of ourloans that are still in deferral status are in our commercial real estate loan portfolio secured by office, retail, hotel properties and multifamily properties, whichcomprised of over 80% of the deferral population.
64

Table of Contents
We had non-performing assets of $9.5 million, or 0.10% of total assets, as of September 30, 2020, as compared to $4.4 million, or 0.06% of total assets, as ofDecember 31, 2019. The increase in non-performing assets was primarily due to the addition of new non-performing loans of $6.8 million, partially offset by thesale of a property in OREO. As of September 30, 2020 and December 31, 2019, we had OREO properties totaling $2.7 million and $4.3 million, respectively. Thedecrease in OREO was due to a property that was sold for $1.5 million during the nine months ended September 30, 2020.
The following table summarizes our non-performing assets as of the dates indicated:
(Dollars in thousands)September 30,
2020December 31,
2019Non-performing loans:
Private banking $ — $ 184 Commercial and industrial 458 — Commercial real estate 6,296 —
Total non-performing loans $ 6,754 $ 184 Other real estate owned 2,724 4,250
Total non-performing assets $ 9,478 $ 4,434
Non-performing troubled debt restructured loans $ — $ 171 Non-performing loans to total loans 0.09 % — %Allowance for loan and lease losses to non-performing loans 454.63 % 7,667.39 %Non-performing assets to total assets 0.10 % 0.06 %
Potential Problem Loans
Potential problem loans are those loans that are not categorized as non-performing loans, but where current information indicates that the borrower may not be ableto comply with repayment terms. Among other factors, we monitor the past due status as an indicator of credit deterioration and potential problem loans. A loan isconsidered past due when the contractual principal and/or interest due in accordance with the terms of the loan agreement remains unpaid after the due date of thescheduled payment. To the extent that loans become past due, we assess the potential for loss on such loans as we would with other problem loans and consider theeffect of any potential loss in determining any provision for loan and lease losses. We also assess alternatives to maximize collection of any past due loans,including and without limitation, restructuring loan terms, requiring additional loan guarantee(s) or collateral, or other planned action.
For additional information on the age analysis of past due loans segregated by class of loan for September 30, 2020 and December 31, 2019, refer to Note 4,Allowance for Loan and Lease Losses, to our unaudited condensed consolidated financial statements.
On a monthly basis, we monitor various credit quality indicators for our loan portfolio, including delinquency, non-performing status, changes in risk ratings,changes in the underlying performance of the borrowers and other relevant factors. On a daily basis, we monitor the collateral of loans secured by cash, marketablesecurities and/or cash value life insurance within the private banking portfolio, which further reduces the risk profile of that portfolio.
Loan risk ratings are assigned based on the creditworthiness of the borrower and the quality of the collateral for loans secured by marketable securities. Loan riskratings are reviewed on an ongoing basis according to internal policies. Loans within the pass rating are believed to have a lower risk of loss than loans that are riskrated as special mention, substandard or doubtful, which are believed to have an increasing risk of loss. Our internal risk ratings are consistent with regulatoryguidance. We also monitor the loan portfolio through a formal periodic review process. All non-pass rated loans are reviewed monthly and higher risk-rated loanswithin the pass category are reviewed three times a year.
For additional information on the definitions of our internal risk rating and the recorded investment in loans by credit quality indicator for September 30, 2020 andDecember 31, 2019, refer to Note 4, Allowance for Loan and Lease Losses, to our unaudited condensed consolidated financial statements.
Investment Securities
We utilize investment activities to enhance net interest income while supporting liquidity management and interest rate risk management. Our securities portfolioconsists of available-for-sale debt securities, held-to-maturity debt securities and, from time to time, debt securities held for trading purposes. Also included in ourinvestment securities is FHLB stock. For additional information on FHLB stock, refer to Note 2, Investment Securities, to our unaudited condensed consolidatedfinancial statements. Debt securities
65

Table of Contents
purchased with the intent to sell under trading activity are recorded at fair value and changes to fair value are recognized in the consolidated statements of income.Debt securities categorized as available-for-sale are recorded at fair value and changes in the fair value of these securities are recognized as a component of totalshareholders’ equity, within accumulated other comprehensive income (loss), net of deferred taxes. Debt securities categorized as held-to-maturity are securitiesthat the Company intends to hold until maturity and are recorded at amortized cost.
The Bank has engaged Chartwell to provide securities portfolio advisory services, subject to the investment parameters set forth in our investment policy.
As of September 30, 2020 and December 31, 2019, we reported debt securities in available-for-sale and held-to-maturity categories. In general, fair value is basedon quoted market prices of identical assets, when available. Where sufficient data is not available to produce a fair valuation, fair value is based on broker quotesfor similar assets. We validate the prices received from these third parties on a quarterly basis by comparing them to prices provided by a different independentpricing service. We have also reviewed the valuation methodologies provided to us by our pricing services. Broker quotes may be adjusted to ensure that financialinstruments are recorded at fair value. Adjustments may include unobservable parameters, among other things. Securities, like loans, are subject to interest rate riskand credit risk. In addition, by their nature, debt securities classified as available-for-sale, and trading securities are also subject to fair value risks that couldnegatively affect the level of liquidity available to us, as well as shareholders’ equity.
We perform a quarterly review of our investment securities to identify those that may indicate other-than-temporary impairment (“OTTI”). Our policy for OTTI isbased on a number of factors, including, but not limited to the length of time and extent to which the estimated fair value has been less than cost, the financialcondition of the underlying issuer, the ability of the issuer to meet contractual obligations, the likelihood of the investment security’s ability to recover any declinein its estimated fair value and, for debt securities, whether we intend to sell the security or if it is more likely than not that we will be required to sell the securityprior to its recovery. If the financial markets experience deterioration, charges to income could occur in future periods as a result of OTTI determinations.
Our available-for-sale debt securities portfolio consists of U.S. government agency obligations, mortgage-backed securities, collateralized mortgage obligations,corporate bonds and single-issuer trust preferred securities, all with varying contractual maturities. Our held-to-maturity debt securities consists of certainmunicipal bonds, agency obligations, mortgage-backed securities and corporate bonds while our trading portfolio, when active, typically consists of U.S. treasurynotes, also with varying contractual maturities. However, these maturities do not necessarily represent the expected life of certain securities as the securities maybe called or paid down without penalty prior to their stated maturities. The effective duration of our debt securities portfolio as of September 30, 2020, wasapproximately 1.7, where duration is defined as the approximate percentage change in price for a 100 basis point change in rates. No investment in any of thesesecurities exceeds any applicable limitation imposed by law or regulation. Our ALCO reviews the investment portfolio on an ongoing basis to ensure that theinvestments conform to our investment policy.
Available-for-Sale Debt Securities. We held $552.9 million and $248.8 million in debt securities available-for-sale as of September 30, 2020 and December 31,2019, respectively. The increase of $304.1 million was primarily attributable to purchases of $467.2 million, net of prepayments, calls and maturities of $44.3million and sales of $120.4 million for certain securities during the nine months ended September 30, 2020.
On a fair value basis, 26.4% of our available-for-sale debt securities as of September 30, 2020, were floating-rate securities, for which yields increase or decreasebased on changes in market interest rates. As of December 31, 2019, floating-rate securities comprised 45.8% of our available-for-sale debt securities.
On a fair value basis, 64.9% of our available-for-sale debt securities as of September 30, 2020, were U.S. government and agency securities, which tend to have alower risk profile than certain corporate bonds and single-issuer trust preferred securities, which comprised the remainder of the portfolio. As of December 31,2019, agency securities comprised 22.1% of our available-for-sale debt securities.
Held-to-Maturity Debt Securities. We held $254.0 million and $196.0 million in debt securities held-to-maturity as of September 30, 2020 and December 31, 2019,respectively. The increase of $58.0 million was primarily attributable to purchases of $436.8 million for certain securities, net of calls and maturities of $378.4million, during the nine months ended September 30, 2020. As part of our asset and liability management strategy, we determined that we have the intent andability to hold these bonds until maturity, and these securities were reported at amortized cost as of September 30, 2020 and December 31, 2019.
Trading Debt Securities. We held no trading debt securities as of September 30, 2020 and December 31, 2019.
66
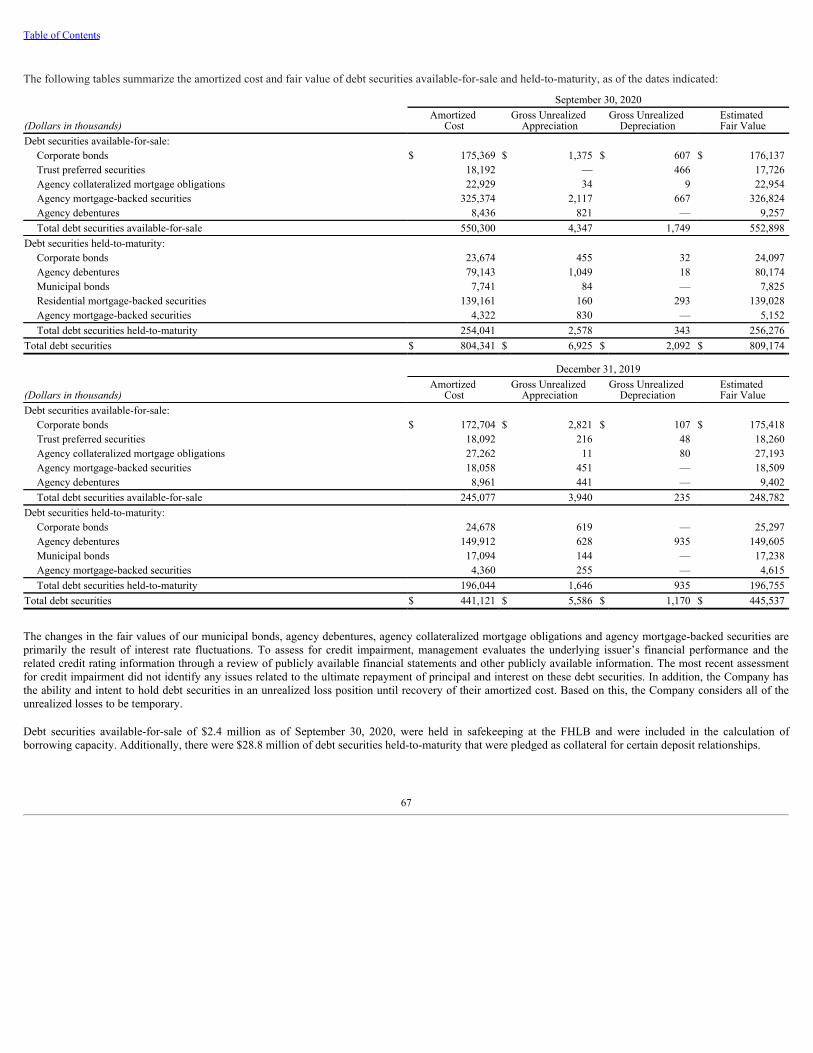
Table of Contents
The following tables summarize the amortized cost and fair value of debt securities available-for-sale and held-to-maturity, as of the dates indicated:
September 30, 2020
(Dollars in thousands)Amortized
CostGross Unrealized
AppreciationGross Unrealized
DepreciationEstimated Fair Value
Debt securities available-for-sale:Corporate bonds $ 175,369 $ 1,375 $ 607 $ 176,137 Trust preferred securities 18,192 — 466 17,726 Agency collateralized mortgage obligations 22,929 34 9 22,954 Agency mortgage-backed securities 325,374 2,117 667 326,824 Agency debentures 8,436 821 — 9,257 Total debt securities available-for-sale 550,300 4,347 1,749 552,898
Debt securities held-to-maturity:Corporate bonds 23,674 455 32 24,097 Agency debentures 79,143 1,049 18 80,174 Municipal bonds 7,741 84 — 7,825 Residential mortgage-backed securities 139,161 160 293 139,028 Agency mortgage-backed securities 4,322 830 — 5,152 Total debt securities held-to-maturity 254,041 2,578 343 256,276
Total debt securities $ 804,341 $ 6,925 $ 2,092 $ 809,174
December 31, 2019
(Dollars in thousands)Amortized
CostGross Unrealized
AppreciationGross Unrealized
DepreciationEstimated Fair Value
Debt securities available-for-sale:Corporate bonds $ 172,704 $ 2,821 $ 107 $ 175,418 Trust preferred securities 18,092 216 48 18,260 Agency collateralized mortgage obligations 27,262 11 80 27,193 Agency mortgage-backed securities 18,058 451 — 18,509 Agency debentures 8,961 441 — 9,402 Total debt securities available-for-sale 245,077 3,940 235 248,782
Debt securities held-to-maturity:Corporate bonds 24,678 619 — 25,297 Agency debentures 149,912 628 935 149,605 Municipal bonds 17,094 144 — 17,238 Agency mortgage-backed securities 4,360 255 — 4,615 Total debt securities held-to-maturity 196,044 1,646 935 196,755
Total debt securities $ 441,121 $ 5,586 $ 1,170 $ 445,537
The changes in the fair values of our municipal bonds, agency debentures, agency collateralized mortgage obligations and agency mortgage-backed securities areprimarily the result of interest rate fluctuations. To assess for credit impairment, management evaluates the underlying issuer’s financial performance and therelated credit rating information through a review of publicly available financial statements and other publicly available information. The most recent assessmentfor credit impairment did not identify any issues related to the ultimate repayment of principal and interest on these debt securities. In addition, the Company hasthe ability and intent to hold debt securities in an unrealized loss position until recovery of their amortized cost. Based on this, the Company considers all of theunrealized losses to be temporary.
Debt securities available-for-sale of $2.4 million as of September 30, 2020, were held in safekeeping at the FHLB and were included in the calculation ofborrowing capacity. Additionally, there were $28.8 million of debt securities held-to-maturity that were pledged as collateral for certain deposit relationships.
67
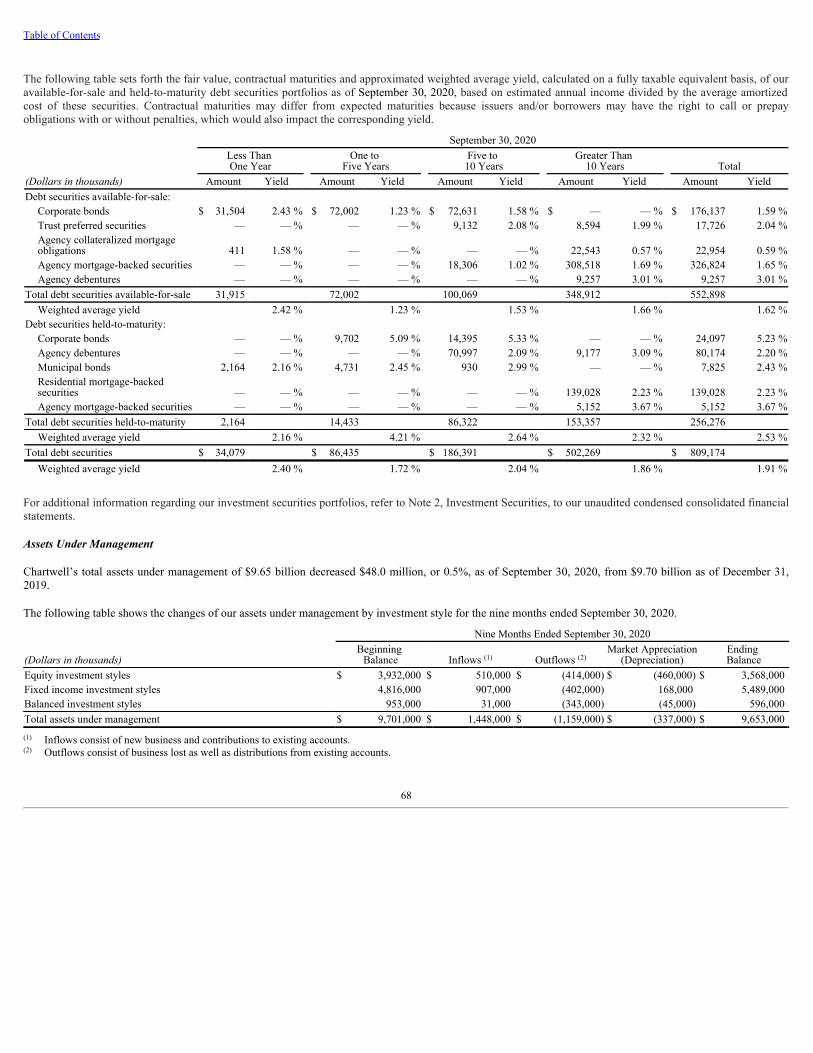
Table of Contents
The following table sets forth the fair value, contractual maturities and approximated weighted average yield, calculated on a fully taxable equivalent basis, of ouravailable-for-sale and held-to-maturity debt securities portfolios as of September 30, 2020, based on estimated annual income divided by the average amortizedcost of these securities. Contractual maturities may differ from expected maturities because issuers and/or borrowers may have the right to call or prepayobligations with or without penalties, which would also impact the corresponding yield.
September 30, 2020Less Than One Year
One to Five Years
Five to 10 Years
Greater Than 10 Years Total
(Dollars in thousands) Amount Yield Amount Yield Amount Yield Amount Yield Amount YieldDebt securities available-for-sale:
Corporate bonds $ 31,504 2.43 % $ 72,002 1.23 % $ 72,631 1.58 % $ — — % $ 176,137 1.59 %Trust preferred securities — — % — — % 9,132 2.08 % 8,594 1.99 % 17,726 2.04 %Agency collateralized mortgageobligations 411 1.58 % — — % — — % 22,543 0.57 % 22,954 0.59 %Agency mortgage-backed securities — — % — — % 18,306 1.02 % 308,518 1.69 % 326,824 1.65 %Agency debentures — — % — — % — — % 9,257 3.01 % 9,257 3.01 %
Total debt securities available-for-sale 31,915 72,002 100,069 348,912 552,898 Weighted average yield 2.42 % 1.23 % 1.53 % 1.66 % 1.62 %
Debt securities held-to-maturity:Corporate bonds — — % 9,702 5.09 % 14,395 5.33 % — — % 24,097 5.23 %Agency debentures — — % — — % 70,997 2.09 % 9,177 3.09 % 80,174 2.20 %Municipal bonds 2,164 2.16 % 4,731 2.45 % 930 2.99 % — — % 7,825 2.43 %Residential mortgage-backedsecurities — — % — — % — — % 139,028 2.23 % 139,028 2.23 %Agency mortgage-backed securities — — % — — % — — % 5,152 3.67 % 5,152 3.67 %
Total debt securities held-to-maturity 2,164 14,433 86,322 153,357 256,276 Weighted average yield 2.16 % 4.21 % 2.64 % 2.32 % 2.53 %
Total debt securities $ 34,079 $ 86,435 $ 186,391 $ 502,269 $ 809,174 Weighted average yield 2.40 % 1.72 % 2.04 % 1.86 % 1.91 %
For additional information regarding our investment securities portfolios, refer to Note 2, Investment Securities, to our unaudited condensed consolidated financialstatements.
Assets Under Management
Chartwell’s total assets under management of $9.65 billion decreased $48.0 million, or 0.5%, as of September 30, 2020, from $9.70 billion as of December 31,2019.
The following table shows the changes of our assets under management by investment style for the nine months ended September 30, 2020.
Nine Months Ended September 30, 2020
(Dollars in thousands)Beginning
Balance Inflows Outflows Market Appreciation
(Depreciation)Ending Balance
Equity investment styles $ 3,932,000 $ 510,000 $ (414,000) $ (460,000) $ 3,568,000 Fixed income investment styles 4,816,000 907,000 (402,000) 168,000 5,489,000 Balanced investment styles 953,000 31,000 (343,000) (45,000) 596,000 Total assets under management $ 9,701,000 $ 1,448,000 $ (1,159,000) $ (337,000) $ 9,653,000
Inflows consist of new business and contributions to existing accounts.Outflows consist of business lost as well as distributions from existing accounts.
(1) (2)
(1)
(2)
68

Table of Contents
Deposits
Deposits are our primary source of funds to support our earning assets. We have focused on creating and growing diversified, stable, and lower all-in cost depositchannels without operating through a traditional branch network. We market liquidity and treasury management products, payment processing products, and otherdeposit products to high-net-worth individuals, family offices, trust companies, wealth management firms, municipalities, endowments and foundations,broker/dealers, futures commission merchants, investment management firms, property management firms, payroll providers and other financial institutions. Webelieve that our deposit base is stable and diversified. We further believe we have the ability to attract new deposits, which is the primary source of funding ourprojected loan growth. With respect to our treasury management business, we utilize hybrid interest-bearing accounts that provide our clients with certainty aroundthe returns for their total cash position while enhancing our ability to obtain their full liquidity relationship and balance their expectations with our cost of fundsexpectations, rather than the more traditional combination of separate non-interest bearing and interest-bearing accounts.
We continue to enhance our liquidity and treasury management capabilities and team to support our efforts to grow this source of funding. Treasury managementdeposit accounts totaled $1.35 billion as of September 30, 2020, an increase of $273.0 million or 25.4%, from December 31, 2019.
The table below depicts average balances of, and rates paid on our deposit portfolio by major deposit category for the three months ended September 30, 2020 and2019.
Three Months Ended September 30,2020 2019
(Dollars in thousands) Average Amount Average Rate Paid Average Amount Average Rate Paid Interest-bearing checking accounts $ 2,866,303 0.46 % $ 1,116,624 2.06 %Money market deposit accounts 3,811,100 0.72 % 3,106,186 2.41 %Certificates of deposit 1,121,824 1.30 % 1,462,521 2.56 %
Total average interest-bearing deposits 7,799,227 0.71 % 5,685,331 2.38 %Noninterest-bearing deposits 407,079 — 268,013 —
Total average deposits $ 8,206,306 0.67 % $ 5,953,344 2.27 %
Annualized
Average Deposits for the Three Months Ended September 30, 2020 and 2019. For the three months ended September 30, 2020, our average total deposits were$8.21 billion, representing an increase of $2.25 billion, or 37.8%, from the same period in 2019. The deposit growth was driven by increases in our interest-bearingchecking account, money market deposit account and noninterest-bearing deposit account categories. Our average cost of interest-bearing deposits decreased 167basis points to 0.71% for the three months ended September 30, 2020, from 2.38% for the same period in 2019, as average rates paid were lower in all interest-bearing deposit categories, which was primarily driven by the recent decrease to the Federal Reserve’s target federal funds rate, which impacted our variable-ratedeposits. Average interest-bearing checking accounts increased to 36.8% of total average interest-bearing deposits for the three months ended September 30, 2020,compared to 19.6% for the same period in 2019. Average money market deposits decreased to 48.8% of total average interest-bearing deposits for the three monthsended September 30, 2020, from 54.7% for the same period in 2019. Average certificates of deposit decreased to 14.4% of total average interest-bearing depositsfor the three months ended September 30, 2020, compared to 25.7% for the same period in 2019. Average noninterest-bearing deposits increased $139.1 million, or51.9%, in the three months ended September 30, 2020, from the three months ended September 30, 2019, and the average cost of total deposits decreased 160 basispoints to 0.67% for the three months ended September 30, 2020, from 2.27% for the same period in 2019. We focus only on high quality loan growth and in theabsence of this, we increase our assets through cash and cash equivalents as well as adding to our investment portfolio as part of our strategy to build greater onbalance sheet liquidity funded through our deposits.
(1) (1)
(1)
69
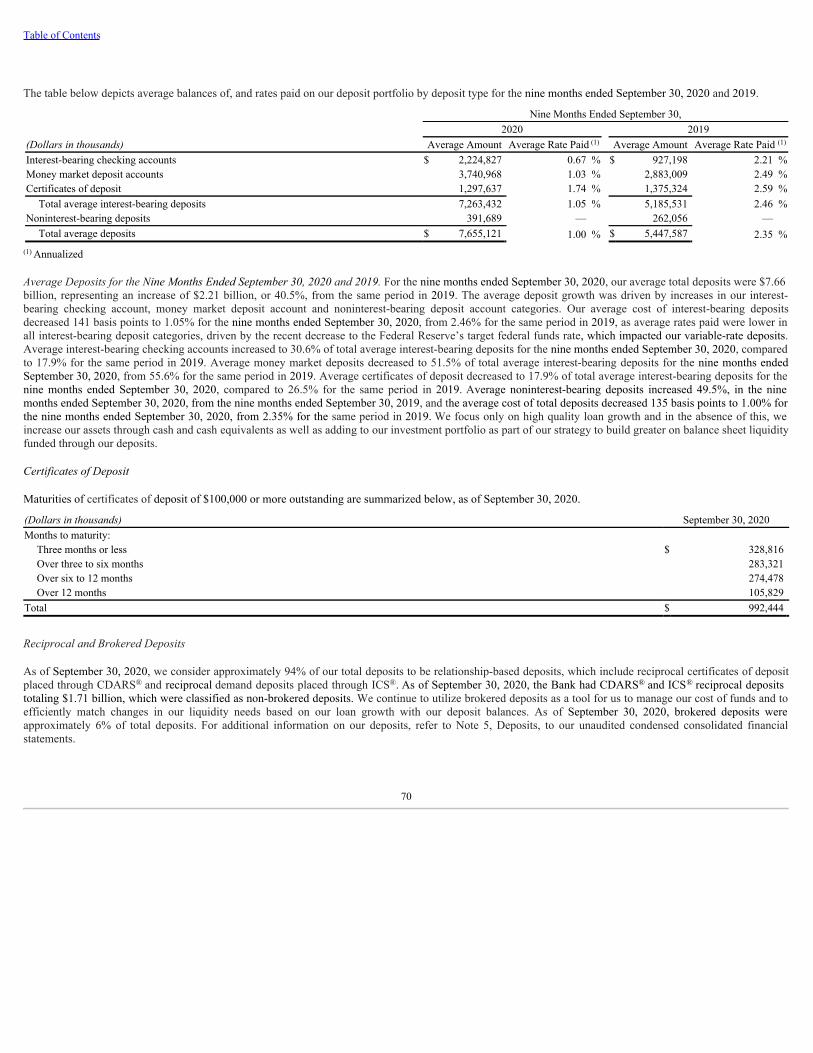
Table of Contents
The table below depicts average balances of, and rates paid on our deposit portfolio by deposit type for the nine months ended September 30, 2020 and 2019.
Nine Months Ended September 30,2020 2019
(Dollars in thousands) Average Amount Average Rate Paid Average Amount Average Rate Paid Interest-bearing checking accounts $ 2,224,827 0.67 % $ 927,198 2.21 %Money market deposit accounts 3,740,968 1.03 % 2,883,009 2.49 %Certificates of deposit 1,297,637 1.74 % 1,375,324 2.59 %
Total average interest-bearing deposits 7,263,432 1.05 % 5,185,531 2.46 %Noninterest-bearing deposits 391,689 — 262,056 —
Total average deposits $ 7,655,121 1.00 % $ 5,447,587 2.35 %
Annualized
Average Deposits for the Nine Months Ended September 30, 2020 and 2019. For the nine months ended September 30, 2020, our average total deposits were $7.66billion, representing an increase of $2.21 billion, or 40.5%, from the same period in 2019. The average deposit growth was driven by increases in our interest-bearing checking account, money market deposit account and noninterest-bearing deposit account categories. Our average cost of interest-bearing depositsdecreased 141 basis points to 1.05% for the nine months ended September 30, 2020, from 2.46% for the same period in 2019, as average rates paid were lower inall interest-bearing deposit categories, driven by the recent decrease to the Federal Reserve’s target federal funds rate, which impacted our variable-rate deposits.Average interest-bearing checking accounts increased to 30.6% of total average interest-bearing deposits for the nine months ended September 30, 2020, comparedto 17.9% for the same period in 2019. Average money market deposits decreased to 51.5% of total average interest-bearing deposits for the nine months endedSeptember 30, 2020, from 55.6% for the same period in 2019. Average certificates of deposit decreased to 17.9% of total average interest-bearing deposits for thenine months ended September 30, 2020, compared to 26.5% for the same period in 2019. Average noninterest-bearing deposits increased 49.5%, in the ninemonths ended September 30, 2020, from the nine months ended September 30, 2019, and the average cost of total deposits decreased 135 basis points to 1.00% forthe nine months ended September 30, 2020, from 2.35% for the same period in 2019. We focus only on high quality loan growth and in the absence of this, weincrease our assets through cash and cash equivalents as well as adding to our investment portfolio as part of our strategy to build greater on balance sheet liquidityfunded through our deposits.
Certificates of Deposit
Maturities of certificates of deposit of $100,000 or more outstanding are summarized below, as of September 30, 2020.
(Dollars in thousands) September 30, 2020Months to maturity:
Three months or less $ 328,816 Over three to six months 283,321 Over six to 12 months 274,478 Over 12 months 105,829
Total $ 992,444
Reciprocal and Brokered Deposits
As of September 30, 2020, we consider approximately 94% of our total deposits to be relationship-based deposits, which include reciprocal certificates of depositplaced through CDARS and reciprocal demand deposits placed through ICS . As of September 30, 2020, the Bank had CDARS and ICS reciprocal depositstotaling $1.71 billion, which were classified as non-brokered deposits. We continue to utilize brokered deposits as a tool for us to manage our cost of funds and toefficiently match changes in our liquidity needs based on our loan growth with our deposit balances. As of September 30, 2020, brokered deposits wereapproximately 6% of total deposits. For additional information on our deposits, refer to Note 5, Deposits, to our unaudited condensed consolidated financialstatements.
(1) (1)
(1)
® ® ® ®
70
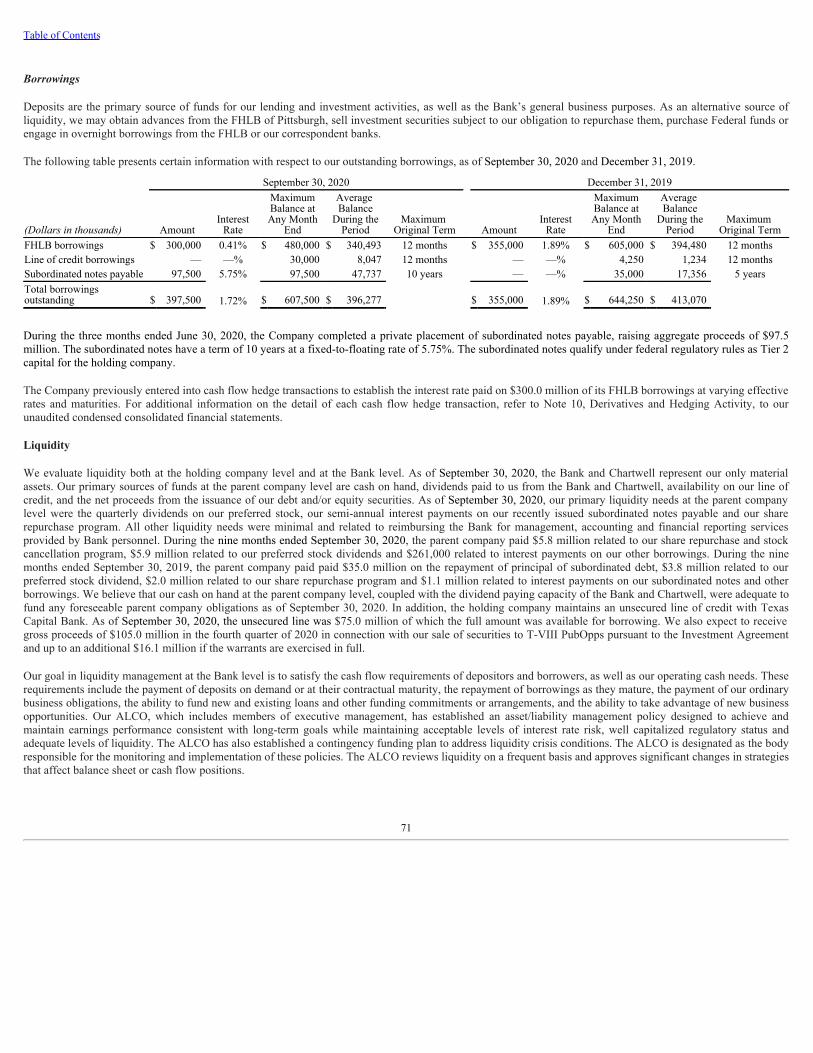
Table of Contents
Borrowings
Deposits are the primary source of funds for our lending and investment activities, as well as the Bank’s general business purposes. As an alternative source ofliquidity, we may obtain advances from the FHLB of Pittsburgh, sell investment securities subject to our obligation to repurchase them, purchase Federal funds orengage in overnight borrowings from the FHLB or our correspondent banks.
The following table presents certain information with respect to our outstanding borrowings, as of September 30, 2020 and December 31, 2019.
September 30, 2020 December 31, 2019
(Dollars in thousands) AmountInterest
Rate
MaximumBalance atAny Month
End
Average Balance
During thePeriod
Maximum Original Term Amount
InterestRate
MaximumBalance atAny Month
End
Average Balance
During thePeriod
Maximum Original Term
FHLB borrowings $ 300,000 0.41% $ 480,000 $ 340,493 12 months $ 355,000 1.89% $ 605,000 $ 394,480 12 monthsLine of credit borrowings — —% 30,000 8,047 12 months — —% 4,250 1,234 12 monthsSubordinated notes payable 97,500 5.75% 97,500 47,737 10 years — —% 35,000 17,356 5 yearsTotal borrowingsoutstanding $ 397,500 1.72% $ 607,500 $ 396,277 $ 355,000 1.89% $ 644,250 $ 413,070
During the three months ended June 30, 2020, the Company completed a private placement of subordinated notes payable, raising aggregate proceeds of $97.5million. The subordinated notes have a term of 10 years at a fixed-to-floating rate of 5.75%. The subordinated notes qualify under federal regulatory rules as Tier 2capital for the holding company.
The Company previously entered into cash flow hedge transactions to establish the interest rate paid on $300.0 million of its FHLB borrowings at varying effectiverates and maturities. For additional information on the detail of each cash flow hedge transaction, refer to Note 10, Derivatives and Hedging Activity, to ourunaudited condensed consolidated financial statements.
Liquidity
We evaluate liquidity both at the holding company level and at the Bank level. As of September 30, 2020, the Bank and Chartwell represent our only materialassets. Our primary sources of funds at the parent company level are cash on hand, dividends paid to us from the Bank and Chartwell, availability on our line ofcredit, and the net proceeds from the issuance of our debt and/or equity securities. As of September 30, 2020, our primary liquidity needs at the parent companylevel were the quarterly dividends on our preferred stock, our semi-annual interest payments on our recently issued subordinated notes payable and our sharerepurchase program. All other liquidity needs were minimal and related to reimbursing the Bank for management, accounting and financial reporting servicesprovided by Bank personnel. During the nine months ended September 30, 2020, the parent company paid $5.8 million related to our share repurchase and stockcancellation program, $5.9 million related to our preferred stock dividends and $261,000 related to interest payments on our other borrowings. During the ninemonths ended September 30, 2019, the parent company paid paid $35.0 million on the repayment of principal of subordinated debt, $3.8 million related to ourpreferred stock dividend, $2.0 million related to our share repurchase program and $1.1 million related to interest payments on our subordinated notes and otherborrowings. We believe that our cash on hand at the parent company level, coupled with the dividend paying capacity of the Bank and Chartwell, were adequate tofund any foreseeable parent company obligations as of September 30, 2020. In addition, the holding company maintains an unsecured line of credit with TexasCapital Bank. As of September 30, 2020, the unsecured line was $75.0 million of which the full amount was available for borrowing. We also expect to receivegross proceeds of $105.0 million in the fourth quarter of 2020 in connection with our sale of securities to T-VIII PubOpps pursuant to the Investment Agreementand up to an additional $16.1 million if the warrants are exercised in full.
Our goal in liquidity management at the Bank level is to satisfy the cash flow requirements of depositors and borrowers, as well as our operating cash needs. Theserequirements include the payment of deposits on demand or at their contractual maturity, the repayment of borrowings as they mature, the payment of our ordinarybusiness obligations, the ability to fund new and existing loans and other funding commitments or arrangements, and the ability to take advantage of new businessopportunities. Our ALCO, which includes members of executive management, has established an asset/liability management policy designed to achieve andmaintain earnings performance consistent with long-term goals while maintaining acceptable levels of interest rate risk, well capitalized regulatory status andadequate levels of liquidity. The ALCO has also established a contingency funding plan to address liquidity crisis conditions. The ALCO is designated as the bodyresponsible for the monitoring and implementation of these policies. The ALCO reviews liquidity on a frequent basis and approves significant changes in strategiesthat affect balance sheet or cash flow positions.
71

Table of Contents
Sources of asset liquidity are cash, interest-earning deposits with other banks, federal funds sold, certain unpledged debt and equity securities, loan repayments(scheduled and unscheduled) and future earnings. Sources of liability liquidity include a stable deposit base, the ability to renew maturing certificates of deposit,borrowing availability at the FHLB of Pittsburgh, unsecured lines with other financial institutions, access to reciprocal CDARS and ICS deposits and brokereddeposits, and the ability to raise debt and equity. Customer deposits, which are an important source of liquidity, depend on the confidence of customers in us.Deposits are supported by our capital position and, up to applicable limits, the protection provided by FDIC insurance.
We measure and monitor liquidity on an ongoing basis, which allows us to more effectively understand and react to trends in our balance sheet. In addition, theALCO uses a variety of methods to monitor our liquidity position and liquidity needs, including a liquidity gap, which measures potential sources and uses offunds over future periods. We have established policy guidelines for a variety of liquidity-related performance metrics, such as net loans to deposits, brokeredfunding composition, cash to total loans and duration of certificates of deposit, among others, all of which are utilized in measuring and managing our liquidityposition. The ALCO performs contingency funding and capital stress analyses at least annually to determine our ability to meet potential liquidity and capital needsunder various stress scenarios.
In response to the public health and economic crisis resulting from COVID-19 pandemic, we intentionally increased our liquid assets as a component of our assetsand our deposits as a portion of our assets for the express purpose of carrying more on balance sheet liquidity to provide for potential or unforeseen clients’ needsduring the pandemic, in particular during the early stages of the government shut-down programs. Our strong liquidity position is due to our ability to generatestrong growth in deposits, which is evidenced by our ratio of total deposits to total assets of 86.2% and 85.4% as of September 30, 2020 and December 31, 2019,respectively. Our ratio of average deposits to average assets increased to 85.9% for the nine months ended September 30, 2020, from 83.8% for the same period in2019. As of September 30, 2020, we had available liquidity of $1.87 billion, or 19.7% of total assets. These sources consisted of available cash totaling $413.1million, or 4.4% of total assets, unpledged investment securities totaling $746.1 million, or 7.9% of total assets, and the ability to borrow from the FHLB andcorrespondent bank lines totaling $713.2 million, or 7.5% of total assets. Available cash excludes cash posted as collateral for derivative and letter of credittransactions and the reserve balance requirement at the Federal Reserve.
The following table shows our available liquidity, by source, as of the dates indicated:
(Dollars in thousands)September 30,
2020December 31,
2019Available cash $ 413,114 $ 167,695 Certain unpledged debt securities 746,058 400,222 Net borrowing capacity 713,153 569,132 Total liquidity $ 1,872,325 $ 1,137,049
For the nine months ended September 30, 2020, we generated $64.1 million of cash from operating activities, compared to $48.7 million for the same period in2019. This change in cash flow was the result of a decrease in net income of $13.0 million for the nine months ended September 30, 2020, more than offset bychanges in working capital items largely related to timing.
Investing activities resulted in a net cash outflow of $1.44 billion for the nine months ended September 30, 2020, as compared to a net cash outflow of $894.0million for the same period in 2019. The outflows for the nine months ended September 30, 2020, were primarily due to net loan growth of $1.08 billion andpurchases of investment securities totaling $904.0 million, partially offset by the proceeds from the sale, principal repayments and maturities from investmentsecurities totaling $543.1 million. The outflows for the nine months ended September 30, 2019, included net loan growth of $881.9 million and purchases ofinvestment securities totaling $233.7 million, partially offset by the proceeds from the sale, principal repayments and maturities from investment securities totaling$229.6 million.
Financing activities resulted in a net inflow of $1.58 billion for the nine months ended September 30, 2020, compared to a net inflow of $1.04 billion for the sameperiod in 2019. The inflows for the nine months ended September 30, 2020, were primarily a result of a net increase in deposits of $1.55 billion and net proceeds of$95.3 million from the issuance of subordinated notes payable, partially offset by a net decrease in FHLB borrowings of $55.0 million. The inflows for the ninemonths ended September 30, 2019, included a net increase in deposits of $1.04 billion and proceeds from the issuance of preferred stock of $77.6 million, partiallyoffset by a net decrease in FHLB borrowings of $35.0 million and repayment of subordinated debt of $35.0 million.
We continue to evaluate the potential impact on liquidity management of various regulatory proposals, including those being established under the Dodd-FrankWall Street Reform and Consumer Protection Act, as government regulators continue the final rule-making process.
® ®
72

Table of Contents
Capital Resources
The access to and cost of funding for new business initiatives, the ability to engage in expanded business activities, the ability to pay dividends, the level of depositinsurance costs and the level and nature of regulatory oversight depend, in part, on our capital position. The Company filed a registration statement on Form S-3with the SEC on December 26, 2019, which provides a means to allow us to issue registered securities to finance our growth objectives.
The assessment of capital adequacy depends on a number of factors, including loan composition, asset quality, liquidity, earnings performance, changingcompetitive conditions and economic forces. We seek to maintain a strong capital base to support our growth and expansion activities, to provide stability to ourcurrent operations and to promote public confidence in our Company.
Shareholders’ Equity. Shareholders’ equity was $643.2 million as of September 30, 2020, compared to $621.3 million as of December 31, 2019. The $21.9 millionincrease during the nine months ended September 30, 2020, was primarily attributable to net income of $32.6 million and $7.2 million in stock-basedcompensation, partially offset by a decrease of $6.6 million in accumulated other comprehensive income (loss), preferred stock dividends paid of $5.9 million, thepurchase of $3.3 million in treasury stock and $2.5 million in cancellation of stock options.
In May 2019, the Company completed the issuance and sale of a registered, underwritten public offering of 3,220,000 depositary shares, each representing a 1/40thinterest in a share of its 6.375% Fixed-to-Floating Rate Series B Non-Cumulative Perpetual Preferred Stock, no par value (the “Series B Preferred Stock”), with aliquidation preference of $1,000 per share (equivalent to $25 per depository share). The Company received net proceeds of $77.6 million from the offering, afterdeducting underwriting discounts, commissions and direct offering expenses. Our Series B Preferred Stock provides Tier 1 capital for the holding company underfederal regulatory capital rules.
When, as, and if declared by the board of directors of the Company (the “Board”), dividends will be payable on the Series B Preferred Stock from the date ofissuance to, but excluding July 1, 2026, at a rate of 6.375% per annum, payable quarterly, in arrears, and from and including July 1, 2026, dividends will accrueand be payable at a floating rate equal to three-month LIBOR plus a spread of 408.8 basis points per annum, payable quarterly, in arrears. The Company mayredeem the Series B Preferred Stock at its option, subject to regulatory approval, on or after July 1, 2024, as described in the prospectus supplement relating to theoffering filed with the SEC on May 23, 2019.
In March 2018, the Company completed the issuance and sale of a registered, underwritten public offering of 1,610,000 depositary shares, each representing a1/40th interest in a share of its 6.75% Fixed-to-Floating Rate Series A Non-Cumulative Perpetual Preferred Stock, no par value (the “Series A Preferred Stock”),with a liquidation preference of $1,000 per share (equivalent to $25 per depository share). The Company received net proceeds of $38.5 million from the offering,after deducting underwriting discounts, commissions and direct offering expenses. Our Series A Preferred Stock provides Tier 1 capital for the holding companyunder federal regulatory capital rules.
When, as, and if declared by the Board, dividends will be payable on the Series A Preferred Stock from the date of issuance to, but excluding April 1, 2023 at a rateof 6.75% per annum, payable quarterly, in arrears, and from and including April 1, 2023, dividends will accrue and be payable at a floating rate equal to three-month LIBOR plus a spread of 398.5 basis points per annum, payable quarterly, in arrears. The Company may redeem the Series A Preferred Stock at its option,subject to regulatory approval, on or after April 1, 2023, as described in the prospectus supplement relating to the offering filed with the SEC on March 19, 2018.
Regulatory Capital. As of September 30, 2020 and December 31, 2019, TriState Capital Holdings, Inc. and TriState Capital Bank were in compliance with allapplicable regulatory capital requirements, and TriState Capital Bank was categorized as well capitalized for purposes of the FDIC’s prompt corrective actionregulations. As we employ our capital and continue to grow our operations, our regulatory capital levels may decrease. However, we will monitor our capital inorder to remain categorized as well capitalized under the applicable regulatory guidelines and in compliance with all regulatory capital standards applicable to us.As of September 30, 2020 and December 31, 2019, the capital conservation buffer was 2.5%, in addition to the minimum capital adequacy levels shown in thetables below. Both the Company and the Bank were above the levels required to avoid limitations on capital distributions and discretionary bonus payments.
73
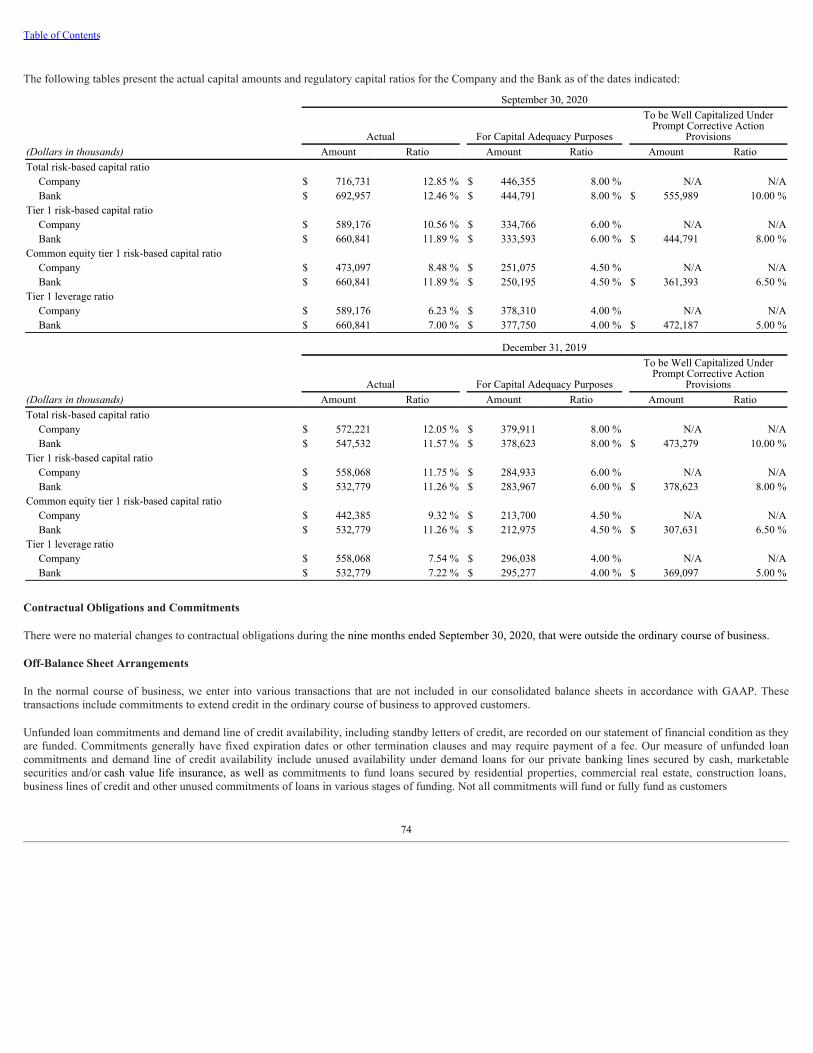
Table of Contents
The following tables present the actual capital amounts and regulatory capital ratios for the Company and the Bank as of the dates indicated:
September 30, 2020
Actual For Capital Adequacy Purposes
To be Well Capitalized UnderPrompt Corrective Action
Provisions(Dollars in thousands) Amount Ratio Amount Ratio Amount RatioTotal risk-based capital ratio
Company $ 716,731 12.85 % $ 446,355 8.00 % N/A N/ABank $ 692,957 12.46 % $ 444,791 8.00 % $ 555,989 10.00 %
Tier 1 risk-based capital ratioCompany $ 589,176 10.56 % $ 334,766 6.00 % N/A N/ABank $ 660,841 11.89 % $ 333,593 6.00 % $ 444,791 8.00 %
Common equity tier 1 risk-based capital ratioCompany $ 473,097 8.48 % $ 251,075 4.50 % N/A N/ABank $ 660,841 11.89 % $ 250,195 4.50 % $ 361,393 6.50 %
Tier 1 leverage ratioCompany $ 589,176 6.23 % $ 378,310 4.00 % N/A N/ABank $ 660,841 7.00 % $ 377,750 4.00 % $ 472,187 5.00 %
December 31, 2019
Actual For Capital Adequacy Purposes
To be Well Capitalized UnderPrompt Corrective Action
Provisions(Dollars in thousands) Amount Ratio Amount Ratio Amount RatioTotal risk-based capital ratio
Company $ 572,221 12.05 % $ 379,911 8.00 % N/A N/ABank $ 547,532 11.57 % $ 378,623 8.00 % $ 473,279 10.00 %
Tier 1 risk-based capital ratioCompany $ 558,068 11.75 % $ 284,933 6.00 % N/A N/ABank $ 532,779 11.26 % $ 283,967 6.00 % $ 378,623 8.00 %
Common equity tier 1 risk-based capital ratioCompany $ 442,385 9.32 % $ 213,700 4.50 % N/A N/ABank $ 532,779 11.26 % $ 212,975 4.50 % $ 307,631 6.50 %
Tier 1 leverage ratioCompany $ 558,068 7.54 % $ 296,038 4.00 % N/A N/ABank $ 532,779 7.22 % $ 295,277 4.00 % $ 369,097 5.00 %
Contractual Obligations and Commitments
There were no material changes to contractual obligations during the nine months ended September 30, 2020, that were outside the ordinary course of business.
Off-Balance Sheet Arrangements
In the normal course of business, we enter into various transactions that are not included in our consolidated balance sheets in accordance with GAAP. Thesetransactions include commitments to extend credit in the ordinary course of business to approved customers.
Unfunded loan commitments and demand line of credit availability, including standby letters of credit, are recorded on our statement of financial condition as theyare funded. Commitments generally have fixed expiration dates or other termination clauses and may require payment of a fee. Our measure of unfunded loancommitments and demand line of credit availability include unused availability under demand loans for our private banking lines secured by cash, marketablesecurities and/or cash value life insurance, as well as commitments to fund loans secured by residential properties, commercial real estate, construction loans,business lines of credit and other unused commitments of loans in various stages of funding. Not all commitments will fund or fully fund as customers
74

Table of Contents
often only draw on a portion of their available credit and we continuously monitor utilization of our unfunded lines of credit and on both commercial and privatebanking loans. We believe that we maintain sufficient liquidity or otherwise have the ability to generate the liquidity necessary to fund anticipated draws underunused loan commitments of demand lines of credit.
Standby letters of credit are written conditional commitments issued by us to guarantee the performance of our customer to a third party. In the event our customerdoes not perform in accordance with the terms of the agreement with the third party, we would be required to fund the commitment. The maximum potentialamount of future payments we could be required to make is represented by the contractual amount of the commitment. If the commitment is funded, we would beentitled to seek recovery from the customer.
We minimize our exposure to loss under loan commitments and standby letters of credit and unfunded demand lines of credit by subjecting them to credit approvaland monitoring procedures. The effect on our revenues, expenses, cash flows and liquidity of the unused portions of these commitments cannot be reasonablypredicted because, while the borrower has the ability to draw upon these commitments at any time under certain contractual agreements, these commitments oftenexpire without being drawn. There is no guarantee that the lines of credit will be used.
The following table is a summary of the total notional amount of unused loan commitments and standby letters of credit commitments and unfunded demand linesof credit availability, based on the values of eligible collateral or other terms under the loan agreement, by contractual maturities outstanding as of the dateindicated.
September 30, 2020
(Dollars in thousands) Due on DemandOne Year
or LessOne to
Three YearsThree to
Five YearsGreater Than
Five Years TotalUnused loan commitments and demand lines of credit $ 5,092,789 $ 561,418 $ 360,676 $ 143,276 $ 14,596 $ 6,172,755 Standby letters of credit 1,619 47,161 18,545 5,808 — 73,133 Total off-balance sheet arrangements $ 5,094,408 $ 608,579 $ 379,221 $ 149,084 $ 14,596 $ 6,245,888
Market Risk
Market risk refers to potential losses arising from changes in interest rates, foreign exchange rates, equity prices and commodity prices. Our primary component ofmarket risk is interest rate volatility. Fluctuations in interest rates will ultimately impact the level of both income and expense recorded on most of our assets andliabilities, and the market value of all interest-earning assets and interest-bearing liabilities, other than those that have a short term to maturity. Because of thenature of our operations, we are not subject to foreign exchange or commodity price risk. From time to time we hold market risk sensitive instruments for tradingpurposes. The summary information provided in this section should be read in conjunction with our unaudited condensed consolidated financial statements andrelated notes.
Interest rate risk is comprised of re-pricing risk, basis risk, yield curve risk and option risk. Re-pricing risk arises from differences in the cash flow or re-pricingbetween asset and liability portfolios. Basis risk arises when asset and liability portfolios are related to different market rate indexes, which do not always changeby the same amount or at the same time. Yield curve risk arises when asset and liability portfolios are related to different maturities on a given yield curve; whenthe yield curve changes shape, the risk position is altered. Option risk arises from embedded options within asset and liability products as certain borrowers mayprepay their loans and certain depositors may redeem their certificates when rates change.
Our ALCO actively measures and manages interest rate risk. The ALCO is responsible for the formulation and implementation of strategies to improve balancesheet positioning and earnings, and for reviewing our interest rate sensitivity position. This involves devising policy guidelines, risk measures and limits, andmanaging the amount of interest rate risk and its effect on net interest income and capital.
We utilize an asset/liability model to measure and manage interest rate risk. The specific measurement tools used by management on at least a quarterly basisinclude net interest income (“NII”) simulation, economic value of equity (“EVE”) analysis and gap analysis. All are static measures that do not incorporateassumptions regarding future business. All are also measures of interest rate sensitivity used to help us develop strategies for managing exposure to interest raterisk rather than projecting future earnings.
In our view, all three measures have specific benefits and shortcomings. NII simulation explicitly measures exposure to earnings from changes in market rates ofinterest but does not provide a long-term view of value. EVE analysis helps identify changes in optionality and price over a longer-term horizon, but its liquidationperspective does not convey the earnings-based measures that are typically the focus of managing and valuing a going concern. Gap analysis compares thedifference between the amount of interest-earning assets and interest-bearing liabilities subject to re-pricing over a period of time but only captures a single rateenvironment. Reviewing these various measures together helps management obtain a comprehensive view of our interest risk rate profile.
75

Table of Contents
The following NII simulation and EVE analysis metrics were calculated using rate shocks that represent immediate rate changes that move all market rates by thesame amount instantaneously. The variance percentages represent the change between the NII simulation and EVE calculated under the particular rate scenarioversus the NII simulation and EVE analysis calculated assuming market rates deemed appropriate as of the date of this filing. For the purpose of this exercise it isassumed that rates do not fall below zero.
September 30, 2020 December 31, 2019
(Dollars in thousands)
Amount Changefrom
Base CasePercent Change from
Base Case
Amount Changefrom
Base CasePercent Change from
Base CaseNet interest income (loss):+300 $ 20,189 13.49 % $ 45,787 31.65 %+200 $ 5,678 3.79 % $ 30,367 20.99 %+100 $ (8,379) (5.60)% $ 15,128 10.46 %–100 $ 4,401 2.94 % $ (16,822) (11.63)%
Economic value of equity:+300 $ (85,439) (13.23)% $ 6,511 1.10 %+200 $ (71,220) (11.03)% $ 3,691 0.62 %+100 $ (50,775) (7.86)% $ 1,513 0.26 %–100 $ (523) (0.08)% $ (10,886) (1.84)%
We plan to continue to manage an asset sensitive interest rate risk position when it comes to net interest income due to the ongoing need for some duration in theliability portfolio, although the duration of those time deposits is being managed shorter over time. The current exception to this approach is in a 100 basis pointshock scenario where we accept the negative impact to NII caused by our recently implemented floors on loans because of the material benefit provided by thosefloors in the base case - a case of low rates for a long period that we believe will persist. Given the longer-term nature of the EVE analysis and the absolute lowlevel of interest rates, we have migrated to a more liability sensitive interest rate risk position when it comes to economic value of equity due to the aforementionedexpectation of low rates for an extended period of time.
76

Table of Contents
The following gap analysis presents the amounts of interest-earning assets and interest-bearing liabilities and related cash flow hedging instruments that are subjectto re-pricing within the periods indicated.
September 30, 2020
(Dollars in thousands)Less Than
90 Days91 to 180
Days181 to 365
DaysOne to Three
YearsThree to Five
YearsGreater ThanFive Years Non-Sensitive Total Balance
Assets:Interest-earning deposits $ 602,676 $ — $ — $ — $ — $ — $ — $ 602,676 Federal funds sold 5,270 — — — — — — 5,270 Total investment securities 232,615 64,996 55,986 162,309 106,222 178,920 19,175 820,223 Total loans and leases 7,223,624 44,958 64,038 195,433 84,973 27,927 13,493 7,654,446 Other assets — — — — — — 411,175 411,175
Total assets $ 8,064,185 $ 109,954 $ 120,024 $ 357,742 $ 191,195 $ 206,847 $ 443,843 $ 9,493,790
Liabilities:Transaction deposits $ 6,049,255 $ — $ 168,656 $ 393,956 $ 75,000 $ — $ 439,878 $ 7,126,745 Certificates of deposit 328,448 347,784 269,885 110,851 — — — 1,056,968 Borrowings, net — 50,000 — 100,000 247,500 — (2,061) 395,439 Other liabilities — — — — — — 271,438 271,438
Total liabilities 6,377,703 397,784 438,541 604,807 322,500 — 709,255 8,850,590
Equity — — — — — — 643,200 643,200 Total liabilities and equity $ 6,377,703 $ 397,784 $ 438,541 $ 604,807 $ 322,500 $ — $ 1,352,455 $ 9,493,790
Interest rate sensitivity gap $ 1,686,482 $ (287,830) $ (318,517) $ (247,065) $ (131,305) $ 206,847 $ (908,612)Cumulative interest ratesensitivity gap $ 1,686,482 $ 1,398,652 $ 1,080,135 $ 833,070 $ 701,765 $ 908,612 Cumulative interest ratesensitive assets to rate sensitiveliabilities 126.4 % 120.6 % 115.0 % 110.7 % 108.6 % 111.2 % 107.3 %Cumulative gap to total assets 17.8 % 14.7 % 11.4 % 8.8 % 7.4 % 9.6 %
The cumulative 12-month ratio of interest rate sensitive assets to interest rate sensitive liabilities decreased to 115.0% as of September 30, 2020, from 121.4% as ofDecember 31, 2019.
The Company entered into cash flow hedge transactions to fix the interest rate on certain of the Company’s borrowings for varying periods of time. During the lifeof these transactions, they have the effect on our gap analysis of moving $300.0 million of borrowings from the less than 90 days re-pricing category to the threemonths and longer re-pricing categories. Of the $300.0 million, $50.0 million was moved to the three to six months re-pricing category, $100.0 million to the oneto three year repricing category, and $150.0 million to the three to five years re-pricing category. For additional information on cash flow hedge transactions, referto Note 10, Derivatives and Hedging Activity, to our unaudited condensed consolidated financial statements.
Additionally, in all of these analyses (NII, EVE and gap), we use what we believe is a conservative treatment of non-maturity, interest-bearing deposits. In our gapanalysis, the allocation of non-maturity, interest-bearing deposits is fully reflected in the less than 90 days re-pricing category. The allocation of non-maturity,noninterest-bearing deposits is fully reflected in the non-sensitive category. In taking this approach, we provide ourselves with no benefit to either NII or EVE froma potential time lag in the rate increase of our non-maturity, interest-bearing deposits.
Impact of Inflation
Our financial statements and related data presented herein have been prepared in accordance with GAAP, which requires the measure of financial position andoperating results in terms of historic dollars, without considering changes in the relative purchasing power of money over time due to inflation.
77

Table of Contents
Inflation generally increases the costs of funds and operating overhead, and to the extent loans and other assets bear variable rates, the yields on such assets. Unlikemost industrial companies, virtually all of the assets and liabilities of a financial institution are monetary in nature. As a result, interest rates generally have a moresignificant effect on the performance of a financial institution than the effects of general levels of inflation. In addition, inflation affects a financial institution’scost of goods and services purchased, the cost of salaries and benefits, occupancy expense and similar items. Inflation and related increases in interest ratesgenerally decrease the market value of investments and loans held and may adversely affect liquidity, earnings and shareholders’ equity.
Other Matters
Recent Regulatory Developments
In March 2020, various regulatory agencies, including the Federal Reserve and the FDIC, issued an Interagency Statement on Loan Modifications andReporting for Financial Institutions Working with Customers affected by the Coronavirus. The interagency statement impacted accounting for loanmodifications, which was revised on April 7, 2020, in response to the CARES Act. Under Accounting Standards Codification 310-40, “Receivables –Troubled Debt Restructurings by Creditors,” (“ASC 310-40”), a restructuring of debt constitutes a TDR if the creditor, for economic or legal reasons related tothe debtor’s financial difficulties, grants a concession to the debtor that it would not otherwise consider. The agencies confirmed with the staff of the FinancialAccounting Standards Board (“FASB”) that short-term modifications made on a good faith basis in response to COVID-19 to borrowers who were currentprior to any relief, are not to be considered TDRs. This includes short-term modifications such as payment deferrals, fee waivers, extensions of repaymentterms, or other delays in payment that are insignificant.
As provided for under the CARES Act, a financial institution may account for an eligible loan modification either under section 4013 of the CARES Act or inaccordance with ASC Subtopic 310-40. If a loan modification is not eligible under section 4013, or if the institution elects not to account for the loanmodification under section 4013, the financial institution should evaluate whether the modified loan is a TDR. To be an eligible loan under section 4013, aloan modification must be (1) related to COVID-19; (2) executed on a loan that was not more than 30 days past due as of December 31, 2019; and (3)executed between March 1, 2020, and the earlier of (A) 60 days after the date of termination of the National Emergency or (B) December 31, 2020.
Recent Accounting Pronouncements and Developments
In August 2020, FASB issued ASU 2020-06, “Debt - Debt with Conversion and Other Options (Subtopic 470-20),” and Derivatives and Hedging - Contractsin Entity’s Own Equity (Subtopic 815-40): Accounting for Convertible Instruments and Contracts in an Entity’s Own Equity which reduces the number ofaccounting models for convertible instruments and allows more contracts to qualify for equity classification. This standard is effective for public businessentities for annual and interim periods in fiscal years beginning after December 15, 2021. Early adoption is permitted, but no earlier than annual and interimperiods in fiscal years beginning after December 15, 2020. The Company is currently evaluating the impact this standard will have on our results of operationsand financial position.
In March 2020, FASB issued ASU 2020-04, “Reference Rate Reform (Topic 848),” which provides optional guidance for a limited time to ease the potentialaccounting burden associated with transitioning away from reference rates such as LIBOR. The expedients and exceptions provided by this standard will notbe available until after December 31, 2022, other than for certain hedging relationships entered into before December 31, 2022. The standard may be appliedas of the beginning of the interim period that includes March 12, 2020 through December 21, 2022. The Company is currently evaluating the impact thisstandard will have on our results of operations and financial position.
In January 2020, FASB issued ASU 2020-01, “Investments - ASU 2020-01, Investments-Equity Securities (Topic 321), Investments-Equity Method and JointVentures (Topic 323), and Derivatives and Hedging (Topic 815): Clarifying the Interactions between Topic 321, Topic 323, and Topic 815. This new guidanceaddresses accounting for the transition into and out of the equity method and also provides guidance on whether equity method accounting would be applied tocertain purchased options and forward contracts upon settlement. This standard is effective for public business entities for annual and interim periods in fiscalyears beginning after December 15, 2020. Early adoption is permitted. The Company is currently evaluating the impact this standard will have on our resultsof operations and financial position.
In December 2019, FASB issued ASU 2019-12, “Simplifying the Accounting for Income Taxes,” which removes certain exceptions for: recognizing deferredtaxes for investments, performing intraperiod allocation and calculating income taxes in interim periods. This standard also adds guidance to reducecomplexity in certain areas, including recognizing deferred taxes for tax goodwill and allocating taxes to members of a consolidated group. This standard iseffective for public business entities for
78

Table of Contents
annual and interim periods in fiscal years beginning after December 15, 2020. Early adoption is permitted. The Company is currently evaluating the impactthis standard will have on our results of operations and financial position.
In June 2016, the FASB issued ASU 2016-13, “Measurement of Credit Losses on Financial Instruments,” along with several other subsequent codificationupdates related to accounting for credit losses, which significantly change the way entities recognize impairment of many financial assets by requiringimmediate recognition of estimated credit losses expected to occur over their remaining life. The new impairment methodology, under this accountingstandard, known as the CECL model, replaces the current incurred loss model and requires financial assets measured at amortized cost basis, such as loans,debt securities, net investments in leases, and off-balance-sheet credit exposures, to be presented at the net amount expected to be collected. CECL requiresuse of expected credit losses based on a standard of relevant information about past events, including historical experience, current conditions, and reasonableand supportable economic forecasts that affect the collectability of the reported amount. Entities will apply the standard's provisions as a cumulative-effectadjustment to retained earnings as of the beginning of the first reporting period in which the guidance is adopted. The changes were originally effective forpublic business entities that are SEC filers for annual and interim periods in fiscal years beginning after December 15, 2019. The CARES Act allows theoption to delay the adoption of this standard until the date on which the national emergency related to the COVID-19 outbreak is terminated or December 31,2020, whichever occurs first.
The Company has elected to delay its adoption of ASU 2016-13, commonly referred to as CECL, as provided by the CARES Act. Upon adoption of ASU2016-13, the Company anticipates recognizing a one-time cumulative effect adjustment of approximately $1.5 million to $2.0 million, net of tax, throughretained earnings as of January 1, 2020, for the changes in allowance for credit losses on loans and leases, unfunded commitments and certain debt securities.We estimate the allowance for credit losses on loans and leases under CECL to range from $30.0 million to $35.0 million on December 31, 2020. Thisestimate is based on a number of forward-looking variable assumptions subject to uncertainty including but not limited to economic forecasting, projectedvolume and composition of loans and leases, and credit quality.
LIBOR Transition
On July 27, 2017, the United Kingdom’s Financial Conduct Authority (the “FCA”) announced that it will no longer persuade or require banks to submit ratesfor the calculation of the London Interbank Offered Rate (“LIBOR”) after 2021. Given LIBOR’s extensive use across financial markets, the transition awayfrom LIBOR presents various risks and challenges to financial markets and institutions, including to the Company. The Company’s commercial and consumerbusinesses issue, trade and hold various products that are currently indexed to LIBOR. As of September 30, 2020, the Company had a material amount ofloans, investment securities, FHLB advances and notional value of derivatives indexed to LIBOR that will mature after 2021. If not sufficiently planned for,the discontinuation of LIBOR could result in financial, operational, legal, reputational or compliance risks to financial markets and institutions, including tothe Company.
The Alternative Reference Rates Committee (“ARRC”) has proposed the Secured Overnight Financing Rate (“SOFR”) as its preferred rate as an alternative toLIBOR, although the AARC has not proposed that SOFR be required. The selection of SOFR as the alternative reference rate currently presents certain marketconcerns, because it is a risk-free rate, while LIBOR incorporates credit risk, and because the methodology for the proposed term structure for SOFR differsfrom the LIBOR framework. The federal banking agencies are not requiring SOFR as the replacement rate.
The ARRC has released final recommended fallback contract language for new issuances of LIBOR-indexed bilateral business loans, syndicated loans,floating rate notes, securitizations and adjustable rate mortgage loans, and it continues to develop other LIBOR transition guidance. The International Swapsand Derivatives Association, Inc. (“ISDA”) is also expected to establish a framework for the transition of derivative instruments away from LIBOR. Theprocess for modification of legacy contracts that do not provide for a permanent transition from LIBOR remains a work in progress.
Due to the uncertainty surrounding the future of LIBOR, it is expected that the transition will span several reporting periods through the end of 2021. Thefederal banking agencies have said that an institution’s LIBOR transition plans are an examination priority. One of the major identified risks is inadequatefallback language in the various instruments’ contracts that may result in issues establishing the alternative index and adjusting the margin as applicable. TheCompany continues to monitor this activity and evaluate the related risks. The Company has already: (1) established a cross-functional team to identify, assessand monitor risks associated with the transition of LIBOR and other benchmark rates; (2) developed an inventory of affected products; and (3) implementedmore robust fallback contract language. The Company’s cross-functional team is also tasked with managing clear communication of the Company’s transitionplans with both internal and external stakeholders and ensuring that the Company appropriately updates its business processes, analytical tools, informationsystems and contract language to minimize disruption during and after the LIBOR transition. For additional information related to the potential impactsurrounding the transition from LIBOR on the Company’s business, see “Item 1A. Risk Factors” in this Annual Report on Form 10-K.
79

Table of Contents
ITEM 3. QUANTITATIVE AND QUALITATIVE DISCLOSURES ABOUT MARKET RISK
Quantitative and qualitative disclosures about market risk are presented under the caption “Market Risk” in Part I, Item 2 of this Quarterly Report on Form 10-Q.
ITEM 4. CONTROLS AND PROCEDURES
Disclosure Controls and Procedures
The Company’s management, including the Chief Executive Officer and Chief Financial Officer, conducted an evaluation of the effectiveness of the Company’sdisclosure controls and procedures (as defined in Rules 13a-15(e) and 15d-15(e) under the Exchange Act) as of September 30, 2020. The Company’s disclosurecontrols and procedures are designed to ensure that information required to be disclosed by the Company in the reports that it files or submits under the ExchangeAct is recorded, processed, summarized and reported within the time periods specified in the SEC’s rules and forms, and that such information is accumulated andcommunicated to the Company’s management, including the Chief Executive Officer and Chief Financial Officer, to allow timely decisions regarding requireddisclosure. Based on this evaluation, the Chief Executive Officer and Chief Financial Officer concluded that the Company’s disclosure controls and procedures (asdefined in Rules 13a-15(e) and 15d-15(e) under the Exchange Act) were effective as of September 30, 2020.
Changes in Internal Control over Financial Reporting
There were no changes in the Company’s internal control over financial reporting (as defined in Rules 13a-15(f) and 15d-15(f) under the Exchange Act) thatoccurred during the quarter ended September 30, 2020, that have materially affected, or are reasonably likely to materially affect, the Company’s internal controlover financial reporting.
PART II – OTHER INFORMATION
ITEM 1. LEGAL PROCEEDINGS
From time to time the Company is a party to various litigation matters incidental to the conduct of its business. During the three months ended September 30, 2020,the Company was not a party to any legal proceedings the resolution of which management believes will be material to the Company’s business, future prospects,financial condition, liquidity, results of operation, cash flows or capital levels.
ITEM 1A. RISK FACTORS
There have not been any material changes to the risk factors previously disclosed under Item 1A of our Annual Report on Form 10-K for the year endedDecember 31, 2019, previously filed with the SEC, except for the risk factor included below:
The novel coronavirus (“COVID-19”) and the impact of actions to mitigate it may materially and adversely affect our business, financial condition and resultsof operations.
Federal, state and local governments have enacted various restrictions in an attempt to limit the spread of COVID-19, including the declaration of a nationalemergency; multiple cities’ and states’ declarations of states of emergency; school and business closings; limitations on social or public gatherings and other socialdistancing measures, such as working remotely, travel restrictions, quarantines and stay at home orders. Such measures have disrupted economic activity andcontributed to job losses and reductions in consumer and business spending. In response to the economic and financial effects of COVID-19, the Federal Reservehas sharply reduced interest rates and instituted quantitative easing measures, as well as domestic and global capital market support programs. In addition, theTrump Administration, Congress, various federal agencies and state governments have taken measures to address the economic and social consequences of thepandemic, including the passage of the CARES Act. The CARES Act, among other things, provides certain measures to support individuals and businesses inmaintaining solvency through monetary relief, including in the form of financing, loan forgiveness and automatic forbearance. All of the federal banking regulatoryagencies have encouraged lenders to extend additional loans, and the federal government is considering additional stimulus and support legislation focused onproviding aid to various sectors, including small businesses. The full impact on our business activities as a result of new government and regulatory policies,programs and guidelines, as well as regulators’ reactions to such activities, remains uncertain.
The economic effects of the COVID-19 pandemic have had a destabilizing effect on financial markets, key market indices and overall economic activity. Theuncertainty regarding the duration of the pandemic and the resulting economic disruption has caused increased market volatility and has led to an economicrecession (including due to uncertainty regarding the impacts of a resurgence of COVID-19 infections, as well as a significant decrease in consumer confidenceand business generally. The continuation of these
80

Table of Contents
conditions, the impacts of the CARES Act, and other federal and state measures, specifically with respect to loan forbearances, has adversely impacted ourbusinesses and results of operations and the business and operations of at least some of our borrowers, customers and business partners and these impacts may bematerial. In particular, these events have had, and/or can be expected to continue to have, the following effects, among other things:
• impair the ability of borrowers to repay outstanding loans or other obligations, resulting in increases in delinquencies;• impair the value of collateral securing loans;• impair the value of our securities portfolio;• require an increase in our allowance for loan and lease losses;• adversely affect the stability of our deposit base, or otherwise impair our liquidity;• reduce our asset management revenues and the demand for our products and services;• impair the ability of loan guarantors to honor commitments;• negatively impact our regulatory capital ratios;• result in increased compliance risk as we become subject to new regulatory and other requirements associated with any new programs in which we
participate;• negatively impact the productivity and availability of key personnel and other employees necessary to conduct our business, and of third-party service
providers who perform critical services for us, or otherwise cause operational failures due to changes in our normal business practices necessitated by theoutbreak and related governmental actions;
• increase cyber and payment fraud risk, and other operational risks, given increased online and remote activity; and• negatively impact revenue and income.
Prolonged measures by health or other governmental authorities encouraging or requiring significant restrictions on travel, assembly or other core businesspractices could further harm our business and those of our customers, in particular our middle market business customers. Although we have business continuityplans and other safeguards in place, there is no assurance that they will continue to be effective.
The ultimate impact of these factors is highly uncertain at this time and we do not yet know the full extent of the impacts on our business, our operations or thenational or global economies, nor the pace of the economic recovery when the COVID-19 pandemic subsides, the decline in economic conditions generally and aprolonged negative impact on middle market businesses, in particular, due to COVID-19 is likely to result in a material adverse effect to our business, financialcondition and results of operations in future period.
In addition, to the extent COVID-19 adversely affects our business, financial condition and results of operations, and global economic conditions more generally,it may also have the effect of heightening many of the other risks described in the “Risk Factors” section of our Annual Report on Form 10-K for the year endedDecember 31, 2019.
The intention of the United Kingdom’s FCA to cease support of LIBOR after 2021 could negatively affect the fair value of our financial assets and liabilities,results of operations and net worth. A transition to an alternative reference interest rate could present operational problems and result in market disruption,including inconsistent approaches for different financial products, as well as disagreements with counterparties.
Although we expect that the capital and debt markets will cease to use LIBOR as a benchmark in the near future and no later than December 31, 2021, we cannotpredict whether LIBOR will actually cease to be available after 2021, whether SOFR will become the market benchmark in its place or what impact such atransition may have on our business, results of operations and financial condition.
The selection of SOFR as the alternative reference rate for these products currently presents certain market concerns because SOFR (unlike LIBOR) does not havean inherent term structure. A methodology has been developed to calculate SOFR-based term rates, and the Federal Reserve Bank of New York has published suchrates daily since early 2020. However, the methodology has not been tested for an extended period of time, which may limit market acceptance of the use of SOFR.In addition, SOFR may not be a suitable alternative to LIBOR for all of our financial products, and it is uncertain what other rates might be appropriate for thatpurpose. It is uncertain whether these other indices will remain acceptable alternatives for such products. The replacement of LIBOR also may result in economicmismatches between different categories of instruments that now consistently rely on the LIBOR benchmark.
We have a significant amount of financial products, including mortgage loans, mortgage-related securities, other debt securities and derivatives, that are tied toLIBOR, and we continue to enter into transactions involving such products that will mature after 2021. Inconsistent approaches to a transition from LIBOR to analternative rate among different market participants and for different financial products may cause market disruption and operational problems, which couldadversely affect us, including by exposing us to increased basis risk and resulting costs in connection, and by creating the possibility of disagreements withcounterparties.
81

Table of Contents
ITEM 2. UNREGISTERED SALES OF EQUITY SECURITIES AND USE OF PROCEEDS
Recent Sales of Unregistered Securities
None.
Purchases of Equity Securities by the Company and Affiliated Purchasers
The table below sets forth information regarding the Company’s purchases of its common stock during its fiscal quarter ended September 30, 2020:
Total Numberof Shares
Purchased
Weighted Average
Price Paid per Share
Total Number ofShares Purchasedas Part of PubliclyAnnounced Plans
or Programs
Approximate DollarValue
of Shares that May Yet Be PurchasedUnder the Plans or
Programs July 1, 2020 - July 31, 2020 27,078 $ 14.67 — $ 9,758,275 August 1, 2020 - August 31, 2020 15,082 14.04 — 9,758,275 September 1, 2020 - September 30, 2020 — — — 9,758,275 Total 42,160 $ 14.44 — $ 9,758,275
There were 42,160 shares of treasury stock acquired in connection with the net settlement of equity awards exercised or vested included in the total number of sharespurchased reflected in the table above. These shares were not part of a publicly announced plan or program.On July 15, 2019, the Board approved a share repurchase program of up to $10 million. Under this authorization, purchases of shares may be made at the discretion ofmanagement from time to time in the open market or through negotiated transactions, as well as purchases of shares or the options to acquire shares subject to commonstock incentive compensation award agreements from officers, directors or employees of the Company.
ITEM 3. DEFAULTS UPON SENIOR SECURITIES
None.
ITEM 4. MINE SAFETY DISCLOSURES
Not applicable.
ITEM 5. OTHER INFORMATION
None.
(1) (2) (2)
(1)
(2)
82

Table of Contents
ITEM 6. EXHIBITS
Exhibit No. Description
3.1 Form of Certificate of Designation of Series C Perpetual Non-Cumulative Convertible Non-Voting Preferred Stock (attached as Exhibit A in Exhibit 10.1hereto)
10.1 Investment Agreement, dated as of October 10, 2020, by and between TriState Capital Holdings, Inc. and T-VIII PubOpps LP (incorporated by reference toExhibit 4.1 to the Current Report on Form 8-K of TriState Capital Holdings, Inc., filed on October 13, 2020).
31.1 Certification of Chief Executive Officer pursuant to Section 302 of the Sarbanes-Oxley Act of 2002, filed herewith.
31.2 Certification of Chief Financial Officer pursuant to Section 302 of the Sarbanes-Oxley Act of 2002, filed herewith.
32 Certification of Chief Executive Officer and Chief Financial Officer pursuant to Section 906 of the Sarbanes-Oxley Act of 2002, filed herewith.
101 The following materials from TriState Capital Holdings, Inc.’s Quarterly Report on Form 10-Q for the period ended September 30, 2020, formatted inXBRL: (i) the Unaudited Condensed Consolidated Statements of Financial Condition, (ii) the Unaudited Condensed Consolidated Statements ofIncome, (iii) the Unaudited Condensed Consolidated Statements of Comprehensive Income, (iv) the Unaudited Condensed ConsolidatedStatements of Changes in Shareholders’ Equity, (v) the Unaudited Condensed Consolidated Statements of Cash Flows and (vi) the Notes toUnaudited Condensed Consolidated Financial Statements.*
* This information is deemed furnished, not filed.
83

Table of Contents
SIGNATURES
Pursuant to the requirements of the Securities Exchange Act of 1934, the registrant has duly caused this report to be signed on its behalf by the undersignedthereunto duly authorized.
TRISTATE CAPITAL HOLDINGS, INC.
By /s/ James F. GetzJames F. GetzChairman, President and Chief Executive Officer
By /s/ David J. DemasDavid J. DemasChief Financial Officer
Date: November 9, 2020
84

EXHIBIT 31.1
CERTIFICATION PURSUANT TO SECTION 302OF THE SARBANES-OXLEY ACT OF 2002
I, James F. Getz, certify that:
1. I have reviewed this Quarterly Report on Form 10-Q of TriState Capital Holdings, Inc.;
2. Based on my knowledge, this report does not contain any untrue statement of a material fact or omit to state a material fact necessary to make the statementsmade, in light of the circumstances under which such statements were made, not misleading with respect to the period covered by this report;
3. Based on my knowledge, the financial statements, and other financial information included in this report, fairly present in all material respects the financialcondition, results of operations and cash flows of the Registrant as of, and for, the periods presented in this report;
4. The Registrant’s other certifying officer and I are responsible for establishing and maintaining disclosure controls and procedures (as defined in the ExchangeAct Rules 13a-15(e) and 15d-15(e)) and internal controls over financial reporting (as defined in Exchange Act Rules 13a-15(f) and 15d-15(f)) for theRegistrant and have:
(a) Designed such disclosure controls and procedures, or caused such disclosure controls and procedures to be designed under my supervision, to ensure thatmaterial information relating to the Registrant, including its consolidated subsidiaries, is made known to me by others within those entities, particularlyduring the period in which this report is being prepared;
(b) Designed such internal control over financial reporting, or caused such internal control over financial reporting to be designed under our supervision, toprovide reasonable assurance regarding the reliability of financial reporting and the preparation of financial statements for external purposes inaccordance with the generally accepted accounting principles;
(c) Evaluated the effectiveness of the Registrant's disclosure controls and procedures and presented in this report my conclusions about the effectiveness ofthe disclosure controls and procedures, as of the end of the period covered by this report based on such evaluation; and
(d) Disclosed in this report any change in the Registrant’s internal control over financial reporting that occurred during the Registrant’s most recent fiscalquarter (the Registrant’s fourth fiscal quarter in the case of an annual report) that has materially affected, or is reasonably likely to materially affect, theRegistrant’s internal control over financial reporting; and
5. The registrant’s other certifying officer and I have disclosed, based on my most recent evaluation of internal control over financial reporting, to theRegistrant’s auditors and the audit committee of the Registrant’s board of directors (or persons performing the equivalent functions):
(a) All significant deficiencies and material weaknesses in the design or operation of internal control over financial reporting which are reasonably likely toadversely affect the Registrant's ability to record, process, summarize and report financial information; and
(b) Any fraud, whether or not material, that involves management or other employees who have a significant role in the Registrant’s internal control overfinancial reporting.
By:/s/ James F. Getz James F. GetzChairman, President and Chief Executive Officer
Dated: November 9, 2020

EXHIBIT 31.2
CERTIFICATION PURSUANT TO SECTION 302OF THE SARBANES-OXLEY ACT OF 2002
I, David J. Demas, certify that:
1. I have reviewed this Quarterly Report on Form 10-Q of TriState Capital Holdings, Inc.;
2. Based on my knowledge, this report does not contain any untrue statement of a material fact or omit to state a material fact necessary to make the statementsmade, in light of the circumstances under which such statements were made, not misleading with respect to the period covered by this report;
3. Based on my knowledge, the financial statements, and other financial information included in this report, fairly present in all material respects the financialcondition, results of operations and cash flows of the Registrant as of, and for, the periods presented in this report;
4. The Registrant’s other certifying officer and I are responsible for establishing and maintaining disclosure controls and procedures (as defined in the ExchangeAct Rules 13a-15(e) and 15d-15(e)) and internal controls over financial reporting (as defined in Exchange Act Rules 13a-15(f) and 15d-15(f)) for theRegistrant and have:
(a) Designed such disclosure controls and procedures, or caused such disclosure controls and procedures to be designed under my supervision, to ensure thatmaterial information relating to the Registrant, including its consolidated subsidiaries, is made known to me by others within those entities, particularlyduring the period in which this report is being prepared;
(b) Designed such internal control over financial reporting, or caused such internal control over financial reporting to be designed under our supervision, toprovide reasonable assurance regarding the reliability of financial reporting and the preparation of financial statements for external purposes inaccordance with the generally accepted accounting principles;
(c) Evaluated the effectiveness of the Registrant's disclosure controls and procedures and presented in this report my conclusions about the effectiveness ofthe disclosure controls and procedures, as of the end of the period covered by this report based on such evaluation; and
(d) Disclosed in this report any change in the Registrant’s internal control over financial reporting that occurred during the Registrant’s most recent fiscalquarter (the Registrant’s fourth fiscal quarter in the case of an annual report) that has materially affected, or is reasonably likely to materially affect, theRegistrant’s internal control over financial reporting; and
5. The registrant’s other certifying officer and I have disclosed, based on my most recent evaluation of internal control over financial reporting, to theRegistrant’s auditors and the audit committee of the Registrant’s board of directors (or persons performing the equivalent functions):
(a) All significant deficiencies and material weaknesses in the design or operation of internal control over financial reporting which are reasonably likely toadversely affect the Registrant's ability to record, process, summarize and report financial information; and
(b) Any fraud, whether or not material, that involves management or other employees who have a significant role in the Registrant’s internal control overfinancial reporting.
By:/s/ David J. Demas David J. DemasChief Financial Officer
Dated: November 9, 2020

EXHIBIT 32
CERTIFICATION OF CHIEF EXECUTIVE OFFICER ANDCHIEF FINANCIAL OFFICER
PURSUANT TO 18 U.S.C. SECTION 1350,AS ADOPTED PURSUANT TO
SECTION 906 OF SARBANES-OXLEY ACT
Pursuant to 18 U.S.C. §1350, as adopted pursuant to §906 of the Sarbanes-Oxley Act of 2002, the undersigned officers of TriState Capital Holdings, Inc. herebycertify that the Quarterly Report of TriState Capital Holdings, Inc. on Form 10-Q for the quarterly period ended September 30, 2020 (the “Report”), fully complieswith the requirements of Section 13(a) or 15(d) of the Securities Exchange Act of 1934, as amended, and that the information contained in such Report fairlypresents, in all material respects, the financial condition and results of operations of TriState Capital Holdings, Inc.
By:/s/ James F. Getz James F. GetzChairman, President and Chief Executive Officer
Dated: November 9, 2020
By:/s/ David J. Demas David J. DemasChief Financial Officer
Dated: November 9, 2020


