
TRIPBAM: Leveraging Digital Data Streams to Unleash Savings557 TRIPBAM: Leveraging Digital Data...
20
Communications of the Association for Information Systems Volume 39 Article 25 12-2016 TRIPBAM: Leveraging Digital Data Streams to Unleash Savings Gabriele Piccoli Louisiana State University Federico Pigni Grenoble Ecole de Management, France, [email protected] Follow this and additional works at: hp://aisel.aisnet.org/cais is material is brought to you by the Journals at AIS Electronic Library (AISeL). It has been accepted for inclusion in Communications of the Association for Information Systems by an authorized administrator of AIS Electronic Library (AISeL). For more information, please contact [email protected]. Recommended Citation Piccoli, Gabriele and Pigni, Federico (2016) "TRIPBAM: Leveraging Digital Data Streams to Unleash Savings," Communications of the Association for Information Systems: Vol. 39 , Article 25. Available at: hp://aisel.aisnet.org/cais/vol39/iss1/25
Transcript of TRIPBAM: Leveraging Digital Data Streams to Unleash Savings557 TRIPBAM: Leveraging Digital Data...
Communications of the Association for Information Systems
Volume 39 Article 25
12-2016
TRIPBAM: Leveraging Digital Data Streams toUnleash SavingsGabriele PiccoliLouisiana State University
Federico PigniGrenoble Ecole de Management, France, [email protected]
Follow this and additional works at: http://aisel.aisnet.org/cais
This material is brought to you by the Journals at AIS Electronic Library (AISeL). It has been accepted for inclusion in Communications of theAssociation for Information Systems by an authorized administrator of AIS Electronic Library (AISeL). For more information, please [email protected].
Recommended CitationPiccoli, Gabriele and Pigni, Federico (2016) "TRIPBAM: Leveraging Digital Data Streams to Unleash Savings," Communications of theAssociation for Information Systems: Vol. 39 , Article 25.Available at: http://aisel.aisnet.org/cais/vol39/iss1/25

C ommunications of the
A
I
S
ssociation for nformation ystems
Teaching Case ISSN: 1529-3181
Volume 39 Paper 25 pp. 556 – 574 December 2016
TRIPBAM: Leveraging Digital Data Streams to Unleash Savings
Gabriele Piccoli E. J. Ourso College of Business
Louisiana State University, USA
Federico Pigni Grenoble Ecole de Management, France
Abstract:
TRIPBAM pioneered automated clustered rate monitoring in the hotel industry. After capturing a traveler’s reservation,TRIPBAM software scrutinized the digital data stream of changing room rates and notified users of any potentialsavings. While TRIPBAM could successfully discover savings for its many customers, its executives focused on thechallenge of turning TRIPBAM into a resilient, viable business going forward. Many questions awaited a clear answer.Was the consumer space the one that had the greatest potential or should the firm focus exclusively on the corporatemarket? How could TRIPBAM protect its early advantage from its inevitable imitators? Both the consumer andbusiness opportunities looked wide open even though each side presented distinct challenges to growth. To achieveprofitability, TRIPBAM needed to not just grow the user base but also seek a unique position in the market to defendagainst the increasing number of startups entering their space.
The case provides substantial data and information for students to step in the shoes of TRIPBAM’s executives andprovide some answers to the above questions.
Keywords: Teaching case, Digital Data Stream, Robotic Process Automation, Analysis of Value.
A teaching note for this case can be obtained from [email protected].
This manuscript underwent editorial review. It was received 18/04/2016 and was with the authors for 5 months for 2 revisions. Heikki Topi served as Associate Editor.
557 TRIPBAM: Leveraging Digital Data Streams to Unleash Savings
Volume 39 Paper 25
1 Introduction We have a solution unlike anything that is on the market today or that has been on the market before…. Our features provide real savings for business travelers, companies, and leisure travelers that puts us well ahead of the rest of the travel market. (TRIPBAM, 2013)
In April 2013, Steve Reynolds found himself taking a new and unexpected journey. After 25 years in the travel industry, he had successfully funded two travel companies in the corporate space and had held positions as executive and consultant. Now, he was incorporating an innovative consumer service: TRIPBAM. TRIPBAM’s value proposition involved discovering cheaper hotel rates for travelers who had already booked a trip.
This turn in Reynolds’s career came about rather serendipitously. First, at a board meeting, a colleague explained how he managed to always get the best rates having his secretary shop every day until the day of travel. Then, he noticed a corporate travel agency that offered a similar manual rate-checking service, called the platinum desk, to their best clients. The catalyst to his new project came when, at a four-way intersection on the way to the Dallas airport, he noticed that comparable hotels stood on each corner. Reynolds recalled thinking: “What if we automated rate monitoring and provide it as a service? Could we significantly lower clients’ hotel cost while preserving flexibility and quality?”.
From this intuition, Reynolds grew TRIPBAM into both a consumer-oriented and business-to-business solution. In 2014, the firm won the Business Travel Supplier Innovation Award at Business Travel News’ Innovate Conference and, in 2015, the Phocuswright Battleground Contest. It also won recognition from corporate travel publications in the United Kingdom and the United States (TRIPBAM, 2013).
With the product in place and seed funding secured from Thayer Ventures, the leading hospitality venture capital firm, Reynolds needed to grow TRIPBAM from a clever idea into a viable business. The company’s success or failure depended on growing the user base, beating an increasing number of competitors, avoiding industry retaliation, and building a sustainable business model.
2 Industry Background More than 50 years had passed since the airline industry had introduced the first reservation system. In 1963, SABRE, a joint effort of American Airlines and IBM, demonstrated IT’s capability to efficiently manage airline seats. Hospitality firms adopted similar systems soon after to manage the daunting problem of pricing hotel rooms. Specifically, two years later, Holiday Inn’s HOLIDEX appeared, and the hospitality industry changed forever. In the late 1970s and early 1980s, the central reservation systems (CRS) showcased the power of distribution networks, which created the efficiencies and distribution services needed for the franchising model to work. Franchising ushered in an era of consolidation during which large multinational chains replaced family-run hotels. By the 1990s, the U.S. lodging industry was dominated by franchisors and management companies with strong brands in each market segment.
The widespread adoption of the Internet in the mid-1990s subverted the established order. Hospitality operators lagged behind, and new entrants with technology backgrounds and the strong entrepreneurial spirit of the dot-com era entered and grew quickly. These new ventures quickly captured a substantial amount of the value created in the industry by intermediating reservations online.
The dominant players included Expedia, originally a business unit of technology giant Microsoft, and Priceline, the brainchild of technology entrepreneur Jay Walker.
In early 2015, the market continued to consolidate. Expedia purchased Travelocity for US$280 million on 23 January, Orbitz on 12 February for US$1.34 billion, and HomeAway on 4 November for US$3.9 billion. After its acquisition spree, Expedia became the world’s largest online travel agency (OTA) by total bookings and, with Priceline, established a de facto duopoly in the industry (see Exhibit 1). Large OTAs drove revenue through commissions and placement costs1. However, unlike the use of fixed commission as in the “pre-Internet days”, current arrangements created acquisition costs through intermediaries ranging anywhere between 15 and 35 percent. Furthermore, the OTAs’ share of guest-paid room revenue increased along all hotel segments. It increased from 7.8 percent in 2011 to 15.8 percent for economy and midscale hotels in 2014, from 7.7 percent to 11.7 percent for upper-midscale and upscale hotels during
1 Hotels pay commissions to OTAs as a percentage of the total booking value. Placement costs comprise additional fees OTAs may request to hotels for gaining a better positioning in hotel and price-comparison search results.
Communications of the Association for Information Systems 558
Volume 39 Paper 25
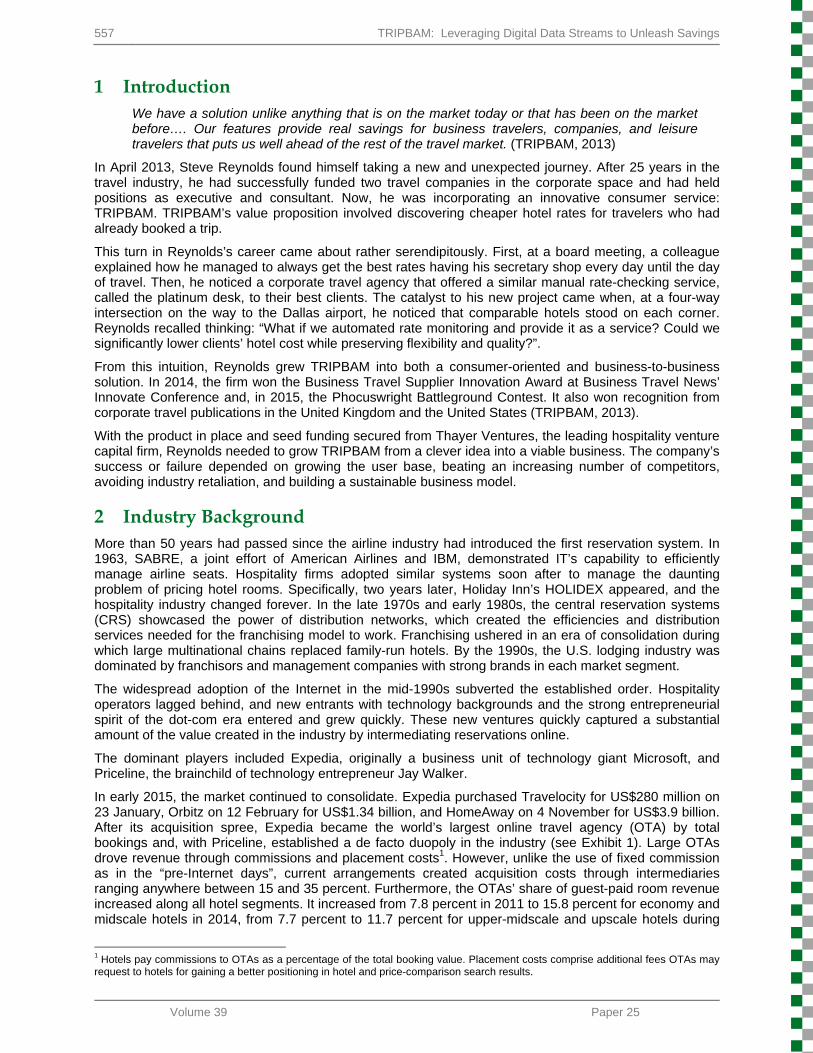
the same period (Mayock, 2015), and from 6.6 percent to 8.8 percent for upper-upscale and luxury hotels again during the same period. In 2014, while lodging operators still received the largest share of their bookings from their websites and through their call centers, the OTAs' share of the online hotel market increased to 48 percent (up from 46 percent in 2012) (Walsh, 2014). Many thought this trend reflected the propensity of millennials, who represented 33 percent of U.S. leisure hotel guests (Harteveldt, 2013), to interact and book directly online through apps or social media. As Douglas Quinby, a principal analyst with the travel research firm Phocuswright, put it, since about 2005 there had been “pretty amazing growth of both the funding that’s gone into online travel and travel technology startups as well as the number of companies that have…made their way into the arena.” (Robinson-Jacobs, 2013)
0
20
40
60
80
100
120
140
160
2013 2014 2015 2016 2017 2018
billion USD
Intermediaries
Hotels
Figure 1. Hotel Global Online Sales by Channel, Projections for 2014 and Onwards (Rossini, 2014, p. 11)
OTAs were not, however, the only players in the distribution space. Savvy travelers would often first shop at metasearch sites such as Kayak (a Priceline property), Skyscanner, and Hipmunk (see Figure 2).
1.4
2.4
3.7
4.2
4.5
11.6
17
19
33.3
123.8
0 20 40 60 80 100 120 140
Easyvoyage.com
Travelsupermarket.com
Hipmunk.com
Farecompare.com
Hotelscombined.com
Trivago.com
Qunar.com
Skyscanner.net
Kayak.com
Tripadvisor.com
million monthly visits
Figure 2. Key Global Metasearch Engines in Travel (Adapted Based on Data from SimilarWeb.com)
Central reservation systems (CRSs), travel agencies, and travel management companies (TMCs) were other important players in the lodging distribution chain. While travel agents serviced a niche market of travelers with complex itinerary requests in the unmanaged consumer market, business travelers relied on internal travel managers or TMCs such as Concur or American Express for their travel needs. Travel agents’ revenues primarily came from service fees (e.g., ticketing, booking, expense management) and
559 TRIPBAM: Leveraging Digital Data Streams to Unleash Savings
Volume 39 Paper 25
transaction fees (e.g., credit card discount rate, processing costs, GDS fees). In some contracts, they could also garner commissions, but these financial flows represented a fraction of their total revenue.
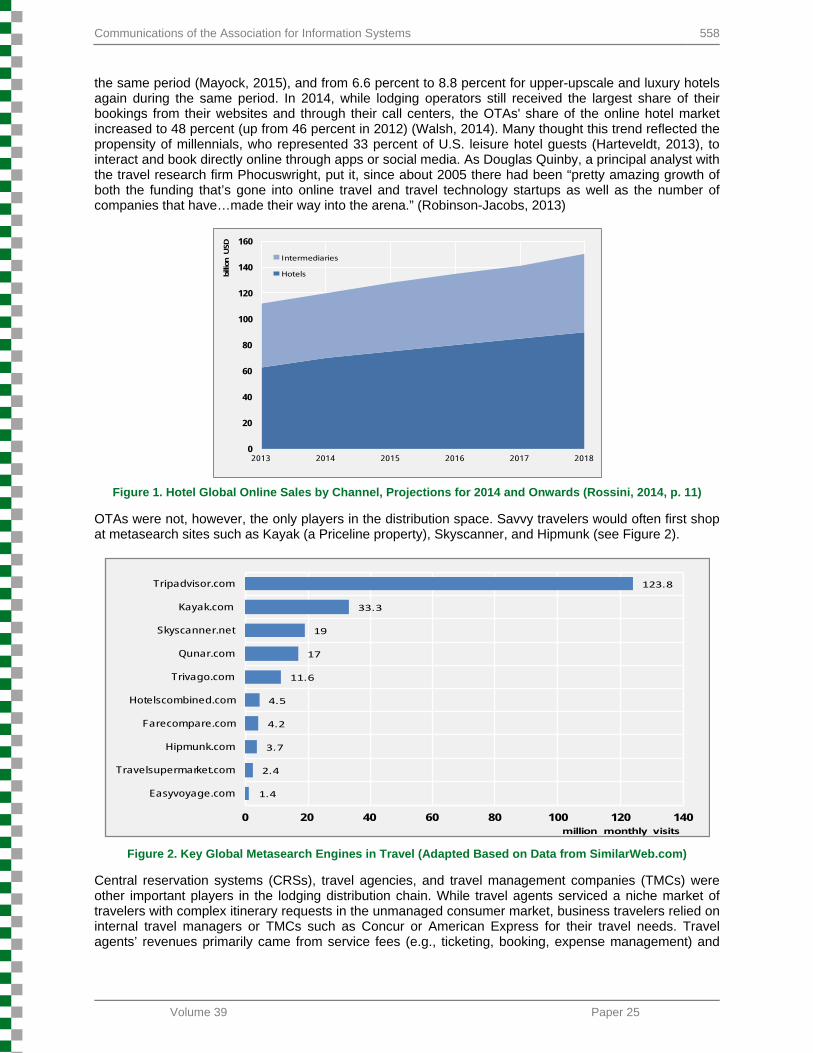
Business travel management was a complex process encompassing corporate travel policies (e.g., maximum allowed rates, allowed categories, and daily expense limits), itinerary planning and booking, expense management, and reporting. It also included yearly rate negotiations with suppliers. Up 4 percent and totaling US$112 billion in 2015, U.S. corporate travel represented one third of the total worldwide travel market (Figure 3). Despite hoteliers’ efforts to attract direct bookings, intermediariaris still managed more than three quarters (US$87 billion, 78%) of corporate travel in 2015 (Fadnis, 2016).
470.97
533.52
593.18
649.85
704.77
762.34
14.1% 13.3%11.2% 9.6% 8.5% 8.2%
0
100
200
300
400
500
600
700
800
2014 2015 2016 2017 2018 2019
Billion
Digital Travel Sales % of change
Figure 3. Worldwide Digital Travel (eMarketer, 2015)
The rising power of OTAs on the consumer side imposed high customer acquisition costs on hotels and an increasing dependency on intermediaries in the distribution channels, particularly for independent operators. In addition, given the strength of their cash flow, OTAs could invest in marketing and communication to attract consumers. They also continually innovated on their online offerings by introducing faster and better search and comparison tools. In 2015, ease of use was still the main reason travelers’ favored OTAs and other booking sites—even ahead of price (Gasdia, Liu, & Blutstein, 2015). Additionally, OTAs introduced their own loyalty programs in an effort to offset the value proposition of the major chains’ proprietary frequent traveler incentives. Sixteen percent of consumer travelers’ booked rooms four times or more annually and many of them (67%) belonged to hotels’ loyalty programs (Gasdia et al., 2015).
While observers did not consider lodging a pioneering industry when it came to IT, software in the form of global distribution systems (GDS), central reservation systems (CRS), and property management systems (PMS) controlled the travel value chain. By 2012, four major GDS dominated the hotel reservation landscape: Amadeus, Sabre, and Travelport’s Worldspan and Galileo. GDS represented the backbone of the travel industry, and hotels published their information such as room availabilities and rates in these systems. Other than hotels, only travel agents or authorized travel resellers could access GDSs. Smaller brands accessed GDS indirectly through intermediate distribution systems called “switches”, such as Pegasus, Genares, Dhisco, and InnLink.
Internally, hotels used revenue management systems to optimize their occupancy and profits adjusting rates to room availabilities. During periods of expected high occupancy, the hotel raised rates to extract greater margins while lowering rates in times of low projected occupancy. The Internet increased rate visibility for guests and competitors alike, which enabled revenue management systems to consider market conditions when creating forecasts. The ultimate outcome of these trends was a drastic increase in room rates’ volatility and the complexity of rate structures that customers had to understand and work with.
Interestingly, the rise of OTAs forced reservation and distribution systems to evolve. The OTA model, because it enabled consumers to shop directly for travel, utterly increased the number of hits (also known as availability requests or “looks”) to the GDS. But the number of actual confirmed reservations sold, the
Communications of the Association for Information Systems 560
Volume 39 Paper 25
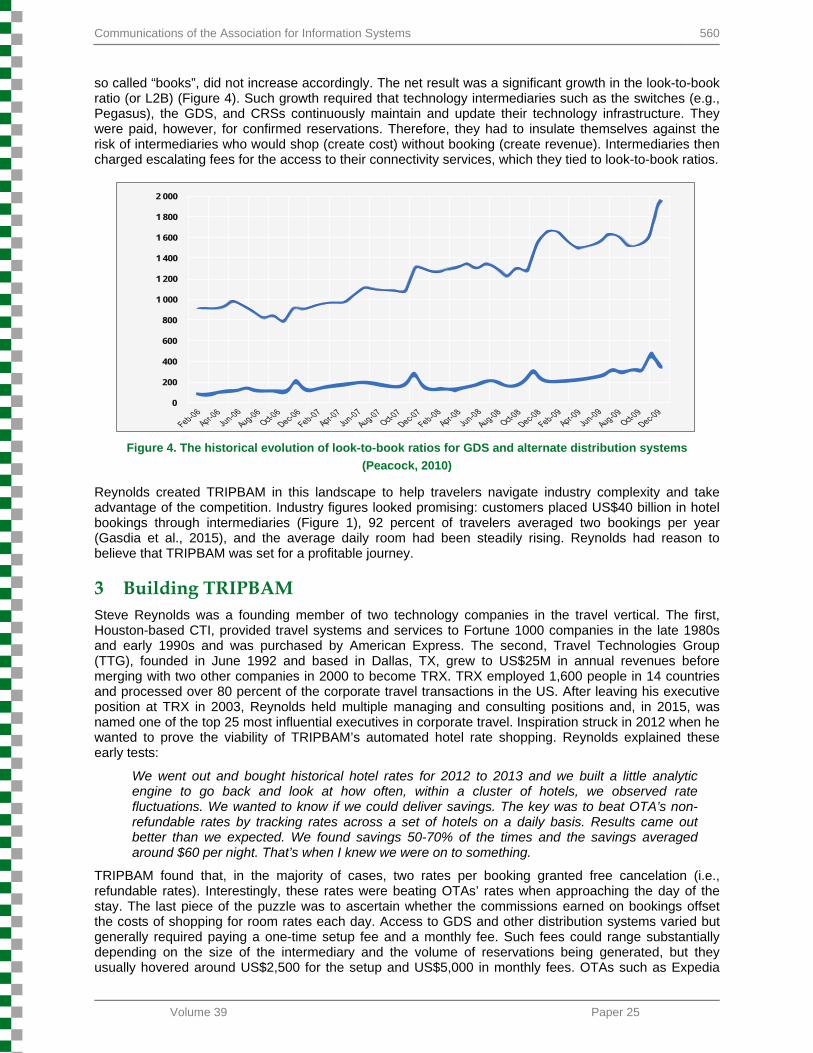
so called “books”, did not increase accordingly. The net result was a significant growth in the look-to-book ratio (or L2B) (Figure 4). Such growth required that technology intermediaries such as the switches (e.g., Pegasus), the GDS, and CRSs continuously maintain and update their technology infrastructure. They were paid, however, for confirmed reservations. Therefore, they had to insulate themselves against the risk of intermediaries who would shop (create cost) without booking (create revenue). Intermediaries then charged escalating fees for the access to their connectivity services, which they tied to look-to-book ratios.
400
0
200
600
800
1 000
1 200
1 400
1 600
1 800
2 000
Figure 4. The historical evolution of look-to-book ratios for GDS and alternate distribution systems
(Peacock, 2010)
Reynolds created TRIPBAM in this landscape to help travelers navigate industry complexity and take advantage of the competition. Industry figures looked promising: customers placed US$40 billion in hotel bookings through intermediaries (Figure 1), 92 percent of travelers averaged two bookings per year (Gasdia et al., 2015), and the average daily room had been steadily rising. Reynolds had reason to believe that TRIPBAM was set for a profitable journey.
3 Building TRIPBAM Steve Reynolds was a founding member of two technology companies in the travel vertical. The first, Houston-based CTI, provided travel systems and services to Fortune 1000 companies in the late 1980s and early 1990s and was purchased by American Express. The second, Travel Technologies Group (TTG), founded in June 1992 and based in Dallas, TX, grew to US$25M in annual revenues before merging with two other companies in 2000 to become TRX. TRX employed 1,600 people in 14 countries and processed over 80 percent of the corporate travel transactions in the US. After leaving his executive position at TRX in 2003, Reynolds held multiple managing and consulting positions and, in 2015, was named one of the top 25 most influential executives in corporate travel. Inspiration struck in 2012 when he wanted to prove the viability of TRIPBAM’s automated hotel rate shopping. Reynolds explained these early tests:
We went out and bought historical hotel rates for 2012 to 2013 and we built a little analytic engine to go back and look at how often, within a cluster of hotels, we observed rate fluctuations. We wanted to know if we could deliver savings. The key was to beat OTA’s non-refundable rates by tracking rates across a set of hotels on a daily basis. Results came out better than we expected. We found savings 50-70% of the times and the savings averaged around $60 per night. That’s when I knew we were on to something.
TRIPBAM found that, in the majority of cases, two rates per booking granted free cancelation (i.e., refundable rates). Interestingly, these rates were beating OTAs’ rates when approaching the day of the stay. The last piece of the puzzle was to ascertain whether the commissions earned on bookings offset the costs of shopping for room rates each day. Access to GDS and other distribution systems varied but generally required paying a one-time setup fee and a monthly fee. Such fees could range substantially depending on the size of the intermediary and the volume of reservations being generated, but they usually hovered around US$2,500 for the setup and US$5,000 in monthly fees. OTAs such as Expedia
561 TRIPBAM: Leveraging Digital Data Streams to Unleash Savings
Volume 39 Paper 25
provide free application programming interface (API)2 access to their affiliates as soon as they could comply with a L2B ratio of 500 to 1 for room rates and availability requests. As Reynolds commented: “Shopping costs have come down compared to the mainframe era because hardware and infrastructure costs have decreased dramatically. Today, it's micro pennies per hit.”.
In November 2011, once he became convinced of the opportunity available to TRIPBAM, Reynolds reached out Caleb Blanton, a former colleague at TRX. After leaving TRX in 2007, Blanton had created his own IT consulting company, Creativa Consulting. Blanton recalled:
Steve told me the story of how he came up with the idea. We had our share of experience with booking tools and we knew that the travel space was really congested, but I immediately realized this wasn’t a booking tool. It was a shopping service and in an industry this congested it's pretty unique to find an emerging niche.
But between an idea and an operating startup, there was significant work to be done. Blanton explained:
I took Steve's coarse-grained business requirements and developed finer grained software solutions. It was challenging, but I am particularly good at bridging the gap between the business and the technology.
Reynolds financed the initial development of TRIPBAM’s prototype. It was a proof of concept limited to core functionalities and based only on static data. Reynolds recounted: “I needed a minimum viable product to pitch investors, to demonstrate our initial success. Investors were critical partners to fuel our growth.”.
TRIPBAM was incorporated in Dallas in April 2013, and it was the first service providing clustered rate shopping to consumers. This unique feature enabled users to shop rates from a set of similar hotels and in a geographical area.
Initially, TRIPBAM outsourced its development to Blanton’s software company, but, in 2015, his whole team joined TRIPBAM full time, which raised the employee count to 10. In August 2013, Thayer Ventures injected the company with US$1m in seed funding. A second wave of funding followed in January 2015 for an additional US$525K of equity to fund TRIPBAM’s development and market penetration in the business segment. To secure TRIPBAM’s intellectual property in September 2013, the firm applied for a utility patent covering the clustered rate shopping concept and received it in March 2014 (Reynolds, 2014).
4 The Product
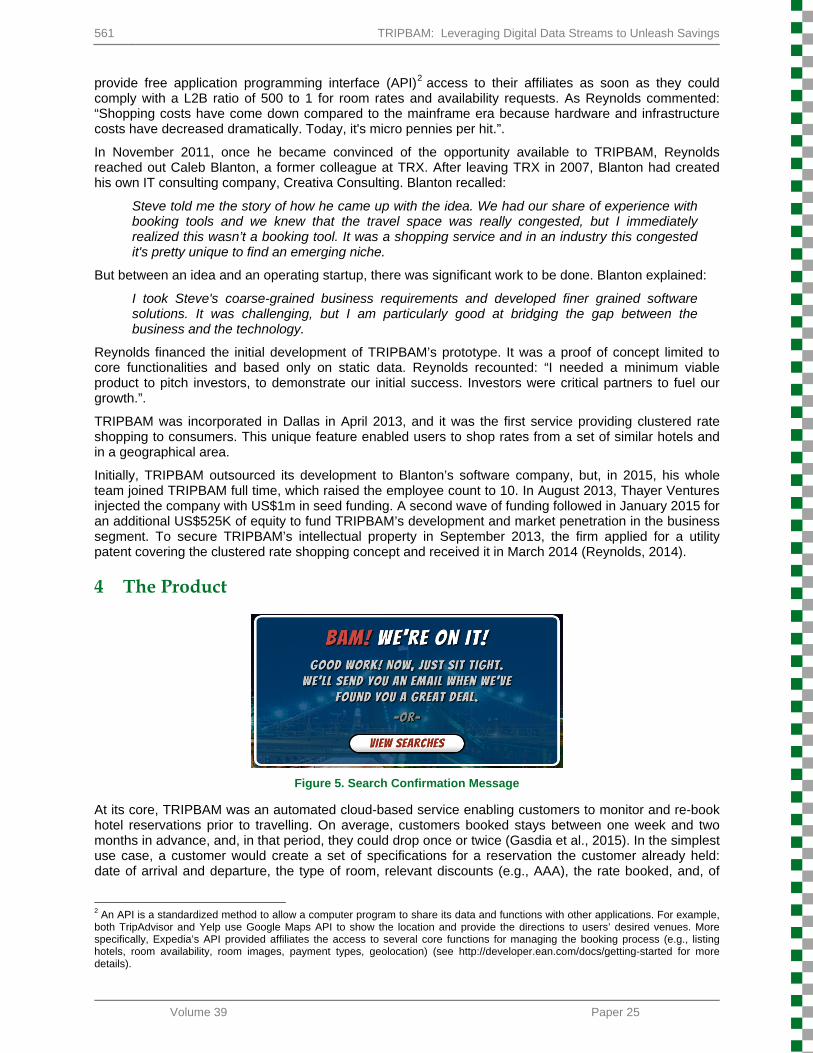
Figure 5. Search Confirmation Message
At its core, TRIPBAM was an automated cloud-based service enabling customers to monitor and re-book hotel reservations prior to travelling. On average, customers booked stays between one week and two months in advance, and, in that period, they could drop once or twice (Gasdia et al., 2015). In the simplest use case, a customer would create a set of specifications for a reservation the customer already held: date of arrival and departure, the type of room, relevant discounts (e.g., AAA), the rate booked, and, of
2 An API is a standardized method to allow a computer program to share its data and functions with other applications. For example, both TripAdvisor and Yelp use Google Maps API to show the location and provide the directions to users’ desired venues. More specifically, Expedia’s API provided affiliates the access to several core functions for managing the booking process (e.g., listing hotels, room availability, room images, payment types, geolocation) (see http://developer.ean.com/docs/getting-started for more details).
Communications of the Association for Information Systems 562
Volume 39 Paper 25
course, the hotel name and location. TRIPBAM referred to these specifications as the “search.” Once it confirmed the search, TRIPBAM would monitor the hotel for rate fluctuations and alert the customer when rebooking would yield savings (Figure 5).
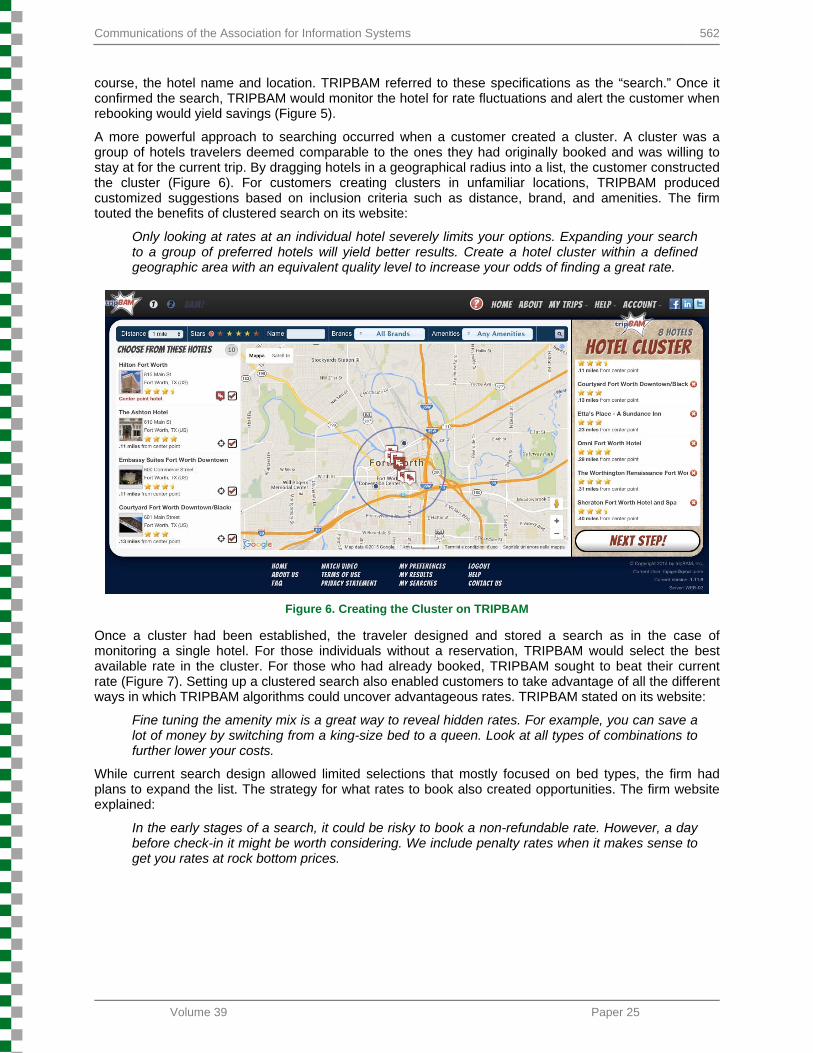
A more powerful approach to searching occurred when a customer created a cluster. A cluster was a group of hotels travelers deemed comparable to the ones they had originally booked and was willing to stay at for the current trip. By dragging hotels in a geographical radius into a list, the customer constructed the cluster (Figure 6). For customers creating clusters in unfamiliar locations, TRIPBAM produced customized suggestions based on inclusion criteria such as distance, brand, and amenities. The firm touted the benefits of clustered search on its website:
Only looking at rates at an individual hotel severely limits your options. Expanding your search to a group of preferred hotels will yield better results. Create a hotel cluster within a defined geographic area with an equivalent quality level to increase your odds of finding a great rate.
Figure 6. Creating the Cluster on TRIPBAM
Once a cluster had been established, the traveler designed and stored a search as in the case of monitoring a single hotel. For those individuals without a reservation, TRIPBAM would select the best available rate in the cluster. For those who had already booked, TRIPBAM sought to beat their current rate (Figure 7). Setting up a clustered search also enabled customers to take advantage of all the different ways in which TRIPBAM algorithms could uncover advantageous rates. TRIPBAM stated on its website:
Fine tuning the amenity mix is a great way to reveal hidden rates. For example, you can save a lot of money by switching from a king-size bed to a queen. Look at all types of combinations to further lower your costs.
While current search design allowed limited selections that mostly focused on bed types, the firm had plans to expand the list. The strategy for what rates to book also created opportunities. The firm website explained:
In the early stages of a search, it could be risky to book a non-refundable rate. However, a day before check-in it might be worth considering. We include penalty rates when it makes sense to get you rates at rock bottom prices.
563 TRIPBAM: Leveraging Digital Data Streams to Unleash Savings
Volume 39 Paper 25
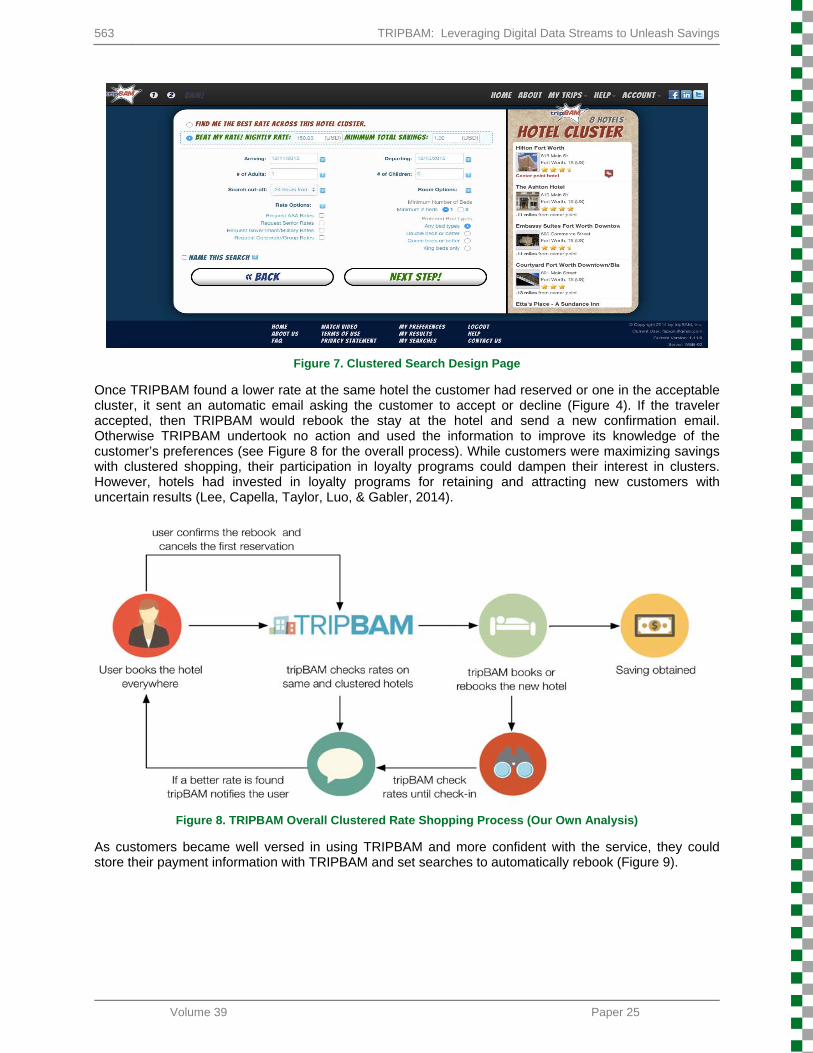
Figure 7. Clustered Search Design Page
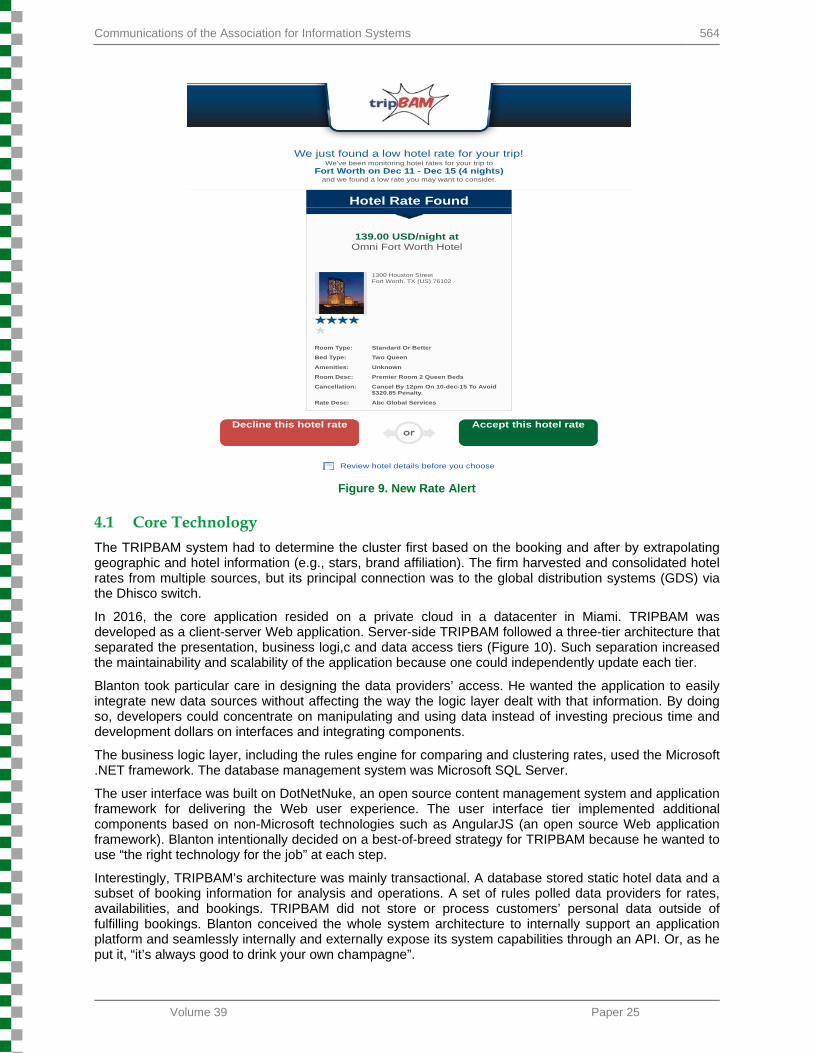
Once TRIPBAM found a lower rate at the same hotel the customer had reserved or one in the acceptable cluster, it sent an automatic email asking the customer to accept or decline (Figure 4). If the traveler accepted, then TRIPBAM would rebook the stay at the hotel and send a new confirmation email. Otherwise TRIPBAM undertook no action and used the information to improve its knowledge of the customer’s preferences (see Figure 8 for the overall process). While customers were maximizing savings with clustered shopping, their participation in loyalty programs could dampen their interest in clusters. However, hotels had invested in loyalty programs for retaining and attracting new customers with uncertain results (Lee, Capella, Taylor, Luo, & Gabler, 2014).
Figure 8. TRIPBAM Overall Clustered Rate Shopping Process (Our Own Analysis)
As customers became well versed in using TRIPBAM and more confident with the service, they could store their payment information with TRIPBAM and set searches to automatically rebook (Figure 9).
Communications of the Association for Information Systems 564
Volume 39 Paper 25
We just found a low hotel rate for your trip!We've been monitoring hotel rates for your trip to
Fort Worth on Dec 11 - Dec 15 (4 nights)and we found a low rate you may want to consider.
Hotel Rate Found
139.00 USD/night atOmni Fort Worth Hotel
1300 Houston StreetFort Worth, TX (US) 76102
Room Type: Standard Or Better
Bed Type: Two Queen
Amenities: Unknown
Room Desc: Premier Room 2 Queen Beds
Cancellation: Cancel By 12pm On 10-dec-15 To Avoid$320.85 Penalty.
Rate Desc: Abc Global Services
Decline this hotel rate Accept this hotel rate
Review hotel details before you choose
Figure 9. New Rate Alert
4.1 Core Technology
The TRIPBAM system had to determine the cluster first based on the booking and after by extrapolating geographic and hotel information (e.g., stars, brand affiliation). The firm harvested and consolidated hotel rates from multiple sources, but its principal connection was to the global distribution systems (GDS) via the Dhisco switch.
In 2016, the core application resided on a private cloud in a datacenter in Miami. TRIPBAM was developed as a client-server Web application. Server-side TRIPBAM followed a three-tier architecture that separated the presentation, business logi,c and data access tiers (Figure 10). Such separation increased the maintainability and scalability of the application because one could independently update each tier.
Blanton took particular care in designing the data providers’ access. He wanted the application to easily integrate new data sources without affecting the way the logic layer dealt with that information. By doing so, developers could concentrate on manipulating and using data instead of investing precious time and development dollars on interfaces and integrating components.
The business logic layer, including the rules engine for comparing and clustering rates, used the Microsoft .NET framework. The database management system was Microsoft SQL Server.
The user interface was built on DotNetNuke, an open source content management system and application framework for delivering the Web user experience. The user interface tier implemented additional components based on non-Microsoft technologies such as AngularJS (an open source Web application framework). Blanton intentionally decided on a best-of-breed strategy for TRIPBAM because he wanted to use “the right technology for the job” at each step.
Interestingly, TRIPBAM’s architecture was mainly transactional. A database stored static hotel data and a subset of booking information for analysis and operations. A set of rules polled data providers for rates, availabilities, and bookings. TRIPBAM did not store or process customers’ personal data outside of fulfilling bookings. Blanton conceived the whole system architecture to internally support an application platform and seamlessly internally and externally expose its system capabilities through an API. Or, as he put it, “it’s always good to drink your own champagne”.

565 TRIPBAM: Leveraging Digital Data Streams to Unleash Savings
Volume 39 Paper 25
Figure 10. Overall logical architecture (Our Own Analysis Based on Company Data)
TRIPBAM collected rates and availability information for the hotels in the monitored lists at a predetermined time. It included timely notification to users as an important part of its value proposition because special rates were available for a limited time or quantity.
Blanton’s team built the rules engine on a proprietary framework and determined when a monitored rate fit the customer preferences, the cluster characteristics, and the saving threshold the customer identified, which triggered the alert notification (Figure 11).
Figure 11. TRIPBAM Workflow (Our Own Analysis Based on Company Data)
4.2 The Corporate Opportunity
Just two months after TRIPBAM’s launch, something unexpected happened. Reynolds recalled:
Large corporations called up and said they wanted to use TRIPBAM for all of their corporate bookings. We were surprised, but we started to work with them. Based on those relationship, we started to develop more corporate oriented functionalities like a customizable rules engine, reporting and analytics.
Communications of the Association for Information Systems 566
Volume 39 Paper 25
Large corporations easily exceeded 15,000 bookings per year (Hermes Management Consulting, 2013). The team had to work hard to refine the service for corporate customers. In particular, compliance was a critical element because, in corporate travel, companies had specific requirements. Travel compliance concerned preferred property program, negotiated rates, preferred brands, and specific agreements with hotel brands. While most corporations had automated policy compliance tools, eight of 10 companies manually monitored and controlled travel expenses (Amadeus, 2015). The use of TRIPBAM in the corporate space was substantially different compared to what happened in the consumer market. Business customers initiated and managed bookings on reservation systems such as Concur, via travel agents, or directly on brand.com sites. Thus, TRIPBAM had to pivot its value proposition to market itself as a service for generating savings and enforcing travel policies’ compliance. The service agreement between TRIPBAM and a business customer defined the engine shopping parameters (e.g., same hotel, same room, preferred cluster, non-preferred cluster, etc.). In general, customers provided the bookings they wanted to monitor through TRIPBAM’s API and the system shopped the rates accordingly. The website then notified the customer in the case of a lower rate.
While different from what TRIPBAM planned for the consumer market, the B2B opportunity appeared to be real. Reynolds recalled: “Thayer Venture's Jeff Jackson, a real expert in the B2B space, pushed us to pursue B2B since he saw it as the best opportunity.”.
4.3 Revenue Model
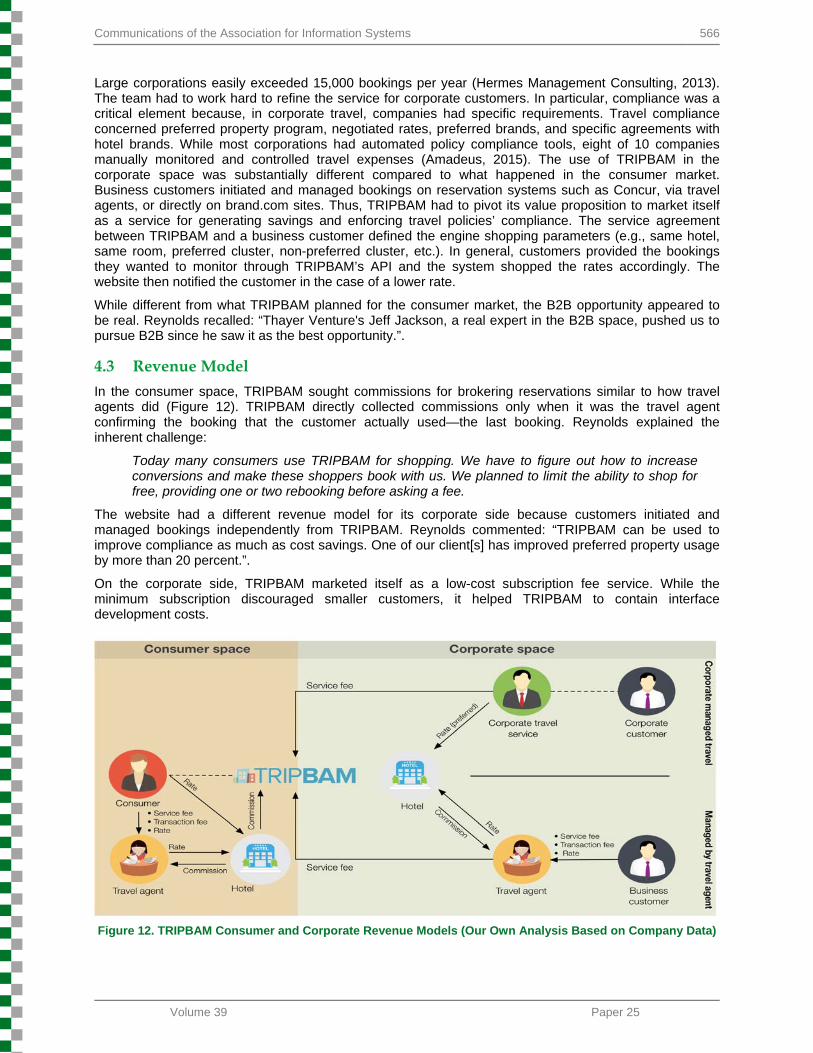
In the consumer space, TRIPBAM sought commissions for brokering reservations similar to how travel agents did (Figure 12). TRIPBAM directly collected commissions only when it was the travel agent confirming the booking that the customer actually used—the last booking. Reynolds explained the inherent challenge:
Today many consumers use TRIPBAM for shopping. We have to figure out how to increase conversions and make these shoppers book with us. We planned to limit the ability to shop for free, providing one or two rebooking before asking a fee.
The website had a different revenue model for its corporate side because customers initiated and managed bookings independently from TRIPBAM. Reynolds commented: “TRIPBAM can be used to improve compliance as much as cost savings. One of our client[s] has improved preferred property usage by more than 20 percent.”.
On the corporate side, TRIPBAM marketed itself as a low-cost subscription fee service. While the minimum subscription discouraged smaller customers, it helped TRIPBAM to contain interface development costs.
Figure 12. TRIPBAM Consumer and Corporate Revenue Models (Our Own Analysis Based on Company Data)
567 TRIPBAM: Leveraging Digital Data Streams to Unleash Savings
Volume 39 Paper 25
4.4 Competition
TRIPBAM faced an increasing competition, and, while OTAs appeared to be of limited concern, other players were challenging its market space. OTAs were only offering price guarantees on the day of purchase and not aggressively moving into TRIPBAM’s territory. Reynolds explained:
While we are about cost savings, OTAs interest lays in revenues improvement. They are so dependent upon hotel commission revenues that copying us would actually mean diminishing their revenues.
Reynolds worried more about the number of other startups or existing companies that would look to copy them in the event that their service became widely accepted. In 2012, Tingo, owned by TripAdvisor, introduced the concept of automatic rebooks and refunds. The application leveraged the Expedia Affiliate Network to book and monitor hotel rates. In case of price drops or free upgrades, the service would automatically rebook and refund the price difference directly on customers’ credit cards. In 2013, the European startup TripRebel launched on Tingo basic business assumptions. The system featured the same automatic room rebooking when the same hotel made upgrades, better rates, or additional amenities available. Additionally, it enabled users to rebook at better rates in a pre-defined “favorite” list of properties.
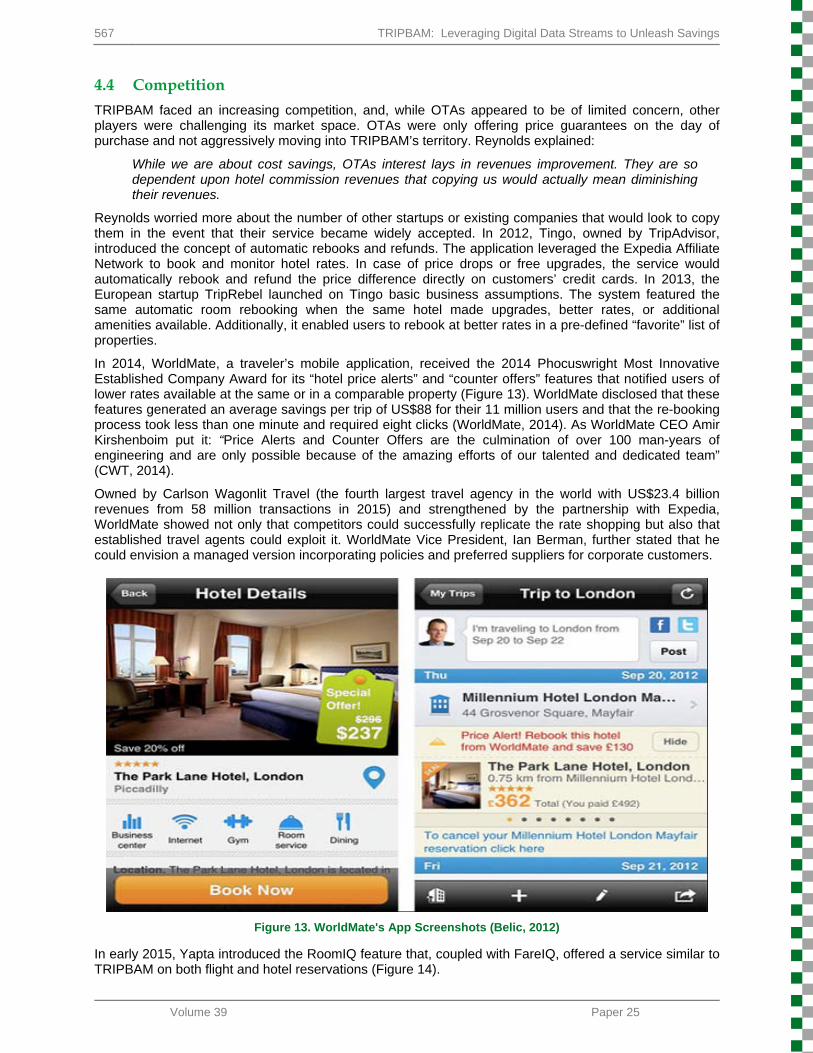
In 2014, WorldMate, a traveler’s mobile application, received the 2014 Phocuswright Most Innovative Established Company Award for its “hotel price alerts” and “counter offers” features that notified users of lower rates available at the same or in a comparable property (Figure 13). WorldMate disclosed that these features generated an average savings per trip of US$88 for their 11 million users and that the re-booking process took less than one minute and required eight clicks (WorldMate, 2014). As WorldMate CEO Amir Kirshenboim put it: “Price Alerts and Counter Offers are the culmination of over 100 man-years of engineering and are only possible because of the amazing efforts of our talented and dedicated team” (CWT, 2014).
Owned by Carlson Wagonlit Travel (the fourth largest travel agency in the world with US$23.4 billion revenues from 58 million transactions in 2015) and strengthened by the partnership with Expedia, WorldMate showed not only that competitors could successfully replicate the rate shopping but also that established travel agents could exploit it. WorldMate Vice President, Ian Berman, further stated that he could envision a managed version incorporating policies and preferred suppliers for corporate customers.
Figure 13. WorldMate's App Screenshots (Belic, 2012)
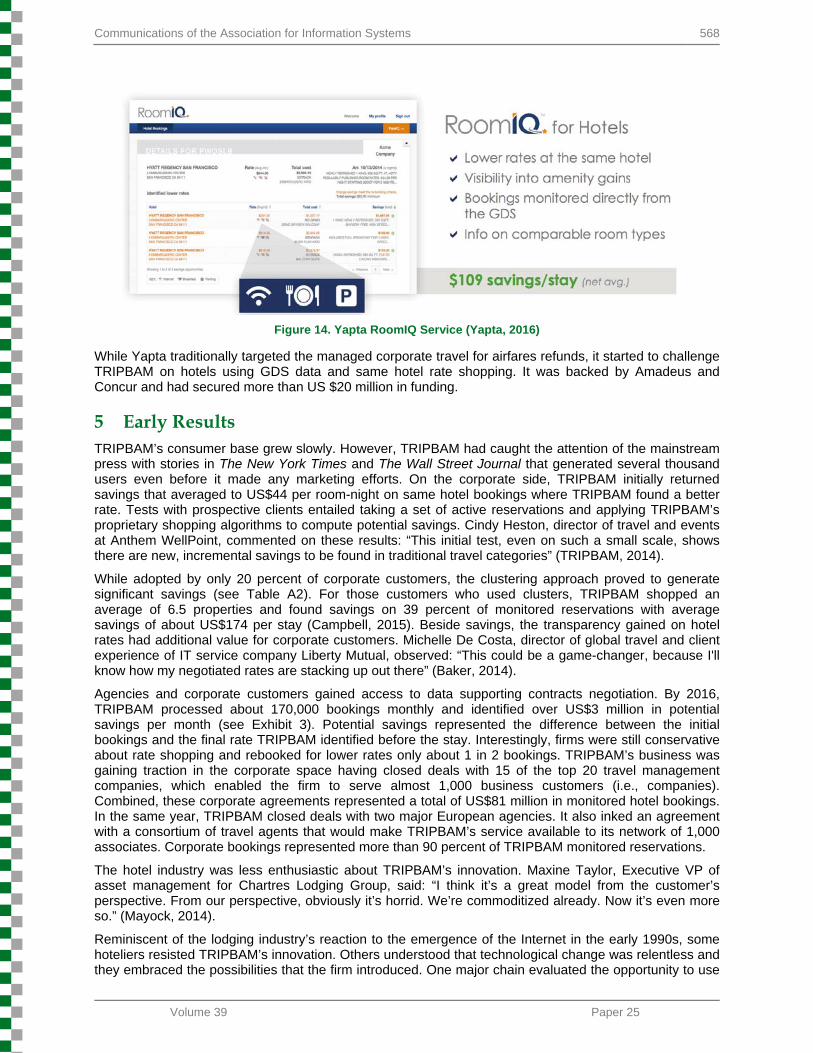
In early 2015, Yapta introduced the RoomIQ feature that, coupled with FareIQ, offered a service similar to TRIPBAM on both flight and hotel reservations (Figure 14).
Communications of the Association for Information Systems 568
Volume 39 Paper 25
Figure 14. Yapta RoomIQ Service (Yapta, 2016)
While Yapta traditionally targeted the managed corporate travel for airfares refunds, it started to challenge TRIPBAM on hotels using GDS data and same hotel rate shopping. It was backed by Amadeus and Concur and had secured more than US $20 million in funding.
5 Early Results TRIPBAM’s consumer base grew slowly. However, TRIPBAM had caught the attention of the mainstream press with stories in The New York Times and The Wall Street Journal that generated several thousand users even before it made any marketing efforts. On the corporate side, TRIPBAM initially returned savings that averaged to US$44 per room-night on same hotel bookings where TRIPBAM found a better rate. Tests with prospective clients entailed taking a set of active reservations and applying TRIPBAM’s proprietary shopping algorithms to compute potential savings. Cindy Heston, director of travel and events at Anthem WellPoint, commented on these results: “This initial test, even on such a small scale, shows there are new, incremental savings to be found in traditional travel categories” (TRIPBAM, 2014).
While adopted by only 20 percent of corporate customers, the clustering approach proved to generate significant savings (see Table A2). For those customers who used clusters, TRIPBAM shopped an average of 6.5 properties and found savings on 39 percent of monitored reservations with average savings of about US$174 per stay (Campbell, 2015). Beside savings, the transparency gained on hotel rates had additional value for corporate customers. Michelle De Costa, director of global travel and client experience of IT service company Liberty Mutual, observed: “This could be a game-changer, because I'll know how my negotiated rates are stacking up out there” (Baker, 2014).
Agencies and corporate customers gained access to data supporting contracts negotiation. By 2016, TRIPBAM processed about 170,000 bookings monthly and identified over US$3 million in potential savings per month (see Exhibit 3). Potential savings represented the difference between the initial bookings and the final rate TRIPBAM identified before the stay. Interestingly, firms were still conservative about rate shopping and rebooked for lower rates only about 1 in 2 bookings. TRIPBAM’s business was gaining traction in the corporate space having closed deals with 15 of the top 20 travel management companies, which enabled the firm to serve almost 1,000 business customers (i.e., companies). Combined, these corporate agreements represented a total of US$81 million in monitored hotel bookings. In the same year, TRIPBAM closed deals with two major European agencies. It also inked an agreement with a consortium of travel agents that would make TRIPBAM’s service available to its network of 1,000 associates. Corporate bookings represented more than 90 percent of TRIPBAM monitored reservations.
The hotel industry was less enthusiastic about TRIPBAM’s innovation. Maxine Taylor, Executive VP of asset management for Chartres Lodging Group, said: “I think it’s a great model from the customer’s perspective. From our perspective, obviously it’s horrid. We’re commoditized already. Now it’s even more so.” (Mayock, 2014).
Reminiscent of the lodging industry’s reaction to the emergence of the Internet in the early 1990s, some hoteliers resisted TRIPBAM’s innovation. Others understood that technological change was relentless and they embraced the possibilities that the firm introduced. One major chain evaluated the opportunity to use
569 TRIPBAM: Leveraging Digital Data Streams to Unleash Savings
Volume 39 Paper 25
TRIPBAM to offer an enhanced rate insurance service to their loyalty program members by rate shopping on a cluster of other preferred properties nearby. Other forward-looking operators explored viable options for using TRIPBAM’s monitoring service to their advantage.
6 Charting the Future As Reynolds focused on turning TRIPBAM into a resilient, viable going concern, many questions remained. Was the consumer space the one that had the greatest potential or should the firm focus exclusively on the corporate market? How could TRIPBAM protect its early advantage from the inevitable imitators? Both the consumer and business opportunities looked wide open even though each side presented distinct challenges to growth. To achieve profitability, TRIPBAM needed to not only grow the user base but also seek a unique positioning in the market to defend against the increasing number of startups entering their space. One central issue involved the need for the technological infrastructure to evolve to accommodate the growth TRIPBAM was already experiencing. Blanton explained:
One of the agencies we are working with has the potential to generate millions of bookings per month, alone. Even if we are mainly transactional, every hotel rate we see, at a certain point, needs to be stored. And this can impact analytics.
While confident about the future of TRIPBAM Reynolds reflected on the road ahead:
Our biggest challenge is focusing on an initial market. We’ve gotten so much attention from multiple market segments that it’s been difficult to stay focused. Our service has value for consumers, travel agencies, independent contractor agents, executive assistants, corporations, convention management companies, and more. (Vivion, 2013)
Communications of the Association for Information Systems 570
Volume 39 Paper 25
References Amadeus. (2015). 2015 European business travel and expense analysis. Retrieved from
http://goo.gl/SCrRku
Baker, M. B. (2014). BCD travel tests TripBam with client hotel programs. The Beat. Retrieved from http://www.thebeat.travel/post/2014/07/21/BCD-Travel-Tests-TripBam-With-Client-Hotel-Programs.aspx
Belic, D. (2012). WorldMate’s iOS app gets hotel price alerts. IntoMobile. Retrieved from http://www.intomobile.com/2012/08/24/worldmates-ios-app-gets-hotel-price-alerts/
Campbell, J. (2015). TripBam, Yapta offer savings in hotel rate assurance. The Company Dime. Retrieved from http://www.thecompanydime.com/yapta-tripbam/
CWT. (2014). WorldMate wins the PhoCusWright travel innovation summit award. Retrieved from http://www.carlsonwagonlit.com/content/cwt/nz/en/news/news-releases/20141113-WorldMate-PhoCusWright-Award.html
eMarketer. (2015). Worldwide digital travel sales will total more than $533 billion in 2015. Retrieved from http://www.emarketer.com/Article/Worldwide-Digital-Travel-Sales-Will-Total-More-than-533-Billion-2015/1013392
Fadnis, C. (2016). U.S. corporate travel: Market sizing and trends. Phocuswright.
The Financial Times. (2016). Markets data. Retrieved from http://markets.ft.com/research/Markets/
Gasdia, M., Liu, B., & Blutstein, M. (2015). U.S. Consumer Travel Report Seventh Edition. Phocuswright.
Harteveldt, H. H. (2013). Who’s sleeping with you? Adara. Retrieved from http://adara.com/images/uploads/white_papers/Detailed-Look-Into-The-US-Online-Hotel-Guest-2013-2014.pdf
Hermes Management Consulting. (2013). Corporate travel management in Western Europe: Challenges and opportunities. Amadeus. Retrieved from http://goo.gl/zOHKco
Lee, J. J., Capella, M. L., Taylor, C. R., Luo, M., & Gabler, C. B. (2014). The financial impact of loyalty programs in the hotel industry: A social exchange theory perspective. Journal of Business Research, 67(10), 2139-2146.
Mayock, P. (2014). In the hot seat: HotelTonight, TripBam, Nor1. Hotel News Now. Retrieved from http://www.hotelnewsnow.com/articles/24597/In-the-hot-seat-HotelTonight-TripBam
Mayock, P. (2015). Study: OTAs continue to steal market share. Hotel News Now. Retrieved from http://www.hotelnewsnow.com/Articles/27250/Study-OTAs-continue-to-steal-market-share
Peacock, M. (2010). Attacking high look-to-book ratios. Retrieved from http://www.slideshare.net/peacock.ma/attacking-high-looktobook-ratios
Reynolds, S. D. (2014). Rate oscillation monitoring hotel reservation system. Google Patents. Retrieved from http://www.google.com/patents/US20140081678
Robinson-Jacobs, K. (2013). Dallas travel startup hopes to tap into increasing funding. The Dallas Morning News. Retrieved from http://www.dallasnews.com/business/restaurants-hotels/20130916-dallas-travel-startup-hopes-to-tap-into-increasing-funding.ece
Rossini, A. (2014). Online travel intermediaries: A fast changing competitive landscape. Euromonitor.
TRIPBAM. (2013). Patents pending for tripBAM hotel booking technology. PRNewswire. Retrieved from http://www.prnewswire.com/news-releases/patents-pending-for-tripbam-hotel-booking-technology-227811731.html
TRIPBAM. (2014). BCD travel pilots tripBAM, driving hotel savings for corporate clients. BusinessWire. Retrieved from http://www.businesswire.com/news/home/20140721005239/en/BCD-Travel-Pilots-tripBAM-Driving-Hotel-Savings
Vivion, N. (2013). TripBAM promises cash savings on hotels with minimal effort. Tnooz. Retrieved from https://www.tnooz.com/article/tripbam-promises-cash-savings-on-hotels-with-minimal-effort/
571 TRIPBAM: Leveraging Digital Data Streams to Unleash Savings
Volume 39 Paper 25
Walsh, C. S. (2014). OTA hotel play pays off: Double-digit gains boost outlook for U.S. intermediaries. Phocuswright. Retrieved from http://goo.gl/DNtvco
WorldMate. (2014). WorldMate PhoCusWright presentation. Retrieved from https://www.youtube.com/watch?v=r2O2nJkFUE8
Yapta. (2016). RoomIQ hotel price tracking for corporate travel. Retrieved from http://yapta.com/roomiq/
Communications of the Association for Information Systems 572
Volume 39 Paper 25
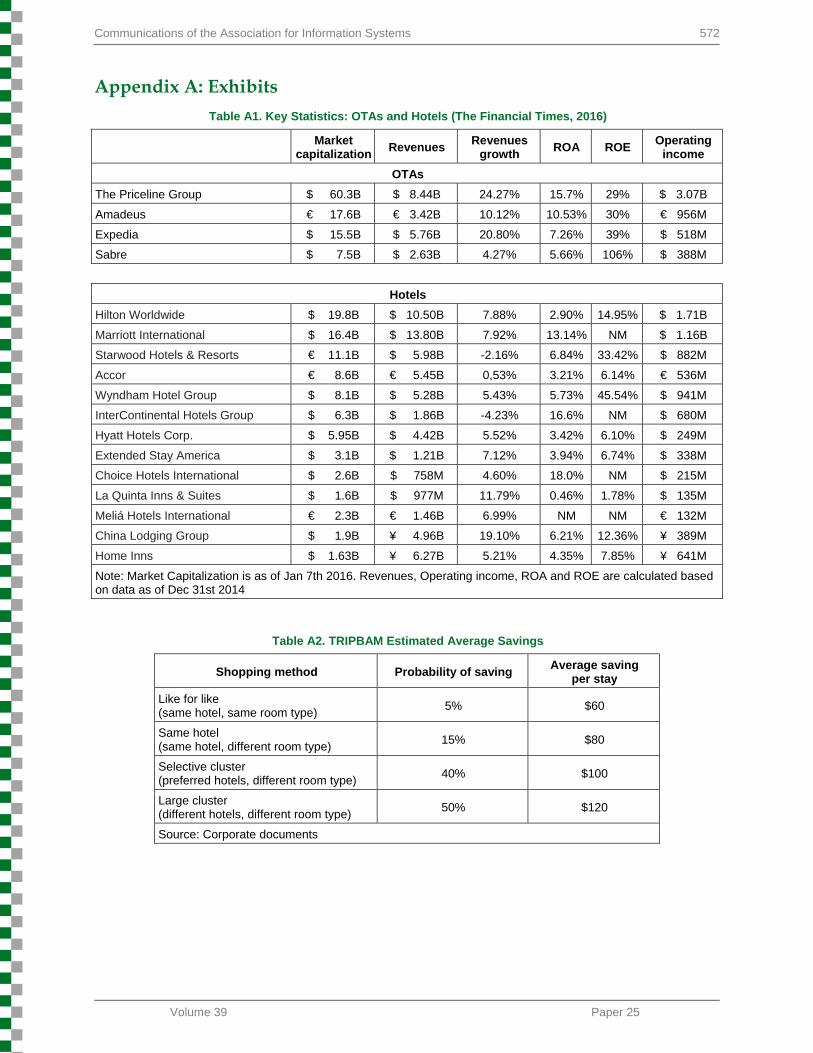
Appendix A: Exhibits Table A1. Key Statistics: OTAs and Hotels (The Financial Times, 2016)
Market
capitalizationRevenues
Revenuesgrowth
ROA ROE Operating
income
OTAs
The Priceline Group $ 60.3B $ 8.44B 24.27% 15.7% 29% $ 3.07B
Amadeus € 17.6B € 3.42B 10.12% 10.53% 30% € 956M
Expedia $ 15.5B $ 5.76B 20.80% 7.26% 39% $ 518M
Sabre $ 7.5B $ 2.63B 4.27% 5.66% 106% $ 388M
Hotels
Hilton Worldwide $ 19.8B $ 10.50B 7.88% 2.90% 14.95% $ 1.71B
Marriott International $ 16.4B $ 13.80B 7.92% 13.14% NM $ 1.16B
Starwood Hotels & Resorts € 11.1B $ 5.98B -2.16% 6.84% 33.42% $ 882M
Accor € 8.6B € 5.45B 0,53% 3.21% 6.14% € 536M
Wyndham Hotel Group $ 8.1B $ 5.28B 5.43% 5.73% 45.54% $ 941M
InterContinental Hotels Group $ 6.3B $ 1.86B -4.23% 16.6% NM $ 680M
Hyatt Hotels Corp. $ 5.95B $ 4.42B 5.52% 3.42% 6.10% $ 249M
Extended Stay America $ 3.1B $ 1.21B 7.12% 3.94% 6.74% $ 338M
Choice Hotels International $ 2.6B $ 758M 4.60% 18.0% NM $ 215M
La Quinta Inns & Suites $ 1.6B $ 977M 11.79% 0.46% 1.78% $ 135M
Meliá Hotels International € 2.3B € 1.46B 6.99% NM NM € 132M
China Lodging Group $ 1.9B ¥ 4.96B 19.10% 6.21% 12.36% ¥ 389M
Home Inns $ 1.63B ¥ 6.27B 5.21% 4.35% 7.85% ¥ 641M
Note: Market Capitalization is as of Jan 7th 2016. Revenues, Operating income, ROA and ROE are calculated based on data as of Dec 31st 2014
Table A2. TRIPBAM Estimated Average Savings
Shopping method Probability of saving Average saving
per stay
Like for like (same hotel, same room type)
5% $60
Same hotel (same hotel, different room type)
15% $80
Selective cluster (preferred hotels, different room type)
40% $100
Large cluster (different hotels, different room type)
50% $120
Source: Corporate documents
573 TRIPBAM: Leveraging Digital Data Streams to Unleash Savings
Volume 39 Paper 25
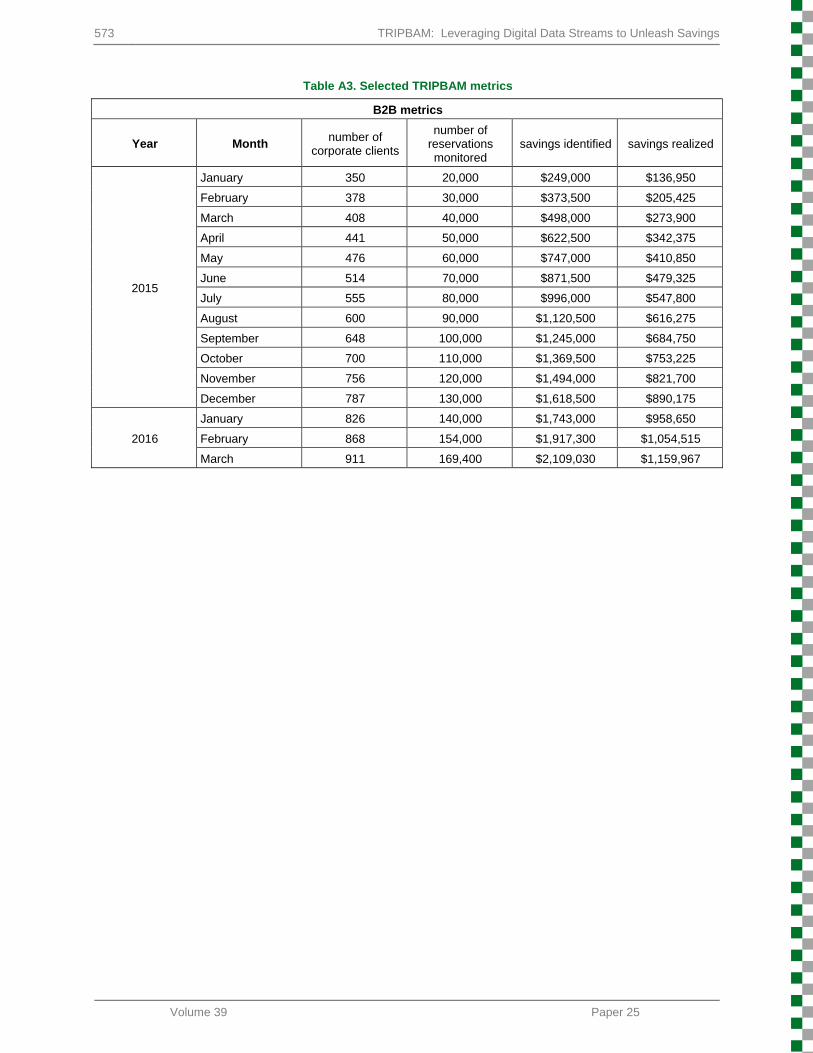
Table A3. Selected TRIPBAM metrics
B2B metrics
Year Month number of
corporate clients
number of reservations monitored
savings identified savings realized
2015
January 350 20,000 $249,000 $136,950
February 378 30,000 $373,500 $205,425
March 408 40,000 $498,000 $273,900
April 441 50,000 $622,500 $342,375
May 476 60,000 $747,000 $410,850
June 514 70,000 $871,500 $479,325
July 555 80,000 $996,000 $547,800
August 600 90,000 $1,120,500 $616,275
September 648 100,000 $1,245,000 $684,750
October 700 110,000 $1,369,500 $753,225
November 756 120,000 $1,494,000 $821,700
December 787 130,000 $1,618,500 $890,175
2016
January 826 140,000 $1,743,000 $958,650
February 868 154,000 $1,917,300 $1,054,515
March 911 169,400 $2,109,030 $1,159,967

Communications of the Association for Information Systems 574
Volume 39 Paper 25
About the Authors Gabriele Piccoli is the Edward G. Schleider Chair for Information Systems in the E. J. Ourso College of Business at Louisiana State University, and the Director of the Digital Data Streams Lab at LSU. His research, teaching, and consulting expertise is in strategic information systems and the use of advanced IT to support customer service. His most recent research focus is on Digital Data Streams and their potential for value creation. He is the author of the book Information Systems for Managers: Text and Cases. His research has appeared in both academic and applied outlets such as MIS Quarterly, Journal of AIS, European Journal of Information Systems, Decision Sciences, California Management Review, MIS Quarterly Executive, Communications of the ACM, and Harvard Business Review. He has published sixteen full-length teaching case studies through Communications of AIS as well as Harvard Business School Publishing.
Federico Pigni is Associate Professor and director of the Global Tech program at the Grenoble Ecole de Management (GEM) in France. He participated to research projects funded by Italian, regional, and EU agencies, private industry, government partners. He has published articles in journals such as MIS Quarterly Executive, California Management Review, Journal of Enterprise Information Management, International Journal of Information Technology and Management (IJITM), and Production Planning & Control. He teaches in the area of Information Systems and he is currently researching value creation and appropriation opportunities stemming from big data and digital data streams and their impacts at the organizational and industry level.
Copyright © 2016 by the Association for Information Systems. Permission to make digital or hard copies of all or part of this work for personal or classroom use is granted without fee provided that copies are not made or distributed for profit or commercial advantage and that copies bear this notice and full citation on the first page. Copyright for components of this work owned by others than the Association for Information Systems must be honored. Abstracting with credit is permitted. To copy otherwise, to republish, to post on servers, or to redistribute to lists requires prior specific permission and/or fee. Request permission to publish from: AIS Administrative Office, P.O. Box 2712 Atlanta, GA, 30301-2712 Attn: Reprints or via e-mail from [email protected].