Trip Generation Study: American Fork Commuter Rail Station ... - BYU.pdf · Trip Generation Study:...
25
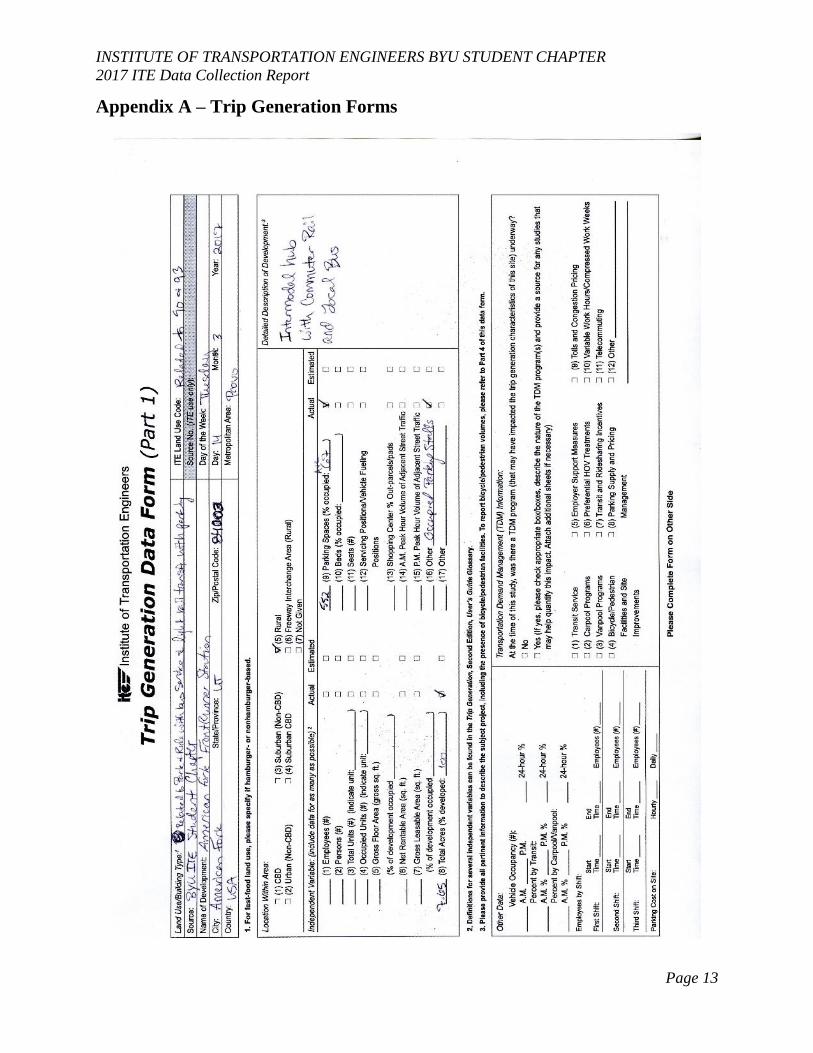
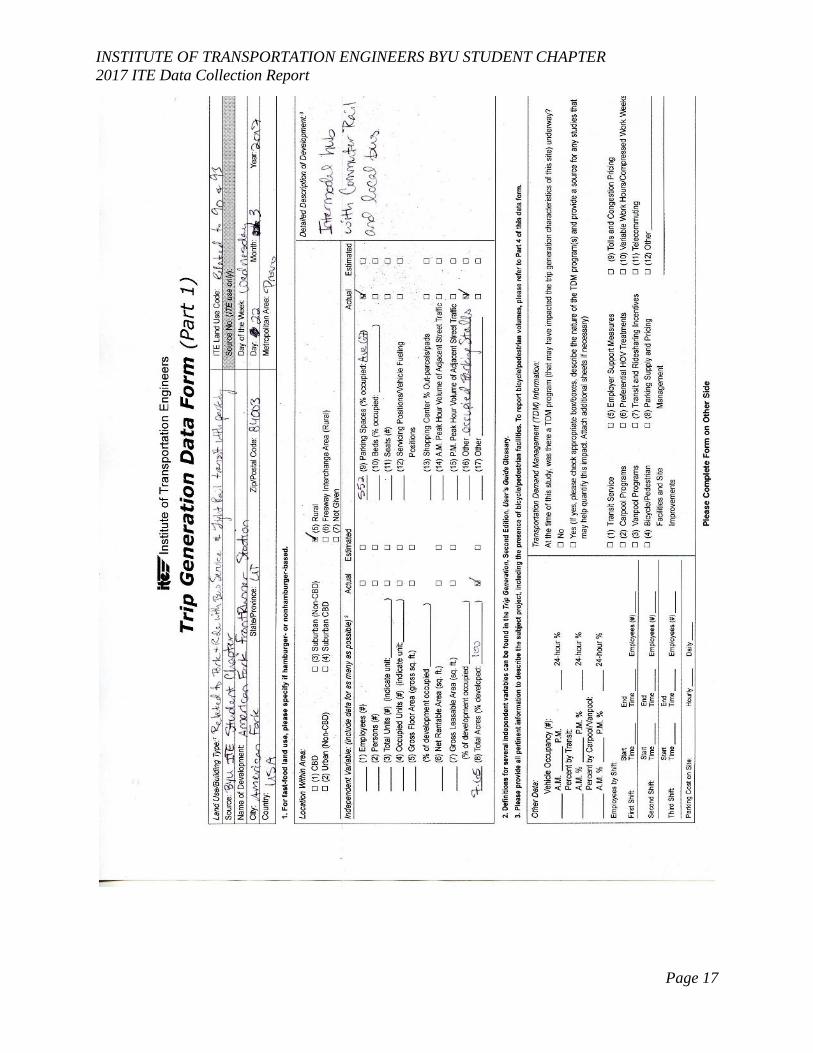
BRIGHAM YOUNG UNIVERSITY 368 CLYDE BUILDING PROVO, UTAH 84602 (801) 422-2811 / FAX: (801) 422-0159 Trip Generation Study: American Fork Commuter Rail Station Land Use Code: N/A Similar Land Use Codes: 90 and 93 Introduction The Brigham Young University Institute of Transportation Engineers (BYU ITE) student chapter completed a trip generation study, as proposed to the ITE Western District. The data were collected at the American Fork Commuter Rail Station in American Fork, Utah. This facility includes a commuter rail (FrontRunner) station and shuttle service and is similar to the ITE Trip Generation Land Use Codes 90 and 93 for the “Park-and-Ride Lot with Bus Service” and “Light Rail Transit Station with Parking” land uses, respectively. Land use 90 refers to a parking area that are used to transfer people from private vehicles to buses. These sites generally have shelters for waiting passengers and circulation facilities for buses and other vehicles. Land use 93 refers to a transportation station with the purpose of transferring people from private vehicles to light rail transportation. It is anticipated that the commuter rail facility could correspond to a new commuter rail center land use. The funding from this project will allow members from our student chapter to participate in ITE Western District meetings, local ITE Utah Chapter luncheons, and student chapter activities. This experience was a great learning opportunity for the student chapter and the students who were involved in the process. Ryan Hales, P.E., PTOE, AICP, and Jeremy Searle, P.E., PTOE, of Hales Engineering, provided mentoring support and project review for this data collection effort. Dr. Mitsuru Saito, P.E. and Dr. Grant Schultz, P.E., PTOE, both of BYU, provided valuable help and support and data collection equipment for the project. Site Information The American Fork Commuter Rail Station is located at 782 West 200 South in American Fork, Utah. The property is owned and operated by Utah Transit Authority (UTA) and is located on the north side of 200 South in a rural area that is growing into a suburban, non-Central Business District (CBD) area. There are two access points to the property at 200 South as illustrated in Figure 1. These two access points are the only access points to the property for all transportation modes, including pedestrians and bicyclists. There are a total of 552 marked parking stalls at the station. The site characteristics are summarized in Table 1.
Transcript of Trip Generation Study: American Fork Commuter Rail Station ... - BYU.pdf · Trip Generation Study:...
B R I G H A M Y O U N G U N I V E R S I T Y 3 6 8 C L Y D E B U I L D I N G P R O V O , U T A H 8 4 6 0 2
( 8 0 1 ) 4 2 2 - 2 8 1 1 / F A X : ( 8 0 1 ) 4 2 2 - 0 1 5 9
Trip Generation Study:
American Fork Commuter Rail Station
Land Use Code: N/A Similar Land Use Codes: 90 and 93
Introduction
The Brigham Young University Institute of Transportation Engineers (BYU ITE) student chapter
completed a trip generation study, as proposed to the ITE Western District. The data were
collected at the American Fork Commuter Rail Station in American Fork, Utah. This facility
includes a commuter rail (FrontRunner) station and shuttle service and is similar to the ITE Trip
Generation Land Use Codes 90 and 93 for the “Park-and-Ride Lot with Bus Service” and “Light
Rail Transit Station with Parking” land uses, respectively.
Land use 90 refers to a parking area that are used to transfer people from private vehicles to
buses. These sites generally have shelters for waiting passengers and circulation facilities for
buses and other vehicles. Land use 93 refers to a transportation station with the purpose of
transferring people from private vehicles to light rail transportation. It is anticipated that the
commuter rail facility could correspond to a new commuter rail center land use.
The funding from this project will allow members from our student chapter to participate in ITE
Western District meetings, local ITE Utah Chapter luncheons, and student chapter activities.
This experience was a great learning opportunity for the student chapter and the students who
were involved in the process.
Ryan Hales, P.E., PTOE, AICP, and Jeremy Searle, P.E., PTOE, of Hales Engineering, provided
mentoring support and project review for this data collection effort. Dr. Mitsuru Saito, P.E. and
Dr. Grant Schultz, P.E., PTOE, both of BYU, provided valuable help and support and data
collection equipment for the project.
Site Information
The American Fork Commuter Rail Station is located at 782 West 200 South in American Fork,
Utah. The property is owned and operated by Utah Transit Authority (UTA) and is located on
the north side of 200 South in a rural area that is growing into a suburban, non-Central Business
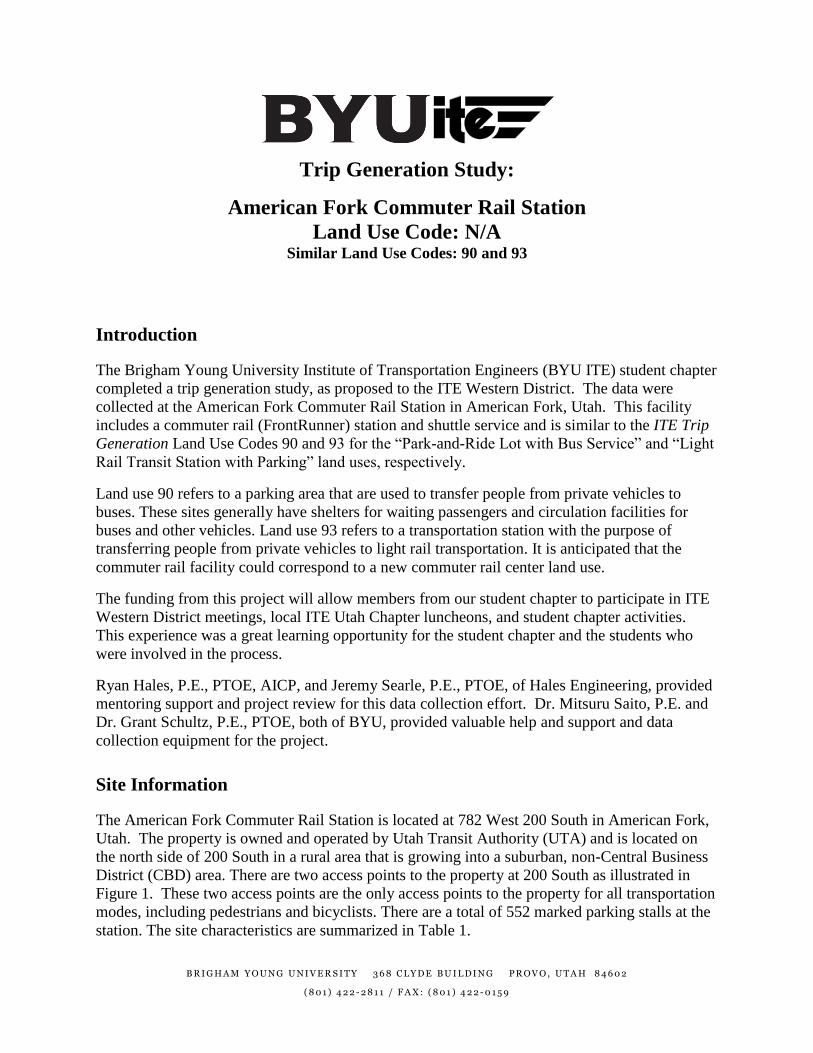
District (CBD) area. There are two access points to the property at 200 South as illustrated in
Figure 1. These two access points are the only access points to the property for all transportation
modes, including pedestrians and bicyclists. There are a total of 552 marked parking stalls at the
station. The site characteristics are summarized in Table 1.
INSTITUTE OF TRANSPORTATION ENGINEERS BYU STUDENT CHAPTER
2017 ITE Data Collection Report
Page 2
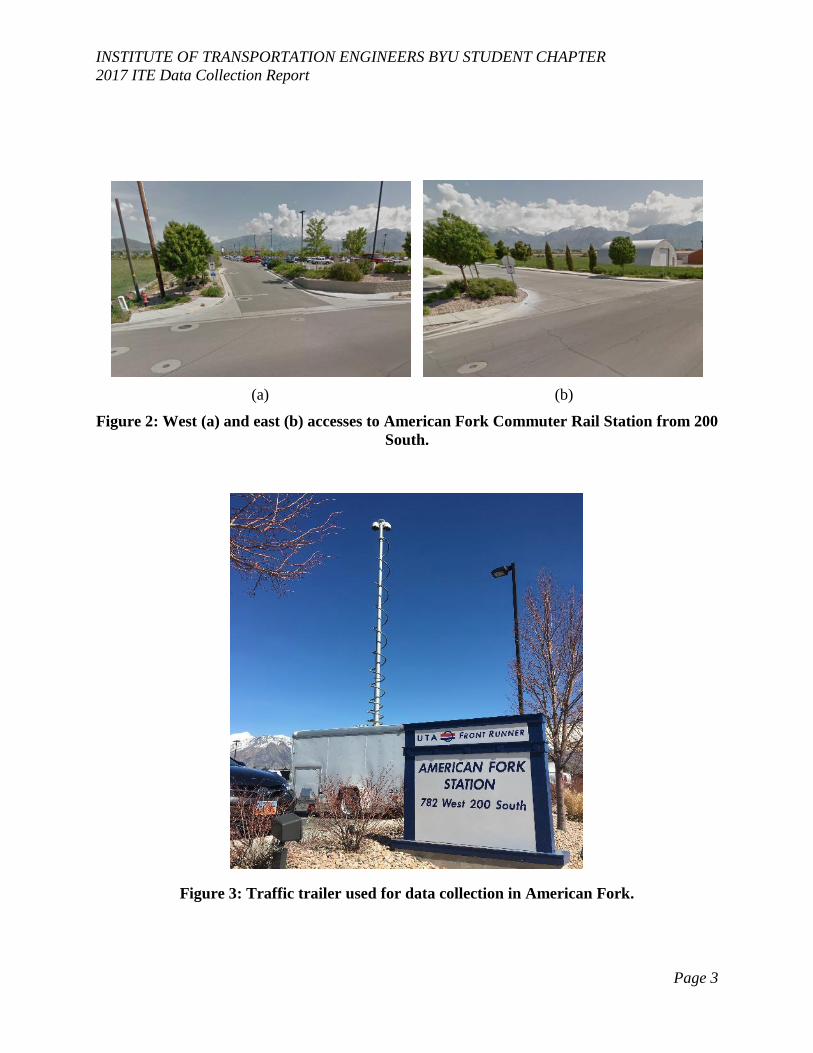
Data used in the study were collected on four weekdays. The BYU data collection trailer was
used to collect data for the project on three weekdays. The trailer was parked within the property,
with the cameras pointed towards the two entrances along 200 South. Manual counts were
performed on one of the weekdays to account for lost video data. Parking counts were performed
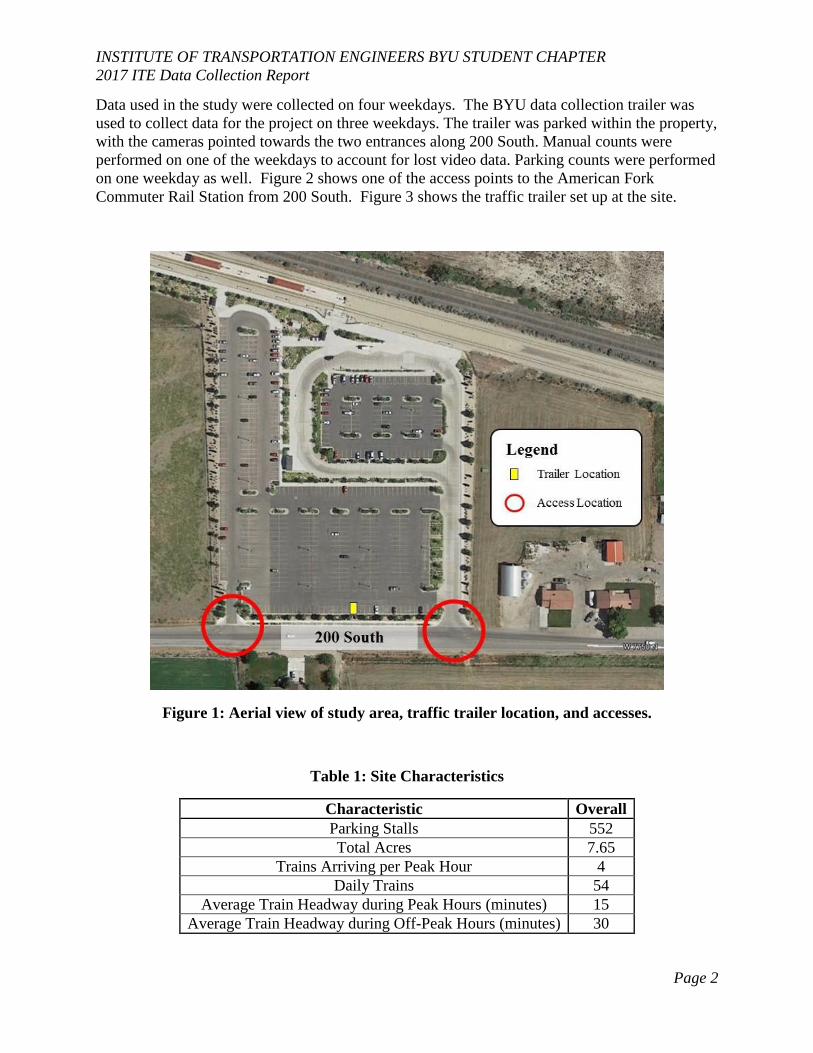
on one weekday as well. Figure 2 shows one of the access points to the American Fork
Commuter Rail Station from 200 South. Figure 3 shows the traffic trailer set up at the site.
Figure 1: Aerial view of study area, traffic trailer location, and accesses.
Table 1: Site Characteristics
Characteristic Overall
Parking Stalls 552
Total Acres 7.65
Trains Arriving per Peak Hour 4
Daily Trains 54
Average Train Headway during Peak Hours (minutes) 15
Average Train Headway during Off-Peak Hours (minutes) 30
INSTITUTE OF TRANSPORTATION ENGINEERS BYU STUDENT CHAPTER
2017 ITE Data Collection Report
Page 3
(a) (b)
Figure 2: West (a) and east (b) accesses to American Fork Commuter Rail Station from 200
South.
Figure 3: Traffic trailer used for data collection in American Fork.
INSTITUTE OF TRANSPORTATION ENGINEERS BYU STUDENT CHAPTER
2017 ITE Data Collection Report
Page 4
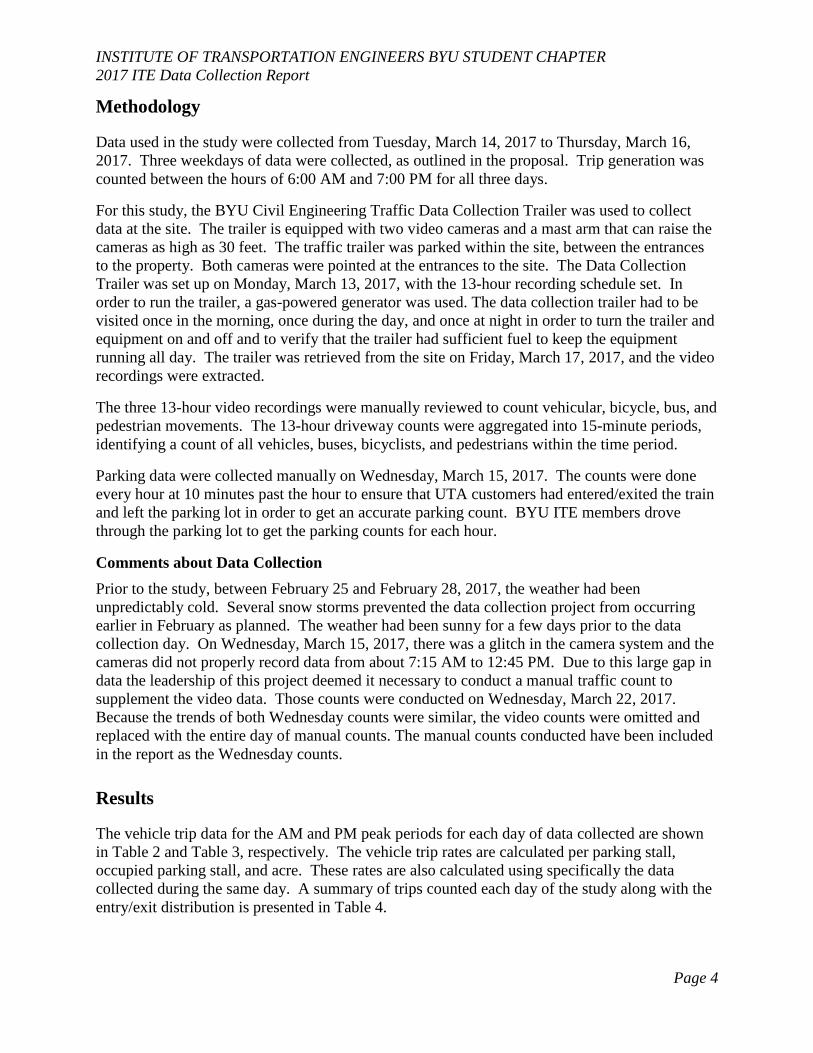
Methodology
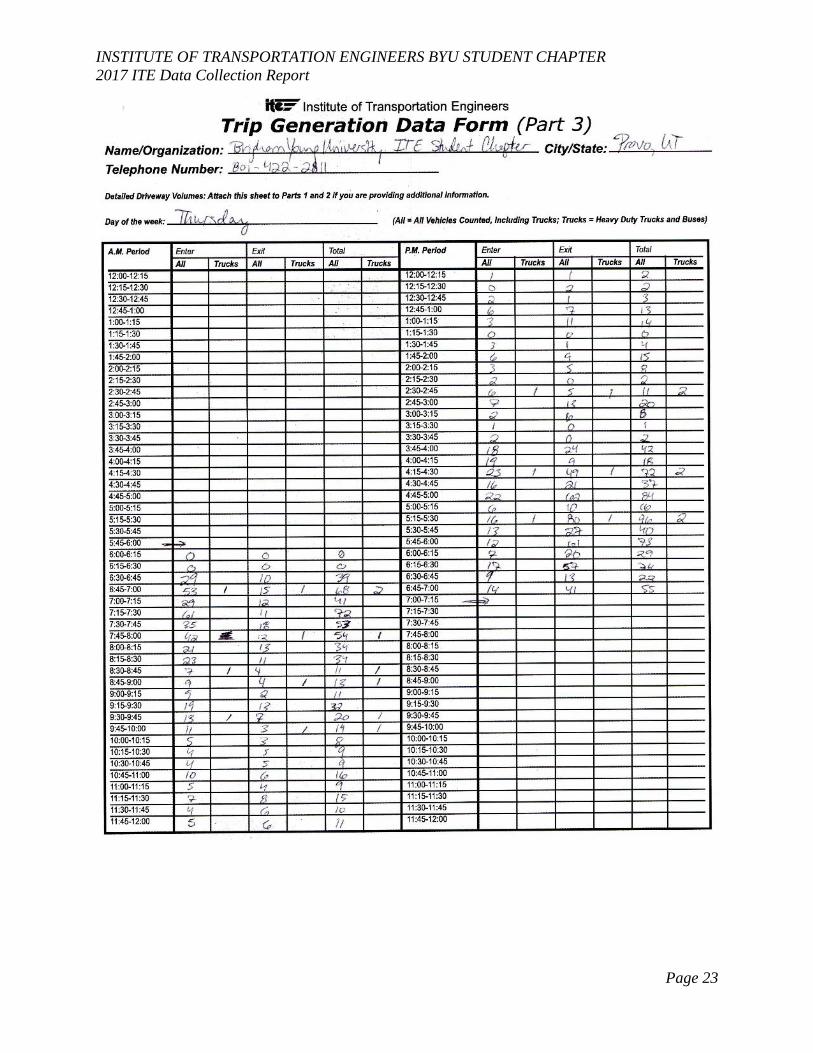
Data used in the study were collected from Tuesday, March 14, 2017 to Thursday, March 16,
2017. Three weekdays of data were collected, as outlined in the proposal. Trip generation was
counted between the hours of 6:00 AM and 7:00 PM for all three days.
For this study, the BYU Civil Engineering Traffic Data Collection Trailer was used to collect
data at the site. The trailer is equipped with two video cameras and a mast arm that can raise the
cameras as high as 30 feet. The traffic trailer was parked within the site, between the entrances
to the property. Both cameras were pointed at the entrances to the site. The Data Collection
Trailer was set up on Monday, March 13, 2017, with the 13-hour recording schedule set. In
order to run the trailer, a gas-powered generator was used. The data collection trailer had to be
visited once in the morning, once during the day, and once at night in order to turn the trailer and
equipment on and off and to verify that the trailer had sufficient fuel to keep the equipment
running all day. The trailer was retrieved from the site on Friday, March 17, 2017, and the video
recordings were extracted.
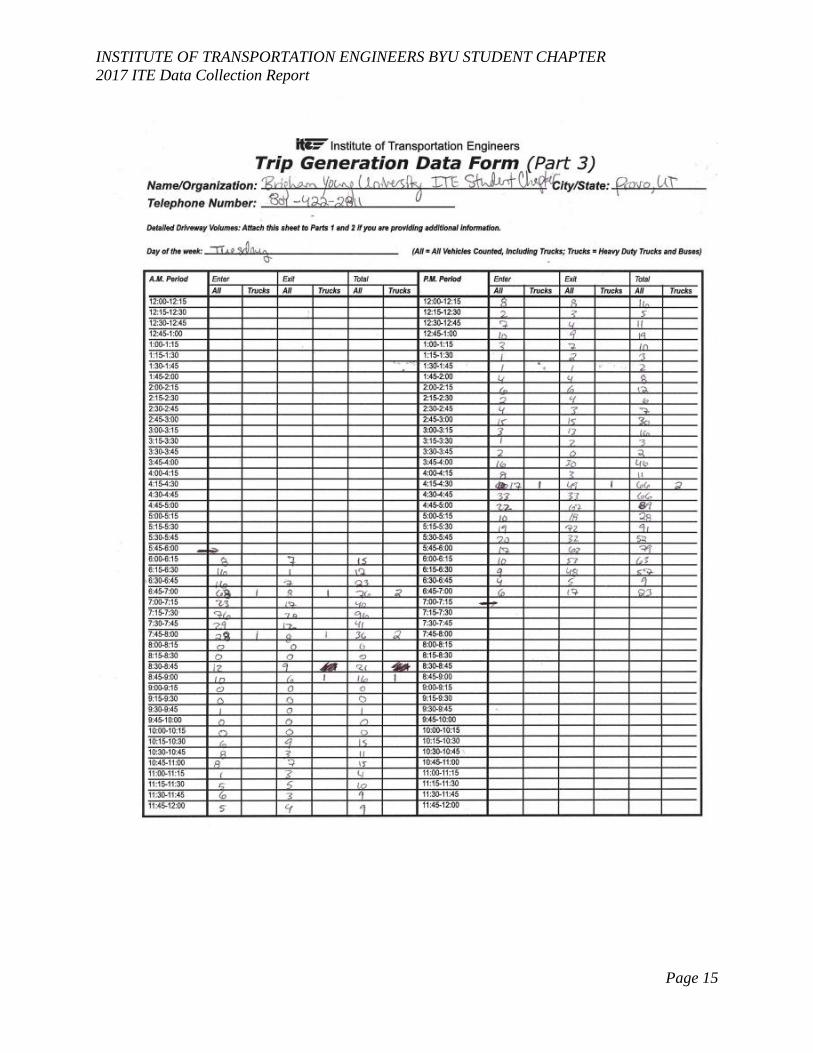
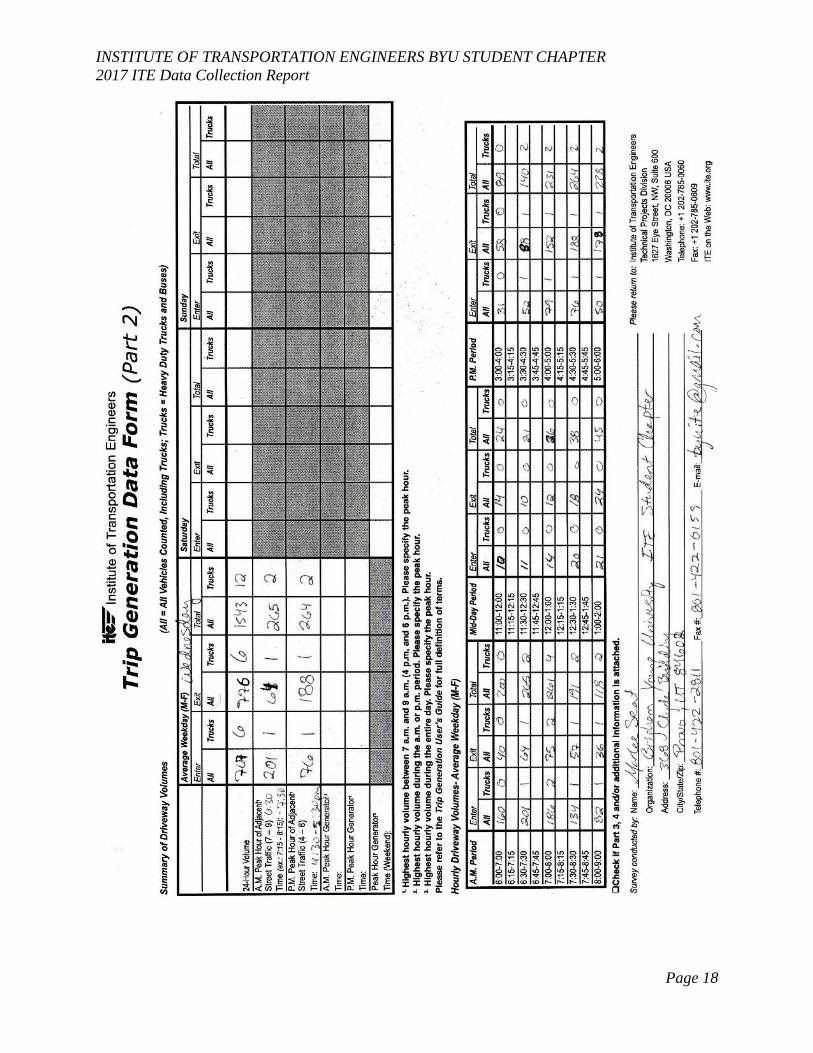
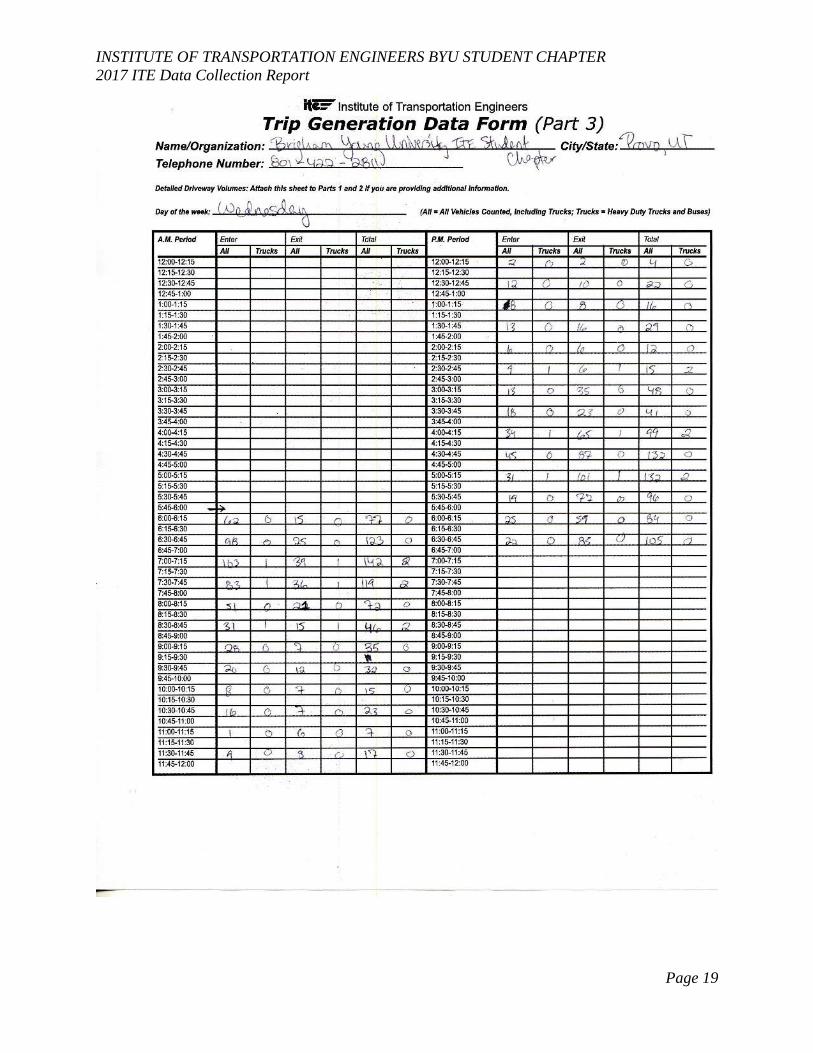
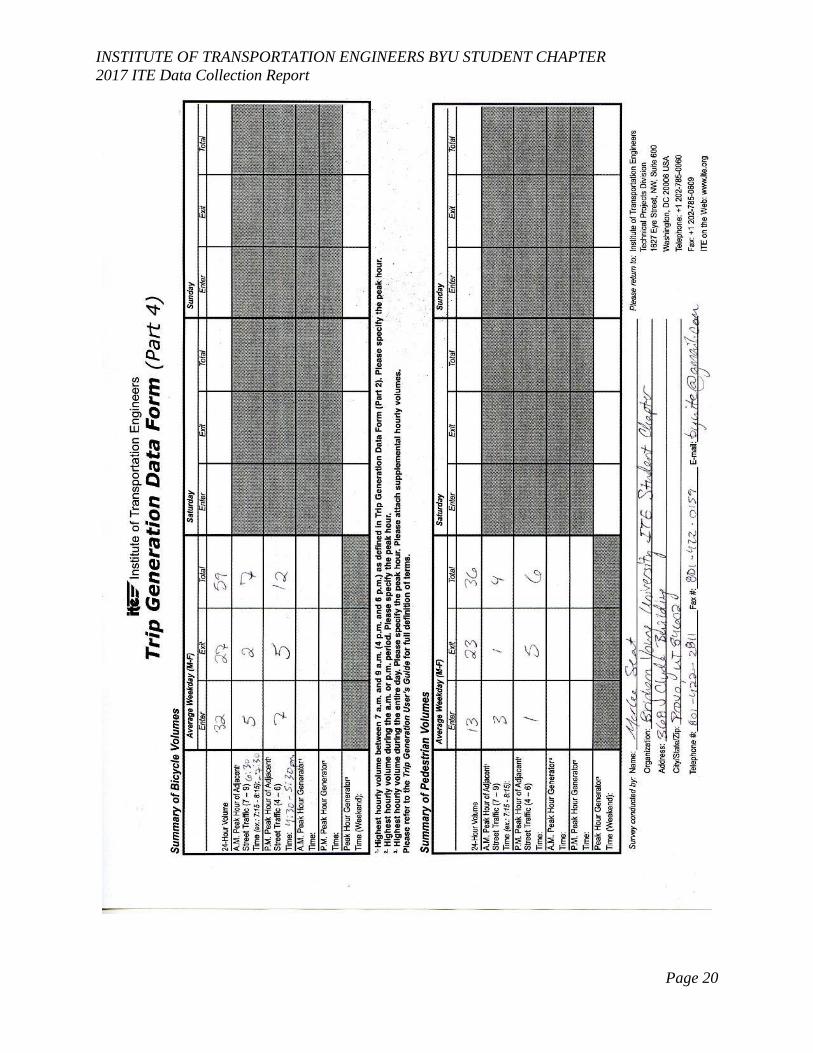
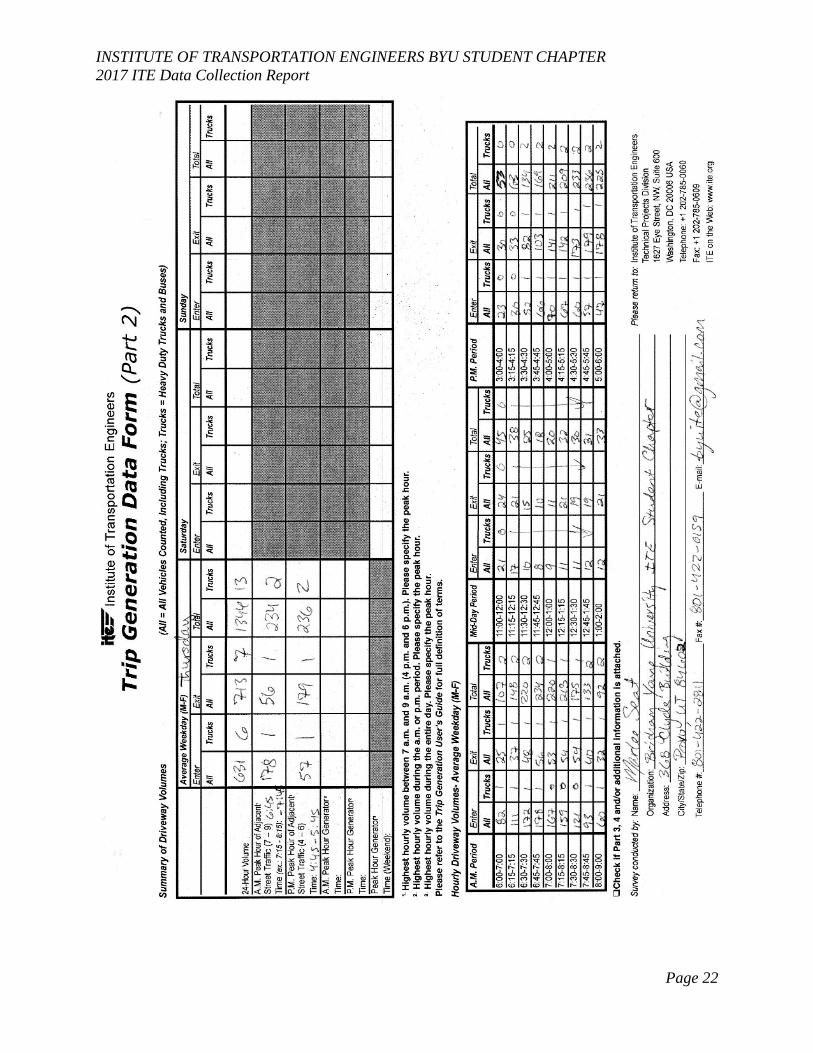
The three 13-hour video recordings were manually reviewed to count vehicular, bicycle, bus, and
pedestrian movements. The 13-hour driveway counts were aggregated into 15-minute periods,
identifying a count of all vehicles, buses, bicyclists, and pedestrians within the time period.
Parking data were collected manually on Wednesday, March 15, 2017. The counts were done
every hour at 10 minutes past the hour to ensure that UTA customers had entered/exited the train
and left the parking lot in order to get an accurate parking count. BYU ITE members drove
through the parking lot to get the parking counts for each hour.
Comments about Data Collection
Prior to the study, between February 25 and February 28, 2017, the weather had been
unpredictably cold. Several snow storms prevented the data collection project from occurring
earlier in February as planned. The weather had been sunny for a few days prior to the data
collection day. On Wednesday, March 15, 2017, there was a glitch in the camera system and the
cameras did not properly record data from about 7:15 AM to 12:45 PM. Due to this large gap in
data the leadership of this project deemed it necessary to conduct a manual traffic count to
supplement the video data. Those counts were conducted on Wednesday, March 22, 2017.
Because the trends of both Wednesday counts were similar, the video counts were omitted and
replaced with the entire day of manual counts. The manual counts conducted have been included
in the report as the Wednesday counts.
Results
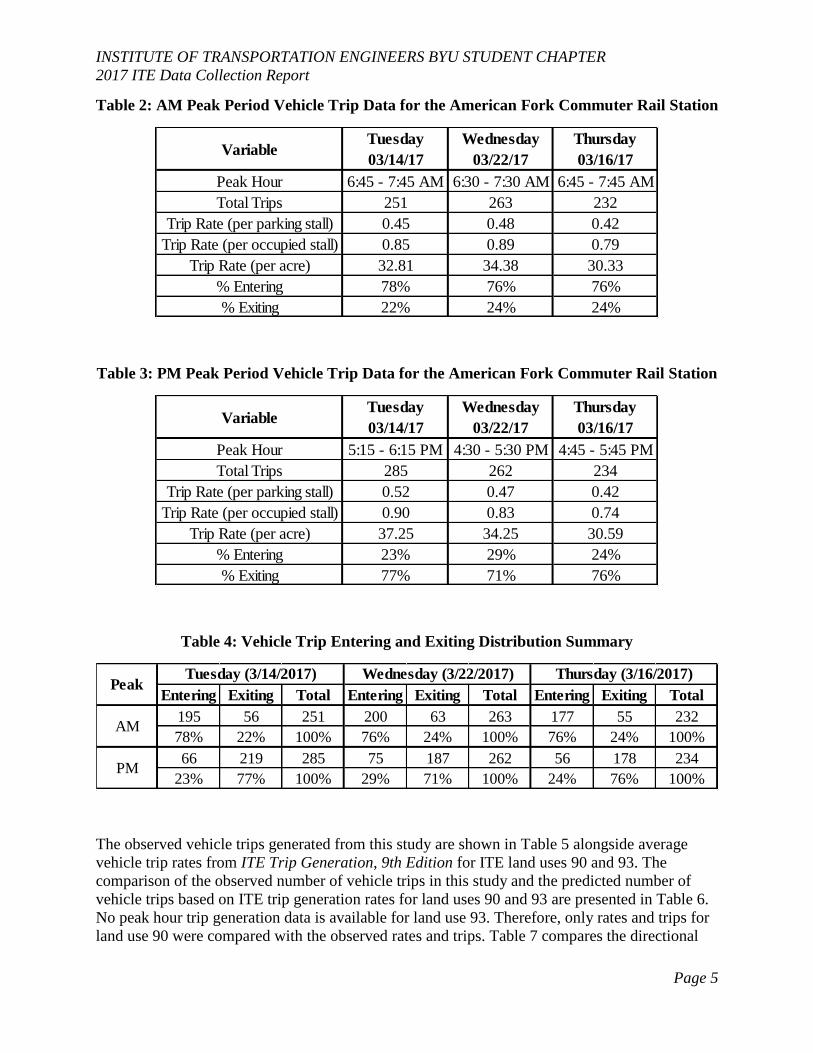
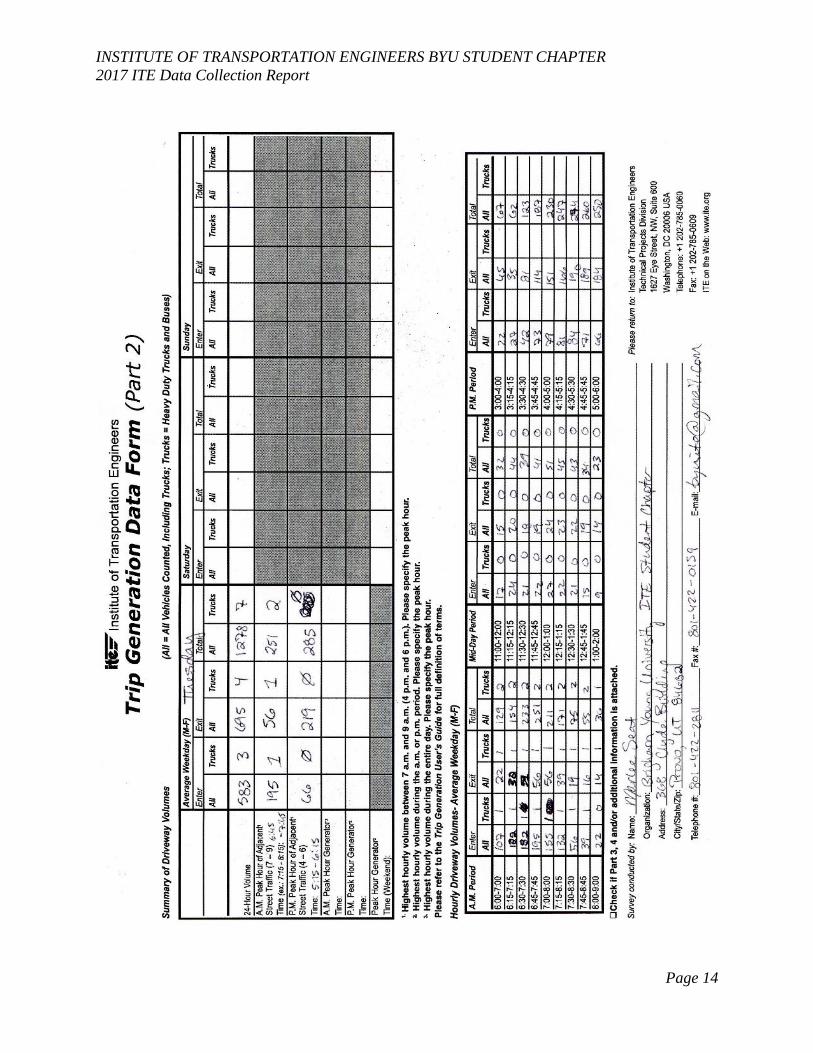
The vehicle trip data for the AM and PM peak periods for each day of data collected are shown
in Table 2 and Table 3, respectively. The vehicle trip rates are calculated per parking stall,
occupied parking stall, and acre. These rates are also calculated using specifically the data
collected during the same day. A summary of trips counted each day of the study along with the
entry/exit distribution is presented in Table 4.
INSTITUTE OF TRANSPORTATION ENGINEERS BYU STUDENT CHAPTER
2017 ITE Data Collection Report
Page 5
Table 2: AM Peak Period Vehicle Trip Data for the American Fork Commuter Rail Station
Table 3: PM Peak Period Vehicle Trip Data for the American Fork Commuter Rail Station
Table 4: Vehicle Trip Entering and Exiting Distribution Summary
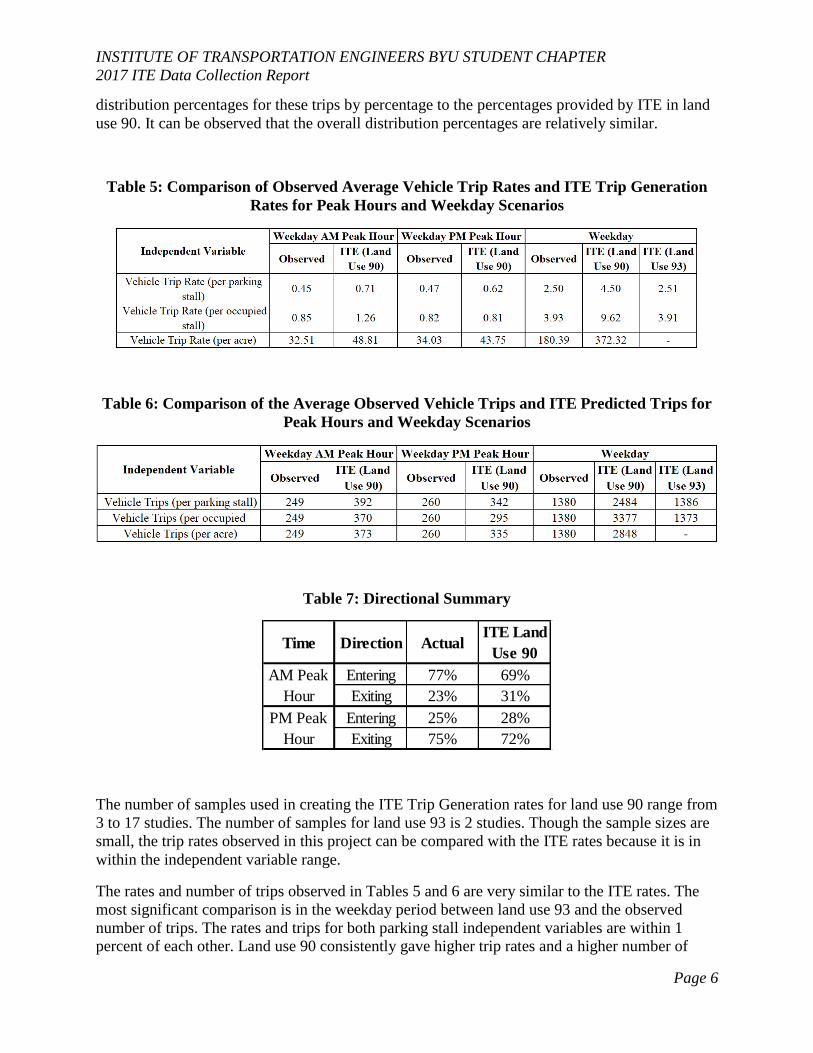
The observed vehicle trips generated from this study are shown in Table 5 alongside average
vehicle trip rates from ITE Trip Generation, 9th Edition for ITE land uses 90 and 93. The
comparison of the observed number of vehicle trips in this study and the predicted number of
vehicle trips based on ITE trip generation rates for land uses 90 and 93 are presented in Table 6.
No peak hour trip generation data is available for land use 93. Therefore, only rates and trips for
land use 90 were compared with the observed rates and trips. Table 7 compares the directional
VariableTuesday
03/14/17
Wednesday
03/22/17
Thursday
03/16/17
Peak Hour 6:45 - 7:45 AM 6:30 - 7:30 AM 6:45 - 7:45 AM
Total Trips 251 263 232
Trip Rate (per parking stall) 0.45 0.48 0.42
Trip Rate (per occupied stall) 0.85 0.89 0.79
Trip Rate (per acre) 32.81 34.38 30.33
% Entering 78% 76% 76%
% Exiting 22% 24% 24%
VariableTuesday
03/14/17
Wednesday
03/22/17
Thursday
03/16/17
Peak Hour 5:15 - 6:15 PM 4:30 - 5:30 PM 4:45 - 5:45 PM
Total Trips 285 262 234
Trip Rate (per parking stall) 0.52 0.47 0.42
Trip Rate (per occupied stall) 0.90 0.83 0.74
Trip Rate (per acre) 37.25 34.25 30.59
% Entering 23% 29% 24%
% Exiting 77% 71% 76%
Entering Exiting Total Entering Exiting Total Entering Exiting Total
195 56 251 200 63 263 177 55 232
78% 22% 100% 76% 24% 100% 76% 24% 100%
66 219 285 75 187 262 56 178 234
23% 77% 100% 29% 71% 100% 24% 76% 100%
Tuesday (3/14/2017) Wednesday (3/22/2017) Thursday (3/16/2017)
AM
PM
Peak
INSTITUTE OF TRANSPORTATION ENGINEERS BYU STUDENT CHAPTER
2017 ITE Data Collection Report
Page 6
distribution percentages for these trips by percentage to the percentages provided by ITE in land
use 90. It can be observed that the overall distribution percentages are relatively similar.
Table 5: Comparison of Observed Average Vehicle Trip Rates and ITE Trip Generation
Rates for Peak Hours and Weekday Scenarios
Table 6: Comparison of the Average Observed Vehicle Trips and ITE Predicted Trips for
Peak Hours and Weekday Scenarios
Table 7: Directional Summary
The number of samples used in creating the ITE Trip Generation rates for land use 90 range from
3 to 17 studies. The number of samples for land use 93 is 2 studies. Though the sample sizes are
small, the trip rates observed in this project can be compared with the ITE rates because it is in
within the independent variable range.
The rates and number of trips observed in Tables 5 and 6 are very similar to the ITE rates. The
most significant comparison is in the weekday period between land use 93 and the observed
number of trips. The rates and trips for both parking stall independent variables are within 1
percent of each other. Land use 90 consistently gave higher trip rates and a higher number of
Time Direction ActualITE Land
Use 90
Entering 77% 69%
Exiting 23% 31%
Entering 25% 28%
Exiting 75% 72%
AM Peak
Hour
PM Peak
Hour
INSTITUTE OF TRANSPORTATION ENGINEERS BYU STUDENT CHAPTER
2017 ITE Data Collection Report
Page 7
trips than what was observed at this site. However, the observed trip rates did fall within the
standard deviation of the trip rates of land use 90. It can be concluded that the American Fork
Commuter Rail Station land use aligns best with ITE land use 93 and is comparable to ITE land
use 90. Detailed trip generation data forms for each day of data can be found in Appendix A.
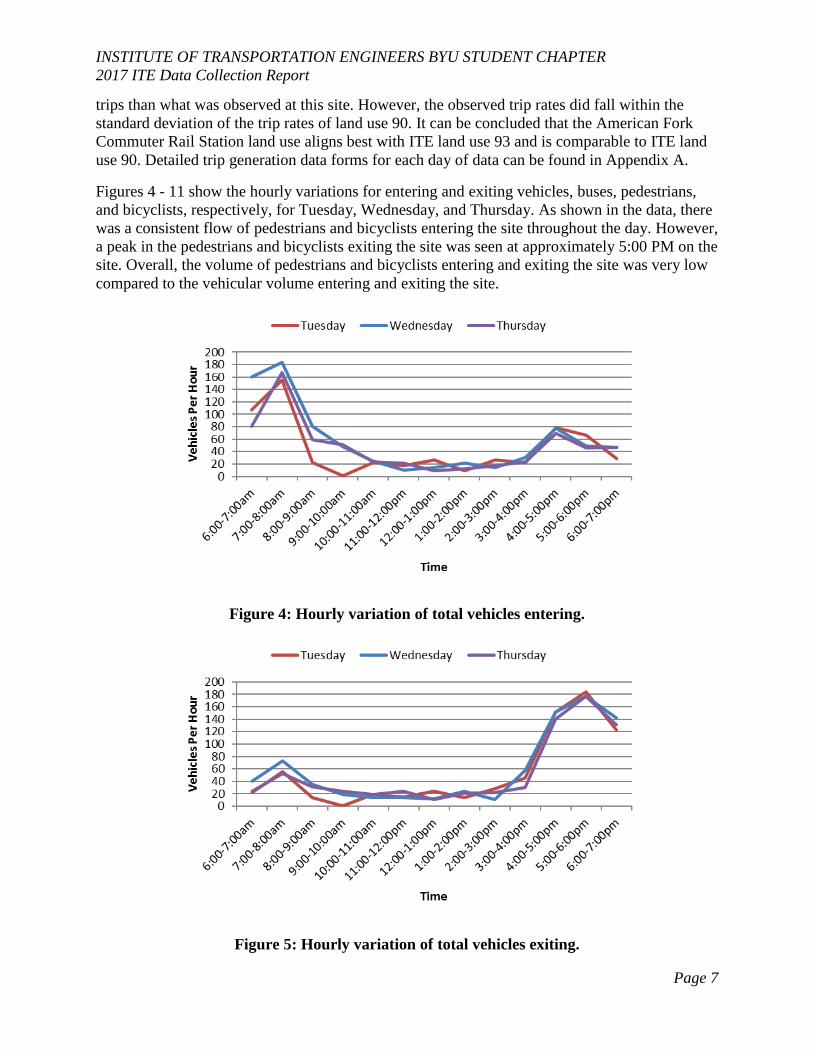
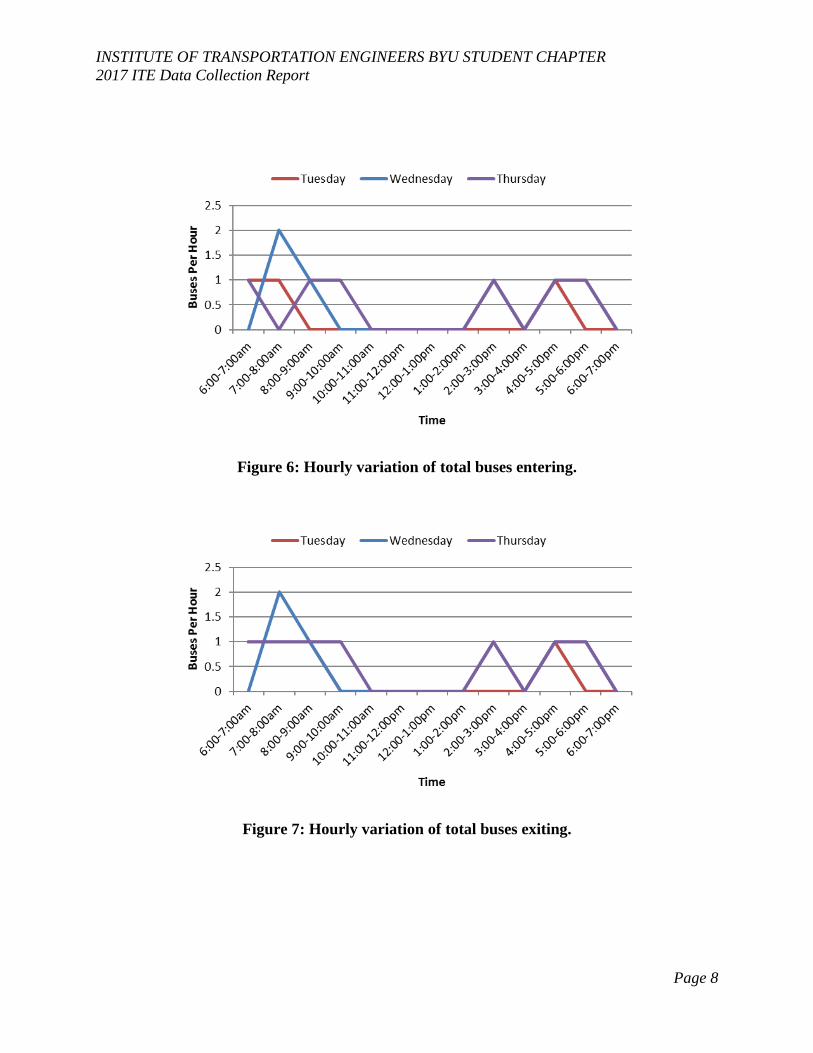
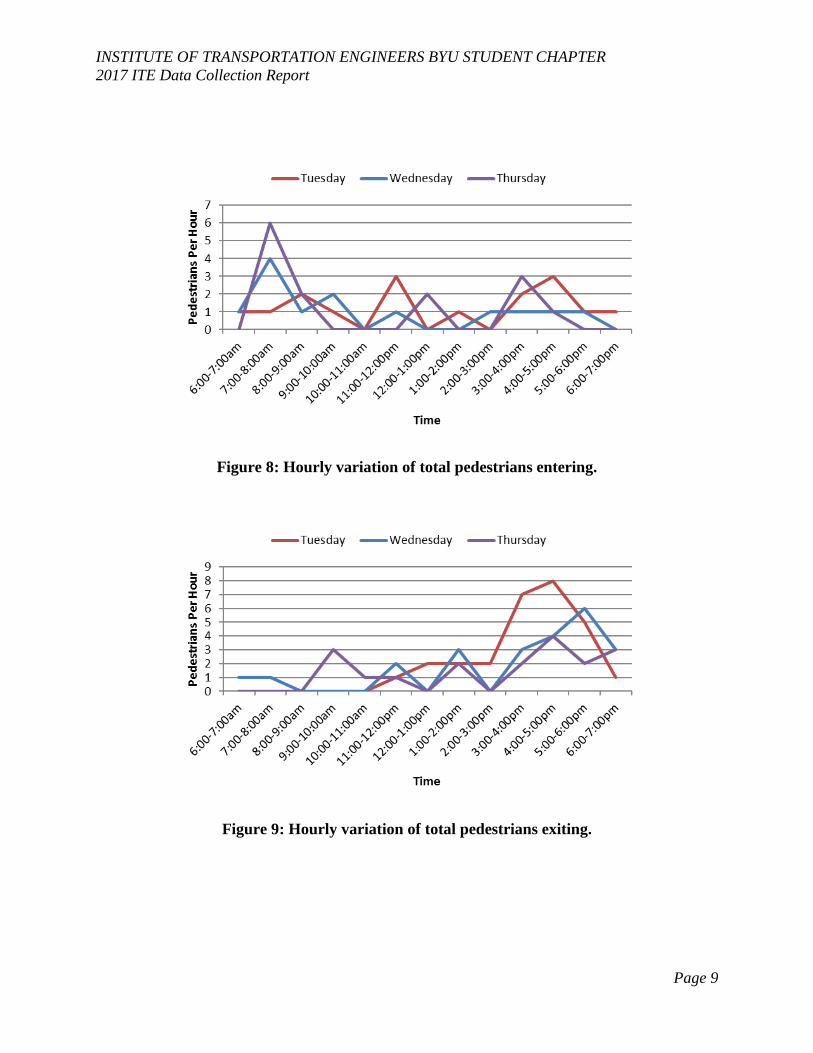
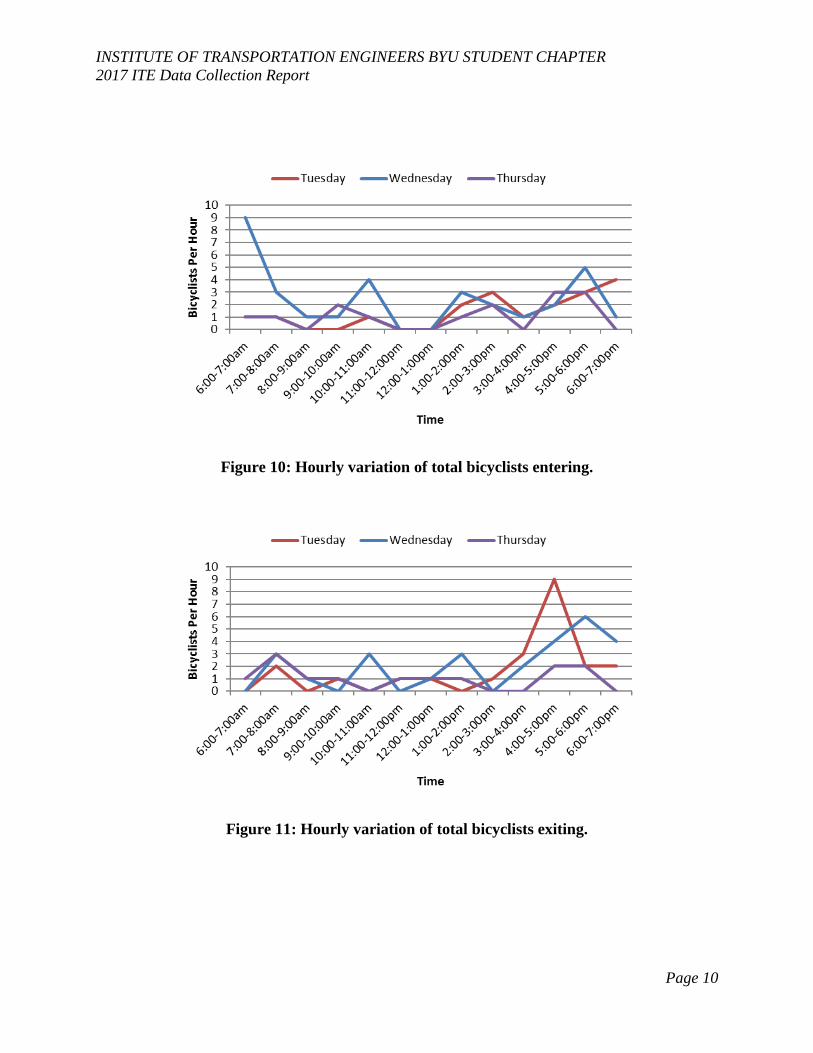
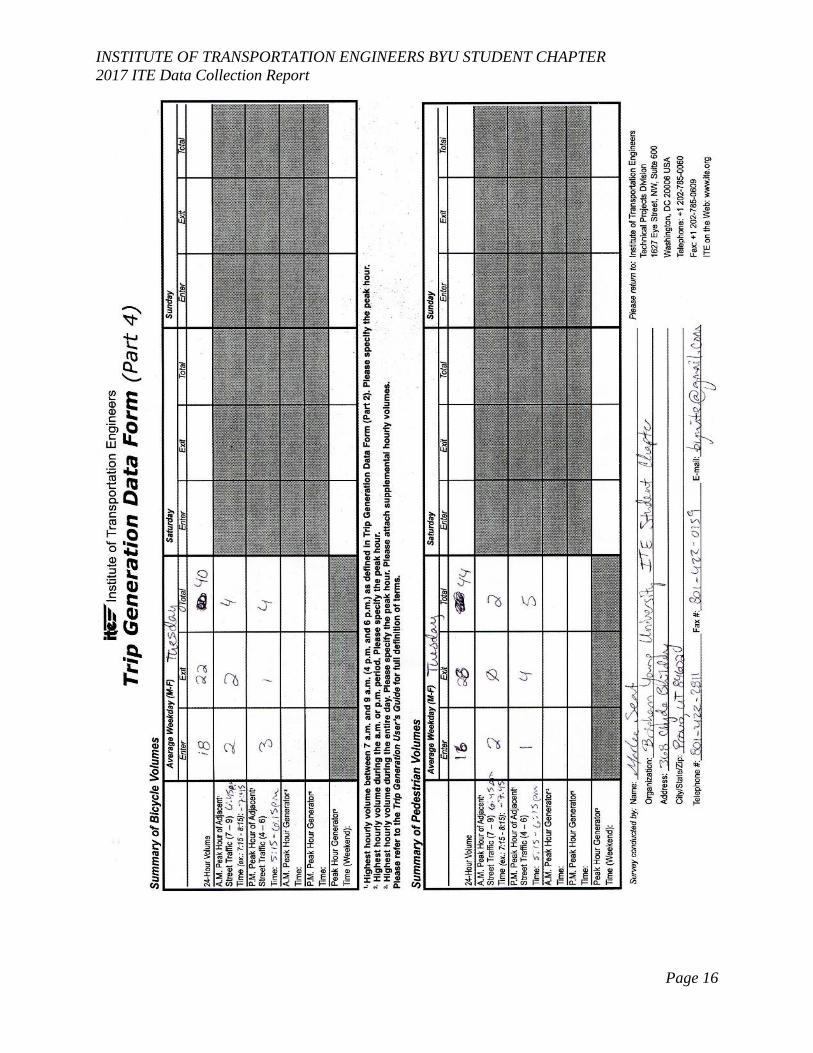
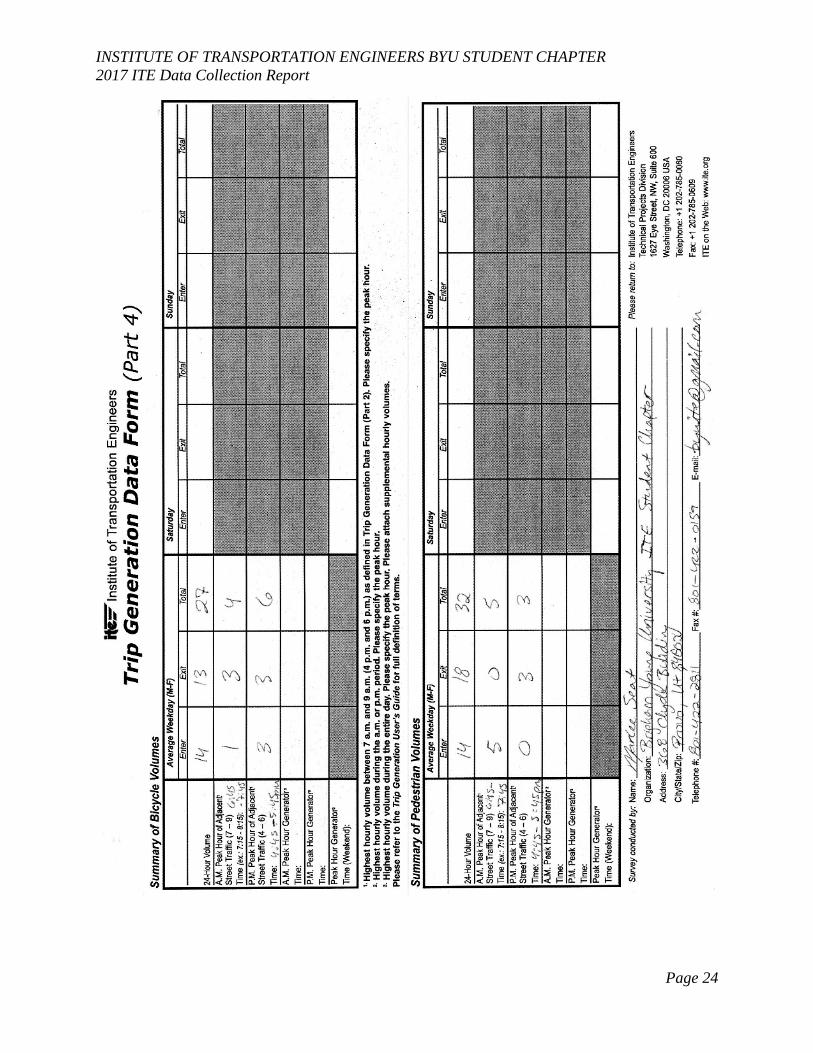
Figures 4 - 11 show the hourly variations for entering and exiting vehicles, buses, pedestrians,
and bicyclists, respectively, for Tuesday, Wednesday, and Thursday. As shown in the data, there
was a consistent flow of pedestrians and bicyclists entering the site throughout the day. However,
a peak in the pedestrians and bicyclists exiting the site was seen at approximately 5:00 PM on the
site. Overall, the volume of pedestrians and bicyclists entering and exiting the site was very low
compared to the vehicular volume entering and exiting the site.
Figure 4: Hourly variation of total vehicles entering.
Figure 5: Hourly variation of total vehicles exiting.
INSTITUTE OF TRANSPORTATION ENGINEERS BYU STUDENT CHAPTER
2017 ITE Data Collection Report
Page 8
Figure 6: Hourly variation of total buses entering.
Figure 7: Hourly variation of total buses exiting.
INSTITUTE OF TRANSPORTATION ENGINEERS BYU STUDENT CHAPTER
2017 ITE Data Collection Report
Page 9
Figure 8: Hourly variation of total pedestrians entering.
Figure 9: Hourly variation of total pedestrians exiting.
INSTITUTE OF TRANSPORTATION ENGINEERS BYU STUDENT CHAPTER
2017 ITE Data Collection Report
Page 10
Figure 10: Hourly variation of total bicyclists entering.
Figure 11: Hourly variation of total bicyclists exiting.
INSTITUTE OF TRANSPORTATION ENGINEERS BYU STUDENT CHAPTER
2017 ITE Data Collection Report
Page 11
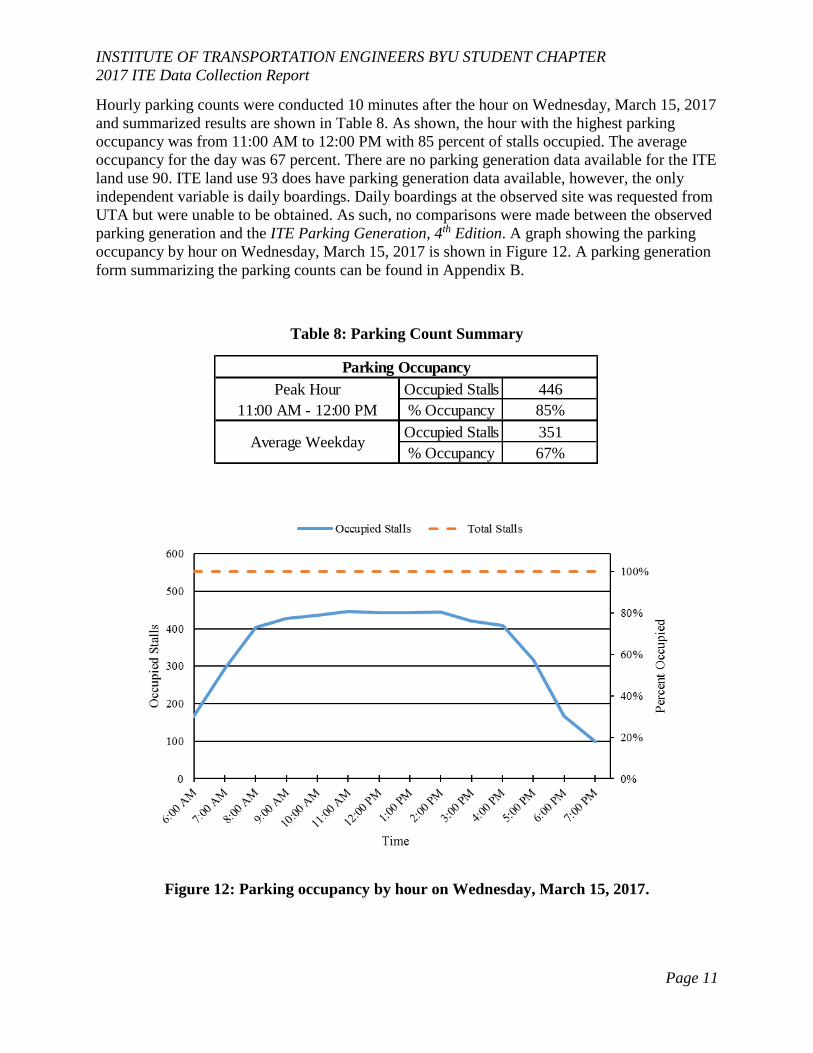
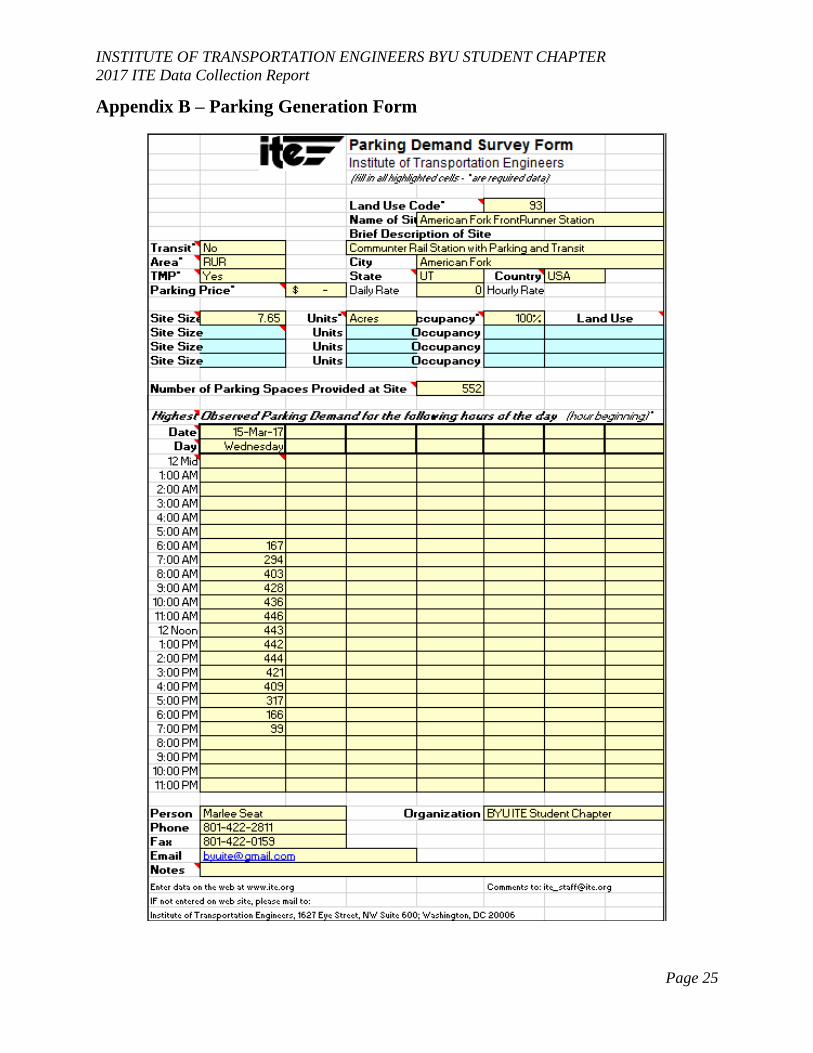
Hourly parking counts were conducted 10 minutes after the hour on Wednesday, March 15, 2017
and summarized results are shown in Table 8. As shown, the hour with the highest parking
occupancy was from 11:00 AM to 12:00 PM with 85 percent of stalls occupied. The average
occupancy for the day was 67 percent. There are no parking generation data available for the ITE
land use 90. ITE land use 93 does have parking generation data available, however, the only
independent variable is daily boardings. Daily boardings at the observed site was requested from
UTA but were unable to be obtained. As such, no comparisons were made between the observed
parking generation and the ITE Parking Generation, 4th Edition. A graph showing the parking
occupancy by hour on Wednesday, March 15, 2017 is shown in Figure 12. A parking generation
form summarizing the parking counts can be found in Appendix B.
Table 8: Parking Count Summary
Figure 12: Parking occupancy by hour on Wednesday, March 15, 2017.
Peak Hour Occupied Stalls 446
11:00 AM - 12:00 PM % Occupancy 85%
Occupied Stalls 351
% Occupancy 67%Average Weekday
Parking Occupancy
INSTITUTE OF TRANSPORTATION ENGINEERS BYU STUDENT CHAPTER
2017 ITE Data Collection Report
Page 12
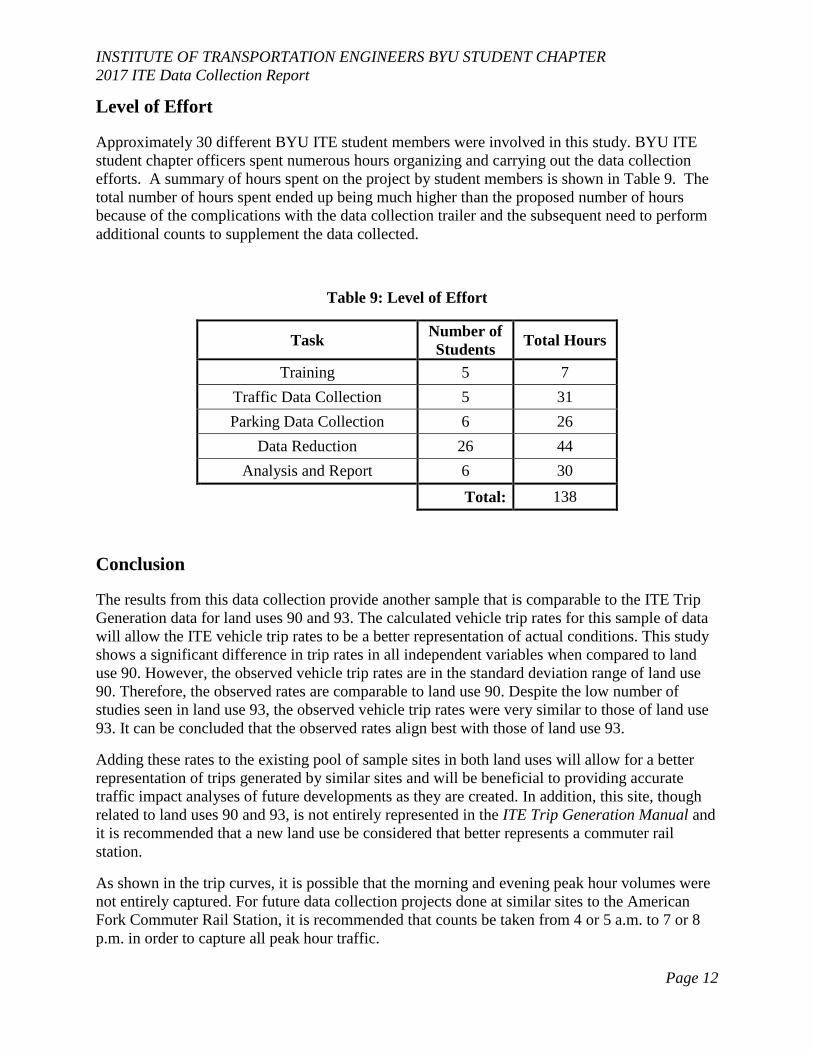
Level of Effort
Approximately 30 different BYU ITE student members were involved in this study. BYU ITE
student chapter officers spent numerous hours organizing and carrying out the data collection
efforts. A summary of hours spent on the project by student members is shown in Table 9. The
total number of hours spent ended up being much higher than the proposed number of hours
because of the complications with the data collection trailer and the subsequent need to perform
additional counts to supplement the data collected.
Table 9: Level of Effort
Task Number of
Students Total Hours
Training 5 7
Traffic Data Collection 5 31
Parking Data Collection 6 26
Data Reduction 26 44
Analysis and Report 6 30
Total: 138
Conclusion
The results from this data collection provide another sample that is comparable to the ITE Trip
Generation data for land uses 90 and 93. The calculated vehicle trip rates for this sample of data
will allow the ITE vehicle trip rates to be a better representation of actual conditions. This study
shows a significant difference in trip rates in all independent variables when compared to land
use 90. However, the observed vehicle trip rates are in the standard deviation range of land use
90. Therefore, the observed rates are comparable to land use 90. Despite the low number of
studies seen in land use 93, the observed vehicle trip rates were very similar to those of land use
93. It can be concluded that the observed rates align best with those of land use 93.
Adding these rates to the existing pool of sample sites in both land uses will allow for a better
representation of trips generated by similar sites and will be beneficial to providing accurate
traffic impact analyses of future developments as they are created. In addition, this site, though
related to land uses 90 and 93, is not entirely represented in the ITE Trip Generation Manual and
it is recommended that a new land use be considered that better represents a commuter rail
station.
As shown in the trip curves, it is possible that the morning and evening peak hour volumes were
not entirely captured. For future data collection projects done at similar sites to the American
Fork Commuter Rail Station, it is recommended that counts be taken from 4 or 5 a.m. to 7 or 8
p.m. in order to capture all peak hour traffic.
INSTITUTE OF TRANSPORTATION ENGINEERS BYU STUDENT CHAPTER
2017 ITE Data Collection Report
Page 13
Appendix A – Trip Generation Forms
INSTITUTE OF TRANSPORTATION ENGINEERS BYU STUDENT CHAPTER
2017 ITE Data Collection Report
Page 14
INSTITUTE OF TRANSPORTATION ENGINEERS BYU STUDENT CHAPTER
2017 ITE Data Collection Report
Page 15
INSTITUTE OF TRANSPORTATION ENGINEERS BYU STUDENT CHAPTER
2017 ITE Data Collection Report
Page 16
INSTITUTE OF TRANSPORTATION ENGINEERS BYU STUDENT CHAPTER
2017 ITE Data Collection Report
Page 17
INSTITUTE OF TRANSPORTATION ENGINEERS BYU STUDENT CHAPTER
2017 ITE Data Collection Report
Page 18
INSTITUTE OF TRANSPORTATION ENGINEERS BYU STUDENT CHAPTER
2017 ITE Data Collection Report
Page 19
INSTITUTE OF TRANSPORTATION ENGINEERS BYU STUDENT CHAPTER
2017 ITE Data Collection Report
Page 20

INSTITUTE OF TRANSPORTATION ENGINEERS BYU STUDENT CHAPTER
2017 ITE Data Collection Report
Page 21
INSTITUTE OF TRANSPORTATION ENGINEERS BYU STUDENT CHAPTER
2017 ITE Data Collection Report
Page 22
INSTITUTE OF TRANSPORTATION ENGINEERS BYU STUDENT CHAPTER
2017 ITE Data Collection Report
Page 23
INSTITUTE OF TRANSPORTATION ENGINEERS BYU STUDENT CHAPTER
2017 ITE Data Collection Report
Page 24
INSTITUTE OF TRANSPORTATION ENGINEERS BYU STUDENT CHAPTER
2017 ITE Data Collection Report
Page 25
Appendix B – Parking Generation Form