
Trillion dollar growth trends to 2020
44
THE GREAT EIGHT Trillion-Dollar Growth Trends to 2020
-
Upload
madhavan-maddy -
Category
Economy & Finance
-
view
56 -
download
0
Transcript of Trillion dollar growth trends to 2020
THE GREAT EIGHTTrillion-Dollar Growth Trends to 2020

Copyright © 2011 Bain & Company, Inc. All rights reserved.Content: Global EditorialLayout: Global Design
The Great Eight | Bain & Company, Inc.
Page 1
Contents
Introduction .......................................................................................pg. 3
1. The next billion consumers ...................................................................pg. 8
2. Old infrastructure, new investments ....................................................pg. 12
3. Militarization following industrialization ..............................................pg. 16
4. Growing output of primary inputs ......................................................pg. 20
5. Developing human capital .................................................................pg. 24
6. Keeping the wealthy healthy ..............................................................pg. 28
7. Everything the same, but nicer ...........................................................pg. 32
8. Prepping for the next big thing ...........................................................pg. 36

The Great Eight | Bain & Company, Inc.
Page 2
The Great Eight | Bain & Company, Inc.
Page 3
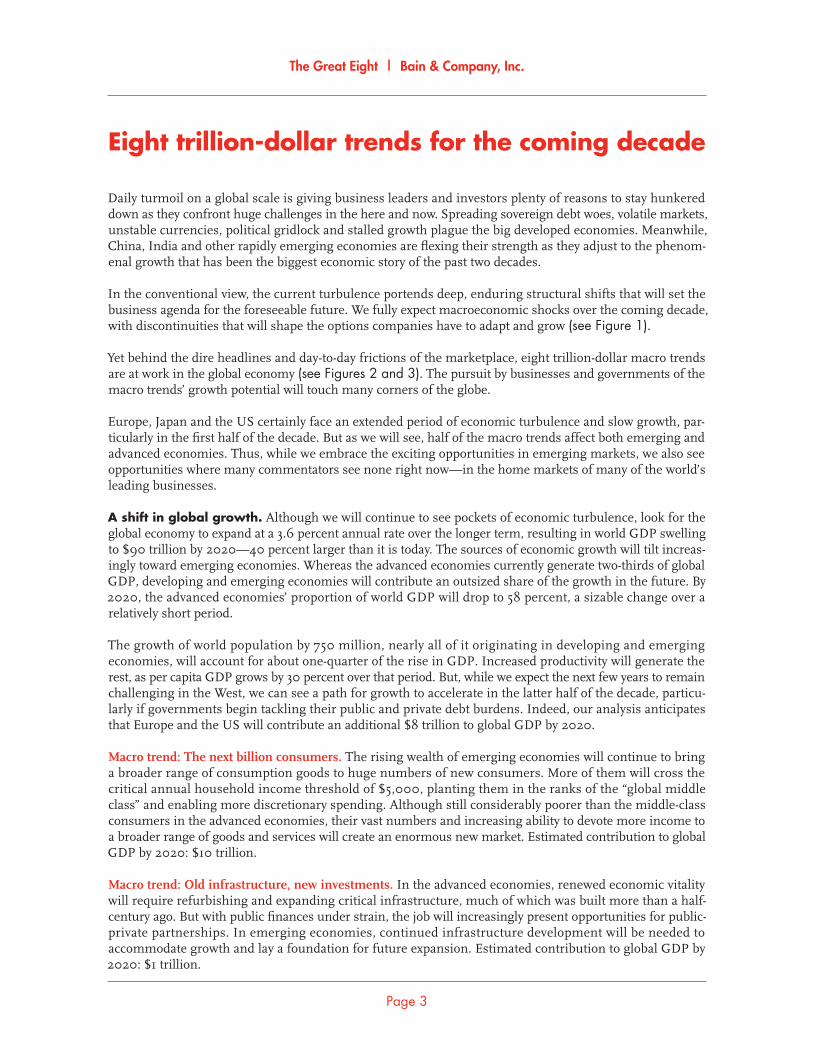
Eight trillion-dollar trends for the coming decade
Daily turmoil on a global scale is giving business leaders and investors plenty of reasons to stay hunkered
down as they confront huge challenges in the here and now. Spreading sovereign debt woes, volatile markets,
unstable currencies, political gridlock and stalled growth plague the big developed economies. Meanwhile,
China, India and other rapidly emerging economies are fl exing their strength as they adjust to the phenom-
enal growth that has been the biggest economic story of the past two decades.
In the conventional view, the current turbulence portends deep, enduring structural shifts that will set the
business agenda for the foreseeable future. We fully expect macroeconomic shocks over the coming decade,
with discontinuities that will shape the options companies have to adapt and grow (see Figure 1).
Yet behind the dire headlines and day-to-day frictions of the marketplace, eight trillion-dollar macro trends
are at work in the global economy (see Figures 2 and 3). The pursuit by businesses and governments of the
macro trends’ growth potential will touch many corners of the globe.
Europe, Japan and the US certainly face an extended period of economic turbulence and slow growth, par-
ticularly in the fi rst half of the decade. But as we will see, half of the macro trends affect both emerging and
advanced economies. Thus, while we embrace the exciting opportunities in emerging markets, we also see
opportunities where many commentators see none right now—in the home markets of many of the world’s
leading businesses.
A shift in global growth. Although we will continue to see pockets of economic turbulence, look for the
global economy to expand at a 3.6 percent annual rate over the longer term, resulting in world GDP swelling
to $90 trillion by 2020—40 percent larger than it is today. The sources of economic growth will tilt increas-
ingly toward emerging economies. Whereas the advanced economies currently generate two-thirds of global
GDP, developing and emerging economies will contribute an outsized share of the growth in the future. By
2020, the advanced economies’ proportion of world GDP will drop to 58 percent, a sizable change over a
relatively short period.
The growth of world population by 750 million, nearly all of it originating in developing and emerging
economies, will account for about one-quarter of the rise in GDP. Increased productivity will generate the
rest, as per capita GDP grows by 30 percent over that period. But, while we expect the next few years to remain
challenging in the West, we can see a path for growth to accelerate in the latter half of the decade, particu-
larly if governments begin tackling their public and private debt burdens. Indeed, our analysis anticipates
that Europe and the US will contribute an additional $8 trillion to global GDP by 2020.
Macro trend: The next billion consumers. The rising wealth of emerging economies will continue to bring
a broader range of consumption goods to huge numbers of new consumers. More of them will cross the
critical annual household income threshold of $5,000, planting them in the ranks of the “global middle
class” and enabling more discretionary spending. Although still considerably poorer than the middle-class
consumers in the advanced economies, their vast numbers and increasing ability to devote more income to
a broader range of goods and services will create an enormous new market. Estimated contribution to global
GDP by 2020: $10 trillion.
Macro trend: Old infrastructure, new investments. In the advanced economies, renewed economic vitality
will require refurbishing and expanding critical infrastructure, much of which was built more than a half-
century ago. But with public fi nances under strain, the job will increasingly present opportunities for public-
private partnerships. In emerging economies, continued infrastructure development will be needed to
accommodate growth and lay a foundation for future expansion. Estimated contribution to global GDP by
2020: $1 trillion.
The Great Eight | Bain & Company, Inc.
Page 4
Intensifying competition for fi nite resources. Population growth, increased manufacturing activity,
urbanization and expanding prosperity will set off a scramble for basic goods, particularly food, water, energy
and industrial commodities. Competition from emerging economies for the same access to raw materials
currently dominated by the advanced economies will likely fuel geopolitical instability, as more nations seek
to secure and defend vital supply lines. Businesses should continue to invest in scenario planning to prepare
for shocks and maintain fl exibility in their business models.
Macro trend: Militarization following industrialization. As economic power tilts toward Asia, political and
military power will shift as well. In China, where defense spending has trended upward in recent years, both
in dollar terms and as a proportion of GDP, military outlays reached some $160 billion in 2010—a 6.7 percent
increase over the previous year, according to the latest available data. The stepped up spending is prompting
China’s neighbors to respond with bigger defense budgets, increasing the risk of confl ict over shipping lanes
in the Indian Ocean and the South China Sea. The military buildups will present near-term opportunities
for arms sales for US and European producers until the purchasing countries can ramp up domestic arma-
ments production. Meanwhile, both nations and businesses are increasing spending on countermeasures to
meet the ongoing risk of terrorism by non-state actors, insurgent threats in war zones, and the new chal-
lenges of cyber and electronic warfare. Estimated contribution to global GDP by 2020: $1 trillion.
Macro trend: Growing output of primary inputs. Growing demand among more nations for oil and natural
gas, grains and proteins, fresh water and extracted ores, such as copper, aluminum and rare earth metals,
will create price volatility and transient shortages of a few of these commodities over the coming decade.
Volatility and commodity price infl ation will intensify as these key inputs are increasingly linked by new uses
and as demand rises. For example, corn is now a major source of ethanol for transportation as well as a
food crop. More water is diverted for use in the extraction of ores and fuel. Ores are fi nding their way into
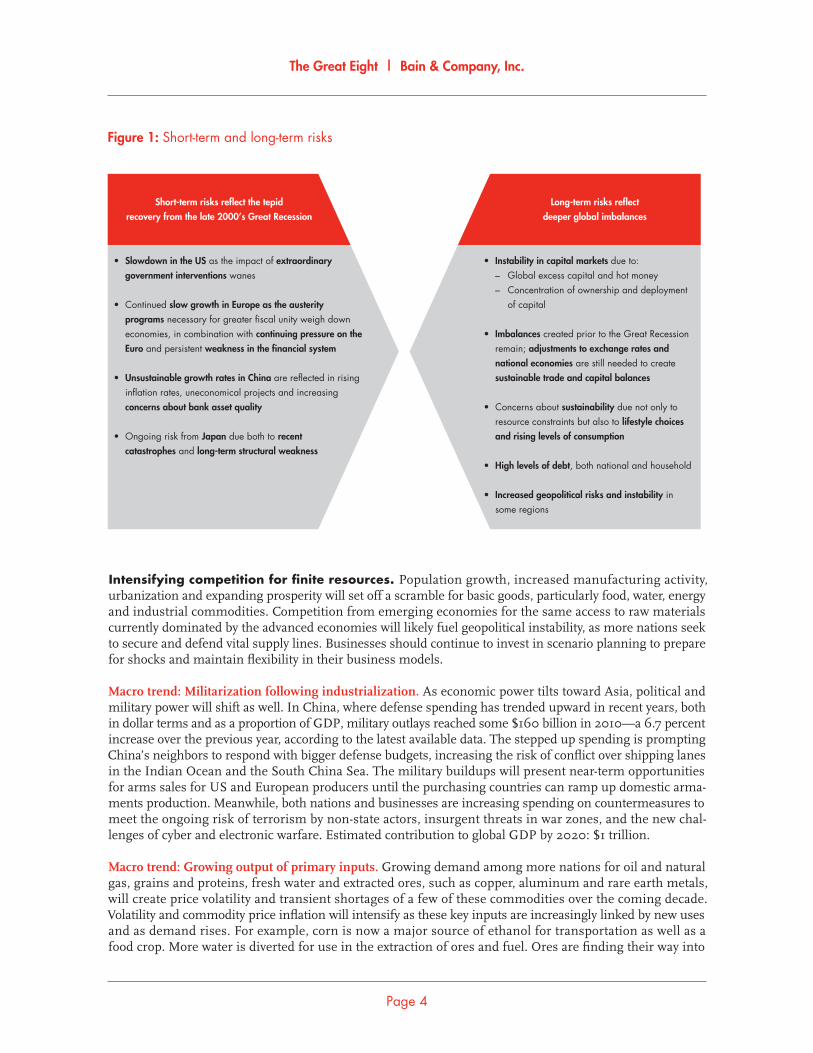
Figure 1: Short-term and long-term risks
• Slowdown in the US as the impact of extraordinary government interventions wanes
• Continued slow growth in Europe as the austerity programs necessary for greater fiscal unity weigh down economies, in combination with continuing pressure on the Euro and persistent weakness in the financial system
• Unsustainable growth rates in China are reflected in rising inflation rates, uneconomical projects and increasing concerns about bank asset quality
• Ongoing risk from Japan due both to recent catastrophes and long�term structural weakness
• Instability in capital markets due to: – Global excess capital and hot money – Concentration of ownership and deployment of capital
• Imbalances created prior to the Great Recession remain; adjustments to exchange rates and national economies are still needed to create sustainable trade and capital balances
• Concerns about sustainability due not only to resource constraints but also to lifestyle choices and rising levels of consumption
• High levels of debt, both national and household
• Increased geopolitical risks and instability in some regions
Short�term risks reflect the tepidrecovery from the late 2000’s Great Recession
Long�term risks reflectdeeper global imbalances
The Great Eight | Bain & Company, Inc.
Page 5
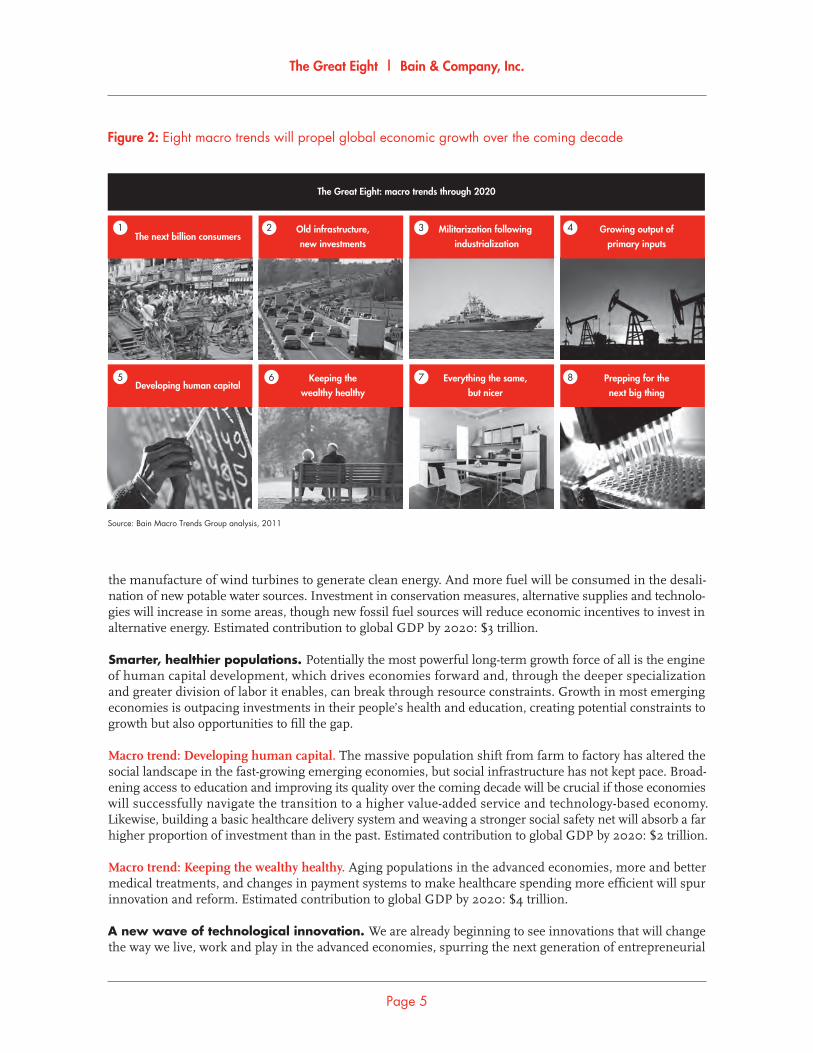
Figure 2: Eight macro trends will propel global economic growth over the coming decade
Developing human capitalKeeping the
wealthy healthyEverything the same,
but nicerPrepping for thenext big thing
Source: Bain Macro Trends Group analysis, 2011
The Great Eight: macro trends through 2020
1 2 3 4
5 6 7 8
The next billion consumersOld infrastructure,new investments
Militarization following industrialization
Growing output ofprimary inputs
the manufacture of wind turbines to generate clean energy. And more fuel will be consumed in the desali-
nation of new potable water sources. Investment in conservation measures, alternative supplies and technolo-
gies will increase in some areas, though new fossil fuel sources will reduce economic incentives to invest in
alternative energy. Estimated contribution to global GDP by 2020: $3 trillion.
Smarter, healthier populations. Potentially the most powerful long-term growth force of all is the engine
of human capital development, which drives economies forward and, through the deeper specialization
and greater division of labor it enables, can break through resource constraints. Growth in most emerging
economies is outpacing investments in their people’s health and education, creating potential constraints to
growth but also opportunities to fi ll the gap.
Macro trend: Developing human capital. The massive population shift from farm to factory has altered the
social landscape in the fast-growing emerging economies, but social infrastructure has not kept pace. Broad-
ening access to education and improving its quality over the coming decade will be crucial if those economies
will successfully navigate the transition to a higher value-added service and technology-based economy.
Likewise, building a basic healthcare delivery system and weaving a stronger social safety net will absorb a far
higher proportion of investment than in the past. Estimated contribution to global GDP by 2020: $2 trillion.
Macro trend: Keeping the wealthy healthy. Aging populations in the advanced economies, more and better
medical treatments, and changes in payment systems to make healthcare spending more effi cient will spur
innovation and reform. Estimated contribution to global GDP by 2020: $4 trillion.
A new wave of technological innovation. We are already beginning to see innovations that will change
the way we live, work and play in the advanced economies, spurring the next generation of entrepreneurial
The Great Eight | Bain & Company, Inc.
Page 6
start-ups to bring novel products and services to market. Technologies like 3D printers will begin to unleash
breakthroughs in manufacturing, enabling smaller batches of highly customized products at declining price
points. Ongoing network and communications improvements will create the “no-collar” location-free worker,
a technology-enabled change that will create interesting options for retaining elderly workers, for example.
Juiced by such innovations, today’s slow-growth advanced economies could accelerate onto a new growth
trajectory in the coming decade, tracing an upward sweeping “S-curve” from its current plateau.
Macro trend: Everything the same, but nicer. Innovation will increasingly come in new forms beyond novel
technologies like iPads and Twitter. Look for businesses to invest more heavily in “soft innovations,” which
will offer affl uent customers premium products and services as substitutes for common consumer purchases,
better products commanding higher prices and a greater variety of niche products. Soft innovations will
change our basic habits, from the way we drink coffee (think mochaccinos rather than drip brew) to the way
we buy clothes (with matching outfi ts delivered to our doorstep rather than shopped for piecemeal in stores).
Innovators will create businesses based on these insights. Estimated contribution to global GDP by 2020:
$5 trillion.
Macro trend: Prepping for the next big thing. Innovations tend to cluster in waves, and fi ve potential platform
technologies—nanotechnology, genomics, artifi cial intelligence, robotics and ubiquitous connectivity—
show promise of fl owering over the coming decade. In many cases, developments across technologies will
be mutually reinforcing. For example, advances in nanotechnology will enable the enhanced computational
power necessary for breakthroughs in artifi cial intelligence. Nanotechnology will also spawn new technologies
for manipulating DNA, which will accelerate advancements in genomics. As technologies move from re-
search concepts and prototypes to fi nd applications in affordable consumer goods and industrial processes,
mainly toward the end of the decade, they will generate step-change efficiency improvements that will
accelerate growth. Estimated contribution to global GDP by 2020: $1 trillion.
As businesses ponder how best to position themselves to profi t from the Great Eight macro trends, they will
need to be mindful of these implications:
• The next billion consumers are not “another billion.” They are and will remain different than
consumers in advanced markets, with median yearly household incomes remaining well under $20,000
throughout this decade. This market now holds the potential for large volume sales at lower price points
and an important window of opportunity to infl uence the tastes of those transitioning into the middle
class over the coming years. But emerging market consumers will seek a different basket of goods than
those purchased by shoppers in advanced markets, due to their lower incomes. To target the new con-
sumers effectively, multinational companies will need a different cost structure. They should also expect
price points to remain at a lower level rather than assuming that buyers will migrate up the price ladder
across all product categories.
• Don’t give up on the West. Even as rapidly as their economies are expanding, China and India together
will contribute little more than one-quarter of the next decade’s forecasted $14 trillion growth in con-
sumption. The US and other advanced economies will account for $6 trillion, or more than 40 percent
of the total, and will continue to contain the majority of the global upper middle class. Their aging
populations represent new challenges, not a petering out of opportunities. Not only will the advanced
economies be a source of substantial growth, they may well be on the cusp of acceleration into a new
“S-curve” after slowing down at the top of the last one.
• “Soft innovation” will reap profi ts. The coming decade will reward creative businesses that inno-
vate by tweaking existing products and services into premium offerings. The possibilities of such soft
innovations are as big as marketers’ imaginations—covering everything from food and housewares to
transportation and entertainment. They show up in retailing concepts like fast fashion and fast food.
They are appearing in recreation, leisure and personal services—even in public utilities where deregu-
The Great Eight | Bain & Company, Inc.
Page 7
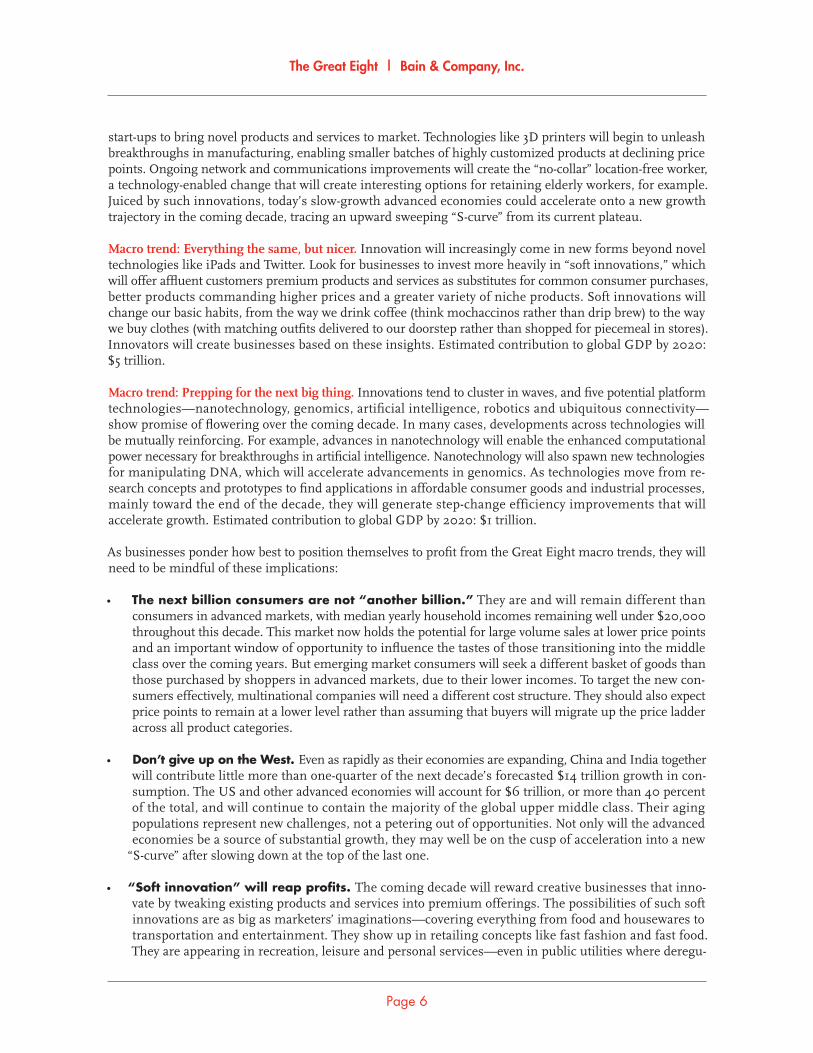
Figure 3: We estimate that each of the eight will increase global GDP by at least $1 trillion, but just two account for half the expected growth
Note: All numbers rounded up to the nearest $1TSources: IMF; Euromonitor; Stockholm International Peace Research Institute Yearbook 2010; WSJ; UN; EIA; IEA; Datamonitor; Lit searches; World Bank; EIU;Bain Macro Trends Group analysis, 2011
1 2 3 4 5 6 7 8 Total
Advancedeconomiesadjustingto age
Developingeconomiescatching up
Estimated contribution of the Great Eight macro trends to increasereal (run rate) global GDP between 2010 and 2020 (forecast)
Nextbillion
consumers
Develophumancapital
Militaritizationfollowing
industrialization
Growing output ofprimaryinputs
Keepingthe wealthy
healthy
Old infra�structure, newinvestments
Everythingthe same,but nicer
Prepping forthe nextbig thing
0
10
20
$30T
10.01.0
1.0
3.02.0
4.0
5.01.0
$11T
$16T
27.0
lation is opening opportunities for companies to differentiate their services on grounds other than price.
Soft innovations are potent because they intersect with, and are enabled by, hard innovations like mobile
devices and social networking. They amplify consumption by adding premium features that create new
experiences customers are willing to pay for. Nearly every company will need to invest in soft innova-
tions and the marketing, customer service and other soft skills that create them. If they do not, they will
be left behind by their competitors who do.
• The “war for talent” will intensify. Population aging in the West and continuing economic advance-
ment in China and India will result in a shortage of management talent that will be felt worldwide.
Companies in advanced and emerging economies alike will share an increasingly mobile white-collar
labor pool. Companies will also be vying for talent against the entrepreneurial opportunities that will be
available to the cohort of young, well-educated workers. To remain globally competitive, companies will
need to attract, develop and retain world-class talent. Part of the solution will be to make better use of
the experience and skills of older workers and retirees, possibly leveraging technology that will make it
easier for them to work on their own terms. Likewise, companies will need to develop fl exible work
models that will enable the growing proportion of women—and their signifi cant others—in the skilled
and managerial workforce, to balance career and family. Hiring, training and retaining skilled managers
will become a more prominent point of competitive advantage.
Businesses will need to devote signifi cant energy to managing through the economy’s current bumps, which
may get even worse over the next few years. But as they maneuver through more near-term turbulence,
they will also want to begin marshalling resources and positioning themselves to capitalize on these longer-
term macro trends.

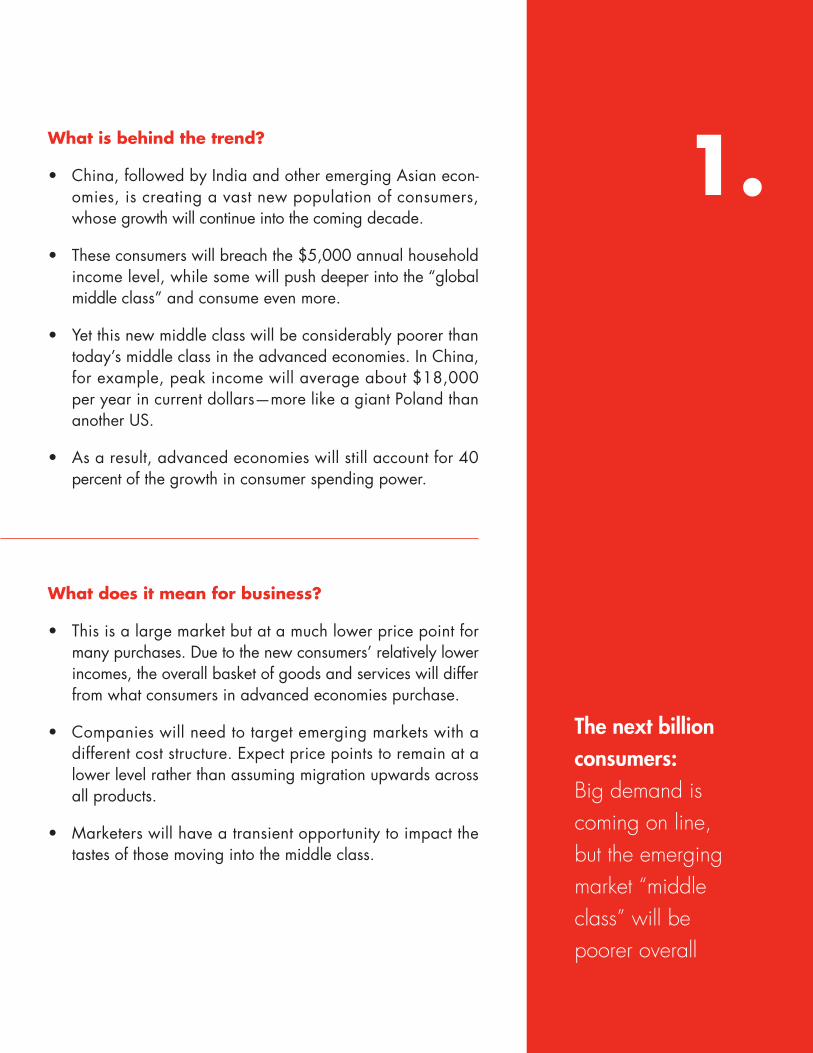
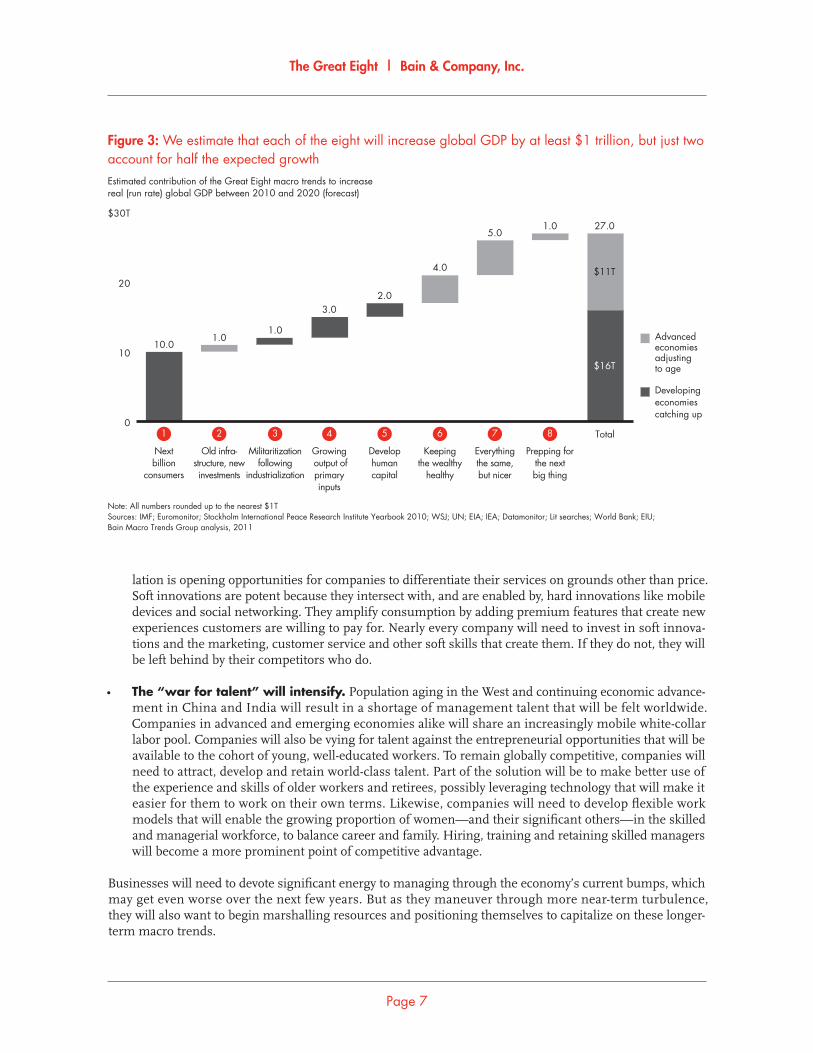
1.
The next billionconsumers:Big demand is coming on line,but the emergingmarket “middleclass” will bepoorer overall
What is behind the trend?
• China, followed by India and other emerging Asian econ-omies, is creating a vast new population of consumers, whose growth will continue into the coming decade.
• These consumers will breach the $5,000 annual household income level, while some will push deeper into the “global middle class” and consume even more.
• Yet this new middle class will be considerably poorer than today’s middle class in the advanced economies. In China, for example, peak income will average about $18,000 per year in current dollars—more like a giant Poland than another US.
• As a result, advanced economies will still account for 40 percent of the growth in consumer spending power.
What does it mean for business?
• This is a large market but at a much lower price point for many purchases. Due to the new consumers’ relatively lower incomes, the overall basket of goods and services will differ from what consumers in advanced economies purchase.
• Companies will need to target emerging markets with a different cost structure. Expect price points to remain at a lower level rather than assuming migration upwards across all products.
• Marketers will have a transient opportunity to impact the tastes of those moving into the middle class.
The Great Eight | Bain & Company, Inc.
Page 10
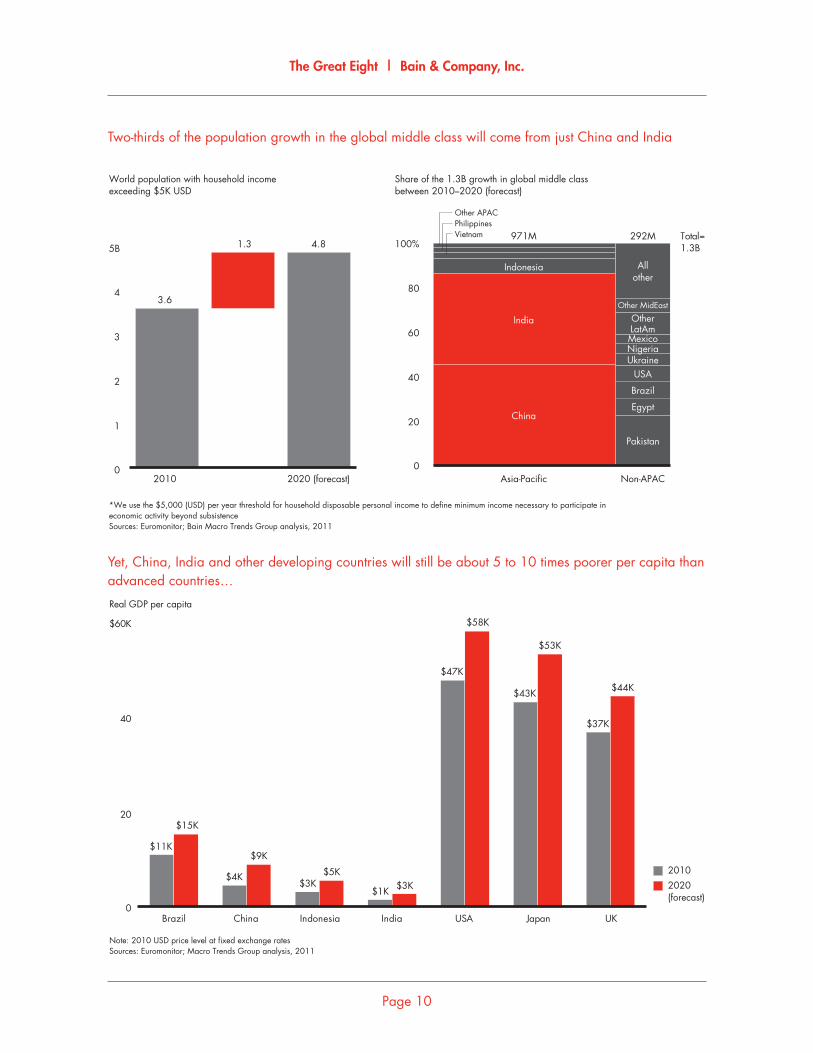
Two-thirds of the population growth in the global middle class will come from just China and India
*We use the $5,000 (USD) per year threshold for household disposable personal income to define minimum income necessary to participate ineconomic activity beyond subsistenceSources: Euromonitor; Bain Macro Trends Group analysis, 2011
World population with household incomeexceeding $5K USD
Share of the 1.3B growth in global middle classbetween 2010–2020 (forecast)
0
1
2
3
4
5B
2010
3.6
1.3
2020 (forecast)
4.8
0
20
40
60
80
100%
Asia�Pacific
Indonesia
India
China
Other APACPhilippinesVietnam 971M
Non�APAC
USAUkraine
Brazil
Pakistan
Egypt
Other MidEast
Allother
OtherLatAm
NigeriaMexico
292M Total=1.3B
Yet, China, India and other developing countries will still be about 5 to 10 times poorer per capita than advanced countries…
Note: 2010 USD price level at fixed exchange ratesSources: Euromonitor; Macro Trends Group analysis, 2011
20102020(forecast)
Real GDP per capita
0
20
40
$60K
Brazil
$15K
China
$4K
$9K
Indonesia
$3K$5K
India
$1K $3K
USA
$58K
Japan
$53K
UK
$44K
$11K
$47K
$43K
$37K
The Great Eight | Bain & Company, Inc.
Page 11
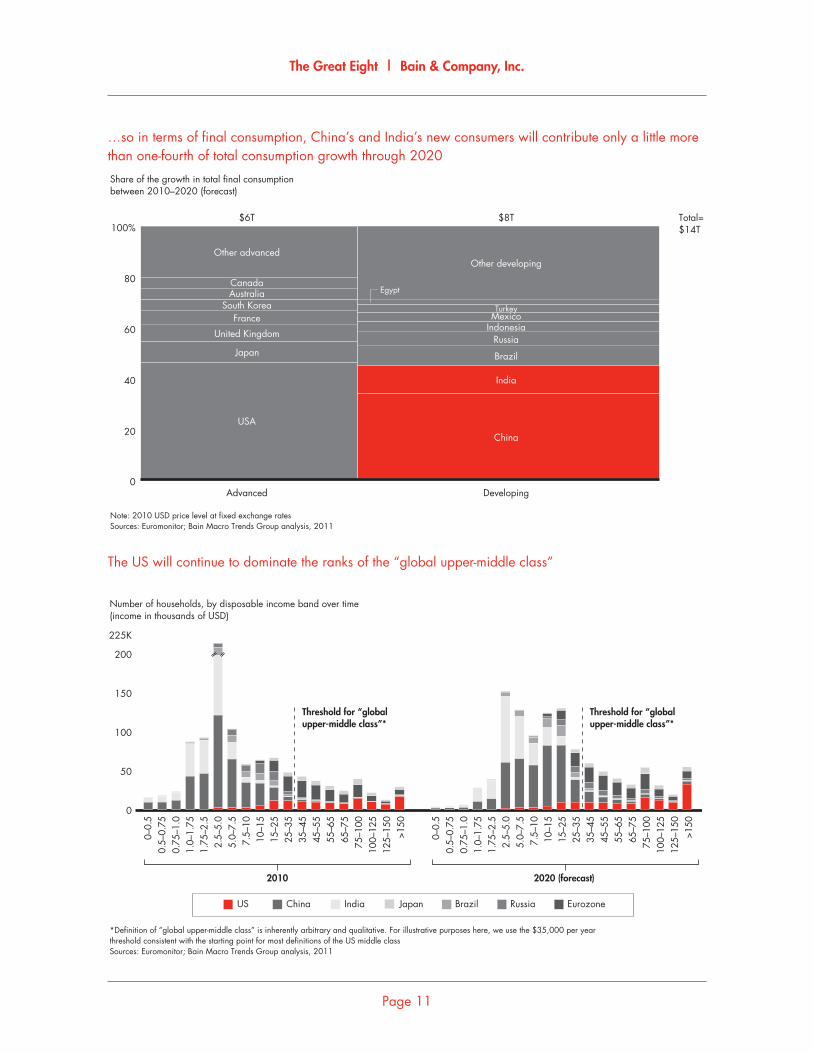
…so in terms of fi nal consumption, China’s and India’s new consumers will contribute only a little more than one-fourth of total consumption growth through 2020
Note: 2010 USD price level at fixed exchange ratesSources: Euromonitor; Bain Macro Trends Group analysis, 2011
Share of the growth in total final consumptionbetween 2010–2020 (forecast)
0
20
40
60
80
100%Total=$14T
Advanced
United Kingdom
France
USA
Japan
Canada
Other advanced
South KoreaAustralia
$6T
Developing
Brazil
Russia
China
India
Indonesia
Egypt
Other developing
MexicoTurkey
$8T
The US will continue to dominate the ranks of the “global upper-middle class”
*Definition of “global upper�middle class” is inherently arbitrary and qualitative. For illustrative purposes here, we use the $35,000 per yearthreshold consistent with the starting point for most definitions of the US middle classSources: Euromonitor; Bain Macro Trends Group analysis, 2011
Number of households, by disposable income band over time(income in thousands of USD)
US China India Brazil Russia EurozoneJapan
0
50
100
150
200
225K
2010 2020 (forecast)
Threshold for “globalupper�middle class”*
Threshold for “globalupper�middle class”*
0–0.
50.
5–0.
750.
75–1
.01.
0–1.
751.
75–2
.52.
5–5.
05.
0–7.
57.
5–10
10–1
515
–25
25–3
535
–45
45–5
555
–65
65–7
575
–100
100–
125
125–
150
>150
0–0.
50.
5–0.
750.
75–1
.01.
0–1.
751.
75–2
.52.
5–5.
05.
0–7.
57.
5–10
10–1
515
–25
25–3
535
–45
45–5
555
–65
65–7
575
–100
100–
125
125–
150
>150

The Great Eight | Bain & Company, Inc.
Page 12
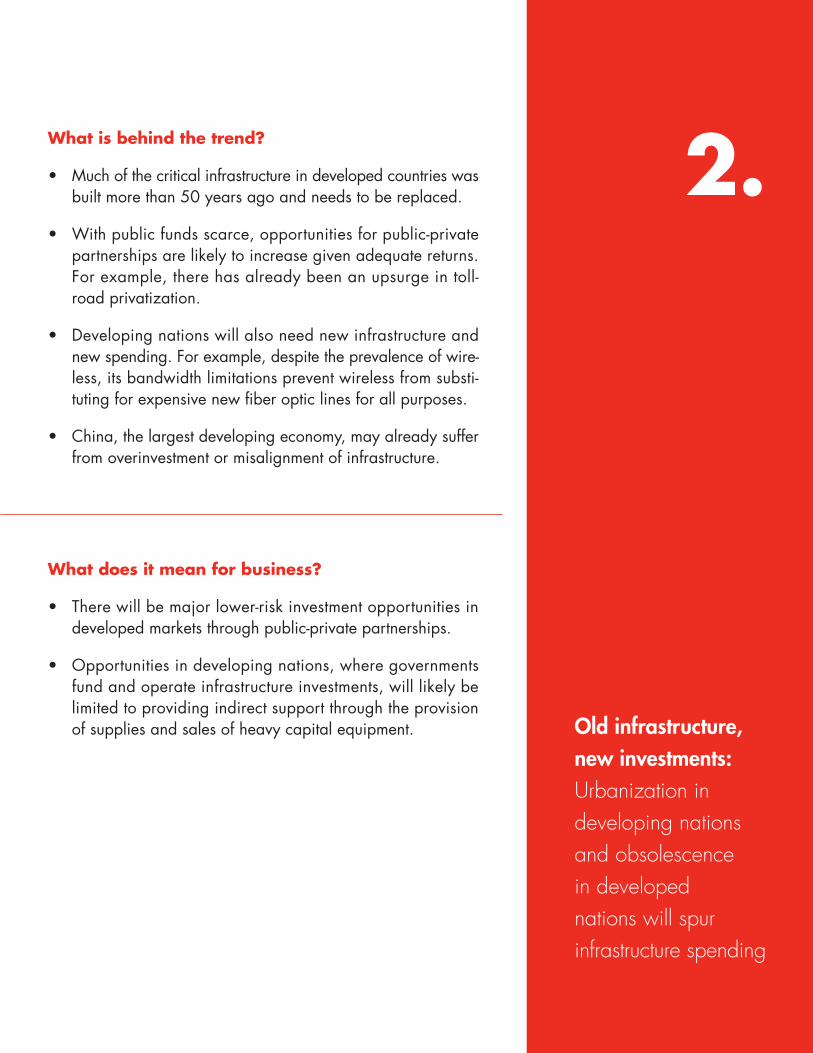
2.
Old infrastructure, new investments:Urbanization in developing nations and obsolescencein developed nations will spur infrastructure spending
What is behind the trend?
• Much of the critical infrastructure in developed countries was built more than 50 years ago and needs to be replaced.
• With public funds scarce, opportunities for public-private partnerships are likely to increase given adequate returns. For example, there has already been an upsurge in toll-road privatization.
• Developing nations will also need new infrastructure and new spending. For example, despite the prevalence of wire-less, its bandwidth limitations prevent wireless from substi-tuting for expensive new fi ber optic lines for all purposes.
• China, the largest developing economy, may already suffer from overinvestment or misalignment of infrastructure.
What does it mean for business?
• There will be major lower-risk investment opportunities in developed markets through public-private partnerships.
• Opportunities in developing nations, where governments fund and operate infrastructure investments, will likely be limited to providing indirect support through the provision of supplies and sales of heavy capital equipment.
The Great Eight | Bain & Company, Inc.
Page 14
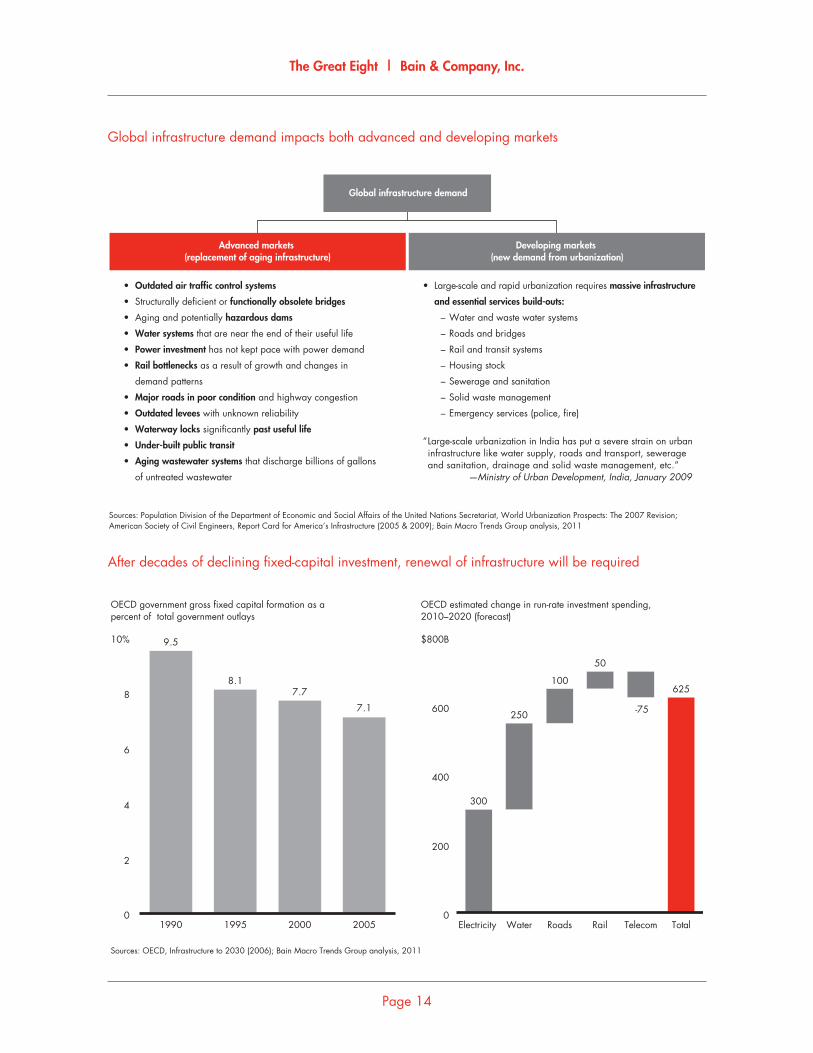
Global infrastructure demand impacts both advanced and developing markets
Sources: Population Division of the Department of Economic and Social Affairs of the United Nations Secretariat, World Urbanization Prospects: The 2007 Revision; American Society of Civil Engineers, Report Card for America’s Infrastructure (2005 & 2009); Bain Macro Trends Group analysis, 2011
Global infrastructure demand
Advanced markets (replacement of aging infrastructure)
Developing markets (new demand from urbanization)
• Outdated air traffic control systems
• Structurally deficient or functionally obsolete bridges
• Aging and potentially hazardous dams
• Water systems that are near the end of their useful life
• Power investment has not kept pace with power demand
• Rail bottlenecks as a result of growth and changes in
demand patterns
• Major roads in poor condition and highway congestion
• Outdated levees with unknown reliability
• Waterway locks significantly past useful life
• Under�built public transit
• Aging wastewater systems that discharge billions of gallons
of untreated wastewater
• Large�scale and rapid urbanization requires massive infrastructure
and essential services build�outs:
– Water and waste water systems
– Roads and bridges
– Rail and transit systems
– Housing stock
– Sewerage and sanitation
– Solid waste management
– Emergency services (police, fire)
“ Large�scale urbanization in India has put a severe strain on urban infrastructure like water supply, roads and transport, sewerage and sanitation, drainage and solid waste management, etc.” —Ministry of Urban Development, India, January 2009
After decades of declining fi xed-capital investment, renewal of infrastructure will be required
Sources: OECD, Infrastructure to 2030 (2006); Bain Macro Trends Group analysis, 2011
OECD government gross fixed capital formation as apercent of total government outlays
OECD estimated change in run�rate investment spending, 2010–2020 (forecast)
0
2
4
6
8
10%
1990
9.5
1995
8.1
2000
7.7
2005
7.1
TotalElectricity Water Roads Rail Telecom0
200
400
600
$800B
300
250
100
50
�75
625
The Great Eight | Bain & Company, Inc.
Page 15
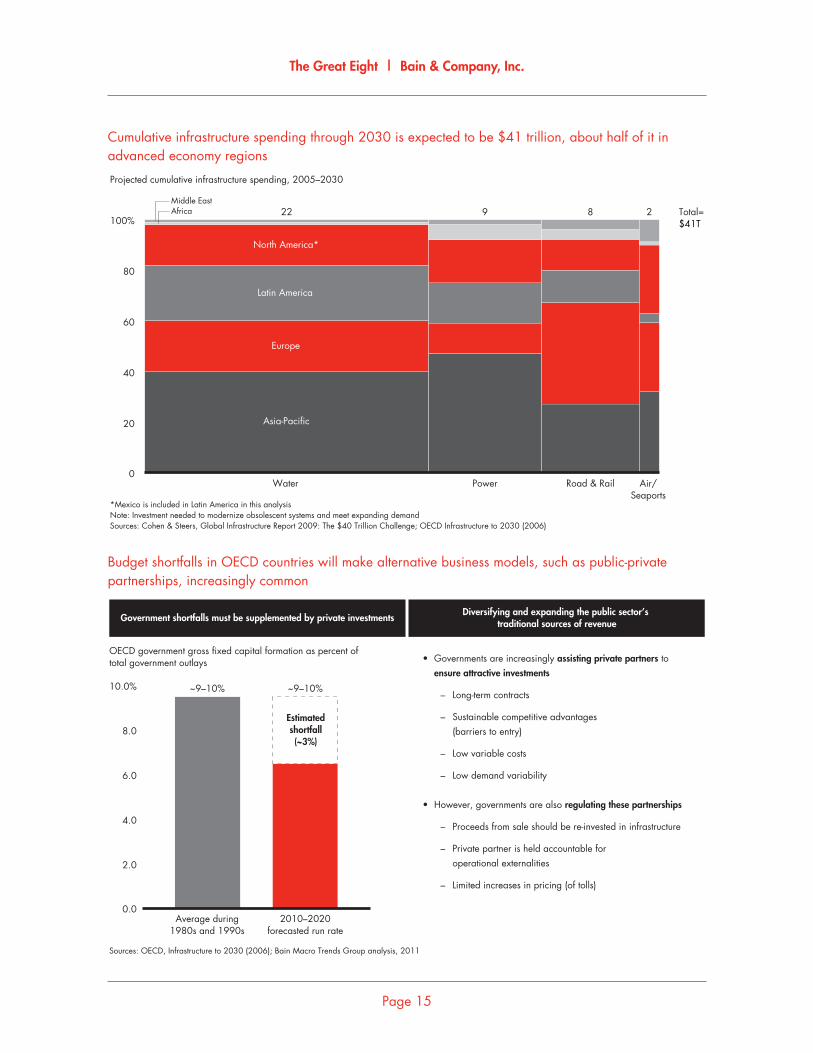
Cumulative infrastructure spending through 2030 is expected to be $41 trillion, about half of it in advanced economy regions
*Mexico is included in Latin America in this analysisNote: Investment needed to modernize obsolescent systems and meet expanding demandSources: Cohen & Steers, Global Infrastructure Report 2009: The $40 Trillion Challenge; OECD Infrastructure to 2030 (2006)
Projected cumulative infrastructure spending, 2005–2030
0
20
40
60
80
100%
Water
Latin America
Europe
Asia�Pacific
North America*
22
Power
9
Road & Rail
8
Air/Seaports
2 Total=$41T
Middle EastAfrica
Budget shortfalls in OECD countries will make alternative business models, such as public-private partnerships, increasingly common
Diversifying and expanding the public sector’s traditional sources of revenue
• Governments are increasingly assisting private partners to ensure attractive investments
– Long�term contracts
– Sustainable competitive advantages (barriers to entry)
– Low variable costs
– Low demand variability
• However, governments are also regulating these partnerships
– Proceeds from sale should be re�invested in infrastructure
– Private partner is held accountable for operational externalities
– Limited increases in pricing (of tolls)
Sources: OECD, Infrastructure to 2030 (2006); Bain Macro Trends Group analysis, 2011
OECD government gross fixed capital formation as percent of total government outlays
Government shortfalls must be supplemented by private investments
0.0
2.0
4.0
6.0
8.0
10.0%
Average during1980s and 1990s
~9–10%
2010–2020forecasted run rate
~9–10%
Estimatedshortfall(~3%)

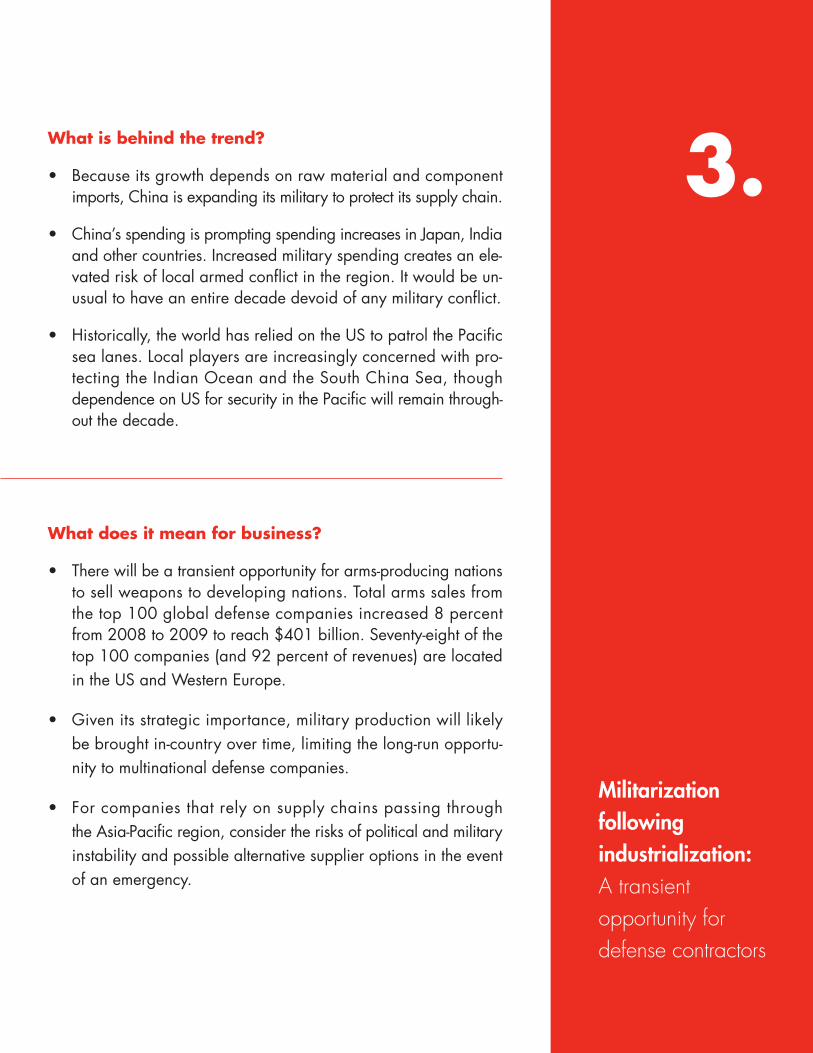
3.
Militarization following industrialization: A transient opportunity for defense contractors
What is behind the trend?
• Because its growth depends on raw material and component imports, China is expanding its military to protect its supply chain.
• China’s spending is prompting spending increases in Japan, India and other countries. Increased military spending creates an ele-vated risk of local armed confl ict in the region. It would be un-usual to have an entire decade devoid of any military confl ict.
• Historically, the world has relied on the US to patrol the Pacifi c sea lanes. Local players are increasingly concerned with pro-tecting the Indian Ocean and the South China Sea, though dependence on US for security in the Pacifi c will remain through-out the decade.
What does it mean for business?
• There will be a transient opportunity for arms-producing nations to sell weapons to developing nations. Total arms sales from the top 100 global defense companies increased 8 percent from 2008 to 2009 to reach $401 billion. Seventy-eight of the top 100 companies (and 92 percent of revenues) are located in the US and Western Europe.
• Given its strategic importance, military production will likely be brought in-country over time, limiting the long-run opportu-nity to multinational defense companies.
• For companies that rely on supply chains passing through the Asia-Pacifi c region, consider the risks of political and military instability and possible alternative supplier options in the event of an emergency.
The Great Eight | Bain & Company, Inc.
Page 18
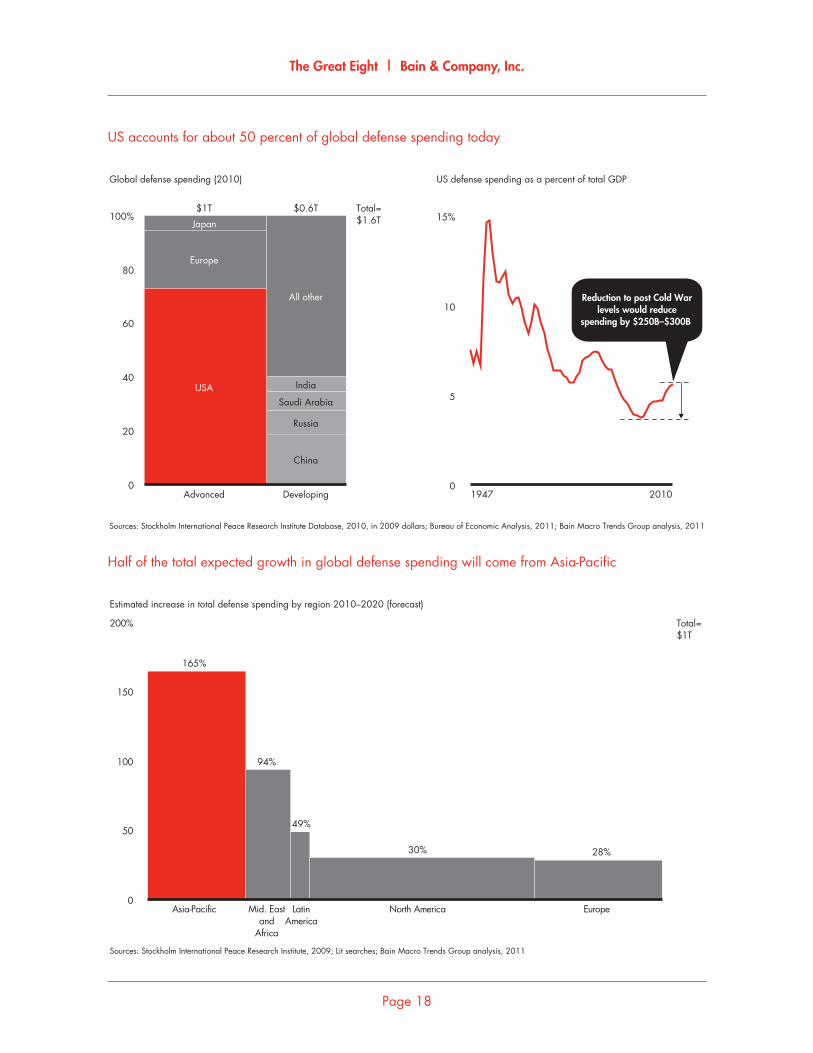
US accounts for about 50 percent of global defense spending today
Sources: Stockholm International Peace Research Institute Database, 2010, in 2009 dollars; Bureau of Economic Analysis, 2011; Bain Macro Trends Group analysis, 2011
Global defense spending (2010) US defense spending as a percent of total GDP
0
20
40
60
80
100%
Advanced
Japan
Europe
USA
$1T
Developing
All other
India
Saudi Arabia
Russia
China
$0.6T Total=$1.6T
1947 2010
Reduction to post Cold Warlevels would reduce
spending by $250B–$300B
0
5
10
15%
Half of the total expected growth in global defense spending will come from Asia-Pacifi c
Sources: Stockholm International Peace Research Institute, 2009; Lit searches; Bain Macro Trends Group analysis, 2011
Estimated increase in total defense spending by region 2010–2020 (forecast)
0
50
100
150
200%
Asia�Pacific
165%
Mid. Eastand
Africa
94%
LatinAmerica
North America
30%
Europe
28%
Total=$1T
49%
The Great Eight | Bain & Company, Inc.
Page 19
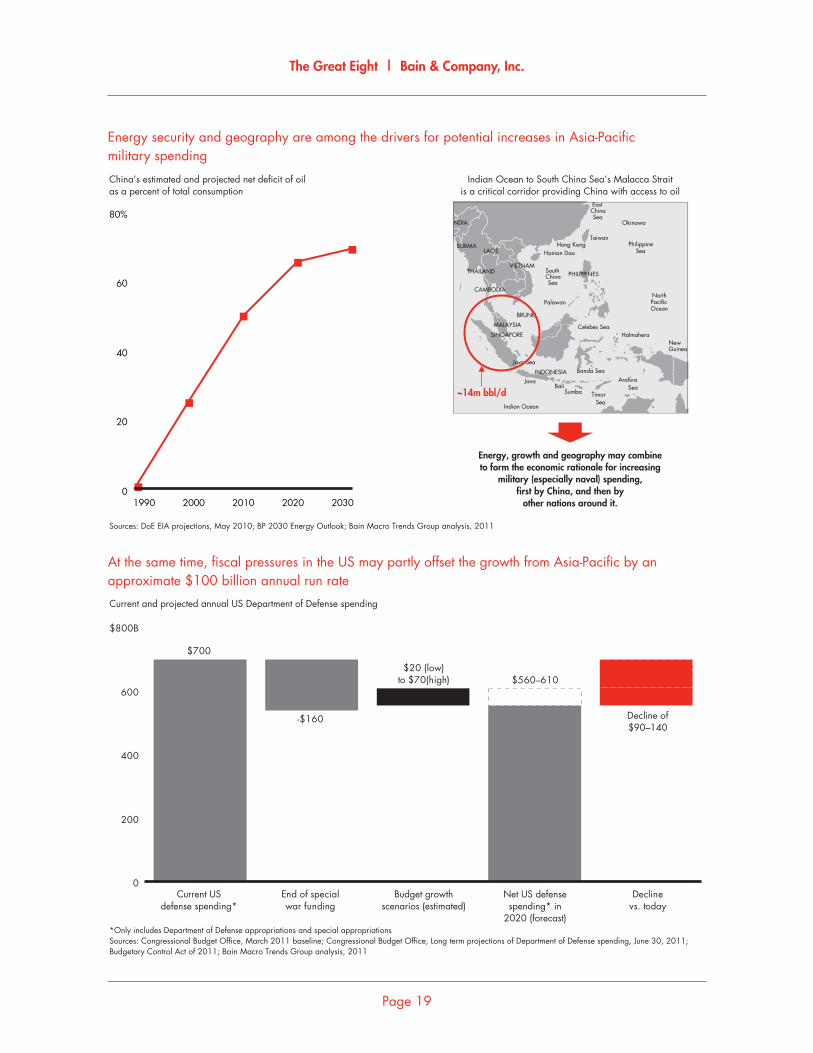
Energy security and geography are among the drivers for potential increases in Asia-Pacifi cmilitary spending
Bali
Indian Ocean
INDONESIAJava
HalmaheraNew Guinea
ArafuraSea
TimorSea
Java Sea
Celebes Sea
Sumba
NorthPacificOcean
PHILIPPINES
BRUNEL
MALAYSIA
SINGAPORE
VIETNAMTHAILAND
CAMBODIA
LAOSBURMA
NDIA
SouthChinaSea
Banda Sea
Palawan
Hainan DaoHong Kong Philippine
Sea
EastChinaSea
Taiwan
Okinawa
Sources: DoE EIA projections, May 2010; BP 2030 Energy Outlook; Bain Macro Trends Group analysis, 2011
China’s estimated and projected net deficit of oilas a percent of total consumption
Energy, growth and geography may combineto form the economic rationale for increasing
military (especially naval) spending,first by China, and then by
other nations around it.0
20
40
60
80%
1990 2000 2010 2020 2030
Indian Ocean to South China Sea’s Malacca Straitis a critical corridor providing China with access to oil
~14m bbl/d
At the same time, fi scal pressures in the US may partly offset the growth from Asia-Pacifi c by an approximate $100 billion annual run rate
*Only includes Department of Defense appropriations and special appropriationsSources: Congressional Budget Office, March 2011 baseline; Congressional Budget Office, Long term projections of Department of Defense spending, June 30, 2011;Budgetary Control Act of 2011; Bain Macro Trends Group analysis, 2011
Current and projected annual US Department of Defense spending
0
200
400
600
$800B
Current USdefense spending*
$700
End of specialwar funding
�$160
Budget growthscenarios (estimated)
$20 (low)to $70(high)
Net US defensespending* in
2020 (forecast)
$560–610
Declinevs. today
Decline of$90–140

4.
Growing outputof primary inputs:Increased demand for basic commodities
What is behind the trend?
• Demand for all commodities will rise. Increased consumption of oil, food, water and ores is a function of population growth but has been amplifi ed by the industrialization of emerging economies.
• Basic commodities are under pressure not only from their own higher demand but also from increasing alternate uses. For example, corn will be needed for food and ethanol. Water will be required for consumption, agricultural production and energy production.
• Only a short list of commodities is likely to result in real con-straints this decade. But for all, rising prices and volatility are likely to be the norm. Ore supply will also gradually adjust to meet demand, although not until the end of the decade. To meet food demand, a sustained period of rising production effi ciency will be necessary to forestall the alternative—sustained food price infl ation.
What does it mean for business?
• Expect upward price pressure on commodities throughout the decade, with the exception of oil (although energy prices may become very volatile).
• General price volatility will increase, partly refl ecting the global surplus of fi nancial capital seeking investment returns, which amplify demand-price shifts.
• Business challenges are likely to come from holdups and short-ages of copper and rare earth metals rather than from shortages of energy, food and water.
The Great Eight | Bain & Company, Inc.
Page 22
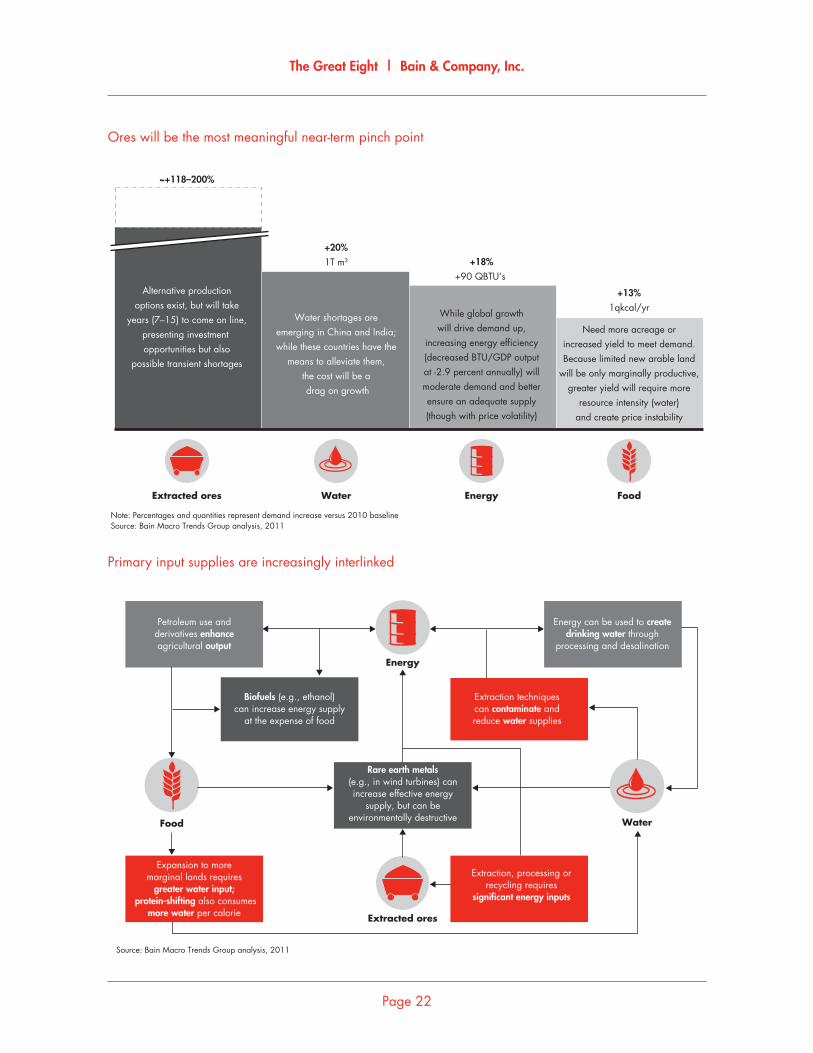
Ores will be the most meaningful near-term pinch point
Note: Percentages and quantities represent demand increase versus 2010 baselineSource: Bain Macro Trends Group analysis, 2011
Extracted ores Water Energy Food
~+118–200%
Alternative productionoptions exist, but will take
years (7–15) to come on line,presenting investment opportunities but also
possible transient shortages
Water shortages areemerging in China and India;while these countries have the
means to alleviate them,the cost will be a drag on growth
While global growthwill drive demand up,
increasing energy efficiency(decreased BTU/GDP outputat �2.9 percent annually) willmoderate demand and betterensure an adequate supply(though with price volatility)
Need more acreage orincreased yield to meet demand.Because limited new arable land
will be only marginally productive,greater yield will require more
resource intensity (water)and create price instability
+20%1T m3 +18%
+90 QBTU’s
+13%1qkcal/yr
Primary input supplies are increasingly interlinked
Petroleum use andderivatives enhanceagricultural output
Source: Bain Macro Trends Group analysis, 2011
Energy
Extracted ores
Food Water
Biofuels (e.g., ethanol)can increase energy supply
at the expense of food
Extraction, processing orrecycling requires
significant energy inputs
Extraction techniquescan contaminate andreduce water supplies
Rare earth metals(e.g., in wind turbines) canincrease effective energy
supply, but can beenvironmentally destructive
Expansion to moremarginal lands requires
greater water input; protein�shifting also consumes
more water per calorie
Energy can be used to createdrinking water through
processing and desalination
The Great Eight | Bain & Company, Inc.
Page 23
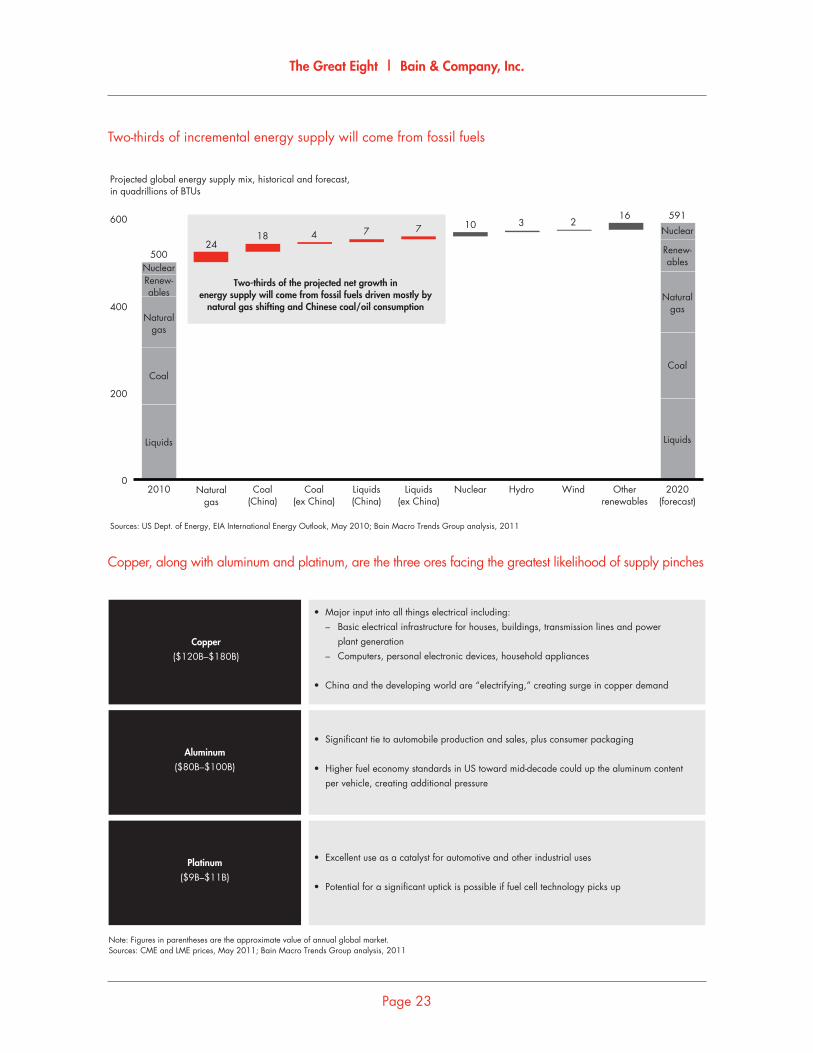
Two-thirds of incremental energy supply will come from fossil fuels
Sources: US Dept. of Energy, EIA International Energy Outlook, May 2010; Bain Macro Trends Group analysis, 2011
Projected global energy supply mix, historical and forecast,in quadrillions of BTUs
Two�thirds of the projected net growth inenergy supply will come from fossil fuels driven mostly by
natural gas shifting and Chinese coal/oil consumption
0
200
400
600
2010
Coal
Liquids
Naturalgas
NuclearRenew�ables
500
Naturalgas
24
Coal(China)
18
Coal(ex China)
4
Liquids(China)
7
Liquids(ex China)
7
Nuclear
10
Hydro
3
Wind
2
Otherrenewables
16
2020(forecast)
Coal
Liquids
Naturalgas
Nuclear
Renew�ables
591
Copper, along with aluminum and platinum, are the three ores facing the greatest likelihood of supply pinches
Note: Figures in parentheses are the approximate value of annual global market.Sources: CME and LME prices, May 2011; Bain Macro Trends Group analysis, 2011
• Major input into all things electrical including: – Basic electrical infrastructure for houses, buildings, transmission lines and power plant generation – Computers, personal electronic devices, household appliances
• China and the developing world are “electrifying,” creating surge in copper demand
Copper($120B–$180B)
• Significant tie to automobile production and sales, plus consumer packaging
• Higher fuel economy standards in US toward mid�decade could up the aluminum content per vehicle, creating additional pressure
Aluminum($80B–$100B)
• Excellent use as a catalyst for automotive and other industrial uses
• Potential for a significant uptick is possible if fuel cell technology picks up
Platinum($9B–$11B)

5.
Developing human capital: Investments in workforce training will be required to lift skill levelsin new markets and to remain competitive in developed ones
What is behind the trend?
• Nations that are home to “the next billion” need to invest in their social infrastructure (healthcare and education) or risk stunting their development into more balanced economies, both in terms of stalling workforce productivity and consumer spending power.
• Creating a consumer class in China (followed by India and Indonesia) will require social safety net investments in health-care and education. An aging population requires either additional savings to support itself in retirement or a public support alternative.
• In advanced economies, growth will be strongest in sectors like technology and healthcare that require skilled labor and entrepreneurship. Opportunities for the poorly educated in advanced economies continue their long-term decline.
What does it mean for business?
• Expect a shortage of management talent for some time in emerg-ing markets as economic growth outstrips home-grown talent growth and managers in advanced countries choose entrepreneur-ship in increasing numbers.
• Hire to grow—companies that plan to expand in China, India, Indonesia and other fast-emerging markets need to hire promising managers early and invest in their training and retention, as fi nding fully capable managers in-market will be extremely challenging.
• For advanced economies, the US in particular, the talent short-age means more enriching career opportunities for the elderly and for university graduates, a majority of whom are now women. Work models better able to adapt to the needs of women raising children will create an advantage in the hiring and retention of this majority group.
• Financial services companies may have an opportunity to create better savings vehicles (public or private) to create or augment a retirement safety net.
The Great Eight | Bain & Company, Inc.
Page 26
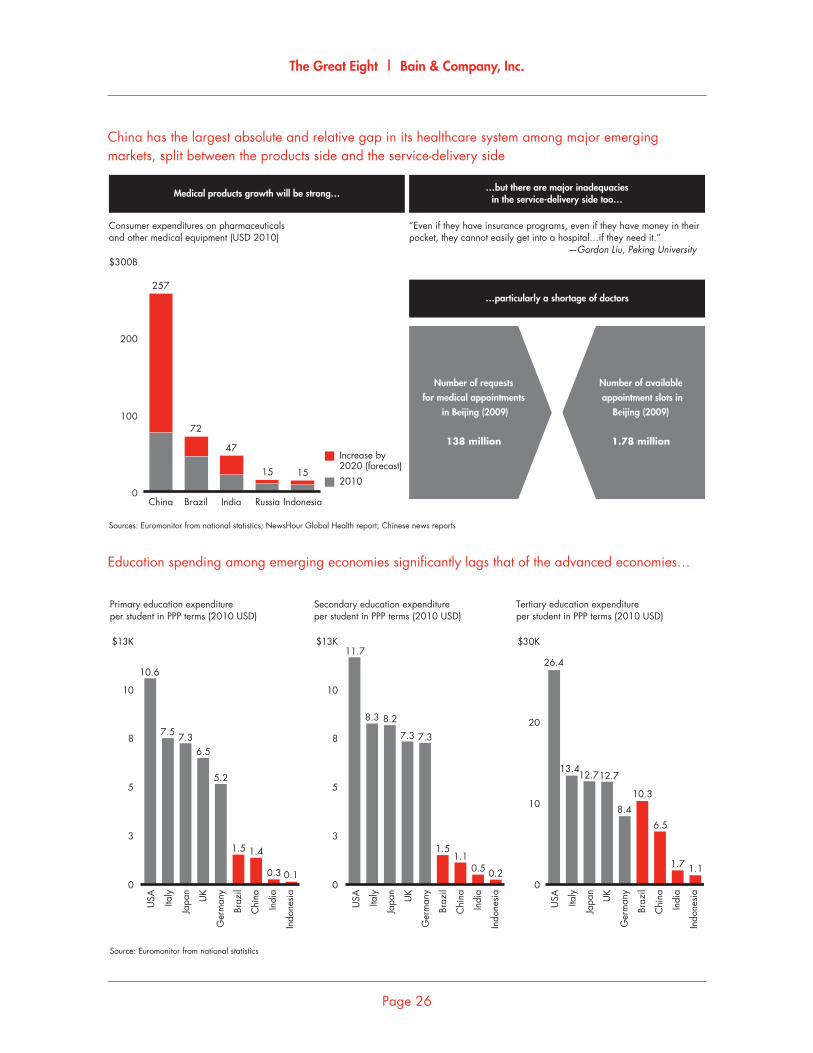
China has the largest absolute and relative gap in its healthcare system among major emergingmarkets, split between the products side and the service-delivery side
Sources: Euromonitor from national statistics; NewsHour Global Health report; Chinese news reports
Consumer expenditures on pharmaceuticalsand other medical equipment (USD 2010)
“Even if they have insurance programs, even if they have money in theirpocket, they cannot easily get into a hospital…if they need it.” —Gordon Liu, Peking University
Medical products growth will be strong……but there are major inadequacies
in the service�delivery side too…
…particularly a shortage of doctors
0
100
200
$300B
China
257
Brazil
72
India
47
Russia
15
Indonesia
15
Number of requestsfor medical appointments
in Beijing (2009)
138 million
Number of available appointment slots in
Beijing (2009)
1.78 millionIncrease by2020 (forecast)
2010
Education spending among emerging economies signifi cantly lags that of the advanced economies…
Source: Euromonitor from national statistics
Primary education expenditureper student in PPP terms (2010 USD)
Secondary education expenditureper student in PPP terms (2010 USD)
Tertiary education expenditureper student in PPP terms (2010 USD)
0
3
5
8
10
$13K
0
3
5
8
10
$13K
0
10
20
$30K
7.5
6.5
5.2
1.5
0.3
10.6
USA Italy
Japa
n
UK
Ger
man
y
Braz
il
Chi
na
Indi
a
Indo
nesi
a
USA Italy
Japa
n
UK
Ger
man
y
Braz
il
Chi
na
Indi
a
Indo
nesi
a
USA Italy
Japa
n
UK
Ger
man
y
Braz
il
Chi
na
Indi
a
Indo
nesi
a
7.3
1.4
0.1
8.3
7.3 7.3
1.51.1
0.5 0.2
11.7
8.2
12.7
8.4
6.5
1.7 1.1
26.4
13.412.7
10.3
The Great Eight | Bain & Company, Inc.
Page 27
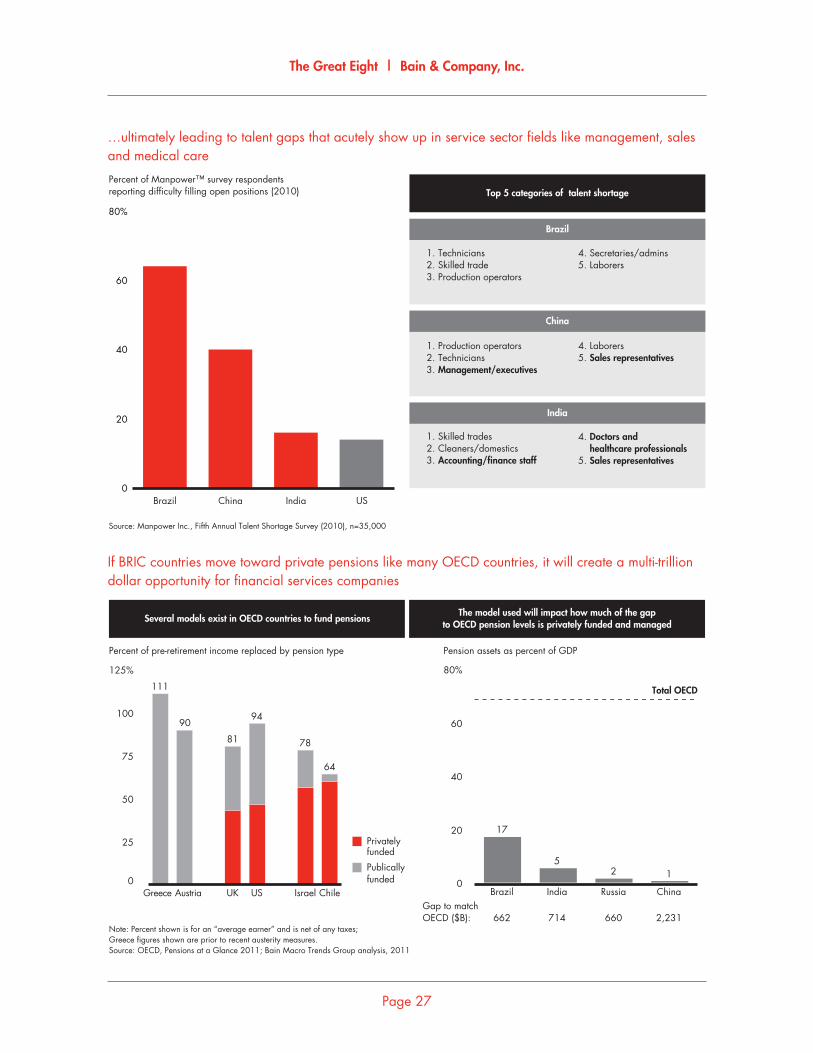
…ultimately leading to talent gaps that acutely show up in service sector fi elds like management, sales and medical care
Source: Manpower Inc., Fifth Annual Talent Shortage Survey (2010), n=35,000
Percent of Manpower™ survey respondentsreporting difficulty filling open positions (2010) Top 5 categories of talent shortage
Brazil
China
India
0
20
40
60
80%
ChinaBrazil India US
1. Technicians2. Skilled trade3. Production operators
1. Production operators2. Technicians3. Management/executives
4. Laborers5. Sales representatives
1. Skilled trades2. Cleaners/domestics3. Accounting/finance staff
4. Doctors and healthcare professionals5. Sales representatives
4. Secretaries/admins5. Laborers
If BRIC countries move toward private pensions like many OECD countries, it will create a multi-trillion dollar opportunity for fi nancial services companies
Note: Percent shown is for an “average earner” and is net of any taxes;Greece figures shown are prior to recent austerity measures.Source: OECD, Pensions at a Glance 2011; Bain Macro Trends Group analysis, 2011
Percent of pre�retirement income replaced by pension type Pension assets as percent of GDP
Several models exist in OECD countries to fund pensionsThe model used will impact how much of the gap
to OECD pension levels is privately funded and managed
Privatelyfunded
Publicallyfunded
Total OECD
25
50
75
100
125%
0
111
90
UK
81
US
94
78
64
Greece Austria Israel Chile0
20
40
60
80%
Brazil
17
India
5
Russia
2
China
1
662 714 660 2,231Gap to matchOECD ($B):

What is behind the trend?
• In advanced markets, aging populations and increasing rates of chronic conditions, such as obesity and diabetes, will con-tinue to infl ate healthcare costs. The continued expansion of healthcare as a “consumer good” will also create demand for new product and service innovations, in some cases broaden-ing the scope of what constitutes necessary care.
• The recent economic downturn and the need for government fi scal reforms will create signifi cant cost pressures on public and private payers. Responses will vary, but they will include some mix of direct control of input costs, the setting of protocols for healthcare delivery and the pursuit of integrated care models that better align incentives. At best, these efforts will reduce cost infl ation to the level of GDP growth.
6.
Keeping the wealthy healthy: Healthcare spending will continue to grow, but at slower rates
What does it mean for business?
• Profi t pools will remain under pressure across all sectors, but there will be signifi cant opportunities for innovation.
• Manufacturers, care providers and payers will make a major push to improve the productivity of healthcare delivery systems. Increased effi ciency, reduced per capita costs and demonstrated, measurable improvements in patient outcomes will continue to earn premium returns.
• To reduce reimbursement exposure, companies and fi nancial investors will see opportunities in more consumer-oriented health-care products and services that patients are willing to pay for out of pocket.
The Great Eight | Bain & Company, Inc.
Page 30
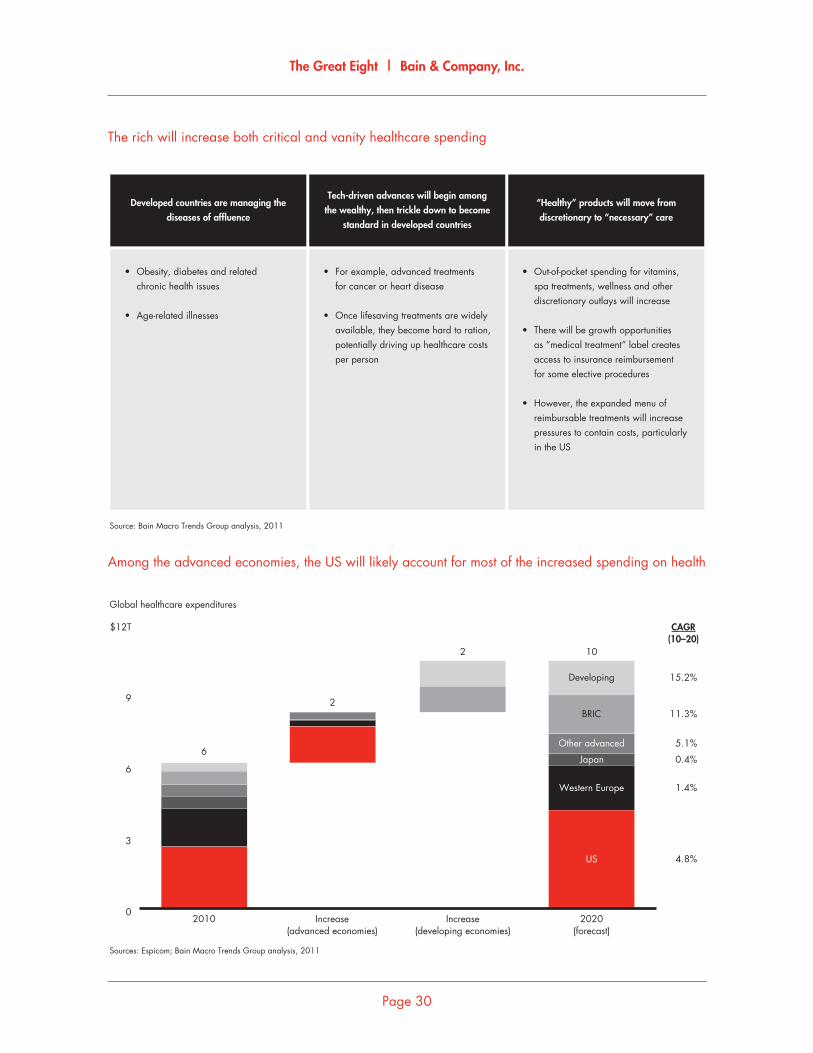
The rich will increase both critical and vanity healthcare spending
Source: Bain Macro Trends Group analysis, 2011
Developed countries are managing thediseases of affluence
“Healthy” products will move fromdiscretionary to “necessary” care
Tech�driven advances will begin amongthe wealthy, then trickle down to become
standard in developed countries
• For example, advanced treatments for cancer or heart disease
• Once lifesaving treatments are widely available, they become hard to ration, potentially driving up healthcare costs per person
• Obesity, diabetes and related chronic health issues
• Age�related illnesses
• Out�of�pocket spending for vitamins, spa treatments, wellness and other discretionary outlays will increase
• There will be growth opportunities as “medical treatment” label creates access to insurance reimbursement for some elective procedures
• However, the expanded menu of reimbursable treatments will increase pressures to contain costs, particularly in the US
Among the advanced economies, the US will likely account for most of the increased spending on health
Sources: Espicom; Bain Macro Trends Group analysis, 2011
Global healthcare expenditures
0
3
6
9
$12T
2010
6
Increase(advanced economies)
2
Increase(developing economies)
2
2020(forecast)
Developing
BRIC
Other advanced
Japan
Western Europe
US
10
4.8%
1.4%
0.4%
5.1%
11.3%
15.2%
CAGR(10–20)
The Great Eight | Bain & Company, Inc.
Page 31
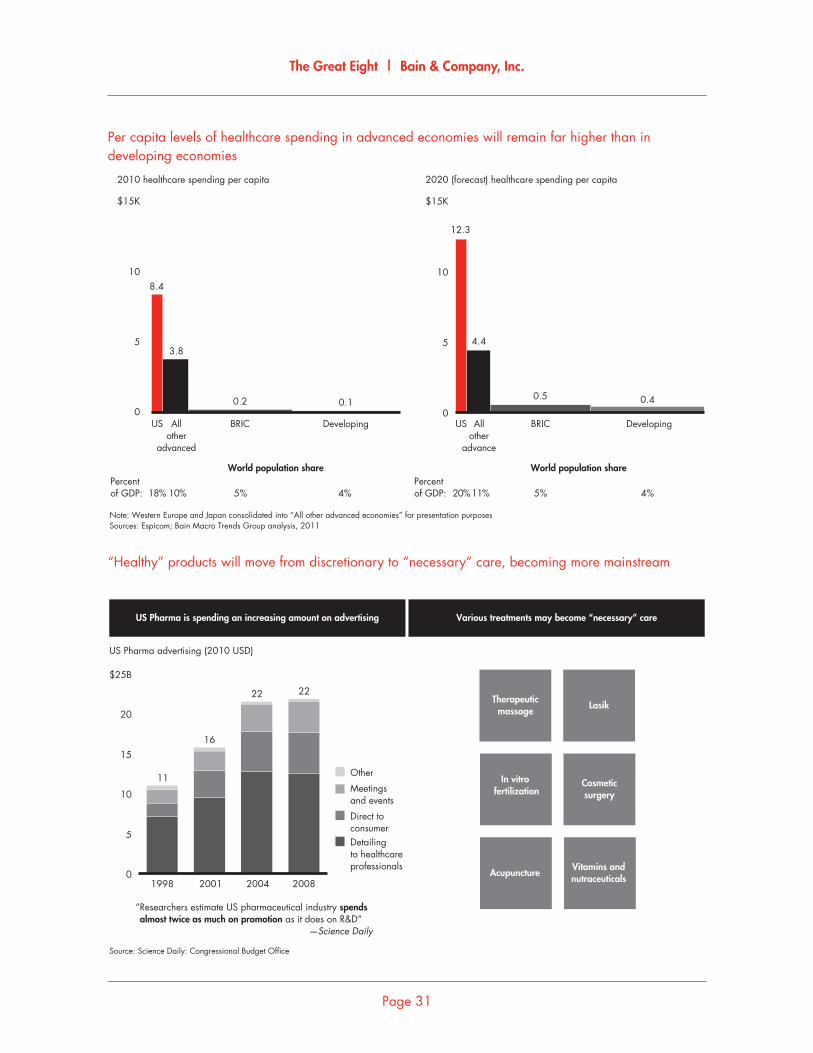
Per capita levels of healthcare spending in advanced economies will remain far higher than in developing economies
Note: Western Europe and Japan consolidated into “All other advanced economies” for presentation purposesSources: Espicom; Bain Macro Trends Group analysis, 2011
2010 healthcare spending per capita
BRIC
20% 5% 4%11%
0
5
10
$15K
World population share
US
8.4
3.8
BRIC
0.2
Developing
0.1
18% 5% 4%
Allother
advanced
10%Percentof GDP:
2020 (forecast) healthcare spending per capita
US Allother
advance
Percentof GDP:
Developing0
5
10
$15K
12.3
4.4
0.5 0.4
World population share
“Healthy” products will move from discretionary to “necessary” care, becoming more mainstream
Source: Science Daily: Congressional Budget Office
0
5
10
15
20
$25B
1998
11
2001
16
2004
22
2008
22
Detailingto healthcareprofessionals
Direct toconsumer
Meetingsand events
Other
US Pharma advertising (2010 USD)
US Pharma is spending an increasing amount on advertising
“ Researchers estimate US pharmaceutical industry spends almost twice as much on promotion as it does on R&D” —Science Daily
Therapeuticmassage
Lasik
In vitro fertilization
Cosmeticsurgery
AcupunctureVitamins andnutraceuticals
Various treatments may become “necessary” care

7.
Everything the same, but nicer: For the affl uent, the search for quality improve-ment rather than quantity will drive consumption trends
What is behind the trend?
• In advanced economies, a signifi cant proportion of GDP growth will come from a broad range of incremental improvements to existing offerings.
• Particularly important will be “soft innovations,” distinct from big breakthroughs or “hard innovations.” Soft innovations are improvements that may be generated from market or customer insights and process or business-model inventions. They have not been part of the traditional defi nitions of the center of inno-vation but will become more central.
• The result of soft innovations will be to increase total consump-tion, including the greater consumption of nonphysical (intan-gible) value, in contrast to just effi ciency innovations that only drive down costs and price points.
What does it mean for business?
• For businesses, increased commitments to invest in soft inno-vations are not just competitive imperatives, but creative ones—making spacious new markets out of crowded old ones.
• Marketing, customer research, process improvements and business model inventions will continue to be critical to creating incremental economic value above and beyond “stealing share.”
• Services, especially in the consumer space, may be poised to expand rapidly and diversify, mirroring (and in response to) the explosion of diversity in product SKUs.
The Great Eight | Bain & Company, Inc.
Page 34
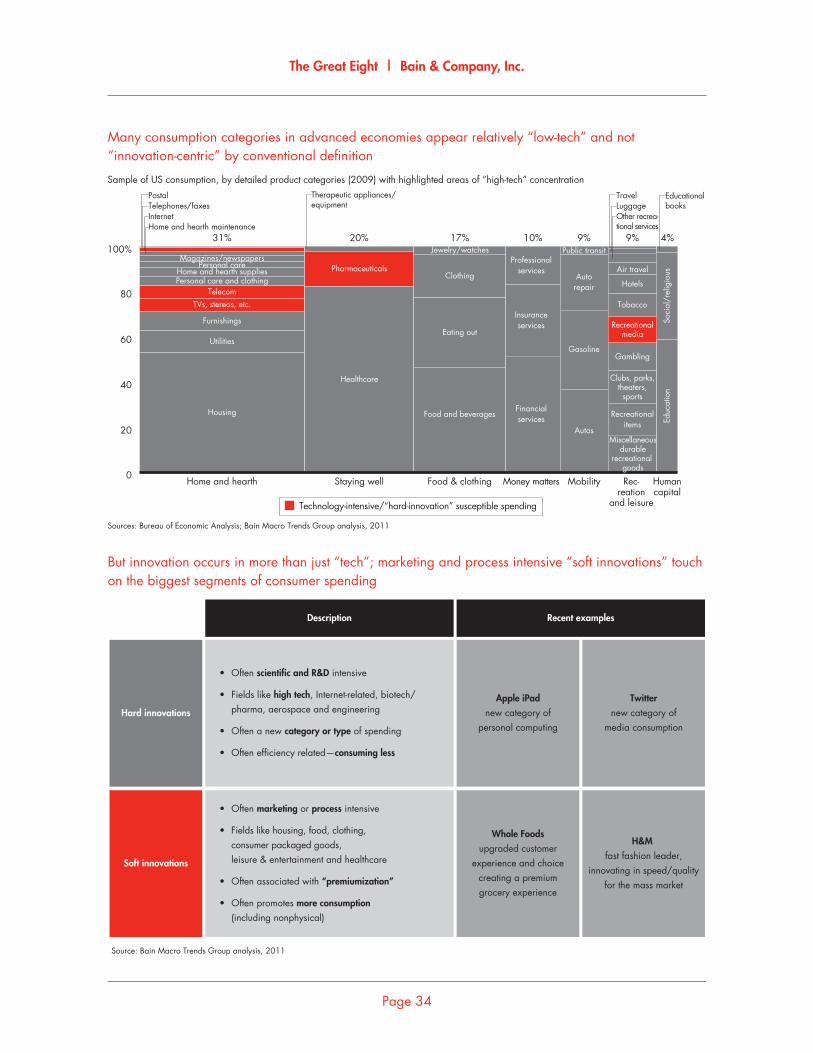
Many consumption categories in advanced economies appear relatively “low-tech” and not “innovation-centric” by conventional defi nition
Sources: Bureau of Economic Analysis; Bain Macro Trends Group analysis, 2011
Sample of US consumption, by detailed product categories (2009) with highlighted areas of “high�tech” concentration
0
20
40
60
80
100%
Home and hearth
InternetHome and hearth maintenance
Personal careHome and hearth suppliesPersonal care and clothing
TelecomTVs, stereos, etc.
Furnishings
Utilities
Housing
31%
Staying well
Pharmaceuticals
Healthcare
20%
Food & clothing
Jewelry/watches
Clothing
Eating out
Food and beverages
17%
Money matters
Professionalservices
Insuranceservices
Financialservices
10%
Mobility
Public transit
Autorepair
Gasoline
Autos
9%
Rec�reation
and leisure
Air travel
Hotels
Tobacco
Recreationalmedia
Gambling
Clubs, parks,theaters,sports
Recreationalitems
9%
Humancapital
4%
PostalTelephones/faxes
Other recrea�tional services
TravelLuggage
Soci
al/r
elig
ious
Educ
atio
n
Educational books
Therapeutic appliances/equipment
Technology�intensive/“hard�innovation” susceptible spending
Miscellaneousdurable
recreational goods
Magazines/newspapers
But innovation occurs in more than just “tech”; marketing and process intensive “soft innovations” touch on the biggest segments of consumer spending
Source: Bain Macro Trends Group analysis, 2011
Recent examplesDescription
• Often scientific and R&D intensive
• Fields like high tech, Internet�related, biotech/ pharma, aerospace and engineering
• Often a new category or type of spending
• Often efficiency related—consuming less
Hard innovations
Soft innovations
• Often marketing or process intensive
• Fields like housing, food, clothing, consumer packaged goods, leisure & entertainment and healthcare
• Often associated with “premiumization”
• Often promotes more consumption (including nonphysical)
Apple iPadnew category of
personal computing
Twitternew category of
media consumption
Whole Foodsupgraded customer
experience and choicecreating a premiumgrocery experience
H&M fast fashion leader,
innovating in speed/qualityfor the mass market
The Great Eight | Bain & Company, Inc.
Page 35
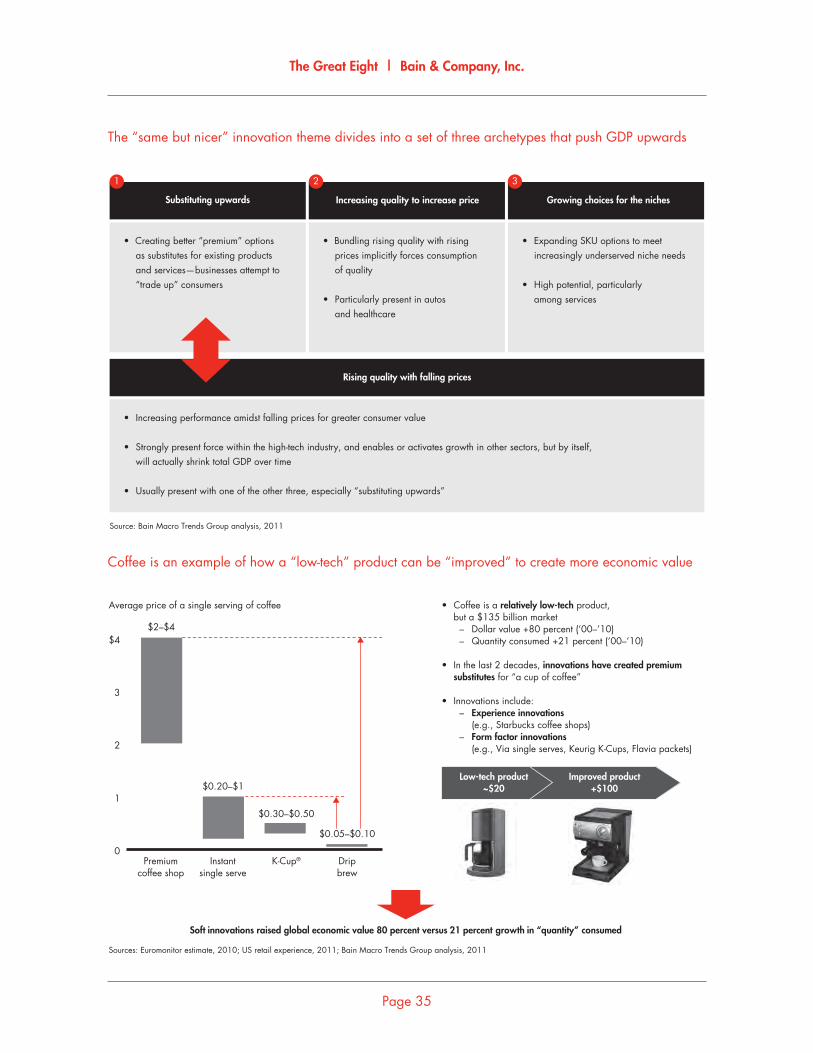
The “same but nicer” innovation theme divides into a set of three archetypes that push GDP upwards
• Expanding SKU options to meet increasingly underserved niche needs
• High potential, particularly among services
• Bundling rising quality with rising prices implicitly forces consumption of quality
• Particularly present in autos and healthcare
• Creating better “premium” options as substitutes for existing products and services—businesses attempt to “trade up” consumers
Source: Bain Macro Trends Group analysis, 2011
Substituting upwards Growing choices for the niches
Rising quality with falling prices
Increasing quality to increase price
1 2 3
• Increasing performance amidst falling prices for greater consumer value
• Strongly present force within the high�tech industry, and enables or activates growth in other sectors, but by itself, will actually shrink total GDP over time
• Usually present with one of the other three, especially “substituting upwards”
Coffee is an example of how a “low-tech” product can be “improved” to create more economic value
Average price of a single serving of coffee • Coffee is a relatively low�tech product, but a $135 billion market – Dollar value +80 percent (‘00–’10) – Quantity consumed +21 percent (‘00–’10)
• In the last 2 decades, innovations have created premium substitutes for “a cup of coffee”
• Innovations include: – Experience innovations (e.g., Starbucks coffee shops) – Form factor innovations (e.g., Via single serves, Keurig K�Cups, Flavia packets)
Sources: Euromonitor estimate, 2010; US retail experience, 2011; Bain Macro Trends Group analysis, 2011
0
1
2
3
$4
Premiumcoffee shop
Instantsingle serve
K�Cup® Dripbrew
$2–$4
$0.30–$0.50
$0.20–$1
$0.05–$0.10
Low�tech product~$20
Improved product+$100
Soft innovations raised global economic value 80 percent versus 21 percent growth in “quantity” consumed

8.
Prepping for the next big thing: The next platform breakthrough isn’t here yet, but the seeds are begin-ning to sprout
What is behind the trend?
• Critical breakthroughs, like railroads, electricity and the Internet, have outsized impact by triggering changes far beyond their immediate uses. For example, the railroad network laid the foundation for the telegraph network, in addition to creating faster and more reliable transport.
• These breakthroughs free up resources and replace labor by automating physical functions, mental functions or both.
• Developments currently underway hint at upcoming break-throughs, but are at least two steps away from commercializa-tion. Examples include personal robots to perform household functions, 3D printers to create at-home prototyping and nano-technology innovations across a wide range of applications including manufacturing and healthcare.
What does it mean for business?
• Big bets—and big wins—are on the horizon.
• A fi nancial system that funnels capital to the right set of start-ups and smaller-scale opportunities, as “angel” and VC investors in the US do, may confer advantages in nurturing these wins. Larger players, like sovereign wealth funds, could use their greater resources to create idea incubators or portfolios, similar to how pharma companies run drug development, for example.
The Great Eight | Bain & Company, Inc.
Page 38
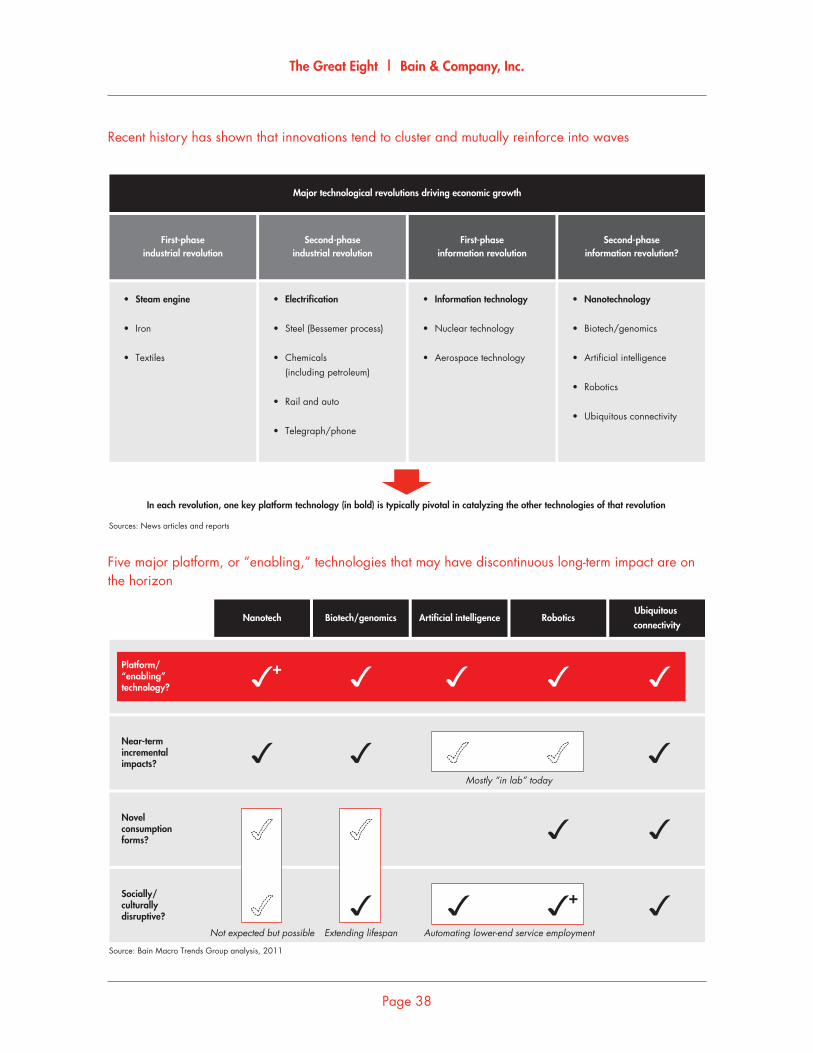
Recent history has shown that innovations tend to cluster and mutually reinforce into waves
Sources: News articles and reports
Major technological revolutions driving economic growth
In each revolution, one key platform technology (in bold) is typically pivotal in catalyzing the other technologies of that revolution
First�phaseindustrial revolution
• Electrification
• Steel (Bessemer process)
• Chemicals (including petroleum)
• Rail and auto
• Telegraph/phone
Second�phaseindustrial revolution
First�phaseinformation revolution
Second�phaseinformation revolution?
• Information technology
• Nuclear technology
• Aerospace technology
• Nanotechnology
• Biotech/genomics
• Artificial intelligence
• Robotics
• Ubiquitous connectivity
• Steam engine
• Iron
• Textiles
Five major platform, or ”enabling,” technologies that may have discontinuous long-term impact are on the horizon
Source: Bain Macro Trends Group analysis, 2011
Near�termincrementalimpacts?
Novelconsumptionforms?
Not expected but possible Extending lifespan
Mostly “in lab” today
Platform/“enabling”technology?
Ubiquitous connectivity
RoboticsArtificial intelligenceBiotech/genomicsNanotech
Socially/culturallydisruptive?
+
Automating lower�end service employment
+
The Great Eight | Bain & Company, Inc.
Page 39
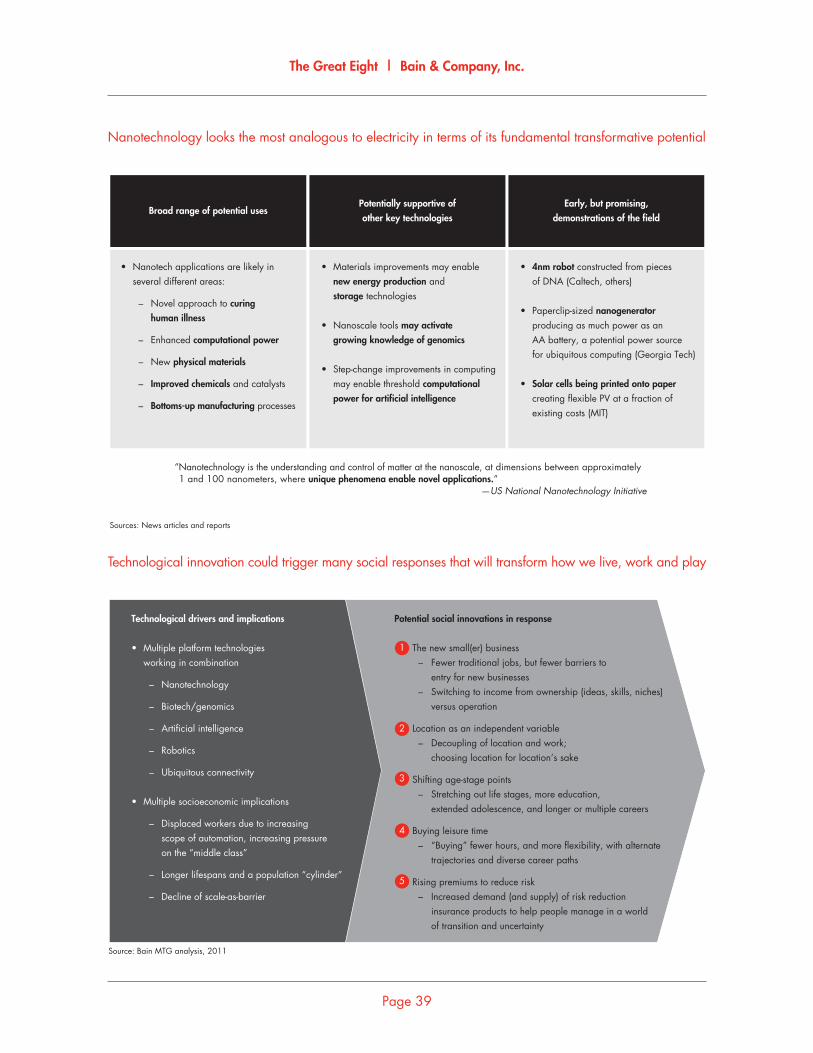
Nanotechnology looks the most analogous to electricity in terms of its fundamental transformative potential
Sources: News articles and reports
Broad range of potential usesEarly, but promising,
demonstrations of the fieldPotentially supportive ofother key technologies
• Materials improvements may enable new energy production and storage technologies
• Nanoscale tools may activate growing knowledge of genomics
• Step�change improvements in computing may enable threshold computational power for artificial intelligence
• Nanotech applications are likely in several different areas:
– Novel approach to curing human illness
– Enhanced computational power
– New physical materials
– Improved chemicals and catalysts
– Bottoms�up manufacturing processes
• 4nm robot constructed from pieces of DNA (Caltech, others)
• Paperclip�sized nanogenerator producing as much power as an AA battery, a potential power source for ubiquitous computing (Georgia Tech)
• Solar cells being printed onto paper creating flexible PV at a fraction of existing costs (MIT)
“Nanotechnology is the understanding and control of matter at the nanoscale, at dimensions between approximately 1 and 100 nanometers, where unique phenomena enable novel applications.” —US National Nanotechnology Initiative
Technological innovation could trigger many social responses that will transform how we live, work and play
Source: Bain MTG analysis, 2011
Technological drivers and implications
• Multiple platform technologies working in combination
– Nanotechnology
– Biotech/genomics
– Artificial intelligence
– Robotics
– Ubiquitous connectivity
• Multiple socioeconomic implications
– Displaced workers due to increasing scope of automation, increasing pressure on the “middle class”
– Longer lifespans and a population “cylinder”
– Decline of scale�as�barrier
Potential social innovations in response The new small(er) business – Fewer traditional jobs, but fewer barriers to entry for new businesses – Switching to income from ownership (ideas, skills, niches) versus operation
Location as an independent variable – Decoupling of location and work; choosing location for location’s sake
Shifting age�stage points – Stretching out life stages, more education, extended adolescence, and longer or multiple careers
Buying leisure time – “Buying” fewer hours, and more flexibility, with alternate trajectories and diverse career paths
Rising premiums to reduce risk – Increased demand (and supply) of risk reduction insurance products to help people manage in a world of transition and uncertainty
1
2
3
4
5
Key contacts in Bain’s Macro Trends Group
New York: Karen Harris ([email protected]); Andrew Schwedel ([email protected])
Dallas: Austin Kim ([email protected])
Please direct questions and comments about this report via email to [email protected]
Acknowledgments
The authors express their appreciation to the members of Bain’s Macro Trends Group Steering Committee:
James Allen, George Cogan, Philippe De Backer, Steve Ellis, Orit Gadiesh, David Harding, Norbert Hüelten-
schmidt, Edmund Lin, Hugh MacArthur, Rob Markey, Wendy Miller, Charles Ormiston, Peter Parry, Raj
Pherwani, Rudy Puryear, Darrell Rigby, Paul Rogers, Ted Rouse, Dave Sanderson, Phil Schefter, John Smith,
Paul Smith and Vijay Vishwanath.
The authors also thank Jennifer Binder-Le Pape, Michael Goldberg, Michael Retterath, Suzanne Tager
and Tim van Biesen for their contributions.


For more information, please visit www.bain.com