Trigonometric functions - haesemathematics.com · These phenomena illustrate variable behaviour...
24
18 Chapter Trigonometric functions Contents: Syllabus reference: 4.5 A B C D E F Observing periodic behaviour The sine function The cosine function Modelling using sine and cosine functions Trigonometric equations Using trigonometric models
Transcript of Trigonometric functions - haesemathematics.com · These phenomena illustrate variable behaviour...
18Chapter
Trigonometricfunctions
Contents:
Syllabus reference: 4.5
A
B
C
D
E
F
Observing periodicbehaviour
The sine function
The cosine function
Modelling using sine andcosine functions
Trigonometric equations
Using trigonometricmodels
IB_STSL-2edmagentacyan yellow black
0 05 5
25
25
75
75
50
50
95
95
100
100 0 05 5
25
25
75
75
50
50
95
95
100
100
Y:\HAESE\IB_STSL-2ed\IB_STSL-2ed_18\557IB_STSL-2_18.CDR Monday, 15 February 2010 10:06:40 AM PETER

OPENING PROBLEM
Periodic phenomena occur all the time in the physical world. For example, in:
² seasonal variations in our climate
² variations in average maximum and minimum monthly temperatures
² the number of daylight hours at a particular location
² tidal variations in the depth of water in a harbour
² the phases of the moon
² animal populations.
These phenomena illustrate variable behaviour which is repeated over time. The repetition
may be called periodic, oscillatory, or cyclic in different situations.
In this chapter we will consider how trigonometric functions can be used to model periodic
phenomena. We will then extend our knowledge of the trigonometric functions by considering
formulae that connect them.
A Ferris wheel rotates at a
constant speed. The wheel’s
radius is 10 m and the bottom of
the wheel is 2 m above ground
level. From a point in front of the wheel,
Andrew is watching a green light on the
perimeter of the wheel. Andrew notices that
the green light moves in a circle. He estimates
how high the light is above ground level at two
second intervals and draws a scatterplot of his
results.
Things to think about:
² What does his scatterplot look like?
² Could a known function be used to model the data?
² How could this function be used to find the light’s position at any point in time?
² How could this function be used to find the times when the light is at its maximum
and minimum heights?
² What part of the function would indicate the time interval over which one complete
cycle occurs?
Click on the icon to visit a simulation of the Ferris wheel. You will be able
to view the light from:
² in front of the wheel ² a side-on position
² above the wheel.
You can then observe the graph of height above or below the wheel’s axis as the wheel
rotates at a constant rate.
DEMO
558 TRIGONOMETRIC FUNCTIONS (Chapter 18)
IB_STSL-2edmagentacyan yellow black
0 05 5
25
25
75
75
50
50
95
95
100
100 0 05 5
25
25
75
75
50
50
95
95
100
100
Y:\HAESE\IB_STSL-2ed\IB_STSL-2ed_18\558IB_STSL-2_18.CDR Monday, 15 February 2010 10:06:54 AM PETER

HISTORICAL NOTE
Consider the table below which shows the mean monthly maximum temperature for Cape
Town, South Africa.
Month Jan Feb Mar Apr May Jun Jul Aug Sep Oct Nov Dec
Temp (oC) 28 27 251
222 181
216 15 16 18 211
224 26
On the scatterplot alongside we plot the
temperature T on the vertical axis. We
assign January as t = 1 month, February
as t = 2 months, and so on for the 12months of the year.
The temperature shows a variation from an average of 28oC in January through a range of
values across the months. The cycle will repeat itself for the next 12 month period. By the
end of the chapter we will be able to establish a function which approximately fits this set of
points.
In 1831 Michael Faraday discovered that an electric current was generated by rotating
a coil of wire in a magnetic field. The electric current produced showed a voltage which
varied between positive and negative values as the coil rotated through 360o.
Graphs with this basic shape where the cycle is repeated over and over are called sine waves.
OBSERVING PERIODIC BEHAVIOURA
10
20
30
3 6 9 12 15 18 21 24
T (°C)
t (months)
JAN JAN
10
20
30
3 6 9 12
T (°C)
t (months)
JAN JAN
(10 21 ),� Qw
lines of
magnetic
force
direction
of rotation
volt
age
+
-90° 180° 270° 360°
559TRIGONOMETRIC FUNCTIONS (Chapter 18)
IB_STSL-2edmagentacyan yellow black
0 05 5
25
25
75
75
50
50
95
95
100
100 0 05 5
25
25
75
75
50
50
95
95
100
100
Y:\HAESE\IB_STSL-2ed\IB_STSL-2ed_18\559IB_STSL-2_18.CDR Monday, 15 February 2010 10:06:57 AM PETER

GATHERING PERIODIC DATA
Data on a number of periodic phenomena can be found online or in other publications. For
example:
² Maximum and minimum monthly temperatures can be found at
² Tidal details can be obtained from daily newspapers or internet sites such as
or
TERMINOLOGY USED TO DESCRIBE PERIODICITY
This means that f(0) = f(12) = f(24) = ::::
f(1) = f(13) = f(25) = :::: and so on.
We say the period of the temperature curve is
A cycloid is another example of a periodic function. It is the curve traced out by a point on a
circle as the circle rolls across a flat surface in a straight line. However, the cycloid function
cannot be written as a Cartesian equation in the form y = :::::: or f(x) = ::::::
In this course we are mainly concerned with periodic phenomena which show a wave pattern
when graphed.
The wave oscillates about a horizontal line called the principal axis or mean line.
A maximum point occurs at the top of a crest, and a minimum point at the bottom of a
trough.
http://www.bom.gov.au/silo/
http://tidesandcurrents.noaa.gov http://www.bom.gov.au/oceanography
principal axis
the wave
horizontal flat surface
DEMO
12 months.
560 TRIGONOMETRIC FUNCTIONS (Chapter 18)
For example, for the temperature graph on page 559, we see that f(x+ 12) = f(x) for all
x on the curve.
A periodic function is one which repeats itself over and over in a horizontal direction.
The period of a periodic function is the length of one repetition or cycle.
f(x) is a periodic function with period p , f(x+ p) = f(x) for all x,
and p is the smallest positive value for this to be true.
IB_STSL-2edmagentacyan yellow black
0 05 5
25
25
75
75
50
50
95
95
100
100 0 05 5
25
25
75
75
50
50
95
95
100
100
Y:\HAESE\IB_STSL-2ed\IB_STSL-2ed_18\560IB_STSL-2_18.CDR Wednesday, 24 February 2010 9:23:54 AM PETER

EXERCISE 18A
1 For each set of data below, draw a scatterplot and decide whether or not the data exhibits
approximately periodic behaviour.
a x 0 1 2 3 4 5 6 7 8 9 10 11 12
y 0 1 1:4 1 0 ¡1 ¡1:4 ¡1 0 1 1:4 1 0
b x 0 1 2 3 4
y 4 1 0 1 4
c x 0 0:5 1:0 1:5 2:0 2:5 3:0 3:5
y 0 1:9 3:5 4:5 4:7 4:3 3:4 2:4
d x 0 2 3 4 5 6 7 8 9 10 12
y 0 4:7 3:4 1:7 2:1 5:2 8:9 10:9 10:2 8:4 10:4
2 The following tabled values show the height above the ground of a point on a bicycle
wheel as the bicycle is wheeled along a flat surface.
Distance travelled (cm) 0 20 40 60 80 100 120 140 160 180 200
Height above ground (cm) 0 6 23 42 57 64 59 43 23 7 1
Distance travelled (cm) 220 240 260 280 300 320 340 360 380 400
Height above ground (cm) 5 27 40 55 63 60 44 24 9 3
a Plot the graph of height against distance.
b Is the data periodic? If so, estimate:
i the equation of the principal axis ii the maximum value
iii the period iv the amplitude.
c Is it reasonable to fit a curve to this data, or should we leave it as discrete points?
TI- spiren
TI-84
Casio
period
amplitude
minimum point
maximum point
principal axis
561TRIGONOMETRIC FUNCTIONS (Chapter 18)
The amplitude of a periodic function is the distance between a maximum (or minimum)
point and the principal axis.
amplitude =max ¡ min
2principal axis y =
max + min
2
IB_STSL-2edmagentacyan yellow black
0 05 5
25
25
75
75
50
50
95
95
100
100 0 05 5
25
25
75
75
50
50
95
95
100
100
Y:\HAESE\IB_STSL-2ed\IB_STSL-2ed_18\561IB_STSL-2_18.CDR Monday, 15 February 2010 10:09:59 AM PETER

3 Which of these graphs show periodic behaviour?
a b
c d
e f
4
For the given periodic function:
a state its amplitude b state its period.
c State the coordinates of the first maximum point such that x > 0.
d What is the distance between successive maxima?
e What is the equation of the principal axis?
In previous studies of trigonometry we have only considered right angled triangles, or static
situations where an angle µ is fixed. However, when an object moves around a circle, the
situation is dynamic. The angle between the radius OP and the horizontal axis continually
changes with time.
Consider again the Opening Problem in which a Ferris
wheel of radius 10 m revolves at constant speed.
The height of P, the point representing the green light on
the wheel relative to the principal axis O, can be determined
using right angled triangle trigonometry.
sin µ =h
10, so h = 10 sin µ:
As time goes by, µ changes and so does h.
So, h is a function of µ, but more importantly h is a function of time t.
THE SINE FUNCTIONB
y
x1 2 3 4 5 6
y
x3 6 9 12 15 18
y
x
11 22 33 44 55 66 77 88 99
y
x2 4 6
y
x
55 1010 1515 2020
h
q
10
P
10x
y
y
x
2-1
1 2 3 4
x
y
-8 -4
-1
41
8 12 16
-2
-3
-12
562 TRIGONOMETRIC FUNCTIONS (Chapter 18)
IB_STSL-2edmagentacyan yellow black
0 05 5
25
25
75
75
50
50
95
95
100
100 0 05 5
25
25
75
75
50
50
95
95
100
100
Y:\HAESE\IB_STSL-2ed\IB_STSL-2ed_18\562IB_STSL-2_18.CDR Monday, 15 February 2010 10:07:05 AM PETER

Suppose the Ferris wheel observed by Andrew takes 100 seconds for a full revolution. The
graph below shows the height of the light above or below the principal axis against the time
in seconds.
We observe that the amplitude is 10 metres and the period is 100 seconds.
THE BASIC SINE CURVE
Suppose the point P moves around a circle of radius 1 unit centred at the origin O, so the
angle OP makes with the horizontal axis is x. In this case the y-coordinate of P will be sinx.
If we project the values of sinx from the unit circle onto a set of axes on the right, we obtain
the graph of y = sinx.
The wave of course can be continued beyond 0o 6 x 6 360o as shown:
We expect the period to be 360o, since the point P returns to its starting point after one full
revolution.
The maximum value is 1 and the minimum is ¡1.
The amplitude is 1.
Use your graphics calculator or graphing package to obtain the graph of
y = sinx to check these features.
10
-10
height (metres)
time (seconds)50 100
DEMO
1
-1
90°90° 180°180° 270°270° 360°360° x
yy
y = xsin_
1
-1
90°90° 180°180° 270°270° 360°360° 540°540° x
y
450°450°
y = xsin_
GRAPHING
PACKAGE
563TRIGONOMETRIC FUNCTIONS (Chapter 18)
IB_STSL-2edmagentacyan yellow black
0 05 5
25
25
75
75
50
50
95
95
100
100 0 05 5
25
25
75
75
50
50
95
95
100
100
Y:\HAESE\IB_STSL-2ed\IB_STSL-2ed_18\563IB_STSL-2_18.CDR Monday, 15 February 2010 10:07:07 AM PETER

THE FAMILY = sin bxINVESTIGATION 2 y
THE FAMILY = a sinxINVESTIGATION 1 y
What to do:
1 Use technology to graph on the same set of axes:
a y = sinx and y = 2 sinx
b y = sinx and y = 0:5 sinx
c y = sinx and y = ¡ sinx
If using a graphics calculator, make sure that the mode is set in degrees
and that your viewing window is appropriate.
2 For each of y = sinx, y = 2 sinx, y = 0:5 sinx, and y = ¡ sinx:
a record the maximum and minimum values
b state the period and amplitude.
3
4 State the amplitude of:
a y = 3 sinx b y =p7 sinx c y = ¡2 sinx
What to do:
1 Use technology to graph on the same set of axes:
a y = sinx and y = sin 2x b y = sinx and y = sin(12x)
2 For each of y = sinx, y = sin 2x, and y = sin(12x):
a record the maximum and minimum values
b state the period and amplitude.
3 On the same set of axes, sketch y = sinx and y = sin(¡x).
State the period and amplitude of y = sin(¡x):
4
5 State the period of:
a y = sin 3x b y = sin(13x) c y = sin(1:2x)
d y = sin(¡2x) e y = sin(¡1
2x) f y = sin bx
From the previous investigations you should have observed that:
jaj is the modulus of
a. It is the size of a,
and cannot be negative.
GRAPHING
PACKAGE
GRAPHING
PACKAGE
Describe the effect of a in the function y = a sinx.
Describe the effect of b in the function y = sin bx.
564 TRIGONOMETRIC FUNCTIONS (Chapter 18)
² In y = a sinx, jaj determines the amplitude.
The graph of y = sinx is vertically stretched
if jaj > 1, or compressed if jaj < 1, to obtain
the graph of y = a sinx.
We call this a vertical dilation.
If a < 0 the graph is also reflected in the x-axis.
IB_STSL-2edmagentacyan yellow black
0 05 5
25
25
75
75
50
50
95
95
100
100 0 05 5
25
25
75
75
50
50
95
95
100
100
Y:\HAESE\IB_STSL-2ed\IB_STSL-2ed_18\564IB_STSL-2_18.CDR Friday, 5 March 2010 9:22:23 AM PETER

Without using technology, sketch the graphs of:
a y = 2 sinx b y = ¡2 sinx for 0o 6 x 6 360o.
a The amplitude is 2 and the period is 360o.
We place the 5 points as shown and fit the sine wave to them.
b
Without using technology, sketch the graph of y = sin 2xfor 0o 6 x 6 360o. As sin 2x has half the
period of sin x, the
first maximum is at
45o
not 90o
.The period is 360
o
2= 180o.
The maximum values are therefore 180o apart.
Example 2 Self Tutor
Example 1 Self Tutor
2
-2
x
y
90° 180°
270° 360°
y = 2_ xsin_
2
-2
x
y
y = -2 x_sin_
y = 2 x_sin_
90° 180°270° 360°
1
-1
x
y
90° 180°
270° 360°
y = 2xsin_
The amplitude is 2, the period is 360o, and y = ¡2 sinx is the reflection of
y = 2 sinx in the x-axis.
565TRIGONOMETRIC FUNCTIONS (Chapter 18)
² In y = sin bx, b 6= 0, b affects the period and the period is360o
jbj .
The graph of y = sinx is horizontally stretched if 0 < jbj < 1, or compressed if
jbj > 1, to obtain the graph of y = sin bx.
We call this a horizontal dilation.
If b < 0 the graph is also reflected in the x-axis.
IB_STSL-2edmagentacyan yellow black
0 05 5
25
25
75
75
50
50
95
95
100
100 0 05 5
25
25
75
75
50
50
95
95
100
100
Y:\HAESE\IB_STSL-2ed\IB_STSL-2ed_18\565IB_STSL-2_18.CDR Monday, 15 February 2010 10:14:43 AM PETER

THE FAMILY = sinx +cINVESTIGATION 3 y
GRAPHING
PACKAGE
566 TRIGONOMETRIC FUNCTIONS (Chapter 18)
EXERCISE 18B.1
1 Without using technology, sketch the graphs of the following for 0o 6 x 6 360o:
a y = 3 sinx b y = ¡3 sinx c y = 3
2sinx d y = ¡3
2sinx
2 Without using technology, sketch the graphs of the following for 0o 6 x 6 540o:
a y = sin 3x b y = sin¡x
2
¢c y = sin(¡2x)
3 State the period of:
a y = sin 4x b y = sin(¡4x) c y = sin¡x
3
¢d y = sin(0:6x)
4 Find b given that the function y = sin bx, b > 0 has period:
a 900o b 120o c 2160o
What to do:
1 Use technology to graph on the same set of axes:
a y = sinx and y = sinx+ 3
b y = sinx and y = sinx¡ 2
2 For each of y = sinx, y = sinx+ 3 and y = sinx¡ 2:
a record the maximum and minimum values
b calculate the equation of the principal axis
c state the period and amplitude.
3 Explain the connection between the graphs of y = sinx and y = sinx+ c.
From Investigation 3 we observe that the graph of y = sinx+ c has the same shape as the
graph of y = sinx, but it is shifted up or down depending on the sign of c. We say:
y = sinx+ c is a vertical translation of y = sinx through c units.
Its principal axis has equation y = c.
On the same set of axes graph for 0 6 x 6 720o: y = sinx and y = sinx¡ 1
Example 3 Self Tutor
1
-1
-2
-1
-1
-1
-1
x
y
180° 360° 540° 720°
y = x - 1sin_
y = xsin_
principal axis
IB_STSL-2edmagentacyan yellow black
0 05 5
25
25
75
75
50
50
95
95
100
100 0 05 5
25
25
75
75
50
50
95
95
100
100
Y:\HAESE\IB_STSL-2ed\IB_STSL-2ed_18\566IB_STSL-2_18.CDR Monday, 15 February 2010 10:20:19 AM PETER
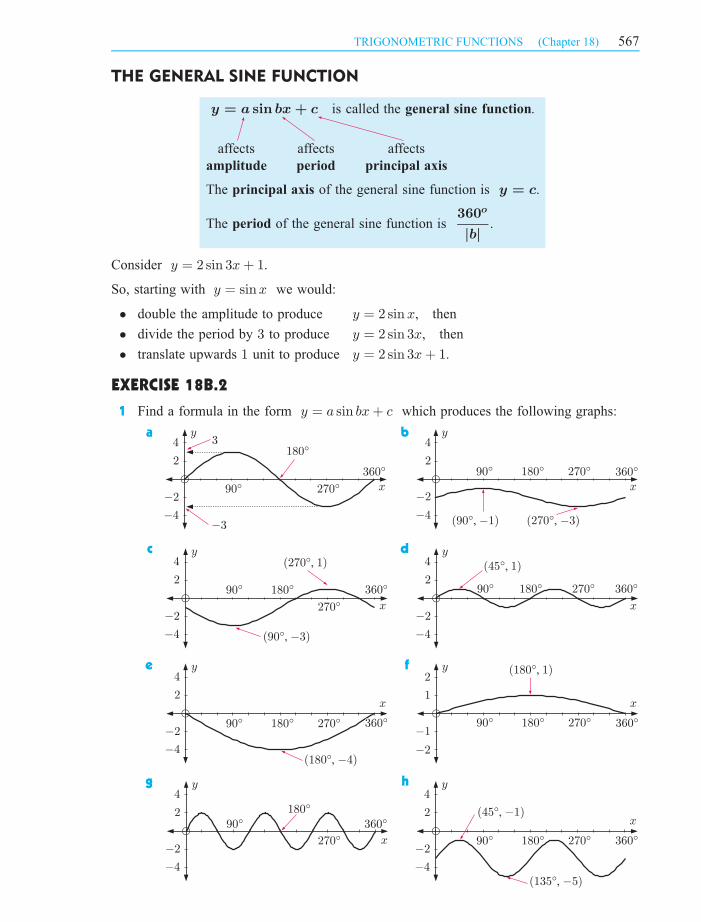
THE GENERAL SINE FUNCTION
Consider y = 2 sin 3x+ 1.
So, starting with y = sinx we would:
² double the amplitude to produce y = 2 sinx, then
² divide the period by 3 to produce y = 2 sin 3x, then
² translate upwards 1 unit to produce y = 2 sin 3x+ 1.
EXERCISE 18B.2
1 Find a formula in the form y = a sin bx+ c which produces the following graphs:
a b
c d
e f
g h
4
2
-2
-4
y
x360°360°
270°270°
180°180°
90°90°
3
-3
4
2
-2
-4
y
x
360°360°
270°270°
180°180°90°90°
(90°, -3)
(270°, 1) 4
2
-2
-4
y
x
360°360°270°180°90°
(45°, 1)
270°270°180°180°90°90°
4
2
-2
-4
y
x
360°360°
(180°, -4)
270°270°180°180°90°90°
2
-2
y
x
360°360°
(180°, 1)
-1
1
4
2
-2
-4
y
x
360°360°270°270°180°180°90°90°
(45°, -1)
(135°, -5)
y = a sin bx+ c is called the general sine function.
affects
amplitude
affects
period
affects
principal axis
The principal axis of the general sine function is y = c.
The period of the general sine function is360o
jbj.
567TRIGONOMETRIC FUNCTIONS (Chapter 18)
4
2
-2
-4
y
x
360°360°
270°270°
180°180°90°90°
4
2360°
y
x
270°270°180°180°90°90°
(90°, -1) (270°, -3)
-2
-4
IB_STSL-2edmagentacyan yellow black
0 05 5
25
25
75
75
50
50
95
95
100
100 0 05 5
25
25
75
75
50
50
95
95
100
100
Y:\HAESE\IB_STSL-2ed\IB_STSL-2ed_18\567IB_STSL-2_18.CDR Tuesday, 16 February 2010 10:24:52 AM PETER

COSINE FUNCTIONSINVESTIGATION 4
2 Without using technology, sketch the graphs of the following for 0o 6 x 6 360o:
a y = sinx+ 1 b y = sinx¡ 2 c y = 1¡ sinx
d y = 2 sinx¡ 1 e f
Click on the icon to obtain printable graph paper for the above question.
We return to the Ferris wheel to see the cosine
function being generated.
Click on the icon to inspect a simulation of the
view from above the wheel.
The graph being generated over time is a cosine
function.
This is no surprise as cos µ =d
10and so
d = 10 cos µ.
The graph alongside shows the horizontal
displacement of the light on the Ferris
wheel over time.
The cosine curve y = cosx, like the
sine curve y = sinx, has a period of
360o, an amplitude of 1, and its range is
¡1 6 y 6 1.
Use your graphics calculator
or graphing package to check
these features.
In this investigation we consider families of cosine functions
in the same way we did for sine functions. If you are using
your graphics calculator, make sure it is set to degrees mode.
What to do:
1 Use technology to graph on the same set of axes:
a y = cosx and y = 2cosx b y = cosx and y = 0:5 cosx
c y = cosx and y = ¡ cosx
2 For each of y = cosx, y = 2cosx, y = 0:5 cosx, y = ¡ cosx:
a record the maximum and minimum values
b state the period and amplitude.
3
THE COSINE FUNCTIONC
GRAPH
PAPER
DEMO
GRAPHING
PACKAGE
10
d
y
xq
10
-10
50
time (s)
horizontal displacement (m)
100
GRAPHING
PACKAGETI- spiren
TI-84
Casio
Describe the effect of a in the function y = a cosx.
568 TRIGONOMETRIC FUNCTIONS (Chapter 18)
y = sin 3x+ 1 y = 1¡ sin 2x
IB_STSL-2edmagentacyan yellow black
0 05 5
25
25
75
75
50
50
95
95
100
100 0 05 5
25
25
75
75
50
50
95
95
100
100
Y:\HAESE\IB_STSL-2ed\IB_STSL-2ed_18\568IB_STSL-2_18.CDR Friday, 5 March 2010 9:24:47 AM PETER

2
1
-1
-2
x
yy = 2 2x_cos_
90° 180° 270° 360°
TRIGONOMETRIC FUNCTIONS (Chapter 18) 569
4 State the amplitude of:
a y = 3cosx b y =p7 cosx c y = ¡2 cosx
5 Use technology to graph on the same set of axes:
a y = cosx and y = cos 2x b y = cosx and cos(12x)
6 For each of y = cosx, y = cos 2x, y = cos(12x), y = cos(¡2x):
a record the maximum and minimum values
b state the period and amplitude.
7 Describe the effect of b in the function y = cos bx.
8 State the period of:
a y = cos 3x b y = cos(13x) c y = cos(1:2x)
d y = cos(¡x) e y = cos(¡3x) f y = cos bx
9 Use technology to graph on the same set of axes:
a y = cosx and y = cosx+ 3 b y = cosx and y = cosx¡ 2
10 For each of y = cosx, y = cosx+ 3 and y = cosx¡ 2:
a record the maximum and minimum values
b find the equation of the principal axis
c state the period and amplitude.
11 Explain the connection between the graphs of y = cosx and y = cosx+ c.
You should have observed that:
² in y = a cosx, jaj determines the amplitude
² in y = cos bx, b affects the period and the period is360o
jbj² in y = sinx+ c, c affects the principal axis.
Without using technology, sketch the graph of y = 2 cos 2x for 0o 6 x 6 360o.
a = 2, so the amplitude is j2j = 2.
b = 2, so the period is
360o
jbj =360o
2= 180o.
Example 4 Self Tutor
IB_STSL-2edmagentacyan yellow black
0 05 5
25
25
75
75
50
50
95
95
100
100 0 05 5
25
25
75
75
50
50
95
95
100
100
Y:\HAESE\IB_STSL-2ed\IB_STSL-2ed_18\569IB_STSL-2_18.CDR Monday, 15 February 2010 10:33:31 AM PETER

EXERCISE 18C
1 Given the graph of y = cosx,
sketch the graphs of:
a y = cosx+ 2 b y = cosx¡ 1 c y = 2
3cosx
d y = 3
2cosx e y = ¡ cosx f y = cos 2x
g y = cos¡x
2
¢h y = 3cos 2x
2 Without graphing them, state the periods of:
a y = cos 3x b y = cos¡x
3
¢c y = cos
¡x
2
¢
3 The general cosine function is y = a cos bx+ c.
State the geometrical significance of a, b and c.
4 For the following graphs, find the cosine function representing them:
a b c
When patterns of variation can be identified and quantified in terms of a formula or equation,
predictions may be made about behaviour in the future. Examples of this include tidal
movement which can be predicted many months ahead, and the date of a future full moon.
In this section we use sine and cosine functions to model certain biological and physical
phenomena that are periodic in nature.
MEAN MONTHLY TEMPERATURE
Consider again the mean monthly maximum temperature for Cape Town:
Month Jan Feb Mar Apr May Jun Jul Aug Sep Oct Nov Dec
Temp (oC) 28 27 251
222 181
216 15 16 18 211
224 26
y
x
-5
55
180°
y11
-1
x-180° 180°
360°-360°
-2-2
2
y
x360°
3
11
y
x360° 720°
D MODELLING USING SINE
AND COSINE FUNCTIONS
570 TRIGONOMETRIC FUNCTIONS (Chapter 18)
GRAPH
PAPER
IB_STSL-2edmagentacyan yellow black
0 05 5
25
25
75
75
50
50
95
95
100
100 0 05 5
25
25
75
75
50
50
95
95
100
100
Y:\HAESE\IB_STSL-2ed\IB_STSL-2ed_18\570IB_STSL-2_18.CDR Tuesday, 16 February 2010 10:26:07 AM PETER

EXERCISE 18D
1 At the Mawson base in Antarctica, the mean monthly temperatures for the last 30 years
are as follows:
Month Jan Feb Mar Apr May Jun July Aug Sept Oct Nov Dec
Temperature (oC) 0 ¡4 ¡10 ¡15 ¡16 ¡17 ¡18 ¡19 ¡17 ¡13 ¡6 ¡1
Find a cosine model for this data without using technology.
2 Some of the largest tides in the world are observed in Canada’s Bay of Fundy. The
difference between high and low tides is 14 metres and the average time difference
between high tides is about 12:4 hours.
t (months)
T (°C)
0
10
20
30
40
Jan JanMar MarMay MayJul JulSep SepNov Nov
0
10
20
30
40
Jan JanMar MarMay MayJul JulSep SepNov Nov
T (°C)
t (months)
571TRIGONOMETRIC FUNCTIONS (Chapter 18)
a Find a sine model for the height of the tide H in terms of the time t hours after
mean tide.
b Sketch the graph of the model over one period.
The graph over a two year period is shown below:
Since the maximum is at the start of the year, we attempt to model this data using the general
cosine function y = a cos bx+ c, or in this case T = a cos bt+ c.
The period is 12 months, so360o
jbj = 12 months.
) b =360o
12= 30o per month.
The amplitude =max ¡ min
2¼ 28¡ 15
2¼ 6:5, so a ¼ 6:5 :
The principal axis is midway between the maximum and minimum,
so c ¼ 28 + 15
2¼ 21:5 .
So, the model is T ¼ 6:5 cos(30t) + 21:5 and is superimposed on the graph which follows:
IB_STSL-2edmagentacyan yellow black
0 05 5
25
25
75
75
50
50
95
95
100
100 0 05 5
25
25
75
75
50
50
95
95
100
100
Y:\HAESE\IB_STSL-2ed\IB_STSL-2ed_18\571IB_STSL-2_18.CDR Tuesday, 16 March 2010 3:02:39 PM PETER
572 TRIGONOMETRIC FUNCTIONS (Chapter 18)
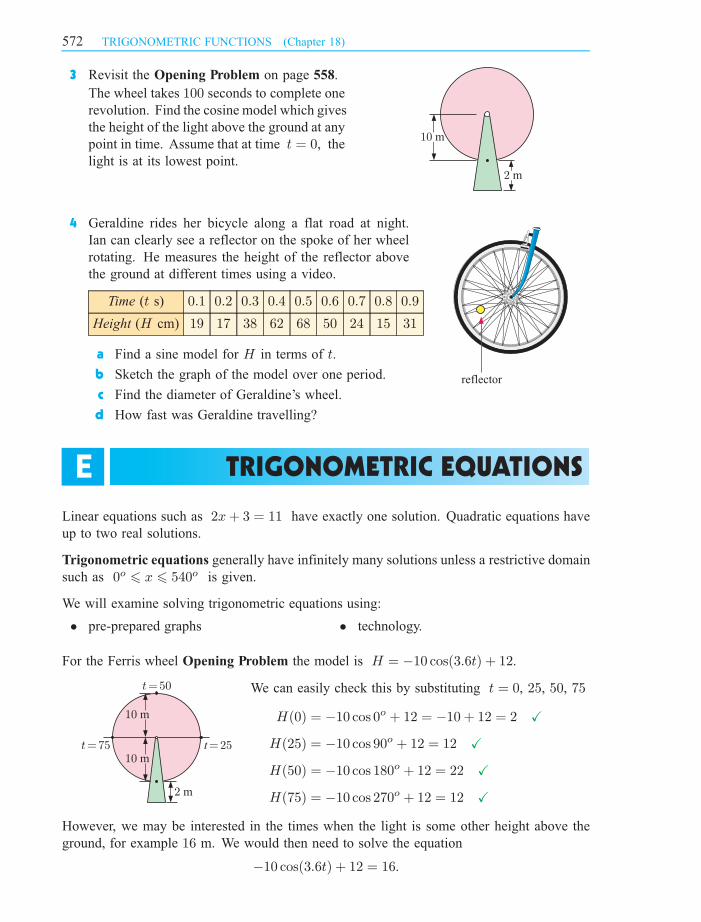
3 Revisit the Opening Problem on page 558.
The wheel takes 100 seconds to complete one
revolution. Find the cosine model which gives
the height of the light above the ground at any
point in time. Assume that at time t = 0, the
light is at its lowest point.
4 Geraldine rides her bicycle along a flat road at night.
Ian can clearly see a reflector on the spoke of her wheel
rotating. He measures the height of the reflector above
the ground at different times using a video.
Time (t s) 0:1 0:2 0:3 0:4 0:5 0:6 0:7 0:8 0:9
Height (H cm) 19 17 38 62 68 50 24 15 31
a Find a sine model for H in terms of t.
b Sketch the graph of the model over one period.
c Find the diameter of Geraldine’s wheel.
d How fast was Geraldine travelling?
Linear equations such as 2x+ 3 = 11 have exactly one solution. Quadratic equations have
up to two real solutions.
Trigonometric equations generally have infinitely many solutions unless a restrictive domain
such as 0o 6 x 6 540o is given.
We will examine solving trigonometric equations using:
² pre-prepared graphs ² technology.
For the Ferris wheel Opening Problem the model is H = ¡10 cos(3:6t) + 12.
We can easily check this by substituting t = 0, 25, 50, 75
H(0) = ¡10 cos 0o + 12 = ¡10 + 12 = 2 X
H(25) = ¡10 cos 90o + 12 = 12 X
H(50) = ¡10 cos 180o + 12 = 22 X
H(75) = ¡10 cos 270o + 12 = 12 X
However, we may be interested in the times when the light is some other height above the
ground, for example 16 m. We would then need to solve the equation
¡10 cos(3:6t) + 12 = 16.
TRIGONOMETRIC EQUATIONSE
2 m
10 m
reflector
2 m
10 m
10 m
t = 75� � t� �= 25
t = 50� �
IB_STSL-2edmagentacyan yellow black
0 05 5
25
25
75
75
50
50
95
95
100
100 0 05 5
25
25
75
75
50
50
95
95
100
100
Y:\HAESE\IB_STSL-2ed\IB_STSL-2ed_18\572IB_STSL-2_18.CDR Monday, 15 February 2010 12:03:56 PM PETER

TRIGONOMETRIC FUNCTIONS (Chapter 18) 573
GRAPHICAL SOLUTION OF TRIGONOMETRIC EQUATIONS
Sometimes simple trigonometric graphs are available on grid paper. In such cases we can
estimate solutions straight from the graph.
For example, we could use a graph to find approximate solutions for trigonometric equations
such as cosx = 0:4 for 0o 6 x 6 540o.
y = 0:4 meets y = cosx at A, B and C.
Hence, to the nearest degree, x ¼ 66o, 294o or 426o.
So, the solutions of cosx = 0:4 for 0o 6 x 6 540o are 66o, 294o and 426o.
EXERCISE 18E.1
1
Use the graph of y = sinx to find, correct to the nearest 5o, the solutions of:
a sinx = 0:3 for 0o 6 x 6 720o b sinx = ¡0:4 for 180o 6 x 6 360o.
1
-1
x
y
A B C
y = xcos_
y = 0.4
90°
180°
270°
360°
450°
540°
-1-1
-0.5-0.5
0.50.5
11
y
x
y = xsin_y = xsin_
100°100° 200°200° 300°300° 400°400° 500°500° 600°600° 700°700° 800°800°
IB_STSL-2edmagentacyan yellow black
0 05 5
25
25
75
75
50
50
95
95
100
100 0 05 5
25
25
75
75
50
50
95
95
100
100
Y:\HAESE\IB_STSL-2ed\IB_STSL-2ed_18\573IB_STSL-2_18.CDR Tuesday, 16 February 2010 10:34:58 AM PETER

GRAPHING
PACKAGE
574 TRIGONOMETRIC FUNCTIONS (Chapter 18)
2
a cosx = 0:6, 0o 6 x 6 720o b cosx = ¡0:3, 180o 6 x 6 540o.
3
Use the graph of y = sin 2x to find, correct to the nearest 5o, the solutions of:
a sin 2x = 0:7, 0o 6 x 6 540o b sin 2x = ¡0:3, 0o 6 x 6 540o.
SOLVING TRIGONOMETRIC EQUATIONS USING TECHNOLOGY
Trigonometric equations may be solved using either a graphing package or a
graphics calculator.
When using a graphics calculator make sure that the mode is set to degrees.
Solve sinx = 0:3 for 0o 6 x 6 360o.
We graph the functions Y1 = sinX and Y2 = 0:3 on the same set of axes.
We need to use view-window settings just larger than the domain.
In this case, Xmin = ¡30o, Xmax = 390o, Xscale = 30o:
Example 5 Self Tutor
-1-1
-0.5-0.5
0.50.5
11
y
x
y = xsin_2y = xsin_2
100°100° 200°200° 300°300° 400°400° 500°500° 600°600° 700°700° 800°800°
-1-1
-0.5-0.5
0.50.5
11
x
yy = xcos_y = xcos_
100°100° 200°200° 300°300° 400°400° 500°500° 600°600° 700°700° 800°800°
Use the graph of y = cosx to find, correct to the nearest 5o, the solutions of:
IB_STSL-2edmagentacyan yellow black
0 05 5
25
25
75
75
50
50
95
95
100
100 0 05 5
25
25
75
75
50
50
95
95
100
100
Y:\HAESE\IB_STSL-2ed\IB_STSL-2ed_18\574IB_STSL-2_18.CDR Tuesday, 16 February 2010 10:31:00 AM PETER

3
-3
3 66 9
noon
15 1818 21 2424
A Bh(t)
t1212
TRIGONOMETRIC FUNCTIONS (Chapter 18) 575
The grid facility on the graphics calculator can
also be helpful, particularly when a sketch is
required.
Using the appropriate function on the calculator
gives the solutions x ¼ 17:5o, 163o.
EXERCISE 18E.2
1 Solve each of the following for 0o 6 x 6 360o:
a sinx = 0:414 b sinx = ¡0:673 c cosx = 1:289
d sin(2x) = 0:162 e cos³x2
´= 0:606 f sin
µ2x
3
¶= 0:9367
In this section we apply our knowledge of trigonometric functions and equations to different
modelling situations.
The height h(t) metres of the tide above mean sea level on January 24th at Cape Town
is modelled approximately by h(t) = 3 sin (30t) where t is the number of hours after
midnight.
a Graph y = h(t) for 0 6 t 6 24.
b When is high tide and what is the maximum height?
c What is the height at 2 pm?
d If a ship can cross the harbour provided the tide is at least 2 m above mean sea
level, when is crossing possible on January 24?
a h(t) = 3 sin (30t) has period =360
30= 12 hours and h(0) = 0
b High tide is at 3 am and 3 pm. The maximum height is 3 m above the mean as
seen at points A and B.
USING TRIGONOMETRIC MODELSF
Example 6 Self Tutor
IB_STSL-2edmagentacyan yellow black
0 05 5
25
25
75
75
50
50
95
95
100
100 0 05 5
25
25
75
75
50
50
95
95
100
100
Y:\HAESE\IB_STSL-2ed\IB_STSL-2ed_18\575IB_STSL-2_18.CDR Monday, 15 February 2010 1:49:58 PM PETER

32
-3
3 66 9 1212 15 1818 21 2424
A B(14, 2.60)h(t)
tt1 t3t2 t4
h = 2
576 TRIGONOMETRIC FUNCTIONS (Chapter 18)
c At 2 pm, t = 14 and h(14) = 3 sin (30£ 14) ¼ 2:60 m
So, the tide is 2:6 m above the mean.
d
We need to solve h(t) = 2, so 3 sin (30t) = 2:
Using a graphics calculator with Y1 = 3 sin (30X) and Y2 = 2
we obtain t1 = 1:39, t2 = 4:61, t3 = 13:39, t4 = 16:61
Now 1:39 hours = 1 hour 23 minutes, and so on.
So, the ship can cross between 1:23 am and 4:37 am or 1:23 pm and 4:37 pm.
EXERCISE 18F
1 The population of grasshoppers after t weeks where 0 6 t 6 12 is estimated by
P (t) = 7500 + 3000 sin (90t).
a Find: i the initial estimate ii the estimate after 5 weeks.
b What is the greatest population size over this interval and when does it occur?
c When is the population: i 9000 ii 6000?
d During what time interval(s) does the population size exceed 10 000?
2 The model for the height of a light on a Ferris wheel is H(t) = 20 ¡ 19 sin (120t),where H is the height in metres above the ground, and t is in minutes.
a Where is the light at time t = 0?
b At what time is the light at its lowest in the first revolution of the wheel?
c How long does the wheel take to complete one revolution?
d Sketch the graph of the function H(t) over one revolution.
3 The population of water buffalo is given by
P (t) = 400 + 250 sin (90t) where t is the number
of years since the first estimate was made.
a What was the initial estimate?
b What was the population size after:
i 6 months ii two years?
c Find P (1). What is the significance of this value?
d Find the smallest population size and when it first
occurred.
e Find the first time when the herd exceeded 500.
IB_STSL-2edmagentacyan yellow black
0 05 5
25
25
75
75
50
50
95
95
100
100 0 05 5
25
25
75
75
50
50
95
95
100
100
Y:\HAESE\IB_STSL-2ed\IB_STSL-2ed_18\576IB_STSL-2_18.CDR Monday, 15 February 2010 1:50:44 PM PETER

REVIEW SET 18A
TRIGONOMETRIC FUNCTIONS (Chapter 18) 577
4 Over a 28 day period, the cost per litre of petrol was modelled by
C(t) = 9:2 cos(25:7t) + 107:8 cents L¡1.
a True or false?
i “The cost per litre oscillates about 107:8 cents with maximum price $1:17.”
ii “Every 14 days, the cycle repeats itself.”
b What was the cost of petrol on day 4, to the nearest tenth of a cent per litre?
c On what days was the petrol priced at $1:10 per litre?
d What was the minimum cost per litre and when did it occur?
1 For each set of data below, draw a scatterplot and state if the data exhibits
approximately periodic behaviour.
a x 0 1 2 3 4 5 6 7 8 9 10 11 12
y 2:7 0:8 ¡1:7 ¡3 ¡2:1 0:3 2:5 2:9 1:3 ¡1:3 ¡2:9 ¡2:5 ¡0:3
b x 0 1 2 3 4 5 6 7 8 9
y 5 3:5 6 ¡1:5 4 ¡2:5 ¡0:8 0:9 2:6 4:3
2 Draw the graph of y = 4 sinx for 0o 6 x 6 360o.
3 State the minimum and maximum values of:
a y = 1 + sinx b y = ¡2 cos(3x)
c y = 5 sinx¡ 3 d y = 1
3cosx+ 1
4
Use the graph of y = cosx to find, correct to the nearest 5o, solutions of:
a cosx = ¡0:4, 0o 6 x 6 720o b cosx = 0:9, 0o 6 x 6 540o
5 Use technology to solve for 0o 6 x 6 360o:
a cosx = 0:3 b 2 sin(3x) =p2 c 43 + 8 sinx = 50:1
-1-1
-0.5-0.5
0.50.5
11
x
yy = xcos_y = xcos_
100°100° 200°200° 300°300° 400°400° 500°500° 600°600° 700°700° 800°800°
IB_STSL-2edmagentacyan yellow black
0 05 5
25
25
75
75
50
50
95
95
100
100 0 05 5
25
25
75
75
50
50
95
95
100
100
Y:\HAESE\IB_STSL-2ed\IB_STSL-2ed_18\577IB_STSL-2_18.cdr Friday, 5 March 2010 9:26:13 AM PETER
REVIEW SET 18B
578 TRIGONOMETRIC FUNCTIONS (Chapter 18)
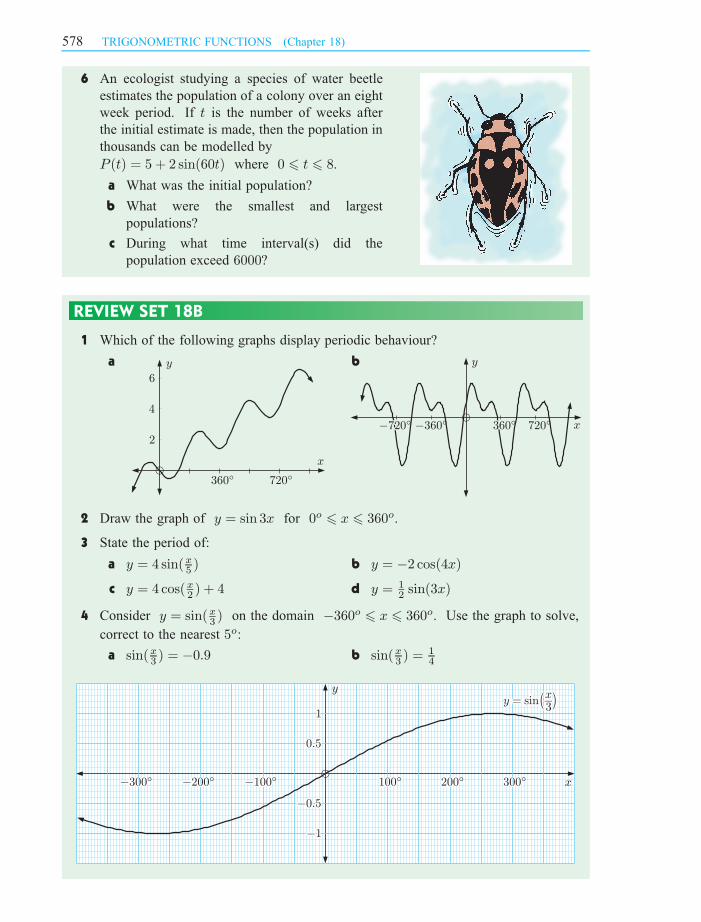
6 An ecologist studying a species of water beetle
estimates the population of a colony over an eight
week period. If t is the number of weeks after
the initial estimate is made, then the population in
thousands can be modelled by
P (t) = 5 + 2 sin(60t) where 0 6 t 6 8.
a What was the initial population?
b What were the smallest and largest
populations?
c During what time interval(s) did the
population exceed 6000?
1 Which of the following graphs display periodic behaviour?
a b
2 Draw the graph of y = sin 3x for 0o 6 x 6 360o.
3 State the period of:
a y = 4 sin(x5) b y = ¡2 cos(4x)
c y = 4cos(x2) + 4 d y = 1
2sin(3x)
4 Consider y = sin(x3) on the domain ¡360o 6 x 6 360o. Use the graph to solve,
correct to the nearest 5o:
a sin(x3) = ¡0:9 b sin(x
3) = 1
4
x
720°360°
6
4
2
y
-360-360°-720-720° 360360° 720720° x
y
-1-1
-0.5-0.5
0.50.5
11
-300-300° -200-200° -100-100° 100100° 200200° 300300°
y
x
xy = sin_&^*3
xy = sin_&^*3
IB_STSL-2edmagentacyan yellow black
0 05 5
25
25
75
75
50
50
95
95
100
100 0 05 5
25
25
75
75
50
50
95
95
100
100
Y:\HAESE\IB_STSL-2ed\IB_STSL-2ed_18\578IB_STSL-2_18.cdr Tuesday, 16 February 2010 10:32:29 AM PETER

REVIEW SET 18C
TRIGONOMETRIC FUNCTIONS (Chapter 18) 579
5 On the same set of axes, for the domain 0o 6 x 6 360o, sketch:
a y = cosx and y = cosx¡ 3 b y = cosx and y = ¡1
2cosx
c y = sinx and y = 3 sin(2x) d
6 A robot on Mars records the temperature every Mars day. A summary series, showing
every one hundredth Mars day, is shown in the table below.
Number of
Mars days0 100 200 300 400 500 600 700 800 900 1000 1100 1200 1300
Temp. (oC) ¡43 ¡15 ¡5 ¡21 ¡59 ¡79 ¡68 ¡50 ¡27 ¡8 ¡15 ¡70 ¡78 ¡68
a Find the maximum and minimum temperatures recorded by the robot.
b Find a sine model for the temperature T in terms of the number of Mars days d.
c Use this information to estimate the length of a Mars year.
1 For each of the following functions, find the:
i amplitude ii vertical translation.
a y = 2 sinx+ 1 b f(x) = ¡3 cosx+ 1
2c g(x) = sin(4x)¡ 5
2 a Without using technology, draw the graph of f(x) = sin(x3) + 2.
b For what values of k will f(x) = k have solutions?
3 Find the cosine function represented in the following graphs:
a b
4 Use technology to solve for 0o 6 x 6 1000o:
a sinx = 0:382 b cos(x2) = ¡0:458
5 For the following graphs, state the:
i equation of the principal axis ii amplitude iii period
a b
1
90°
y
x
33
y
x360°
4
22
11
-1-1
-2-2
-3-3
-360° 360° 720° x
y6
4
2
-2360°360°
x
y
180°180°
y = cosx and y = 2 cos(x2) + 3
IB_STSL-2edmagentacyan yellow black
0 05 5
25
25
75
75
50
50
95
95
100
100 0 05 5
25
25
75
75
50
50
95
95
100
100
Y:\HAESE\IB_STSL-2ed\IB_STSL-2ed_18\579IB_STSL-2_18.cdr Friday, 5 March 2010 9:27:45 AM PETER

580 TRIGONOMETRIC FUNCTIONS (Chapter 18)
6 In an industrial city, the amount of pollution
in the air becomes greater during the working
week when factories are operating, and lessens
over the weekend. The number of milligrams
of pollutants in a cubic metre of air is given by
P (t) = 40¡ 12 sin(51:4t)
where t is the number of days after midnight
on Saturday night.
a What is the minimum level of pollution?
b At what time during the week does this minimum level occur?
IB_STSL-2edmagentacyan yellow black
0 05 5
25
25
75
75
50
50
95
95
100
100 0 05 5
25
25
75
75
50
50
95
95
100
100
Y:\HAESE\IB_STSL-2ed\IB_STSL-2ed_18\580IB_STSL-2_18.cdr Monday, 15 February 2010 2:34:19 PM PETER