Trifast plc · 62 n otes (forming part of the Financial Statements) IBC Company Details and...
108
“Leaders in the world of fasteners for over 35 years, literally holding together the products we know” ANNUAL REPORT 2010
Transcript of Trifast plc · 62 n otes (forming part of the Financial Statements) IBC Company Details and...

17989 05/08/2010 Proof7 17989 05/08/2010 Proof7
“Leaders in the world offasteners for over 35 years,literally holding togetherthe products we know”
AnnuAl RepoRt 2010trifast House, Bellbrook park, uckfield, east Sussex, tn22 1QW tel: +44 (0)1825 747366 Fax: +44 (0)1825 747368
to find out more about our business please visit:
www.trifast.com
Ft Sector: Industrial engineering ticker Code: tRI.l
Trifast plc A
nn
uA
l RepoRt 2010

17989 05/08/2010 Proof7 17989 05/08/2010 Proof7
40 Directors’ Report 42 Corporate Social Responsibility 44 Corporate Governance 47 Directors’ Remuneration Report 50 notes to the Directors’ Remuneration Report 53 Statement of Directors’ Responsibilities 54 Independent Auditors’ Report 55 Consolidated Income Statement 56 Statements of Comprehensive Income 57 Consolidated Statements of Changes in equity 58 Company Statements of Changes in equity 59 Statements of Financial position 60 Statements of Cash Flows 62 notes (forming part of the Financial Statements) IBC Company Details and Advisers
Financial Reporting and Governance
“three-pronged strategy playing a key role in the tR recovery story — focusing on things we can influence”
17 the Business 18 trifast Board of Directors 20 Management Structure 22 the trifast Culture 24 Reasons Why our Customers Choose us 26 trifast in Asia 29 Global Sales 31 Change Management 33 Marketing team 35 Finance team — Supporting global operations 36 Your questions answered
1 letter from the Chairman 3 Review of 2010 4 “phase 1” Delivered 5 Business Review 12 Finance ReviewYear Under Review
Inside Trifast
Company Details
ADVISERS
Registered AuditorsKpMG Audit plc
1 Forest Gate, Brighton Road, Crawley,
West Sussex, RH11 9pt
Corporate StockbrokerArden partners plc
125 old Broad Street,
london, eC2n 1AR
Merchant Bank and Financial AdviserRothschild
new Court, St Swithins lane,
london, eC4p 4Du
SolicitorsCharles Russell, llp
Compass House, lypiatt Road, Cheltenham,
Gloucestershire, Gl50 2QJ
RegistrarsComputershare Investor Services plC
the pavilions, Bridgwater Road,
Bristol, BS13 8Ae
Financial PR AdviserCitigate Dewe Rogerson
1 Wrens Court, lower Queen Street,
Birmingham, B72 1Rt
TRIFAST plcIncorporated in the united Kingdom
Head Office and Registered Officetrifast House, Bellbrook park, uckfield,
east Sussex, tn22 1QW
telephone: +44 (0)1825 747366
Facsimile: +44 (0)1825 747368
Registered number 1919797
e-mail: [email protected]
Website: www.trifast.com
Audit Committeeneil Chapman (Chairman)
Jonathan Shearman
Remuneration CommitteeJonathan Shearman (Chairman)
neil Chapman
Nominations CommitteeMalcolm Diamond
Jim Barker
neil Chapman
Jonathan Shearman

1www.trifast.com
17989 05/08/2010 Proof7
Trifast House
Bellbrook Park, Uckfield
East Sussex, TN22 1QW
United Kingdom
Tel: +44 (0)1825 747200
ISO 9001 : 2008FM00079
Trifast House
Bellbrook Park, Uckfield
East Sussex, TN22 1QW
United Kingdom
Tel: +44 (0)1825 747366Trifast House
Bellbrook Park, Uckfield
East Sussex, TN22 1QW
United Kingdom
Tel: +44 (0)1825 747200
ISO 9001 : 2008FM00079
Report for the year ended March 2010
As you may naturally expect, a great deal of change has been implemented within Trifast since my first letter to you only a year ago, details of which are explained fully in this publication.
Clearly, our main tasks in 2009 after the new Board was put in place in March 2009 were to ensure financial survival, to remove unproductive and wasteful costs and to preserve the main assets of our Company as much as possible — especially our staff.
By half-year stage, in September 2009, we were starting to see an improving monthly trend in sales performance plus the emergence of a revised purchasing strategy that would deliver higher volume low cost products into TR during the last quarter of this financial year we are reporting upon.
As stated in our pre-close update, issued on 22 April 2010, every one of our 21 TR global business units made a profit during the last month of the financial year ended March 2010, with total sales revenue for the last month of the year being the highest for 18 months.
The recovering optimism witnessed by our customers together with our implemented “Phase 1” recovery strategy instigated by the Board has seen the Group improve its market positioning significantly by the end of March 2010. The Board and our staff thus had the benefit of seeing the results of their efforts and commitment throughout the toughest year ever seen end on a high, so underpinning our confidence that TR’s recovery can be sustained.
However, this is only the first stage of our road to recovery, with a great deal of work yet to do over the coming months in order to fulfil our objective to return Trifast Shareholder value to an acceptable level.
One critical ingredient for achieving success is to have employees who feel properly valued, and currently, we have now endured two years of a Group-wide pay freeze whilst price inflation continues to escalate again this year. It is the Board’s intention to redress this situation as soon as practicable.
As a Shareholder currently devoid of a dividend, please be assured that the restoration of a yield is one of the key issues in our minds. The Board is keen to address this at the soonest opportunity and once our distributable reserves allow.
Finally, to assist in the next phase of growth across our Global operations and to ensure continuity and implementation of consistent policies across the Group, Trifast announced on 16 June 2010 the following Board appointments:
l Mark Belton appointed Group Finance Directorl Seamus Murphy, Director of Operations, HR and ITl Glenda Roberts, Group Sales Director
As a Board, we believe that Mark, Seamus and Glenda truly represent the TR spirit — their drive, experience and commitment will take us forward and we congratulate not only them and our other Senior appointments recently made but all our staff who have supported us through this very difficult time.
I am confident that TR remains on target with its three-phase strategy and our stated objective, to return the business back to stronger levels of profitability through lean logistics, targeted sales and marketing with on-going margin improvement.
We look forward to reporting on our progress over the next year. Meanwhile, your enduring patience, understanding and support are sincerely and deeply appreciated.
Yours sincerely
Malcolm Diamond MBE
Executive Chairman
Letter from the Chairman

17989 05/08/2010 Proof7
2 Trifast plc Annual Report 20102

17989 05/08/2010 Proof7
3www.trifast.com
Year UnderReview
3
Review of 2010 — Key points
Results ahead of expectation, despite year-on-year FX swing
All 21 business units trading profitably by year end
Return to “sales led” structure
Staff morale restored with a clearer focus already resulting in improved productivity
Broadening leadership skills to drive “Phase 2”
Recovering optimism from customers and key TR sectors
Good start to the current year

17989 05/08/2010 Proof7
4 Trifast plc Annual Report and Accounts 2010
Phase 2
“Phase 1” Delivered
Find out more at www.trifast.com
StatuS
India, Vietnam and China to receive major sales focus
Category ‘C’ items to be sourced through our Chinese office
uK sales structure now directly linked to the two regional business hubs
Create three distinct business divisions:— Branded Products (Global)— transactional & Supply Chain Sales (Global)— Manufacturing & “Factory to Factory” (asia)
Re-establish global sales team & target > £500k pa (product spend) multinationals
Major trading alliances being developed with same sector players
Done
In place: multiple wins secured after none for two years
On-going
Done with on-going support from Singapore
In process 2010
Operational efficiencies to be yielded going forward
PhaSe 1 taRGetS
Building a solid foundation

17989 05/08/2010 Proof7
IntroductionThe recovering optimism initially witnessed in our Q3 period by
customers followed through into Q4 particularly within some of the
sectors we serve. This, together with our implemented “Phase 1”
recovery strategy instigated during the year by the Board has seen
the Group improve its market positioning significantly by the end of
March 2010. As we finished the year, all 21 business units traded
profitably and ahead of management expectations, this underpins our
confidence that TR’s recovery can be sustained.
As we enter the second year since we returned to Trifast in March
2009, it is pleasing to report that our recovery plan is performing
ahead of target. However, as a team, we are well aware of the need
continually to apply ourselves to a further array of improvement
opportunities that have been clearly identified during “Phase 1” of
our turnaround programme.
Key operational targets for year 2010/11 are vendor development,
internal warehousing, logistics and freight, transactional sales
within the UK and Europe as well as HR management (including the
restoration of staff appraisals and management training schedules that
had been abandoned in 2007).
5www.trifast.com
“We are well aware of the need continually to apply ourselves to a further array of improvement opportunities that have been clearly identified during “Phase 1” of our turnaround programme”
Business ReviewJoint Statement — Malcolm Diamond and Jim Barker
To watch Questions and Answers with Jim Barker visit:www.trifast.com

17989 05/08/2010 Proof7
6 Trifast plc Annual Report 2010
The “rebuild strategy”Manufacturing demand for assembly components is increasingly
Asia-centric and the activity in this region clearly demonstrates that an
economic recovery has now arrived in the Far East whilst Europe ticks
over at a steadily increasing rate, with the UK manufacturing presence
regaining momentum. America is gradually showing more activity,
and with Trifast having only a minor market share in the US, there
is increasing opportunity for us to grow the business in this region
going forward, especially as we are gaining a good reputation for TR
Branded Products.
This demand profile provides a clear and simple pointer to our
strategic planning.
Historically, multinationals based in the UK employed local staff who
wanted the reassurance of locally held component supplies along
with local sales and technical support. Being a sales/customer led
organisation, during the nineties, TR successfully established a network
of branches across the UK to satisfy this demand.
The market is different now. Many multinationals, especially in
Scotland, have fled to lower cost countries, plus the present day
sophistication with freight logistics has drastically reduced — even
removed the need to hold stock within a network of localised
warehouses, with current “Best Practice” creating centralised stocking
“hubs” feeding long distance overnight next-day customer deliveries.
We have already benchmarked such systems against successful hub-
based organisations in Sweden and Denmark which serve their network
of Western European mainland customers on a next-day delivery basis
from a single stockholding location.
However, this strategy has to be combined with retaining
knowledgeable sales and technical customer facing personnel placed
geographically local to their existing and potential clients.
Therefore, this removes stock duplication, reduces incoming freight and
packaging costs, warehousing and materials handling costs, simplifies
quality control and enhances the scope for vendor management — and
all without sacrificing customer care and service reaction speed. Key
points include broadening leadership teams and investing in processes
and expertise whilst also continuing to “work smarter” to further
profitability and efficiencies.
It is both rare and motivating in the current economic climate to be
able to implement a cost rationalisation strategy that reduces indirect
costs without the loss of key employees. This is the main element of
“Phase 2” — our “rebuild” year.
This in turn permits us to return to making capital investment within
our Asian manufacturing and distribution facilities.
Business Review continued

17989 05/08/2010 Proof7
7www.trifast.com
Group structureAs we have previously indicated, the Board’s review of the TR Group
business will remain on-going so we not only ensure that we have the
core skills to drive the business forward but that they also accurately
reflect our commercial position.
In the main, the restructuring of our Asian and Mainland Europe
operations is complete, TR’s UK programme remains in progress;
and whilst a number of issues have already been addressed, we
anticipate further consolidation during the current year: these plans
are well advanced and we expect to roll out the initiatives over coming
months.
PeopleThe Trifast Board is keen to acknowledge the enthusiasm and
willingness of the TR teams around the world; they have all embraced
our “continuous improvement” and “working smarter” philosophy in
the key areas of service, supply chain, logistics, pricing and packaging.
In what has been one of the toughest two-year periods for the business,
on behalf of all stakeholders we thank every one of our people for their
hard work and determination to pull this business around and working
with the management towards a sustained recovery.
Our ability to sustain our “continuous improvement” momentum is,
of course, totally dependent on the commitment, energy and focus of
our entire workforce, which to date has been outstanding; however,
with many having to accept a four-day working week during much of
2009 plus a pay freeze for the last two years, it would be irresponsible
of the Board to fail to attempt at least a partial remedy to this
situation during the financial year ending March 2011.
Broadening the skills of the BoardAs Trifast continue its recovery strategy, a key element is to ensure
that the Board is even more operationally focused with Group wide
responsibility and authority in order to implement new initiatives
quickly and consistently.
In order to drive our next phase of growth across our global
operations and to ensure continuity and implementation of consistent
policies across the Group, the Board is making a number of
appointments at both Main Board and Senior Management level:
We welcomed the following to the Main Board with effect from
16 June 2010:
l Mark Belton appointed Group Finance Director
l Seamus Murphy, Director of Operations, HR and IT
l Glenda Roberts, Group Sales Director
Taking on Senior Posts are:
l Roberto Bianchi as Director of Sourcing
l Keith Gibb as Sales Director, TR Branded Products
l Ian Carlton as Director of Quality
The last twelve months have enabled the Main Board to work with
the Management teams around the business and we expect these
appointments to play key roles in driving this business forward in
the future.

17989 05/08/2010 Proof7
8 Trifast plc Annual Report 2010
Business Review continued
Our on-going focus remains on working capital and cash
management; as a result, debt and stock levels continue to reduce,
and at the same time, we have had sufficient scope to allow the Trifast
teams to compete effectively.
Further details of the Group’s banking facilities are contained within
the Finance Review on page 12.
Current tradingThe uplift in Q4 in the year being reported has continued into Q1 of
the current financial year ending March 2011, and we would hope to
report further positive news as we go through the period.
Our focus will remain sales-led with margin improvement, while also
mindful of retaining a tight control on costs and working capital,
reducing debt and continuing the ability to generate cash.
Whilst a growing number of UK manufacturers are enjoying a rise in
demand for their products overseas, in UK markets, we have to be
mindful of the number of external macro-factors which could slow
global and UK economic recovery.
This apart, looking at Trifast, as we have already touched on, trading in
Asia remains buoyant in both manufacturing and in distribution, with
the UK, Europe and the US territories beginning to recover.
We are encouraged with sales daily run-rate and enquiry levels are
higher than for many months. Global sales contracts successfully
secured in the latter part of 2009 are beginning to come on stream
and the focus on key sectors is driving further opportunities. This,
coupled with the on-going optimism of customers from within the key
sectors we serve which include medical equipment, electronics and
automotive, provides a solid foundation for us to remain cautiously
optimistic that Trifast is now positioned for recovery.
SummaryWe anticipate the Group will make further progress during this current
financial year as we implement “Phase 2” of our growth strategy.
The Directors are confident that TR remains on target with its three-
pronged strategy and stated objective of returning the business to
stronger levels of profitability through lean logistics, targeted sales and
marketing with on-going margin improvement.
We look forward to updating shareholders throughout the coming
year on our progress.
To find out more about TR please visit:
www.trifast.com
The Board is mindful of the fact that the Main Board additions stretch
the ratio of Independent Directors (NEDs) to Executives beyond
recommended “Best Practice”. It is considered that, with the high
level of time commitment and support being received from the two
incumbent Independent Directors, the recruitment of a third Director
is not an immediate business priority. Nevertheless, the Board has
agreed to revisit the situation by Q4 of the new financial year.
Financing and banking facilitiesWe believe the banking facilities put in place in the latter part of the
year provide the Company with adequate resources to achieve its
short-term financial objectives and also form an important part of
enabling us to deliver our strategy going forward.

17989 05/08/2010 Proof7
9www.trifast.com
• Focus on key sectors driving opportunities
• Enquiry levels continue to increase
• Encouraged by sales daily run-rate since year end
• Global contract wins beginning to come on stream
• Category ‘C’ products around the Group to be sourced from China
• trading conditions
– all units continue to trade positivelyso underpinning confidence
– asia: buoyant conditions inboth manufacturing and distribution
– uK and Europe: gradually improving
– uS: repositioning business in marketplace beginning to recover
• tR cautiously optimistic that it is positioned for growth
• Broadening skills of both Management Board and Senior Management
• Champion transactional Sales
• Move to centralise vendor management, purchasing & sourcing
• Group marketing and It initiatives to support tR
• Continue to reduce debt
• Look to re-introduce dividend payments
See our people www.trifast.com
“PhaSE 2” taRGEtSMoving forward. . . the year ahead
StatuS aS at junE 2010Quarter One
• Q2 2010
– roll out on-going cost efficiency programme within uK
– focus on retaining key skills
– warehousing & operations integrationin northern Europe in process
– “centres of excellence” established in holland and the uK
• tR asia Group
– capital expenditure approved tosupport growth
– provides a key uSP to tR’s market positioning
– actively supporting Europe and uS tobuild tR’s penetration

17989 05/08/2010 Proof7
10 Trifast plc Annual Report 2010
Business Review continued
SOLutIOn
Competitor price down pressures on logistics systems and implementation creating the risk of losing existing and potential customer revenue
We have benchmarked our operations against several leading logistics providers (within and outside our sector) and have embarked on a comprehensive rationalisation programme to reduce resource duplication within the Group
ChaLLEnGE
Marketplace challenges and trends
the re-established Global sales team coupled with a total re-jig of our purchasing strategy will realistically enable tR to secure a larger market share despite a possible repeated reduction in overall market size. If tR had as much as 1% global market share, even in the midst of further downturn, it would enjoy sales revenue of at least £500 million, so growth aspirations remain legitimate
the threat of the ‘W’ shaped global economic recovery
17989 05/08/2010 Proof7
11www.trifast.com
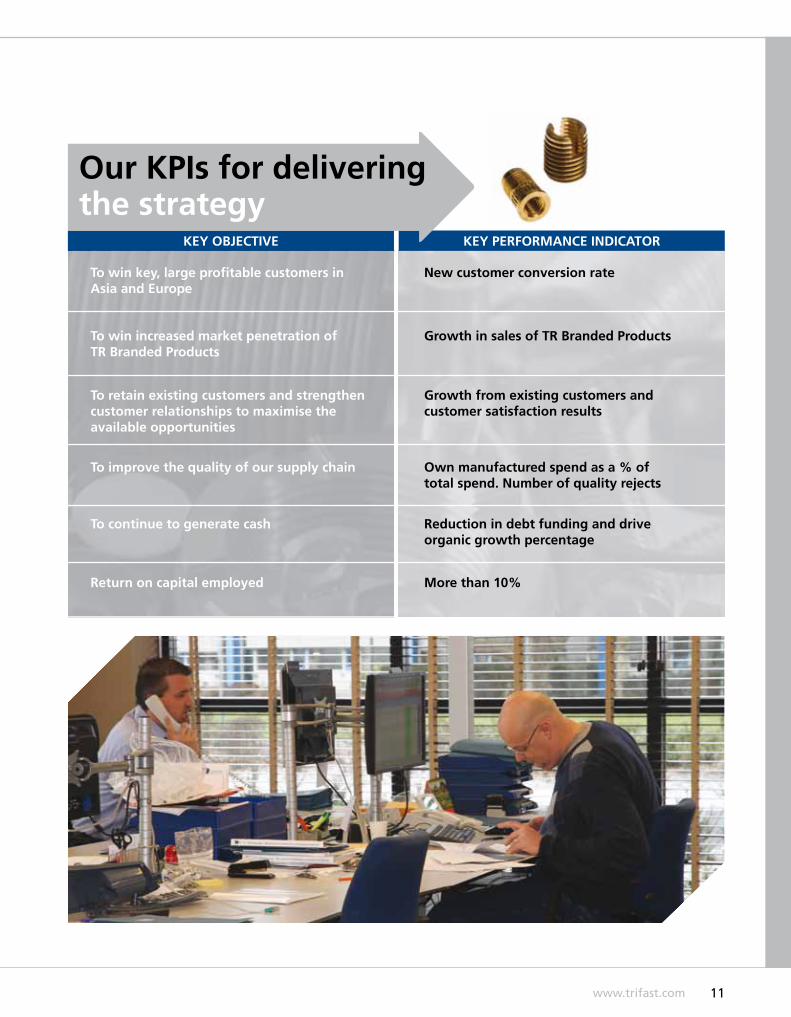
KEy PERFORManCE InDICatOR
to win key, large profitable customers in asia and Europe
new customer conversion rate
KEy OBjECtIVE
Our KPIs for delivering the strategy
Growth in sales of tR Branded Productsto win increased market penetration of tR Branded Products
to retain existing customers and strengthen customer relationships to maximise the available opportunities
Growth from existing customers and customer satisfaction results
to improve the quality of our supply chain Own manufactured spend as a % of total spend. number of quality rejects
to continue to generate cash Reduction in debt funding and drive organic growth percentage
Return on capital employed More than 10%

17989 05/08/2010 Proof7
12 Trifast plc Annual Report 2010
“As a result of the Group’s concerted effort to generate cash, the Board is pleased to show that Net Debt reduced significantly from £8.40 million in 2009 to £4.68 million as at 31 March 2010”
Finance ReviewOverview — Mark Belton, Group Finance Director
An operational review of the year is set out in the Joint Chairman’s
and CEO Statement on page 5.
RevenueAs indicated in our 2010 half-year statement, turnover reached
its lowest point in Q4 2009 (January to March 2009). This level
remained unchanged for the first half of 2010 providing some
degree of stability. Then in H2 2010 we began to see a gradual rise,
in particularly Q4 2010 (Jan ’10–Mar ’10) as demand increased,
reflecting now what we believe to be the underlying usage.
Adjusted pre-tax profit operating marginsTo stem the losses of H2 2009 (Oct ’08–Mar ’09), Management
continued to cut costs and improve efficiencies, thus enabling the
Group to break even during H1 2010. Further rationalisation was
undertaken during H2 2010, primarily in the UK (which had been the
hardest hit by the recession).
As at 31 March 2010 the Board is encouraged in being able to
show an underlying profit figure for the Group of £0.92 million
(2009: £2.54 million). The underlying profit figure is derived before
separately disclosed items as stated below. The Board believes this
profit figure provides a better understanding of the Group’s
underlying performance.
Asia was the first area to see demand increase, followed slowly by
Mainland Europe, then the UK and USA. This was reflected in the
Regional underlying results before Central costs, with Asia showing
an adjusted profit of £2.79 million, whilst the UK and the Rest of the
World lagged behind with adjusted losses of £0.59 million and £0.34
million respectively.
Gross profit margins by the year end stood at 24.4% compared
with 25.3% in 2009. This decrease is due to fixed overheads being
spread over a lower revenue base. However, a clearer picture is shown
when comparing to H2 2009, which had a gross profit margin of
22.8%. This shows an increase of 1.6 percentage points reflecting the
efficiency savings made during the year.www.trifast.com
To watch Questions and Answers with Mark Belton visit:

17989 05/08/2010 Proof7
13www.trifast.com
Results for the yearThe income statement for the year ended 31 March 2010 can be summarised as follows:
H1 H2 Full year Full Year
30.09.09 31.03.10 2010 2009
Continuing operations
Revenue £39.85m £46.09m £85.94m £104.90m
Adjusted EBITDA* £0.59m £1.54m £2.13m £4.55m
Overheads £9.87m £10.29m £20.16m £23.41m
Adjusted pre-tax profit* — £0.92m £0.92m £2.54m
Pre-tax profit/(loss) from continuing operations £0.18m £(2.99)m £(2.81)m £(11.00)m
Operating cash generation £2.25m £1.66m £3.91m £5.91m
Net debt £5.57m £4.68m £4.68m £8.40m
* These figures exclude discontinued operations and take into account the separately disclosed items below, which the management believe
provide a better understanding of the Company’s underlying profit.
Overheads are down by £3.25 million compared to last year based on
the saving initiatives already implemented. If we exclude the foreign
exchange cost swing between the years of £1.07 million, the true
overhead savings were actually £4.32 million.
The Board continues to remain vigilant and review areas where
efficiencies can be made. However, it is mindful that to achieve
ongoing growth further investment will be required.
Separately disclosed itemsThe following items are shown separately in the Income Statement
and need to be taken into consideration to truly understand the
underlying performance of the Group:
(i) Sale of associate £0.33 million
(ii) Restructuring programme (£3.42 million)
(iii) Expense of changing banking facilities (£0.52 million)
Intangible amortisation (£0.26 million)
IFRS 2 credit £0.14 million
(3.73 million)
(i) Sale of associateOn 24 September 2009, the Company sold its 25% shareholding
in the associate undertaking, Techfast Holding Bhd. Techfast is a
Malaysian company, listed on the Kuala Lumpur Stock Exchange.
The sale generated a one-off gain and a positive cash impact of
£0.33 million.
(ii) Restructuring programmePhase 1 of the restructuring programme has been implemented,
totalling £3.42 million in the year. £2.80 million is in relation to
closures and downsizing of sites within the UK. £0.62 million refers to
redundancy/compensation payments, £0.56 million of which relates
to the UK.
The cash effect of the above restructuring costs will total £3.42 million,
£0.63 million of which had been incurred during 2010.

17989 05/08/2010 Proof7
14 Trifast plc Annual Report 2010
Finance Review continued
(iii) Expense of changing banking facilitiesIn February 2010 the Group renegotiated its old banking facilities
and secured new more flexible banking arrangements. The cost of
achieving this was £0.52 million in respect of one-off legal, due
diligence, and bank arrangement fees. £0.30 million of the £0.52
million cash outflow was incurred during 2010.
Interest and interest coverNet interest before one-off financing cost has fallen significantly from
£0.80 million to £0.15 million. This is due to the Group’s lower net
debt levels and reduced interest base rates.
Net interest cover has increased from 5.7 to 14.2 (defined as EBITDA
to net interest, before the one-off separately disclosed items).
Going forward, it is anticipated that finance expenses will increase
as higher banking charges have been agreed as part of the new
banking facilities.
To protect against significant interest rate increases, the Company
has taken out a 3% fixed cap interest rate hedging instrument for
three years.
TaxationOverall there was a tax credit of £0.62 million, ETR 22% (2009: a tax
charge of £0.52 million, ETR 4.7%) in the year. This largely reflects a
deferred tax credit as a result of the increase in the UK’s deferred tax
asset in relation to brought forward losses.
All of the 2010 current tax charge related to overseas operations.
Balance sheet and fundingAt 31 March 2010, total Shareholder equity amounted to
£40.18 million (2009: £42.47 million) a decrease of 5.4%,
reflecting the loss incurred in the period.
Net working capital fell by £3.58 million, largely as a result of the
Group’s reduction in gross stock levels in order in generate cash.
As a result of the Group’s concerted effort to generate cash, the Board
is pleased to show that Net Debt reduced significantly from £8.40
million in 2009 to £4.68 million as at 31 March 2010.
In February 2010 the Group’s banking facilities were changed in order
to provide more security and flexibility. The existing Gross Debt of
£14.82 million was repaid and the overdraft facility of £6.00 million
cancelled; replacing these were a three-year Asset Based Lending facility
of £13.50 million (as at 31 March 2010, £7.22 million was utilised), a
bridging loan of £2.00 million and a term loan of £4.00 million (as at
31 March 2010 the amount outstanding was £4.88 million).
Trading forecasts show that these new facilities provide sufficient
headroom up until the date of renewal. In addition, current forecasts
show that the Group will retain liquidity headroom beyond this date.
However, the Board is keen to renegotiate terms of facilities with the
Bank to provide the Group with more security and flexibility for the
longer term.

17989 05/08/2010 Proof7
15www.trifast.com
As a result of the above changes, Gross debt at 31 March 2010 was
£12.10 million, a reduction of £2.72 million. Overall gearing is down
to 12% (2009: 20%) reflecting the reduced Net Debt position.
The Group’s net cash balances were £7.42 million (2009: £6.42
million), of which £7.81 million was held in foreign currencies (2009:
£6.42 million). As a Group, our policy is, where possible, to hold
the same local currency as the respective local entity. We monitor
exchange rates and buy and sell currencies in order to minimise our
open exposure to foreign exchange rates but remain mindful of
operational requirements. We do not speculate on rates.
Cash flowCash generation is a continual key objective of the Group. Stock
levels have been driven down to an optimum level, but without being
detrimental to the business.
Cash generated from operations was £3.91 million before tax (2009:
£5.91 million). However, during the year, cash paid out on one-off
separately disclosed items was £2.61 million, which reflects that
the underlying cash generation was £6.52 million and the true cash
generated from working capital was £7.80 million.
Debtor days remain strong at 69 (2009: 70) and bad debts in the
period were £0.07 million, which is felt acceptable given the current
economic climate.
Capital expenditure in the period was modest at £0.22 million.
Although conservation of cash is still extremely important, the Board
will not stifle Capex plans that will expand the business and lead to
future cash and profit generation.
DividendNo dividend payment is being proposed in respect of the year ended
31 March 2010. As already indicated, the restoration of a yield is
an important issue and it is the Directors’ intention to redress the
situation as soon as practical.

17989 05/08/2010 Proof7
16 Trifast plc Annual Report 2010

17989 05/08/2010 Proof7
17www.trifast.com
At the heart of TR is the strength of our people, systems and technical competence.
Our strategy is based on:
Leadership
Drive
Motivation
Focus
Determination
InsideTrifast

17989 05/08/2010 Proof7
18 Trifast plc Annual Report 2010
Inside trifast
Malcolm Diamond MBEExecutive Chairman
• Appointed on 18 March 2009• Retired from Trifast in 2002 following a
successful career spanning over 20 years with the Company as CEO
• Malcolm was the principal driver of Trifast’s founding strategic development, led the PLC listing in 1994 and achieved TR’s objectives of improving market penetration and a strong global presence
• Now responsible for investor relations, and supporting the CEO with mentoring heads of Sales and Marketing, plus revising the TR USA business plan and directing its implementation
• Other directorships include Senior Independent Director (NED) of Dechra Pharmaceuticals PLC; Independent Director (NED) of Unicorn AIM VCT Investment Fund. He is also Chairman of Cathedral Works Organisation Ltd and Partner at Soundscape Environmental Structures LLP
jim BarkerChief Executive
• Re-appointed on 18 March 2009• Focused now on direct interaction with the
key TR Country and Regional team leaders responsible for sales, purchasing and sourcing in order to sustain the strategic business recovery plan instigated in April 2009
• Succeeded Malcolm Diamond in 2002 as CEO (30 years’ experience in fastener industry) and guided the development of TR until his retirement from TR in 2007
• Played a major role in the development of Trifast’s international footprint particularly in Asia in both manufacturing and distribution, helping to underpin ‘TR’ as a leading brand within the industry
• Chairman of the British Association of Fastener Distributors
• British Representative of the European Fasteners Distributors Association
Mark BeltonGroup Finance Director and Company Secretary
• Appointed to the Board on 16 June 2010• Responsible for all aspects of Group
finance, Company Secretariat and provides support to the TR operations
• Joined the European Operating Board in 2006
• Became Group Financial Controller and Company Secretary in 2004
• Appointed European Finance Controller in 2003
• Joined Trifast in 1999 and made Group Accountant in 2000
• Qualified as Chartered Accountant at KPMG in 1994
Geoff Buddtechnical Director
• Joined the Company in 1976• Executive Member of the Board since 1986• Extensive experience in the industry• Focused now on leading Group technical
support including specialised sourcing and procurement, Quality Assurance and upgrading internal data transfer systems and procedures amongst TR Global business teams
1 Geoff Budd
2 Malcolm Diamond
3 Jim Barker
4 Mark Belton
5 Seamus Murphy
6 Glenda Roberts
7 Neil Chapman
8 Jonathan Shearman
trifast Board of Directors
41 2 3
Dedicated to providing strong
to providing strong
to providing Leadership
strong Leadershipstrong

17989 05/08/2010 Proof7
19www.trifast.com
Seamus MurphyDirector of Operations, hR and It
• Appointed to the Board on 16 June 2010• Responsible for the on-going development
and strategic direction of TR’s European and US business with the objective of maximising operational efficiencies across the network
• Integrated Serco Ryan finance function in 2005, taking on the role as European Purchasing & IT Director within TR
• Qualified accountant with extensive commercial experience gained over 20 years in multi-site distribution
• Ten years as Finance Director at Serco Ryan, prior to the business being acquired by TR
• Seven years with British Steel Distribution
Glenda RobertsGroup Sales Director
• Appointed to the Board on 16 June 2010• Glenda has more than 30 years of
experience in the fastenings industry, from manufacturing through to distribution
• She has been with TR for 20 years• Her sales roles within TR have taken her
from Sales Director in the UK, to the role of Global Account Director for eight years, and in 2010 she took on the role as Group Sales Director
• She has extensive experience working with multinationals globally, and has spent time working in China, Eastern Europe, Mexico and India as the newer markets emerged. The knowledge and skills she has gained in this time have enabled her to relaunch the TR Sales strategy in 2009, and refocus the Sales teams into the areas and industry sectors that will be the most productive for the business
neil ChapmanSenior Independent Director (nED)
• Appointed on 24 March 2009 as Senior Independent Director and Chairman of the Company’s Audit Committee and Nominations Committee
• Former Senior Partner of KPMG’s South East region
• Extensive experience across a variety of disciplines and sectors including technology, commercial and industrial products
• Other current roles include: Group Finance Director of Endeavour Holdings Ltd and Managing Director of Rivervale Cars Ltd
jonathan ShearmanIndependent Director (nED)
• Appointed on 1 July 2009 as Independent Director and Chairman of the Company’s Remuneration Committee
• Extensive City experience having worked within the stockbroking and investment community for 15 years
• Other current roles include: Adviser to the Chief Executive of European Investment Banking Group, Altium; Key facilitator to the Leadership team of the Christian Centre, Nottingham
75 68

20 Trifast plc Annual Report 2010
17989 05/08/2010 Proof7
Mark BeltonGroup Finance
Geoff BuddTechnical Director
Glenda RobertsGroup Sales
Malcolm Diamond MBEExecutive Chairman
COuntRy ManaGERS
Steven tanConsultant
Focused and committed to
the task
Key Disciplines
Inside trifast continued
jim BarkerChief Executive
Seamus MurphyOperations HR & IT
neil ChapmanSenior Independent Director
jonathan ShearmanIndependent Director
Management Structure
www.trifast.com
To watch our Corporate Video visit:

21www.trifast.com
17989 05/08/2010 Proof7
UK EURoPE
Ron VluttersHolland
jan Erik StorsveNorway
Roberto BianchiSweden
ASIA
hK tanMalaysia
Wilson ChenTaiwan
Key Disciplines
Key Disciplines
Key Disciplines
Sam WilsonManaging Director, Lancaster Fasteners
thomas tanManaging Director, Asia
USAalan Bate
Managing Director
Dave FiskGeneral Manager, TR Southern Region
Steve MeiklemGeneral Manager, TR Northern Region
Keith GibbSales Director, TR Branded Products
Phua yong SangChina
Endy ChinSingapore
Zoltan CsengeriHungary
anjanita EldridgeGroup Marketing
Ian CarltonQuality
Roberto BianchiSourcing
Dara horganIreland
helen tooleHR Adviser

22 Trifast plc Annual Report 2010
17989 05/08/2010 Proof7
Inside trifast continued
If you thinkIf you thinkyou’re beatenyou’re beatenIf you think you’re beaten, you are,If you think you dare not, you don’t.If you’d like to win, but think you can’t,It’s almost for sure, you won’t.
If you think you’re losing, you’ve lost.For out in the world we find —Success begins with a person’s will,It’s all in the state of mind.
If you think you’re outclassed, you are,You’ve got to think high to rise.You have to stay with it,In order to win the prize.
Life’s battles don’t always go,To the one with the better plan.For more often than not, you will win,If only you think you can.
the trifast Culture“A passionate approach to service and truly innovative thinking have helped create the Trifast culture”
Respect and share success!
Clear and challenging
objectives along with Clear and challenging
objectives along with Clear and challenging
appropriate local objectives along with
appropriate local objectives along with
managerial freedom
All backed by the
full support of central All backed by the
full support of central All backed by the
senior management through
senior management through full support of central
senior management through full support of central
encouragement, guidance senior management through
encouragement, guidance senior management through
and active involvementencouragement, guidance
and active involvementencouragement, guidance

23www.trifast.com
17989 05/08/2010 Proof7
Operate through motivated and focused
Operate through motivated and focused
Operate through
business teamsmotivated and focused
business teamsmotivated and focused
Management being regularly accessible
Management being regularly accessible
Management being and visible in person
regularly accessible and visible in person
regularly accessible
Communicate more by
talking and visiting than Communicate more by
talking and visiting than Communicate more by
by memos and emails! talking and visiting than
by memos and emails! talking and visiting than

24 Trifast plc Annual Report 2010
17989 05/08/2010 Proof7
Reasons why our customers choose us
Inside trifast continued
One-stop shop broad
product range
On-line web
based data resource
Reliability, quality
and commitment
Low cost manufacturing
from our 5 asian
factories
TR has the capability to
supply over 100 million
components a day.
Continuous improvement
Fresh and functional tool
for both new and existing
customers, buyers and design
engineers see:
Automotive
Electronics
Medical Equipment
Domestic Appliances
Telecoms
Key M
ark
et
Sect
ors
:
www.trifast.com
www.trfastenings.com

25www.trifast.com
17989 05/08/2010 Proof7
Design and application technical
client support
24/7 service support
from L.a. to
Shanghai
One-stop shop broad
product range
On-line web
based data resource
Financial stability
Client specific supply chain
logisticsGlobal
footprint,local
presenceA dynamic business, TR has
operations in Europe, the
Americas and Asia.
Our people
TR employs over 800 people
across its network of 21 sites.
Find out more on page 20
Low cost manufacturing
from our 5 asian
factories
TR Asia has the capacity to
produce 6 billion parts per
annum all used across key
sectors.
Find out more on page 26
Our Customers
Follow us on twitter:
http://twitter.com/trfastenings
www.trifast.com

26 Trifast plc Annual Report 2010
17989 05/08/2010 Proof7
trifast in asiaOverview — Thomas Tan, Managing Director
“TR Asia has successfully leveraged its USPs to positively differentiate its position in the marketplace”
Inside trifast continued
TR Asia employs 400 people across the region and represents around
25% of Group revenue.
TR Asia has the capacity to produce six billion parts per annum
covering products such as machine & tapping screws, automotive
screws, form parts to self-clinching fasteners and micro-screws, all
of which are used across key sectors including consumer electronics,
business and data transfer equipment, automotive, medical
equipment, domestic appliances, and cash dispensers.
TR Asia adds value to TR’s Global team by serving customers both
globally and locally in Asia. It also supports the Global sales team
in product development, securing new global customers and the
expansion of existing relationships.
Sales and Account Managers are fully deployed in most parts of Asia
directly and via distribution.
TR Asia engages a wholesome approach to capture market
opportunities using a three-pronged approach to grow Asia.
TR Asia is based in Singapore and operates through the
following regions:
Singapore — manufacturing and distribution
Malaysia — manufacturing and distribution
Taiwan — manufacturing and distribution
China (Suzhou) — manufacturing
China (Shanghai) — distribution
India (Chennai) — distribution
Growing existing accountsAccount Managers utilise their account relationship management skills
set to acquire more business from existing customers, new projects,
global OEM’s and increase market share from our competitors.
New business developmentBusiness Development Managers (known as ‘hunters’) utilise their
hunting skills to acquire new customers.
Pictured right: Front, left to right: Thomas Tan, David Ng, Toh Hai Joo Back, left to right: C. G. Lim, Dominic Heng, Endy Chin, Eric Tay

27www.trifast.com
17989 05/08/2010 Proof7
General Manager
tR SFE taiwan
asia Business Development
Manager
General Manager
tR Formac China
General Manager
tR Formac Malaysia
General Manager
tR Singapore
Regional Financial
Controller
Managing Director tR asia
TR Asia organisation Chart
tR Formac Suzhou
tR Formac Shanghai
tR Formac India
tR Formac Singapore

28 Trifast plc Annual Report 2010
17989 05/08/2010 Proof7
Inside trifast continued
Expanding into new geographical marketsTR Asia has recently set up a legal entity in Chennai, India in order to
tap into the enormous market in that region. The next move will be to
establish a presence through a representative office in Thailand, where
opportunities still exist, and also on into Vietnam.
Investment in TR Asia is necessary to ensure that TR keeps pace with
demand from our customers and continues to grow the business. Our
immediate investment plans will be upgrading and buying new Quality
control equipment as more and more customers are aiming at “zero”
defect products.
The bulk of our investment plans in 2010/11 will be on relocating TR
Suzhou in China out of the “Export Processing Zone” as products are
mainly sold locally from here. This action will see the Company saving
around 20% in cost, thus improving the bottom line.
Investment in people remains on-going as our success is very much
dependent on the people and skills we employ. Our success is
reflected through our dedicated teams across the region.
What do we see as our USPs?l in-house low cost manufactured products that are consistently high
in quality
l delivery anywhere in the world
l TR manufactures a broad range of specialist Branded Products such
as self-clinch studs and nuts, which are becoming the preferred
choice by customers, and
l technical specialists add value to our on-line resource expertise. TR’s
commercial website is now the most visited fastener website for
technical data.
TR Asia has successfully leveraged its USPs to positively differentiate
its position in the marketplace. As we continue with this strategy,
we anticipate seeing further benefits feeding through in the short to
medium term.

29www.trifast.com
17989 05/08/2010 Proof7
My role in previous years involved leading a strategic team who
were responsible for a number of Global accounts that we supplied
on three Continents. I was asked to step back into the heart of the
business during the recession to reorganise the Sales structure, and
formulate a clear strategy so that we emerged strongly from recession.
The objective was to ensure that we had a business model in place
for the different types of customers we service globally, respecting the
needs of different industry sectors and demands.
They are:
l Global and Regional OEMs
l The CEMs — the Contract manufacturers that support them
l Transactional Sales — the smaller accounts
l Distributor Sales
I took the approach that “recession” was not to be used as an excuse
not to be able to sell, and banished the R word. I took the stance that
“if you think you can’t . . . you won’t“ and that became the mindset
change for the Sales force. The opportunities came in different forms,
but we took advantage of the fact that some of our competitors
were in disarray during this time. Working closely with Marketing we
stepped up our activities, and increased our focus on Telemarketing
within the UK which was the hardest hit geographical area of the
business during recession. An enquiry Portal was developed within
our computer system by our own people, which has proved to be a
fantastic tool in the business as we now see every enquiry in Europe
and America, and all Automotive enquiries globally. This allows the
“experts“ from different disciplines, (eg: Quality, Engineering and
Sourcing and Senior Managers) to get involved at the inception of the
business. This close attention has resulted in a dramatic improvement
Global SalesOverview — Glenda Roberts, Group Sales Director
“We have entered our “Phase 2” year strongly with a renewed confidence based on results”

30 Trifast plc Annual Report 2010
17989 05/08/2010 Proof7
Inside trifast continued
in our conversion rates for new business, and has increased the
confidence of the Sales teams. We have always been a Company that
performs better when we are winning!
The Sales teams in Europe were restructured, and I took responsibility
for the strategy and re-motivation of the sales personnel allowing
the General Managers to concentrate on the Operations. Essentially
now the Business Development Managers spend approximately 60%
of their time on the major OEMs in their area; the balance of time is
focused on developing new business, as they have 12 target accounts
and the leads that are generated by the Telemarketing team. Quarterly
meetings are held with myself, the Regional Sales Managers and their
teams and the dialogue between us is constant.
Asia weathered the recession in sales terms better than Europe, and
the concept there is to continue to ensure any business transitioned
from Europe to China in particular, is managed and that we retain
and grow it. This policy has worked well for the last eight years and
we have strengthened the Sales teams, and have a Regional Manager
in place. The new focus is on the accounts we have in Europe and
America, ensuring if they have sister plants in Asia that we “connect“
these up East and West. We are pursuing some of the high volume
electronics manufacturers who have re-positioned their manufacturing
to these lower cost regions, but whose design centres are usually still
in the USA.
This is where the Strategic team roles are vital as they can use their
Global customer contacts and contracts to open the doors. We are
now seeing the re-emergence of the large multinationals putting
their global procurement teams back in position, and we are in a
prime position to work with these teams. We have stepped up our
activity, been involved in securing some very good contracts within the
Automotive sector. Recently, in the face of strong competition, we were
awarded the Philips lifestyle business for all of their European plants.
These new contracts take time to bring on board, but we are skilled in
managing this process. The commitment and energy that goes into this
is enormous and involves all areas and disciplines of
the TR business.
The involvement with these demanding multinationals, particularly
during the TR site audits, has made us look hard at our processes
and systems again, and as a result of these activities the benefits
will be felt back in all areas of the Company. Corporate Social
Responsibility (CSR), Sustainability, Vendor Management and the
new legislation REACH are all hot topics. The criticality in having our
own manufacturing should not be underestimated, particularly going
through the product design and testing phase, and New Product
Introduction (NPI).
Our organic growth is modestly exceeding our forecasts, and the
new business is now making a positive impact on the figures. The
growth can be analysed now by industry sectors, and we have seen
an exceptional rise in our Automotive business where we have been
very active. This will continue because of the contracts we have been
awarded often with a six-year life span. We will be balancing this with
a renewed drive into the Electronics and General Industrial areas, and
emerging fastener rich new markets like renewable energy.
Sales of our Branded Products to Distribution have seen a strong
recovery, and both the TR Branded Products team and Lancaster
Fasteners have produced very good results. Many distributors in
Europe and America had destocked during the last 18 months, and
conserved their cash. We had stocks positioned and ready for when
the upturn came and have been able to capitalise on this.
We have entered our “Phase 2” year
strongly with a renewed confidence
based on results.

31www.trifast.com
17989 05/08/2010 Proof7
Change ManagementOverview — Seamus Murphy, Director of Operations, HR and IT
“We will continue to work towards a combination of “centralised hubs” and “centres of excellence” to complement our new ‘sales-led’ structure and philosophy”
As the Group enters its next stage of development, I will be
responsible for the on-going development and strategic direction
of TR’s European and US business operations with the key objective
being, the maximising of operational efficiencies across the network
as well as leading the change management necessary to achieve the
“rebuild strategy”.
Planning, implementing and managing sustainable change in a fast-
changing environment is increasingly the situation in which most
organisations now work.
Dynamic environments such as these require dynamic processes,
people, systems and culture, especially for managing change
successfully, notably effectively optimising organisational response to
market opportunities and threats.
operations & Information Technology (IT)During “Phase 2”, we will continue to work towards a combination
of “centralised hubs” and “centres of excellence”. Not only does this
help us drive down costs through the elimination of many duplicated
processes, it also complements our new “sales led” structure and
philosophy.
“It is not the strongest species that survive, nor the most intelligent, but the ones who are most responsive to change”Charles Darwin

32 Trifast plc Annual Report 2010
17989 05/08/2010 Proof7
Inside trifast continued
As a result of the importance of change management to the overall TR strategy it was felt necessary to commission an HR Adviser to review the Group’s HR function.
This project included one-to-one interviews with a number of Directors and Managers throughout the business, focus groups comprising volunteer employees to gauge their views, visits to several UK sites, and a desk-top review of current policies and procedures. The commission also included a review of the electronic HR systems currently in place.
The HR review had an agreed remit and covered all areas of the ‘people’ aspects of our business including HR strategy and communication, recruitment and selection, induction, training, performance management, attendance management, contracts of employment, staff handbook, Health & Safety and HR reporting.
The full report, which was presented to the Trifast Board, clearly identified the undoubted
commitment of the staff to the future success of the business. It has also provided a platform to enable the leadership team to plan a more resourceful HR discipline going forward around the following key elements:
l the introduction of a more simple but effective performance review system clearly linked to corporate goals and objectives;
l re-invigorate investment in training particularly in supervisory and management skills;
l further develop effective methods of communication including the use of social media;
l ensuring a culture of “continuous improvement” pervades the entire organisation and becomes part of the TR Culture; and
l re-instigate TQM (Total Quality Management) reviews across the business. This initiative commences Autumn 2010, when the Chairman and CEO will visit all TR business units.
trifast human Resources Study
The principles of “lean logistics” are steadily being adopted in areas
such as warehousing, packaging, freight, stock management and
supply chains both internally and externally and, through a number of
initiatives that are already under way which should see us continue to
achieve significant operational savings in these areas.
And of course, supporting all of this and the rest of the Company
disciplines is the IT function where we continue to deliver process/
transactional efficiencies to the business and maintain a robust system
and service delivering timely information that enables the business to
make accurate and effective commercial decisions.

33www.trifast.com
17989 05/08/2010 Proof7
Marketing teamOverview — Anjanita Eldridge, Group Marketing Manager
“Our focus is to deliver effective marketing programmes to both existing and target customers and market sectors”
Having taken on the role of Group Marketing Manager in September
2009, leading the marketing team under the direction of Chairman,
Malcolm Diamond, it has been a very exciting yet challenging year for
the department.
Our key task is to develop the Marketing function through balancing
on-going promotional and communications activity with closer
collaboration with Group Sales Director, Glenda Roberts, and TR
Branded Products Sales Director, Keith Gibb, whilst looking at
opportunities to further expand marketing activity in line with the
strategic direction of the Group.
Following a visit to TR’s Asian subsidiaries in the early part of 2010,
the Marketing team is now working very closely with TR Asia to
ensure that the “TR brand” image and corporate communications are
consistent across the business. There are subtle cultural elements that
need to be taken into account when developing global marketing and
communications strategies. Therefore, the time invested in Asia with
David Ng, the Sales and Marketing Manager, has provided a greater
insight into the culture and workings of the region.
This has been key, allowing the marketing teams to establish a better
working partnership and to manage output with clear goals and
objectives both at Group level and locally.
More recently, the team has been pursuing a market-oriented
approach; the department is in the process of developing a market
research Portal for TR’s sales and support staff globally. This means
information on emerging themes, developing trends and activity in
the marketplace can be easily accessed and updated helping us all to
make more informed decisions and build on our collective knowledge.
Pictured: Left: Marie Spratt, Marketing representative for TR Southern Ireland
Right: Group Marketing team;Anjanita Eldridge, Abi Burnett, Donna Weller

34 Trifast plc Annual Report 2010
17989 05/08/2010 Proof7
Inside trifast continued
Increasingly, we are seeing a more interactive
experience between the Marketing department
and the rest of the Group which is a very
positive step towards improving our internal
communications and free flow of information which in turn,
reflects the needs of our customers into our marketing strategy.
TR’s Marketing team will also continue to develop its core activities,
for example, building on the success of the TR website. Spending
time with our customers’ engineers has really clarified areas for
improvement, and we are now well on the way to seeing major
enhancements on the functionality and content of the TR website.
As a priority we will continue to make on-going developments so
that the website will always remain a fresh and functional tool for
prospective customers, buyers and design engineers.
The massive diversity within the fastener industry and our customer
base means that we have to be mindful of the intricacies of individual
sectors, from distribution, global accounts and one-off transactions
through to complex vendor managed solutions.
As a team, we are highly responsive and we can quickly adapt to the
changes in our industry. Our focus is to deliver effective marketing
programmes to both existing and target customers and market sectors
that are relevant, informative and timely and which, as we strive for
excellence, highlight how TR can and will deliver on its promises.
Follow us!!
TM

35www.trifast.com
17989 05/08/2010 Proof7
Finance team supporting global operations
Under the leadership of the Group Finance Director, Mark Belton, the
Group finance team provides support and technical resource to the
local finance teams throughout the business.
Over the last twelve months, the Central team has successfully
worked through many changes around the Group as well as within
its own framework. New systems have been introduced and new
business practices implemented, all of which will enhance the efficient
operations of the Group’s finance function — the key focus being on
cash flow and control of working capital.
The Group and UK finance teams played key roles in comfortably
satisfying the due diligence requirements and subsequent negotiations
with the Group’s Bankers for the new financing facilities which
were put in place in the latter part of 2009.
It is a testament to the strength, skills and commitment of the people
across the finance teams that has helped us achieve the objectives we
set last year and inspire confidence that further initiatives will see the
teams work in partnership with the business to achieve strategic goals
identified for the coming year.
“Further initiatives will see the finance teams work in partnership with the business to achieve strategic goals identified for the coming year”
Pictured: Right: Carolyn Emsley, Assistant Company Secretary, Lyndsey Case, Group Accountant, Jon Gibb, Group Management Accountant, Maria Johnson, UK Financial Controller, Mark Belton, Group Finance Director

36 Trifast plc Annual Report 2010
17989 05/08/2010 Proof7
“We are now in ‘rebuild strategy’ stage which will help drive the business forward. Also, we are focusing on those things which TR control and can influence such as logistics, sourcing and purchasing, sales and operations”
your questions answeredMalcolm Diamond
Inside trifast continued
What has been your key message to Investors?
Why at this stage have you added to the Main Board?
“We have a clear strategy to reposition and rebuild TR’s market position and we have made these Board appointments and a number of Senior appointments to help achieve our goals. Each member has responsibility for a key discipline and the structure is capable of delivering the strategy — no extra costs”
What is your goal for the business?
“To be the global preferred fastener vendor to the top 30 multinational manufacturers of auto interiors, medical equipment, electronic assemblies and sheet metal sub-assemblies by 2012”
Do your top 10 customers contribute more than 30% of revenue?
“No — we have a good spread and no one customer even where we work in partnership across our operations represents a significant size, there is a lot to go for and we are up for the challenge”

37www.trifast.com
17989 05/08/2010 Proof7
“The Board is confident that its three-pronged strategy will return the business back to stronger levels of profitability, dividend yield and shareholder value”
What’s key to the tR recovery story?
“To return the business back to stronger levels of profitability through lean logistics, targeted sales and marketing with on-going margin improvement.”
“This and the on-going optimism of customers from within the key sectors we serve provides a solid foundation for us to remain cautiously optimistic that Trifast is now well on that road of recovery”
What are your key messages to all the people at tR and stakeholders?
“Steady as she goes, the banks are supportive, customers are supportive and the Group is not in intensive care”
“The new team believe strongly TR can continue to respond to the economic environment through its leading market position in the fastenings industry, expanding and exploiting the markets it serves, whilst also identifying other opportunities to further strengthen the business.“
how have you found the last 12 months?
“Jim and I have between us visited all parts of the business from Asia through to Europe, UK and USA and it has been both tough but rewarding, talking with everyone and making them part of this rebuild process” “Out of this it has become very clear that TR has great people with knowledge, drive and commitment.
“Instilling confidence in the teams in these challenging times is key. Together, we are securing the future success of the business, so it’s down to a team effort that we now find ourselves in a stronger position with many opportunities ahead“
To watch Questions and Answers with Malcolm Diamond visit:
www.trifast.com

17989 05/08/2010 Proof7
38 Trifast plc Annual Report 2010

17989 05/08/2010 Proof7
39www.trifast.com
Financial Reportingand Governance
Key Financials
Cash conversion from stock £3.7 million
Overheads down £3.25 million
Operating cash flow £3.91 million (2009: £5.91 million); net debt £4.68 million (2009: £8.40 million)
Restructuring £3.42 million; Refinancing £0.52 million
Sale of Associate £0.33 million

17989 05/08/2010 Proof7
40 Trifast plc Annual Report 2010
Directors’ Report
For smaller suppliers where no terms are agreed, payment will normally
be made in the month following receipt of goods or services.
The number of days purchases in trade payables at the end of the
financial year for the Company was 48 (2009: 45) and 82 (2009: 75)
for the Group.
Directors and Directors’ interestsDetails on how the Company appoints and replaces Directors are
disclosed in the Corporate Governance Statement section of the
Directors’ report.
The Directors who held office during the year were as follows:
ChairmanM M Diamond — (Executive Director)
Executive DirectorsJ C Barker — (Chief Executive Officer)
G P Budd
Independent Directors (Non-Executive)N S Chapman — (Senior Independent)
J Shearman — (appointed 1 July 2009)
The Directors’ remuneration and their interests in share capital are
shown in the Remuneration Report on pages 47 to 53.
Substantial shareholdingsDetails of the share structure of the Company are disclosed in
note 25.
As at 31 May 2010, the Company was aware of the following
material interests, representing 3% or more of the issued share
capital of the Company:
no. of % of
shares held shares held
Gartmore Investment
Management Limited 11,489,483 13.48
Schroder Investment
Management Limited (SIM) 11,254,529 13.20
Michael C Timms 10,000,000 11.73
Fidelity Management Research 8,520,000 9.99
Michael J Roberts 5,960,000 6.99
Axa (Institutional Group) 5,315,800 6.24
Hermes Fund Managers Limited 4,871,675 5.71
River & Mercantile Asset
Management LLP 4,200,811 4.93
Universities Superannuation
Scheme Ltd (USS) 2,848,618 3.34
The Directors present their Directors’ Report and financial statements
for the year ended 31 March 2010.
Results and proposed dividendsTotal Group revenue from continuing operations was £85.94 million
(2009: £104.90 million) and the loss for the year before taxation was
£2.81 million (2009: loss £11.00 million). Underlying profit for the
Group was £0.92 million (2009: profit £2.54 million); see note 2
for breakdown.
The Directors do not recommend a final dividend (2009: £nil).
Principal activities and business reviewThe principal activity of the Group during the financial year has been
that of the manufacture and distribution of industrial fastenings and
category ‘C’ components.
A review of the business activity and future prospects of the
Group are covered in the Chairman’s and CEO’s Statement and
the Directors’ Business Review. This includes that information to
be included in the Directors’ Report as required by the enhanced
business review under s417 of the Companies Act 2006.
A balanced and comprehensive review of the development and
performance of the Group and its position at the year end is given
on page 5. An analysis of key performance indicators is given on
page 11.
A description of the principal risks and uncertainties facing the
Group is discussed on page 10.
A description of the main trends and factors likely to affect future
development is given on pages 10 and 11.
Information on environmental and social issues is provided on
page 42.
The key assumptions underlying the going concern basis of
preparation, including a discussion of the Group’s new banking
facilities, are included on page 63.
Annual General MeetingThe Annual General Meeting will be held on 21 September 2010 at
Trifast House, Bellbrook Park, Uckfield, East Sussex, TN22 1QW.
Policy and practice on payment on creditorsThe Group does not follow any code or standard on payment
practice as it is the Group’s policy to settle creditors promptly on
mutually agreed terms. The terms will vary from supplier to supplier
and suppliers will be aware of the terms of payment.

17989 05/08/2010 Proof7
41www.trifast.com
Regular consultation and meetings, formal or otherwise, are held
with all levels of employees to discuss problems and opportunities.
Information on matters of concern to employees is presented in the
in-house letters and publications.
Political and charitable contributionsDuring the year the Group made no political donations (2009: £nil)
and various charitable contributions totalling £0.02 million (2009:
£0.02 million).
Disclosure of information to auditorsThe Directors who held office at the date of approval of this
Directors’ Report confirm that, so far as they are each aware, there
is no relevant audit information of which the Company’s Auditors
are unaware; and each Director has taken all the steps that they
ought to have taken as a Director to make themselves aware of
any relevant audit information and to establish that the Company’s
Auditors are aware of that information.
AuditorsIn accordance with Section 489 of the Companies Act 2006, a
resolution for the reappointment of KPMG Audit Plc as Auditors
of the Company is to be proposed at the forthcoming Annual
General Meeting.
By order of the Board
Mark Belton
Company Secretary
Trifast House
Bellbrook Park
Uckfield
East Sussex
TN22 1QW
15 June 2010
Company registered number: 1919797
Corporate GovernanceThe Corporate Governance Statement on pages 44 to 46 should be
read as forming part of the Directors’ Report.
Takeover DirectiveWhere not provided elsewhere in the Directors’ Report, the following
provides the additional information required to be disclosed as a
result of the implementation of the Takeover Directive.
There are no restrictions on the transfer of Ordinary shares in the
capital of the Company other than certain restrictions which may
from time to time be imposed by law (for example, insider trading
law). In accordance with the Listing Rules of the Financial Services
Authority, certain employees are required to seek the approval of the
Company to deal in its shares.
The Company is not aware of any agreements between Shareholders
that may result in restrictions on the transfer of shares or on voting
rights.
The rules governing the appointment of Directors are set out in the
Corporate Governance Statement section of the Directors’ Report
on pages 44 to 46. The Company’s Articles of Association may
only be amended by a Special resolution at a General Meeting of
Shareholders.
The Company is a party to a number of banking agreements that,
upon a change of control of the Company, could be terminable by
the bank concerned.
Outside of the extension of certain Directors’ rolling contract periods
and notice periods (see pages 48 and 49) there are no agreements
between the Company and its Directors or employees which provide
for compensation for loss of office or employment (whether through
resignation, purported redundancy or otherwise) that occurs because
of a takeover bid.
The Company is not aware of any contractual or other agreements
which are essential to its business which ought to be disclosed in the
Directors’ Report.
EmployeesThe Group has a policy of offering equal opportunities to employees
at all levels in respect of the conditions of work. Throughout the
Group it is the Board’s intention to provide possible employment
opportunities and training for disabled people and to care for
employees who become disabled having regard to aptitude and
abilities. Our Corporate Social Responsibility Statement can be found
on our website www.trifast.com.

17989 05/08/2010 Proof7
42 Trifast plc Annual Report 2010
Corporate Social Responsibility
Corporate Social ResponsibilityWe recognise that our social, environmental and ethical conduct
has an impact upon our reputation. We take our Corporate Social
Responsibility (CSR) seriously and are committed to implementing
our policies and systems across the Group. These include good
ethical behaviour, concern for employee health & safety, care for the
environment and community involvement.
The Board takes ultimate responsibility for CSR and is committed to
developing and implementing appropriate policies to create and
maintain long-term value for Shareholders. Sound company ethics
make business sense by helping to minimise risk, ensuring legal
compliance, enhancing company efficiency and building reputation
among stakeholders.
Business EthicsWe expect all of our business activities to be conducted in
accordance with high standards of ethical conduct and full
compliance with all applicable national and international laws.
We, in turn, apply these standards to all dealings with customers,
suppliers, employees and other stakeholders.
Our Code of Business Ethics and Responsible Behaviour provides a
guide to the way we achieve our business goals, helping us to
behave in an open and ethical manner. This extends to provisions for
“whistleblowing” whereby employees may report suspected
wrongdoings in confidence. Appropriate ethical behaviour is
reviewed as part of the Group’s performance appraisal process.
We have extended this Code to our vendors/suppliers. This
requires our key strategic suppliers to work towards achieving, as
a minimum, standards covering such issues as the environment,
employee health & safety and the prohibition of child labour, which
through business reviews and visits, encourages compliance and
good practice within our supply chain.
We will do our utmost to contract only with sub-contractors or
suppliers who themselves adhere to international human rights and
environmental laws and practices. Trifast commits to monitor the
ethical performance of its key suppliers and to taking immediate
steps in cases where the ethical performance of its key suppliers
comes into question.
Health & SafetyThe Managing Directors/General Managers appointed by the
Board have responsibility for the health & safety and environmental
performance of their operational areas. They are assisted by the Health
& Safety Manager. Trifast is committed to meeting all relevant health
& safety legislation, regulation and Codes of Practice.
The Group Health & Safety Policy places responsibility for the
management of health & safety on the individual business unit
management who are supported by Health & Safety Advisers where
necessary.
All business units provide employees with relevant comprehensive
health & safety training and a written health & safety policy.
The Managing Directors/General Managers ensure regular inspections
and annual internal audits of health & safety performance and also
have regular designated health & safety training. These audits have
been successfully reinforced by the use of the British Safety Council.
Our health & safety performance and significant risk exposures are
reviewed regularly by management and the Board.
EnvironmentGood environmental practice and the impact that our operations
have on the environment are of great importance to Trifast. The main
aim of Trifast’s Environmental Policy is to comply with all relevant
legislation in all areas in which we operate and to adopt responsible
environmental practices.
We have established a process for monitoring legislation and acting
upon it where necessary. Business units are required to comply with
Group policy and local statutory regulations and are committed to
setting their own environmental targets such as improving energy
efficiency, reducing waste and increasing recycling in conjunction with
Group objectives.
In respect of waste management specifically, we use the services of an
external professional agency to manage and monitor activities using
health check compliance audits and advice on data collection systems.
Promoting recycling, we follow the agency’s recommendation for
appropriate waste disposal. Group performance and risk reviews are
undertaken via Management Review on a regular basis and reported
directly to Jim Barker, Chief Executive who has Main Board
responsibility for the Group’s Environmental Risk Policy. Trifast will
communicate any significant environmental impact with third parties
on request.

17989 05/08/2010 Proof7
43www.trifast.com
CommunityTrifast recognises the role local communities play in our businesses.
We aspire to be a responsible partner in the communities in which we
operate around the world. We encourage all our businesses to support
the particular needs of their communities by contributing to local
charities and community initiatives.
EmployeesTrifast continues to aim at attracting, retaining and motivating the
highest calibre of employees within a structure that encourages their
development and initiative. Employees are provided with ongoing
learning and development opportunities that are aligned to the
Group’s strategic and business units’ objectives and formal personal
development programmes operate where linked to the Group’s
objectives. All of these processes are reinforced with appropriate
remuneration incentives and are on recognised systems.
CommunicationsWe aim to maintain a productive and open dialogue with all interested
parties in our business including shareholders, customers, suppliers and
employees. We have established customer relations, conduct customer
satisfaction surveys, monitor and develop supplier performance and
undertake regular employee surveys. We maintain our website as one
of the main routes for providing information to interested parties and
for contacting us.

17989 05/08/2010 Proof7
44 Trifast plc Annual Report 2010
Corporate Governance
The Board met ten times during the period with attendance as
follows:
J C Barker 10
G P Budd 10
M M Diamond 10
N S Chapman 10
J Shearman (appointed 1 July 2009) 7
Upon appointment the Directors are required to seek election at
the first AGM following appointment. All Directors are required to
submit themselves for re-election at regular intervals and at least
every three years.
The Company has separate posts of Chairman and Chief Executive.
The Chairman leads the Board and the Chief Executive is responsible
for the management of the Company, implementing policies and
strategies determined by the Board.
The Independent Non-Executive Directors have full access to
the external Auditors and to management and there is a formal
procedure for Directors to obtain independent professional advice in
the furtherance of their duties should this be necessary. All Directors
have access to the advice and services of the Company Secretary.
Appropriate and relevant training is provided to the Directors as and
when required.
The Board meets a minimum of five times a year, and is supplied as
early as practical with an agenda and appropriate papers. Further
ad-hoc meetings of the Board are held as and when required.
Directors are appointed by the Board on recommendation from
the Nominations Committee. The Board monitors the financial
performance of the Group, and approves and reviews major projects
and acquisitions. The Board has formally adopted a schedule of
matters which are reserved to the Board for decision, thus ensuring
that it maintains control over appropriate strategic, financial,
organisation and compliance issues.
The Board undertakes annual evaluation of its own performance
and that of its Committees using questionnaires and continues to
train and evaluate Senior Managers below Board level in order to
maintain its continuous succession policy.
With exceptions as highlighted below, the Company complied
with the provisions of the revised Combined Code on Corporate
Governance issued by the Financial Reporting Council in June 2008
(as amended) (“the Combined Code”).
The Board acknowledges that for part of the year the Board
structure was not compliant with provision C.3.1 of the Combined
Code due to restructuring of the Board. This provision requires a
smaller company to have at least two independent Non-Executives.
This non-compliance was rectified with the appointment of an
Independent Non-Executive Director, Jonathan Shearman, on
1 July 2009.
The reduced Non-Executive position of the Company between
1 April 2009 and 30 June 2009 meant that the Company was also
unable to comply with the Combined Code minimum Non-Executive
Director requirements in the Audit, Remuneration and Nomination
Committees during this time.
The Board also acknowledges Malcolm Diamond is a non-
independent Executive Chairman which does not comply with the
requirements of the Combined Code. However, the Board believes
that given Mr Diamond sits as Chairman and as a Non-Executive in
other companies, his experience from these appointments and his
previous knowledge of Trifast is invaluable.
The structure of the Board and its standing committees are as
follows:
The BoardDuring the year the Board consisted of two Executive Directors,
two Independent Non-Executive Directors and a Chairman. The
Non-Executive Directors are considered to be independent of
management and free from any business or other relationship which
could interfere with the exercise of their independent judgement
for the purposes of the Code. The Chairman, who is an Executive
Chairman, is not considered by the Board to be independent.
The Senior Independent Non-Executive Director is Neil Chapman
who was chosen due to his Executive Board experience with other
companies.
All Independent Non-Executive Directors have the authority to meet
with Shareholders without first seeking approval from the Chief
Executive or the Chairman.

17989 05/08/2010 Proof7
45www.trifast.com
The Nominations CommitteeThe Nominations Committee comprises the Independent Non-
Executive Directors, the Chief Executive and the Chairman and
meets at least once a year. It is chaired by Neil Chapman, as Senior
Independent Non-Executive Director. The Committee is responsible
for reviewing the Board structure, size and composition and for
nominating candidates for Executive and Non-Executive positions. It
will also ensure that any newly appointed Director receives a full and
proper induction into the Company’s affairs.
Shareholder relationsThe Group has a website, www.trifast.com, which is regularly
updated to ensure that Shareholders are fully aware of the Group’s
activities. The Group’s Registrars, Computershare, is also linked to
the Trifast website and offers services for the Shareholders.
The Group also works with City Specialists to ensure all levels of
Shareholders receive Trifast information, such as:
Arden Partners — Institutions
Citigate — Press, Analysts and Private Client Brokers
Edison — Analyst information available via TR website or Edison
The members of the Audit, Remuneration and Nominations
Committees will normally be available to speak to Shareholders at
the AGM. In addition, Shareholders can contact them at any time
by writing to Trifast plc, Trifast House, Bellbrook Park, Uckfield,
TN22 1QW.
Going concern reportAfter making enquiries, the Directors have reasonable expectations
that the Group has adequate resources to continue in operational
existence for the foreseeable future. Further information is given in
the “Basis of preparation”, note 1. For this reason, they continue to
adopt the going concern basis in preparing the financial statements.
Internal control The Combined Code requires that Directors review the effectiveness
of the Group’s system of internal controls which includes controls
over financial, operational, compliance and risk management. The
Audit Committee has reviewed the effectiveness of the system of
internal control and reported its positive conclusions to the Board.
In addition, the Board takes required account of the significance of
social, environmental and ethical matters in regard to the business of
the Group and seeks to take an ethical view of its responsibilities in
providing business opportunities.
The Board has delegated specific responsibilities to Committees, as
described below:
The Audit CommitteeThe Audit Committee’s principal responsibilities are to assist
the Board in reviewing and approving the Company’s financial
statements including any significant financial judgements contained
therein, monitoring the Company’s internal financial control and risk
management systems and making recommendations to the Board
with regard to the appointment and remuneration of the external
Auditors.
It is Group policy to ensure auditor independence by carefully
considering any non-audit work carried out by the Auditors. The
Group uses a number of professional advisers and has a specific
policy not to use the current external Auditors for any accounts
preparation work.
The Audit Committee comprises entirely the Independent Non-
Executive Directors. It is chaired by Neil Chapman and has met
four times in the year. Jonathan Shearman was appointed to the
Committee on 1 July 2009. During the period the Committee
felt that, given the size of the Group, it was valuable having the
Chairman, CEO and CFO attending the committee meetings. The
external Auditor also normally attend meetings. In addition, there is
at least one meeting a year where the Audit Committee meets the
external Auditors without executive management present.
The Committee is considered to be adequately qualified. The
Chairman, a qualified FCA, was previously the senior partner of
KPMG’s South-East operation and now works in industry as a Group
Finance Director.
The Remuneration CommitteeThe Remuneration Committee comprises the Independent Non-
Executive Directors and was chaired during the year by Jonathan
Shearman. Jonathan joined the Committee on 1 July 2009. The
Committee meets as required during the year to review and
determine the terms and conditions of employment of the Executive
Directors and senior management, including levels of remuneration
and other benefits. During the period, the Committee met on two
occasions.

17989 05/08/2010 Proof7
46 Trifast plc Annual Report 2010
Corporate Governance continued
A formalised internal review process has been set up to routinely
review the operational and financial controls within the Group.
These reviews are conducted by senior personnel who are
independent from the entity which is under review. Whilst the
Board recognises that this does not constitute a fully independent
internal audit function, it believes that due to the size of the Group,
this process provides appropriate comfort as to the operational and
financial controls in place.
The Board and Audit Committee continually review the effectiveness
of the Group’s internal control systems. No significant failings or
weaknesses were identified as a result of this review process. As
such, the Board and Audit Committee are comfortable that they
meet the requirements of the Turnbull Report.
Our Corporate Social Responsibility Statement can be found on our
website www.trifast.com.
The Board has overall responsibility for the Group’s controls.
However, such a system is designed to manage rather than eliminate
the risk of failure in order to achieve business objectives, and can
only provide reasonable and not absolute assurance against material
misstatement or loss regarding:
l The safeguarding of assets against unauthorised use or
disposition.
l The maintenance of proper accounting records and the reliability of
financial information used within the business or for publication.
The key elements of the system are as follows:
l Full detailed reviews of the business risks undertaken as part of
the ongoing day-to-day procedures of the business.
l An organisational structure with clearly defined lines of
responsibility and delegation of authority.
l Group policies for financial reporting, accounting, financial risk
management, information security, capital expenditure appraisal
and Corporate Governance are all well documented.
l Detailed annual budgets and rolling forecasts are prepared for all
operating units and reviewed/approved by the Board.
l Regular “Healthcheck” reviews are undertaken at each site
to cover both operational and financial controls with reports
reviewed by the Audit Committee.
l Performance against budget is monitored closely and material
variances are reported to the Board on a monthly basis. Rolling
forecasts are updated quarterly and reviewed accordingly.
l The control system is operated with the full co-operation of all
Company Directors. Risk assessments are done at all levels from
local divisional right up to the Main Board with the summaries all
being fed up to the Main Board for review.
l The Audit Committee deals with any significant control issues
raised by the external Auditors.
l Well-structured reporting lines to the Board. There is a formal
schedule of matters specifically reserved for decisions by the Board.
l Investment approval, controlled by the budgetary process with
authorisation levels in place. Any single capital expenditure over
£20,000 goes to the Board with detailed written proposals and
financial analysis of expected returns.

17989 05/08/2010 Proof7
47www.trifast.com
Directors’ Remuneration Report(Information not subject to audit)
Remuneration PolicyDuring the year the Committee reviewed its remuneration policy to
ensure that it continues to motivate, retain and incentivise the key
individuals within the Company who are ultimately responsible for
driving Shareholder value.
The overriding principles behind the policy are that levels of salary
should be competitive and balanced with the opportunity to earn
generous rewards from short and long-term incentives to the extent
of achievement of stretching performance targets which lead to the
enhancement of Shareholder value.
Actual remuneration to the Directors is shown in the table on
page 52.
Components of Remuneration PackageIn order to achieve the objectives of the Committee’s policy on
remuneration, the individual components of an Executive Director’s
remuneration package are determined as follows:
Base Salary
The policy of the Committee during the year ended 31 March 2010
was to set base salaries around the lower quartile to median of an
appropriate comparator group.
Factors taken into account by the Committee when determining
base salary levels are:
l Objective research based on a review of the remuneration in UK
quoted companies with similar corporate attributes drawn from
the following industry sectors:
— Support Services
— Engineering and Machinery
— Electronic and Electrical Equipment
— Engineering
l The performance of the individual Executive Director.
l Experience and responsibilities of each Executive Director.
l Pay and conditions throughout the Group.
Salaries are reviewed annually in April. It is the intention of the
Committee that base salaries will continue to be competitive with
the comparator group.
The Directors present the Remuneration Report for the year ended
31 March 2010. This Report has been prepared in accordance with
Schedule 8 of the Large and Medium Sized Companies Regulation
(“the regulations”). The Auditors are required to report on the
“auditable” part of this Report and to state whether, in their opinion,
that part of the Report has been properly prepared in accordance with
the Companies Act 2006 (as amended by the regulations). The Report
is therefore divided into separate sections for audited and unaudited
information. In accordance with schedule 18 of the Companies
Act, this Report has been approved by the Board for approval by
Shareholders at the forthcoming Annual General Meeting.
Statement of ComplianceThe Board has reviewed the Group’s compliance with the Combined
Code and it is their opinion that throughout the year, outside of the
reduced Independent Non-Executive position of the Company from
17 March to 1 July 2009, the Company complied with the Principles
and Provisions on remuneration specified in the Combined Code.
Remuneration CommitteeThe objective of the Remuneration Committee (the “Committee”)
is to develop remuneration strategies that drive performance and
provide levels of reward which reflect that performance, both for the
Executive Directors and other key Executives. It is also responsible for
reviewing the overall remuneration policy for all employees.
The Committee is composed entirely of Independent Non-Executive
Directors. Members have no day-to-day involvement in the running
of the business and no personal financial interest in the Company
other than that of Shareholders. No Executive Director sits on the
Committee. The Remuneration Committee is formally constituted
with written Terms of Reference. A copy of the Terms of Reference
is available to Shareholders by writing to the Company Secretary
whose details are set out on the inside back cover of the Report
and Accounts.
The Committee had two meetings during the year. All members of
the Committee at the time attended each meeting.
The Committee is advised on matters relating to Directors as
required. It uses independent external advisers as and when, to
advise on remuneration matters.
The Committee consults with the Company Secretary regarding
issues on areas of remuneration and Corporate Governance. With
regard to senior Executives in the Company (excluding Board
Directors), the Committee also takes advice from the Executive
Board.

17989 05/08/2010 Proof7
48 Trifast plc Annual Report 2010
Directors’ Remuneration Report continued(Information not subject to audit)
Shareholding guidelinesThe Committee will ensure that Executive Directors are encouraged
to build up a meaningful holding in the Company over a five-year
period. This demonstrates their commitment and confidence in
the Company going forward and further aligns the interests of the
Executive Directors with those of Shareholders.
Contractsa) Executive Directors
During the year all Executive Directors had rolling service contracts
as follows:
M M Diamond 6 months (12 months in the event of a
change in control)
J C Barker 6 months (12 months in the event of a
change in control)
G P Budd 6 months (12 months in the event of a
change in control)
The Board is confident that these rolling contracts with the
respective contractual termination payments are appropriate
for the business and in accordance with Best Practice Corporate
Governance.
The dates of the Executive Directors contracts are:
G P Budd 17 April 2003
M M Diamond 18 March 2009
J C Barker 18 March 2009
b) Independent Non-Executive Directors
All Independent Non-Executive Directors are paid fees for their
services which are determined by the Board as a whole and reviewed
against market levels on an annual basis. They are all on annual
contracts which are reviewed each year; their original signing dates
were as follows:
N S Chapman 24 March 2009
J Shearman 1 July 2009
All Independent Non-Executive Directors have three-month notice
periods (six months in the event of a change in control) and no
contractual termination payments.
Their remuneration is not performance related and is not
pensionable. The only other payments made to them are mileage
allowances at Inland Revenue rates and expenses for items incurred
during the fulfilment of their roles.
Benefits
In line with other companies, potential benefits are provided in the
form of a Company car (or car allowance), private medical insurance,
permanent health insurance, critical illness cover and life cover at
a maximum 13.33 times earnings at date of death. This life cover
provides a benefit in the form of a four times salary lump sum and a
balance to buy a spouse’s annuity. The provision of these benefits is
in line with market practice.
Pension
The Company has agreed to make a contribution of a maximum
20% of current basic salary into Geoff Budd’s private pension
scheme.
Malcolm Diamond and Jim Barker do not participate in the Company
pension plan.
Annual Bonus payment
For the year ended 31 March 2010 no bonuses were paid. A
full review of the Executive Remuneration packages including
the balance between fixed and variable performance related
compensation will be performed by the Remuneration Committee
during 2010.
Long-term incentives
Following approval at the 2005 Annual General Meeting, the
Company introduced a long-term incentive arrangement known as
the Trifast plc 2005 Long Term Incentive Plan (“LTIP”). Awards under
the LTIP were delivered in the form of conditional share awards
which were to be released in three years dependent on continued
employment and the satisfaction of demanding performance targets.
Full details of the awards held by Executive Directors under the LTIP
at the start of the year are contained in the audited section of this
Report on page 51.
All Company Directors who held LTIPs waived their right to these
rewards during the year.
The Executive Directors may also participate in the Trifast Savings
Related Share Option Scheme that is open to all UK employees
and is Inland Revenue approved. The Scheme offers three, five and
seven-year savings contracts which provide an option to purchase
shares after maturity at a discount to the share price on the date the
contract is taken out (the maximum discount is 20% of mid-market
price).

17989 05/08/2010 Proof7
49www.trifast.com
c) Performance graph
In accordance with the Directors’ Remuneration Report Regulations 2002, the graph below shows Trifast’s total Shareholder return compared
with the FTSE Fledgling Index and the FTSE All-Share Industrial Engineering Index for the last five years. The Board considers these Indices to
be a fair measure of the Company’s performance against its competitors.
The Remuneration Report (including accompanying notes) was approved by the Board of Directors on 15 June 2010 and was signed on its
behalf by:
jonathan Shearman
Remuneration Committee
2005 2006 2007 2008 2009 2010
Trifast plc FTSE Fledgling Index FTSE All Share Industrial Engineering Index
200
150
100
50
0
-50
-100
%
Total Shareholder Return from 31 March 2005

17989 05/08/2010 Proof7
50 Trifast plc Annual Report 2010
notes to the Directors’ Remuneration Report(Information not subject to audit)
The interests in the ordinary shares of 5p each in the Company, of the Directors who held office at the end of the financial year were
as follows:
number of shares
Interest at
beginning of
Interest at year/date of
end of year appointment
G P Budd 245,955 245,955
J C Barker 473,229 473,229
M M Diamond 493,800 493,800
N S Chapman 400,000 220,000
There were no non-beneficial interests.
The Directors retiring by rotation are Malcolm Diamond and Neil Chapman who, being eligible, offer themselves for re-election at the
forthcoming Annual General Meeting.
The rights of the Directors who held office during the financial year to subscribe for ordinary shares of 5p each in the Company, including
SAYE options, are as follows:
Number of options
Option At Options Options at
Date price 31 March granted cancelled 31 March
granted £ 2009 in the year in the year 2010
G P Budd 17 Dec ’99 2.510 92,000 — (92,000) —
24 July ‘00 2.690 64,800 — (64,800) —
2 July ‘03 0.650 125,000 — (125,000) —
27 Sept ‘04 0.730 160,000 — (160,000) —
30 Sept ‘09 0.085 — 500,000 — 500,000
SAYE Options 0.170 — 53,382 — 53,382
J C Barker 30 Sept ‘09 0.085 — 2,000,000 — 2,000,000
M M Diamond 30 Sept ‘09 0.085 — 2,000,000 — 2,000,000
N S Chapman 30 Sept ‘09 0.085 — 150,000 — 150,000
No other Director has share options.

17989 05/08/2010 Proof7
51www.trifast.com
The options granted on 30 September 2009 are exercisable between September 2012 and September 2019 at an exercise price of £0.085
per share. These can only be exercised when the Company’s share price has reached a minimum of 51p, maintained as an average over the
three-month period preceding the Notice of Exercise, and the Company has achieved a minimum of 10% Return on Capital Employed.
The market price of the ordinary shares at 31 March 2010 was £0.23 (2009: £0.09) and the range during the year was £0.08 to £0.29
(2009: £0.08 to £0.58).
The Company’s register of Directors’ interests, which is open to inspection, contains full details of Directors’ shareholdings and options
to subscribe.
There have been no other changes in the interests or rights to subscribe for shares of the Directors in the ordinary share capital of the
Company since the end of the financial year.
LTIP Awards over shares of 5p eachThe details of the awards under the LTIP held at the start of the year by Executive Directors who held office during the financial year are
shown below:
Value of Shares Conditionally
awarded Date of
Share price Value the end of
Date of at date at date the holding
Executive Directors grant of grant number of grant period
G P Budd 31.07.2006 54.25p 300,000 £162,750 31.07.2009
31.07.2007 82.25p 210,942 £173,500 31.07.2010
31.07.2008 51.50p 413,793 £213,103 31.07.2011
G P Budd waived the rights to these LTIPs during the year.
At 31 March 2010, no Director of the Company held any LTIP awards.

17989 05/08/2010 Proof7
52 Trifast plc Annual Report 2010
notes to the Directors’ Remuneration Report continued(Information subject to audit)
Directors’ RemunerationMarch 2010 Fees Salaries Subtotal Pension total
name £000 £000 £000 £000 £000
Chairman
M M Diamond — 100 100 — 100
Executive Directors
J C Barker (CEO) — 175 175 — 175
G P Budd — 187 187 37 224
Independent non-Executive Directors
N S Chapman 30 — 30 — 30
J Shearman (appointed 1 July 2009) 18 — 18 — 18
totals 48 462 510 37 547
Benefits Restructuring
March 2009 Fees Salaries in kind costs1 Subtotal Pension Total
Name £000 £000 £000 £000 £000 £000 £000
Chairman
A V Allen (resigned 17/03/09) 67 — — — 67 — 67
M M Diamond (appointed 18/03/09) — 4 — — 4 — 4
Executive Directors
J C Barker (appointed 18/3/09) — 7 — — 7 — 7
G P Budd — 216 11 — 227 42 269
S Lawson (resigned 31/01/09) — 190 1 281 472 38 510
S Auld (resigned 17/03/09) — 295 1 375 671 59 730
Independent non-Executive Directors
N S Chapman (appointed 24/03/09) 2 — — — 2 — 2
E G Hutchinson (resigned 17/03/09) 34 — — — 34 — 34
B Wilson (resigned 17/03/09) 34 — — — 34 — 34
Totals 137 712 13 656 1,518 139 1,657
1 The restructuring costs relate to compensation for loss of office for Steve Auld and Stuart Lawson following them stepping down from the
Board on 17 March and 31 January 2009 respectively.

17989 05/08/2010 Proof7
53www.trifast.com
Statement of Directors’ Responsibilities in Respect of the annual Report and the Financial Statements
The Directors are responsible for the maintenance and integrity of
the corporate and financial information included on the Company’s
website. Legislation in the UK governing the preparation and
dissemination of financial statements may differ from legislation in
other jurisdictions.
We confirm that to the best of our knowledge:
l the financial statements, prepared in accordance with IFRSs as
adopted by the EU and applicable law, give a true and fair view
of the assets, liabilities, financial position and profit or loss of the
Company and its subsidiaries included in the consolidation taken
as a whole; and
l the Directors’ Report includes a fair review of the development
and performance of the business and the position of the
Company and its subsidiaries included in the consolidation taken
as a whole, together with a description of the principal risks and
uncertainties that they face.
On behalf of the Board
Mark Belton
Group Finance Director
and Company Secretary
The Directors are responsible for preparing the Annual Report and
the Group and Parent Company financial statements in accordance
with applicable law and regulations.
Company law requires the Directors to prepare Group and Parent
Company financial statements for each financial year. Under that
law, they are required to prepare the Group financial statements in
accordance with IFRSs as adopted by the EU and applicable law and
have elected to prepare the Parent Company financial statements on
the same basis.
Under Company law, the Directors must not approve the financial
statements unless they are satisfied that they give a true and fair view
of the state of affairs of the Group and Parent Company and of their
profit or loss for that period. In preparing each of the Group and
Parent Company financial statements, the Directors are required to:
l select suitable accounting policies and then apply them
consistently;
l make judgements and estimates that are reasonable and prudent;
l state whether they have been prepared in accordance with IFRSs
as adopted by the EU; and
l prepare the financial statements on the going concern basis unless
it is inappropriate to presume that the Group and the Parent
Company will continue in business.
The Directors are responsible for keeping adequate accounting
records that are sufficient to show and explain the Parent Company’s
transactions and disclose with reasonable accuracy at any time
the financial position of the Parent Company, and enable them to
ensure that its financial statements comply with the Companies Act
2006. They have general responsibility for taking such steps as are
reasonably open to them to safeguard the assets of the Group and
to prevent and detect fraud and other irregularities.
Under applicable law and regulations, the Directors are also
responsible for preparing a Directors’ Report, Directors’
Remuneration Report and Corporate Governance Statement that
complies with that law and those regulations.

17989 05/08/2010 Proof7
54 Trifast plc Annual Report 2010
Independent auditors’ Report to the Members of trifast plc
prepared in accordance with IFRSs as adopted by the EU and as
applied in accordance with the provisions of the Companies Act
2006; and
l the financial statements have been prepared in accordance with
the requirements of the Companies Act 2006 and, as regards the
Group financial statements, Article 4 of the IAS Regulation.
opinion on other matters prescribed by the Companies Act 2006In our opinion:
l the part of the Directors’ Remuneration Report to be audited has
been properly prepared in accordance with the Companies Act
2006; and
l the information given in the Directors’ Report for the financial
year for which the financial statements are prepared is consistent
with the financial statements.
Matters on which we are required to report by exceptionWe have nothing to report in respect of the following:
Under the Companies Act 2006 we are required to report to you if,
in our opinion:
l adequate accounting records have not been kept by the Parent
Company, or returns adequate for our Audit have not been
received from branches not visited by us; or
l the Parent Company financial statements and the part of
the Directors’ Remuneration Report to be audited are not in
agreement with the accounting records and returns; or
l certain disclosures of Directors’ remuneration specified by law are
not made; or
l we have not received all the information and explanations we
require for our Audit.
Under the Listing Rules we are required to review:
l the Directors’ Statement, set out on page 45, in relation to going
concern; and
l the part of the Corporate Governance Statement on pages 44 to
46 relating to the Company’s compliance with the nine provisions
of the June 2008 Combined Code specified for our review.
P alex Sanderson (Senior Statutory auditor)
for and on behalf of KPMG Audit Plc, Statutory Auditor
Chartered Accountants
15 June 2010
KKPMG Audit Plc
1 Forest Gate
Brighton Road
Crawley
RH11 9PT
United Kingdom
We have audited the financial statements of Trifast plc for the year
ended 31 March 2010 set out on pages 55 to 104. The financial
reporting framework that has been applied in their preparation
is applicable law and International Financial Reporting Standards
(IFRSs) as adopted by the EU and, as regards the Parent Company
financial statements, as applied in accordance with the provisions of
the Companies Act 2006.
This Report is made solely to the Company’s members, as a body, in
accordance with Chapter 3 of Part 16 of the Companies Act 2006.
Our audit work has been undertaken so that we might state to
the Company’s members those matters we are required to state to
them in an auditors’ report and for no other purpose. To the fullest
extent permitted by law, we do not accept or assume responsibility
to anyone other than the Company and the Company’s members,
as a body, for our audit work, for this Report, or for the opinions we
have formed.
Respective responsibilities of Directors and AuditorsAs explained more fully in the Directors’ Responsibilities Statement
set out on page 53, the Directors are responsible for the preparation
of the financial statements and for being satisfied that they give
a true and fair view. Our responsibility is to audit the financial
statements in accordance with applicable law and International
Standards on Auditing (UK and Ireland). Those standards require
us to comply with the Auditing Practices Board’s (APB’s) Ethical
Standards for Auditors.
Scope of the audit of the financial statementsA description of the scope of an audit of financial statements is
provided on the APB’s website at www.frc.org.uk/apb/scope/UKP.
opinion on financial statementsIn our opinion:
l the financial statements give a true and fair view of the state of
the Group’s and of the Parent Company’s affairs as at 31 March
2010 and of the Group’s loss for the year ended; and
l the Group financial statements have been properly prepared in
accordance with IFRSs as adopted by the EU; and
l the Parent Company financial statements have been properly

17989 05/08/2010 Proof7
55www.trifast.com
Financial Statements
Consolidated Income Statementfor year ended 31 March 2010
2010 2009 Continuing operations Note £000 £000
Revenue 3 85,935 104,901 Cost of sales (64,927) (78,312)
Gross profit 21,008 26,589 Other operating income before separately disclosed items: 4 218 156 Sale of associate 2 332 —
Total other operating income 550 156 Distribution expenses (2,146) (2,814)
Administrative expenses before separately disclosed items: (18,015) (20,593) IFRS 2 credit/(charge) 2, 23 143 (55) Intangible amortisation 2, 13 (261) (266) Goodwill impairment 2, 13 — (8,303) Settlement claim 2 — (555) Restructuring costs 2 (3,420) (3,701) Impairment of associate 2, 15 — (659)
Total administrative expenses (21,553) (34,132)
operating loss 5, 6, 7 (2,141) (10,201) Financial income 8 96 99 Financial expenses before separately disclosed items: 8 (246) (896) Expense of changing banking facilities 2 (517) —
Total financial expenses (763) (896)
Net financing costs (667) (797)
Loss before tax 2, 3 (2,808) (10,998) Taxation 9 621 (520)
Loss from continuing operations (attributable to equity Shareholders of the Parent Company) (2,187) (11,518) Discontinued operations 3, 10 Loss from discontinued operations (net of income tax) — (3,792)
Loss for the period (2,187) (15,310)
Loss per share (total) Basic 26 (2.57p) (17.98p) Diluted 26 (2.57p) (17.98p) Loss per share (continuing operations) Basic 26 (2.57p) (13.53p) Diluted 26 (2.57p) (13.53p) Dividends Interim paid 2010 — nil (2009: 0.93p) 25 — 793

17989 05/08/2010 Proof7
56 Trifast plc Annual Report 2010
Financial Statements
Statements of Comprehensive Incomefor year ended 31 March 2010
Group Company 2010 2009 2010 2009 £000 £000 £000 £000
(Loss)/profit for the year (2,187) (15,310) 4,530 (8,900)
Other comprehensive income: Foreign currency translation differences 42 7,135 — — Net (loss)/gain on hedge of net investment in foreign subsidiary (1) 7 — —
other comprehensive income recognised directly in equity net of income tax 41 7,142 — —
Total comprehensive (expense)/income recognised for the year (attributable to the equity Shareholders of the Parent Company) (2,146) (8,168) 4,530 (8,900)

17989 05/08/2010 Proof7
57www.trifast.com
Consolidated Statement of Changes in Equityfor year ended 31 March 2010
Share Share Translation Retained Total capital premium reserve earnings equity £000 £000 £000 £000 £000
Balance at 1 April 2009 4,262 12,167 8,958 17,083 42,470
Total comprehensive income for the year: Loss for the year — — — (2,187) (2,187) Other comprehensive income: Foreign currency translation differences — — 42 — 42 Net loss on hedge of net investment in foreign subsidiary — — (1) — (1)
Total other comprehensive income — — 41 — 41
Total comprehensive income/(expense) recognised for the year — — 41 (2,187) (2,146)
Transactions with owners, recorded directly in equity Share-based payment transactions — — — (143) (143)
Total transactions with owners — — — (143) (143)
Balance at 31 March 2010 4,262 12,167 8,999 14,753 40,181
Consolidated Statement of Changes in Equityfor year ended 31 March 2009
Share Share Translation Retained Total capital premium reserve earnings equity £000 £000 £000 £000 £000
Balance at 1 April 2008 4,248 12,167 1,816 34,734 52,965
Total comprehensive income for the year: Loss for the year — — — (15,310) (15,310) Other comprehensive income: Foreign currency translation differences — — 7,135 — 7,135 Net gain on hedge of net investment in foreign subsidiary — — 7 — 7
Total other comprehensive income — — 7,142 — 7,142
Total comprehensive income/(expense) recognised for the year — — 7,142 (15,310) (8,168)
Transactions with owners, recorded directly in equity Share-based payment transactions 14 — — 41 55 Dividends — — — (2,382) (2,382)
Total transactions with owners 14 — — (2,341) (2,327)
Balance at 31 March 2009 4,262 12,167 8,958 17,083 42,470

17989 05/08/2010 Proof7
58 Trifast plc Annual Report 2010
Financial Statements
Company Statement of Changes in Equityfor year ended 31 March 2010
Share Share Translation Retained Total capital premium reserve earnings equity £000 £000 £000 £000 £000
Balance at 1 April 2009 4,262 12,167 1,521 (6,976) 10,974
Total comprehensive income for the year: Profit for the year — — — 4,530 4,530 Other comprehensive income: Foreign currency translation differences — — — — — Net gain/(loss) on hedge of net investment in foreign subsidiary — — — — —
Total other comprehensive income — — — — —
Total comprehensive income recognised for the year — — — 4,530 4,530
Transactions with owners, recorded directly in equity Share-based payment transactions — — — (143) (143)
Total transactions with owners — — — (143) (143)
Balance at 31 March 2010 4,262 12,167 1,521 (2,589) 15,361
Company Statement of Changes in Equityfor year ended 31 March 2009
Share Share Merger Retained Total capital premium reserve earnings equity £000 £000 £000 £000 £000
Balance at 1 April 2008 4,248 12,167 2,393 3,393 22,201
Total comprehensive income for the year: Loss for the year — — — (8,900) (8,900) Other comprehensive income: Foreign currency translation differences — — — — — Net gain/(loss) on hedge of net investment in foreign subsidiary — — — — —
Total other comprehensive income — — — — —
Total comprehensive expense recognised for the year — — — (8,900) (8,900)
Transactions with owners, recorded directly in equity Utilisation of merger reserve — — (872) 872 — Share-based payment transactions 14 — — 41 55 Dividends — — — (2,382) (2,382)
Total transactions with owners 14 — (872) (1,469) (2,327)
Balance at 31 March 2009 4,262 12,167 1,521 (6,976) 10,974

17989 05/08/2010 Proof7
59www.trifast.com
Statements of Financial Positionat 31 March 2010
Group Company 2010 2009 2010 2009 Note £000 £000 £000 £000
Non-current assets Property, plant and equipment 11, 12 7,740 8,606 2,624 2,711 Intangible assets 13, 14 16,358 16,380 — — Equity investments 15 — — 21,874 21,874 Deferred tax assets 16, 17 2,046 707 — —
Total non-current assets 26,144 25,693 24,498 24,585
Current assets Stocks 18 20,141 23,952 — — Trade and other receivables 19 20,458 18,362 1,397 1,677 Cash and cash equivalents 20, 27 7,420 9,063 2,176 4,019
Total current assets 48,019 51,377 3,573 5,696
Total assets 3 74,163 77,070 28,071 30,281
Current liabilities Bank overdraft 20, 27 — 2,641 6,524 5,728 Other interest-bearing loans and borrowings 21, 27 12,103 2,547 4,877 1,135 Trade and other payables 22 16,701 14,838 1,215 1,175 Tax payable 847 8 — — Provisions 24 841 1,166 — 517
Total current liabilities 30,492 21,200 12,616 8,555
Non-current liabilities Other interest-bearing loans and borrowings 21, 27 — 12,271 — 10,446 Provisions 24 3,144 781 — — Deferred tax liabilities 16, 17 346 348 94 306
Total non-current liabilities 3,490 13,400 94 10,752
Total liabilities 3 33,982 34,600 12,710 19,307
Net assets 40,181 42,470 15,361 10,974
Equity Share capital 4,262 4,262 4,262 4,262 Share premium 12,167 12,167 12,167 12,167 Reserves 8,999 8,958 1,521 1,521 Retained earnings 14,753 17,083 (2,589) (6,976)
Total equity 40,181 42,470 15,361 10,974
These financial statements were approved by the Board of Directors on 15 June 2010 and were signed on its behalf by:
Malcolm Diamond james Barker
Director Director

17989 05/08/2010 Proof7
60 Trifast plc Annual Report 2010
Financial Statements
Statements of Cash Flowsfor year ended 31 March 2010
Group Company 2010 2009 2010 2009 Note £000 £000 £000 £000
Cash flows from operating activities (Loss)/profit for the year (2,187) (15,310) 4,530 (8,900) Adjustments for: Depreciation, amortisation and impairment 1,329 9,780 87 9,419 Financial income (96) (99) (2) (51) Financial expense 763 896 520 678 Loss on sale of property, plant and equipment and investments 10 436 — — Loss on disposal of subsidiary 10 — 2,950 — — Dividends received — — (5,289) (4,679) Equity settled share-based payment (credit)/charge (143) 55 (105) (32) Gain on sale of associate (332) — (332) — Impairment of associate — 659 — 500 Taxation (621) 585 (212) 136
operating cash outflow before changes in working capital and provisions (1,277) (48) (803) (2,929) Change in trade and other receivables (1,983) 8,078 242 (356) Change in stocks 3,748 2,746 — — Change in trade and other payables 1,599 (5,847) 113 373 Change in provisions 1,821 976 (667) 508
Cash generated from/(used) in the operations 3,908 5,905 (1,115) (2,404) Tax recovered/(paid) 119 (2,270) — —
Net cash from operating activities 4,027 3,635 (1,115) (2,404)
Cash flows from investing activities Proceeds from sale of property, plant and equipment 13 41 — — Interest received 97 103 3 51 Proceeds from sale of associate 332 — 332 — Disposal of discontinued operation, net of cash disposed of 10 — (104) — (573) Acquisition of property, plant and equipment 11, 12 (220) (730) — (29) Dividends received — — 5,289 4,679
Net cash from investing activities 222 (690) 5,624 4,128

17989 05/08/2010 Proof7
61www.trifast.com
Group Company 2010 2009 2010 2009 Note £000 £000 £000 £000
Cash flows from financing activities Proceeds from new loan 21, 27 12,103 — 4,877 — Repayment of long-term borrowings 21, 27 (14,818) (2,732) (11,581) (1,506) Dividends paid 25 — (2,382) — (2,382) Interest paid (620) (1,030) (444) (799)
Net cash from financing activities (3,335) (6,144) (7,148) (4,687)
Net change in cash and cash equivalents 914 (3,199) (2,639) (2,963) Cash and cash equivalents at 1 April 20 6,422 8,247 (1,709) 1,254 Effect of exchange rate fluctuations on cash held 84 1,374 — —
Cash and cash equivalents at 31 March 20 7,420 6,422 (4,348) (1,709)
Statements of Cash Flows continuedfor year ended 31 March 2010
17989 05/08/2010 Proof7
62 Trifast plc Annual Report 2010
Financial Statements
notes (forming part of the Financial Statements)
1 Accounting policies a) Significant accounting policiesTrifast “the Company” is a Company incorporated in the United Kingdom. The registered office details are on the inside back cover.
The Group financial statements consolidate those of the Company and its subsidiaries (together referred to as the “Group”). The Parent Company financial statements present information about the Company as a separate entity and not about its Group. The profit after tax for the Company is £4.53 million (2009: loss of £8.90 million).
Statement of ComplianceBoth the Parent Company financial statements and the Group financial statements have been prepared and approved by the Directors in accordance with International Financial Reporting Standards as adopted by the EU (“Adopted IFRSs”) except as explained below:
On publishing the Parent Company financial statements here together with the Group financial statements, the Company is taking advantage of the exemption in s408 of the Companies Act 2006 not to present its individual statement of comprehensive income, income statement and related notes that form a part of these approved financial statements.
The accounting policies set out below have, unless otherwise stated, been applied consistently to all periods presented in these Group and Parent Company financial statements. In these financial statements the following IFRSs and amendments have been adopted for the first time.
l IAS 1 Presentation of Financial Statements (Revised). The application of the revision to IAS 1 has changed the format of the financial statements but has not fundamentally changed the reported financial position or performance.
l Amendment to IFRS 2 Share-based payments, IAS 23 Borrowing Costs (Revised), Amendments to IAS 32 Financial Instruments: Presentation, IFRIC 13 Customer loyalty programmes and IFRIC 16 Hedges of a net investment in a foreign operation had no significant impact on the financial statements.
Amendment to:l IFRS 7 Financial instruments disclosure has led to increased liquidity and fair value disclosures.
IFRS not yet appliedThe IASB and IFRIC have issued a number of standards and interpretations with an effective date after the date of these financial statements. The following are those standards and interpretations that it is expected may have an impact on the Group’s financial statements.
l IFRS 3 (2008) Business Combinations. This is not expected to have an impact on the financial statements although it will impact on any future acquisitions. This standard applies prospectively to acquisitions with a date on or after the beginning of the first annual period beginning on or after 1 July 2009.
l IAS 17 Leases has been amended to require classification of land and buildings leases based on an assessment of transfer of risks and rewards. This amendment will apply to the Group’s 2011 financial statements but is not expected to have a material impact.
l IAS 36 Impairment of assets has been amended to clarify that for the purposes of impairment testing, goodwill is allocated to operating segments as defined in paragraph 5 of IFRS 8 Operating Segments i.e. before aggregation. This amendment will apply to the Group’s 2011 financial statements but is not expected to have a material impact.
l IFRS 9 Financial Instruments has been amended to simplify the mixed measurement model and establishes two primary measurement categories for financial assets: amortised cost and fair value. This is applicable for the Group’s 2014 financial statements and will result in presentation and measurement changes to the financial instruments held in the balance sheet.

17989 05/08/2010 Proof7
63www.trifast.com
1 Accounting policies continuedb) Basis of preparationThe financial statements are prepared in Sterling, rounded to the nearest thousand. They are prepared on the historical cost basis with the exception of certain items which are measured at fair value as disclosed in the accounting policies below.
The preparation of the financial statements requires management to make judgements, estimates and assumptions that affect the application of policies and reported amounts of assets and liabilities, income and expenses. Actual results may differ from these estimates.
The estimates and underlying assumptions are reviewed on an ongoing basis. Revisions to accounting estimates are recognised in the period in which the estimate is revised if the revision affects only that period or in the period of the revision and future periods if the revision affects current and future periods.
Judgements made by management in the application of IFRS that have significant effect on the financial statements and estimates with a significant risk of material adjustment in the next year are discussed in note 32.
A review of the business activity and future prospects of the Group are covered in the Chairman’s and CEO’s Statement and the Directors’ Business Review. The financial position of the Group, its cash flows, liquidity position and borrowing facilities are described in the Finance Review. Detailed information regarding the Group’s current facility levels, liquidity risk and maturity dates are provided in note 27.
Current trading and forecasts show that the Group will continue to be profitable and generate cash. The banking facilities have been secured and covenants and facilities are in place to provide appropriate headroom against our forecasts.
The asset backed lending facility (maximum £13.50 million) has a three year term. The Group term loan of £4.00 million is due to be repaid by 31 December 2010. Current forecasts show that the Group has sufficient liquidity headroom to continue to operate within its facilities beyond this date. However, management remain keen to renegotiate term facilities with the bank to provide the Group with more secure and flexible facilities for the longer term.
As a result, the Group has held a number of positive discussions with its bankers about its future borrowing needs and no matters have been drawn to its attention to suggest that renewal, if required, may not be forthcoming on acceptable terms.
Considering the Directors’ understanding of the bank’s current position and in conjunction with its current forecasts, the Directors have a reasonable expectation that the Group has adequate resources to continue in operational existence for the foreseeable future. Thus they continue to adopt the going concern basis of accounting in preparing the annual financial statements.
c) Basis of consolidationi) SubsidiariesSubsidiaries are entities controlled by the Group. Control exists when the Group has the power, directly or indirectly, to govern the financial and operating policies of an entity so as to obtain benefits from its activities. In assessing control, potential voting rights that are currently exercisable or convertible are taken into account. The financial statements of subsidiaries are included in the consolidated financial statements from the date that control commences until the date that control ceases.
ii) AssociatesAssociates are those entities in which the Group has the power to exercise significant influence, but not control, over the financial and operating policies. The consolidated financial statements include the Group’s share of the total recognised income and expense of associates on an equity accounted basis, from the date that significant influence commences until the date that significant influence ceases. When the Group’s share of losses exceeds its interest in an associate, the Group’s carrying amount is reduced to £nil and recognition of further losses is discontinued except to the extent that the Group has incurred legal or constructive obligations or made payments on behalf of an associate.

17989 05/08/2010 Proof7
64 Trifast plc Annual Report 2010
Financial Statements
notes (forming part of the Financial Statements) continued
1 Accounting policies continuediii) Transactions eliminated on consolidationIntra-Group balances, and any unrealised gains and losses or income and expenses arising from intra-Group transactions, are eliminated in preparing the consolidated financial statements.
d) Foreign currencyi) Foreign currency transactionsTransactions in foreign currencies are translated at the foreign exchange rate ruling at the date of the transaction. Monetary assets and liabilities denominated in foreign currencies at the balance sheet date are translated to sterling at the foreign exchange rate ruling at that date. Foreign exchange differences arising on translation are recognised in the income statement. Non-monetary assets and liabilities that are measured in terms of historical cost in a foreign currency are translated using the exchange rate at the date of the transaction.
ii) Financial statements of foreign operationsThe assets and liabilities of foreign operations, including goodwill and fair value adjustments arising on consolidation, are translated to sterling at foreign exchange rates ruling at the balance sheet date. The revenues and expenses of foreign operations are translated to sterling at average rates of exchange for the period, where this rate approximates to the foreign exchange rates ruling at the dates of the transactions.
Foreign exchange differences arising on retranslation are recognised directly in a separate component of equity, the translation reserve. They are released into the income statement upon disposal.
e) Hedge of net investment in foreign operationsThe portion of the gain or loss on an instrument used to hedge a net investment in a foreign operation that is determined to be an effective hedge is recognised directly in equity in the translation reserve. The ineffective portion is recognised immediately in the income statement. The effective portion is recycled and recognised in the income statement upon disposal of the operation.
f) Property, plant and equipmenti) Owned assetsProperty, plant and equipment are stated at cost or deemed cost less accumulated depreciation (see below) and impairment losses (see accounting policy l).
Certain items of property, plant and equipment that had been revalued to fair value on or prior to 1 April 2004, the date of transition to Adopted IFRS, are measured on the basis of deemed cost, being the revalued amount at the date of transition.
ii) DepreciationDepreciation is charged to the income statement on a straight-line basis over the estimated useful lives of each part of an item of property, plant and equipment. Land is not depreciated. The depreciation rates are as follows:
Freehold and long leasehold buildings — 2% per annum on a straight-line basis or the period of the leaseShort leasehold properties — period of the leaseMotor vehicles — 25% on a straight-line basisPlant and machinery — 10%–20% per annum on a straight-line basisFixtures, fittings and office equipment — 10%–25% per annum on a straight-line basis
When parts of an item of property, plant and equipment have different useful lives, those components are accounted for as separate items of property, plant and equipment. Where relevant, residual values are reassessed annually.

17989 05/08/2010 Proof7
65www.trifast.com
1 Accounting policies continuediii) Leased assetsThe rental charges on assets held under operating leases are taken to the profit and loss account on a straight-line basis over the life of the lease.
iv) Subsequent costsThe Group recognises in the carrying amount of an item of property, plant and equipment the cost of replacing part of such an item when that cost is incurred, if it is probable that the future economic benefits embodied within the item will flow to the Group and the cost of the item can be measured reliably. All other costs are recognised in the income statement as an expense as incurred.
g) Intangible assetsi) GoodwillAll business combinations are accounted for by applying the purchase method. In respect of business acquisitions that have occurred since 1 April 2004, goodwill represents the difference between the cost of the acquisition and the fair value of the net identifiable assets acquired. Identifiable intangibles are those which can be sold separately or which arise from legal rights regardless of whether those rights are separable.
Positive goodwill arising on acquisitions is stated at cost less any accumulated impairment losses. Goodwill is allocated to cash-generating units and is not amortised but is tested annually for impairment (see accounting policy l).
Goodwill arising on acquisitions before 1 April 1998 was written off to reserves in the year of acquisition. Under IFRS 1 and IFRS 3, this goodwill will now remain eliminated against reserves. Goodwill arising on acquisitions after 1 April 1998 but before 31 March 2004 is included on the basis of its deemed cost, which represents the amortised amount recorded under UK GAAP as at 31 March 2004. The classification and accounting treatment of business combinations that occurred prior to 1 April 2004 has not been reconsidered in preparing the Group’s year end balance sheets.
Decreases in goodwill resulting from the non-payment of contingent consideration are recognised in the period when non payment occurs.
Negative goodwill arising on an acquisition is recognised directly in profit or loss.
ii) Other intangible assetsIntangible assets other than goodwill that are acquired by the Group are stated at cost less accumulated amortisation (see below) and impairment losses (see accounting policy l).
Expenditure on internally generated goodwill and brands is recognised in profit or loss as an expense as incurred.
iii) Subsequent expenditureSubsequent expenditure on capitalised intangible assets is capitalised only when it increases the future economic benefits embodied in the specific asset to which it relates. All other expenditure is expensed as incurred.
iv) AmortisationAmortisation is charged to profit or loss on a straight-line basis over the estimated useful lives of intangible assets, unless such lives are indefinite. Goodwill and intangible assets with an indefinite useful life are tested systematically for impairment at each annual balance sheet date.

17989 05/08/2010 Proof7
66 Trifast plc Annual Report 2010
Financial Statements
notes (forming part of the Financial Statements) continued
1 Accounting policies continuedThe amortisation rates of other intangibles are as follows:
Customer relationships — 12.5% per annumLicences — 20.0% per annum
h) Investments in subsidiariesInvestments in subsidiaries and associates are held in the Company balance sheet at historic cost net of any impairment.
i) Trade and other receivablesTrade and other receivables are stated at their fair value, and subsequently at cost less impairment losses (see accounting policy l).
j) StocksStocks are stated at the lower of cost and net realisable value with provision being made for obsolete and slow-moving items. In determining the cost of raw materials, consumable and goods purchased for resale, a first in, first out purchase price is used and includes expenditure incurred in acquiring the stocks and bringing them to their existing location and condition. For work in progress and finished goods manufactured by the Group, cost is taken as production cost, which includes an appropriate proportion of attributable overheads based on normal operating capacity.
k) Cash and cash equivalentsCash and cash equivalents comprise cash balances and call deposits with an original maturity of three months or less. Bank overdrafts that are repayable on demand and form an integral part of the Group’s cash management are included as a component of cash and cash equivalents only for the purpose of the statement of cash flows.
l) ImpairmentThe carrying amounts of the Group’s assets, other than stocks (see accounting policy j), and deferred tax assets (see accounting policy t), are reviewed at each balance sheet date to determine whether there is any indication of impairment. If any such indication exists, the asset’s recoverable amount is estimated (see accounting policy l(i)).
Financial assets are considered to be impaired if objective evidence indicates that one or more events has had a negative effect on the estimated future cash flows of that asset.
For goodwill and other intangible assets that have an indefinite useful life, the recoverable amount is estimated at each annual balance sheet date.
An impairment loss is recognised whenever the carrying amount of an asset or its cash-generating unit exceeds its recoverable amount. Impairment losses are recognised in the income statement unless the asset is recorded at a revalued amount in which case it is treated as a revaluation decrease.
Impairment losses recognised in respect of cash-generating units are allocated first to reduce the carrying amount of any goodwill allocated to cash-generating units and then to reduce the carrying amount of the other assets in the unit on a pro rata basis. A cash-generating unit is the smallest identifiable group of assets that generates cash inflows that are largely independent of the cash inflows from other assets or groups of assets.
i) Calculation of recoverable amountThe recoverable amount is the greater of net selling price and value in use. In assessing value in use, the estimated future cash flows are discounted to their present value using a pre-tax discount rate that reflects current market assessments of the time value of money and the risks specific to the asset. For an asset that does not generate largely independent cash inflows, the recoverable amount is determined for the cash generating unit to which the asset belongs.

17989 05/08/2010 Proof7
67www.trifast.com
1 Accounting policies continuedii) Reversals of impairmentAn impairment loss in respect of goodwill is not reversed. An impairment loss on any other asset is reversed only to the extent that the asset’s carrying amount does not exceed the carrying amount that would have been determined, net of depreciation or amortisation, if no impairment loss had been recognised.
m) Share capital — DividendsDividends to the Company’s Shareholders are recognised as a liability and deducted from Shareholders’ equity in the period in which the Shareholders’ right to receive payment is established.
n) Interest-bearing borrowingsInterest-bearing borrowings are recognised initially at fair value. Where existing facilities are extinguished (rather than modified) arrangement fees and related costs are expensed in full in the income statement as incurred. Subsequent to initial recognition, interest-bearing borrowings are stated at amortised cost.
o) Employee benefitsi) Defined contribution plansThe Group operates Defined Contribution Pension Schemes which include stakeholder pension plans. The assets of these schemes are held separately from those of the Group in independently administered funds. The amount charged against profits represents the contributions payable to the schemes in respect of the accounting period.
ii) Share-based payment transactionsThe share option programme allows Group employees to acquire shares of the Parent Company. The fair value of options granted is recognised as an employee expense with a corresponding increase in equity. The fair value is measured at grant date and spread over the period during which the employees become unconditionally entitled to the options. The fair value of the options granted is measured using a binomial lattice model, taking into account the terms and conditions upon which the options were granted. The amount recognised as an expense is adjusted to reflect the actual number of share options that vest except where forfeiture is only due to share prices not achieving the threshold for vesting. IFRS 2 has been applied, in accordance with IFRS1, to equity settled share options granted after 7 November 2002 and not vested at 1 April 2005.
iii) Termination benefitsTermination benefits are recognised as an expense when the Group is demonstrably committed without realistic possibility of withdrawal, to a formal plan to terminate employment before the normal retirement date.
p) ProvisionsA provision is recognised in the balance sheet when the Group has a present legal or constructive obligation as a result of a past event, and it is probable that an outflow of economic benefits will be required to settle the obligation. If the effect is material, provisions are determined by discounting the expected future cash flows at a pre-tax rate that reflects current market assessments of the time value of money and, when appropriate, the risks specific to the liability.
i) RestructuringA provision for restructuring is recognised when the Group has approved a detailed and formal restructuring plan and the restructuring has either commenced or has been announced publicly. Future operating costs are not provided for.
ii) DilapidationsA provision for dilapidations is recognised when expected costs become more likely than not and can be estimated reliably.

17989 05/08/2010 Proof7
68 Trifast plc Annual Report 2010
Financial Statements
notes (forming part of the Financial Statements) continued
1 Accounting policies continuediii) Onerous contractsA provision for onerous contracts is recognised when the expected benefits to be derived by the Group from a contract are lower than the unavoidable cost of meeting its obligations under the contract. The provision is measured at the present value of the lower of the expected cost of terminating the contract and the expected net cost of continuing with the contract.
q) Trade and other payablesTrade and other payables are stated at cost.
r) RevenueRevenue from the sale of goods rendered is recognised net of VAT in the Income Statement when the significant risks and rewards of ownership have been transferred to the buyer. In accordance with normal practice, this will be on dispatch of goods.
s) Expensesi) Operating lease paymentsPayments made under operating leases are recognised in the Income Statement on a straight-line basis over the term of the lease. Lease incentives received are recognised in the Income Statement as an integral part of the total lease expense.
ii) Net financing costsNet financing costs comprise interest payable on borrowings calculated using the effective interest rate method and interest receivable on funds invested. Interest income is recognised in the income statement as it accrues, using the effective interest method. Net finance costs also include arrangement fees and related costs recognised in line with accounting policy (n).
t) TaxationTax on the profit or loss for the periods presented comprises current and deferred tax. Tax is recognised in the income statement except to the extent that it relates to items recognised directly in equity, in which case it is recognised in equity.
Current tax is the expected tax payable on the taxable income for the year, using tax rates enacted or substantively enacted at the balance sheet date, and any adjustment to tax payable in respect of previous years.
Deferred tax is provided using the balance sheet liability method, providing for temporary differences between the carrying amounts of assets and liabilities for financial reporting purposes and the amounts used for taxation purposes. The following temporary differences are not provided for: the initial recognition of goodwill not deductible for tax purposes, the initial recognition of assets or liabilities that affect neither accounting nor taxable profit and differences relating to investments in subsidiaries to the extent that they will probably not reverse in the foreseeable future. The amount of deferred tax provided is based on the expected manner of realisation or settlement of the carrying amount of assets and liabilities, using tax rates enacted or substantively enacted at the balance sheet date.
A deferred tax asset is recognised only to the extent that it is probable that future taxable profits will be available against which the asset can be utilised. Deferred tax assets are reduced to the extent that it is no longer probable that the related tax benefit will be realised.
Additional income taxes that arise from the distribution of dividends are recognised at the same time as the liability to pay the related dividend. Information as to the calculation of income tax on the profit or loss for the period presented is included in note 9.

17989 05/08/2010 Proof7
69www.trifast.com
1 Accounting policies continuedu) operating segment reportingA segment is a distinguishable component of the Group that is engaged in providing products or services within a particular geographical economic environment whose operating results are reviewed regularly by the Group’s Chief Operating Decision maker in order to allocate resources and assess its performance and for which discrete financial information is available.
The Group operates in a number of geographical economic environments. The Company only operates in one business segment being the manufacture and logistical supply of industrial fasteners and category ‘C’ components.
v) Financial guarantee contractsWhere the Company enters into financial guarantee contracts to guarantee the indebtedness of other companies within its Group, the Company considers these to be insurance arrangements, and accounts for them as such. In this respect, the Company treats the guarantee contract as a contingent liability until such time as it becomes probable that the Company will be required to make a payment under the guarantee.
w) Earnings per shareThe Group presents basic and diluted earnings per share (EPS) data for its ordinary shares. Basic EPS is calculated by dividing the profit or loss attributable to ordinary Shareholders of the Company by the weighted average number of ordinary shares outstanding during the period. Diluted EPS is determined by adjusting the profit or loss attributable to ordinary Shareholders and the weighted average number of ordinary shares outstanding for the effects of all dilutive potential ordinary shares, which comprise share options granted to employees.
x) Discontinued operationsA discontinued operation is a component of the Group’s business that represents a separate major line of business or geographical area of operations that has been disposed of or is held for sale, or is a subsidiary acquired exclusively with a view to resale. Classification as a discontinued operation occurs upon disposal or when the operation meets the criteria to be classified as held for sale, if earlier. When an operation is classified as a discontinued operation, the comparative statement of comprehensive income is re-presented as if the operation had been discontinued from the start of the comparative period.
y) Underlying measure of profits and lossesThe Group believes that underlying operating profit and underlying profit before tax provide additional guidance to statutory measures to help understand the underlying performance of the business during the financial period. The term underlying is not defined under International Financial Reporting Standards. It is a measure that is used by management to assess the underlying performance of the business internally and is not intended to be a substitute measure for Adopted IFRSs’ GAAP measures. The Group defines these underlying measures as follows:
Underlying operating profit is profit before taxation and separately disclosed items (see (z) and note 2).
Underlying earnings used in the calculation of underlying earnings per share is profit after tax excluding separately disclosed items.
It should be noted that the definitions of underlying items being used in these financial statements are those used by the Group and may not be comparable with the term “underlying” as defined by other companies within both the same sector or elsewhere.
Separately disclosed items are included within the income statement caption to which they relate.
z) Separately disclosed items (see note 2)Separately disclosed items are those significant items which in management’s judgement are highlighted by virtue of their size or incidence to enable a full understanding of the Group’s financial performance.
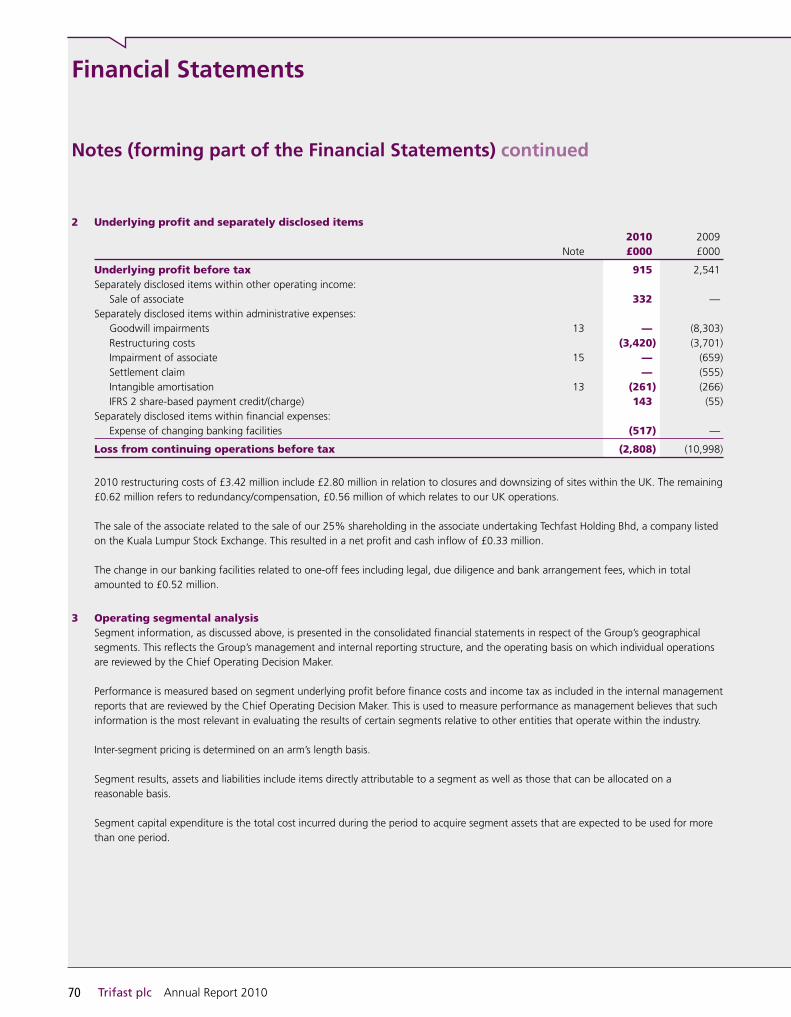
17989 05/08/2010 Proof7
70 Trifast plc Annual Report 2010
Financial Statements
notes (forming part of the Financial Statements) continued
2 Underlying profit and separately disclosed items 2010 2009 Note £000 £000
Underlying profit before tax 915 2,541Separately disclosed items within other operating income: Sale of associate 332 —Separately disclosed items within administrative expenses: Goodwill impairments 13 — (8,303) Restructuring costs (3,420) (3,701) Impairment of associate 15 — (659) Settlement claim — (555) Intangible amortisation 13 (261) (266) IFRS 2 share-based payment credit/(charge) 143 (55)Separately disclosed items within financial expenses: Expense of changing banking facilities (517) —
Loss from continuing operations before tax (2,808) (10,998)
2010 restructuring costs of £3.42 million include £2.80 million in relation to closures and downsizing of sites within the UK. The remaining £0.62 million refers to redundancy/compensation, £0.56 million of which relates to our UK operations.
The sale of the associate related to the sale of our 25% shareholding in the associate undertaking Techfast Holding Bhd, a company listed on the Kuala Lumpur Stock Exchange. This resulted in a net profit and cash inflow of £0.33 million.
The change in our banking facilities related to one-off fees including legal, due diligence and bank arrangement fees, which in total amounted to £0.52 million.
3 operating segmental analysisSegment information, as discussed above, is presented in the consolidated financial statements in respect of the Group’s geographical segments. This reflects the Group’s management and internal reporting structure, and the operating basis on which individual operations are reviewed by the Chief Operating Decision Maker.
Performance is measured based on segment underlying profit before finance costs and income tax as included in the internal management reports that are reviewed by the Chief Operating Decision Maker. This is used to measure performance as management believes that such information is the most relevant in evaluating the results of certain segments relative to other entities that operate within the industry.
Inter-segment pricing is determined on an arm’s length basis.
Segment results, assets and liabilities include items directly attributable to a segment as well as those that can be allocated on a reasonable basis.
Segment capital expenditure is the total cost incurred during the period to acquire segment assets that are expected to be used for more than one period.

17989 05/08/2010 Proof7
71www.trifast.com
3 operating segmental analysis continuedGeographical operating segmentsThe Group is composed of the following main geographical operating segments:
UK Mainland Europe/USA: includes Norway, Sweden, Hungary, Southern Ireland, Holland, Poland, USA, Mexico and Costa RicaAsia: includes Malaysia, China, Singapore and Taiwan
In presenting information on the basis of geographical operating segments, segment revenue and segment assets are based on the geographical location of our entities across the world, and are consolidated into the three distinct geographical regions, which the Board uses to monitor and assess the Group.
Mainland Europe/ Common UK USA Asia costs TotalMarch 2010 £000 £000 £000 £000 £000
Revenue*Revenue from external customers 46,464 18,027 21,444 — 85,935Inter-segment revenue 1,154 271 2,596 — 4,021
Total revenue 47,618 18,298 24,040 — 89,956
Segment result before separately disclosed items (590) (341) 2,787 (941) 915Separately disclosed items (see note 2) (3,723)
Loss before tax (2,808)
Specific disclosure items Depreciation and amortisation 318 49 615 347 1,329Impairment loss — — — — —
Assets and liabilitiesSegment assets 27,799 8,608 29,249 8,507 74,163Segment liabilities (21,351) (2,031) (4,356) (6,244) (33,982)

17989 05/08/2010 Proof7
72 Trifast plc Annual Report 2010
Financial Statements
notes (forming part of the Financial Statements) continued
3 operating segmental analysis continued Mainland Europe/ Common UK USA Asia Costs TotalMarch 2009 £000 £000 £000 £000 £000
Revenue*Revenue from external customers 58,881 20,717 25,303 — 104,901Inter-segment revenue 2,749 369 3,900 — 7,018
Total revenue 61,630 21,086 29,203 — 111,919
Segment result before separately disclosed items 789 732 3,906 (2,886) 2,541Separately disclosed items (see note 2) (13,539)
Loss before tax from continuing operations (10,998)Discontinued Turkish business loss (before tax) (see note 10) (3,727)
Loss before tax (14,725)
Specific disclosure itemsDepreciation and amortisation 458 72 588 359 1,477Impairment loss — — 1,503 7,608 9,111
Assets and liabilitiesSegment assets 24,487 9,884 30,739 11,960 77,070Segment liabilities (11,743) (2,117) (6,561) (14,179) (34,600)
* Of the Asian external revenue, £2.01 million (2009: £3.3 million) was sold into the American market and £4.68 million (2009: £5.2 million) sold into the European market.
There were no major customers that represent more than 10% of the revenue.
There was no material difference in the UK, Europe Mainland and USA regions between the external revenue based on location of the entities and the location of the customers.
Revenue is derived solely from the manufacture and logistical supply of industrial fasteners and category ‘C’ components.
4 other operating income 2010 2009 Note £000 £000
Sale of associate (note 2) 2 332 —Other 218 156
550 156

17989 05/08/2010 Proof7
73www.trifast.com
5 Expenses and Auditors’ remunerationIncluded in loss for the year are the following: 2010 2009 Note £000 £000
Depreciation 11 1,068 1,211Impairment/amortisation of acquired intangibles 13 261 9,377Forex loss/(gain) 524 (546)
Auditors’ remuneration: 2010 2009 £000 £000
Audit of these financial statements 34 34Audit of financial statements of subsidiaries pursuant to legislation 164 155Other services relating to taxation 84 120All other services 47 33
6 Staff numbers and costsThe average number of persons employed by the Group (including Directors) during the year, analysed by category, was as follows:
Group Number of employees 2010 2009
Office and management 47 50Manufacturing 234 281Sales 118 121Distribution 469 587
868 1,039
The aggregate payroll costs of these persons were as follows: Group 2010 2009 £000 £000
Wages and salaries (including bonus) 16,140 18,721Share-based payments (143) 55Social security costs 1,544 1,781Other pension costs (see note 23) 1,105 1,325
18,646 21,882

17989 05/08/2010 Proof7
74 Trifast plc Annual Report 2010
Financial Statements
notes (forming part of the Financial Statements) continued
7 Directors’ emoluments 2010 2009 £000 £000
Directors’ emoluments 510 862Company contributions to money purchase pension plans 37 139Compensation for loss of office — 656
547 1,657
The emoluments of individual Directors are shown in the Remuneration Report on page 52.
The aggregate of emoluments (including compensation for loss of office in 2009) of the highest paid Director was £187,000 (2009: £671,000), and Company pension contributions of £37,000 (2009: £59,000) were made to a money purchase scheme on his behalf.
Number of Directors 2010 2009
Retirement benefits are accruing to the following number of Directors under: Money purchase schemes 1 3The number of Directors who exercised share options — —
See pages 47 to 52 of the Remuneration Report for more details.
Directors’ rights to subscribe for shares in the Company are also set out in the Remuneration Report.
8 Financial income and expense 2010 2009 £000 £000
Financial income 96 99
Financial expenses Interest payable on bank loans 246 896 Expense of changing banking facilities (note 2) 517 —
Total financial expenses 763 896

17989 05/08/2010 Proof7
75www.trifast.com
9 TaxationRecognised in the income statement 2010 2009 Note £000 £000
Current UK tax expense: Current year — 755 Double taxation relief — (755)
— —
Current tax on foreign income for the year 790 1,079Adjustments for prior years (76) (31)
714 1,048
Total current tax 714 1,048
Deferred tax expense (note 16) Origination and reversal of temporary differences (1,254) (475) Adjustments for prior years (81) (53)
(1,335) (528)
Tax in income statement from continuing operations (621) 520Tax from discontinued operations 10 — 65
Total tax in income statement (621) 585
Reconciliation of effective tax rate (“ETR”) and tax expense 2010 ETR 2009 ETR £000 % £000 %
Loss for the period (2,187) (15,310)Tax from continuing operations (621) 520Tax from discontinued operations — 65
Loss before tax (2,808) (14,725)
Tax using the UK corporation tax rate of 28% (2009: 28%) (786) 28 (4,123) 28Goodwill impairment — — 2,325 (16)Impairment of associate — — 185 (1)Tax suffered on dividends 94 (3) 579 (4)Non-deductible expenses 168 (6) 294 (2)IFRS 2 share option (credit)/charge (7) — 164 (1)Sale of associate (93) 3 — —Deferred tax assets not recognised 343 (12) 616 (4)Losses from discontinued operations — — 1,107 (8)Different tax rates on overseas earnings (183) 6 (478) 3Over provided in prior years (157) 6 (84) 1
Total tax in income statement (621) 22 585 (4)

17989 05/08/2010 Proof7
76 Trifast plc Annual Report 2010
Financial Statements
notes (forming part of the Financial Statements) continued
10 Discontinued operationIn March 2009, the Group sold the Turkish business (TR Keba Ltd) back to Keba’s original management team and this was shown as a discontinued operation as at 31 March 2009. 2009 £000
Results of discontinued operationRevenue 2,697Expenses (3,474)
Results from operating activities (777)Income tax (65)
Results from operating activities, net of income tax (842)Loss on sale of discontinued operation (including goodwill impairment) (2,950)
Loss for the period (3,792)
Basic loss per share (4.45p)Diluted loss per share (4.45p)Cash flows from/(used in) discontinued operationNet cash used in operating activities (426)Net cash from investing activities 387Net cash used in financing activities (2)
Net cash used in discontinued operation (41)
Effect of disposal on the financial position of the GroupGoodwill 808Property, plant and equipment 65Stock 1,031Trade and other receivables 939Cash and cash equivalents 104Deferred tax liabilities (207)Trade and other payables 210
Net assets and liabilities 2,950
Consideration received, satisfied in cash —Cash disposed of (104)
Net cash outflow (104)

17989 05/08/2010 Proof7
77www.trifast.com
11 Property, plant and equipment — Group Land Leasehold Plant Fixtures and improve- and and Motor buildings ments equipment fittings vehicles Total £000 £000 £000 £000 £000 £000
CostBalance at 1 April 2008 5,679 663 9,205 5,155 264 20,966Additions 29 26 500 156 19 730Disposals — (78) (843) (1,453) (93) (2,467)Discontinued operations — — (22) (71) (10) (103)Effect of movements in foreign exchange 539 129 1,316 205 66 2,255
Balance at 31 March 2009 6,247 740 10,156 3,992 246 21,381
Balance at 1 April 2009 6,247 740 10,156 3,992 246 21,381Additions — 24 98 91 7 220Disposals — (9) (19) (92) (32) (152)Effect of movements in foreign exchange 45 (10) 114 (9) (6) 134
Balance at 31 March 2010 6,292 745 10,349 3,982 215 21,583
Depreciation and impairmentBalance at 1 April 2008 1,235 348 6,527 4,092 194 12,396Depreciation charge for the year 90 141 590 368 22 1,211Disposals — (46) (659) (1,193) (90) (1,988)Discontinued operations — — (9) (26) (3) (38)Effect of movements in foreign exchange 116 78 816 140 44 1,194
Balance at 31 March 2009 1,441 521 7,265 3,381 167 12,775
Balance at 1 April 2009 1,441 521 7,265 3,381 167 12,775Depreciation charge for the year 96 100 582 270 20 1,068Disposals — (8) (11) (80) (30) (129)Effect of movements in foreign exchange 13 (3) 119 3 (3) 129
Balance at 31 March 2010 1,550 610 7,955 3,574 154 13,843
Net book valueAt 1 April 2008 4,444 315 2,678 1,063 70 8,570
At 31 March 2009 4,806 219 2,891 611 79 8,606
At 31 March 2010 4,742 135 2,394 408 61 7,740
Included in the net book value of land and buildings are £3.35 million (2009: £3.41 million) of freehold land and buildings, and £1.39 million (2009: £1.39 million) of long leasehold land and buildings.
£3.35 million (2009: £3.35 million) of land and buildings have been recognised at a deemed cost that is equal to their fair value at transition date as allowable under IFRS/transition rules.

17989 05/08/2010 Proof7
78 Trifast plc Annual Report 2010
Financial Statements
notes (forming part of the Financial Statements) continued
12 Property, plant and equipment — Company Land Fixtures and and buildings fittings Total £000 £000 £000
CostBalance at 1 April 2008 3,468 750 4,218Additions 29 — 29
Balance at 31 March 2009 3,497 750 4,247
Balance at 1 April 2009 and 31 March 2010 3,497 750 4,247
Depreciation and impairment Balance at 1 April 2008 777 666 1,443Depreciation charge for the year 54 39 93
Balance at 31 March 2009 831 705 1,536
Balance at 1 April 2009 831 705 1,536Depreciation charge for the year 54 33 87
Balance at 31 March 2010 885 738 1,623
Net book valueAt 1 April 2008 2,691 84 2,775
At 31 March 2009 2,666 45 2,711
At 31 March 2010 2,612 12 2,624
Included in the net book value of land and buildings are £2.61 million (2009: £2.67 million) of freehold land and buildings.
£3.35 million (2009: £3.35 million) of land and buildings have been recognised at a deemed cost that is equal to their fair value at transition date as allowable under IFRS/transition rules.

17989 05/08/2010 Proof7
79www.trifast.com
13 Intangible assets — Group Goodwill other Total £000 £000 £000
CostBalance at 1 April 2008 27,001 2,152 29,153Effect of movements in foreign exchange 2,586 — 2,586
Balance at 31 March 2009 29,587 2,152 31,739
Balance at 1 April 2009 29,587 2,152 31,739Effect of movements in foreign exchange (476) — (476)
Balance at 31 March 2010 29,111 2,152 31,263
Amortisation and impairment Balance at 1 April 2008 4,636 689 5,325Amortisation for the year — 266 266Impairment losses in continuing operations 8,303 — 8,303Impairment loss in discontinued operations 808 — 808Effect of movements in foreign exchange 657 — 657
Balance at 31 March 2009 14,404 955 15,359
Balance at 1 April 2009 14,404 955 15,359
Amortisation for the year — 261 261Effect of movements in foreign exchange (715) — (715)
Balance at 31 March 2010 13,689 1,216 14,905
Net book valueAt 1 April 2008 22,365 1,463 23,828
At 31 March 2009 15,183 1,197 16,380
At 31 March 2010 15,422 936 16,358
Other intangible assets are made up of customer relationships acquired as part of the acquisition of Serco Ryan Ltd. The remaining amortisation period of this asset is 3.5 years.
There were no impairments made during 2010 (2009: £9.11 million).

17989 05/08/2010 Proof7
80 Trifast plc Annual Report 2010
Financial Statements
notes (forming part of the Financial Statements) continued
13 Intangible assets — Group continuedThe following cash generating units have significant carrying amounts of goodwill: 2010 2009 £000 £000
Special Fasteners Engineering Co. Ltd (Taiwan) 8,927 8,688TR Fastenings AB (Sweden) 1,063 1,063Lancaster Fastener Company Ltd (UK) 1,245 1,245Serco Ryan Ltd (within TR Fastenings Ltd) (UK) 4,083 4,083Other 104 104
15,422 15,183
The Group tests goodwill annually for impairment. The recoverable amount of cash-generating units is determined from value in use calculations.
Value in use was determined by discounting the future cash flows generated from the continuing use of the unit. In this method, the free cash flows after funding internal needs of the subject company are forecast for a finite period of five years based on actual operating results, budgets and economic market research. Beyond the finite period, a terminal (residual) value is estimated using an assumed stable cash flow figure.
The values assigned to the key assumptions represent management’s assessment of future trends in the fastenings market and are based on both external and internal sources of historical data.
The table below highlights the key assumptions: Taiwan UK Sweden 2010 2009 2010 2009 2010 2009
Pre-tax discount rate 17% 16% 17% 16% 17% 16%Growth rate 4% 4% 3% 3% 2% 2%
Long-term growth rateFive year management plans are used for the Group’s value in use calculations. Long-term growth rate into perpetuity has been determined as the lower of:
l the nominal GDP rates for the country of operation; andl the long-term compound annual growth rate in EBITDA in years six to ten estimated by management.
Pre-tax risk adjusted discount rateThe discount rate applied to the cash flows of each of the Group’s operations is based on the risk-free rate for ten year bonds issued by the government in the respective market, adjusted for a risk premium to reflect both the increased risk of investing in equities and the systematic risk of the specific Group operating company.
In making this adjustment, inputs required are the equity market risk premium (that is the increased return required over and above a risk-free rate by an investor who is investing in the market as a whole) and the risk adjustment, beta, applied to reflect the risk of the specific Group operating company relative to the market as a whole.

17989 05/08/2010 Proof7
81www.trifast.com
13 Intangible assets — Group continuedIn determining the risk adjusted discount rate, management has applied an adjustment for the systematic risk to each of the Group’s operations determined using an average of the betas of comparable listed fastener distribution and manufacturing companies and, where available and appropriate, across a specific territory. Management has used a forward-looking equity market risk premium that takes into consideration studies by independent economists, the average equity market risk premium over the past ten years and the market risk premiums typically used by investment banks in evaluating acquisition proposals.
The table above discloses pre-tax discount rates of 17% across the three CGUs. This reflects that certain components increase the discount rate in one region more than others, such as higher cost of debt in Asia. However, the slower recovery and automotive exposure in the UK and Sweden means a higher territorial premium has been applied. Overall, the Board is confident the pre-tax adjusted discount rates adequately reflect the circumstances in each region and are in accordance with IAS 36.
Sensitivity to changes in assumptionsOther than as disclosed below, management believes that no reasonably possible change in any of the above key assumptions would cause the carrying value of any cash-generating unit to exceed its recoverable amount.
The estimated values in use at 31 March 2010 of the Group’s operations in Taiwan, UK and Sweden were S$0.80 million, £3.02 million and £0.30 million above their respective carrying value and, consequently, any material adverse change in key assumptions would, in isolation, cause an impairment loss to be recognised.
The tables below show the key assumptions used in the value in use calculations for Taiwan, UK and Sweden and the amount by which each key assumption must change in isolation in order for the estimated recoverable amount to be equal to its carrying value.
Taiwan UK Sweden
Pre-tax adjusted discount rate 18% 19% 18%Budgeted change in EBITDA 3% 15% 11%Long-term growth rate 3.6% 0.2% 0.3%
Other subsidiaries are not included in the calculation as their individual cash-generating units show a significant headroom over the goodwill carrying value.
The £0.24 million increase in the goodwill of SFE refers to a foreign exchange gain, as the investment is held in Singapore dollars within TR Asia Investment Holdings Pte Ltd.

17989 05/08/2010 Proof7
82 Trifast plc Annual Report 2010
Financial Statements
notes (forming part of the Financial Statements) continued
14 Intangible assets — Company other £000
CostBalance at 1 April 2008 62
Balance at 31 March 2009 62
Balance at 31 March 2010 62
Amortisation and impairmentBalance at 1 April 2008 58Amortisation for the year 4
Balance at 31 March 2009 62
Balance at 1 April 2009 62Amortisation for the year —
Balance at 31 March 2010 62
Net book valueAt 1 April 2008 4
At 31 March 2009 —
At 31 March 2010 —
15 Equity investments Company — investments in subsidiaries £000
CostBalance at 1 April 2008 36,995Additions 2,129Disposals (3,165)
Balance at 31 March 2009 35,959
Balance at 1 April 2009 and 31 March 2010 35,959
ProvisionBalance at 1 April 2008 7,885Increase in provision 6,200
Balance at 31 March 2009 14,085
Balance at 1 April 2009 and 31 March 2010 14,085
Net book valueAt 1 April 2008 29,110
At 31 March 2009 21,874
At 31 March 2010 21,874

17989 05/08/2010 Proof7
83www.trifast.com
15 Equity investments continuedThere were no movements during 2010 in relation to investments.
During 2009 an additional £0.42 million was invested in TR Keba Ltd. At the end of 2009 as a result of it being sold back to its existing management (note 10), TR Keba’s loan and interest outstanding to the Company of £1.71 million was capitalised. Subsequently, the sale of the business resulted in a total investment disposal of £3.17 million.
Also during 2009, the provision increased by £6.20 million due to the impairment of Serco Ryan (within TR Fastenings Ltd) following our investment reviews under IAS 36 (see note 13).
Company — Investment in associateThe Company sold its 25% shareholding in the associate Techfast Holding Bhd on 24 September 2009. This resulted in a net profit and cash inflow of £0.33 million (2009: impaired by £0.50 million Company, £0.66 million Group).
The Group’s share of profit in the above associate for the year ended 31 March 2010 was £nil (2009: £nil).
Details of principal subsidiary and associate undertakings, country of registration and principal activity are included on page 104.
16 Deferred tax assets and liabilities — GroupRecognised deferred tax assets and liabilities Deferred tax assets and liabilities are attributable to the following:
Assets Liabilities Net 2010 2009 2010 2009 2010 2009 £000 £000 £000 £000 £000 £000
Property, plant and equipment (287) (458) 317 555 30 97Intangible assets — — 262 336 262 336Stocks (185) (244) — — (185) (244)Provisions/IFRS 2 (141) (186) 39 97 (102) (89)Tax value of loss carried forward (1,705) (459) — — (1,705) (459)
Tax (assets)/liabilities (2,318) (1,347) 618 988 (1,700) (359)Tax set-off 272 640 (272) (640) — —
Net tax (assets)/liabilities (2,046) (707) 346 348 (1,700) (359)

17989 05/08/2010 Proof7
84 Trifast plc Annual Report 2010
Financial Statements
notes (forming part of the Financial Statements) continued
16 Deferred tax assets and liabilities — Group continuedA potential £1.26 million (2009: £1.23 million) deferred tax asset relating to tax losses at TR Fastenings Inc. was not recognised on the grounds that recovery is uncertain. In addition, a potential £0.77 million (2009: £0.46 million) deferred tax asset relating to the Company’s losses was not recognised on the grounds that recovery of these losses is uncertain.
Movement in deferred tax during the year Recognised in 1 April Recognised translation 31 March 2009 in income reserve 2010 £000 £000 £000 £000
Property, plant and equipment 97 (70) 3 30Intangible assets 336 (73) (1) 262Stocks (244) 60 (1) (185)Provisions/IFRS 2 (89) (11) (2) (102)Tax value of loss carried forward (459) (1,241) (5) (1,705)
(359) (1,335) (6) (1,700)
Movement in deferred tax during the prior year Recognised in 1 April Recognised translation 31 March 2008 in income reserve 2009 £000 £000 £000 £000
Property, plant and equipment 214 (160) 43 97Intangible assets 409 (73) — 336Stocks (239) 1 (6) (244)Provisions/IFRS 2 (250) 163 (2) (89)Tax value of loss carried forward — (459) — (459)
Continuing operations 134 (528) 35 (359)Discontinued operations (58) 65 (7) —
76 (463) 28 (359)

17989 05/08/2010 Proof7
85www.trifast.com
17 Deferred tax assets and liabilities — CompanyRecognised deferred tax assets and liabilities Deferred tax assets and liabilities are attributable to the following:
Assets Liabilities Net 2010 2009 2010 2009 2010 2009 £000 £000 £000 £000 £000 £000
Property, plant and equipment — — 114 352 114 352Provisions/IFRS 2 (20) (46) — — (20) (46)
Tax (assets)/liabilities (20) (46) 114 352 94 306Tax set-off 20 46 (20) (46) — —
Net tax liabilities — — 94 306 94 306
Movement in deferred tax during the year 1 April Recognised 31 March 2009 in income 2010 £000 £000 £000
Property, plant and equipment 352 (238) 114Provisions/IFRS 2 (46) 26 (20)
306 (212) 94
Movement in deferred tax during the prior year 1 April Recognised 31 March 2008 in income 2009 £000 £000 £000
Property, plant and equipment 334 18 352Provisions/IFRS 2 (165) 119 (46)
169 137 306

17989 05/08/2010 Proof7
86 Trifast plc Annual Report 2010
Financial Statements
notes (forming part of the Financial Statements) continued
18 Stocks Group 2010 2009 £000 £000
Raw materials and consumables 1,625 2,109Work in progress 749 376Finished goods and goods for resale 17,767 21,467
20,141 23,952
19 Trade and other receivables Group Company 2010 2009 2010 2009 £000 £000 £000 £000
Trade receivables 19,369 17,066 — —Non-trade receivables and prepayments 1,089 1,296 2 13Amounts owed by subsidiary undertakings — — 1,395 1,664
20,458 18,362 1,397 1,677
20 Cash and cash equivalents/bank overdrafts Group Company 2010 2009 2010 2009 £000 £000 £000 £000
Cash and cash equivalents per balance sheet 7,420 9,063 2,176 4,019Bank overdrafts per balance sheet — (2,641) (6,524) (5,728)
Cash and cash equivalents per cash flow statements 7,420 6,422 (4,348) (1,709)

17989 05/08/2010 Proof7
87www.trifast.com
21 other interest-bearing loans and borrowingsThis note provides information about the contractual terms of the Group and Company’s interest-bearing loans and borrowings. For more information about the Group and Company’s exposure to interest rate and foreign currency risk, see note 27.
Current Non-current 2010 2009 2010 2009Initial Loan Value Rate Maturity £000 £000 £000 £000
CompanyBridging loan £2.00 million Base +4.00% 2010 1,210 — — —Term loan £4.00 million Libor +3.75% 2010 3,667 — — —Acquisition SEK 30 million Libor +0.95% 2009 — 64 — —Acquisition £15.0 million Libor +0.91% 2012 — 1,071 — 10,446
4,877 1,135 — 10,446
other GroupAcquisition $21.78 million Libor +0.80% 2011 — 1,412 — 1,825Asset-based lending £13.50 million Base (+2.25% (Maximum) to +2.75%) 2013 7,226 — — —
7,226 1,412 — 1,825
Total Group 12,103 2,547 — 12,271
The Company’s bridging and term loans are secured by corporate guarantees and debentures over the Group’s UK, Singapore and Swedish entities.
The asset-based lending facility is secured over the receivables and stock of the Group’s UK companies and the property of the Company. The amount available is dependent on the receivables and stock levels at that point in time. Due to the revolving nature of this facility, it is shown as current on the Statement of financial position. However, the facility agreement runs until February 2013.

17989 05/08/2010 Proof7
88 Trifast plc Annual Report 2010
Financial Statements
notes (forming part of the Financial Statements) continued
22 Trade and other payables Group Company 2010 2009 2010 2009 £000 £000 £000 £000
Trade payables 12,124 9,925 — 128Amounts payable to subsidiary undertakings — — 810 633Non-trade payables and accrued expenses 3,864 4,148 403 338Interest payable — 74 — 74Other taxes and social security 713 691 2 2
16,701 14,838 1,215 1,175
23 Employee benefitsPension plansDefined contribution plansThe Group operates a number of defined contribution pension plans, which include stakeholder pension plans whose assets are held separately from those of the Group, in independently administered funds.
The total expense relating to these plans in the current year was £1.11 million (2009: £1.33 million) and represents contributions payable by the Group to the funds.
At the end of the financial year, there were outstanding pensions contributions of £0.06 million (2009: £0.09 million), which are included in creditors.

17989 05/08/2010 Proof7
89www.trifast.com
23 Employee benefits continuedShare-based payments The Group Share Options and Share Matching Plans provide for a grant price equal to the average quoted market price of the Group shares on the date of grant. The vesting period is generally three years. The options expire if they remain unexercised after the exercise period has lapsed. Furthermore, options are forfeited if the employee leaves the Group before the options vest, unless for retirement, redundancy or health reasons. The options are equity settled.
The number and weighted average exercise prices of share options are as follows: 2010 2009 Weighted Weighted average average exercise exercise price price options £ Options £
Outstanding at beginning of year 1,582,218 0.83 3,457,168 0.99Granted during the year 8,512,488 0.11 648,123 0.45Forfeited/lapsed during the year (1,254,545) 0.85 (2,523,073) 0.96Exercised during the year — — —Outstanding at the end of the year 8,840,161 0.13 1,582,218 0.83Exercisable at the end of the year 224,452 0.40 887,374 1.08
The options outstanding at 31 March 2010 had a weighted average remaining contractual life of 6.40 years (2009: 2.40 years) and exercise prices ranging from £0.085 to £0.91 (2009: £0.45 to £2.69).
The fair value of services received in return for share options granted are measured by reference to the fair value of share options granted. The estimate of the fair value of the services received is measured based on binominal lattice and Monte Carlo models. The contractual life of the option is used as an input into this model.
Options granted before September 2004 (with the exception of SAYE) can only be exercised if the Company’s growth based on annualised earnings per share in the period or any three consecutive financial years after the grant exceeds RPI plus an average of 2% per annum. Options granted in September 2004 can only be exercisable where the Company’s earnings per share growth is at least RPI plus 4% over the three year period from date of grant.
The options granted in September 2009 are exercisable between September 2012 and September 2019 at an exercise price of £0.085 per share. They can only be exercised when the Company’s share price has reached a minimum of 51p, maintained as an average over the three month period preceding the Notice of Exercise, and the Company has achieved a minimum of 10% Return on Capital Employed.

17989 05/08/2010 Proof7
90 Trifast plc Annual Report 2010
Financial Statements
notes (forming part of the Financial Statements) continued
23 Employee benefits continuedThe only vesting conditions on all other options are detailed below: No. out- Share standing price Expected on on date Exercise Expected Vesting Expected Risk-free annual FairDate of Type of Valuation 31 March of grant price volatility period Life rate dividend valuegrant Instrument model 2010 (£) (£) % (yrs) (yrs) % % (£)
02/07/2003 Share Options Binomial 37,000 0.640 0.650 48.21 3.00 3.00 3.50 2.50 0.2027/09/2004 Share Options Binomial 40,000 0.760 0.730 37.45 3.00 3.00 4.72 2.50 0.2201/10/2003 7 year SAYE Binomial 1,126 0.760 0.600 50.45 7.00 7.00 4.43 2.50 0.4001/10/2004 5 year SAYE Binomial 11,803 0.760 0.700 37.15 5.00 5.00 4.79 2.50 0.2801/10/2004 7 year SAYE Binomial 4,595 0.760 0.700 37.15 7.00 7.00 4.84 2.50 0.3101/10/2005 5 year SAYE Binomial 8,497 0.710 0.700 28.81 5.00 5.00 4.29 2.50 0.1801/10/2005 7 year SAYE Binomial 2,042 0.710 0.700 28.81 7.00 7.00 4.33 2.50 0.2115/03/2005 Share Options Binomial 7,000 0.830 0.830 29.24 3.00 3.00 4.85 2.50 0.1301/10/2006 SAYE 3 year Binomial 92,378 0.600 0.500 39.85 3.00 3.00 4.82 3.00 0.2001/10/2006 SAYE 5 year Binomial 11,592 0.600 0.500 39.85 5.00 5.00 4.70 3.00 0.2201/10/2006 SAYE 7 year Binominal 2,736 0.600 0.500 39.85 7.00 7.00 4.66 3.00 0.3031/07/2007 LTIP Monte Carlo 36,474 0.830 0.000 28.87 3.00 3.00 5.56 3.39 0.5001/10/2007 SAYE 3 year Binomial 24,948 0.740 0.750 29.26 3.00 3.00 4.94 3.39 0.1401/10/2007 SAYE 5 year Binomial 13,971 0.740 0.750 29.26 5.00 5.00 5.00 3.39 0.1701/10/2007 SAYE 7 year Binomial 6,091 0.740 0.750 29.26 7.00 7.00 5.06 3.39 0.2031/07/2008 LTIP Monte Carlo 81,182 0.520 0.000 32.30 3.00 3.00 4.77 5.44 0.2201/10/2008 SAYE 3 year Binomial 65,582 0.370 0.450 34.02 3.00 3.00 4.02 7.67 0.0401/10/2008 SAYE 5 Year Binomial 60,033 0.370 0.450 34.02 5.00 5.00 4.17 7.67 0.0401/10/2008 SAYE 7 Year Binomial 25,591 0.370 0.450 34.02 7.00 7.00 4.31 7.67 0.0430/09/2009 Share Monte Options Carlo 5,950,000 0.280 0.085 53.54 3.00 3.00 1.94 3.32 0.0901/10/2009 SAYE 3 Year Binomial 1,566,201 0.280 0.170 45.44 3.00 3.00 1.83 3.38 0.1101/10/2009 SAYE 5 Year Binomial 638,457 0.280 0.170 45.44 5.00 5.00 2.58 3.38 0.1201/10/2009 SAYE 7 Year Binomial 222,444 0.280 0.170 45.44 7.00 7.00 3.09 3.38 0.12

17989 05/08/2010 Proof7
91www.trifast.com
23 Employee benefits continuedExpected volatility was determined by calculating the historical volatility of the Group’s share price over one, two and three years back from the date of grant. The expected life used in the model has been adjusted, based on management’s best estimate for the effects of non-transferability, exercise restrictions and behavioural considerations.
The Group recognised a total credit of £0.14 million and a cost of £0.06 million in relation to equity settled share-based payment transactions in 2010 and 2009 respectively.
As at 31 March 2010, outstanding options to subscribe for ordinary shares of 5p were as follows:
Number of ContractualGrant date / employees entitled instruments life of options
07/08/01 / Executive 15,000 Aug 2004–Aug 201101/10/02 / SAYE 33,074 Oct 200902/07/03 / Executive 37,000 July 2006–July 201301/10/03 / SAYE 1,126 Oct 201027/09/04 / Executive 40,000 Sept 2007–Sept 201421/10/04 / SAYE 16,398 Oct 2009, 201115/03/05 / Executive 7,000 Mar 2008–Mar 201501/10/05 / SAYE 10,539 Oct 2010, 201201/10/06 / SAYE 106,706 Oct 2009, 2011, 201301/10/07 / SAYE 45,010 Oct 2010, 2012, 201401/10/08 / SAYE 151,206 Oct 2011, 2013, 201501/10/09 / SAYE 2,427,102 Oct 2012, 2014, 201630/09/10 / Executive 5,950,000 Sept 2012–Sept 2019
8,840,161
In accordance with IFRS 1, transitional provisions, share option arrangements granted before 7 November 2002 have not been included in the IFRS 2 charge calculated.
All options require continued employment from grant date to the later of vesting date or exercise date.
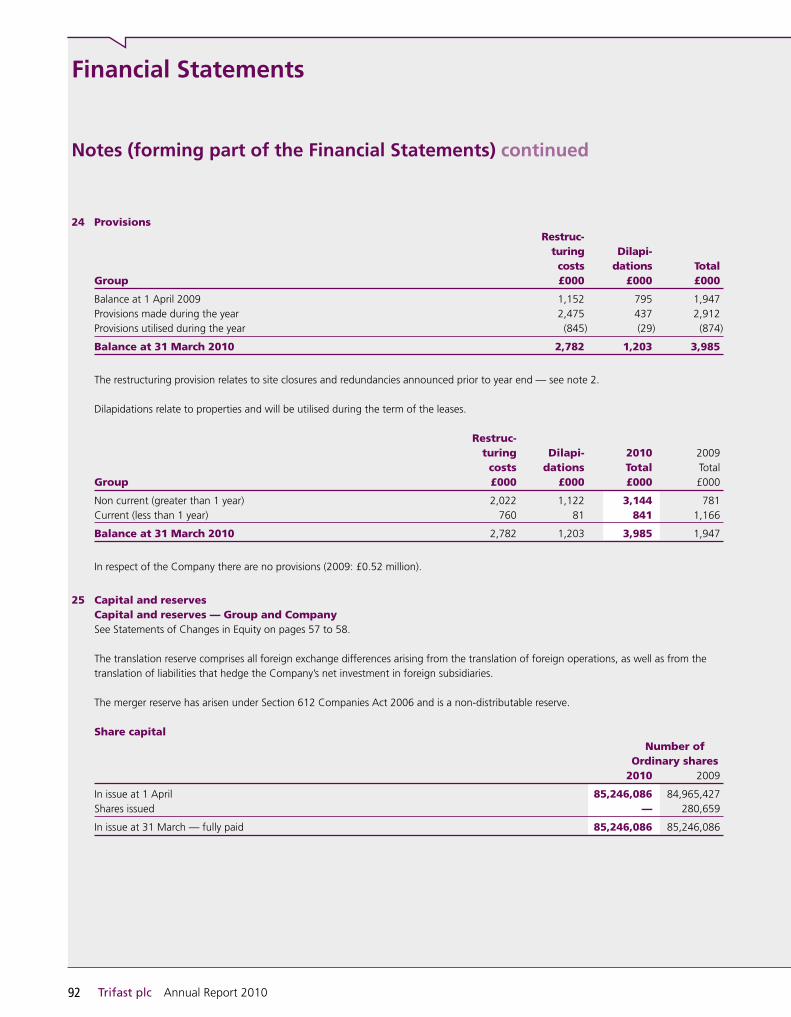
17989 05/08/2010 Proof7
92 Trifast plc Annual Report 2010
Financial Statements
notes (forming part of the Financial Statements) continued
24 Provisions Restruc- turing Dilapi- costs dations TotalGroup £000 £000 £000
Balance at 1 April 2009 1,152 795 1,947Provisions made during the year 2,475 437 2,912Provisions utilised during the year (845) (29) (874)
Balance at 31 March 2010 2,782 1,203 3,985
The restructuring provision relates to site closures and redundancies announced prior to year end — see note 2.
Dilapidations relate to properties and will be utilised during the term of the leases.
Restruc- turing Dilapi- 2010 2009 costs dations Total TotalGroup £000 £000 £000 £000
Non current (greater than 1 year) 2,022 1,122 3,144 781Current (less than 1 year) 760 81 841 1,166
Balance at 31 March 2010 2,782 1,203 3,985 1,947
In respect of the Company there are no provisions (2009: £0.52 million).
25 Capital and reservesCapital and reserves — Group and CompanySee Statements of Changes in Equity on pages 57 to 58.
The translation reserve comprises all foreign exchange differences arising from the translation of foreign operations, as well as from the translation of liabilities that hedge the Company’s net investment in foreign subsidiaries.
The merger reserve has arisen under Section 612 Companies Act 2006 and is a non-distributable reserve.
Share capital Number of ordinary shares 2010 2009
In issue at 1 April 85,246,086 84,965,427Shares issued — 280,659
In issue at 31 March — fully paid 85,246,086 85,246,086

17989 05/08/2010 Proof7
93www.trifast.com
25 Capital and reserves continued 2010 2009 £000 £000
AuthorisedOrdinary shares of 5p each 10,000 10,000
Allotted, called up and fully paidOrdinary shares of 5p each 4,262 4,262
The holders of ordinary shares are entitled to receive dividends as declared from time to time and are entitled to one vote per share at meetings of the Company.
DividendsDuring the year the following dividends were declared and paid by the Group: 2010 2009 £000 £000
Final paid 2009 — 0.00p (2008: 1.87p) per qualifying ordinary share — 1,589Interim paid 2010 — 0.00p (2009: 0.93p) per qualifying ordinary share — 793
— 2,382
After the balance sheet date no final dividend per qualifying ordinary share was proposed by the Directors (2009: 0.00p). 2010 2009 £000 £000
Final proposed 2010 — 0.00p, (2009: 0.00p) per qualifying ordinary share — —
26 Earnings per shareBasic earnings per shareThe calculation of basic earnings per share at 31 March 2010 was based on the loss attributable to ordinary Shareholders of £2.19 million (2009: loss of £15.31 million) and a weighted average number of ordinary shares outstanding during the year ended 31 March 2010 of 85,246,086 (2009: 85,136,525), calculated as follows:
Weighted average number of ordinary shares 2010 2009
Issued ordinary shares at 1 April 85,246,086 84,965,427Effect of shares issued — 171,098
Weighted average number of ordinary shares at 31 March 85,246,086 85,136,525

17989 05/08/2010 Proof7
94 Trifast plc Annual Report 2010
Financial Statements
notes (forming part of the Financial Statements) continued
26 Earnings per share continuedDiluted earnings per shareThe calculation of diluted earnings per share at 31 March 2010 was based on loss attributable to ordinary Shareholders of £2.19 million (2009: loss of £15.31 million) and a weighted average number of ordinary shares outstanding during the year ended 31 March 2010 of 86,262,349 (2009: 85,136,525), calculated as follows:
Weighted average number of ordinary shares (diluted) 2010 2009
Weighted average number of ordinary shares at 31 March 85,246,086 85,136,525Effect of share options on issue 1,016,263 —
Weighted average number of ordinary shares (diluted) at 31 March 86,262,349 85,136,525
The average market value of the Company’s shares for the purposes of calculating the dilutive effect of share options was based on quoted market prices for the period that the options were outstanding.
EPS (Total) 2010 2009 EPS EPS Earnings Basic and Adjusted Earnings £000 Diluted1 Diluted2 £000 Basic Diluted
Loss for the financial year (2,187) (2.57p) (2.54p) (15,310) (17.98p) (17.98p)Separately disclosed items: Goodwill & intangible impairment 261 0.31p 0.30p 8,569 10.07p 10.07p Associate impairment — — — 659 0.77p 0.77p Sale of associate (332) (0.39p) (0.38p) — — — Restructuring costs 3,420 4.01p 3.97p 3,701 4.35p 4.35p Settlement claim — — — 555 0.65p 0.65p IFRS 2 Share option (143) (0.17p) (0.17p) 55 0.06p 0.06p Tax charge on adjusted items (958) (1.12p) (1.11p) (1,036) (1.22p) (1.22p)
Adjusted 61 0.07p 0.07p (2,807) (3.30p) (3.30p)

17989 05/08/2010 Proof7
95www.trifast.com
26 Earnings per share continuedEPS (Continuing operations) 2010 2009 EPS EPS Earnings Basic and Adjusted Earnings £000 Diluted1 Diluted2 £000 Basic Diluted
Loss for the financial year (2,187) (2.57p) (2.54p) (11,518) (13.53p) (13.53p)Separately disclosed items: Goodwill & intangible impairment 261 0.31p 0.30p 8,569 10.07p 10.07p Associate impairment — — — 659 0.77p 0.77p Sale of associate (332) (0.39p) (0.38p) — — — Restructuring costs 3,420 4.01p 3.97p 3,701 4.35p 4.35p Settlement claim — — — 555 0.65p 0.65p IFRS 2 Share option (143) (0.17p) (0.17p) 55 0.06p 0.06p Tax charge on adjusted items (958) (1.12p) (1.11p) (1,036) (1.22p) (1.22p)
Adjusted 61 0.07p 0.07p 985 1.15p 1.15p
1 The diluted loss per share is equal to the basic loss per share of (2.57p) as IFRS does not allow loss per share to be reduced by the effect of share options in issue.
2 However, the adjusted earnings per share does need to reflect the dilutive effect of these share options and is therefore reconciled to non-adjusted loss per share in the tables above.
The “Adjusted diluted” earnings per share is detailed in the above tables. In the Directors’ opinion, this best reflects the underlying performance of the Group and assists in the comparison with the results of earlier years (see note 2).
27 Financial instruments(a) Fair values of financial instrumentsThere is no difference between the fair values and the carrying values shown in the balance sheet.
(b) Financial instruments risksExposure to credit, interest rate and currency risks arises in the normal course of the Group’s business, and the Group continues to monitor and reduce any exposure accordingly. Information has been disclosed relating to the individual company only where a material risk exists.
(i) Credit riskCredit risk is the risk of financial loss to the Group if a customer or counterparty to a financial instrument fails to meet its contractual obligations, and arises principally from the Group’s receivables from customers.
Management has a credit policy in place and the exposure to credit risk is monitored on an ongoing basis.
Credit evaluations are performed on all customers requiring credit over a predetermined amount. Bad debt insurance is taken out on all key accounts where the cost is appropriate given the risk covered. All overdue debts are monitored regularly and customers are put on credit hold if payments are not received on time.

17989 05/08/2010 Proof7
96 Trifast plc Annual Report 2010
Financial Statements
notes (forming part of the Financial Statements) continued
27 Financial instruments continuedThe carrying amount of trade receivables represents the maximum credit exposure for the Group. Therefore, the maximum exposure to credit risk at the balance sheet date was £19.40 million (2009: £17.07 million), being the total carrying amount of trade receivables net of an allowance. Management do not consider there to be any significant unimpaired credit risk in the year end balance sheet (2009: £nil).
At the balance sheet date there were no significant concentrations of credit risk.
The amount of trade receivables which are beyond 90 days from their due date is £0.84 million (2009: £0.65 million). This represents 4% of the total gross receivable balance.
Impairment lossesThe movement in the allowance for impairment in respect of loans and receivables during the year was as follows: 2010 2009 £000 £000
Balance at 1 April (921) (681)Impairment movement 281 (240)
Balance at 31 March (640) (921)
There are no significant losses/bad debts provided for specific customers.
(ii) Liquidity and interest riskThe Group holds net debt and hence its interest and liquidity risks are associated with the maturity of its loans against cash inflows from around the Group. The Group’s objective is to maintain a balance of continuity of funding and flexibility through the use of loans and banking facilities as applicable.
During the year the Group extinguished its old banking facilities in respect of loans and overdrafts and entered into negotiations with its principal bank to provide more secure and flexible facilities.
The Directors were aware given the current lending market that these facilities would attract higher costs. However, they believed that the added security and flexibility offered justified the increase in this expense.
In February 2010, the previous facilities were replaced with a bridging loan of £2.00 million and a term loan of £4.00 million (as at 31 March 2010 the total amount outstanding was £4.88 million). Both loans are to be repaid by 31 December 2010. However, a number of positive discussions have been held with the bank about the Group’s future borrowing needs and no matters have been drawn to suggest that the term loan cannot be extended out further if required. These loans are secured by Corporate guarantees and debentures over the Group’s UK, Singapore and Swedish entities.

17989 05/08/2010 Proof7
97www.trifast.com
27 Financial instruments continuedCovenant headroomThe current term facilities are subject to covenant testing as follows:
EBITDA: Net interest > 3 times EBITDA and operating cash flow to exceed quarterly, predetermined absolute levels
These covenants currently provide sufficient headroom, and forecasts indicate no breach is anticipated.
Term loan covenants on renewal are expected to be set up on a standard commercial basis taking appropriate account of the forecast trading position of the Group at this time.
In addition, the UK companies have been provided a £13.50 million three year asset-backed facility to replace the current overdraft. This is secured over the trade receivables and stock of the Group’s UK companies and the property of the Company.
The amount available from the asset-backed lending facility is dependent on the receivables and stock levels at that point in time. At 31 March 2010 £7.22 million of this facility was utilised.
Liquidity headroomTrading forecasts show that the current facilities provide sufficient liquidity headroom up until 31 December 2010. In addition, the forecasts show that the Group will retain liquidity headroom beyond this date, however the Board remains keen to renegotiate term facilities with the bank to provide the Group with more security and flexibility for the longer term.
Interest riskThe Group monitors closely all loans outstanding, which currently incur interest at floating rates.
The Company has taken out a 3% Fixed Cap interest rate hedging instrument for three years to protect the Group against interest rate fluctuations on the new asset based lending and term loans.
In respect of income-earning financial assets and interest-bearing financial liabilities, the following table indicates their effective interest rates at the balance sheet date and the periods in which they mature.

17989 05/08/2010 Proof7
98 Trifast plc Annual Report 2010
Financial Statements
notes (forming part of the Financial Statements) continued
27 Financial instruments continued 2010 2009 Effective Effective interest 0 to interest 0 to 1 to 2 to rate Total <1 years rate Total <1 years <2 years <5 years % £000 £000 % £000 £000 £000 £000
CompanyCash and cash equivalents — 2,176 2,176 0.36 4,019 4,019 — —Secured bank loans 4.37 (4,877) (4,877) 2.60 (11,581) (1,135) (8,571) (1,875)Bank overdrafts — (6,524) (6,524) 1.56 (5,728) (5,728) — —
Total Company (9,225) (9,225) (13,290) (2,844) (8,571) (1,875)
GroupCash and cash equivalents — 7,420 7,420 0.36 9,063 9,063 — —Secured bank loans 3.91 (12,103) (12,103) 2.33 (14,818) (2,547) (10,396) (1,875)Bank overdrafts — — — 1.56 (2,641) (2,641) — —
Total Group (4,683) (4,683) (8,396) 3,875 (10,396) (1,875)
All assets and liabilities bear interest at a floating rate and are therefore due to change within one year.
Sensitivity analysisA change of 1% point in interest rates at the balance sheet date would change equity and profit and loss by £0.12 million (2009: £0.15 million). This calculation has been applied to risk exposures existing at the balance sheet date.
This analysis assumes that all other variables, in particular foreign currency rates, remain consistent and considers the effect of financial instruments with variable interest rates. The analysis is performed on the same basis for the comparative period.
(iii) Foreign currency riskThe Group is exposed to foreign currency risk on sales, purchases and cash borrowings that are denominated in a currency other than local functional currency. The Group faces additional currency risks arising from monetary financial instruments held in non-functional local currencies.
Operational foreign exchange exposureWhere possible the Group tries to invoice in the local currency at the respective entity. If this is not possible, then to mitigate any exposure, the Group tries to buy from suppliers and sell to customers in the same currency.
Where possible the Group tries to hold the majority of its cash and cash equivalent balances in the local currency at the respective entity.
Monetary assets/liabilitiesThe Group continues to monitor exchange rates and buy or sell currencies in order to minimise open exposure to foreign exchange risk. The Group does not speculate on rates.
Hedge of net investments in foreign entitiesIncluded in interest-bearing loans at 31 March were the following amounts, which had been designated as hedges of net investments in the Group’s subsidiaries in Europe and were used to reduce the exposure to foreign exchange risk.

17989 05/08/2010 Proof7
99www.trifast.com
27 Financial instruments continued Amount Recognised in Equity 2010 2009Borrowings in local currency £000 £000
SEK 750,000 1 (7)
(Gains) or losses on the retranslation of these borrowings were transferred to equity to offset any gains or losses on retranslation of the net assets in subsidiaries.
The Group’s exposure to foreign currency risk is as follows. This is based on the carrying amount for monetary financial instruments, held in non-functional currencies.
Sterling Euro US Dollar other Total31 March 2010 £000 £000 £000 £000 £000
Cash and cash equivalents 155 1,416 3,595 — 5,166
Balance sheet exposure 155 1,416 3,595 — 5,166
Sterling Euro US Dollar Other Total31 March 2009 £000 £000 £000 £000 £000
Cash and cash equivalents 155 1,747 2,983 6 4,891Secured bank loans — — (3,237) (63) (3,300)
Balance sheet exposure 155 1,747 (254) (57) 1,591
Sensitivity analysisGroupA 1% change in the following currencies against local functional currency at 31 March would have changed equity and profit and loss by the amount shown below. This calculation assumes that the change occurred at the balance sheet date and had been applied to risk exposures existing at that date.
This analysis assumes that all other variables, in particular other exchange rates and interest rates, remain constant. The analysis is performed on the same basis for the comparative period.
Equity & profit or loss 2010 2009 £000 £000
US dollar to sterling (36) 3Euro to sterling (14) (17)
A 1% strengthening of the above currencies against the pound sterling at 31 March would have had the equal but opposite effect on the above currencies to the amounts shown above, on the basis that all other variables remain constant.

17989 05/08/2010 Proof7
100 Trifast plc Annual Report 2010
Financial Statements
notes (forming part of the Financial Statements) continued
27 Financial instruments continued(c) Capital managementThe Group’s objectives when managing capital are to ensure that all entities within the Group will be able to continue as going concerns, while maximising the return to Shareholders through the optimisation of the debt and equity balance. We regularly review and maintain or adjust the capital structure as appropriate in order to achieve these objectives and this is consistent with the management of capital for previous periods.
The Group has various borrowings and available facilities that contain certain external capital requirements (“covenants”) that are considered normal for these types of arrangements. As discussed above, we remain comfortably within all such covenants. Identification of the total funding requirement is achieved via a detailed cash flow forecast which is reviewed and updated on a monthly basis.
The capital structure of the Group is presented below: 2010 2009 £000 £000
Cash and cash equivalents (note 20) 7,420 6,422Borrowings (note 21) (12,103) (14,818)
Net debt (4,683) (8,396)Equity 40,181 42,470
Capital 35,498 34,074
There is a continuous process for identifying, evaluating and managing the key risks faced by the Group. Activities are co-ordinated by the Audit Committee. It has responsibility, on behalf of the Board, for ensuring the adequacy of systems for identifying and assessing significant risks, that appropriate control systems and other mitigating actions are in place, and that residual exposures are consistent with the Group’s strategy and objectives. Assessments are conducted for all material entities.
28 operating leasesNon-cancellable operating lease rentals are payable as follows: Group Company 2010 2009 2010 2009 £000 £000 £000 £000
Less than one year 2,355 2,326 67 13Between two and five years 4,953 4,788 30 52More than five years 2,215 1,408 — —
9,523 8,522 97 65
The Group leases a number of offices, warehouse and factory facilities under operating leases. None of the leased properties have been sublet by the Group (2009: £nil). The Group has recognised a provision of £2.49 million (2009: £0.23 million) in respect of onerous leases which is included within the restructuring provision (see note 24).
GroupDuring the year £2.41 million was recognised as an expense (2009: £2.86 million) in the income statement in respect of operating leases.
CompanyDuring the year £0.08 million (2009: £0.07 million) was recognised as an expense in the income statement in respect of operating leases.

17989 05/08/2010 Proof7
101www.trifast.com
29 ContingenciesGroup and Company(i) The Company has cross guarantees on overdrafts with five subsidiaries. The amount outstanding at the end of the year was
£6.34 million (2009: £11.71 million).
(ii) In accordance with the provisions of Section 17 of the Republic of Ireland Companies (Amendment) Act 1986, Trifast plc has given irrevocable guarantees in respect of the financial year 1 April 2009 to 31 March 2010, in respect of the liabilities, as are referred to in Section 5c of that Act, for the subsidiary company TR Southern Fasteners Limited.
30 Related parties (Group and Company)Compensation of key management personnel of the GroupFull details of the compensation of key management personnel are given in the Directors’ Remuneration Report.
In addition to details of the compensation of key management personnel given in the Directors’ Remuneration Report, the credit for the year in relation to share-based payments was £0.14 million (2009: cost of £0.06 million).
Transactions with Directors and Directors’ close family relatives During the year a relative of the Chairman provided IT consultancy services totalling £4,000 on an arm’s length basis and terms similar to other third party suppliers.
Related Party TransactionsDetails of principal subsidiary undertakings, country of registration and principal activities are included on page 104.

17989 05/08/2010 Proof7
102 Trifast plc Annual Report 2010
Financial Statements
notes (forming part of the Financial Statements) continued
30 Related parties (Group and Company) continuedCompany Related Party Transactions — Income/Expenditure Income Expenditure Manage- Manage- ment Loan ment Rent Fees Interest Total Fees £000 £000 £000 £000 £000
TR Fastenings Ltd 176 214 — 390 110TR Southern Fasteners Ltd — 27 — 27 —TR Norge AS — 30 — 30 —TR Fastenings AB — 28 — 28 —TR Miller BV — 28 2 30 —Lancaster Fastener Co Ltd — 29 — 29 —TR Hungary Kft — 22 — 22 —TR Asia Investments Pte Ltd — 230 — 230 —TR Fastenings Inc — 41 — 41 —
176 649 2 827 110
Company Related Party Transactions — Receivable/Payable Balances Balances Receivable Payable Trade Trade Receivables Payables £000 £000
TR Fastenings Ltd 113 19TR Southern Fasteners Ltd 3 —TR Norge AS 3 —TR Fastenings AB — —TR Miller BV 8 —Lancaster Fastener Co Ltd 30 —TR Hungary Kft 1 —TR Asia Investments Pte Ltd 38 —TR Fastenings Inc — —Dormant Subsidiaries — 267Trifast Overseas Holdings Ltd 981 524Trifast Holdings BV 218 —
1,395 810

17989 05/08/2010 Proof7
103www.trifast.com
31 Subsequent eventsThere are no material adjusting or non-adjusting events subsequent to the balance sheet date.
32 Accounting estimates and judgementsThe preparation of financial statements in conformity with Adopted IFRS requires management to make judgements, estimates and assumptions that affect the application of policies and reported annual amounts of assets and liabilities, income and expenses. The estimates and associated assumptions are based on historical experience and various other factors that are believed to be reasonable under the circumstances, the results of which form the basis of making the judgements about carrying values of assets and liabilities that are not readily apparent from other sources. Actual results may differ from these estimates.
The estimates and underlying assumptions are reviewed on an ongoing basis. Revisions to accounting estimates are recognised in the period in which the estimate is revised if the revision affects only that period, or in the period of the revision and future periods if the revision affects both current and future periods.
The Group believes the principal accounting estimates, assumptions and uncertainties employed in the preparation of these financial statements are:
l Recoverable amount of goodwill (note 13) The recoverable amount is the greater of net selling price and value in use, where value in use is determined by discounting the future
cash flows generated from the continuing use of the unit. Further details are provided in note 13.
l Provisions (note 24) A provision is recognised in the balance sheet where the Group has a present legal or constructive obligation as a result of a past
event, and it is probable that an outflow of economic benefits will be required to settle the obligation. Management has based their judgements on the latest available information, reflecting the expected outcome.
In respect of onerous leases and dilapidation provisions, external advisers were used to provide estimates of potential costs and likelihood of sub-letting rental. The future cash flows were then discounted using risk-free rates over the length of the leases.

17989 05/08/2010 Proof7
104 Trifast plc Annual Report 2010
notes (forming part of the Financial Statements) continued
33 Trifast plc Principal trading subsidiaries Percentage Country of Issued and of ordinary incorporation fully paid held sharesName or registration share capital Principal activity Group Company
EuropeTrifast Overseas Holdings Ltd United Kingdom £109 Holding company 100% 100%TR Fastenings Ltd United Kingdom £10,200 Manufacture and 100% — distribution of fasteningsTR Southern Fasteners Ltd Republic of Ireland €254 Distribution of fastenings 100% —TR Norge AS Norway NOK 300,000 Distribution of fastenings 100% —TR Miller Holding B.V. Holland €45,378 Distribution of fastenings 100% —Lancaster Fastener Company Ltd United Kingdom £40,000 Distribution of fastenings 100% —TR Fastenings AB Sweden SEK 1,500,000 Distribution of fastenings 100% —TR Hungary Kft Hungary HUF 3,000,000 Distribution of fastenings 100% —TR Fastenings Poland Sp. Z o.o Poland PLN 50,000 Distribution of fastenings 100% 100%
AsiaTR Asia Investment Holdings Pte Ltd Singapore S$4 Holding company 100% —TR Formac Pte Ltd Singapore S$315,000 Manufacture and 100% — distribution of fasteningsTR Formac (Malaysia) SDN Bhd Malaysia M$480,000 Manufacture and 100% — distribution of fasteningsTR Formac (Shanghai) Pte Ltd China US$200,000 Distribution of fastenings 100% —Special Fasteners Engineering Co Ltd Taiwan NT$100,000,000 Manufacture and 100% — distribution of fasteningsTR Formac (Suzhou) Co. Ltd China US$2,000,000 Manufacture and 100% — distribution of fasteningsTR Formac Fastenings Private Ltd India Rs100,000 Distribution of fastenings 100% —AmericasTR Fastenings Inc. USA US$1,168,063 Distribution of fastenings 100% —
A full list of the Group companies will be included in the Company’s annual return.
Outside of the sale of the associate Techfast Holdings Bhd, there were no changes in ownership during the year.

17989 05/08/2010 Proof7 17989 05/08/2010 Proof7
40 Directors’ Report 42 Corporate Social Responsibility 44 Corporate Governance 47 Directors’ Remuneration Report 50 notes to the Directors’ Remuneration Report 53 Statement of Directors’ Responsibilities 54 Independent Auditors’ Report 55 Consolidated Income Statement 56 Statements of Comprehensive Income 57 Consolidated Statements of Changes in equity 58 Company Statements of Changes in equity 59 Statements of Financial position 60 Statements of Cash Flows 62 notes (forming part of the Financial Statements) IBC Company Details and Advisers
Financial Reporting and Governance
“three-pronged strategy playing a key role in the tR recovery story — focusing on things we can influence”
17 the Business 18 trifast Board of Directors 20 Management Structure 22 the trifast Culture 24 Reasons Why our Customers Choose us 26 trifast in Asia 29 Global Sales 31 Change Management 33 Marketing team 35 Finance team — Supporting global operations 36 Your questions answered
1 letter from the Chairman 3 Review of 2010 4 “phase 1” Delivered 5 Business Review 12 Finance ReviewYear Under Review
Inside Trifast
Company Details
ADVISERS
Registered AuditorsKpMG Audit plc
1 Forest Gate, Brighton Road, Crawley,
West Sussex, RH11 9pt
Corporate StockbrokerArden partners plc
125 old Broad Street,
london, eC2n 1AR
Merchant Bank and Financial AdviserRothschild
new Court, St Swithins lane,
london, eC4p 4Du
SolicitorsCharles Russell, llp
Compass House, lypiatt Road, Cheltenham,
Gloucestershire, Gl50 2QJ
RegistrarsComputershare Investor Services plC
the pavilions, Bridgwater Road,
Bristol, BS13 8Ae
Financial PR AdviserCitigate Dewe Rogerson
1 Wrens Court, lower Queen Street,
Birmingham, B72 1Rt
TRIFAST plcIncorporated in the united Kingdom
Head Office and Registered Officetrifast House, Bellbrook park, uckfield,
east Sussex, tn22 1QW
telephone: +44 (0)1825 747366
Facsimile: +44 (0)1825 747368
Registered number 1919797
e-mail: [email protected]
Website: www.trifast.com
Audit Committeeneil Chapman (Chairman)
Jonathan Shearman
Remuneration CommitteeJonathan Shearman (Chairman)
neil Chapman
Nominations CommitteeMalcolm Diamond
Jim Barker
neil Chapman
Jonathan Shearman

17989 05/08/2010 Proof7 17989 05/08/2010 Proof7
“Leaders in the world offasteners for over 35 years,literally holding togetherthe products we know”
AnnuAl RepoRt 2010trifast House, Bellbrook park, uckfield, east Sussex, tn22 1QW tel: +44 (0)1825 747366 Fax: +44 (0)1825 747368
to find out more about our business please visit:
www.trifast.com
Ft Sector: Industrial engineering ticker Code: tRI.l
Trifast plc A
nn
uA
l RepoRt 2010