TRICLOSAN: SOURCE ATTRIBUTION, URINARY ......TRICLOSAN: SOURCE ATTRIBUTION, URINARY METABOLITE...
130
TRICLOSAN: SOURCE ATTRIBUTION, URINARY METABOLITE LEVELS AND TEMPORAL VARIABILITY IN EXPOSURE AMONG PREGNANT WOMEN IN CANADA By LORELLE WEISS A thesis Submitted to the Faculty of Graduate Studies In partial Fulfillment of the Requirements For the Degree of MASTERS OF SCIENCE Department of Epidemiology and Community Medicine Faculty of Medicine University of Ottawa Ottawa, Ontario © Lorelle Weiss, Ottawa, Canada, 2013
Transcript of TRICLOSAN: SOURCE ATTRIBUTION, URINARY ......TRICLOSAN: SOURCE ATTRIBUTION, URINARY METABOLITE...

TRICLOSAN: SOURCE ATTRIBUTION, URINARY METABOLITE LEVELS AND
TEMPORAL VARIABILITY IN EXPOSURE AMONG PREGNANT WOMEN IN
CANADA
By LORELLE WEISS
A thesis
Submitted to the Faculty of Graduate Studies
In partial Fulfillment of the Requirements
For the Degree of
MASTERS OF SCIENCE
Department of Epidemiology and Community Medicine
Faculty of Medicine
University of Ottawa
Ottawa, Ontario
© Lorelle Weiss, Ottawa, Canada, 2013

ii
ABSTRACT
OBJECTIVE:
To measure urinary triclosan levels and their variability across pregnancy, and to identify
sources of triclosan exposure among Canadian pregnant women.
METHODS:
Single spot and serial urine samples, as well as consumer product use information were
collected across pregnancy and post-partum from 80 healthy pregnant women in Ottawa.
Analyses included descriptives, linear mixed effects and parametric trend modeling, and
surrogate category analysis.
RESULTS:
Triclosan was detected in 87% of maternal urine samples (LOD=3.0 µg/L). Triclosan
concentrations varied by time of day of urine collection (p=0.0006), season of sampling
(p=0.019), and parity (p=0.038). Triclosan was included in 4% of all personal care products
used by participants; 89% of these triclosan products were varying brands of toothpaste and
hand soaps.
CONCLUSION: This study provided the first data on temporal variability
urinary triclosan levels, and on source attribution data in Canadian pregnant women. Results
will assist with population-specific exposure assessment strategies.
iii
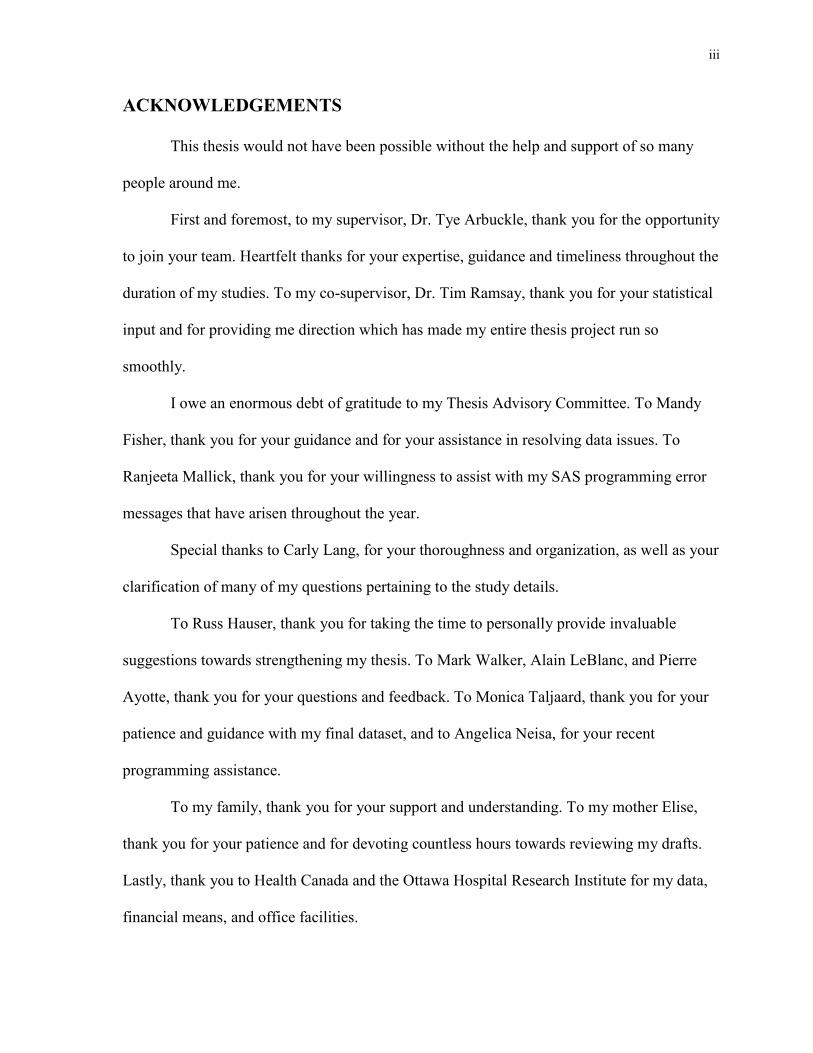
ACKNOWLEDGEMENTS
This thesis would not have been possible without the help and support of so many
people around me.
First and foremost, to my supervisor, Dr. Tye Arbuckle, thank you for the opportunity
to join your team. Heartfelt thanks for your expertise, guidance and timeliness throughout the
duration of my studies. To my co-supervisor, Dr. Tim Ramsay, thank you for your statistical
input and for providing me direction which has made my entire thesis project run so
smoothly.
I owe an enormous debt of gratitude to my Thesis Advisory Committee. To Mandy
Fisher, thank you for your guidance and for your assistance in resolving data issues. To
Ranjeeta Mallick, thank you for your willingness to assist with my SAS programming error
messages that have arisen throughout the year.
Special thanks to Carly Lang, for your thoroughness and organization, as well as your
clarification of many of my questions pertaining to the study details.
To Russ Hauser, thank you for taking the time to personally provide invaluable
suggestions towards strengthening my thesis. To Mark Walker, Alain LeBlanc, and Pierre
Ayotte, thank you for your questions and feedback. To Monica Taljaard, thank you for your
patience and guidance with my final dataset, and to Angelica Neisa, for your recent
programming assistance.
To my family, thank you for your support and understanding. To my mother Elise,
thank you for your patience and for devoting countless hours towards reviewing my drafts.
Lastly, thank you to Health Canada and the Ottawa Hospital Research Institute for my data,
financial means, and office facilities.

iv
TABLE OF CONTENTS
ABSTRACT….…………………………………………………………………………….....i
ACKNOWLEDGEMENTS………………………………………………………………...iii
TABLE OF CONTENTS…………………………………………………………………...iv
LIST OF FIGURES………………………………………………………………………..vii
LIST OF TABLES…………………………………………………………………...……viii
LIST OF APPENDICES…………………………………………………...……………... .ix
CHAPTER 1: INTRODUCTION TO THE STUDY……………..1 1.1 THE PROBLEM…...............................................................................................1
1.1.1 Triclosan research gaps
1.2 SIGNIFICANCE…………………………………………………………………3
1.3 THE PURPOSE STATEMENT………………………………………………...4
CHAPTER 2: THEORETICAL FRAMEWORK:
HYPOTHESES AND OBJECTIVES……………………………...5 2.1 THEORETICAL FRAMEWORK……………………………………………..5
2.2 DEFINITIONS…………………………………………………………………...6
2.3 OBJECTIVES…………………………………………………………………....7
2.4 HYPOTHESES…………………………………………………………………..7
CHAPTER 3: REVIEW OF THE LITERATURE…………….....9 3.1 RISK ASSESSMENT……………………………………………………………9
3.1.1 Hazard identification
3.1.2 Characteristics and sources of exposure of triclosan
3.1.3 The impact of triclosan on the environment, animals, and humans
3.1.3.1 Triclosan in the environment
3.1.3.2 Animal models of triclosan toxicity
3.1.3.3 Impact of triclosan on human health
3.1.4 Exposure assessment
3.2 BIOMONITORING……………………………………………………………16
3.2.1 Sampling methods: disadvantages and advantages
3.2.2 Half-life
3.2.3 Urinary measurement of specific-gravity and creatinine
3.2.4 Single versus serial urine sample collection
3.3 URINARY TRICLOSAN BIOMONITORING STUDIES………………….23
3.3.1 International studies measuring urinary triclosan in non-pregnant
populations
3.3.2 Triclosan in the Canadian population
3.3.3 Triclosan in pregnant populations
3.4 RISK CHARACTERIZATION……………………………………………….28
3.5 SUMMARY OF THE LITERATURE………………………………………..30

v
CHAPTER 4: METHODS………………………………………..31 4.1 STUDY DESIGN……………………………………………………………….31
4.1.1 Data/biospecimen collection
4.2 SETTING AND STUDY POPULATION…………………………………….34
4.2.1 Setting of the study
4.2.2 Study population
4.2.2.1 Reasons for ineligibility
4.2.3 Participant recruitment
4.2.4 Sample size and power calculation
4.3 DATA COLLECTION…………………………………………………………42
4.3.1 Ethics, informed consent
4.3.2 Maternal urine collection
4.3.2.1 Biospecimen analysis
4.3.3 Questionnaires and exposure journal
4.4 DEFINITIONS OF VARIABLES……………………………………………..45
4.5 DATA CLEANING…………………………………………………………….48
4.6 DATA ANALYSIS……………………………………………………………..49
4.6.1 Adjustment of maternal urine samples for dilution effects
4.6.2 Descriptive statistics
4.6.3 Product use
4.6.4 Prediction of urinary triclosan levels
4.6.5 Predictive ability of a single spot urine sample
4.6.6 Pattern of urinary triclosan concentration following triclosan product
exposure
CHAPTER 5: RESULTS………………………………………….56 5.1 SAMPLE CHARACTERISTICS……………………………………………...56
5.2 EVIDENCE SUPPORTING EACH OF THE RESEARCH OBJECTIVES.57
5.2.1 Objective 1: To highlight the main personal care product sources of
exposure to triclosan and their association with urinary triclosan
concentrations
5.2.2 Objective 2: To identify covariates which are statistically significant
predictors of urinary triclosan levels
5.2.3 Objective 3: To measure current triclosan exposure levels through urine
biomonitoring
5.2.3.1 Objective 3a: To measure inter-individual and within-subject
variability of urinary triclosan levels
5.2.3.2 Objective 3b: To evaluate the ability of a single spot urine
sample to correctly predict an individual's level of exposure to
triclosan
5.2.4 Objective 4: To determine the pattern of urinary triclosan concentrations
in a 48-hour time period following triclosan exposure
5.3 SUMMARY OF FINDINGS…………………………………………………...72

vi
CHAPTER 6: DISCUSSION……………………………………..74 6.1 EXPLANATIONS FOR THE STUDY FINDINGS………………………….74
6.1.1 Sample characteristics
6.1.2 Personal care product use
6.1.3 Covariate associations with urinary triclosan levels
6.1.4 Urinary metabolite levels
6.1.5 Predictive ability of single spot samples
6.1.6 Parametric linear trend model
6.2 LIMITATIONS…………………………………………………………………85
CHAPTER 7: SUMMARY CONCLUSION…………………….89
BIBLIOGRAPHY………………………………………………..111

vii
LIST OF FIGURES
Figure 1: The Red Book risk assessment process…………………………………………...6
Figure 2: Reasons for study participant ineligibility……………………………………….36
Figure 3: P4 cumulative participant recruitment by site and month…………………….....38
Figure 4: Participant flow diagram………………………………………………………...40
Figure 5: Total of personal care product uses by product category……………………….58
Figure 6: Triclosan classification of all recorded products used by study participants…...59
Figure 7: Triclosan products by product category………………………………………...60
Figure 8: Geometric mean specific gravity adjusted maternal urinary triclosan levels by
time of day of urine sampling…………………………………………………..63
Figure 9: Geometric mean specific gravity adjusted maternal urinary triclosan levels by
season of urine sampling………………………………………………………..63
Figure 10: Geometric mean specific gravity adjusted maternal urinary triclosan levels by
parity…………………………………………………………………………...64
Figure 11: Boxplot of the geometric means of all individual maternal urine samples…….66
Figure 12: Boxplot of the geometric means of all individual maternal urine samples by
week-day collection (1A) and week-end day collection (1B)………………....67
Figure 13: Boxplot of the geometric means of all individual maternal urine samples by study
visit……………………………………………………………………………..68
Figure 14: Individual profiles of log-transformed urinary triclosan concentration levels by
time since exposure to a triclosan product in hours………………………….. .71
Figure 15: Parametric linear trend model of log-urinary triclosan concentration by time since
exposure to a triclosan product across a 48-hour time period………………….72

viii
LIST OF TABLES
Table 1: Interpretation of the intraclass correlation coefficient (ICC)…………………….21
Table 2: Summary of urinary triclosan concentration studies in humans………………... 26
Table 3: Summary of study visits………………………………………………………….32
Table 4: Demographic covariates of P4 Study participants……………………………….55
Table 5: Type 3 tests of fixed effects of covariates and Akaike Information Criterion.......60
Table 6: Geometric mean and selected percentiles of triclosan concentrations in maternal
urine……………………………………………………………………………....64
Table 7: Prediction accuracy of a week-day single spot sample to correctly identify an
individual’s overall geometric mean triclosan level……………………………..68
Table 8: Prediction accuracy of a week-end day single spot sample to correctly identify an
individual’s overall geometric mean triclosan level…………………………….68
Table 9: Prediction accuracy of high urinary triclosan levels by time of day of urine sample
collection………………………………………………………………………….69
Table 10. Qualitative data on occupation of nine P4 study participants who recorded high
outlier urinary triclosan levels…………………………………………………...82
Table 11a. Triclosan product uses by time of day (3 categories)…………………………..82
Table 11b. Triclosan product uses by time of day (6 categories)……………………..……83

ix
LIST OF APPENDICES
Appendix A: Environmental Defence Report………………………………………….......91
Appendix B: Biospecimen tracking logs…………………………………………………...93
Appendix C: Study recruitment poster……………………………………………………..99
Appendix D: Informed consent……………………………………………………………101
Appendix E: Participant eligibility screening……………………………………………..102
Appendix F: Data and maternal collection schedules……………………………………..103
Appendix G: Food and activity journals/product use booklets…………………………....104
Appendix H: Pertinent database components……………………………………………..110
1
CHAPTER 1: INTRODUCTION TO THE STUDY
1.1 THE PROBLEM
Triclosan (TCS) is a current topic of interest due to concerns about potential adverse
health effects and its widespread use. Research studies and media stories are focusing on this
antibacterial agent due to the steady increase in the number of triclosan-containing consumer
products over the past 20 years, including toothpaste, hand soap, deodorant and mascara to
name a few (Alliance for the Prudent Use of Antibiotics, 2011; Sandborgh-Englund et al.,
2006). A recent report published in 2012 by Environmental Defence labeled the
bioaccumulation of triclosan in the environment as “toxic to the aquatic environment”
(Environmental Defence 2012). The widespread use of triclosan has also been linked to
occurrence of TCS antimicrobial resistance in dermal, intestinal, and environmental
microorganisms (Yazdankhah et al. 2006). This begs the question as to whether or not there
are further human health impacts due to triclosan exposure.
Nearly all of the research on potential health effects of triclosan use animal models
(The Associated Press 2013); however, the results from these models are not always
applicable to humans (FDA 2010). Current research on potential human toxicity of triclosan
has demonstrated that it has low acute toxicity in humans who use the products as intended
(Rodricks et al., 2010), and its rapid excretion through urine and feces creates a low chronic
health risk from the current use of triclosan-containing products (NICNAS 2009). However,
there are knowledge gaps on triclosan source attribution and current exposure levels among
certain populations; especially among susceptible populations such as Canadian pregnant
women. This information is critical for risk assessment of triclosan and to guide risk
management options.

2
1.1.1 Triclosan knowledge gaps
Triclosan has been consistently detected in approximately 75% of participants in
surveys conducted in the United States and Canada (Calafat et al. 2008; Environmental
Defence 2012; Health Canada 2013). A recent Canadian population-based survey (Health
Canada 2013b) as well as a smaller Canadian study (Environmental Defence 2012) reported
detection of urinary triclosan levels among 88% and 72% of their participants, respectively;
however, these surveys did not target a population of pregnant women.
At the time of creating a study analysis plan, there were no studies published on the
temporal variability of triclosan. However, methods for assessing the temporal variability as
well as personal care product use for phthalates had been developed. Similar to triclosan,
phthalates are ubiquitous in the environment, primarily excreted in urine, do not lead to
bioaccumulation in humans, and have short half-lives of less than 24 hours in urine or feces
(Agency for Toxic Substances and Disease Registry 2002).
Phthalates are a family of chemicals added to a number of industrial and consumer
products in order to increase product flexibility. Some products containing phthalates include
vinyl plastics and flooring, hairsprays, cosmetics and insect repellants (Health Canada
2011b; Wolff et al. 2007), which can release phthalates into the environment.
Urinary phthalate levels have been positively associated with personal care product
use (Hauser et al, 2004). In addition, other factors such as diet, activity patterns and other
environmental and biological factors may influence exposure levels (Hauser et al. 2004). To
date, only one research study provides information on source attribution to triclosan. This
study was conducted in a sample of Puerto Rican pregnant women between 2010 and 2012.
Positive associations were identified between triclosan concentrations and the use of certain
personal care products (Meeker et al., 2013). This research study, among others, has

3
highlighted the importance of conducting additional research to support existing data on
triclosan levels and source attribution in human populations (Calafat et al. 2008; Meeker et
al. 2013). Health Canada has used U.S. population data to provide the most accurate
estimates of total triclosan exposure of the general population (Health Canada and
Environment Canada 2012). This highlights the need for Canadian source attribution data.
Significant costs and participant burden arise when collecting and analyzing serial
urine samples. As a result, epidemiologic studies or large population surveys commonly
measure an individual’s exposure to a chemical through a single spot urine sample; however,
it is unclear whether using a single spot urine sample to measure triclosan is a representative
indicator of an individual’s exposure over a period of time. Following exposure to triclosan,
the urinary triclosan concentration fluctuates; it degrades by 50 percent in approximately 11
hours (Sandborgh-Englund et al. 2006). Limited data exist on this matter, especially in
pregnant women.
To date, there is a paucity of Canadian data on current urinary triclosan levels in
pregnant women, as well as the sources of exposure, temporal variability, and reliability of a
single spot urine sample in a pregnant population.
1.2 SIGNIFICANCE
The potential health effects, if any, of triclosan (TCS) exposure on humans are
largely unknown, but based on experimental toxicology studies, are expected to be minimal.
Clearly having information on urinary triclosan levels in a Canadian population is important
for consumers and for those working in areas of risk assessment and risk management in
order to properly assess the exposure levels and triclosan product uses in order to
characterize risk, if any, that may be associated with the chemical. This study contributes to

4
the ongoing research by providing the first Canadian data in a subpopulation of pregnant
women. This population is of specific interest due to the fragility of the developing fetus and
its increased vulnerability relative to the susceptibility of adults to endocrine modulation
effects (Casas et al. 2011; WHO 2012).
This thesis will produce the first report of Canadian data on maternal urinary triclosan
levels and on the temporal variability of triclosan through assessment of TCS concentrations
within a 24-hour time period. This information will provide insight into potential exposure
misclassification when only a spot urine sample is collected and recommendations for when
and what additional data to gather, if only a spot urine sample is collected.
Identification of which sources of exposure are most correlated with urinary TCS
levels can further direct or enhance exposure controls and risk management procedures.
1.3 THE PURPOSE STATEMENT
This thesis focuses on triclosan data collected from the P4 Study, a longitudinal
observational study examining exposure of Canadian pregnant women to triclosan,
phthalates, bisphenol A, naphthalene, cotinine and triclocarban.
Following data entry, product categorization, variable creation, as well as dataset
merging and cleaning, analysis and interpretation of the P4 Study triclosan data will be
performed.
The purpose of this thesis is to correlate urinary maternal triclosan levels with
personal care product use throughout pregnancy among Canadian pregnant women, while
controlling for potential confounding variables. In addition, this study will contribute to the
ongoing research on the ability of a single spot sample taken at varying time points
throughout pregnancy and postpartum to accurately predict individual exposure levels.

5
Results from this study can assist with population-specific exposure assessment
strategies in Canadian populations and can contribute to ongoing assessment studies
worldwide. The methodology for analysis of triclosan data developed in this thesis will then
be used for data analysis of the remaining chemicals of interest in the P4 Study.
CHAPTER 2: THEORETICAL FRAMEWORK,
HYPOTHESES AND OBJECTIVES
2.1 THEORETICAL FRAMEWORK
In 1983, a risk assessment paradigm was established in The United States Red Book
to provide information on concepts and conduct of a systematic risk-assessment process.
Today, this paradigm is still a core component of newly developed frameworks that are
advancing the field of risk assessment through further emphasis on the options available to
reduce exposure and evaluate the hazards (Abt et al., 2010) . The Red Book framework has
been referenced by expert committees, regulatory agencies and public health institutions in
their decision-making processes (National Academy of Sciences 2008). The original risk
assessment paradigm, as listed in the Red Book will be the basis of presentation of published
literature in this area, due to its pertinence to chemical risk assessment. Figure 1 represents
the theoretical framework for this study.

6
Figure 1. The Red Book risk assessment process (Pohjola et al. 2012).
2.2 DEFINITIONS
General concepts for the purpose of this thesis are summarized as follows:
Temporal variability = within-individual variation of urinary triclosan
concentrations across time.
Source attribution = various products through which an individual is exposed to
triclosan.
Personal care products = substances or mixtures of substances which are generally
recognized by the public for use in daily cleansing or grooming (Environment
Canada 2012).
Personal care product category = a combination of individual personal care
products with similar characteristics. Selected product categories for this thesis
include: cosmetics, hair care, oral care, deodorant/antiperspirant, hand
soaps/sanitizers, lotions/creams, skin care, medication/vitamins, household cleaning

7
products, and other products.
The following variables are presented in the statistical analyses of this study:
Dependent variable: urinary triclosan concentrations in pregnant women (spot urine
and serial urine samples collected over a 24-hour period).
Independent variable: personal care product use summary score (sum of total
number of exposures to an individual personal care product containing triclosan).
Covariates: maternal age, education, marital status, combined household income,
country of birth, time of day of urine void, season of sampling, season of conception,
parity, total urine volume, study visit, and time since last urine void.
2.3 OBJECTIVES
The objectives of this study in our population of Canadian pregnant women are:
Objective 1. To highlight the main personal care product sources of exposure to
triclosan and their association with urinary triclosan concentrations.
Objective 2. To identify covariates which are statistically significant predictors of
urinary triclosan levels.
Objective 3. To measure current triclosan exposure levels through urine
biomonitoring.
Objective 3a. To measure inter-subject and within-subject variability of
urinary triclosan levels:
Within a week-end day and a week-day
At various stages of pregnancy
Over a 24-hour period
8
Objective 3b. To evaluate the ability of a single spot urine sample to
correctly predict an individual’s level of exposure to triclosan.
Objective 4. To determine the pattern of urinary triclosan concentrations in a 48-hour
time period following triclosan exposure.
2.4 HYPOTHESES
It is hypothesized that:
Hypothesis 1. Pregnant women will primarily be exposed to triclosan through
cosmetics, soaps, and toothpaste.
Hypothesis 2. Triclosan levels will be predicted by time of day of sample collection.
Hypothesis 3. Canadian triclosan exposure levels measured through urine voids
among pregnant women will be similar to those found in comparable studies.
Specifically, triclosan will be detected in 60-83% of maternal urine samples.
Hypothesis 3a. Inter-subject variability will be attributed primarily to
differences in the timing of exposure to triclosan-containing products.
Hypothesis 3b. A single spot sample will prove to be a reliable indicator of
an individual’s average exposure to triclosan-containing products.
Hypothesis 4. Triclosan levels will experience a sharp increase following exposure to
a triclosan-containing product, followed by a constant decline, with a half-life of
approximately 11 hours.

9
CHAPTER 3: REVIEW OF THE LITERATURE
The literature review section will first provide a basic introduction to triclosan,
identify products in which triclosan is present, and outline its impacts on the environment,
animals, and humans. A brief history of biomonitoring will also be presented, addressing the
advantages and challenges of different biomonitoring matrices, as well as additional
challenges that arise in populations of pregnant women.
Following this, examination of evidence relating to triclosan biomonitoring studies in
various populations will be conducted, including studies measuring levels following triclosan
exposure. Together, this information will support the risk characterization of triclosan.
Deficiencies and limitations in the existing literature will define the purpose of the
present study.
3.1 RISK ASSESSMENT
3.1.1 Hazard identification
Chemicals are ubiquitous in today’s environment. Human exposure to these
chemicals is unavoidable. To assist with quantification of exposure, chemicals are classified
according to their persistency. Persistency is defined as “the residence time of a chemical
species in a specifically defined compartment of the environment (Greenhalgh et al. 1980)”,
with respect to the chemical and physical properties of the agent. Further persistency is
described through “the dispersion of the chemical agent from its primary compartment to a
new location (US Environmental Protection Agency 2004)”. Estimation of persistency
depends on three basic processes: how the chemicals are released, how they move in their

10
environment and their tendency to degrade within their compartment (US Environmental
Protection Agency 2004).
Persistency can be sub-divided into two categories: persistent or non-persistent,
according to the time required for the compound to disperse. The US Environmental
Protection Agency lists compounds that never degrade or that require a very long period of
time to do so as persistent. On the other hand, non-persistent chemicals are those that
degrade over a very short period of time (US Environmental Protection Agency 2004).
The degradation time of a chemical determines its half-life. Half-life is defined as
“the period it takes for the concentration of a substance to be reduced by half, by
transformation, in a medium (Canadian Environmental Protection Act 2000)”. There exists
no single threshold separating persistent versus non-persistent compounds, most importantly
because chemicals degrade at different rates according to the environmental conditions of
specific media. Specifically, factors such as temperature, types of microbes present in the
environment, and concentrations of the compounds can all influence the chemical half-life
(Verschueren 2001).
Triclosan is classified as a non-persistent chemical in air, water, soil and sediment
because its half-life does not meet any of the criteria for each of the above medias, as
identified in the Persistence and Bioaccumulation Regulations of the Canadian
Environmental Protection Act, 1999 or the Toxic Substances Management Policy (Health
Canada and Environment Canada 2012). Persistent chemicals must meet at least one of the
following characteristics (Canadian Environmental Protection Act 2000):
“(a) in air,
(i) its half-life is equal to or greater than 2 days, or
(ii) it is subject to atmospheric transport from its source to a remote area;

11
(b) in water, its half-life is equal to or greater than 182 days;
(c) in sediments, its half-life is equal to or greater than 365 days; or
(d) in soil, its half-life is equal to or greater than 182 days.”
3.1.2 Characteristics and sources of exposure of triclosan
Triclosan is a broad-spectrum anti-microbial agent that was initially developed in
Basel, Switzerland, and has been used to control the spread of bacteria since as early as the
1960s (Fang et al., 2010; Jones et al., 2000). This agent is also marketed under the following
brand names: Microban, Amicor, Aquasept, Bactonix, DP 300, Irgasan, Monolith, Sanitized,
Sapoderm, Ster-Zac and Ultra-Fresh (Environmental Defence 2012).
Triclosan is commonly added to over 1500 personal-care products including
toothpastes, mouthwashes, soaps, deodorants, and cosmetics (Government of Canada 2013).
In addition, it exists in many medical devices and household items such as plastic kitchen
utensils, toys, (Clayton et al., 2011; Fang et al., 2010; Kim et al., 2011; Philippat et al., 2012)
and even smartphone cases (Environmental Defence, 2012).
Research on wastewater and surface water monitoring in the United States has
concluded that due to the abundance of consumer products containing triclosan, it is one of
the most frequently detected compounds and in highest concentrations in wastewater, due to
disposal in residential drains (Reiss et al., 2002). Washing hands and dishes, as well as
bathing and brushing teeth with triclosan-containing personal care products are a select few
of the activities that can result in accumulation of triclosan in waterways through product
disposal. Humans generally have low exposure to triclosan from drinking water due to the
water treatment process. Water treatment plants have a triclosan removal efficiency rate of
approximately 95% (Samsoe-Petersen et al., 2003). The accumulation of triclosan in
waterways results in chronic exposure of aquatic organisms such as fish, frogs and algae

12
(Environmental Defence 2012). Consequently, concentrations found in fish are much higher
than those found in water (Balmer et al., 2004; Samsoe-Petersen et al., 2003). Triclosan
accumulates in these media (Bennett et al., 2009; Fair et al., 2009). Upon consumption of
fish, humans may also be exposed to triclosan, albeit in negligible amounts.
Although TCS lacks the ability to persist in aerobic conditions, its continual input to
surface water through wastewater treatment plants makes exposure to this chemical agent
ubiquitous (Canadian Environmental Protection Act 2000).
3.1.3 The impact of triclosan on the environment, animals, and humans
3.1.3.1 Triclosan in the environment
Upon combined exposure with chlorine and UV radiation, triclosan undergoes
photochemical degradation and produces 2 dioxins (2,8-dichlorodibenzo-p-dioxin (2,8-
DCDD) and 2,4-dichlorophenol (2,4-DCP) (Alliance for the Prudent Use of Antibiotics
2011). Dioxins are highly toxic, persistent environmental pollutants that can affect
reproduction, development, immunity, and hormones; they can also be carcinogenic (World
Health Organization 2010). There are 210 environmental dioxins; however, only 17 are of
public health concern (Van den Berg et al. 2006). It has been concluded that the two
formations resulting from triclosan degradation are not of public health concern (Latch et al.
2005). This is important to confirm that human exposure to triclosan through these dioxins is
a negligible source.
3.1.3.2 Animal models of triclosan toxicity
Conclusions drawn from animal research studies have identified mixed androgenic
and thyroid effects due to triclosan exposure. Triclosan mimics the thyroid hormone, thereby
restricting the functionality of endogenous hormones and inhibiting the metabolism of the
thyroid hormone. This thyroid hormone-associated disruption at low levels of exposure (0.03

13
mg/L) has been linked to disruption of gene expression in tadpoles (Veldhoen et al. 2006)
and reduced sperm production in male rats (Kumar et al. 2009). Other research has shown
that TCS hinders estrogen sulfotransferase, an important enzyme in the metabolization and
transportation of the hormone to the fetus in sheep placenta (James et al. 2010). In addition,
triclosan has been found to impact testosterone binding in rats (Gee et al., 2008). Chronic
oncogenicity studies have identified tumors in mice, rats, and hamsters; however, the
development of similar tumors in humans is not plausible due to differences in TCS
metabolite generation and excretion as well as modes of actions in the animals that are not
relevant to humans (FDA 2010; Rodricks et al. 2010).
On the contrary, further research has shown that triclosan has no effect on androgenic
activity in rats (Zorrilla et al., 2009) or in frogs (Matsumura et al., 2005). As well, no
reproductive effects were found on Japanese Medaka fish after 21 days of triclosan exposure
(Ishibashi et al., 2004).
3.1.3.3 Impact of triclosan on human health
Antimicrobial agents can be bacteriostatic or bactericidal. Bacteriostatic agents
prevent the growth of microorganisms without resulting in microorganism death, whereas
bactericidal agents kill microorganisms directly. Triclosan is bacteriostatic at low
concentrations and bactericidal at higher concentrations (Alliance for the Prudent Use of
Antibiotics 2011). It has an effect on many types of Gram-positive and Gram-negative non-
sporulating bacteria, as well as on some fungi and parasites (McLeod et al. 2001; Schweizer
2001). It does not have an effect on Pseudomonas aeruginosa or on Clostridium difficile
(Alliance for the Prudent Use of Antibiotics 2011).

14
The efficacy of the anti-microbial activity of triclosan-containing products varies.
The efficacy of triclosan-containing soaps was examined using bacterial counts and was
found to not be statistically significant from the bacterial counts in regular soaps (Aiello et
al., 2007; Tan et al., 2002). Similarly, there was no distinct evidence of efficacy of triclosan
as an anti-microbial agent in plastics (Fang et al. 2010). Contrarily, in Colgate Total®
toothpaste, TCS was found to successfully prevent gingivitis (FDA 2010). However, two
studies examining exposure to triclosan through toothpaste use showed no significant
differences in plasma thyroid levels following short-term or long-term use of the toothpaste
(Cullinan et al., 2010; Allmyr et al., 2009).
Although triclosan has been linked to antimicrobial resistance (Yazdankhah et al.,
2006), the majority of research studies show no association between triclosan and bacterial
resistance (Aiello et al., 2007; Randall et al., 2004; Russell 2004; Suller & Russell, 2000;
Russell 2000; Beier et al., 2008).
Triclosan can lead to endocrine disruption (Allmyr et al., 2009; Kim et al., 2011). An
endocrine disrupting chemical (EDC) alters hormone signaling and can have potential effects
on hormone homeostasis (2009) and on transcriptional activity induced by testosterone
(Chen et al. 2007), on metabolism, as well as on the development of reproductive and
nervous systems (Dann and Hontela, 2011; Dodson et al., 2012). To date, only one
epidemiologic study has examined the potential effects of TCS on thyroid status. An analysis
of the US National Health and Nutrition Examination Survey (NHANES) data (a cross-
sectional study) from 2007-2008 has reported a positive association between triclosan and
total plasma triiodothyronine (T3) concentrations in adolescents; T3 levels were unaffected
in adults (Koeppe et al. 2013; Meeker et al. 2013). Triiodothyronine is a thyroid hormone
responsible for fetal and child growth and neurodevelopment, as well as regulation of

15
metabolism, reproductive, and cardiovascular systems (Dussault and Ruel, 1987; Stathatos
2012). Pregnant women are more susceptible to the effects of increased thyroid levels;
symptoms of increased T3 levels include accelerated central nervous system functioning
such as increased heart rate, metabolism, and anxiety. Anti-thyroid medication can cross the
placenta. This can lead to underdevelopment of the fetus due to low thyroid levels
(Springhouse Corporation, 1984).
In addition to the above effects, contact dermatitis and skin irritation can occur
following contact with triclosan (Robertshaw and Leppard, 2007). Also, photo-allergic
contact dermatitis (PACD), characterized by a more severe rash, can also result following
dermal exposure and subsequent ultraviolet radiation (Schena et al., 2008).
3.1.4 Exposure Assessment
Through dermal and oral routes, personal care products are the primary source of
exposure to triclosan. Exposure pathways such as fish consumption and contact with
untreated wastewater are negligible sources of triclosan exposure when compared to dermal
or oral routes. Triclosan is absorbed in the gastrointestinal tract and across the skin (Dayan
2007); however, to date there is no evidence of bioaccumulation from human oral or dermal
exposures to triclosan (SCCP (Scientific Committee on Consumer Products) 2009). For this
reason, exposure to personal care products is the focus of this thesis. In addition to the
exposure pathway, knowledge of the concentration, duration, frequency, and timing of
exposure, as well as the chemical identity, source, and medium of transport are essential for
the basis of risk assessment of environmental chemicals.
Indirect or surrogate methods of exposure data collection such as questionnaires,
diaries and interviews are commonly used to measure activity patterns among the population.
Although practical, these collection methods are self-reported and introduce a high amount

16
of uncertainty into the calculation of exposure estimates due to their subjectivity (Meeker et
al. 2013; Prince et al. 2008; Shephard 2003). Direct methods such as measurement of a
person’s environmental exposure through for example, the use of an air monitor provide
objective results; however, these methods tend to be expensive, and generally do not provide
any detailed information pertaining to sources of entry of the chemical into the human body
nor on confounding exposures. In addition, measures of the external environment often
assess only one route of exposure – for example, inhalation and may be a less precise
indicator of internal dose. Because of the strengths and drawbacks of both indirect and direct
data collection methods, these methods should be combined to obtain more precise measures
of exposure to environmental chemicals.
3.2 BIOMONITORING
Historically, exposure was measured by the degree of contact with a substance.
Resulting information was inaccurate; however, the concept of absorbed dose was
discovered. The absorbed dose is the amount of a compound that crosses the body’s
boundaries (Sexton et al. 2004). Today, the absorbed dose is measured through
biomonitoring.
Biomonitoring is “the measurement of a chemical, the products it makes after it has
broken down, or the products that might result from interactions in the body” (Health Canada
2013a). Biomonitoring data establishes baseline exposure levels, allows for comparison of
exposure among populations, as well as supports future research on potential effects of
environmental chemicals on human health (Health Canada 2013a). The direct measurements
of chemicals or their metabolites in different biological matrices are referred to as
biomarkers of exposure (California Department of Public Health 2013). Some collection

17
matrices include urine, blood, saliva, semen, hair, meconium, sputum, fingernails, lung
tissue, bone marrow, adipose tissue, and blood vessels.
Biomonitoring data provides sound evidence of both exposure and uptake. These results
can provide information on which subpopulations may be more vulnerable than others to
exposure of a specific compound. The US National Health and Nutrition Examination
Survey (NHANES) has demonstrated the value of biomonitoring. Between 1971 and 1975,
the first cycle of this survey (NHANES I) collected a variety of health data from different
populations. A plethora of research on exposure to environmental chemicals has since
emerged and is used by the public, scientists, and other health professionals to perform
exposure and risk assessments. The Fourth National Report on Human Exposure to
Environmental Chemicals was published in 2009 (US Department of Health and Human
Services 2013). In Canada, a similar population-based survey, the Canadian Health Measures
Survey, is an ongoing biomonitoring and health examination survey that has now produced
its second biomonitoring report (Health Canada, 2013b).
Biomonitoring has many advantages including accounting for all routes of exposure
(dermal, oral, inhalation), as well as accurately representing repeated contact with a chemical
(Arnold et al. 2013). Biomonitoring techniques today are used to precisely measure levels of
environmental chemicals in human fluids and tissues.
3.2.1 Sampling methods: advantages and challenges
One of the most common biomonitoring matrices is blood, because of its contact with
organs and tissues where chemicals are stored. Disadvantages of blood as a matrix, however,
are that its collection is rather invasive (Esteban and Castaño, 2009) and that in pregnant
populations, measurements of chemical concentrations in blood are influenced by plasma
volume expansion (PVE). PVE occurs throughout pregnancy to provide for the circulatory

18
needs of the uterus, breasts, skin, kidneys, and placenta. The average volume expansion is
45%, although variation exists from minimum to a 2-fold increase. As a result, serum
proteins are altered (Faupel-Badger et al. 2007). Plasma volume expansion is difficult to
measure in population studies. In addition, concentrations of non-persistent chemicals may
be significantly lower and of shorter duration in blood than in other matrices such as urine
(Needham et al. 2008).
Another common biomonitoring matrix is urine. This is the predominant route of
excretion for triclosan; urinary triclosan excretion proportions vary from 57 to 87% in United
States literature (Rodricks et al. 2010). The urinary excretion half-life of TCS is
approximately 11 hours (Sandborgh-Englund et al. 2006). Triclosan can be excreted in its
free form, or it can undergo the chemical process of conjugation to increase its stability,
which results in the excretion of conjugated forms of triclosan, specifically glucuronide and
sulfate conjugates (Wang et al. 2004). The majority of triclosan is excreted through the urine
within 24 hours (Fang et al. 2010) in its conjugated forms. As a result, urine void samples
represent an accurate biomonitoring tool to measure TCS exposure (Calafat et al. 2008;
Sexton et al. 2004). Other reasons that urine sample collections are excellent biomarkers of
exposure include the ease of sample collection in addition to the fact that urinary metabolites
are readily detectable for up to several days after exposure (Barr et al. 2006).
Although common and efficient, urine biomonitoring does present its own
challenges. Serial urine samples over a 24-hour period raise the possibility of non-adherence
by participants. Biomarker measurements may be affected by when during the day urine is
collected, as well as the variability in the volume and concentration of the urine samples
(Barr et al. 2006). As a result, the association between exposure and outcome may be
misrepresented (Arbuckle 2010).

19
The collection of one single spot urine sample to represent the pregnancy period, as was
performed in several studies of triclosan urinary concentration levels, does not allow for
determination of the temporal variability of triclosan across pregnancy (Casas et al. 2011;
Philippat et al. 2012; Wolff et al. 2008; Woodruff et al. 2011). An important question to ask
is whether a single sample collected in the third trimester provides an accurate representation
of exposure to a chemical that generally has a short half-life (Wolff et al. 2008), but may
have a slightly different half-life due to metabolism differences in pregnant women as
compared to non-pregnant women (Philippat et al. 2012).
With respect to other biomonitoring matrices, unique challenges present themselves
in pregnant populations when correlating maternal exposure levels with fetal and infant
exposure (Arbuckle 2010). In terms of breast milk collection, not all women breastfeed and
providing extra milk for sampling can prove to be challenging for some women. In these
cases, a breast pump is often used, which can lead to potential contamination of the sample
from the collection materials. Lastly, standardizing the collection of breast milk sample is
very difficult. Samples can be provided at any time of the day, all from one breast or through
a serial collection from both breasts, and can be a combination of hind and fore milk (higher
fat content versus lower fat content and available more at the end of feeding versus available
at the beginning, respectively). When collecting cord blood, contamination may occur from
collection materials. There may also be a competition for the sample and the delivery of a
baby can be a hectic and unscheduled event. As a result, the collection of cord blood may not
be a priority for the staff. Another matrix of interest is meconium, a tar-like substance that
forms in utero around the thirteenth week of gestation and accumulates thereafter. Although
collection of meconium is non-invasive and may provide a longer, cumulative record of

20
exposure to various environmental chemicals than urine or cord blood, its equivalency to
other matrices is still unknown.
Additional factors should be taken into consideration when dealing with subpopulations
such as pregnant women. There are critical time periods of exposure or susceptibility, and
pregnant women are not a general healthy population. Pregnancies can be terminated for
various reasons, health problems may present themselves, and there may be anxiety in
providing the biospecimens for measurement of environmental chemicals. Pregnant women
are routinely asked to provide maternal blood and urine as part of care; these can be used as
surrogates for fetal exposure (Arbuckle 2010).
Measuring biomarkers of exposure can advance the field of research if they are true
measurements of the individual’s exposure for the relevant time period of interest (Arbuckle
2010). The wide number of biomonitoring matrices and the differences in collection methods
between women raise challenges with respect to biomonitoring of pregnant women and
infants.
3.2.2 Half-life
The selection of the biological matrix to measure exposure will depend on a number
of factors, including the nature of the chemical of interest. Varying chemical and physical
properties of environmental chemicals, along with the elimination half-life of each chemical
can provide reason for measurement in one biological specimen over another. The half-life
of a compound highly influences the selection of an appropriate biomonitoring matrix.
Compounds with longer half-lives (months or years) have longer body biological residence
times. These compounds can be sequestered in fatty acids or in bones and are therefore
metabolized more slowly than others. Contrarily, compounds with short half-lives (hours or

21
days), such as triclosan, are quickly metabolized in non-fatty tissues and are often excreted in
the urine (Sexton et al. 2004).
3.2.3 Urinary measurement of specific-gravity and creatinine
To properly interpret the urinary concentration of a compound, it is important to
account for the hydration status of the individual (Haddow et al. 1994; Miller et al. 2004).
Two common measures of hydration status are creatinine (CR) and specific gravity (SG).
Creatinine is a muscle activity by-product that is excreted from the bloodstream by the renal
system. Specific gravity is a measure of urine turbidity (Adibi et al. 2008). More specifically,
it is a ratio of the density of the urine specimen to the density of water. Although many
national studies including the US NHANES study report creatinine-adjusted urinary
biomonitoring data (as well as the unadjusted data) (Calafat et al. 2008), adjusting for
creatinine may introduce biases in either direction in the actual exposure dose. There has
been substantial discussion among investigators as to the appropriateness of creatinine
adjustment of single spot urine samples (Barr et al. 2005; Lee and Arbuckle, 2009). Intra-day
variation exists in creatinine measurements due to a combination of both internal and
external factors such as sex, age, health, diet, alcohol and incomplete voiding. As a result,
other means of adjustment for urine dilution may be more accurate (Boeniger et al. 1993).
Specific gravity has been identified as a useful alternative to creatinine in adjustment of
urinary concentration levels (Berlin et al. 1985; Haddow et al. 1994; Miller et al. 2004),
especially for women late in pregnancy (Adibi et al. 2008). Despite its sensitivity to changes
in temperature resulting in an increase in inter and intra-subject variability (Miller et al.
2004), specific gravity measurement is rapid and inexpensive (Haddow et al. 1994) which
makes it easy to use. Modern clinical refractometers to measure urine specific gravity
include automatic temperature compensation.

22
3.2.4 Single versus serial urine sample collection
Valid and reliable measures of exposure are important in order to assess the toxicity
of triclosan in humans. For some chemicals, several studies have shown that the between-
subject variability is larger than within-subject variability, and as a result, a single urine
sample may be representative of exposure (Hoppin et al. 2002; Mahalingaiah et al. 2008).
For other environmental chemicals, moderate within-subject variation has been reported.
This suggests that multiple urine samples are required to provide a reliable measure of an
individual’s exposure over a specified time period (Fromme et al. 2007; Hauser et al. 2004).
An intraclass correlation coefficient (ICC) is calculated to quantitatively measure the
ability of biomarkers to properly measure exposure to a chemical. An ICC of 1.0 indicates
perfect reproducibility, while an ICC of 0 indicates no reproducibility. A classification
method used by Rosner in biomonitoring research is indicated in Table 1 (Rosner 2006).
Table 1. Interpretation of the intraclass correlation coefficient (ICC).
ICC Reproducibility
<0.4 Poor
0.4 to 0.75 Fair to good
>0.75 Excellent
Due to the expense of laboratory analyses of biospecimens for environmental
chemicals and the burden of multiple urine collections on participants, the collection of a
single urine void from each individual in a large study or survey is common practice;
however, the reliability of the measure can be questioned if the chemical has a short half-life
23
(such as triclosan) and if the potential for moderate within-subject variation exists. To date,
only two studies have measured the temporal variability in exposure to triclosan. The first
study (Teitelbaum et al. 2008) collected data from June to October 2004 in a sample of 35
children aged 6 to 10 years from New York. The children provided six spot urine samples
within a six month time period. An intraclass correlation coefficient of 0.35 indicated poor
reproducibility among samples collected at different time points (Rosner 2006). The second
study (Meeker et al. 2013) collected data from 2010 to 2012 in a sample of 105 pregnant
women from Northern Puerto Rico. Spot urine samples were only collected three times
throughout pregnancy, for financial and logistical reasons. An intraclass correlation
coefficient of 0.47 indicated a moderately consistent exposure to sources over time.
It is recommended that separate temporal variability studies should be conducted in
pregnant women to develop population- and chemical-specific exposure assessment
strategies (Hauser et al. 2004). To date, no studies have measured temporal variability in
exposure to triclosan in a Canadian population, nor within a 24-hour period.
3.3 URINARY TRICLOSAN BIOMONITORING STUDIES
3.3.1 International studies measuring urinary triclosan in non-pregnant populations
Triclosan has previously been measured in several studies in the United States (Calafat
et al. 2008; Clayton et al. 2011; Teitelbaum et al. 2008), as well as in Chinese and Korean
populations (Kim et al. 2011; Li et al. 2011). Triclosan was detected in 93% of urine samples
in both the Chinese and Korean populations, with limits of detection of 0.5µg/L and
0.05µg/L, respectively. The limits of detection in the United States studies were higher,
ranging from 2.27 to 2.3µg/L. The detection rate of triclosan in these studies ranged from 70
to 75% (Calafat et al. 2008; Teitelbaum et al. 2008); however, these cannot be directly

24
compared to the Chinese and Korean studies because of the differences in the limits of
detection.
Li and colleagues (2011) measured triclosan levels in a population (n=287) aged 3-24
years of age in China. They found a decreasing tendency in urinary triclosan levels with age.
Contrarily, an increasing tendency in urinary triclosan levels with age was noted in a larger
study by Kim and colleagues (2011), where triclosan levels were measured in a Korean adult
population aged 18-69 years, as well as in a general United States population six years of age
or older (Calafat et al. 2008).
Higher triclosan levels have also been found to be associated with higher income
levels in the United States general population based on data from the National Health and
Nutrition Examination Survey (Calafat et al. 2008; Clayton et al. 2011).
The cross-sectional nature and single spot urine sampling of these studies do not allow
for the measurement of temporal variability of triclosan. Another limitation includes the
generalizability of the results given the country of the population of interest. Specifically, in
the study by Teitelbaum and colleagues (2008) in children of New York aged 6-10 years of
age, only black and Hispanic children were included in the study, so they were not
representative of the entire United States population of children.
A 2006 study (Sandborgh-Englund et al. 2006) examined the pharmacokinetics of
triclosan following oral ingestion in humans. They found that within 4 days following oral
exposure to triclosan, 24 to 83% of the dose was excreted. The median urinary half-life was
found to be 11 hours (range 7-17 hours). This study described the pattern of plasma triclosan
concentrations to increase rapidly with a maximum between 1 and 3 hours, and then slowly
declined with a half-life of 21 hours. To date, models describing the pattern of urinary

25
triclosan concentration in a short time period or the rate of urinary triclosan concentration
elimination have not yet been developed.
3.3.2 Triclosan in the Canadian population
Prior to May of 2012, no Canadian data on triclosan had been published. Since then,
two separate reports have been published. The first report, published in May of 2012 (but not
in the peer-reviewed literature), included descriptive statistics on urinary triclosan
concentration measurements for 8 Canadians from the general population (Environmental
Defence 2012). Detectable levels of triclosan were measured in 7 of these 8 participants
(88%). Average urinary concentrations in this population were similar to those reported in
the NHANES US population surveys (US Department of Health and Human Services 2013).
Despite being the first study to provide triclosan data on a Canadian population, this was a
survey of a very small and select population. In April of 2013, Health Canada published the
“Second Report on Human Biomonitoring of Environmental Chemicals in Canada”. This
provided the results of the population-based Canadian Health Measures Survey (CHMS)
Cycle II, which collected urine samples from 6,400 Canadians aged 3 to 79 years at 18 sites
across Canada, from 2009-2011 (Health Canada 2013b). Detectable levels of triclosan were
measured in 72% of the population, indicating again that exposure to triclosan is widespread.
Other than the Environmental Defence and CHMS Cycle II data results, no other published
Canadian data on triclosan exist at this time.
3.3.3 Triclosan in pregnant populations
Urinary triclosan concentrations have been measured in pregnant populations in the
United States, Spain, France, and Puerto Rico (Casas et al. 2011; Meeker et al. 2013;
Philippat et al. 2012; Wolff et al. 2008; Woodruff et al. 2011). Despite the relatively
consistent limits of detection in these studies (levels varied from 2.3 to 2.7ng/mL), there was

26
high variability in the rates of detection among these studies. Triclosan was detected in
urines of only 60% of the Spanish pregnant women in a 2011 study (Casas et al. 2011). In
contrast, the detection rate was as high as 89% in a study by Meeker and colleagues (2013)
of 105 Puerto Rican pregnant women from the Puerto Rico Test Site for Exploring
Contamination Threats (PROTECT) study; however, differences in the proportion of the
population using more of certain types of products may account for differences among
studies (Woodruff et al. 2011).
The most recently published study on triclosan in Puerto Rican pregnant women
measured the temporal variability of triclosan across pregnancy through serial urine sample
collection, in addition to collecting information on distributions and predictors of urinary
triclosan concentrations and self-reported product use information (Meeker et al. 2013).
Consistent with results of general population studies (Calafat et al. 2008; Kim et al. 2011),
the highest levels of urinary triclosan concentrations were present in the highest age
category. Urinary triclosan levels in this population did not vary across pregnancy, as was
determined by the similar measurements among study visits (Meeker et al. 2013).
Canadian data on triclosan in pregnant women, a population susceptible to increased
thyroid levels (Springhouse, 1984) and endocrine modulation effects (Woodruff et al., 2008),
have yet to be reported. This thesis project will produce the first Canadian data on the
exposure levels and temporal variability in such a population.
A summary of studies measuring urinary triclosan concentrations in humans is detailed
in Table 2.

27
Table 2. Summary of urinary triclosan studies in humans.
Author/Year Objective Population Results Limitations
Calafat et al.,
2008
Exposure to
triclosan in a
representative
sample
US general
population
(n=1288)
> 6 years of age
2003-2004
NHANES data
74.6% detection
Increasing TCS
levels with age and
income
Teitelbaum et al.,
2008
Evaluate intra-
individual temporal
variability
New York City
children (n=159) 6-
10 years of age
2004 data collection
71.7% detection
Limited
generalizability
(only Black and
Hispanic
nationalities)
Small sample size,
limited power
Wolff et al.,
2008
Prenatal exposures
to phenol
metabolites
US pregnant
women (n=404)
Single spot third-
trimester sample
1998-2002 data
collection
77.4% detection
One biomarker
measurement in
third trimester
Casas et al.,
2011
Evaluate the extent
of exposure to
phenols (one spot
urine sample in
third trimester)
Spanish pregnant
women (n=120)
Single spot sample
2004-2008 data
collection
59.5% detection
Small sample size,
limited power
Clayton et al.,
2011
Association of
endocrine-
disruption
compounds on
immune function
US general
population
2003-2006
NHANES data
> 6 years of age
Increasing TCS
levels with age and
income
Cross-sectional
design
Small sample size,
limited power
Kim et al.,
2011
Exposure to
triclosan
Korean adult
population (n-1870)
18-69 years of age
2009 data collection
92.6% detection
Increasing TCS
levels with age
Single spot ,
lifestyle factors
(levels lower than
US population)
Li et al.,
2011
TCS urinary levels Chinese children
and students
(n=287)
3-24 years of age
93% detection
Decreasing TCS
levels with age
Woodruff et al.,
2011
Characterize
individual and
multiple chemical
exposures
US pregnant
women (n=86)
2003-2004
NHANES data
> 6 years of age
Single spot sample
87% detection
Possibility of non-
representative
exposure patterns
Environmental
Defence 2012
Canadian exposure
to triclosan
General Canadian
population (n=8)
Single spot sample,
detected in 7/8
participants
Small sample size
(n=8)
Philippat et al.,
2012
Prenatal exposures
to phenols
French pregnant
women (n=191)
Single spot third
84.1% detection
No record of time
of sampling

28
trimester sample
2002-2006 data
collection
Health Canada,
2013
Second report on
human
biomonitoring of
environmental
chemicals in
Canada
Canadian
population
(n=2550) CHMS
Cycle II, 2009-2011
3-79 years of age
71.80% detection
Meeker et al.,
2013
Determine
distributions,
variability, and
predictors of
urinary biomarkers
of environmental
phenols and
multiple times
during pregnancy
Northern Puerto
Rico pregnant
women (n=105)
Spot urine sampling
in each trimester
2010-2012 data
collection
88.9% detection
rate
No difference
between study visits
Increasing TCS
levels with age
Self-reported
product use
3.4 RISK CHARACTERIZATION
Triclosan was detected in 76% of urine samples of Americans in the National Health
and Nutrition Examination Survey (NHANES) conducted in 2003 in United States
(Woodruff et al. 2011). Triclosan has been detected in 76% of liquid soaps and 29% of bar
soaps in a national US survey conducted in 2001 by Perencevich et al. (Perencevich et al.
2001). Body burdens of TCS have been correlated with the use of products containing TCS
as an active ingredient (Dodson et al. 2012; Fang et al. 2010).
Triclosan is an ingredient on Health Canada’s Hotlist, a list which is used to
communicate the names of prohibited and restricted cosmetic ingredients that may cause
harm to the health of the user (Health Canada 2011c). In March of 2012, Health Canada and
Environment Canada completed a preliminary assessment of TCS under the Canadian
Environmental Protection Act (CEPA), 1999 and the Pest Controls Products Act. It was
concluded that “triclosan is not harmful to human health at current exposure levels, but in
significant amounts can cause harm to the environment (Health Canada and Environment
Canada 2012)”. There was no clear evidence of a link between triclosan and antibacterial

29
resistance. As no Canadian data were available for this assessment, Health Canada used
biomonitoring data from the US NHANES study to estimate the total Canadian exposure to
TCS. During a 60 day comment period, Health Canada and Environment Canada proposed a
voluntary reduction of the use of household products containing TCS (Health Canada and
Environment Canada 2012). Subsequently, in May of 2012, Environmental Defence
produced the first report of TCS concentration measurement in Canadian adults. They
recommended “a mandatory ban on TCS in household products to protect the health of
Canadians and the environment (Environmental Defence 2012)”. They concluded that 87.5%
of their volunteers had detectable urinary levels of TCS. Further information from the media
report of this study, released on May 16th
, 2012, is available in Appendix A. Since the release
of the Environmental Defence report, certain companies have voluntarily decided to remove
triclosan from their list of active ingredients. Most recently, Johnson and Johnson has
removed it from all of their adult products (Kay 2013).
Currently, Health Canada has approved maximum TCS concentrations of 0.03% in
mouthwashes and 0.3% in other cosmetics (Health Canada and Environment Canada 2012).
These levels are consistent with those approved in the United States and Europe
(Government of Canada 2013). Approved triclosan concentration levels are slightly higher
(1.0%) in personal care products that are regulated as a drug (Government of Canada 2013).
When these products are used as directed, triclosan is rapidly excreted from the body,
creating a low chronic health risk and low human toxicity (NICNAS 2009; Rodricks et al.
2010).
In order to measure exposure to varying chemicals over time, biomonitoring
techniques have been developed and are an important tool in risk assessment.

30
3.5 SUMMARY OF THE LITERATURE
The findings of this review show that triclosan is consistently detected in a high
number of urine samples among children, adults and pregnant women in many countries
around the world. There is some evidence that triclosan levels are positively associated with
income (Calafat et al. 2008; Clayton et al. 2011), while there exists conflicting results
regarding how triclosan levels change with age (Calafat et al. 2008; Clayton et al. 2011; Kim
et al. 2011; Li et al. 2011; Meeker et al. 2013). The present study will attempt to contribute
to the ongoing research in the field through identifying the main sources of exposure to
triclosan, establishing predictors of urinary triclosan levels, measuring current urinary
triclosan levels through biomonitoring, as well as through the development of a model to
highlight the pattern of urinary triclosan concentrations following triclosan exposure.

31
CHAPTER 4: METHODS
4.1 STUDY DESIGN
Data for this thesis has been collected from The P4 Study: Plastics and Personal-Care
Product Use in Pregnancy. The P4 Study is a Health Canada Chemicals Management Plan
funded longitudinal observational study led by Dr. Tye Arbuckle, a Senior Epidemiologist
and Research Scientist, working for the Healthy Environments and Consumer Safety Branch
of Health Canada. The P4 Study examined exposure among a small group of Canadians to
triclosan, phthalates, bisphenol A, naphthalene, cotinine and triclocarban at all stages of
pregnancy and post-partum, while concurrently collecting questionnaire data and product use
activity information. Advantages of longitudinal observational studies include allowing for
investigation of events or changes that occur over time within the same individual. Also,
each participant serves as their own control, thereby eliminating confounding due to
between-subject variability.
This thesis covers the analysis of triclosan, one of the chemicals measured in the P4
Study.
4.1.1 Data/biospecimen collection
The P4 Study consisted of five study visits. Visit T1 occurred within the first 20
weeks of pregnancy. This visit consisted of two separate sub-visits, one on a week-day and
the other on a week-end day. Visit T2 was a second trimester visit, while visit T3 was a third
trimester visit. Visits T4 and T5 were post-partum visits, taking place right after the birth of
the infant as well as approximately 2 – 3 months post-partum, respectively. At these repeated
occasions throughout pregnancy, several different biomonitoring matrices were analyzed for
presence of the numerous P4 study chemicals. These biomonitoring matrices included

32
maternal and infant urine, breast milk, meconium, and infant formula. Serial maternal urine
samples were collected over a 24-hour period during the week-day and week-end day T1
Visit, while a single spot maternal urine sample was collected at Visit T2, T3, and T5. The
biomonitoring data were recorded in biospecimen tracking logs, which can be reviewed in
Appendix B.
In addition to the collection of biomonitoring samples, self-reported “Product Use
Booklets” and “Food and Activity” diaries were also completed by participants for specific
time periods coinciding with their urine sample collections provided at the various study
visits. The women also completed questionnaires at each of the study visits during pregnancy
and approximately 2 – 3 months post-partum.
The P4 Study staff performed a number of tasks throughout the duration of the study.
In addition to collaborating with the clinical nurses, receptionists and ultrasound technicians,
they were responsible for participant recruitment and informed consent, completion of
participant case report forms, as well as the scheduling of home visits to pick up the urine
specimens and the completed diaries.
A summary of the procedures and requirements of participants and staff for each of
the study visits are detailed in Table 3.

33
Table 3. Summary of study visits. This table summarizes the study design, including all data
collected at each time point. The blue boxes indicate participant tasks; the grey boxes
indicate staff-facilitated tasks.
T1: Completed prior to 19 completed weeks gestation
Study Period Recruitment T1a (week-day) T1b (week-end)
Place Clinic Home Home
Time Frame Pre study 0 hrs 24-48hrs At 48hrs 0 hr 24-48hrs at 48hrs
Study Tasks
Consent Form
T1 CRF
Participant
receives cooler
bag, urine
specimen cups,
freezer packs,
diaries
Begin diary Continue diary
24 hrs of urine
collection
Home Visit to
pick up urine,
and diary
Begin
diary
Continue
diary
24 hrs of
urine
collection
Home Visit
to pick up
urine, and
diary
24-28 weeks 32-36 weeks Delivery 2-3 mo. Postpartum
Study
Period T2
T3 T4 T5
Place Home Clinic/Home Home
Clinic/Ho
me Hospital Home Home
Time
Frame 0 hrs 24 hrs 0 hrs 24 hrs Delivery 0 hrs 24 hrs
Study
Tasks
Begin
diary
Spot urine sample
CRF 2
Begin
diary
Spot urine
sample
CRF 3
Chart Review
(CRF 4)
Begin
diary
Home
visit to
collect:
Spot urine
sample
CRF 5 CRF: case report form questionnaire administered to study participants

34
4.2 SETTING AND STUDY POPULATION
4.2.1 Setting of the study
Ontario has a population of 13,505,900 (Ontario Ministry of Finance 2013). Canada’s
capital city, Ottawa, has a population of 883,391 (Statistics Canada 2012). The Ottawa
Hospital combines the services of the General, Civic and Riverside Campuses. With over
12,000 staff members and more than 6,500 babies delivered from 2011-2012, it is one of the
busiest hospitals in Ontario (The Ottawa Hospital 2012).
For the purpose of this study, the participants were all residents of Ottawa, while the
physicians and research nurses worked at The Ottawa Hospital.
4.2.2 Study population
Eighty pregnant women were recruited for the study from the Ottawa Hospital
between 2009 and 2010. Initial eligibility criteria included healthy women aged 18 years or
older, in the first trimester of pregnancy, with a singleton, viable fetus, planning on
delivering at the Ottawa Hospital, General Campus, and with the ability to consent and
communicate in English or French. Women who were planning a home birth within the city
were also deemed eligible for the study as an effort to boost enrolment.
4.2.2.1 Criteria for ineligibility
Women who had known fetal abnormalities (e.g. hydatidiform mole), known fetal
chromosomal anomalies or major malformations in their current pregnancy were excluded
from the study. Any women with a history of any of the following medical complications
were also excluded: renal disease with altered renal function, thyroid disorder, hypertension,
diabetes, epilepsy, any collagen disease such as lupus erythematosus and scleroderma, active
and chronic liver disease (hepatitis), heart disease, serious pulmonary disease, cancer,
haematologic disorder, threatened spontaneous abortion, and illicit drug use.

35
Exceptions to these exclusion criteria included women with anaemia or
thrombophilia, or women who experienced bleeding in the first trimester provided that their
chart documented a viable fetus at the time of recruitment (Tye Arbuckle, P4 Study Protocol,
May 2009).
The most common reason for which potential research participants were not eligible
for the study was that they were delivering at a hospital outside of Ottawa. As ultrasound
clinics were not available in smaller centres, women from outlying areas needed to come into
the city for their ultrasounds. It was at these clinics that the recruitment took place. Another
common reason for ineligibility was many women had a gestational age greater than 20
weeks before the completion of the T1 visit. Other reasons for exclusion included living too
far away from Ottawa for research staff to complete home visits, having serious co-
morbidity, being too sick to take part in the study, and no response given. Figure 2 indicates
the detailed reasons potential research participants were not eligible for study participation.

36
Reasons Not Eligiblen=536
0
0
1
1
1
2
2
2
3
3
6
7
8
8
13
18
20
26
79
336
0 50 100 150 200 250 300 350 400
Heart Disease
Illicit drug use
Chronic HTN
Renal disease
Serious pulmonary Disease
Active hepatitis
Cancer
Threatened abortion
Collagen disease
Does not understand consent
Multiple pregnancy
Hematological disorder
Epilepsy
Thyroid disease
Other: Participating in MIREC
Diabetes (not gestational)
Does not speak English
Other*
Unable to complete T1 before 20 weeks
Delivery outside participating hospitals
Ex
clu
sio
n C
rite
ria
Number of Potential Research Participants
Figure 2. Reasons for study participant ineligibility.
4.2.3 Participant recruitment
Recruitment began in November 2009 in the obstetrical clinic at The Ottawa
Hospital, General Campus, including only participants who planned to deliver at this hospital
and were in the first trimester of pregnancy. Recruitment took place primarily through
ultrasound clinics and high risk clinics; however, midwifery groups also played a role in
study participant recruitment. The research study was presented to physicians at their weekly
or monthly rounds, where the P4 Study staff formed collaborative relationships with
physicians’ support staff (nurses, receptionists, ultrasound technicians) to gain access to the
patients. Physicians who spoke favourably to their patients about participation in research

37
studies highly assisted the recruitment. Research staff also met with family doctors at other
offices within the community to inform them of the research study.
In February 2010, study posters and brochures were delivered to obstetrical and
general practitioner’s offices across the city. A copy of the study brochure is included in
Appendix C. Special attention was made to design and poster attractiveness through complex
and colourful graphics. Due to low recruitment, the study expanded the inclusion criteria in
March 2010 to include women delivering anywhere in the city of Ottawa. This included
hospital deliveries, as well as home births. At this time, recruitment began at a private
obstetrical clinic called Harmony, developed through partnership with physicians at The
Ottawa Hospital, Civic Campus. Recruitment at Harmony was from ultrasound clinics and
regular obstetrician visits. In order to increase recruitment levels further, the top end of the
gestational age limitation was increased in May of 2010 from 13 weeks 6 days to 19 weeks 6
days, and the compensation for participants’ time was increased from $50 to $100. Many
participants were ineligible because they could not complete the T1 visit before 20 weeks
gestational age. It was common to encounter women who were between 18-22 weeks
gestational age in the ultrasound clinics because this timing coincides with the morphology
ultrasound. Although women who were 18 weeks gestational age were usually able to
complete the T1 visit in time, it was common to explain the study to a potential research
participant only to find that she was slightly past the gestational age range for inclusion.
Figure 3 shows the cumulative participant recruitment by site and month throughout the
study.

38
P4 Recruitment - Cumulative by month and site(Dec 2009 - Dec 2010)
0 4 713 15 16 17
23 24 2734
41 41
00 0
58
1423
25 2734
44 45
38
0
10
20
30
40
50
60
70
80
90
100
Dec Jan Feb Mar Apr May Jun Jul Aug Sept Oct Nov Dec
Month
To
tal n
um
be
r re
cru
ite
d
Harmony
General
Figure 3. P4 cumulative participant recruitment by site and month from December 2009 to
December 2010.
Overall, between November 2009 and December 2010, 86 healthy pregnant women
from Ottawa, Ontario, Canada were recruited from physician and obstetrician offices,
ultrasound clinics, and midwifery groups as participants of the P4 Study. Six women
withdrew prior to the first study visit. As a result, our study sample consisted of 80 women.
Only 1307 women were assessed for study eligibility. As the number of births at the
Ottawa Hospital during the study period was greater than 6500, this represents only
approximately 20% of the sampling frame. Based on the criteria mentioned above, only 769
of the 1307 were eligible to take part in the P4 Study. The percentage of women who
volunteered to participate was only 11% for this study (86 out of an initial 769 eligible
participants) due to lack of interest. It is important to note that the questionnaire given to
participants choosing not to volunteer for the study failed to give participants the options to

39
say “prefer not to answer” or “unsure”, so it is hypothesized that “not interested” was the
default answer. Despite the low acceptance rate, the collaboration between the research and
clinical staff resulted in an overall successful number of recruited study participants. The
overall retention rate of study participants was 84% after excluding early outcomes such as
neonatal death or miscarriage and medical withdrawals. Figure 4 shows the flow diagram of
participant selection throughout the recruitment periods. “Lost to follow up” was defined as a
missed visit without an active withdrawal. Hence, there was sometimes a higher participant
number in subsequent visits. The numbers in the flow diagram do not necessarily add up
because some participants missed one study visit but were present for the remaining visits. In
order to assist with participant retention, participants in this study were contacted a minimum
of every 2-3 months.

40
Figure 4. Participant flow diagram. +Defines the number of participants remaining in the study after the neonatal period
a The term “No sample, meconium” includes all possible reasons meconium was not
collected. This includes: Meconium present at birth therefore no meconium in diapers,
patient did not save meconium, staff was not contacted at delivery, not enough meconium to
scrape into tubes, stool and transitional stool bThe term “No sample, infant urine” includes all possible reasons infant urine was not
collected. This includes: 2 or more unsuccessful urine bag attempts; the patient did not want
this procedure done at this point; unable to contact the patient
Loss to follow up is defined as a missed visit without an active withdrawal.

41
4.2.4 Sample size and power calculation
When the P4 Study was initially designed, there was limited biomonitoring data
available upon which to calculate sample sizes for many of the chemicals, including
triclosan. As a result, study power calculations were performed using a common phthalate
metabolite: mono-ethyl phthalate (mEP). There were a number of published biomonitoring
studies on mEP which showed considerable variability in exposure. Phthalates tend to have a
skewed distribution, so log-transformed mEP levels were modelled as normally distributed
with mean 5.3 and variance 0.51, based on mean and standard deviation values of 259.8 and
212.8, respectively, as reported by Hoppin et al. (Hoppin et al. 2002). As reported in the P4
Study Protocol, the assumed mixed effects model is:
log( ) .ij i ijmEP
“mEPij represents the ith woman’s measured level of mEP on the jth day, βi represents the ith
woman’s average level of mEP and εij represents random variation reflecting intra-subject
variability. This model assumes that the different women’s average levels were normally
distributed as βi ~ N (µ, Ƭ2), where µ represents the overall average level of mEP and Ƭ
2
represents the inter-subject variance. Finally, the model also assumes that the individual
variation term is normally distributed as εij ~ N (0, σ2), where σ
2 represents the intra-subject
variance. The overall variance of the log-transformed mEP levels would be 0.51= Ƭ2 + σ
2,
the sum of the inter-subject and intra-subject variance”.
A simulation was performed with 1000 samples of 15 women, each with 6 urine spot
tests throughout a day and with equal inter- and intra-subject variability ( ). Results of
the power calculation concluded that a sample size of 80 women would provide 80% power

42
to estimate the variability within each individual with an error of less than 0.06, while
accounting for any loss of data from study limitations mentioned above. Since the overall
variance is 0.5, this means that our final estimate of between-subject variability will be
reliable because it will not be biased by unaccounted-for between-subject variability (Tim
Ramsay, P4 Study Protocol, May 2009).
4.3 DATA COLLECTION
4.3.1 Ethics, Informed Consent
The P4 study received ethical approval by the Health Canada Research Ethics Board
and the Ottawa Hospital Research Ethics Board.
Individual written and signed consent was obtained for each participant. A copy of
the consent form completed by each participant in the study is included in Appendix D. This
information was collected by hospital research nurses, who undertook self-directed training
to understand the study protocol and procedures, and to learn the procedures of patient
screening, recruitment, informed consent, specimen and data collection and processing, as
well as shipment of biospecimens. Study procedures were clearly explained and participant
eligibility criteria were assessed by the research nurses. The participant eligibility form is
included in Appendix E. All information and specimens provided by participants were coded
with a unique participant identifier in order to preserve confidentiality of personal
information.
Throughout pregnancy, all medical conditions and prescribed medications were
recorded in each woman’s medical chart. In addition, the outcome of the pregnancy was also
recorded. This information was extracted from each participant’s chart for the purpose of this
study.

43
4.3.2 Maternal Urine Collection
Women were asked to provide multiple urine samples on five different occasions
throughout their pregnancy and post-delivery. Serial urine samples were collected on two
different occasions (week-day and week-end day) during early pregnancy (between 6 and 19
weeks). For these collections, participants were asked to collect each of their urine voids
within a 24-hour time period to provide information on the temporal variability of urinary
triclosan concentrations within a day. In addition, single spot samples (minimum of 50mL)
were collected during the 2nd
trimester (24-28 weeks), the 3rd
trimester (32-36 weeks) of
pregnancy, as well as two to three months postpartum. Urine samples were collected at the
participant’s home or at their regularly scheduled clinic visit with their obstetrician or family
doctor. All post-partum samples were collected at the participant’s home. In the event of
home collections, a research assistant from The Ottawa Hospital personally collected each of
the samples. In order to avoid degradation of the chemical, study staff were reminded that the
urine must be kept cool (4°C) during the collection period, mixed well and aliquotted within
36 hours of collection, and then stored frozen at -80°C (Calafat et al. 2008). The maternal
urine collection schedule is detailed in Appendix F.
Data from maternal urine sample logs, questionnaires and diaries were entered
directly into MS Access 2007 using a standardized data collection form.
4.3.2.1 Biospecimen analysis
All laboratory analyses of the P4 biospecimens took place at the Centre de
Toxicologie du Québec (CTQ), Institut national de santé publique du Québec (INSPQ).
Triclosan was quantified in urine samples with the GC-MS-MS (gas chromatography
coupled to tandem mass spectrometry) method, following a solvent extraction protocol. The
detection limit was 3.0 µg/L. Field blanks of distilled water were aliquotted to test for

44
contamination during the process, and a 50mL field blank of deionised water for each
participant was also analyzed. Specific gravity of the urine was measured by refractometry
(Atago UG-α, Cat. # 3464) with automatic temperature compensation (ATAGO 2003-2013).
4.3.3 Questionnaires and Exposure Journal
Upon recruitment, participants completed a questionnaire collecting details on
demographics, socio-economic status, employment, smoking history, obstetrical history,
current pregnancy information, and information on potential sources of exposure to the
chemicals of interest. Participants were also asked to complete additional questionnaires
throughout pregnancy as well as postpartum. These questionnaires collected updated
pregnancy, employment, smoking history, and exposure information. A chart review
questionnaire was also completed for each participant containing information on health
problems during pregnancy, and any medications prescribed to the woman during her
pregnancy.
Both a “Food and Activity” diary and a “Product Use Booklet” were given to each
participant to complete at specified times throughout their pregnancy. These can be found in
Appendix G. In particular, for the first two serial urine sample collections, participants
completed the journals over a 48-hour period starting 24 hours prior to commencing the
serial urine collection and continuing throughout the 24-hour collection. For the single spot
urine samples collected in the second and third trimester, as well as approximately 2 – 3
months post-partum, women only completed the journals for the 24-hour period prior to the
collection of the spot urine sample. The complete data collection schedule is detailed in
Appendix F.
In the “Food and Activity” diary, all foods and drinks consumed, and personal-care
products used throughout the day were recorded, including the time of use for the pre-

45
specified time period. Also included in these journals were notes of any missed urine
collections and any medical procedures throughout pregnancy that were close in time to the
collection of the urine samples, such as amniocentesis, dental work, or blood draws.
Meanwhile, in the “Product Use Booklet”, women recorded detailed product and brand name
information including dates consumed/applied for all products listed in the “Food and
Activity” journal. Questionnaire data, as well as food, activity, and product information data
were entered directly into a MS Access 2007 database.
Throughout the course of the study, many of the Product Use Booklets (PUBs) were
not returned. Out of 80 participants, 53 PUBs were returned, 19 were lost and there is no
available information on the remaining PUBs from participants with early outcomes such as
miscarriages or neonatal deaths, as well as from those who were lost to follow-up. As a
result, the brand name and manufacturer of the products that they used at any point in the
study are unknown for some of the women.
4.4 DEFINITIONS OF VARIABLES
The dependent variable or primary outcome is urine triclosan concentrations (µg/L)
in pregnant women, as measured by both single spot urine and serial 24-hour urine samples.
All urine samples with a volume of 50mL or greater were included in the analysis. Un-
recorded voids were coded as missing.
The independent variable of personal care product use summary score is a
continuous variable representing the extent of exposure of an individual to products
containing triclosan. Each person received an individual summary score based on the sum of
the total number of exposures to an individual personal care product throughout their
pregnancy.

46
Product categories for the classification of triclosan include:
Category I: Cosmetics: products used for making up the eyes, face, or lips
Category II: Hair care: products used for cleaning, treating, conditioning and styling
of hair
Category III: Oral care: products used for dental hygiene
Category IV: Baby products: products that are applied to a baby
Category V: Deodorant/Antiperspirant: products used for underarm hygiene
Category VI: Hand soaps/sanitizers: products used for washing hands
Category VII: Lotions/Creams: products used for moisturizing hands, face, body,
and feet
Category VIII: Skin care: products that are used as cleansers and toners for the face,
body and feet
Category IX: Medication/vitamins: products that are used for medical treatment or
health maintenance
Category X: Household cleaning products: products that are used for household
disinfection
Category XI: Other products
Additional covariates included in the study models were categorized as follows,
ensuring a minimum sample size of 5 participants per category for each categorization.
Marital age:
(1=<30 years / 2=30-34 years / 3=35-39 years / 4=>40 years / 99= “missing”)
Education:

47
(1=High School diploma, some College or University classes / 2=College diploma /
3=Undergraduate University degree / 4=Masters or PhD)
Marital status:
(1=Married / 2=Single, divorced, separated, widowed, or living with partner for greater
than one year)
Combined household income:
(1=<60,000 / 2=60,001-80,000 / 3=80,001-100,000 / 4=>100,000 / 99= “missing, refuse,
don’t know”)
Country of birth:
(1=Canadian / 2=Non-Canadian)
Time of day of urine void collection:
(1=00:00-07:59 / 2=08:00-15:59 / 3=16:00-23:59)
Parity: the number of times a woman has been pregnant for 20 or more weeks
regardless of whether the infant is dead or alive at birth (current pregnancy excluded)
(Centers for Disease Control and Prevention, 2011)
(0=none/1=once/2=two or more times)
Season of sample: season in which urine sample was collected
(1=spring / 2=summer / 3=autumn / 4=winter)
Season of conception: season in which conception took place, as determined through
gestational age information provided in study visit questionnaires
(1=spring / 2=summer / 3=autumn / 4=winter)
Season was defined according to the specific dates corresponding to each season for the
years of the study sampling:

48
Spring: March 20 – June 20, 2010; March 20 – June 20, 2011
Summer: June 21– Sept 22, 2010; June 21 – Sept 22, 2011
Autumn: Sept 23 – Dec 20, 2010; Sept 23 – Dec 21, 2011
Winter: Dec 21 – Mar 19, 2010; Dec 21 – Mar 19, 2011
Also included as covariates were the total volume of the urine sample (in mL), as
well as time since the last urine void (in seconds). Although study participants recorded their
time since last urine void in hours and minutes, seconds was selected as the units for the time
since last void variable in the study model due to ease of coding within the Statistical
Analysis Software (SAS) 9.3 program.
4.5 DATA CLEANING
This thesis consisted of analyses of secondary datasets, collected from the P4 Study.
These final datasets were available as of May 2012. One of these datasets included all the
laboratory and biospecimen tracking log information, which contained 55 different variables,
some of which being the participant identifier numbers, barcode numbers for each metabolite
sample, sample collection dates and times, laboratory measurements of each of the study
metabolites, and adjustment factor measurements of specific gravity and creatinine. Cleaning
of this dataset was performed for the purpose of this thesis in order to obtain a final dataset
containing only the laboratory information relevant to triclosan.
A second dataset was also available containing all of the demographic information
collected from participant questionnaire data. Each of the variables was labelled as either
categorical or continuous. The categorical demographic variables were grouped into
categories, ensuring a minimum of 5 entries per cell; the dataset was coded accordingly.
49
The laboratory dataset and the demographic information dataset were then merged
into one final dataset, which was then prepared for analysis using Statistical Analysis
Software (SAS) 9.3 (SAS Institute, Cary, NC).
Lastly, a partially complete dataset was available, containing questionnaire
information, as well as information from the “Food and Activity” diaries and the “Product
Use Booklets”. Further data entry was required to complete the dataset. In the end, there
were many cases in which the information provided in the diaries did not match that of the
booklets. For example, an activity of “brushing teeth” may have been recorded in the diary;
however, there was no corresponding recording of “toothpaste” in the product booklet.
Consequently, there was a high amount of missing data in this product dataset. After
consulting incomplete diaries on a case-by-case basis and finding instances where use of a
specific product by an individual had been identified earlier in the diary but not as
specifically later (e.g., “Colgate Total toothpaste” earlier and then “toothpaste” later),
imputation was performed. An additional 170 products and corresponding activities were
added to the dataset to produce a final total of 6031 product and activity recordings. The final
product dataset contained participant identifier numbers, activity information, product brand
and manufacturer information, as well as the corresponding dates and times of each of the
product uses. Each entry in this dataset was then individually categorized into one of the 11
product categories. Further classification placed each of the entries into a category of
“product contains triclosan”, “unsure as to whether product contains triclosan”, or “product
does not contain triclosan”. This dataset was then prepared for SAS analysis.

50
4.6 DATA ANALYSIS
Data were imported from MS Access 2007 into Statistical Analysis Software (SAS)
9.3 (SAS Institute, Cary, NC). The complete components of the database are listed in
Appendix H. Components of interest for this thesis include questionnaires, journals, product
use booklets, biospecimen tracking logs, and maternal urine specimen results from the
laboratory at the Institut National de Santé Publique du Québec (INSPQ).
Previous studies analyzing triclosan concentrations in urine found that the
distribution of TCS concentration was not normal. As a result, the variable required
transformation (Calafat et al. 2008; Casas et al. 2011; Kim et al. 2011; Teitelbaum et al.
2008; Wolff et al. 2008). An initial analysis for normality in this data suggested that the
urinary triclosan levels were positively skewed. As a result, this variable was log-
transformed, and was included as such in the models which will be presented in the
subsequent sections.
4.6.1 Adjustment of Maternal Urine Samples for Dilution Effect
Consideration of the hydration status of the individual is important for interpreting
chemical concentrations in urine. Specific gravity adjustment has been labelled as a useful
alternative to creatinine adjustment (Berlin et al. 1985; Haddow et al. 1994; Miller et al.
2004), especially in pregnancy (Adibi et al. 2008). Hence, urinary concentrations were
adjusted for specific gravity, using the following formula, adapted from Just and colleagues
(Just et al. 2010):
Pc = Pi [(SGm– 1)/(SGi – 1)],
where Pc is the SG-adjusted metabolite concentration (ng/ml), Pi is the observed metabolite
concentration, SGi is the specific gravity of the urine sample, and SGm is the median SG for

51
the cohort. Both unadjusted and specific gravity adjusted concentrations will be reported for
all calculations.
4.6.2 Descriptive Statistics
Descriptive statistics were used to describe the study population, the number of urine
samples provided by each participant, and the distribution of participants in the various
categories of maternal age, education, marital status, combined household income, country of
birth, time of day of urine void, season of sampling, season of conception, and parity
variables. In addition, the overall geometric mean and 95% confidence intervals, median,
range and selected percentiles of urinary triclosan levels per participant in these categories
were also calculated. No participants were eliminated from subsequent analyses based on
their failure to provide urine samples.
The total percentage of samples in which the urinary triclosan level was greater than
the limit of detection (LOD), corresponding to 3.0µg/L, as reported in the 2012 version of
the INSPQ P4 laboratory summary report (LeBlanc and Marchand, 2012), was recorded. It
was not necessary to employ a method to account for urinary triclosan concentrations that
were below the LOD due to the ability of the lab results to quantify levels in samples below
3.0µg/L. For the purpose of study analysis, a constant of 0.0001 was added to each of the
urinary triclosan concentrations of 0µg/L.
4.6.3 Product Use
With the abundance of products on the market, presence of TCS in the recorded
products was identified with the assistance of the White Paper prepared by The Alliance for
the Prudent Use of Antibiotics and the Health Canada online Drug Product Database
(Alliance for the Prudent Use of Antibiotics 2011; Health Canada 2011a).
52
The eleven product categories were derived upon consultation of previous product
classification methods for chemicals of emerging concern (Dhanirama et al. 2012; Koniecki
et al. 2011; Romero-Franco et al. 2011). Categories included cosmetics, hair care, oral care,
baby products, deodorant/antiperspirant, hand soaps/sanitizers, lotions/creams, skin care,
medication/vitamins, household cleaning products, and other products.
Analysis of self-completed journals, product-use booklets and of questionnaire data
in combination with the product categorization allowed for identification of which product
categories were most frequently used by the participants, how product use varied across
pregnancy, and the association between triclosan product use and triclosan geometric mean
urine concentration levels.
4.6.4 Prediction of Urinary Triclosan Levels
A question of interest to this study was to determine whether any covariates
significantly predicted urinary triclosan levels. Due to the correlations among the repeated
urine sample measurements per participant in this study design, linear mixed effects models
were fitted using the MIXED procedure in SAS, as has previously been done in similar
studies (Hauser et al. 2004; Mahalingaiah et al. 2008; Teitelbaum et al. 2008). These models
allowed the first urinary triclosan level of each participant to vary, while also allowing for
variation in their responses over time. The spatial power covariance structure inherent in
these models accounted for a change in correlation of responses over time; it was selected for
its ability to handle the unbalanced observations, specifically the fact that the time points
were unequally spaced, and were different across study participants.
Three different models were fitted:
1. The outcome was unadjusted log-transformed urinary triclosan concentration;
specific gravity was not adjusted for nor included in the model in any way.

53
2. The outcome was unadjusted log-transformed urinary triclosan concentration;
specific gravity was included as a covariate in the model.
3. The outcome was specific gravity adjusted log-transformed urinary triclosan
concentration.
As previously mentioned, a constant value of 0.0001 was added to any urinary
triclosan concentrations of 0µg/L within the dataset, in order to retain these samples in the
analysis when log transforming the urinary triclosan concentrations.
Covariates included in each of the fitted models were: study visit, total volume,
marital status, education, combined household income, country of birth, time of day of urine
void, age, season of conception, season of sampling, parity, and time since last urine void.
Type 3 tests of fixed effects of covariates will report associations between selected covariates
and the log-transformed urinary triclosan levels. The numerical value of the Akaike
Information Criterion (AICC), a measure of model quality, will be used to determine the
most appropriate model for our study data.
Within-subject variance provided an estimate of the measurement error involved in
using a single spot sample to estimate a subject’s average exposure. Between-subject
variance provided an estimate of the variability among urine samples provided by each of the
different study participants.
The temporal variability of TCS within a 24-hour period following exposure and
throughout pregnancy were assessed using the intra-class correlation coefficient (ICC), a
measure of reproducibility, calculated by dividing the between-subject variability by the sum
of the between- and within- subject variability. The value of the ICC summarized how well
groups of observations at each time point resembled each other.

54
Any factors that predicted urinary triclosan levels were also identified. Tukey’s HSD
(Honestly Significant Difference) test was performed in combination with an estimate model
statement to test for differences in mean concentration values between group categories. The
Tukey’s HSD test was performed in order to obtain an output which adjusted for the multiple
comparisons, which could have increased the chance of Type I error.
Because the urinary triclosan levels were non-normally distributed (as was
determined by Quantile-Quantile plots), non-parametric tests were performed on the log-
transformed urinary triclosan concentrations. A Mann-Whitney test was performed to test for
differences in week-day and week-end day urinary triclosan levels, while a Kruskal-Wallis
test was used to test for differences in triclosan levels across pregnancy.
4.6.5 Predictive Ability of a Single Spot Urine Sample
In order to examine the predictive ability of the single spot samples taken throughout
pregnancy versus a 24 hour urine collection sample, a surrogate categorical analysis was
performed, as was done in similar studies (Braun et al. 2012; Hauser et al. 2004; Teitelbaum
et al. 2008).
Terciles (low, medium, and high levels) of urinary TCS concentration levels were
created based on cut-points determined by the distribution of each participant’s geometric
mean concentration levels.
The geometric mean value of specific gravity (SG) adjusted triclosan concentrations
across all samples provided across study visits was calculated for each participant. This value
classified them into one of the terciles, corresponding to the “observed true value” for that
participant. In the case of serial urine samples provided in visits T1A and T1B, all individual
urine samples were used in the calculation of the overall geometric mean for each
participant.

55
The values of each individual SG-adjusted urine sample classified participants into
one of the pre-determined terciles; each classification was referred to as the “predicted
value”.
Contingency tables were created to determine the sensitivity of single spot
classifications to correctly predict an individual’s overall exposure throughout pregnancy.
Specifically, the overall agreement between the predicted and observed true classifications
for each sample, as well as the agreement between study visits and between different times
of day of urine sample collections were calculated. Chi-square tests of independence were
performed to test whether a significant difference existed between the levels of overall
predicted and true classifications.
4.6.6 Pattern of Urinary Triclosan Concentration Following Triclosan Product
Exposure
In order to assess the pattern of urinary triclosan concentration following exposure to
a product containing triclosan, a parametric linear trend model was fit. Specific gravity
adjusted log-transformed urinary triclosan concentration was the outcome (dependent
variable) and the time in hours since exposure to a product containing triclosan was the
predictor (independent variable). The time since exposure variable was created using each
individual’s recorded time of exposure to a product containing triclosan, and their subsequent
recorded urine samples provided in the 48 hours following the exposure.

56
CHAPTER 5: RESULTS
5.1 SAMPLE CHARACTERISTICS
The P4 study sample included 80 healthy, pregnant women. Amongst these women,
the mean maternal age was 32.8 years, with a standard deviation of 4.70. Ages ranged from
19 to 47 years.
Table 4 reports sample characteristics by demographic category. Among the 80
participants, 36 (45%) were between the ages of 30 and 34 years, 36 (45%) had an
Undergraduate University Degree, 63 (78.8%) were married, 44 (55%) had a combined
household income of greater than $100,000, while 63 (78.8%) were born in Canada. Forty-
six percent of study participants had no previous pregnancies prior to the pregnancy of
interest for the study. Season of conception was equally distributed among seasons; the
lowest percentage of women (14%) conceived in autumn.
Table 4. Demographic covariates of P4 Study participants (n=80) for all categories of
maternal age, education, marital status, combined household income, country of birth, parity,
and season of conception. Frequency and percentages of participant distribution.
Frequency Percentage
Maternal Age
<30
30-34
35-39
>40
Missing
17
36
19
7
1
21
45
24
9
1
Education
< College Diploma
College Diploma
9
14
11
18

57
Undergraduate University Degree
Masters or PhD
36
21
45
26
Marital Status
Married
Other
63
17
79
21
Income
<60,001
60,001-80,000
80,001-100,000
>100,000
Missing
7
11
13
44
5
9
14
16
55
6
Country of Birth
Canada
Other
63
17
79
21
Parity
0
1
>2
37
34
9
46
43
11
Season of Conception
Spring
Summer
Autumn
Winter
20
23
11
26
25
29
14
32
The mean number of urine samples provided by an individual participant was 15.59
samples. The number of total urine samples provided by an individual ranged from 4 to 23.
5.2 EVIDENCE SUPPORTING EACH OF THE RESEARCH OBJECTIVES
Biospecimen tracking log data were merged with laboratory data. Product and
activity information formed a separate dataset. Each was analyzed with Statistical Analysis
Software (SAS) 9.3 (SAS Institute, Cary, NC).

58
5.2.1 Objective 1: To highlight the main personal care product sources of exposure to
triclosan and their association with urinary triclosan concentrations.
Overall, there were 6031 product uses recorded by the study participants. Amongst
the 11 product categories, the mean number of product uses per category by a participant was
9.0 with a standard deviation of 12.9. Participants used as little as zero products from a
product category to as high as 60 products within one product category throughout
pregnancy. The product categories most frequently used were “hand soaps/sanitizers” (905
product uses, 15%), as well as “lotions/creams (875 product uses, 14.5%). The fewest
number of products were those of “baby products” (202 product uses, 3.4%), as well as
“other” (176 product uses, 2.9%). Examples of products that were in the “other” category
included bandaids and shaving gel. Figure 5 shows the distribution of all the product uses by
product category. The number of products used per participant did not vary across pregnancy
(F=1.42, p=0.27).
Figure 5. Total of personal care product uses by product category.
12.0%
10.9%
12.5%
3.3%
4.7%
15.0%
14.5%
7.9%
11.1%
5.2%
2.9%

59
Of the 6031 total products used by the study participants, 266 products (4.41%)
contained triclosan. Approximately a quarter of the products did not contain triclosan (4274
products, 70.87%), while for 1491 products (24.72%), it was not possible to determine
whether or not the product contained triclosan due to insufficient information provided in the
“Product Use Booklet”. Figure 6 demonstrates the triclosan classification of the total
recorded products by study participants.
Figure 6. Triclosan classification of all recorded products used by study participants.
The number of triclosan product uses per participant ranged from 1 to 40 uses. The
average was 7.51 with a standard deviation of 7.95, while the median number was 5 triclosan
product uses.
Triclosan products were classified into product categories. 123 (46.6%) were “oral
care” triclosan products, while 112 (42.4%) were “hand soaps/sanitizers” containing
triclosan, totaling 89% of all the recorded products. Other categories containing triclosan
products were “skin care” (5.3%), “household” (1.1%), and “other” (3.4%). Figure 7 shows
the breakdown of triclosan product categorization.

60
Figure 7. Triclosan products by product category.
There was a statistically significant positive correlation between the total number of
triclosan product uses per participant and their individual specific-gravity adjusted geometric
mean urinary triclosan level (r=0.53, p=0.0009).
5.2.2 Objective 2: To identify covariates which are statistically significant predictors of
urinary triclosan levels.
Three linear mixed effects models were performed to test for associations between
various covariates on urinary triclosan levels. Model 1 tested associations of various
covariates on unadjusted urinary triclosan levels with no inclusion of specific-gravity in the
model. Model 2 is identical to Model 1; however, specific-gravity is included as a covariate
in the model. Model 3 tested associations of various covariates on specific-gravity adjusted
urinary triclosan levels. Results of tests for fixed effects are listed in Table 5.

61
Table 5. Type 3 tests of fixed effects of covariates and Akaike Information Criterion
(AICC). Excluding specific-gravity (Model 1), including specific-gravity as a covariate
(Model 2) and adjusting the dependent variable for specific-gravity (Model 3). Linear mixed
effects models. *P-value significant at <0.05.
Model 1 Model 2 Model 3
Specific-gravity n/a F=111.53; p<0.0001* n/a
Visit F=0.84; p=0.499 F=1.30; p=0.267 F=1.11; p=0.351
Total volume F=4.55; p=0.033* F=0.34; p=0.561 F=0.24; p=0.624
Marital status F=2.96; p=0.090 F=3.63; p=0.062 F=3.82; p=0.055
Education F=1.75; p=0.166 F=2.32; p=0.085 F=2.04; p=0.118
Income F=1.90; p=0.121 F=2.12; p=0.089 F=2.00; p=0.106
Country of birth F=0.07; p=0.794 F=0.21; p=0.646 F=0.21; p=0.648
Time of day F=5.66; p=0.004* F=11.20; p<0.0001* F=7.46; p=0.0006*
Maternal age F=0.52; p=0.722 F=0.31; p=0.870 F=0.34; p=0.849
Season of conception F=1.09; p=0.359 F=1.30; p=0.282 F=1.38; p=0.257
Season of sampling F=3.08; p=0.027* F=3.91; p=0.009* F=3.35; p=0.019*
Parity F=3.05; p=0.055 F=3.42; p=0.039* F=3.45; p=0.038*
Time since last void F=9.59; p=0.002* F=0.72; p=0.396 F=1.13; p=0.287
AICC Information Criteria 4725.1 4612.4 4693.8
Time of day of urine collection and season of urine sampling were consistently
significant predictors of urinary triclosan levels (Time of day: Model 1: p=0.004; Model 2:
p<0.0001; Model 3: p=0.0006; Season of sampling : Model 1: p=0.027; Model 2: p=0.009;

62
Model 3: p=0.019 ). Each of the three models highlighted slightly different overall
predictors:
Model 1 also identified total volume of the urine sample (p=0.033), and time since
last urine void (p=0.002) as significant predictors of urinary triclosan levels. Model 2
identified specific gravity as a significant covariate (p<0.0001). Both Model 2 and Model 3
identified parity (Model 2: p=0.039; Model 3=0.038) as a significant predictor of urinary
triclosan levels.
All three models reported similar measures of information criteria, indicating that
each of the three models is of similar quality. Estimates of specific-gravity adjusted urinary
triclosan levels by time of day category, season of urine sampling and parity, as incorporated
in Model 3 are represented in Figures 8, 9, and 10, respectively. Geometric mean triclosan
levels were significantly lower in urine samples collected between 16:00-23:59 than in
samples collected from 09:00-15:59 or from 00:00-08:59. Urinary triclosan levels collected
in autumn were 1.44 times greater than samples collected in winter. Women with no
previous pregnancies had urinary triclosan concentrations 6.04 times greater than women
with 2 or more previous pregnancies.

63
Figure 8. Geometric mean of specific gravity adjusted maternal urinary triclosan levels
(µg/L) by time of day of urine sampling. * p < 0.05.
Figure 9. Geometric mean of specific gravity adjusted maternal urinary triclosan levels
(µg/L) by season of urine sampling.
* *

64
Figure 10. Geometric mean of specific gravity adjusted maternal urinary triclosan levels
(µg/L) by parity.
5.2.3 Objective 3: To measure current exposure levels through urine biomonitoring.
5.2.3.1 Objective 3a: To measure inter-subject and within-subject variability of
urinary triclosan levels.
The mean number of urine samples provided by an individual participant across the
duration of the study was 15.61 (standard deviation: 5.20).The number of total urine samples
provided by a single individual throughout the duration of the study ranged from 4 to 23.
Overall, there were a total of 1247 maternal urine samples provided. The percentage of these
samples which contained specific gravity adjusted urinary triclosan levels greater than the
limit of detection (3.0µg/L) was 86.8%. Among all 80 study participants, 39 (51.25%) had at
least one urine sample with a detectable level of triclosan (>3.0µg/L). As no triclosan was
detected in any of the field blanks, potential contamination from the study collection
materials, processing or storage conditions was not a concern.

65
Among maternal urine samples, the specific-gravity adjusted geometric mean
triclosan concentration and the respective 95% confidence interval (CI) was 34.1µg/L (30.5-
38.0), while the unadjusted geometric mean and 95% CI was 32.1µg/L (28.7-36.0). The
maximum specific-gravity adjusted triclosan measurement was 2452.4µg/L, while the
maximum unadjusted triclosan measurement was 3229.3µg/L. In addition to these values, the
minimum and maximum concentrations, as well as the 10th
, 50th
, 90th
, and 95th
percentiles of
TCS levels in all the maternal urine samples are described in Table 6.
Table 6. Geometric mean and selected percentiles of triclosan concentrations in maternal
urine [µg/L (95% CI)].
Specific-Gravity Adjusted Unadjusted
No. of Samples 1247 1247
Geometric Mean 34.1 (30.5-38.0) 32.1 (28.7-36.0)
Minimum Value 0 0
10th
Percentile 2.4 (2.1-2.7) 2.2 (1.9-2.4)
50th
Percentile 23.3 (20.1-26.8) 25.3 (21.2-29.6)
90th
Percentile 526.4 (466.2-576.2) 523.2 (471.3-591.7)
95th
Percentile 774.9 (673.6-880.8) 833.4 (740.7-918.1)
Maximum Value 2452.4 3229.3
CI, confidence interval.
LOD for urine: 3.00µg/L
Results based on raw data provided by chemist (ignoring LODs)
The intraclass correlation coefficient for all urine samples was 0.24, indicating poor
reproducibility among samples (Rosner 2006).
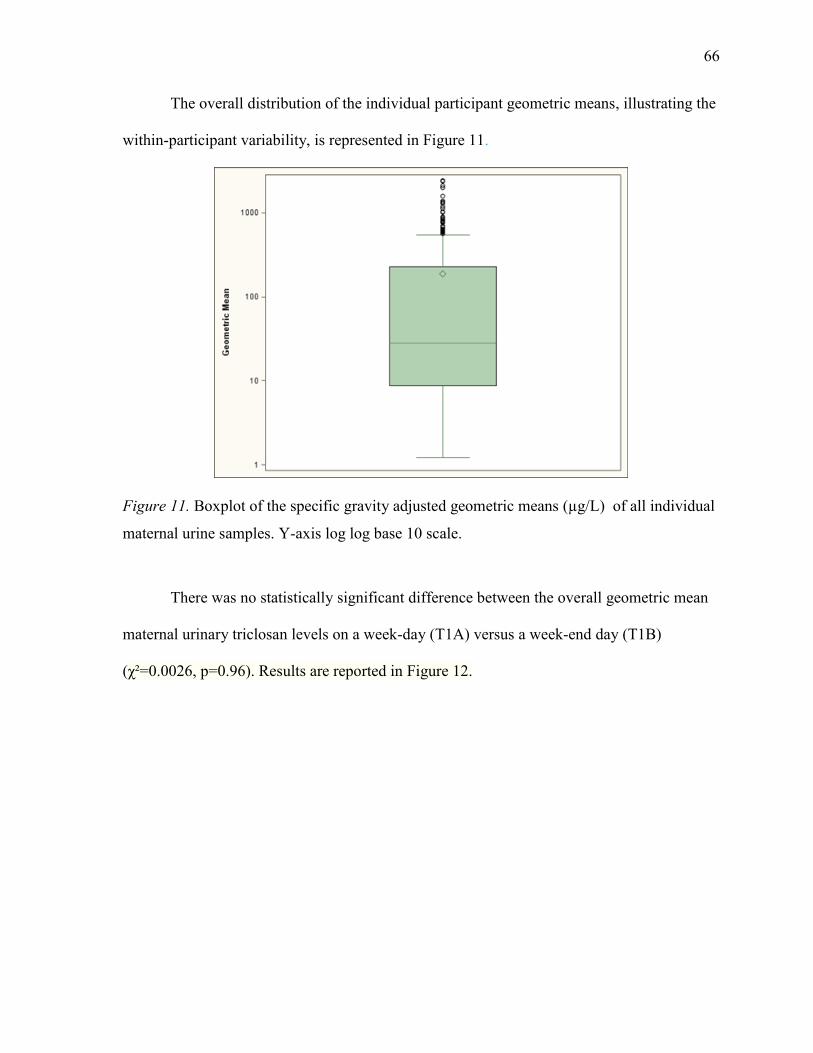
66
The overall distribution of the individual participant geometric means, illustrating the
within-participant variability, is represented in Figure 11.
Figure 11. Boxplot of the specific gravity adjusted geometric means (µg/L) of all individual
maternal urine samples. Y-axis log log base 10 scale.
There was no statistically significant difference between the overall geometric mean
maternal urinary triclosan levels on a week-day (T1A) versus a week-end day (T1B)
(χ²=0.0026, p=0.96). Results are reported in Figure 12.

67
Figure 12. Boxplot of the specific gravity adjusted geometric means (µg/L) of all individual
maternal urine samples by week-day collection (1A) and week-end day collection (1B). Y-
axis log log base 10 scale.
Because no statistically significant difference was found between the samples
collected on a week-day and a week-end day, these two study visits were combined into one
visit (T1). There was no statistically significant difference between the geometric means
maternal urinary triclosan levels at any of the four study visits (F=1.01, p=0.52). Results are
reported in Figure 13.

68
Figure 13.Boxplot of the specific gravity adjusted geometric means (µg/L) of all individual
maternal urine samples by study visit. Y-axis log log base 10 scale.
5.2.3.2 Objective 3b: To evaluate the ability of a single spot urine sample to correctly
predict an individual’s level of exposure to triclosan.
Terciles (low, medium, and high exposure) were identified based on the distribution
of all individual specific-gravity adjusted geometric means from the T1A and T1B study
visits. Geometric means of 0µg/L to less than 11.49µg/L were classified as low exposure.
Those between 11.49µg/L and under 136.67µg/L fell into the medium exposure category.
Geometric mean triclosan levels of 136.67µg/L or greater were classified as high exposure.
The overall accuracy of a single spot sample collected in visit T1A or T1B to
correctly predict an individual’s overall exposure to triclosan was 86.7%. The prediction
accuracy was lower for women who had geometric mean triclosan levels in the medium
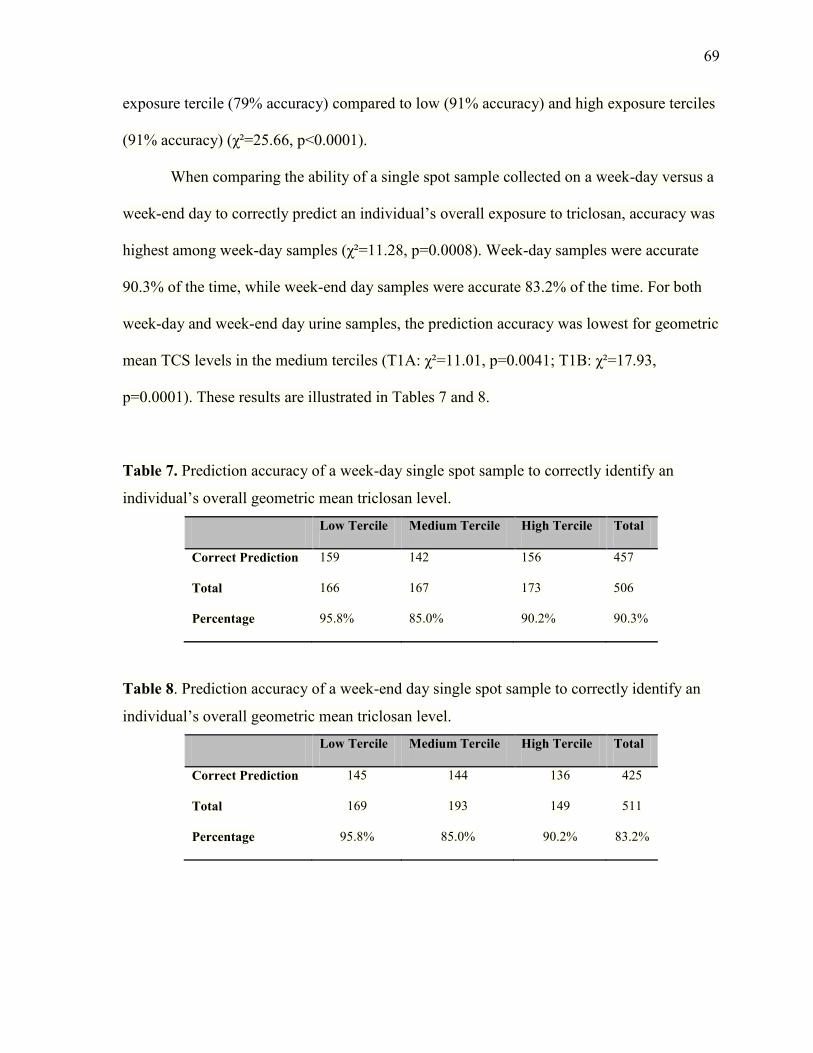
69
exposure tercile (79% accuracy) compared to low (91% accuracy) and high exposure terciles
(91% accuracy) (χ²=25.66, p<0.0001).
When comparing the ability of a single spot sample collected on a week-day versus a
week-end day to correctly predict an individual’s overall exposure to triclosan, accuracy was
highest among week-day samples (χ²=11.28, p=0.0008). Week-day samples were accurate
90.3% of the time, while week-end day samples were accurate 83.2% of the time. For both
week-day and week-end day urine samples, the prediction accuracy was lowest for geometric
mean TCS levels in the medium terciles (T1A: χ²=11.01, p=0.0041; T1B: χ²=17.93,
p=0.0001). These results are illustrated in Tables 7 and 8.
Table 7. Prediction accuracy of a week-day single spot sample to correctly identify an
individual’s overall geometric mean triclosan level.
Low Tercile Medium Tercile High Tercile Total
Correct Prediction 159 142 156 457
Total 166 167 173 506
Percentage 95.8% 85.0% 90.2% 90.3%
Table 8. Prediction accuracy of a week-end day single spot sample to correctly identify an
individual’s overall geometric mean triclosan level.
Low Tercile Medium Tercile High Tercile Total
Correct Prediction 145 144 136 425
Total 169 193 149 511
Percentage 95.8% 85.0% 90.2% 83.2%

70
Prediction of overall geometric mean triclosan levels was equally accurate among
urine samples provided at various time points throughout the day (χ²=2.51, p=0.28);
however, single spot samples collected between 09:00 and 15:59 were more accurate at
predicting high urinary triclosan levels (χ²=15.52, p=0.0004). Results are detailed in Table 9.
Table 9. Prediction accuracy of high urinary triclosan levels by time of day of urine sample
collection.
00:00-08:59 09:00-15:59 16:00-23:59 Total
Correct Prediction 59 135 98 292
Total 67 138 117 322
Percentage 88.1% 97.8% 83.8% 90.7%
5.2.4 Objective 4: To determine the pattern of urinary triclosan concentrations in a 48-
hour time period following triclosan exposure.
There was a high amount of variability in the urinary triclosan levels following
exposure to a product containing triclosan. Individual profiles of study participants and the
average trend line are plotted in Figure 14. The resulting trend line demonstrated that time
should be modelled cubicly; however, due to the heterogeneity of the data and the limited
sample size, a parametric linear trend model was judged as an adequate model for the study
data.
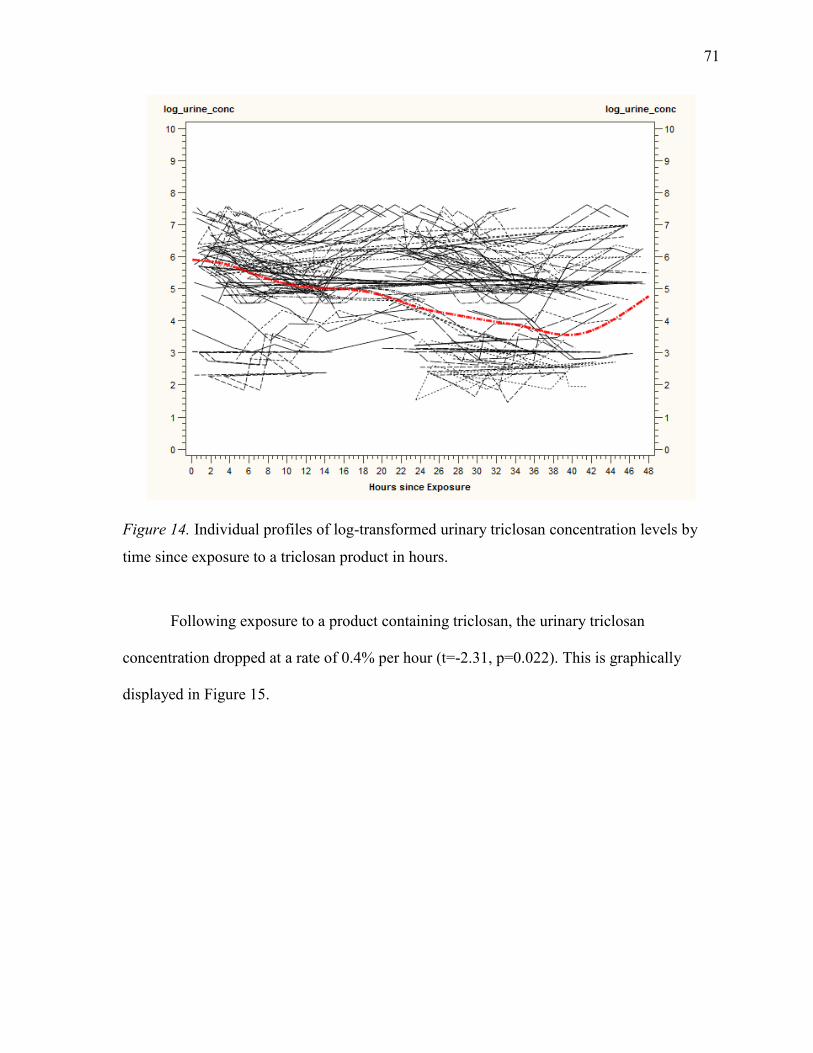
71
Figure 14. Individual profiles of log-transformed urinary triclosan concentration levels by
time since exposure to a triclosan product in hours.
Following exposure to a product containing triclosan, the urinary triclosan
concentration dropped at a rate of 0.4% per hour (t=-2.31, p=0.022). This is graphically
displayed in Figure 15.
72
Figure 15. Parametric linear trend model of log-urinary triclosan concentration by time since
exposure to a triclosan product across a 48-hour time period.
5.3 SUMMARY OF FINDINGS
The study sample included 80 pregnant women, with an average maternal age of 32.8
years (standard deviation=4.70).
There were a total of 6031 recorded products used across pregnancy; hand
soaps/sanitizers (15.0%) and lotions/creams (14.5%) were most frequently used by the study
participants (Figure 5). Of the 6031 total product uses, 266 (4.41%) contained triclosan
(Figure 6). Those products containing triclosan were primary oral care products (46.6%) and
hand soaps/sanitizers (42.4%) (Figure 7).
Linear mixed effects modeling identified that time of day, season of urine sampling,
and parity were significant predictors of urinary triclosan levels (Table 5). Specifically, the
geometric means of urine samples provided between 16:00 and 23:59 were significantly
lower than those provided from 00:00 to 08:00 or from 09:00 to 15:59. The geometric mean

73
of urine samples collected in autumn was 1.44 times higher than those collected in winter.
Women with no previous pregnancies had geometric mean urinary triclosan levels 6.04 times
greater than those with 2 or more previous pregnancies.
A total of 1247 urine samples were provided among study participants. Adjusting for
specific-gravity, 86.8% of these samples had detectable levels of triclosan. Triclosan was
detected in the urine of 51.25% of the pregnant women. The geometric mean specific-gravity
adjusted triclosan level of all the urine samples was 34.1µg/L (30.5-38.0) (Table 6). An intra-
class correlation coefficient of 0.24 indicated poor reproducibility among urine samples
collected across pregnancy (Figure 11). Geometric mean specific-gravity adjusted urinary
triclosan levels were not different between week-day and week-end day samples (χ²=0.0026,
p=0.96) (Figure 12), nor between samples collected at different study visits (F=1.01, p=0.52)
(Figure 13).
When using a single spot urine sample to predict an individual’s overall geometric
mean urinary triclosan level corresponding to low, medium, or high exposure, the overall
accuracy was 86.7%. Single spot urine samples had significantly lower accuracy when
predicting exposure into a medium exposure category (χ²=25.66, p<0.0001). Accuracy was
significantly higher among samples collected on a week-day when compared to those
collected on a week-end day (χ²=11.28, p=0.0008) (Table 7 and 8). When assessing the
accuracy of a single spot sample to predict geometric mean urinary triclosan levels
representing high exposure, samples collected between 09:00 and 15:59 (χ²=15.52,
p=0.0004) had significantly higher accuracy (Table 9).
Following exposure to a product containing triclosan, urinary triclosan levels
significantly decreased at a linear rate of 0.4% per hour (t=-2.31, p=0.022) (Figure 15).

74
CHAPTER 6: DISCUSSION
The present study provided the first Canadian data on personal care product use and
urinary maternal triclosan levels throughout pregnancy. The study findings indicated that
pregnant women were exposed to triclosan through numerous product sources; the detection
of maternal urinary triclosan levels persisted throughout the duration of the pregnancy as
well as postpartum.
6.1 EXPLANATIONS FOR THE STUDY FINDINGS
6.1.1 Sample characteristics
As the General Campus of the Ottawa Hospital is a tertiary care hospital, some of the
pool of potential participants from that site may have been high risk pregnancies; however,
low risk pregnancies were also seen at the General Campus. Other recruitment sites such as
the Harmony obstetrical clinic would also be less likely to recruit participants with high risk
pregnancies, thereby creating the most representative sample possible.
While attempts to recruit participants from all socio-economic strata were made, the
P4 study population was a highly educated sample; 45% had an Undergraduate University
Degree and 26% had a Masters or a Doctorate degree. For this reason, these women may
have had different personal care product use patterns or lifestyle changes throughout their
pregnancy compared to those with less education or income and the results of the study are
less generalizable.
A higher percentage of highly educated participants was also observed in several
other studies, including Braun and colleagues (2012) , who measured the temporal variability
of bisphenol A, (also a phenol like triclosan), in a United States pregnant population.

75
Woodruff and colleagues (2011) measured urinary triclosan levels in a United States general
population; 59% of their study population were in the highest categorized education category
(greater than high school diploma). In the study by Meeker and colleagues (2013) on Puerto
Rican pregnant women, 82% of the study population had a college degree, which underlies
the difficulties in obtaining a representative population of pregnant women across socio-
economic lines in longitudinal follow-up biomonitoring studies. The increased education
level of the P4 study participants could have resulted in a heightened awareness of
antimicrobials, leading to an active avoidance of specific antimicrobial products. Women
were not asked whether or not they were actively trying to avoid the use of antimicrobial
products. The 4.41% of products used containing triclosan may be an underestimation due to
the nature of the study population and the means of collecting the data. It is difficult to get
women to accurately and completely record all products used.
6.1.2 Personal care product use
All data collected in this study pertaining to product use information were self-
reported. The information collected was only as accurate as the information provided by the
study participants. Missing product use information was high for several reasons: 19 women
lost their “Product Use Booklet” throughout the duration of the study; information could not
be collected from participants with early outcomes or who were lost to follow up over the
year; “Food and Activity Diary” and “Product Use Booklet” information did not always
match up; insufficient product information such as brand name and/or manufacturer of the
product resulted in an inability to properly categorize the product. Overall, approximately
25% of all recorded product uses had insufficient information to properly identify whether or
not triclosan was an active ingredient in the product. More detailed product information was
expected among participants; the high number of insufficient information provided was

76
disappointing. The high percentage of products with insufficient information provided
provides evidence towards supporting the conclusion that the actual number of triclosan
products used may be greater than 5%. The only other previous study to date measuring
triclosan product use did not require participants to record product brand and manufacturer
information, in hopes of retaining power to test for associations (Meeker et al. 2013).
Although the P4 study did lose power by collecting this information, it is important
knowledge to understand the details of triclosan product sources that may be associated with
increased urinary triclosan levels.
The findings of this study indicated that 89% of all triclosan products used by the
pregnant women were “oral care” products or “hand soaps/sanitizers”. These findings are
slightly different from the only previous study to identify triclosan product uses. Meeker and
colleagues (2013) also identified “hand soaps/sanitizers” as a commonly used product
categories throughout their study population of Puerto Rican women; however, their research
study failed to include “oral care” as a category. Rather, they found a high number of “hair
care” product uses, due to the use of hairspray. The P4 study findings did not indicate any
association between “hair care” products and urinary triclosan levels. This difference in
study findings could be attributable to cultural differences between Canadian and Puerto
Rican women and the products available in the two countries.
It was hypothesized that pregnant women would be exposed to triclosan through
cosmetics, soaps, and toothpaste. Soaps and toothpaste were in fact common sources of
exposure. Despite the fact that cosmetics were a commonly used product, they were not
found to be a statistically significant product source of triclosan in this population.
There was a statistically significant positive correlation between urinary triclosan
concentration and triclosan product use. In a study of bisphenol A sublingual exposure by

77
Gayrard and colleagues (2013), sublingual absorption was higher than the gastro-intestinal
absorption from the oral dosing (Gayrard et al. 2013). “Oral care” products and “hand
soaps/sanitizers” were the most commonly used products containing triclosan among the
study population. Based on the high sublingual absorption rates of phenols, it is plausible
that an increased concentration of urinary triclosan levels could be observed in this study
population due to the “oral care” products. However, the geometric mean of specific gravity
adjusted triclosan levels was no different between the “oral care” (79.92 µg/L (95% CI
59.29-107.73)) and the “hand soaps/sanitizer” (80.73 µg/L (95% CI 63.37-102.85)) groups.
6.1.3 Covariate associations with urinary triclosan levels
The P4 Study findings indicated that triclosan levels were significantly lower among
samples collected between 16:00 and 23:59. This is consistent with previous literature on the
temporal variability of phenols reporting the lowest phenol levels after 16:00 (Mahalingaiah
et al. 2008), and confirm the hypothesis that time of day of sample collection would predict
urinary triclosan levels.
Triclosan levels were significantly higher among urine samples collected in autumn
when compared to those collected in winter. This could be the result of product use
differences between the two seasons. With the colder winter weather, it is possible that the
women did not leave the house as much, and therefore did not use as many products
containing triclosan. Although no statistically significant differences were observed between
urine samples collected in autumn and those collected in spring or summer, it is possible that
the small sample size of this study did not produce enough power to detect these differences.
Overall, parity was a significant predictor of urinary triclosan levels. Pairwise
comparisons concluded that triclosan levels in women with no previous pregnancies were
significantly higher than samples collected from women with two of more previous
78
pregnancies. This could be due to the fact that they had less time to devote to personal care
product use because of the need to care for their children. Again, with a larger sample size, a
difference in triclosan levels between women with no previous pregnancies and those with 1
previous pregnancy may have been observed.
Education and combined household income were not statistically significant
predictors of urinary triclosan levels in any of the three models. This is in contrast with
previous studies which have reported differing conclusions regarding associations between
education and household income on urinary triclosan levels. Specifically, an inverse
relationship was noted between education level and phenol concentration (Wolff et al. 2008),
while a positive association (Ye et al. 2008) and an inverse association (Kim et al. 2011)
were reported between household income and phenol concentration. Inconsistent results have
also been reported on maternal age; the results of the P4 Study did not confirm any of these
associations; however, it is possible that with a larger sample size, an association may have
been observed.
Model 1, which did not include specific gravity at all in the model, reported that total
volume and time since last void were statistically significant predictors of the urinary
triclosan levels. Total volume and time since last void were not statistically significant in
Model 2 or Model 3, which included it as a covariate and adjusted for specific gravity in the
dependent variable, respectively. This could indicate that total volume and time since last
void are less important to control for if the specific gravity measurement is known.
6.1.4 Urinary metabolite levels
Missed urine samples were also reflected in the number of urine samples provided
by participants across pregnancy; the minimum number of samples provided was 4, which is
highly unlikely given the serial urine sample collection periods in early pregnancy. Study

79
nurses reminded participants about each upcoming study visit; however, many samples were
still unrecorded despite these reminders.
Despite the fact that 49.75% of the study sample did not have any detectable levels of
triclosan in their urine samples, 86.8% of all the urine samples still contained levels of
triclosan greater than the limit of detection (3.0µg/L). This demonstrates that the women
with detectable levels of triclosan contributed an overall larger number of urine samples than
those with triclosan levels consistently below the limit of detection.
Usually laboratories do not release biomonitoring data below the limit of detection
(LOD). The LOD is the lowest quantity of a substance that can be distinguished from the
absence of that substance (a blank value) within a stated confidence limit (McNaught and
Wilkinson 1997). In this study, the laboratory was asked to report urinary triclosan levels
regardless of their relation to the limit of detection. As a result, measurements between 0 and
3.0µg/L were reported, thereby reducing potential biases that can be affected by using a
constant such as one-half the limit of detection.
The unadjusted maternal urinary triclosan concentrations reported in this study were
nearly twice as high as many previously reported levels. The observed geometric mean
urinary triclosan levels among P4 Study participants was 32.1µg/L (28.7-36.1), which was
twice as high as levels found in two previous Canadian studies. The 2013 Canadian Health
Measures Survey data reported a geometric mean of only 16.0µg/L (Health Canada 2013b)
while the 2012 report published provided by Environmental Defence reported an arithmetic
mean of 15.48µg/L (Environmental Defence 2012). It is important to note that the Canadian
Health Measures Survey samples were also analysed by the same Quebec laboratory using
the same methods as in the P4 Study. In two studies of United States pregnant populations,
geometric mean urinary triclosan levels were 17.00µg/L and 13.0µg/L, respectively (Calafat

80
et al. 2008; Woodruff et al. 2011). The difference between the P4 Study findings and those of
the United States studies could be attributable to a difference in product availability of
certain triclosan products between the two countries; however, the urine samples for these
studies were collected between 2003 and 2004, 6 to 7 years prior to that of the P4 Study
(2009 to 2010 collection period). The urine samples collected from the Canadian Health
Measures Survey were collected between 2009 and 2011, which is a comparable collection
time period to that of the P4 Study. Further Canadian research is required to confirm these
elevated urinary triclosan measurements in pregnant women and then attempt to understand
why they might be higher in this population.
Although differences were observed between the P4 Study findings and those of
previous studies, the most recently published study on maternal urinary triclosan levels by
Meeker and colleagues (2013) reported a geometric mean urinary triclosan level of 29.9
(23.6-37.9), which is very comparable to the results of the P4 Study. The similarities in
geometric mean urinary triclosan levels could be attributable to a similar urine collection
schedule between the two studies. Urine samples were collected at multiple times across
pregnancy, rather than once in the third trimester, as was done in previous studies (Calafat et
al. 2008; Woodruff et al. 2011).
The calculation performed for the 95% confidence intervals of urinary triclosan level
percentiles in the P4 Study assumed that the data are normally distributed. The urinary
triclosan levels were not normally distributed, as was reflected by the log transformation of
the data for the linear mixed effect models. In order to account for this, the geometric mean
and median were reported in Table 6.
The P4 Study data reported some extreme urinary triclosan measurements, including
a maximum unadjusted urinary triclosan measurement of 3229.3µg/L. Qualitative

81
employment information on selected participants recording extreme urinary triclosan
measurements does not show a distinct pattern; however, approximately two-thirds of
participants reporting outlying levels worked in a government office or in a hospital (Table
10). These participants did not report repeated outlying urinary triclosan levels throughout
the study. Therefore, factors leading to these high outliers remain unknown. It is unlikely that
these results are due to lab error, as extreme urinary triclosan measurements of 2000µg/L
(Meeker et al., 2013), 3157.7µg/L (Kim et al., 2011) and >6000µg/L (Tye Arbuckle,
unpublished data, 2013) have also been reported in urinary triclosan studies of pregnant
populations.
Table 10. Qualitative data on occupation of nine P4 study participants who recorded high
outlier urinary triclosan levels.
Unadjusted urinary TCS (µg/L) Occupation
3229.26 Government
2803.41 Government
2629.95 Construction Engineer
2550.73 Physician
2528.34 Unemployed
2216.43 Esthetician
2136.98 Unemployed
2037.88 Government
1269.23 Registered Nurse

82
The intra-class correlation coefficient of the samples collected throughout the course
of the P4 Study was 0.24, which indicated poor reproducibility among samples collected at
different time points across pregnancy. This result showed a lower level of reproducibility
than that of Meeker and colleagues (2013), who reported a specific-gravity adjusted intra-
class correlation coefficient of 0.47 among single spot urine samples collected 3 times during
gestation. The lower ICC reported in the P4 Study could have been a result of the high level
of variability in the data. In addition to measuring urinary triclosan levels across pregnancy,
the P4 Study also collected serial urine samples on both a week-day and a week-end day
during the first 20 weeks of pregnancy. Thus, it was possible to conclude that the urinary
triclosan levels were no different between samples collected on a week-day versus those
collected on a week-end day.
Urinary triclosan levels were lower from 16:00-23:59 when compared to 00:00-08:59
and to 09:00-15:59. It is possible that this difference is related to the timing of triclosan
product use. Table 11a indicates the percentage of product use by the time of day categories
used in the linear mixed effects model analysis, while Table 11b further breaks down the
time of day in order to obtain increased detail pertaining to the timing of the triclosan
product use among study participants.
Table 11a. Triclosan product uses by time of day (3 categories).
Time of Day N Percentage
00:00-08:59 39 14.7%
09:00-14:59
15:00-23:59
Missing
127
97
3
47.7%
36.5%
1.1%

83
Table 11b. Triclosan product uses by time of day (6 categories).
Time of Day N Percentage
00:00-03:59 21 7.9%
04:00-07:59 18 6.8%
08:00-11:59 25 9.4%
12:00-15:59 102 38.3%
16:00-19:59 68 25.6%
20:00-23:59
Missing
29
3
10.9%
1.1%
Approximately 85% of all triclosan product uses occurred between 09:00 and 23:59.
Specifically, 63.9% of all recorded products used were between 12:00 and 19:59. These
results indicate that triclosan product exposure is less common through products used in the
morning; rather, product use throughout the day and early evening is more common. As the
urinary half-life of triclosan is suggested to be approximately 11 hours, the low urinary
triclosan levels from 15:59-23:59 could be a reflection of the low percentage of triclosan
product use in the early morning. These findings confirm the hypothesis that differences in
the timing of product exposure result in individual differences in urinary triclosan levels.
6.1.5 Predictive ability of single spot samples
The serial urine sample collection also allowed for calculation of the predictive
ability of single spot samples collected at various time points throughout a day, as well as on
a week-day and on a week-end day. Although collecting serial urine samples at each study

84
visit could increase the precision and power of the results, it remains cost-effective to limit
the number of serial urine samples collected in a study. Based on the findings of the P4
Study that there was no statistically significant difference in the geometric mean urinary
triclosan levels across the study visits, the results obtained from the serial urine samples can
be extrapolated to the subsequent study visits. Future research could collect serial urine
samples in the second or third trimester and compare the results of a surrogate category
analysis with the early pregnancy results from the P4 Study.
The surrogate category analysis indicated that the accuracy of single spot urine
samples was lower when identifying individuals with moderate urinary metabolite levels.
From a risk assessment perspective, it is most important to identify individuals with high
levels of urinary triclosan. Single spot urine samples consistently predicted high metabolite
levels more than 90% of the time, which is consistent with the hypothesis stating that a single
spot sample would be a reliable indicator of an individual’s average exposure.
Increased precision of the prediction ability of a single spot sample could have been
achieved if the time of day had been categorized into more than three categories. Due to the
small sample size in this study, the number of urine samples per cell became insufficient as
the 24-day was broken down into a greater number of categories.
6.1.6 Parametric linear trend model
Although the parametric linear trend model possessed the ability to identify the rate
of linear decrease of urinary triclosan concentrations following exposure to a triclosan
product, it remains hypothetical. An assumption of this model was that an individual had
only one exposure to triclosan within a 48-hour time period. A future model should be
developed that accounts for the multiple exposures to triclosan within a 48-hour time period.

85
Another possible way to model the trend of urinary triclosan concentration following
exposure to triclosan would be through the use of a spline model. This model would allow
for the 48-hour period to be broken down into smaller time periods; the pattern of triclosan
would be modelled within each of these. Due to the small sample size, there was a large
amount of variability in the P4 Study data. This variability could be due to the route of
exposure, the concentration of triclosan in the product, and the ease of exposure to triclosan
upon use of a triclosan containing product. As a result, the selection of the number and
location of the knots corresponding to the multiple time periods was highly influential on the
outcome of the model. For this reason, it was not possible to determine an optimal location
and number of knots, and the parametric linear trend model was the chosen model.
Because of the selection of a parametric linear trend model, it was not possible to
confirm the hypothesis predicting the pattern of urinary triclosan levels following exposure
to a product containing triclosan. In a previous paper by Meeker et al. (2012) on urinary
phthalate metabolites, the timing since last exposure was said to be an important contributor
to the phthalate concentrations (Meeker et al. 2012). Future research is required to determine
the pattern of urinary triclosan levels following exposure to assess the relationship.
6.2 LIMITATIONS
The repeated measures and longitudinal nature of this study design was susceptible to
many limitations, particularly through the selection of subjects, as well as the self-reporting
of activity and product use information.
Loss to follow-up:
Loss to follow-up or participant drop out was a limitation of this longitudinal study
design. Throughout the study period, participants may have relocated, changed their contact

86
information or chosen not to continue with the study for various reasons. To address this
limitation, a power calculation was performed to identify the minimum number of
participants required to obtain the desired level of power for the study analyses and
additional women were recruited to compensate for potential loss to follow-up.
Power:
The proposed sample size of 80 women was sufficient to estimate the variability
within each individual with an error of less than 0.06 (power=0.80). However, the sample
size proved to not be large enough to detect many statistically significant differences.
Because of small and sometimes zero cell counts (for example, in the time of day of urine
sampling variable) it was not possible to categorize certain variables into a larger number of
categories. A larger sample size would have increased precision of the reported results and
could have resulted in additional power to support the study findings.
Convenience sample:
The sample for the P4 Study was a convenience sample. Given that only
approximately 20% of all women in the sampling frame were approached to take part in the
study, this largely influences the generalizability of the study results. Women who were
informed of P4 Study were only those who attended their ultrasound within the specified
eligible gestation time, were those with high-risk pregnancies, or were those who visited the
hospital at a time when a study researcher was working. Only two researchers were
responsible for recruitment; each one was responsible for balancing the P4 Study recruitment
with their full-time jobs. This resulted in convenience sampling, and many potentially
eligible and interested participants never being invited to participate.
Selection bias:

87
Selection bias occurred in the study. Study participants were informed prior to
enrolling in the study that one of the measured study chemicals was an antimicrobial. It is
possible that the women who volunteered to enroll in the study were more knowledgeable
and interested in this topic and consequently used less products containing triclosan, an
antimicrobial agent. Another possibility is that the women who volunteered to participate in
this research study may have had lifestyles that allowed time for record keeping and urine
collections throughout the duration of the study. This may have led to biased results; reported
triclosan product use may have been under-reported due to the associated selection bias.
However, the higher geometric mean urinary triclosan concentrations would argue against
less use of antimicrobial products containing triclosan.
Although it was not possible to overcome this limitation, controlling for covariates in
the study limited the extent of selection bias on the study population. While the study results
are not generalizable to the Canadian population, this should not have affected the internal
validity of the study.
Interviewer bias:
Interviewer bias may occur if the interviewer tends to reveal more study information
or selectively recruit a certain group of individuals. Use of a standardized data collection
form was used to minimize interviewer bias.
Missing data/Recall bias:
Studies requiring participants to self-report data are more likely to encounter missing
data for various reasons. It would have been easy for study participants to not prioritize the
study diary and booklet completion. As a result, when they would have remembered to fill in
their activities and product use information, certain activities, products, and details may have
been forgotten.
88
Self-completion of questionnaires is also very time-consuming. For this reason, the
degree of detail in the thoroughness of completion of diaries and booklets may have highly
differed between participants.
Another reason for missing data is simply no reporting at all due to the loss of
questionnaire material by the study participant. The repeated visits of this study were a way
to remind participants about their diary completion; however, the final self-reported data was
only as accurate as the information that was provided by the study participants regardless of
the efforts undertaken to increase reporting.

89
CHAPTER 7: SUMMARY CONCLUSION
This study set out to address the existing knowledge gaps pertaining to urinary
triclosan data in Canadian pregnant women. It was the first of its kind to provide Canadian
data on personal care product use and urinary maternal triclosan levels within a day, a week-
day and week-end day, and throughout pregnancy. It also was the first to provide information
on the predictive ability of a single spot urine sample in pregnancy and to develop a linear
trend model to represent the urinary triclosan concentration following exposure to a product
containing triclosan. Given that the study sample is poorly representative of the Ottawa or
Canadian population, the study results are not generalizable; however, they provide
important information towards understanding sources of exposure to triclosan and towards
characterizing the nature of the exposure risk, if any, associated with triclosan.
The findings indicate that the urinary triclosan levels of our study sample of pregnant
women are consistent across pregnancy; levels are lowest between 16:00 and 23:59. Single
spot urine samples accurately predict an individual’s overall exposure 87% of the time;
accuracy is highest among single spot urine samples collected between 09:00 and 16:00. The
study participants are primarily exposed to triclosan through the use of “oral care” products
and “hand soaps/sanitizers” containing triclosan. There is a positive association between
triclosan product use and urinary triclosan levels. Following exposure to a product containing
triclosan, there is a statistically significant linear decrease in urinary triclosan levels at a rate
of 0.004µg/L per hour. Highly educated pregnant women may also be more highly exposed
to triclosan than the general population, given the results of our study.
The results of this study can provide important information to policy makers,
researchers and consumers. Policy makers and researchers can use this knowledge for future
risk assessment and risk management. On a different level, it is important for consumers to

90
understand sources of exposure to triclosan and the basic pharmacokinetics of urinary
excretion of triclosan in order to make personal choices regarding purchase of personal care
products. The knowledge of current exposure levels and the identification of triclosan
product sources associated with these levels can also assist with population-specific exposure
assessment strategies in Canadian populations, as well as to ongoing assessment studies
worldwide.
Additional studies are required to further examine the associations between specific
covariates and urinary triclosan levels, which could direct the focus of educational awareness
of antimicrobial agents. Expansion on the model of urinary triclosan levels following
multiple exposures to triclosan is required. Further studies can replicate the methods of this
study design and analysis to test hypotheses in different sub-populations.
Clearly the information on current Canadian maternal triclosan levels, sources of
exposure, and the predictive ability of single spot urine sampling, as well as the basic
pharmacokinetics of triclosan in combination with other knowledge is of great value for
policy makers, consumers, risk assessors, and health care providers, among others. The
information provided from this study can be readily used to further direct exposure controls
and risk management procedures.

91
APPENDIX A – ENVIRONMENTAL DEFENCE REPORT
ENVIRONMENTAL DEFENCE REPORT, MAY 16TH
2012
May 16 2012
Canada NewsWire
First-of-kind data find toxic chemical widespread in Canadian adults
TORONTO, May 16, 2012 /CNW/ - The first data on levels of the chemical triclosan were
released today to reveal widespread body pollution in Canadian adults. Seven of eight people
tested had the antibacterial chemical in their bodies-with levels higher than those toxic to fish
and algae.
Environmental Defence, which conducted the test, says the high prevalence of the chemical
means it's time to ban it from household use. This backs up an earlier call from Canadian
Medical Association, due to fears its widespread use contributes to antibiotic-resistant
"superbugs."
Triclosan is an anti-bacterial chemical originally used in medical settings. But now it is
found in hundreds of products, including hand sanitizers, toothpaste, household items,
makeup and even smartphone cases. This is worrisome given it is also a known endocrine
disruptor-interfering with the human body's natural hormones. Many endocrine disruptors
have been linked to thyroid problems and cancer.
The Environmental Defence report The Trouble with Triclosan can be downloaded at
www.environmentaldefence.ca/troublewithtriclosan
"Mounting evidence has convinced doctors and scientists that this chemical is, in fact,
harmful and should be banned from household use," said Dr.Rick Smith, executive director
of Environmental Defence and co-author of the bestselling book on toxic products, Slow
Death by Rubber Duck. "Today's data show how widespread the chemical is in our bodies.
So consumers should do what they can to avoid products that contain it. Because the danger
with triclosan isn't just the level of exposure, it's also the length of time someone is exposed."
“Environmental Defence believes that a ban on the household use of triclosan is good for
human health and our environment. We congratulate the federal government on its first steps
in dealing with the chemical, and look forward to the next ones," he said.
On March 30, Health Canada and Environment Canada published a preliminary assessment
of triclosan on the Chemical Substances website, commencing a 60-day public comment
period. The assessment declared that found it can cause harm to the environment.
Environmental Defence has long called for better controls on toxic chemicals such as
triclosan, and has successfully advocated to ban BPA in baby bottles and phthalates in toys.
Now it's turning its attention to triclosan, which contaminates the environment as it is
washed down drains to pollute rivers and lakes. It is toxic to fish, amphibians and rats, where

92
it mimics thyroid hormones. This raises questions about its harm to human health. In
addition, when it breaks down, it can produce the human carcinogens chloroform, and
dioxins, one of the most toxic groups of substances known.
"Every time we wash our hands or brush our teeth with triclosan, more of this hormone-
disrupting chemical goes down the drain. That's bad news for people and bad news for the
environment and why it's time for a household ban," said Smith.
About Environmental Defence (www.environmentaldefence.ca): Environmental Defence is
Canada's most effective environmental action organization. We challenge, and inspire
change in government, business and people to ensure a greener, healthier and prosperous life
for all.

93
APPENDIX B – BIOSPECIMEN TRACKING LOGS

94

95

96

97

98

99
APPENDIX C – STUDY RECRUITMENT POSTER

100

101
APPENDIX D – INFORMED CONSENT
Plastics and Personal-care Product use in Pregnancy: The P4
Study
Consent Form
I have read this six-page Patient Information and Consent Form and I have had the opportunity to ask
the study investigator or research nurse coordinator any questions I may have had about the study.
My questions and/or concerns have been answered to my satisfaction and I agree to participate in this
study. If I decide at a later time in the study that I would like to withdraw, I may do so at any time
and my withdrawal will not affect the quality of care I receive now and in the future at The Ottawa
Hospital.
A copy of this Information and Consent Form will be provided to me.
Unless I have provided specific consent or where the law requires or a court order has been obtained,
my results will not be communicated to any third parties such as my employers, governmental
organizations or insurance companies. This includes my spouse or other members of my family. Any
results of tests performed in this study will not be communicated to my health care provider nor will
they appear in my medical record.
If I wish to withdraw from the study or remove my coded data and coded biological specimens, I
must contact Dr. Mark Walker at The Ottawa Hospital or a member of his research team and request
that my data and specimens be destroyed.
I hereby consent to participate and to have any leftover samples stored for future research
directly related to environmental contaminants.
_____________________ _________________ _________
Name of Participant Signature Date
________________
Telephone number
_____________________ __________________ __________
Investigator/Delegate Signature Date

102
APPENDIX E – PARTICIPANT ELIGIBILITY SCREENING
INCLUSION CRITERIA: If the woman answers yes to ALL of the inclusion criteria questions she may be eligible for the study. Yes No 1. Singleton and viable fetus 2. The woman is at least 6 0/7 weeks pregnant and is able to complete the T1 urine collections
(week-day and week-end multiple samples) before 196 weeks. NOTE: if early ultrasound and LMP
dates are discordant ≤ 7 days, base GA estimate on LMP dates, if discordant > 7 days base on ultrasound.
3. Age ≥ 18 years 4. Speaks French or English 5. Plans to deliver in the city of Ottawa, including all Ottawa hospitals or home births 6. The woman is able to understand and sign a consent form. EXCLUSION CRITERIA: If the woman answers YES to ANY of the exclusion criteria below she is NOT eligible for the study. Yes No 1. Known major fetal abnormalities, including chromosomal anomalies 2. Has one of the following conditions
2.1 Renal disease with altered renal function (creatinine ≥ 2 times the upper limit of normal range
value) 2.2 Any collagen vascular disease (including lupus erythematosus, scleroderma) 2.3. Active or chronic hepatitis 2.4 Epilepsy 2.5 Heart disease 2.6 Serious pulmonary disease (COPD) 2.7 Cancer 2.8 Haematologic disorder
2.9 Threatened abortion 2.10 Thyroid disorder; including treated hypothyroidism 2.11 Chronic hypertension (diagnosed prior to pregnancy) 2.12 Diabetes (do not exclude if participant develops gestational diabetes after recruitment) 2.13 Current Illicit Drug use

103
APPENDIX F – DATA AND MATERNAL COLLECTION SCHEDULES
I. Data Collection Schedule
Sample
Pregnancy Post Delivery
1st trimester
(6 – 19 wks)
2nd
trimester
(24-28 wks)
3rd
trimester (32-36 wks)
PP* Day 1-3 2 -3 months
PP
T1a T1b T2 T3 T4 T5
Questionnaire ● ● ● ●
Journal ● ● ● ● ●
Maternal Urine ● ● ● ● ●
Medical Chart ● ● ● ●
Meconium ●
Infant Urine** ● ●
Breastmilk ●
Formula ●
Personal and indoor air samples
● ● ●
*PP=postpartum **samples collected up to 1 month postpartum
II. Maternal Urine Collection
Sample Collection
1st trimester
(6 – 19 wks) 2
nd trimester
(24-28 wks) 3
rd trimester
(32-36 wks) 2–3 mo PP
T1a T1b T2 T3 T5
Day of the week
week-day
week-end
Either
Either
Either
Approx. # of samples
8 8 1 1 1
Type of sample
Multiple samples throughout a 24 hr period.
Multiple samples throughout a 24 hr period.
One spot urine sample
One spot urine sample
One spot urine sample

104
APPENDIX G – FOOD AND ACTIVITY DIARIES/PRODUCT USE BOOKLETS

105

106

107

108
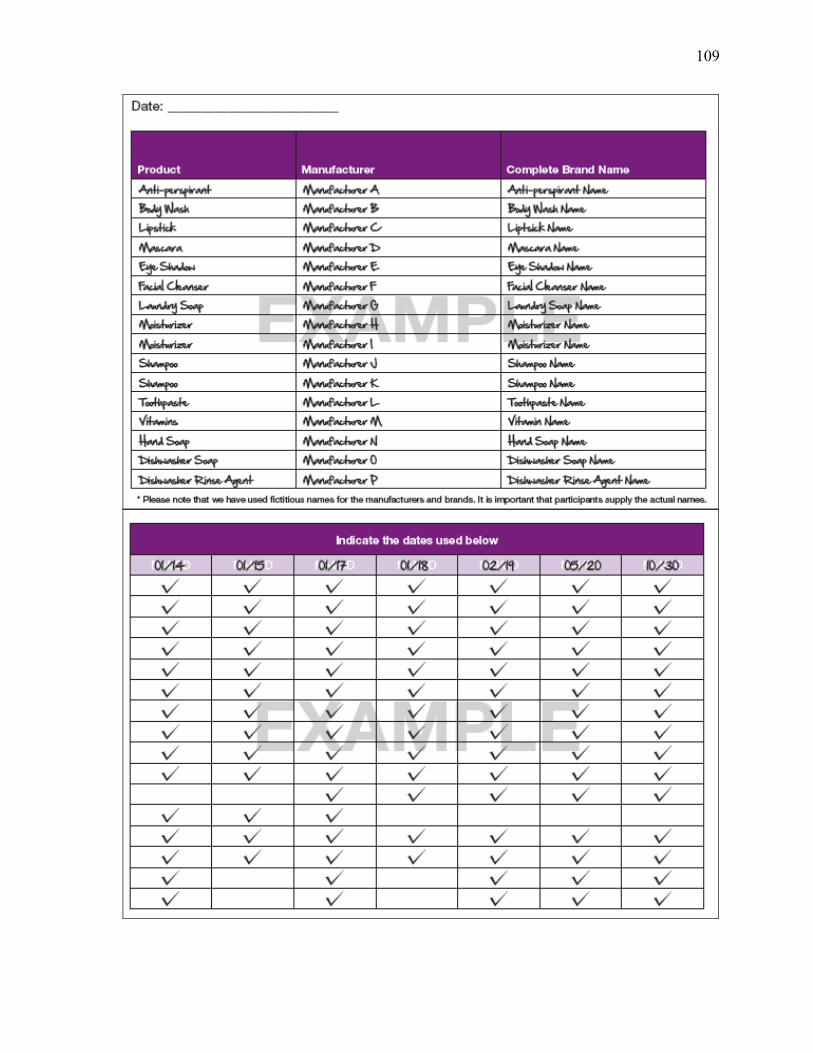
109

110
APPENDIX H – PERTINENT DATABASE COMPONENTS
Questionnaires (T1a, T2, T3, T5)
Chart review (T4)
Journals (T1a, T1b, T2, T3, T5)
Product Use Booklet
Biospecimen Tracking Logs (date and time of sample, specific gravity)
Specimen Results from INSPQ (Environmental Chemical results)
o Maternal Urine (T1a, T1b, T2, T3, T5)
o Infant Urine (T4, T5)*
o Meconium (T4)*
o Breastmilk and or Formula (T5)*
o Air monitoring (T1a, T1b, T5)*
*This matrix is not pertinent for the purpose of the analysis of P4 triclosan data for this
thesis; however, it was included in the overall P4 database.

111
BIBLIOGRAPHY
Abt, Eileen, Joseph V Rodricks, Jonathan I Levy, Lauren Zeise, and Thomas a Burke. 2010.
“Science and decisions: advancing risk assessment.” Risk analysis : an official
publication of the Society for Risk Analysis 30(7): 1028–36.
http://www.ncbi.nlm.nih.gov/pubmed/20497395 (May 21, 2013).
Adibi, Jennifer J, Robin M Whyatt, Paige L Williams, Antonia M Calafat, David Camann,
Robert Herrick, Heather Nelson, Hari K Bhat, Frederica P Perera, Manori J Silva, and
Russ Hauser. 2008. “Characterization of phthalate exposure among pregnant women
assessed by repeat air and urine samples.” Environmental health perspectives 116(4):
467–73.
http://www.pubmedcentral.nih.gov/articlerender.fcgi?artid=2291011&tool=pmcentrez&
rendertype=abstract (May 22, 2013).
Agency for Toxic Substances and Disease Registry. 2002. Toxicological Profile: Di(2-
Ethylhexyl)Phthalate. Atlanta, Georgia.
Alliance for the Prudent Use of Antibiotics. 2011. “Triclosan: White Paper.” (January): 1–
18.
Arbuckle, Tye E. 2010. “Maternal-infant biomonitoring of environmental chemicals: the
epidemiologic challenges.” Birth defects research. Part A, Clinical and molecular
teratology 88(10): 931–7. http://www.ncbi.nlm.nih.gov/pubmed/20706992 (May 21,
2013).
Arnold, Scott M, Juergen Angerer, Peter J Boogaard, Michael F Hughes, Raegan B O’Lone,
Steven H Robison, and a Robert Schnatter. 2013. “The use of biomonitoring data in
exposure and human health risk assessment: benzene case study.” Critical reviews in
toxicology 43(2): 119–53.
http://www.pubmedcentral.nih.gov/articlerender.fcgi?artid=3585443&tool=pmcentrez&
rendertype=abstract (May 22, 2013).
“ATAGO.” http://www.atago.net/english/products_clinical.php (July 8, 2013).
Balmer, Marianne E, Thomas Poiger, Christian Droz, Kathrin Romanin, Per-Anders
Bergqvist, Markus D Müller, and Hans-Rudolf Buser. 2004. “Occurrence of methyl
triclosan, a transformation product of the bactericide triclosan, in fish from various
lakes in Switzerland.” Environmental science & technology 38(2): 390–5.
http://www.ncbi.nlm.nih.gov/pubmed/14750712.
Barr, D, K Thomas, B Curwin, D Landsittel, J Raymer, C Lu, K Donnelly, and J Acquavella.
2006. “Biomonitoring of Exposure in Farmworker Studies.” Environmental Health
Perspectives 936(6): 936–943.

112
Barr, D, L Wilder, S Caudill, A Gonzalez, L Needham, and J Pirkle. 2005. “Urinary
Creatinine Concentrations in the U.S. Population: Implications for Urinary Biologic
Monitoring Measurements.” Environmental Health Perspectives 113(2): 192–200.
Bennett, Erin R, Peter S Ross, David Huff, Mehran Alaee, and Robert J Letcher. 2009.
“Chlorinated and brominated organic contaminants and metabolites in the plasma and
diet of a captive killer whale (Orcinus orca).” Marine pollution bulletin 58(7): 1078–83.
http://www.ncbi.nlm.nih.gov/pubmed/19486998 (May 27, 2013).
Van den Berg, Martin, Linda S Birnbaum, Michael Denison, Mike De Vito, William Farland,
Mark Feeley, Heidelore Fiedler, Helen Hakansson, Annika Hanberg, Laurie Haws,
Martin Rose, Stephen Safe, Dieter Schrenk, Chiharu Tohyama, Angelika Tritscher,
Jouko Tuomisto, Mats Tysklind, Nigel Walker, and Richard E Peterson. 2006. “The
2005 World Health Organization reevaluation of human and Mammalian toxic
equivalency factors for dioxins and dioxin-like compounds.” Toxicological sciences :
an official journal of the Society of Toxicology 93(2): 223–41.
http://www.pubmedcentral.nih.gov/articlerender.fcgi?artid=2290740&tool=pmcentrez&
rendertype=abstract (May 22, 2013).
Berlin, A, L Alessio, G Sesana, A Dell’Orto, and I Ghezzi. 1985. “Problems concerning the
usefulness of adjustment of urinary cadmium for creatinine and specific gravity.”
International archives of occupational and environmental health 55(2): 107–11.
http://www.ncbi.nlm.nih.gov/pubmed/3988354.
Boeniger, MF, LK Lowry, and J Rosenberg. 1993. “Interpretation of urine results used to
assess chemical exposure with emphasis on creatinine adjustments: a review.” American
Industrial Hygiene Association journal 54(10): 615–627.
Braun, Joe M, Kristen W Smith, Paige L Williams, Antonia M Calafat, Katharine Berry, and
Shelley Ehrlich. 2012. “Variability of Urinary Phthalate Metabolite and Bisphenol A
Concentrations before and during Pregnancy.” Environmental health perspectives
120(5): 739–746.
Calafat, Antonia, Xiaoyun Ye, Lee-Yang Wong, John Reidy, and Larry Needham. 2008.
“Urinary concentrations of triclosan in the U.S. population: 2003-2004.” Environmental
health perspectives 116(3): 303–7.
http://www.pubmedcentral.nih.gov/articlerender.fcgi?artid=2265044&tool=pmcentrez&
rendertype=abstract (May 21, 2013).
California Department of Public Health. 2013. “Biomonitoring.” California Environmental
Health Tracking Program. http://www.ehib.org/page.jsp?page_key=44 (June 13, 2013).
Canadian Environmental Protection Act. 2000. “Persistence and Bioaccumulation
Regulations.” Canada Gazette 134(7).
http://canadagazette.gc.ca/archives/p2/2000/2000-03-29/html/sor-dors107-eng.html.

113
Casas, Lidia, Mariana F Fernández, Sabrina Llop, Mònica Guxens, Ferran Ballester, Nicolás
Olea, Mikel Basterrechea Irurzun, Loreto Santa Marina Rodríguez, Isolina Riaño,
Adonina Tardón, Martine Vrijheid, Antonia M Calafat, and Jordi Sunyer. 2011.
“Urinary concentrations of phthalates and phenols in a population of Spanish pregnant
women and children.” Environment international 37(5): 858–66.
http://www.ncbi.nlm.nih.gov/pubmed/21440302 (May 21, 2013).
Centers for Disease Control and Prevention. 2011. Pediatric and Pregnancy Nutrition
Surveillance System PNSS Health Indicators.
http://www.cdc.gov/pednss/what_is/pnss_health_indicators.htm (May 27, 2013).
Chen, Jiangang, Ki Chang Ahn, Nancy a Gee, Shirley J Gee, Bruce D Hammock, and Bill L
Lasley. 2007. “Antiandrogenic properties of parabens and other phenolic containing
small molecules in personal care products.” Toxicology and applied pharmacology
221(3): 278–84.
http://www.pubmedcentral.nih.gov/articlerender.fcgi?artid=1978490&tool=pmcentrez&
rendertype=abstract (May 22, 2013).
Clayton, Erin M Rees, Megan Todd, Jennifer Beam Dowd, and Allison E Aiello. 2011. “The
impact of bisphenol A and triclosan on immune parameters in the U.S. population,
NHANES 2003-2006.” Environmental health perspectives 119(3): 390–6.
http://www.pubmedcentral.nih.gov/articlerender.fcgi?artid=3060004&tool=pmcentrez&
rendertype=abstract (May 22, 2013).
Dann, Andrea B, and Alice Hontela. 2011. “Triclosan: environmental exposure, toxicity and
mechanisms of action.” Journal of applied toxicology : JAT 31(4): 285–311.
http://www.ncbi.nlm.nih.gov/pubmed/21462230 (May 22, 2013).
Dayan, a D. 2007. “Risk assessment of triclosan [Irgasan] in human breast milk.” Food and
chemical toxicology : an international journal published for the British Industrial
Biological Research Association 45(1): 125–9.
http://www.ncbi.nlm.nih.gov/pubmed/17011099 (May 22, 2013).
Dhanirama, Danelle, Jan Gronow, and Nikolaos Voulvoulis. 2012. “Cosmetics as a potential
source of environmental contamination in the UK.” Environmental technology 33(13-
15): 1597–608. http://www.ncbi.nlm.nih.gov/pubmed/22988620.
Dodson, Robin E, Marcia Nishioka, Laurel J Standley, Laura J Perovich, and Julia Green
Brody. 2012. “Endocrine Disruptors and Asthma-Associated Chemicals in Consumer
Products.” Environmental Health Perspectives 120(7): 935–944.
Dussault, J H, and J Ruel. 1987. “Thyroid hormones and brain development.” Annual Review
of Physiology 49(4): 321–334. http://www.ncbi.nlm.nih.gov.ezp-
prod1.hul.harvard.edu/pubmed/3551803.
114
Environmental Defence. 2012. 1–25 The Trouble With Triclosan: How a Pervasive
Antibacterial Chemical is Polluting our World and our Bodies.
Esteban, Marta, and Argelia Castaño. 2009. “Non-invasive matrices in human
biomonitoring: a review.” Environment international 35(2): 438–49.
http://www.ncbi.nlm.nih.gov/pubmed/18951632 (May 21, 2013).
Fair, Patricia a, Hing-Biu Lee, Jeff Adams, Colin Darling, Grazina Pacepavicius, Mehran
Alaee, Gregory D Bossart, Natasha Henry, and Derek Muir. 2009. “Occurrence of
triclosan in plasma of wild Atlantic bottlenose dolphins (Tursiops truncatus) and in their
environment.” Environmental pollution (Barking, Essex : 1987) 157(8-9): 2248–54.
http://www.ncbi.nlm.nih.gov/pubmed/19410343 (May 27, 2013).
Fang, Jia-Long, Robin L Stingley, Frederick a Beland, Wafa Harrouk, Debbie L Lumpkins,
and Paul Howard. 2010. “Occurrence, efficacy, metabolism, and toxicity of triclosan.”
Journal of environmental science and health. Part C, Environmental carcinogenesis &
ecotoxicology reviews 28(3): 147–71. http://www.ncbi.nlm.nih.gov/pubmed/20859822
(May 22, 2013).
Faupel-Badger, Jessica M, Chung-Cheng Hsieh, Rebecca Troisi, Pagona Lagiou, and Nancy
Potischman. 2007. “Plasma volume expansion in pregnancy: implications for
biomarkers in population studies.” Cancer epidemiology, biomarkers & prevention : a
publication of the American Association for Cancer Research, cosponsored by the
American Society of Preventive Oncology 16(9): 1720–3.
http://www.ncbi.nlm.nih.gov/pubmed/17855687 (May 22, 2013).
FDA. 2010. Triclosan: What Consumers Should Know.
http://www.fda.gov/downloads/ForConsumers/ConsumerUpdates/UCM206222.pdf.
Fromme, Hermann, Gabriele Bolte, Holger M Koch, Jürgen Angerer, Sigrun Boehmer, Hans
Drexler, Richard Mayer, and Bernhard Liebl. 2007. “Occurrence and daily variation of
phthalate metabolites in the urine of an adult population.” International journal of
hygiene and environmental health 210(1): 21–33.
http://www.ncbi.nlm.nih.gov/pubmed/17182278 (May 22, 2013).
Gayrard, Véronique, Marlène Z Lacroix, Séverine H Collet, Catherine Viguié, Alain
Bousquet-melou, Pierre-louis Toutain, and Nicole Picard-hagen. 2013. “High
bioavailability of Bisphenol A from Sublingual Exposure.” Environmental health
perspectives (June): 1–27.
Government of Canada. 2013. “The Safety of triclosan.” Healthy Canadians.
http://healthycanadians.gc.ca/environment-environnement/home-maison/triclosan-
eng.php.
Greenhalgh, R, RL Baron, J Desmoras, R Engst, HO Esser, and W Klein. 1980. “Definition
of Persistence in Pesticide Chemistry.” Pure and Applied Chemistry 52: 2563–66.

115
Haddow, J E, G J Knight, G E Palomaki, L M Neveux, and B a Chilmonczyk. 1994.
“Replacing creatinine measurements with specific gravity values to adjust urine cotinine
concentrations.” Clinical chemistry 40(4): 562–4.
http://www.ncbi.nlm.nih.gov/pubmed/8149610.
Hauser, Russ, John D. Meeker, Sohee Park, Manori J. Silva, and Antonia M. Calafat. 2004.
“Temporal Variability of Urinary Phthalate Metabolite Levels in Men of Reproductive
Age.” Environmental Health Perspectives 112(17): 1734–1740.
http://www.ehponline.org/ambra-doi-resolver/10.1289/ehp.7212 (May 21, 2013).
Health Canada. 2011a. “DPD.” Drug Product Database Online Query. http://webprod5.hc-
sc.gc.ca/dpd-bdpp/index-eng.jsp .
———. 2011b. “Fact Sheet.” Phthalates Regulations. http://www.hc-sc.gc.ca/ahc-
asc/media/nr-cp/_2011/2011_07fs-eng.php (June 12, 2013).
———. 2011c. 1–33 The Cosmetic Ingredient Hotlist.
———. 2013a. “Human Biomonitoring of Environmental Chemicals.” Environmental and
Workplace Health. http://www.hc-sc.gc.ca/ewh-semt/contaminants/human-
humaine/index-eng.php (June 13, 2013).
———. 2013b. 2 1–434 Second Report on Human Biomonitoring of Environmental
Chemicals in Canada.
Health Canada and Environment Canada. 2012. 1–137 Preliminary Assessment: Triclosan.
Hoppin, Jane a, John W Brock, Barbara J Davis, and Donna D Baird. 2002. “Reproducibility
of urinary phthalate metabolites in first morning urine samples.” Environmental health
perspectives 110(5): 515–8.
http://www.pubmedcentral.nih.gov/articlerender.fcgi?artid=1240840&tool=pmcentrez&
rendertype=abstract.
James, Margaret O, Wenjun Li, David P Summerlot, Laura Rowland-Faux, and Charles E
Wood. 2010. “Triclosan is a potent inhibitor of estradiol and estrone sulfonation in
sheep placenta.” Environment international 36(8): 942–9.
http://www.ncbi.nlm.nih.gov/pubmed/19299018 (May 22, 2013).
Jones, Rhonda D, Fim Aam, Jerry L Newman, and Andrew S Lee. 2000. “Triclosan : A
review of effectiveness safety in health care settings.” American Journal of Infection
Control 28(2): 184–196.
Just, Allan C, J J Adibi, A G Rundle, A M Calafat, David E Camann, Russ Hauser, Manori J
Silva, and Robin M Whyatt. 2010. “Urinary and air phthalate concentrations and self-
reported use of personal care products among minority pregnant women in New York
City.” Journal of exposure science & environmental epidemiology 20(7): 625–633.

116
Kay, J. 2013. “J&J removes some chemicals from its baby shampoo.” Environmental Health
News. http://www.environmentalhealthnews.org/ehs/news/2013/childrens-products-
sidebar.
Kim, Kisok, Hyejin Park, Wonho Yang, and Jin Heon Lee. 2011. “Urinary concentrations of
bisphenol A and triclosan and associations with demographic factors in the Korean
population.” Environmental research 111(8): 1280–5.
http://www.ncbi.nlm.nih.gov/pubmed/21925656 (May 22, 2013).
Koeppe, Erika S, Kelly K Ferguson, Justin a Colacino, and John D Meeker. 2013.
“Relationship between urinary triclosan and paraben concentrations and serum thyroid
measures in NHANES 2007-2008.” The Science of the total environment 445-446: 299–
305. http://www.ncbi.nlm.nih.gov/pubmed/23340023 (May 21, 2013).
Koniecki, Diane, Rong Wang, Richard P Moody, and Jiping Zhu. 2011. “Phthalates in
cosmetic and personal care products: concentrations and possible dermal exposure.”
Environmental research 111(3): 329–36.
http://www.ncbi.nlm.nih.gov/pubmed/21315328 (May 21, 2013).
Kumar, Vikas, Ajanta Chakraborty, Mool Raj Kural, and Partha Roy. 2009. “Alteration of
testicular steroidogenesis and histopathology of reproductive system in male rats treated
with triclosan.” Reproductive toxicology (Elmsford, N.Y.) 27(2): 177–85.
http://www.ncbi.nlm.nih.gov/pubmed/19118620 (May 22, 2013).
Latch, DE, JL Packer, Stender BL, JV VanOverbeke, WV Arnold, and K McNeil. 2005.
“Aqueous photochemistry of triclosan: Formation of 2,4-dichlorophenol, 2,8-
dichlorodibenzo-p-dioxin, and oligomerization products.” Environmental toxicology
and chemistry 24(3): 517–525.
LeBlanc, Alain, and Mario Marchand. 2012. 4 1–17 Plastics and Personal Care Products in
Pregnancy Laboratory Summary Report.
Lee, E, and T Arbuckle. 2009. “Urine-sampling methods for environmental chemicals in
infants and young children.” Journal of exposure analysis and environmental
epidemiology 19(7): 625–33.
Li, Xu, Guang-Guo Ying, Jian-Liang Zhao, Zhi-Feng Chen, Hua-Jie Lai, and Hao-Chang Su.
2011. “4-Nonylphenol, bisphenol-A and triclosan levels in human urine of children and
students in China, and the effects of drinking these bottled materials on the levels.”
Environment international 52: 81–6. http://www.ncbi.nlm.nih.gov/pubmed/21794921
(May 22, 2013).
Mahalingaiah, Shruthi, John D Meeker, Kimberly R Pearson, Antonia M Calafat, Xiaoyun
Ye, John Petrozza, and Russ Hauser. 2008. “Temporal variability and predictors of
urinary bisphenol A concentrations in men and women.” Environmental health
perspectives 116(2): 173–8.

117
http://www.pubmedcentral.nih.gov/articlerender.fcgi?artid=2235217&tool=pmcentrez&
rendertype=abstract (May 21, 2013).
McLeod, R, S P Muench, J B Rafferty, D E Kyle, E J Mui, M J Kirisits, D G Mack, C W
Roberts, B U Samuel, R E Lyons, M Dorris, W K Milhous, and D W Rice. 2001.
“Triclosan inhibits the growth of Plasmodium falciparum and Toxoplasma gondii by
inhibition of apicomplexan Fab I.” International Journal for Parasitology 31(2): 109–
113. http://www.ncbi.nlm.nih.gov/pubmed/11239932.
McNaught, AD, and A Wilkinson. 1997. IUPAC. Compendium of Chemical Terminology,
2nd ed. (the “Gold Book”). Oxford, United Kingdom: Blackwell Scientific
Publications. http://goldbook.iupac.org/L03540.html.
Meeker, JD, AM Calafat, and R Hauser. 2012. “Urinary phthalate metabolites and their
biotransformation products: predictors and temporal variability among men and
women.” Journal of exposure science & environmental epidemiology 22(4): 376–385.
Meeker, John D, David E Cantonwine, Luis O Rivera-González, Kelly K Ferguson, Bhramar
Mukherjee, Antonia M Calafat, Xiaoyun Ye, Liza V Anzalota Del Toro, Noé Crespo-
Hernández, Braulio Jiménez-Vélez, Akram N Alshawabkeh, and José F Cordero. 2013.
“Distribution, variability, and predictors of urinary concentrations of phenols and
parabens among pregnant women in Puerto Rico.” Environmental science & technology
47(7): 3439–47. http://www.ncbi.nlm.nih.gov/pubmed/23469879.
Miller, Rebecca C, Eleanor Brindle, Darryl J Holman, Jane Shofer, Nancy a Klein, Michael
R Soules, and Kathleen a O’Connor. 2004. “Comparison of specific gravity and
creatinine for normalizing urinary reproductive hormone concentrations.” Clinical
chemistry 50(5): 924–32. http://www.ncbi.nlm.nih.gov/pubmed/15105350 (May 22,
2013).
National Academy of Sciences. 2008. Science and Decisions: Advancing Risk Assessment
(free executive summary). http://www.nap.edu/catalog/12209.html.
Needham, LL, AM Calafat, and DB Barr. 2008. “Assessing developmental toxicant
exposures via biomonitoring.” Basic & clinical pharmacology & toxicology 102(2):
100–108.
NICNAS. 2009. 1–485 Priority Existing Chemical Assessment Report No.30. Triclosan.
Ontario Ministry of Finance. 2013. 1 Ontario Fact Sheet.
Perencevich, E N, M T Wong, and a D Harris. 2001. “National and regional assessment of
the antibacterial soap market: a step toward determining the impact of prevalent
antibacterial soaps.” American journal of infection control 29(5): 281–3.
http://www.ncbi.nlm.nih.gov/pubmed/11584251.

118
Philippat, Claire, Marion Mortamais, Cécile Chevrier, Claire Petit, Antonia M Calafat, and
Xiaoyun Ye. 2012. “Exposure to Phthalates and Phenols during Pregnancy and
Offspring Size at Birth.” Environmental Health Perspectives 464(3): 464–470.
Pohjola, M V, O Leino, V Kollanus, J T Tuomisto, H Gunnlaugsdóttir, F Holm, N
Kalogeras, J M Luteijn, S H Magnússon, G Odekerken, M J Tijhuis, Ø Ueland, B C
White, and H Verhagen. 2012. “State of the art in benefit-risk analysis: environmental
health.” Food and chemical toxicology : an international journal published for the
British Industrial Biological Research Association 50(1): 40–55.
http://www.ncbi.nlm.nih.gov/pubmed/21708210 (May 21, 2013).
Prince, Stéphanie a, Kristi B Adamo, Meghan E Hamel, Jill Hardt, Sarah Connor Gorber,
and Mark Tremblay. 2008. “A comparison of direct versus self-report measures for
assessing physical activity in adults: a systematic review.” The international journal of
behavioral nutrition and physical activity 5: 56.
http://www.pubmedcentral.nih.gov/articlerender.fcgi?artid=2588639&tool=pmcentrez&
rendertype=abstract (May 21, 2013).
Quirós-Alcalá, Lesliam, Brenda Eskenazi, Asa Bradman, Xiaoyun Ye, Antonia M Calafat,
and Kim Harley. 2013. “Determinants of urinary bisphenol A concentrations in
Mexican/Mexican-American pregnant women.” Environment international 59C: 152–
160. http://www.ncbi.nlm.nih.gov/pubmed/23816546 (July 10, 2013).
Robertshaw, Helen, and Barbara Leppard. 2007. “Contact dermatitis to triclosan in
toothpaste.” Contact dermatitis 57(6): 383–4.
http://www.ncbi.nlm.nih.gov/pubmed/17988290.
Rodricks, Joseph V, James a Swenberg, Joseph F Borzelleca, Robert R Maronpot, and
Annette M Shipp. 2010. “Triclosan: a critical review of the experimental data and
development of margins of safety for consumer products.” Critical reviews in
toxicology 40(5): 422–84. http://www.ncbi.nlm.nih.gov/pubmed/20377306 (May 21,
2013).
Romero-Franco, Michelle, Raúl U Hernández-Ramírez, Antonia M Calafat, Mariano E
Cebrián, Larry L Needham, Susan Teitelbaum, Mary S Wolff, and Lizbeth López-
Carrillo. 2011. “Personal care product use and urinary levels of phthalate metabolites in
Mexican women.” Environment international 37(5): 867–71.
http://www.ncbi.nlm.nih.gov/pubmed/21429583 (May 21, 2013).
Rosner, B. 2006. Fundamentals of biostatistics. 6th ed. Pacific Grove, California: Duxbury
Press.
Samsoe-Petersen, L, M Winther-Nielsen, and T Madsen. 2003. Fate and Effects of Triclosan.
ed. Danish Environmental Protection Agency.
119
Sandborgh-Englund, Gunilla, Margaretha Adolfsson-Erici, Göran Odham, and Jan Ekstrand.
2006. “Pharmacokinetics of triclosan following oral ingestion in humans.” Journal of
toxicology and environmental health. Part A 69(20): 1861–73.
http://www.ncbi.nlm.nih.gov/pubmed/16952905 (May 21, 2013).
SCCP (Scientific Committee on Consumer Products). 2009. 1–136 Opinion on Triclosan
COLIPA n° P32.
Schena, D, A Papagrigoraki, and G Girolomoni. 2008. “Sensitizing potential of triclosan and
triclosan-based skin care products in patients with chronic eczema.” Dermatologic
Therapy 21(6): 35–38.
Schweizer, H P. 2001. “Triclosan: a widely used biocide and its link to antibiotics.” FEMS
Microbiology Letters 202(1): 1–7. http://www.ncbi.nlm.nih.gov/pubmed/11506900.
Sexton, K, L Needham, and J Pirkle. 2004. “Human Biomonitoring of Environmental
Chemicals.” American Scientist 92: 38–45.
http://www.cdc.gov/biomonitoring/pdf/AS_article_biomonitoring.pdf.
Shephard, R J. 2003. “Limits to the measurement of habitual physical activity by
questionnaires.” British journal of sports medicine 37(3): 197–206; discussion 206.
http://www.pubmedcentral.nih.gov/articlerender.fcgi?artid=1724653&tool=pmcentrez&
rendertype=abstract.
Stathatos, Nikolaos. 2012. “Thyroid physiology.” The Medical clinics of North America
96(2): 165–73. http://www.ncbi.nlm.nih.gov/pubmed/22443969 (May 22, 2013).
Statistics Canada. 2012. “Focus on Geography Series, 2011 Census.” Statistics Canada
Catalogue: 98–310–XWE2011004. https://www12.statcan.gc.ca/census-
recensement/2011/as-sa/fogs-spg/Facts-cma-
eng.cfm?LANG=Eng&GK=CMA&GC=505 (June 7, 2013).
Teitelbaum, S, J Britton, A Calafat, X Ye, M Silva, J Reidy, M Galvez, B Brenner, and M
Wolff. 2008. “Temporal variability in urinary concentrations of phthalate metabolites,
phytoestrogens and phenols among minority children in the United States.”
Environmental research 106(2): 257–69.
http://www.ncbi.nlm.nih.gov/pubmed/17976571 (May 21, 2013).
The Associated Press. 2013. “Triclosan and liquid soap safety.” WJLA ABC 7 News.
http://wj.la/12vUh37.
The Ottawa Hospital. 2012. “Statistics.” Ottawa Hospital’s Annual Report.
http://www.ottawahospital.on.ca/wps/portal/Base/TheHospital/AboutOurHospital/Statis
tics (June 7, 2013).

120
US Department of Health and Human Services. 2013. 19 Fourth National Report on Human
Exposure to Environmental Chemicals. Centers for Disease Control and Prevention.
US Environmental Protection Agency. 2004. “Chapter 17: Quantification of Exposure:
Chemical and Physical Properties Affecting Multimedia Fate and Transport.” In Risk
Assessment and Modeling - Air Toxics Risk Assessment Reference Library, , p. 1–11.
http://www.epa.gov/ttn/fera/data/risk/vol_1/chapter_17.pdf.
Veldhoen, Nik, Rachel C Skirrow, Heather Osachoff, Heidi Wigmore, David J Clapson,
Mark P Gunderson, Graham Van Aggelen, and Caren C Helbing. 2006. “The
bactericidal agent triclosan modulates thyroid hormone-associated gene expression and
disrupts postembryonic anuran development.” Aquatic toxicology (Amsterdam,
Netherlands) 80(3): 217–27. http://www.ncbi.nlm.nih.gov/pubmed/17011055 (May 22,
2013).
Verschueren, K. 2001. 1–2391 Handbook of Environmental Data on Organic Chemicals.
New York, NY: Van Nostrand Reinhold Co.
Wang, Li-Quan, Charles Falany, and Margaret James. 2004. “Triclosan as a substrate and
inhibitor of 3’-phosphoadenosine- 5'- phosphosulfate- sulfotransferase and UDP-
glucuronosyl transferase in human liver fractions.” Drug Metabolism and Disposition
32(10): 1162–1169.
WHO. 2012. 1–85 Possible developmental early effects of endocrine disrupters on child
health. http://apps.who.int/iris/bitstream/10665/75342/1/9789241503761_eng.pdf.
Wolff, Mary S, Stephanie M Engel, Gertrud S Berkowitz, Xiaoyun Ye, J Manori, Chenbo
Zhu, James Wetmur, Antonia M Calafat, J Silva, and M Engel. 2008. “Prenatal Phenol
and Phthalate Exposures and Birth Outcomes.” Environmental Health Perspectives
116(8): 1092–1097.
Wolff, Mary S., Susan L. Teitelbaum, Gayle Windham, Susan M. Pinney, Julie a. Britton,
Carol Chelimo, James Godbold, Frank Biro, Lawrence H. Kushi, Christine M. Pfeiffer,
and Antonia M. Calafat. 2007. “Pilot Study of Urinary Biomarkers of Phytoestrogens,
Phthalates, and Phenols in Girls.” Environmental Health Perspectives 115(1): 116–121.
http://www.ehponline.org/ambra-doi-resolver/10.1289/ehp.9488 (May 24, 2013).
Woodruff, T, A Zota, and J Schwartz. 2011. “Environmental chemicals in pregnant women
in the United States: NHANES 2003-2004.” Environmental health perspectives 119(6):
878–85.
http://www.pubmedcentral.nih.gov/articlerender.fcgi?artid=3114826&tool=pmcentrez&
rendertype=abstract (May 22, 2013).
World Health Organization. 2010. “Dioxins and their effects on human health.” Media
Centre. http://www.who.int/mediacentre/factsheets/fs225/en/ (May 22, 2013).

121
Yazdankhah, SP, AA Scheie, EA Hoiby, BT Lunestad, E Heir, TO Fotland, K Neterstad, and
H Kruse. 2006. “Triclosan and Antimicrobial Resistance in Bacteria: An Overview.”
Microbial Drug Resistance 12(2): 83–90.
Ye, X, FH Pierik, R Hauser, S Duty, J Angerer, and MM Park. 2008. “Urinary metabolite
concentrations of organophosphorous pesticides, bisphenol A, and phthalates among
pregnant women in Rotterdam, the Netherlands: the generation R study.”
Environmental research 108: 260–267.