Tribological Aspects of Journal Bearings Focusing on the ...
187
Louisiana State University LSU Digital Commons LSU Doctoral Dissertations Graduate School 2006 Tribological Aspects of Journal Bearings Focusing on the Stribeck Curve Xiaobin Lu Louisiana State University and Agricultural and Mechanical College, [email protected] Follow this and additional works at: hps://digitalcommons.lsu.edu/gradschool_dissertations Part of the Mechanical Engineering Commons is Dissertation is brought to you for free and open access by the Graduate School at LSU Digital Commons. It has been accepted for inclusion in LSU Doctoral Dissertations by an authorized graduate school editor of LSU Digital Commons. For more information, please contact[email protected]. Recommended Citation Lu, Xiaobin, "Tribological Aspects of Journal Bearings Focusing on the Stribeck Curve" (2006). LSU Doctoral Dissertations. 2538. hps://digitalcommons.lsu.edu/gradschool_dissertations/2538
Transcript of Tribological Aspects of Journal Bearings Focusing on the ...
Louisiana State UniversityLSU Digital Commons
LSU Doctoral Dissertations Graduate School
2006
Tribological Aspects of Journal Bearings Focusingon the Stribeck CurveXiaobin LuLouisiana State University and Agricultural and Mechanical College, [email protected]
Follow this and additional works at: https://digitalcommons.lsu.edu/gradschool_dissertations
Part of the Mechanical Engineering Commons
This Dissertation is brought to you for free and open access by the Graduate School at LSU Digital Commons. It has been accepted for inclusion inLSU Doctoral Dissertations by an authorized graduate school editor of LSU Digital Commons. For more information, please [email protected].
Recommended CitationLu, Xiaobin, "Tribological Aspects of Journal Bearings Focusing on the Stribeck Curve" (2006). LSU Doctoral Dissertations. 2538.https://digitalcommons.lsu.edu/gradschool_dissertations/2538

TRIBOLOGICAL ASPECTS OF JOURNAL BEARINGS FOCUSING ON THE STRIBECK CURVE
A Dissertation Submitted to the Graduate Faculty of the
Louisiana State University and Agricultural and Mechanical College
In Partial Fulfillment of the requirements for the degree of
Doctor of Philosophy
in
The Department of Mechanical Engineering
by Xiaobin Lu
B.S., Zhengzhou Textile Institute, China, 1997 M.S., Univeristy of Petroleum, China, 2000
December, 2006

ii
To whom I love
Yihui Zeng
iii
ACKNOWLEGEMENTS
This work is carried out under the direction of Professor Michael M. Khonsari. I
have been enjoying his great advices and thoughtful insights during the time of research.
What I have learned is far beyond those words written in the dissertation. If the work
fortunately contributes a little to tribology of journal bearings, half of the credit goes to
him.
I am sincerely thankful to my committee members: Dr. Ram, Dr. Pang, Dr. Wang
and Dr. Monroe for their valuable time in evaluating this work.
The authors gratefully acknowledge the support of Louisiana Board of Regents
through an industrial-ties grant with Caterpillar Inc. The instrument used in this research
was purchased through the grant. The authors also acknowledge the constant support and
encouragement of their colleagues and members of the Center for Rotating Machinery
(CeRoM) at Louisiana State University.
My parents and grandparents support me mentally through any pain in the past,
current and future.

iv
TABLE OF CONTENTS
ACKNOWLEGEMENTS………………………………………………..……………..iii
ABSTRACT……………………………………………………………..……………...vii
CHAPTER 1 ON THE LIFT-OFF SPEED IN JOURNAL BEARINGS ---------------1 1.1. Introduction ----------------------------------------------------------------------------------1 1.2. Experimental ---------------------------------------------------------------------------------2
1.2.1 Experiment Procedure------------------------------------------------------------------5 1.2.2. Experiment Results --------------------------------------------------------------------5
1.3. Discussion---------------------------------------------------------------------------------- 12 1.4. Conclusions -------------------------------------------------------------------------------- 13 1.5. Nomenclature ------------------------------------------------------------------------------ 13
CHAPTER 2 THE STRIBECK CURVE: EXPERIMENTAL RESULTS AND THEORETICAL PREDICTION ------------------------------------------------------------- 15
2.1. Introduction -------------------------------------------------------------------------------- 15 2.2. Theoretical --------------------------------------------------------------------------------- 17
2.2.1 Friction Expression ------------------------------------------------------------------- 17 2.2.2 Elastohydrodynamic Component --------------------------------------------------- 20 2.2.3 Asperity Contact Component ------------------------------------------------------- 21
2.3. Experimental ------------------------------------------------------------------------------- 23 2.3.1 Bearing Properties and Operating Conditions------------------------------------- 23 2.3.2 Experimental Procedure-------------------------------------------------------------- 24
2.4. Numerical Simulations ------------------------------------------------------------------- 24 2.5. Results and Discussion ------------------------------------------------------------------- 24
2.5.1 Effect of Inlet Oil Temperature ----------------------------------------------------- 25 2.5.2 Effect of Load ------------------------------------------------------------------------- 28
2.6. Conclusions -------------------------------------------------------------------------------- 30 2.7. Nomenclature ------------------------------------------------------------------------------ 30
CHAPTER 3 AN EXPERIMENTAL INVESIGATION OF GREASE-LUBRICATED JOURNAL BEARINGS---------------------------------------------------- 33
3.1. Introduction -------------------------------------------------------------------------------- 33 3.2. Experimental ------------------------------------------------------------------------------- 35
3.2.1 Bearing Properties -------------------------------------------------------------------- 35 3.2.2. Experimental Procedure------------------------------------------------------------- 37 3.2.3. Experimental Results and Discussion --------------------------------------------- 37 3.2.4. Comparison with Oil Lubrication-------------------------------------------------- 41 3.2.5 Theoretical Predictions--------------------------------------------------------------- 44
3.3. Conclusions -------------------------------------------------------------------------------- 45 3.4. Nomenclature ------------------------------------------------------------------------------ 47
CHAPTER 4 AN EXPERIMENTAL INVESTIGATION OF DIMPLE EFFECT ON THE STRIBECK CURVE OF JOURNAL BEARINGS---------------------------- 50
4.1. Introduction -------------------------------------------------------------------------------- 50
v
4.2. Experimental ------------------------------------------------------------------------------- 51 4.2.1. Bearings ------------------------------------------------------------------------------- 51 4.2.2. Experiment Procedure --------------------------------------------------------------- 54 4.2.3. Experimental Results and Discussion --------------------------------------------- 54 4.2.4 Discussion ----------------------------------------------------------------------------- 62
4.3. Conclusions -------------------------------------------------------------------------------- 65 4.4. Nomenclature ------------------------------------------------------------------------------ 69
CHAPTER 5 AN EXPERIMENTAL STUDY OF OIL LUBRICATED JOURNAL BEARINGS UNDERGOING OSCILLATORY MOTION------------------------------ 70
5.1. Introduction -------------------------------------------------------------------------------- 70 5.2. Experimental ------------------------------------------------------------------------------- 71
5.2.1 Bearing Properties -------------------------------------------------------------------- 71 5.2.2 Experiment Procedure---------------------------------------------------------------- 72 5.2.3 Development of Oscillatory Motion------------------------------------------------ 73 5.2.4 Results and Discussion--------------------------------------------------------------- 73
5.3. Conclusions -------------------------------------------------------------------------------104 5.4. Nomenclature -----------------------------------------------------------------------------105
CHAPTER 6 AN EXPERIMENTAL STUDY OF GREASE-LUBRICATED JOURNAL BEARINGS UNDERGOING OSCILLATORY MOTION -------------106
6.1. Introduction -------------------------------------------------------------------------------106 6.2. Experimental ------------------------------------------------------------------------------107
6.2.1 Bearing Parameters ------------------------------------------------------------------107 6.2.2 Experiment Procedure---------------------------------------------------------------108 6.2.3 Development of Oscillatory Motion-----------------------------------------------109 6.2.4 Results and Discussion--------------------------------------------------------------110
6.3. Conclusions -------------------------------------------------------------------------------130 6.4. Nomenclature -----------------------------------------------------------------------------132
CHAPTER 7 DYNAMIC FRICTION MODELING OF OIL-LUBRICATED LONG JOURNAL BEARINGS -----------------------------------------------------------------------133
7.1 Introduction --------------------------------------------------------------------------------133 7.2 Theoretical Development ----------------------------------------------------------------134
7.2.1 Mixed Lubrication Modeling-------------------------------------------------------134 7.2.2 The Friction Coefficient ------------------------------------------------------------135 7.2.3 Load Capacity of Constant Velocity ----------------------------------------------137 7.2.4 Dynamic Modeling of Long Journal Bearings -----------------------------------137
7.3 Numerical Solutions ----------------------------------------------------------------------140 7.4 Results and Discussion -------------------------------------------------------------------141 7.5 Conclusion ---------------------------------------------------------------------------------143 7.6 Nomenclature------------------------------------------------------------------------------143
CHAPTER 8 FINITE ELEMENT ANALYSIS OF THERMAL FIELD IN OSCILLATORY JOURNAL BEARINGS-------------------------------------------------145
8.1 Introduction --------------------------------------------------------------------------------145 8.2 Model Development ----------------------------------------------------------------------145 8.3 Simulation of Pin and Bushing Assemblies -------------------------------------------148
vi
8.3.1 Results of PinA and PinB-----------------------------------------------------------149 8.3.2 Harmonic Oscillating Speed--------------------------------------------------------152 8.3.3 Intervals between Oscillating Cycles----------------------------------------------152
8.4 Simulation of LaboratoryTests ----------------------------------------------------------153 8.4.1 Pin and Bushing Properties ---------------------------------------------------------154 8.4.2 Experimental Results ----------------------------------------------------------------155 8.4.3 Simulation ----------------------------------------------------------------------------158
8.5 Conclusion ---------------------------------------------------------------------------------163 8.6 Nomenclature------------------------------------------------------------------------------163
REFERENCES ----------------------------------------------------------------------------------165
VITA-----------------------------------------------------------------------------------------------179

vii
ABSTRACT
The dissertation focuses on the frictional characteristics of journal bearings as
represented by the Stribeck curve. The behavior of lift-off speed and the factors that
affect it are explored. An equation is proposed for predicting the lift-off speed. The
comparison between the experimental results of oil- and grease-lubricated journal
bearings with a mixed elastohydrodynamic lubrication model for line contacts is
indicative of good agreement in the mixed lubrication regime. Efforts are made to modify
the surface profile of bushing by putting dimples on its surface. Experimental results
show that with proper dimensions of dimples, the friction performance of journal
bearings can be improved, particularly for light oils. The friction hysteresis of oil and
grease-lubricated journal bearings undergoing oscillatory motion are investigated under
different load, with or without oil, oil type, oil inlet temperature, oscillating frequency,
and bushing material. A dynamic friction model for infinitely long journal bearing is also
developed that demonstrates the existence of hysteresis loop. Finally, a thermal analysis
of oscillatory journal bearings is carried out by finite element method using ANSYS.
Simulations are found to be in good agreement with experimental measurement of
temperature at four locations along the circumference.

1
CHAPTER 1 ON THE LIFT-OFF SPEED IN JOURNAL BEARINGS
1.1. Introduction
The celebrated work of Stribeck [1] trailed the work of Hirn [2] in 1846 who
reported the results of experiments with a journal bearing and found that the coefficient
of friction was directly proportional to speed. His work was published in 1854. In
dedicating his book to Hirn, Thurston [3] reported that the coefficient of friction passed
through a minimum which is now recognized as the transition point from mixed to
hydrodynamic lubrication. About half of a century after Hirn, Stribeck (1902) carried out
systematic experiments to show the existence of the minimum point proposed by
Thurston and provided a clear view of the characteristic curve of the coefficient of
friction versus speed. In recognition of his contribution, this curve is universally referred
to as “the Stribeck curve” (Dowson, [4]).
After Stribeck’s original contribution, many researchers endeavored to broaden our
insight into the understanding of the physical meaning and its implication on the different
lubrication regimes. In some sense, especially after the speed parameter was extended to
the Sommerfeld number ([5], [6]), the Stribeck curve acquired a much greater breadth as
its applicability extended to a far greater number of tribological components than merely
journal bearings. For example, the concept has been applied to ball bearings [7], seals
([8], [9]), wet clutches [10], piston pumps [11], hip joints [12], and even fiber-capstan
[13].
It has been long recognized that the coefficient of friction is influenced by many
parameters such as the material properties, the surface finish, the viscosity of the oil, and
the operating conditions such as the speed and the pressure on the bearing. As early as
1922, Wilson [14] compiled a comprehensive review of forerunners’ research on the

2
clearance ratio, bearing material, and the oil and its arrangements. The McKee brothers
[15] in 1932 employed three different oils in bronze and babbitt bearings to show that the
coefficient of friction depends on the viscosity in the boundary or mixed lubrication
regime. Their conclusion was supported by Bridgeman’s experiments [16] in which four
different oils were used in babbitt and mild steel bearings. In 1941, Burwell [17]
conducted a series of experiments on surfaces with a wide range of surface roughness,
and showed that the critical speed was influenced by the surface finish. Later, in 1959,
Ocvirk [18] analyzed the clearance’s effect based on the short-bearing approximation.
While these researchers illustrated the shift of the Stribeck curve under various
conditions, none attempted to predict the transition point—the point that marks the
watershed of the mixed and the hydrodynamic lubrication. This problem was tackled by
Vogelpohl [19] in 1958 who was probably the first researcher to have succeeded in
developing an empirical equation to calculate the lift-off speed.
In the current paper, we present the results of a series of experiments that are
conducted to explore the behavior of the lift-off speed. We study the influence of oil inlet
temperature, the oil type and the load. Comparison with Vogelpohl’s equation is also
presented.
1.2. Experimental
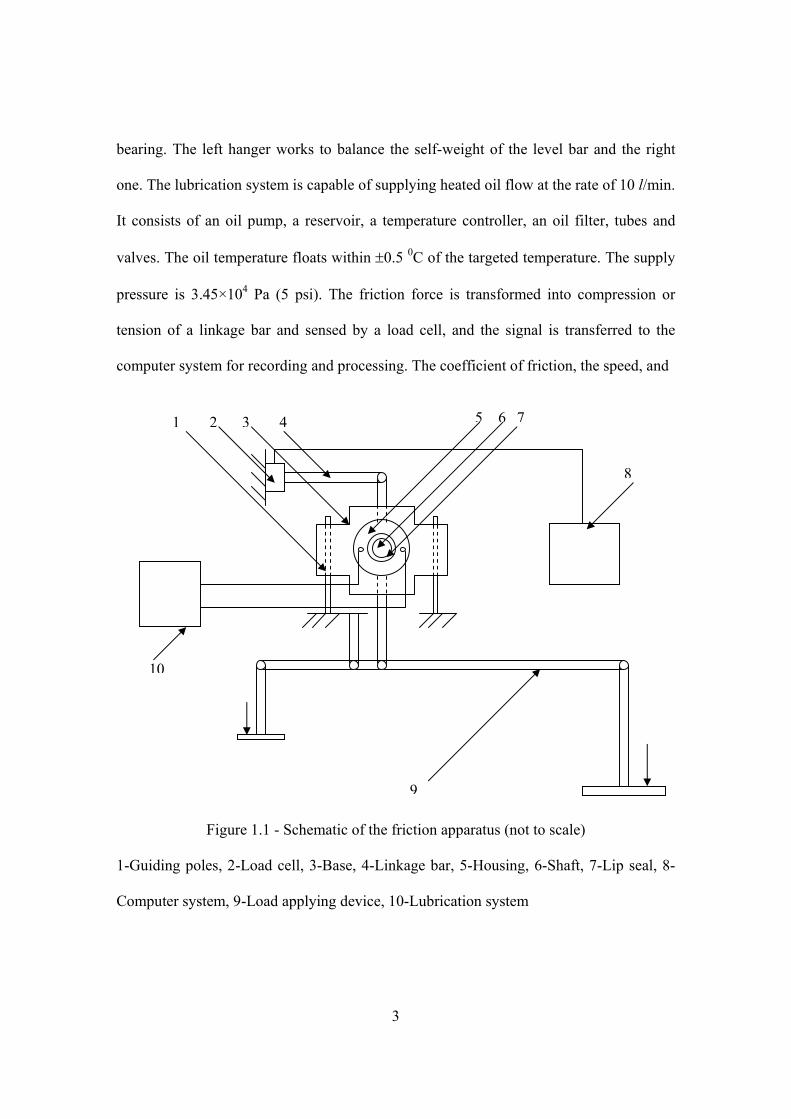
Figure 1.1 shows the schematic of the apparatus (Lewis LRI-8H) used for
measuring the coefficient of friction of journal bearings.
The Shaft is tapered at one end and is centered in the rear supporting base. It is
driven by an electronic motor with a maximum speed of 3300 rpm. The desired load is
applied using a dead weight located on the right hanger device via a lever. The lever
scale is 1:10, so that one Newton on the hanger is equivalent to 10 Newton on the
3
bearing. The left hanger works to balance the self-weight of the level bar and the right
one. The lubrication system is capable of supplying heated oil flow at the rate of 10 l/min.
It consists of an oil pump, a reservoir, a temperature controller, an oil filter, tubes and
valves. The oil temperature floats within ±0.5 0C of the targeted temperature. The supply
pressure is 3.45×10⁴ Pa (5 psi). The friction force is transformed into compression or
tension of a linkage bar and sensed by a load cell, and the signal is transferred to the
computer system for recording and processing. The coefficient of friction, the speed, and
Figure 1.1 - Schematic of the friction apparatus (not to scale)
1-Guiding poles, 2-Load cell, 3-Base, 4-Linkage bar, 5-Housing, 6-Shaft, 7-Lip seal, 8-
Computer system, 9-Load applying device, 10-Lubrication system
1 2 3 4 5 6 7
8
9
10
4
the load are processed by software and displayed on the computer screen. The time
interval of data reading is adjustable and is independent of the duration of the test. In the
current study, the minimum time interval is 20 seconds.
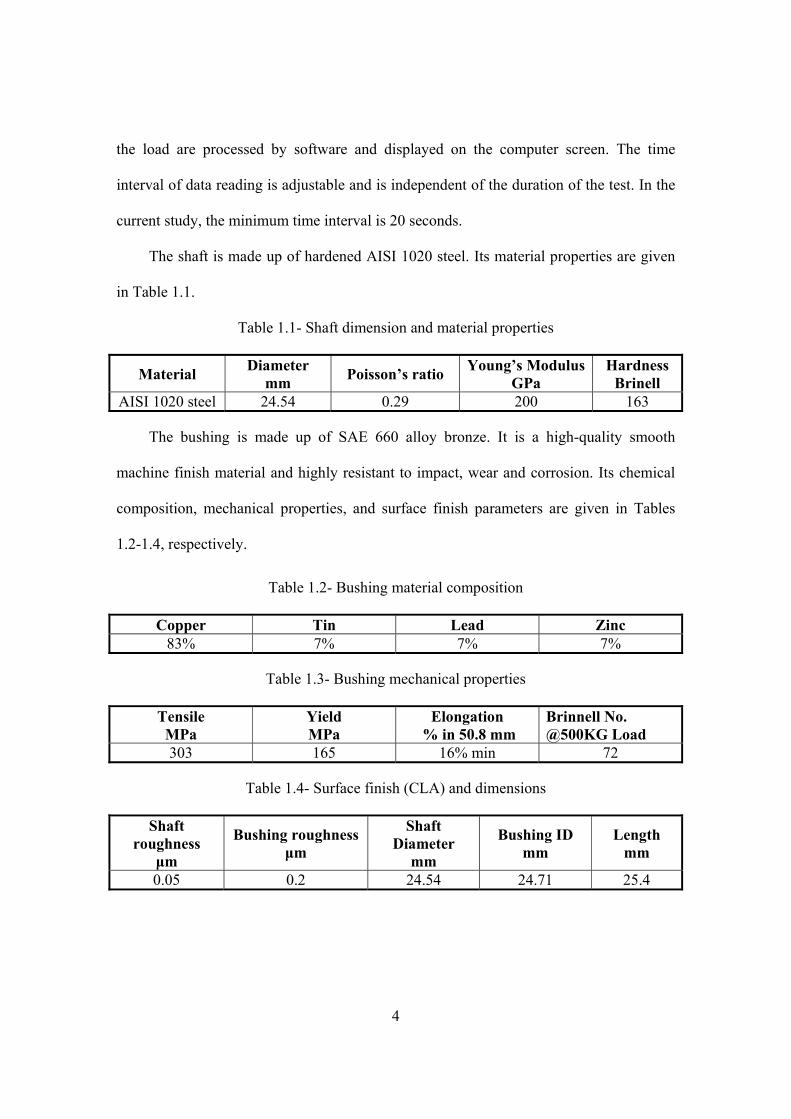
The shaft is made up of hardened AISI 1020 steel. Its material properties are given
in Table 1.1.
Table 1.1- Shaft dimension and material properties
Material Diameter mm Poisson’s ratio Young’s Modulus
GPa Hardness
Brinell AISI 1020 steel 24.54 0.29 200 163
The bushing is made up of SAE 660 alloy bronze. It is a high-quality smooth
machine finish material and highly resistant to impact, wear and corrosion. Its chemical
composition, mechanical properties, and surface finish parameters are given in Tables
1.2-1.4, respectively.
Table 1.2- Bushing material composition
Copper Tin Lead Zinc 83% 7% 7% 7%
Table 1.3- Bushing mechanical properties
Tensile MPa
Yield MPa
Elongation % in 50.8 mm
Brinnell No. @500KG Load
303 165 16% min 72
Table 1.4- Surface finish (CLA) and dimensions
Shaft roughness
µm
Bushing roughness µm
Shaft Diameter
mm
Bushing ID mm
Length mm
0.05 0.2 24.54 24.71 25.4

5
Two types of oils (SAE30 and SAE5W30) whose properties are shown in Table 1.5
are used. The applied loads are: 222N (50 lb), 445 N (100 lb), 543 N (122 lb), 667 N (150
lb), and 890 N (200 lb). The range of speeds tested is between 2 rpm to 500 rpm.
Table 1.5- Oil properties
Viscosity (cSt) Oil Type
40 0C 100 0C
Specific Gravity at
150C
Viscosity Index
SAE 30 93 10.8 0.890 100 SAE 5W30 65 10.4 0.875 147
1.2.1 Experiment Procedure
Before any measurement is taken, the system is balanced so that the coefficient of
friction is nil when the shaft is in static position. The lubrication supply system is turned
on to allow lubricant to enter in the bearing for 2 hours at the running speed of 100 rpm.
Air bubbles, if any, are eliminated through a branch return path. At each speed, the
history of the coefficient of friction is monitored. The friction coefficient oscillates
periodically around a relatively constant value. The rms value of the history is taken as
the coefficient of friction for that speed. By observation, 4 minutes are regarded as a
reasonable testing period for each velocity point.
1.2.2. Experiment Results
1.2.2.1 Effect of Inlet Oil Temperature
The oil viscosity can have a pronounced effect on the Stribeck curve. Experimentally
this can be easily demonstrated by varying the inlet oil temperature. As shown in Figure
1.2, while the profile remains the same, the speed at which the coefficient of friction is
the minimum is shifted by varying the oil temperature. The higher the inlet oil
temperature, the greater is the transition speed.
6
0.000
0.050
0.100
0.150
0.200Fr
ictio
n co
effi
cien
t
0 100 200 300 400 500
Velocity (rpm)
Temperature effect at 445 N
60 degree C 50 degree C 40 degree C
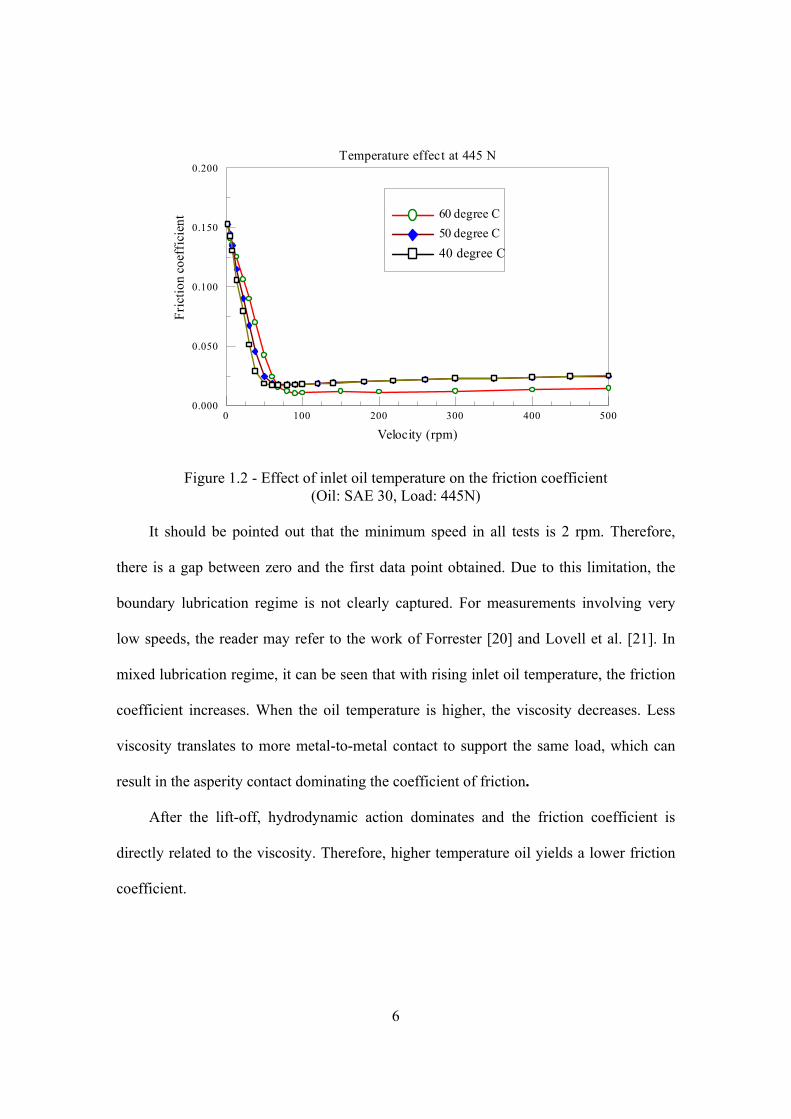
Figure 1.2 - Effect of inlet oil temperature on the friction coefficient (Oil: SAE 30, Load: 445N)
It should be pointed out that the minimum speed in all tests is 2 rpm. Therefore,
there is a gap between zero and the first data point obtained. Due to this limitation, the
boundary lubrication regime is not clearly captured. For measurements involving very
low speeds, the reader may refer to the work of Forrester [20] and Lovell et al. [21]. In
mixed lubrication regime, it can be seen that with rising inlet oil temperature, the friction
coefficient increases. When the oil temperature is higher, the viscosity decreases. Less
viscosity translates to more metal-to-metal contact to support the same load, which can
result in the asperity contact dominating the coefficient of friction.
After the lift-off, hydrodynamic action dominates and the friction coefficient is
directly related to the viscosity. Therefore, higher temperature oil yields a lower friction
coefficient.

7
1.2.2.2 Effect of Load
Figure 1.3 shows the results for the coefficient of friction as a function of speed for
different loads ranging from 222 N to 890 N. The oil type is SAE 30, and the inlet
temperature is 400 C.
0 100 200 300 400 500
Velocity (rpm)
0.000
0.050
0.100
0.150
0.200
Fric
tion
coef
fici
ent
Load effect at 40 0C oil
222 N445 N543 N667 N890 N
Figure 1.3 Variation of coefficient of friction with speed under different load.
(Oil: SAE 30, Inlet temperature: 400 C) The error associated with the friction coefficient measurement with each load is
tabulated in Table 1.6. With this friction apparatus, increasing load results in a smaller
error. Thus, this test rig is best suited for higher loads where the experimental error is
considerably lower.
Table 1.6- Friction error for different load
Load
222 N (50 lb)
445 N (100 lb)
543N (122lb)
667 N (150 lb)
890 N (200 lb)
Error (±) 0.0333 0.0229 0.0136 0.0111 0.0083
When lift-off occurs, the speed TN satisfies the definition of the Sommerfeld number:
8
2
L
T
CRs
P60N
S ⎟⎠⎞
⎜⎝⎛
×µ= (1.1)
So that
60RsCPS
N2
LT ×⎟
⎠⎞
⎜⎝⎛
µ×
= (1.2)
Using equation (1.2), the lift-off speed TN can be calculated. The lift-off speed is
directly proportional to the projected load, DLWPL = , hence to the bearing load. This fact
is reflected by the results of the experiments shown in Figure 1.3. In mixed lubrication
regime, a light load creates a smaller coefficient of friction than the heavy load. Mixed
lubrication is a lubrication state in which the load is supported by both fluid pressure and
asperities (Spikes [22] and [23]). When load is higher, more metal-to-metal asperity
contact occurs, which causes the friction coefficient to increase.
On the other hand, the opposite is true in the full-film lubrication regime. In this
regime, a high load translates into a higher eccentricity ratio ε and a thinner film.
Therefore, the friction coefficient is lower. These trends are consistent with the
experimental findings of Stribeck’s [24] and Vogelpohl’s [19].
Solutions of full Reynolds equation also reveal the same information. According to
[25], in a bearing whose length is equal to the shaft diameter (L/D =1), the coefficient of
friction varies from f (C/R) = 53.4294 at ε =0.05 to f (C/R) =0.6896 for ε =0.95.
1.2.2.3 Effect of Load with another Oil
Figure 1.4 demonstrates the results from oil SAE 5W30 with an inlet temperature of
400 C and different loads.

9
0 100 200 300 400 500
Velocity (rpm)
0.000
0.050
0.100
0.150
0.200Fr
ictio
n co
effic
ient
Load effect at 40 0 C oil
222 N445 N543 N667 N890 N
Figure 1.4 Effect of Load on the friction coefficient
(Oil: SAE 5W30, Load: 445N)
The results with SAE 5W30 (a multi-grade oil) are similar to those of SAE30 oil.
Referring to Table 1.5, the viscosity of SAE 5W30 oil (65 cSt) is smaller than that of
SAE 30 oil (93 cSt). Compared with Fig. 1.3, it can be seen that the decrease of the oil
viscosity shifts the lift-off speed to the right. This shift can be derived from equation
(1.2).
1.2.2.4 Comparison of Theoretical Prediction and Experiment Results
In order to avoid metal-to-metal contact between journal and bearing, a minimum
oil film thickness is required. The minimum film thickness corresponds to the lift-off
speed. In other words, the operation speed must be equal to or greater than the lift-off
speed to ensure that the bearing runs in fully lubricated regime. Hence, the determination
of the minimum film thickness becomes essential.
On the basis of Tarasov’s examination of surface roughness reading to actual
surface profile [26], Ocvirk [18] hypothesized that for journal bearings with ground
10
surface finish, the minimum film thickness is 9 times of the combination of two surface
roughnesses in rms. Dawson defined a so-called “D” ratio whose reversal is now known
as the lambda ratio “Λ” (see Dowson [4]). Martin [27] described two ways to predict the
minimum film thickness. One uses the work of Davis [28], Rubert [29] and Ocvirk [30]
which is based on the surface finish criterion. The other considers the oil film
temperature effect at high speed operation from white-metal wiping criterion. Hamrock &
Dowson [31] mark the transition between lubrication regimes using the definition of Λ
ratio. Cann et al. [32] and Masen [33] examined the relationship of Λ to the minimum
film thickness considering heavily loaded elastohydrodynamic contacts and non-
Newtonian effects. Nevertheless, it is generally agreed that for full-film lubrication, Λ
should be greater than 3 in journal bearings (Spikes [22]).
In the present article, the transition point is taken to be Λ = 3. We now apply two
approaches to estimate lift-off speed corresponding to the experimental results.
Vogelpohl’s empirical equation for predicting the lift-off speed reads:
VCWNT
T µ= (1.3)
where W is the bearing load in pound; µ is viscosity in microreyn; TC denotes a factor
related to the oil flow and such geometric quantities as clearance and minimum oil
thickness; TC =1/4 for most applications; V is defined as bearing volume ( ) 4LD2π= in
inch3.
Alternatively, the minimum film thickness equation can be directly obtained from
the numerical solution to the Reynolds equation (Khonsari & Booser [25]). Fitting an
equation to cover high eccentricity values range for different L/D ratios results in the
following equation for an iso-viscous Newtonian lubricant:
11
( ) SD/L678.4C
h 044.1min = (1.4)
Solving for the Sommerfeld number yields:
( ) 044.1min
DLC678.4h
S = (1.5)
The minimum film thickness hmin can be calculated by the definition of Λ:
( ) 212
b2
amin RRh +×Λ= (1.6)
It is assumed that Λ = 3. For Gaussian distribution of the summits, Ra and Rb are 1.25
times of the average roughness.
After hmin is determined, equation (1.6) is employed to obtain S. Combining with
equation (1.1), the lift-off speed can be determined by
( )2044.1
212
b2
aLT
CRs
DLC678.4
RRP60N
⎟⎠⎞
⎜⎝⎛µ⎟
⎠⎞
⎜⎝⎛
+Λ= (1.7)
Assuming that the viscosity-temperature relation obey the Walther equation [25]
( ) TlogBA7.0loglog −=+ν (1.8)
where A and B are constants for any given oil. The viscosity at 500C and 600C can be
estimated from known charts [26].
The lift-off speed for SAE30 oil from equations and experiments are tabulated in
Table 1.7. The experimental data for 543 N, 667 N, 890 N loads with 500C and 600C inlet
oil temperature are not available. So the prediction of the lift-off speed for those cases is
left blank.
It can be seen from the table that the calculated lift-off speed from two approaches
are comparable.

12
Table 1.7- Prediction of the lift-off speed and comparison to experiment
Load
(N)
Lift-off speed (rpm)
Vogelpohl (eq. 1.2)
Lift-off speed (rpm)
Equation (1.7)
Lift-off speed (rpm)
Experiment
400C 500C 600C 400C 500C 600C 400C 500C 600C
445 46 68 99 49 73 106 55 68 90
543 56 --- --- 60 --- --- 68 --- ---
667 69 --- --- 74 --- --- 95 --- ---
890 92 --- --- 98 --- --- 115 --- ---
1.3. Discussion
It is noticed that when the load is relatively small, its effect on the shift of the lift-off
speed does not obey the rule that they are directly proportional. For instance, the lift-off
speed is around the same (46 rpm) for both 222 N and 445N loads (Figure 1.2). To
examine this phenomenon, an additional test of 98 N load is performed.
0 100 200 300 400 500
Velocity (rpm)
0.000
0.050
0.100
0.150
0.200
0.250
Fric
tion
coef
fici
ent
Load effect at 40 0 C oil
98 N222 N445 N
Figure 1.5 Load effect with SAE30 oil

13
In Figure 1.5, the lift-off speeds of these three loads almost overlap. Similar trends
also exist in Vogelpohl’s and Stribeck’s experiments. According to equation (1.2), when
the load is nil, the required lift-off speed is very small. Nevertheless, at a near zero
velocity like 2 rpm, a continuous oil film cannot be developed [14]. The authors’
deduction is that no matter how small the load is, the shaft speed must be big enough to
establish a continuous oil film. Quantitative analysis is beyond the scope of this paper.
In Figure 1.4, when the load is 890 N, the Stribeck curve presents some curvature in
mixed lubrication regime. One cannot find this curvature in other reported results. SAE
5W30 is a multigrade oil and uses polymeric additives to improve its viscosity index (VI-
improver) and this phenomenon is more pronounced in its tests. Equation (1.7) is derived
based on iso-viscous solution of Reynolds’ equation. The experimental results of
SAE5W30 oil do not fit equation (1.7) well.
1.4. Conclusions
The shift of the Stribeck curve is examined in terms of varying load, oil
temperature, and oil type. Increasing oil temperature and load shifts the lift-off speed to
the right. In mixed or boundary lubrication regime, a higher temperature creates a greater
friction coefficient, while in the full-film lubrication regime, the opposite is true. A
higher load causes a smaller friction coefficient in the full-film lubrication regime. It is
also shown that an equation derived based on the numerical solution of the finite
Reynolds equation can effectively predict the lift off speed.
1.5. Nomenclature
A constant in viscosity-temperature relation
B constant in viscosity-temperature relation
C radial clearance, m

14
TC factor related to the oil flow and geometric quantities
D shaft diameter, m
f coefficient of friction
minh minimum film thickness, m
L bearing length, m
TN lift-off speed, rpm
LP projected load, N
aR rms of the shaft surface roughness, µm
bR rms of the bearing surface roughness, µm
Rs shaft radius, m
S Sommerfeld number
T temperature, 0C
V bearing volume, m3
W load, N
µ dynamic viscosity, Pa.s
ν kinematic viscosity, cSt
Λ film thickness parameter
15
CHAPTER 2 THE STRIBECK CURVE: EXPERIMENTAL RESULTS AND THEORETICAL PREDICTION
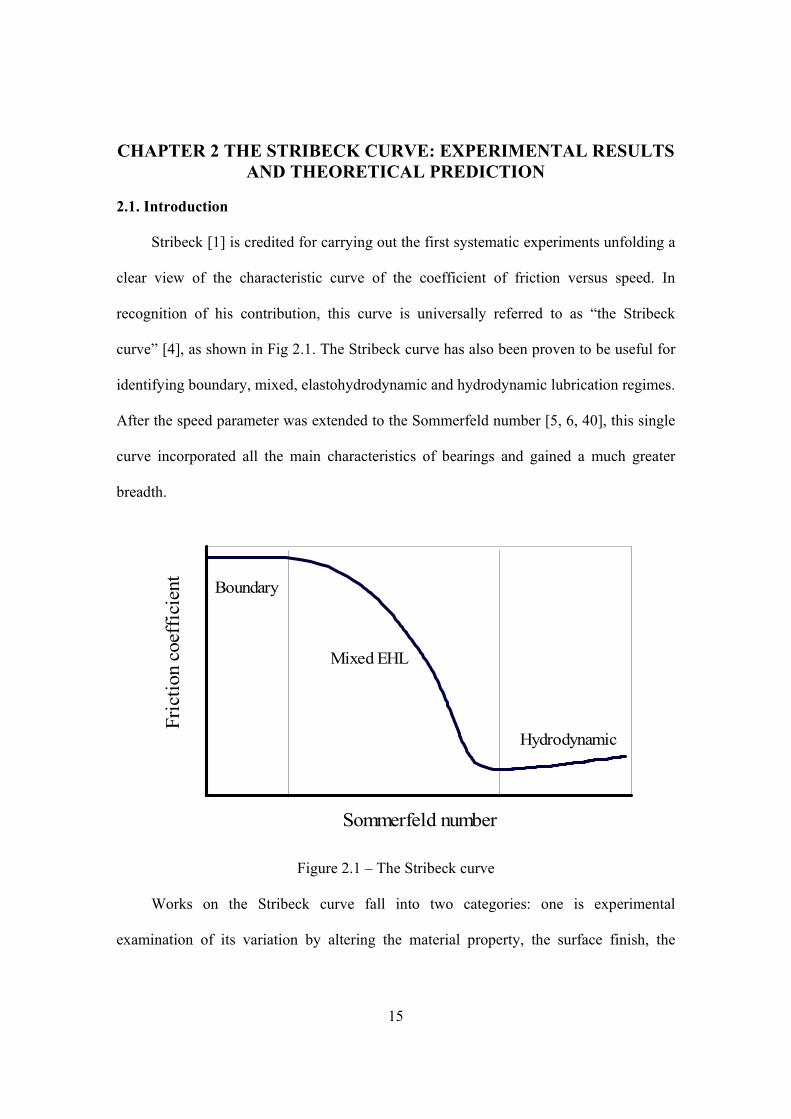
2.1. Introduction
Stribeck [1] is credited for carrying out the first systematic experiments unfolding a
clear view of the characteristic curve of the coefficient of friction versus speed. In
recognition of his contribution, this curve is universally referred to as “the Stribeck
curve” [4], as shown in Fig 2.1. The Stribeck curve has also been proven to be useful for
identifying boundary, mixed, elastohydrodynamic and hydrodynamic lubrication regimes.
After the speed parameter was extended to the Sommerfeld number [5, 6, 40], this single
curve incorporated all the main characteristics of bearings and gained a much greater
breadth.
Sommerfeld number
Fric
tion
coef
fici
ent
Boundary
Mixed EHL
Hydrodynamic
Figure 2.1 – The Stribeck curve
Works on the Stribeck curve fall into two categories: one is experimental
examination of its variation by altering the material property, the surface finish, the

16
viscosity of the oil, and the operating condition; the other is theoretical exploration of its
behavior which parallels the development of the modeling of mixed lubrication.
The term “mixed friction” first appeared in the literature early in the 1930s [41]. It
evolved into “mixed or quasi-hydrodynamic lubrication” in 1966 [42]. Mixed lubrication
commonly defines a lubrication state in which both fluid film and asperity contact exist to
support the applied load. However, a thorough understanding of this lubrication state still
remains rudimentary. Its progress heavily relies on the breakthrough of knowledge in two
areas: an integrative knowledge of fluid film and boundary lubrication, and a sufficient
recognition of the stochastic property of rough surface interaction. The year 1966
witnessed a major stride on the statistical analysis of rough surface contact by
Greenwood and Williamson [43]. Meanwhile, elastohydrodynamic lubrication attracted
the focus of a number of researchers’ attention. These preliminaries paved the way to
probing into the depth of mixed lubrication.
The modeling of mixed lubrication is bifurcated into pursuing a full solution of
pressure distribution and film thickness of rough surfaces, researched by Cheng [44] and
Chang [45]; and modeling the load sharing between hydrodynamic pressure and asperity
contact pressure of rough surfaces, pioneered by Johnson [46] and Tallian [47]. The
concept of load sharing is relatively straightforward, hence it gains popularity.
Circa 1926, Karelitz [48] was probably the first researcher who formulated the load
sharing relationship CH PPP += . Thereafter, Fuller [49], Lenning [50], Tsao [51], Soda
[52, 53] and Yamaguchi [54] continued to apply this basic concept to improve on the
modeling of mixed lubrication regime. More recently, Gelinck [55, 56] proposed a mixed
elastohydrodynamic lubrication model by taking advantage of the Moes’ central film
thickness equation and Greenwood’s asperity contact pressure expression, including

17
Johnson’s concept of applying a scaling factor γ to hydrodynamic component. This
model successfully predicted the trend of the Stribeck curve.
In the present paper, we present the Stribeck curves of a series of experiments under
various oil inlet temperatures and loads. The results are compared with the simulations of
the Stribeck curves using the approach presented in [55, 56]. The theoretical verifications
presented in this paper pertain to mixed lubrication and EHL regimes where the Bair-
Winer model is adopted to describe the shear stress of the lubricant. The theoretical
analysis, therefore, provide a simple, but realistic model, for prediction of the bearing
behavior before lift off occurs. Simplicity in the treatment of friction is often required in
precision control industry for development of rapid friction compensation algorithms; see
Olsson [57]. More complicated mixed-lubrication models have been developed by Wang
[58, 59] and Liu [60].
2.2. Theoretical
2.2.1 Friction Expression
The total normal load TF is shared by the hydrodynamic lifting force HF and the
asperity interacting force CF . Consequently,
CHT FFF += (2.1)
Applying Johnson’s concept of scaling factors [47], Eq. (2.1) can be rewritten as
21 γγTT
TFFF += (2.2)
where 1γ and 2γ are the scaling factors for hydrodynamic part and asperity contact part
respectively, which can be simplified as:
21
111γ
+γ
= (2.3)

18
Similarly, the total friction force is the sum of two components
C,fH,ff FFF += (2.4)
where H,fF is the hydrodynamic friction force given by the following expression
∫∫τ=HA
HHH,f dAF (2.5)
where Hτ represents the shear stress and HA is the contact area of the fluid.
The expression for H,fF is derived based on the Bair-Winer model [61]. The equivalent
viscosity ∗η for this model is [62]:
( )λ−∗ −λ
η=η e11 (2.6)
where
Lτγη
=λ (2.7)
The limiting shear stress Lτ varies in accordance to pressure described by
m00LL pβ+τ=τ (2.8)
where 0Lτ is the limiting shear stress at ambient pressure, 0β is the slope of the limiting
shear stress-pressure relation, and mp is the mean pressure of Hertzian contact.
The traction force per unit length lF is determined by integrating the shear stress
dxdxFl γη=τ= ∫ ∫ ∗ (2.9)
The separation of two rough surfaces is assumed to be constant and equal to the central
film thickness ch . By incorporating Eqs. (2.6) and (2.7) into Eq. (2.9), lF reads:

19
a2e1F L
chu
Ll ⋅
⎟⎟⎟⎟
⎠
⎞
⎜⎜⎜⎜
⎝
⎛
−τ±= τ
⎟⎟⎠
⎞⎜⎜⎝
⎛±η
−
(2.10)
where a is the half width of Hertzian contact. Taking the “+” sign, the hydrodynamic
friction force H,fF is represented as
aB2e1F L
chu
LH,f ⋅
⎟⎟⎟⎟
⎠
⎞
⎜⎜⎜⎜
⎝
⎛
−τ= τ
⎟⎟⎠
⎞⎜⎜⎝
⎛η
−
(2.11)
with B the bearing length and u the shaft velocity. It is assumed that the oil viscosity η
obeys the Roelands’ formula [32]:
⎥⎥
⎦
⎤
⎢⎢
⎣
⎡
⎟⎟⎠
⎞⎜⎜⎝
⎛+−
∞⎟⎟⎠
⎞⎜⎜⎝
⎛ηη
η=η
Z
p
m
cp
11
00 (2.12)
where 0η is the oil viscosity at inlet temperature. Its value can be found in reference [26].
∞η is 6.315×10⁻⁵ Pa·s. pc is equal to 1.962×10⁸ Pa. The Roelands’ pressure-viscosity
index Z can be estimated from the lubricant’s viscosity (in centipoises) at 400 C and 1000
by using the following equation [63]:
( )[ ] ( )405.1
10040 FHH81.7Z −= (2.13)
where
( )( )( )( )
4040
100100
4040
H864.0885.0F200.1loglogH
200.1loglogH
−=+µ=+µ=
The parameter C,fF represents the asperity interacting friction force given by
20
∑ ∫∫=
τ=N
1i ACCC,f
iC
iidAF (2.14)
where iCτ denotes the shear stress, N represents the number of asperities, and
iCA is the
area of asperities in contact.
For a single asperity, the coefficient of friction iCf is:
i
i
iC
CC p
fτ
= (2.15)
Assuming that iCf is constant for all asperities, we arrive at the following relationship for
the friction force.
CC
N
i ACCC
N
i ACCCCf FfdApfdApfF
iC
ii
iC
iii=== ∑∫∫∑∫∫
== 11, (2.16)
where Cf is determined from experiments.
Hence, the coefficient of friction can be obtained from
T
ccH,f
T
f
FFfF
FFf
+== (2.17)
2.2.2 Elastohydrodynamic Component
Employing Moes’ equation [64], the central film thickness reads:
1ss
72
27
EP27
RP
s73
37
EI37
RIc HHHHH
−
⎥⎥
⎦
⎤
⎢⎢
⎣
⎡⎟⎠⎞
⎜⎝⎛ ++⎟
⎠⎞
⎜⎝⎛ +=
−−− (2.18)
where
⎟⎟
⎠
⎞
⎜⎜
⎝
⎛+=
⎟⎟⎠
⎞⎜⎜⎝
⎛−
RI
EI
HH
2
e8751s
with the following group of dimensionless parameters:
21
1RI M3H −=
51
EI M621.2H−
=
32
RP L287.1H =
43
81
EP LM311.1H−
=
21
'cc UhH
−
∑= ,Rhh c'
c =
21
WUM−
∑= , 41
GUL ∑=
RBEFW '
T= , REuU '
0η=∑ , 'EG α=
Applying Johnson’s concept of scaling factors, and substituting 1
'Eγ
for 'E , 1
TFγ
for
TF into these equations, it can be shown that
( ) ( ) ( ) ( )21
1
72
27
27
21
73
37
1514
137
2121
'
1
γγγγ
−
⎥⎥
⎦
⎤
⎢⎢
⎣
⎡⎟⎠⎞
⎜⎝⎛ ++⎟
⎠⎞
⎜⎝⎛ +=
−−−−−−
∑
ss
EPRP
ss
EIRI
s
c HHHHUh (2.19)
where
⎟⎟⎟
⎠
⎞
⎜⎜⎜
⎝
⎛+=
⎟⎟
⎠
⎞
⎜⎜
⎝
⎛⋅−
−
RI
EI
HH
es52
12
8751 γ
2.2.3 Asperity Contact Component
Greenwood and Williams’ model is adopted to calculate the interacting pressure of
asperities [43]. The appropriate expression is:
( ) ( )⎟⎟⎠
⎞⎜⎜⎝
⎛σβ
σβσ=
s23
'ss
xhFEn32xp (2.20)

22
where
( ) ( )( )
dsexhs21xhF
2
s
s212
3
xh ss23
−∞
σ
∫ ⎟⎟⎠
⎞⎜⎜⎝
⎛σ
−π
=⎟⎟⎠
⎞⎜⎜⎝
⎛σ
The distance between the mean plane through the summits and the mean plane through
the surface heights is dd . Because the latter is taken as the reference plane for the
hydrodynamic component in the current calculation, dd is subtracted by the separation of
rough surfaces ( )xh . According to Whitehouse and Archard [65], dd is
approximately s15.1 σ . Therefore the central contact pressure of an asperity can be
expressed as:
⎟⎟⎠
⎞⎜⎜⎝
⎛σ−
βσ
βσ=s
dc23
'ssc
dhFEn32p (2.21)
Gelinck [55] fitted the following expression to the central contact pressure:
( ) 443232 a
1a
aaa's
a'1hc Wna1pp ⎥⎦
⎤⎢⎣⎡ σ+= − (2.22)
where a1 = 1.558, a2 = 0.0337, a3 = -0.442, a4= -1.70, and hp represents the maximum
Hertzian pressure of line contact:
'
'T
h BR2EFp
π=
Combining Eqs. (2.21) and (2.22), we arrive at the following equation:
( ) 443232 a
1a
aaa's
a'1h
s
dc23
'ss Wna1pdhFEn
32
⎥⎦⎤
⎢⎣⎡ σ+=⎟⎟
⎠
⎞⎜⎜⎝
⎛σ−
βσ
βσ − (2.23)

23
Substituting 2
'Eγ
for 'E , 2
TFγ
for TF , and 2nγ for n into it, and making it dimensionless,
yields:
( )2
a1
aa2
aaa's
a'1'
s
'd
'c
23'T
's
's
' 1Wna1dhFFn32 44
23232
γ⎥⎦⎤
⎢⎣⎡ γσ+=⎟⎟
⎠
⎞⎜⎜⎝
⎛σ−
σσ − (2.24)
with the following group of dimensionless parameters:
Rdd
FEBR2F
R
RnRn
d'd
T
'''T
s's
'
=
π=
σ=σ
β=
Combining Eqs. (2.3), (2.19), and (2.24) provides the appropriate equations for
evaluating the unknown parameters 1γ , 2γ , ch . Substituting 2γ into Eq. (2.2), ch into Eq.
(2.11), together with Eqs. (2.16) and (2.17), enables one to determine the coefficient of
friction.
2.3. Experimental
Lewis LRI-8H tribometer is used for measuring the coefficient of friction of journal
bearings. Its detail has been described in §1.2, Chapter 1.
2.3.1 Bearing Properties and Operating Conditions
The shaft is made up of hardened AISI 1020 steel. The bushing is composed of SAE
660 alloy bronze. It is a high-quality smooth machine finish material and highly resistant
to impact, wear and corrosion. Their characteristics are tabulated in Table 2.1. The
properties of SAE30 oil are referred to Table 1.5. The applied loads are: 667 N (150 lb),
890 N (200 lb), 1112 N (250 lb). The range of speeds tested is between 2rpm to 500rpm.

24
Table 2.1- Bearing characteristics
Young’s Modulus
(GPa)
Poisson’s Ratio
Surface Roughness Ra
(µm)
Length (mm)
Shaft Diameter
(mm)
Bushing Inner
Diameter (mm)
shaft bushing shaft bushing shaft bushing25.4 24.54 24.71 209 100 0.29 0.33 0.05 0.2
2.3.2 Experimental Procedure
The same experimental procedure as in §1.2.1, Chapter 1 is followed.
2.4. Numerical Simulations
Three unknown parameters 1γ , 2γ and ch are included in three nonlinear Eqs. (2.3),
(2.19) and (2.24). Using Eq. (2.3), 1γ is expressed in terms of 2γ and substituted into Eq.
(2.19). The parameter ch is on the left side of Eq. (2.19) and can be substituted into Eq.
(2.24). Therefore, three equations are condensed into one nonlinear equation. The
bisection scheme is employed to solve it. An initial guess is made for 2γ . In the boundary
or mixed lubrication regime, asperity contact friction plays a major role so that 2γ is
taken as 1.0001. The speed range is divided into 1000 points.
2.5. Results and Discussion
Additional input parameters used in the simulations are provided in Table 2.2.
Table 2.2- Input parameters of simulation
Parameter Value n 2.5×10¹⁰ m-2
β 10×10-6 m σs 0.2×10⁻⁶ m E’ 1.50×10¹¹ Pa η0 0.0815 Pa·s β0 0.047 τL0 2.5×10⁶ Pa
25
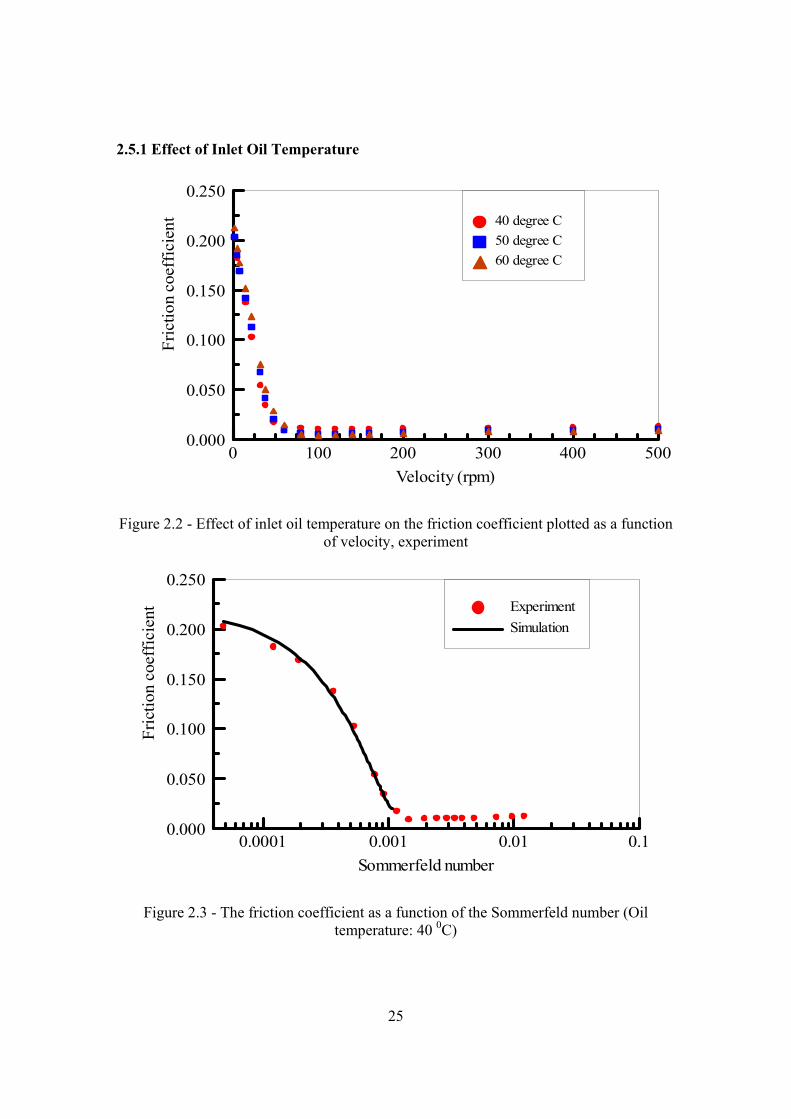
2.5.1 Effect of Inlet Oil Temperature
Velocity (rpm)0 100 200 300 400 500
Fric
tion
coef
ficie
nt
0.000
0.050
0.100
0.150
0.200
0.250
40 degree C50 degree C60 degree C
Figure 2.2 - Effect of inlet oil temperature on the friction coefficient plotted as a function of velocity, experiment
Sommerfeld number0.0001 0.001 0.01 0.1
Fric
tion
coef
ficie
nt
0.000
0.050
0.100
0.150
0.200
0.250ExperimentSimulation
Figure 2.3 - The friction coefficient as a function of the Sommerfeld number (Oil temperature: 40 0C)

26
Sommerfeld number0.0001 0.001 0.01
Fric
tion
coef
ficie
nt
0.000
0.050
0.100
0.150
0.200
0.250
ExperimentSimulation
Figure 2.4 - The friction coefficient as a function of the Sommerfeld number (Oil temperature: 50 0C)
Sommerfeld number0.00001 0.0001 0.001 0.01
Fric
tion
coef
ficie
nt
0.000
0.050
0.100
0.150
0.200
0.250
ExperimentSimulation
Figure 2.5 - The friction coefficient as a function of the Sommerfeld number (Oil temperature: 60 0C)
The effect of oil viscosity on the Stribeck curve can be demonstrated by varying the
inlet oil temperature, as shown in Figs. 2.2-2.5. 667 N load is applied.
27
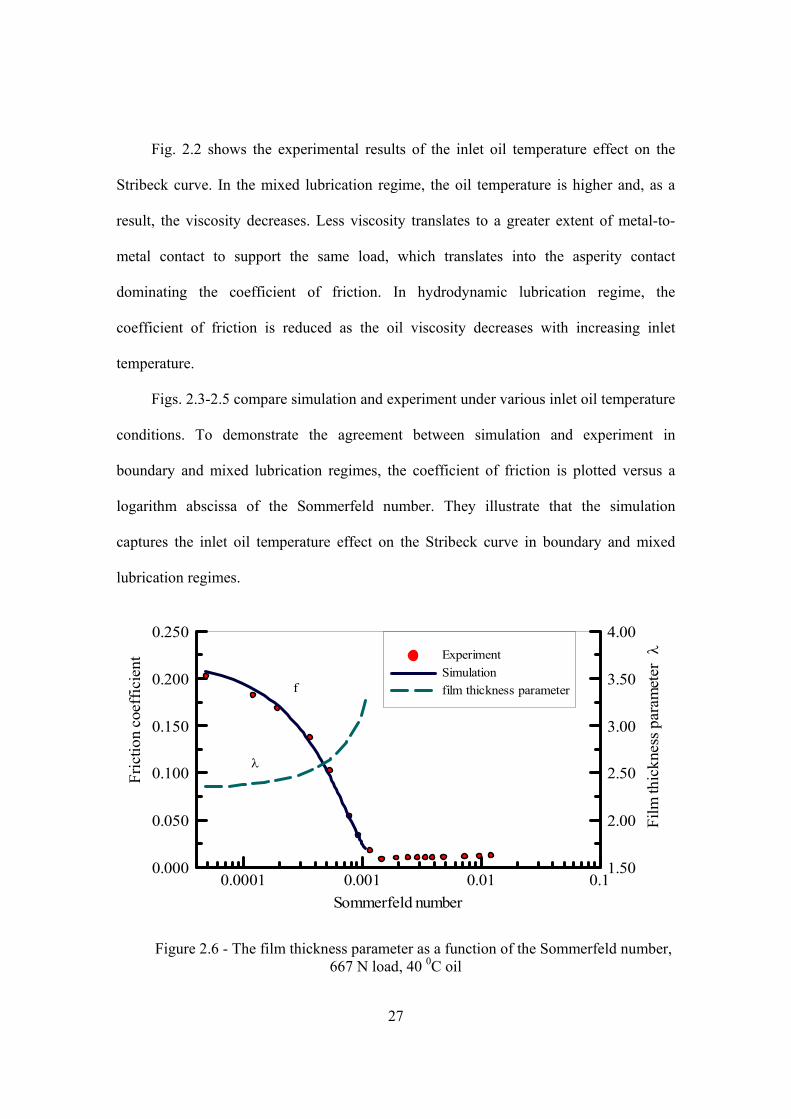
Fig. 2.2 shows the experimental results of the inlet oil temperature effect on the
Stribeck curve. In the mixed lubrication regime, the oil temperature is higher and, as a
result, the viscosity decreases. Less viscosity translates to a greater extent of metal-to-
metal contact to support the same load, which translates into the asperity contact
dominating the coefficient of friction. In hydrodynamic lubrication regime, the
coefficient of friction is reduced as the oil viscosity decreases with increasing inlet
temperature.
Figs. 2.3-2.5 compare simulation and experiment under various inlet oil temperature
conditions. To demonstrate the agreement between simulation and experiment in
boundary and mixed lubrication regimes, the coefficient of friction is plotted versus a
logarithm abscissa of the Sommerfeld number. They illustrate that the simulation
captures the inlet oil temperature effect on the Stribeck curve in boundary and mixed
lubrication regimes.
Sommerfeld number0.0001 0.001 0.01 0.1
Fric
tion
coef
ficie
nt
0.000
0.050
0.100
0.150
0.200
0.250Fi
lm th
ickn
ess p
aram
eter
λ
1.50
2.00
2.50
3.00
3.50
4.00
λ
f
ExperimentSimulationfilm thickness parameter
Figure 2.6 - The film thickness parameter as a function of the Sommerfeld number, 667 N load, 40 0C oil

28
Fig. 2.6 examines the variation of the film thickness parameter λ ( sch σ=λ ) with
the Sommerfeld number. λ = 3.3 at the lift-off speed, which is close to the widely
accepted value λ=3.
2.5.2 Effect of Load
Velocity (rpm)0 100 200 300 400 500
Fric
tion
coef
ficie
nt
0.000
0.050
0.100
0.150
0.200
0.250 667 N 890 N 1112 N
Figure 2.7 - Effect of load on the friction coefficient plotted as a function of velocity, experiment, 40 0C oil
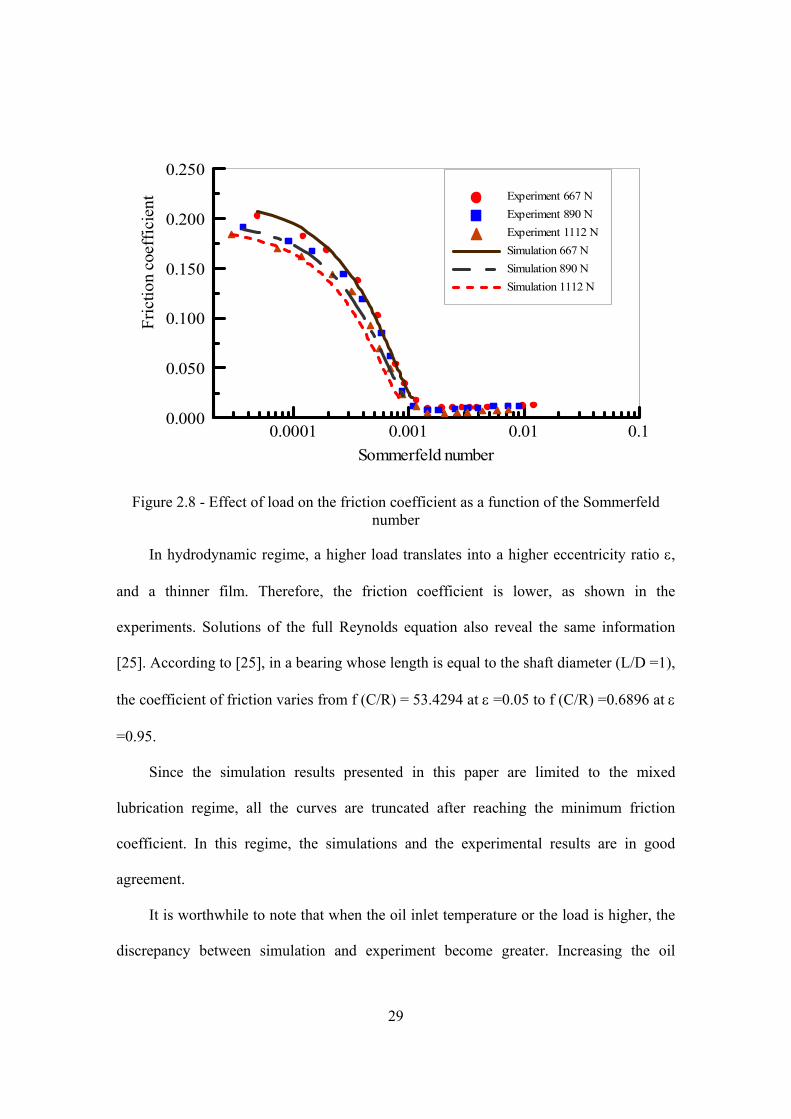
Figures 2.7-2.8 shows the results for the coefficient of friction as a function of
Sommerfeld number for different loads ranging from 667 N to 1112 N. The oil inlet
temperature is 40 0C. In the mixed lubrication regime, simulations successfully predict
that a light load creates a smaller coefficient of friction than does the heavy load. The
experimental results exhibit the same trend. The model is based on the load sharing
concept. When the imposed load is heavy, more metal-to-metal asperity contact occurs,
which creates a greater asperity friction and causes the coefficient of friction to increase.
29
Sommerfeld number0.0001 0.001 0.01 0.1
Fric
tion
coef
ficie
nt
0.000
0.050
0.100
0.150
0.200
0.250Experiment 667 NExperiment 890 NExperiment 1112 NSimulation 667 NSimulation 890 NSimulation 1112 N
Figure 2.8 - Effect of load on the friction coefficient as a function of the Sommerfeld number
In hydrodynamic regime, a higher load translates into a higher eccentricity ratio ε,
and a thinner film. Therefore, the friction coefficient is lower, as shown in the
experiments. Solutions of the full Reynolds equation also reveal the same information
[25]. According to [25], in a bearing whose length is equal to the shaft diameter (L/D =1),
the coefficient of friction varies from f (C/R) = 53.4294 at ε =0.05 to f (C/R) =0.6896 at ε
=0.95.
Since the simulation results presented in this paper are limited to the mixed
lubrication regime, all the curves are truncated after reaching the minimum friction
coefficient. In this regime, the simulations and the experimental results are in good
agreement.
It is worthwhile to note that when the oil inlet temperature or the load is higher, the
discrepancy between simulation and experiment become greater. Increasing the oil

30
temperature or the load tends to magnify the influence of thermal effect on the
performance of bearings. Additional factors that may affect the results include thermal
expansion and starvation effects.
2.6. Conclusions
The behavior of Stribeck curve is examined both theoretically and experimentally.
Employing the load sharing concept, a mixed elastohydrodynamic model using the Bair-
Winer constitutive equation is proposed. This model is based on the line contact
formulation and incorporates surface roughness, the pressure-viscosity, and the
temperature-viscosity effects. In the mixed lubrication regime, a higher lubricant
temperature creates a larger friction coefficient, while in the full-film lubrication regime,
the opposite is true. The model effectively predicts the friction behavior in the mixed
lubrication regime.
2.7. Nomenclature
a half width of Hertzian contact = BERF8 ''T π , m
A contact area, m2
B bearing length, m
C radial clearance, m
pc constant, 1.962×10⁸ Pa
dd distance between mean line of asperities and mean line of surface, m
E modulus of elasticity for shaft, Pa
bE modulus of elasticity for bushing, Pa
'E equivalent modulus of elasticity, = ( ) ( )( )b
22 E1E12 bν−+ν− , Pa
C,fF friction force from asperity interaction, N
31
H,fF hydrodynamic friction force, N
f coefficient of friction
h film thickness, m
n density of asperities, 1/m2
TN shaft velocity, revolution per second
p pressure, Pa
hp maximum Hertzian pressure, Pa
mp mean Hertzian pressure = aB2FT , Pa
F,P load, N
LP projected load, = ( )RBP 2 , Pa
R shaft radius, m
bR bushing radius, m
'R equivalent radius, = ( )RRRR bb − , m
S Sommerfeld number, = ( ) LT PCRN /2η
u effective velocity, m/s
Z pressure-viscosity index
α pressure-viscosity coefficient, 1/Pa
β average radius of asperities, m
0β slope of the limiting shear stress-pressure relation, 0.047
γ scaling factor
γ shear strain rate, 1/s
λ film thickness parameter
32
η dynamic viscosity, Pa·s
0η dynamic viscosity at zero pressure and 400 C temperature, Pa·s
∞η constant, 6.315×10⁻⁵ Pa·s
µ kinematic viscosity, m2/s
ν Poisson’s ratio for shaft
bν Poisson’s ratio for bushing
sσ standard deviation of asperities, m
τ shear stress, Pa
Lτ limiting shear stress, Pa
0Lτ limiting shear stress at ambient pressure, Pa
Subscripts
c central
C, 2 Asperity component
f friction
H, 1 Hydrodynamic component
T total or normal
33
CHAPTER 3 AN EXPERIMENTAL INVESIGATION OF GREASE-LUBRICATED JOURNAL BEARINGS
3.1. Introduction
Grease is widely used in journal bearings that are tasked to function under relatively
low to moderate speeds but heavily loaded operating conditions. Compared to
conventional oils, grease offers some advantages in terms of enhanced stability, reduced
maintenance requirements, and considerably lower leakage rate. While in typical
applications the contact is starved of bulk grease, the base oil is released from bulk grease
outside the contact either by hydrodynamic pressure or by soap structure shrinking. This
grease replenishment mechanism will serve to maintain a lubricating film in the contact
track [66-71]. This mechanism allows for a longer service life [72]. Moreover, experience
shows that in boundary or mixed lubrication regime, a grease-lubricated journal bearing
performs better than an oil-lubricated one [73-75]. Another advantage is that the
dimensions of a greased-lubricated bearing are smaller than that of an oil-lubricated
bearing with the identical load capacity [76], and there is no need for an elaborate oil
supply system.
Despite its extensive use, the underlying lubrication mechanism of grease is still
poorly understood [77, 78]. The paucity of available literature stems from the complexity
of behavior of grease and its non-Newtonian response to shear.
One of the early attempts at understanding the general nature of grease lubrication is
the experimental studies reported by Westcott [79] who tested a number of greases under
a variety of conditions and was published in 1913. Westcott presented results for the
history of the coefficient of friction versus time and temperature. His experiments
showed that grease was suitable as a general lubricant. Cohn [80] measured the film
34
pressure in grease lubrication. Chakrabarti [81] concluded that lithium greases could be
treated as a Bingham plastic. In his article, the friction torque was empirically expressed
in terms of the yield stress, the plastic viscosity, the speed, the load, and the clearance.
Unfortunately the relationship between the friction coefficient and those factors was not
clarified. Bradford’s work [73] on a cast bronze half-bearing made further advancement.
He plotted the friction coefficient versus the so-called Hersey number. But the lubrication
regime was restricted to hydrodynamic part. A pressure-velocity limitation chart was
established by Glaeser [82] from design point of view. With some additive like PTFE, the
performance of grease-lubricated journal bearing was improved [83] and facilitated the
application of grease to spiral-groove bearings [84].
Theoretical studies on the behavior of grease began with calculation of pressure
distribution by Lawrence [85]. Milne [86] analyzed the performance of a simple slider
bearing with complete core formation. Wada [87-90] and Hayashi [91] devoted
considerable attention to grease lubrication of journal bearings. They introduced a
“nonlinear factor” into the Reynolds equation to characterize the behavior of a pseudo-
plastic type grease. Tichy [92] presented a modified Reynolds equation for Bingham
plastic. More recently, papers dealing with the EHL aspects [93-95] and grease-lubricated
bearings with consideration of thermal effect [96] have been published.
A review of the open literature reveals that the transition of the regimes of grease
lubrication in bearings has not been studied. Given that many grease lubricated bearings
operate in oscillatory or intermittent fashion, it is essential to examine the transition of
grease lubrication. In the current paper, a series of experimental results is presented to
emphasize the transition and describe the friction characteristic of grease-lubricated
journal bearings. Also presented in this paper are the prediction results of a mixed
35
elastohydrodynamic lubrication model for line contacts to estimate the coefficient of
friction in mixed lubrication regime.
3.2. Experimental
Lewis LRI-8H tribometer is used for measuring the coefficient of friction of journal
bearings. Its detailed description is available in §1.2, Chapter 1. Briefly, the machine is
capable of measuring the friction coefficient under varying operating conditions such as
load, speed, and temperature. Load is applied through a level mechanism. The friction
force is sensed by a measuring cell and data are continuously recorded into a computer
via an automated data acquisition system.
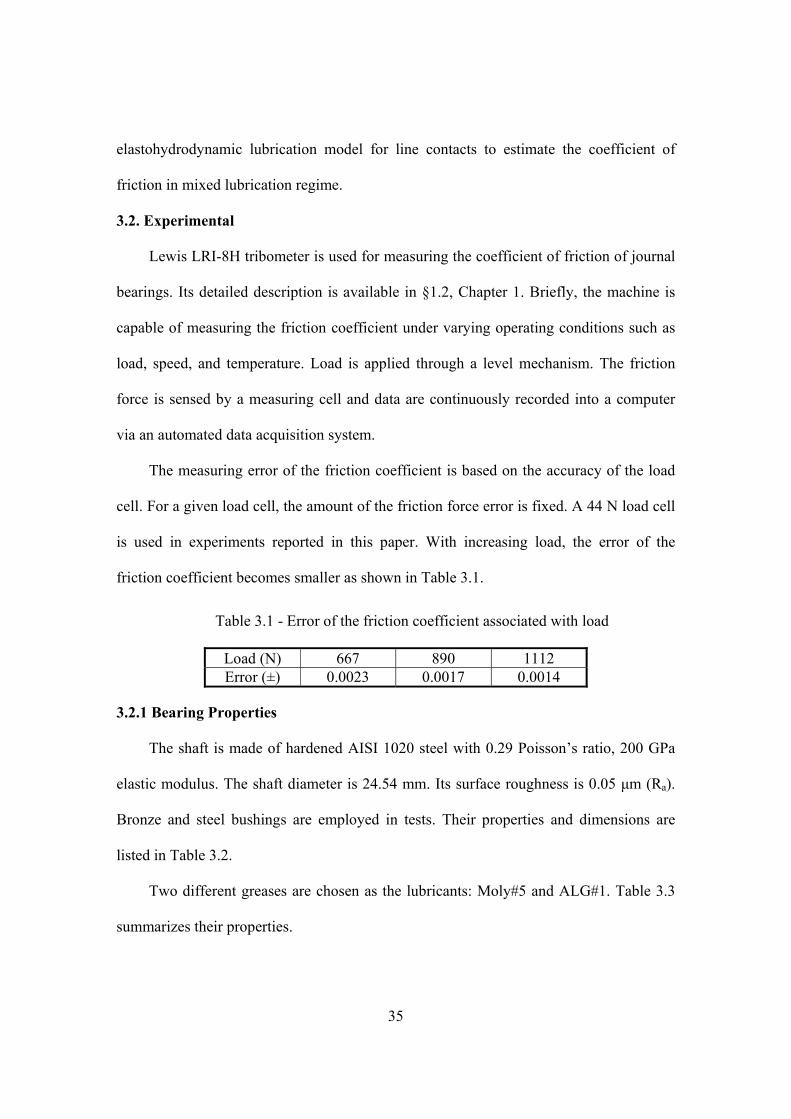
The measuring error of the friction coefficient is based on the accuracy of the load
cell. For a given load cell, the amount of the friction force error is fixed. A 44 N load cell
is used in experiments reported in this paper. With increasing load, the error of the
friction coefficient becomes smaller as shown in Table 3.1.
Table 3.1 - Error of the friction coefficient associated with load
Load (N) 667 890 1112 Error (±) 0.0023 0.0017 0.0014
3.2.1 Bearing Properties
The shaft is made of hardened AISI 1020 steel with 0.29 Poisson’s ratio, 200 GPa
elastic modulus. The shaft diameter is 24.54 mm. Its surface roughness is 0.05 µm (Ra).
Bronze and steel bushings are employed in tests. Their properties and dimensions are
listed in Table 3.2.
Two different greases are chosen as the lubricants: Moly#5 and ALG#1. Table 3.3
summarizes their properties.
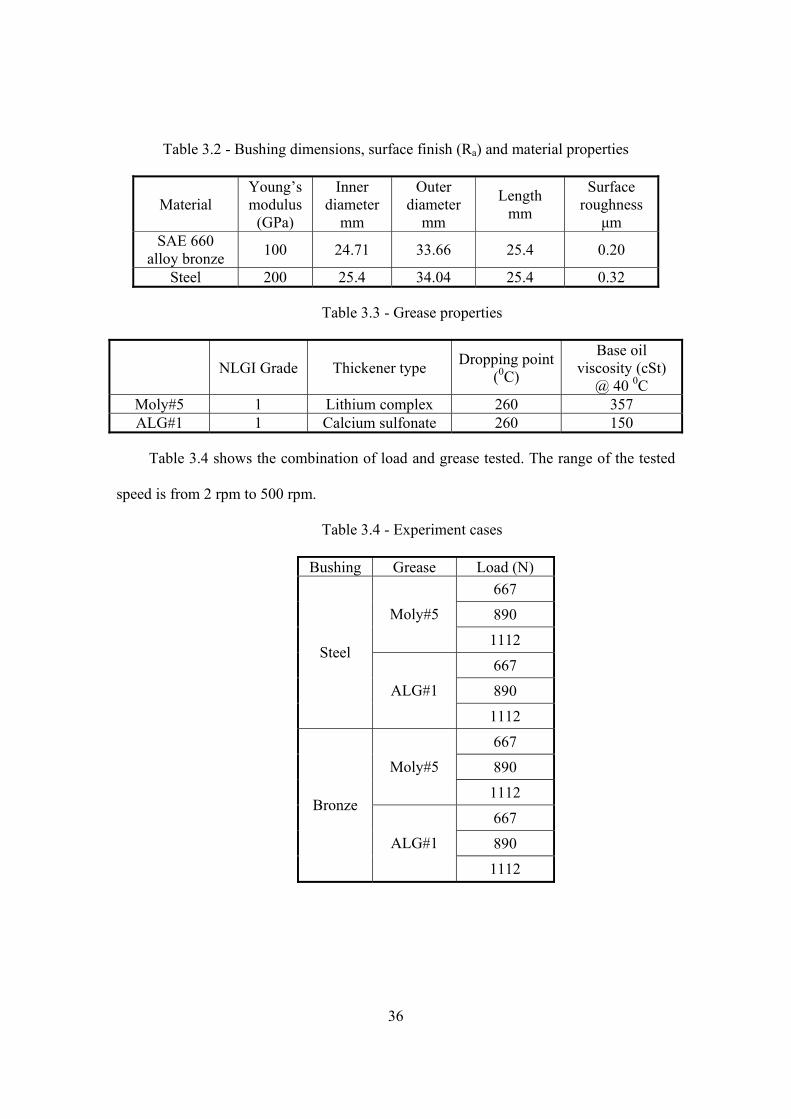
36
Table 3.2 - Bushing dimensions, surface finish (Ra) and material properties
Material Young’s modulus
(GPa)
Inner diameter
mm
Outer diameter
mm
Length mm
Surface roughness
µm SAE 660
alloy bronze 100 24.71 33.66 25.4 0.20
Steel 200 25.4 34.04 25.4 0.32
Table 3.3 - Grease properties
NLGI Grade Thickener type Dropping point (0C)
Base oil viscosity (cSt)
@ 40 0C Moly#5 1 Lithium complex 260 357 ALG#1 1 Calcium sulfonate 260 150
Table 3.4 shows the combination of load and grease tested. The range of the tested
speed is from 2 rpm to 500 rpm.
Table 3.4 - Experiment cases
Bushing Grease Load (N) 667 890 Moly#5
1112
667
890
Steel
ALG#1
1112
667 890 Moly#5
1112
667 890
Bronze
ALG#1
1112
37
3.2.2. Experimental Procedure
Before recording measurement data, the system is balanced so that the coefficient of
friction is nil when the shaft is at static position. The system is run-in for two hours at the
running speed of 100 rpm and the load of 667 N. A computerized data acquisition system
allows monitoring the history of the coefficient of friction at each running speed. The
friction coefficient tends to oscillate periodically around a relatively constant value. The
rms value of the history is taken as the coefficient of friction for that speed. By
observation, a testing period of four minutes is regarded to be a reasonable testing period
for each velocity. After each test is completed, the system is given enough time, typically
two hours, to cool down before conducting the next test.
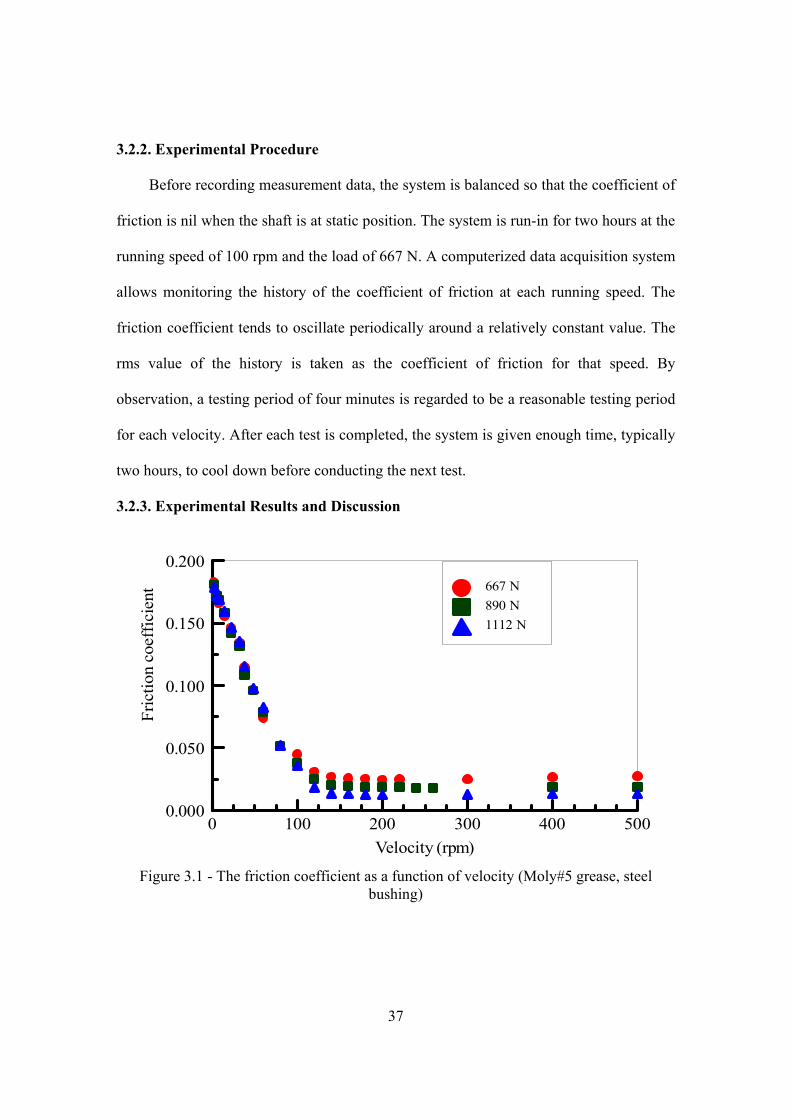
3.2.3. Experimental Results and Discussion
Velocity (rpm)0 100 200 300 400 500
Fric
tion
coef
ficie
nt
0.000
0.050
0.100
0.150
0.200 667 N 890 N 1112 N
Figure 3.1 - The friction coefficient as a function of velocity (Moly#5 grease, steel
bushing)
38
Velocity (rpm)0 100 200 300 400 500
Fric
tion
coef
ficie
nt
0.000
0.050
0.100
0.150 667 N 890 N 1112 N
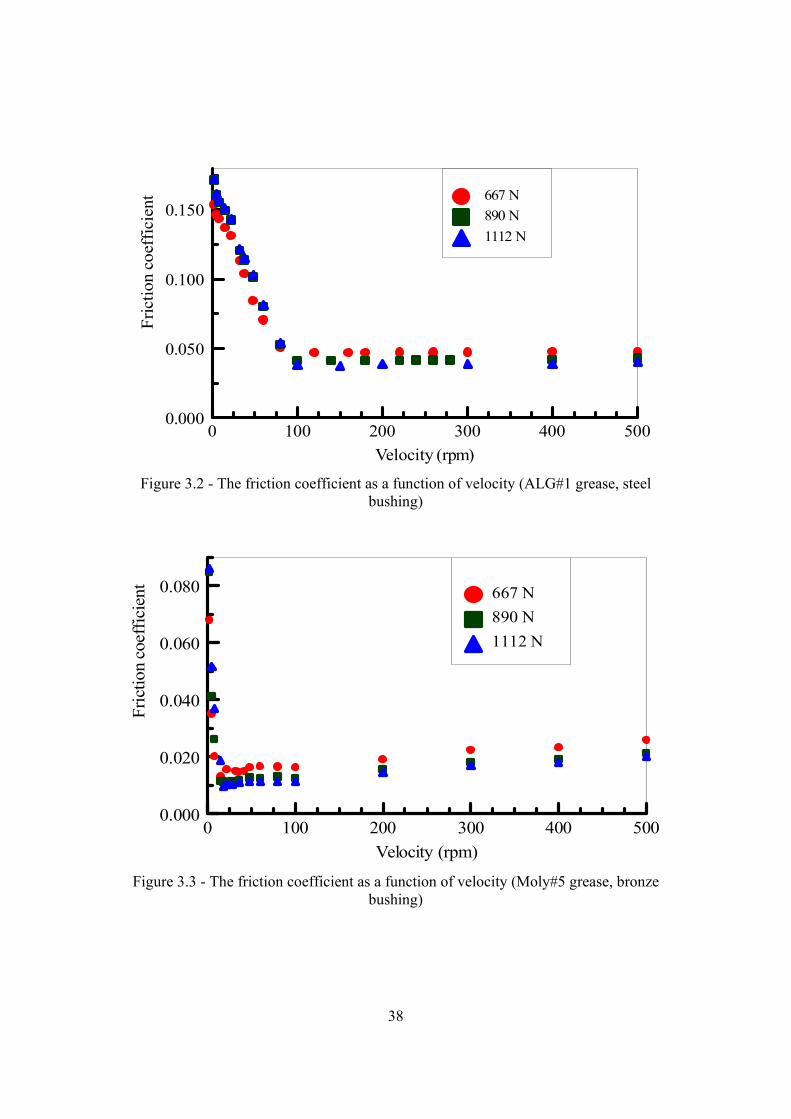
Figure 3.2 - The friction coefficient as a function of velocity (ALG#1 grease, steel
bushing)
Velocity (rpm)0 100 200 300 400 500
Fric
tion
coef
ficie
nt
0.000
0.020
0.040
0.060
0.080 667 N890 N1112 N
Figure 3.3 - The friction coefficient as a function of velocity (Moly#5 grease, bronze
bushing)

39
Velocity (rpm)0 100 200 300 400 500
Fric
tion
coef
ficie
nt
0.000
0.020
0.040
0.060
0.080
0.100667 N890 N1112 N
Figure 3.4 - The friction coefficient as a function of velocity (ALG#1 grease, bronze
bushing)
Figures 3.1-3.4 display the experimental results of twelve cases, also summarized in
Table 3.4. The results reveal that in each case there exists a distinct minimum friction
coefficient point which marks the transition between mixed lubrication and
hydrodynamic lubrication. In the hydrodynamic regime, increasing the load tends to
reduce the friction coefficient. This trend remains the same for oil lubricated bearings as
well [97]. A heavier load translates to a bigger eccentricity and a thinner film thickness,
which produces a smaller friction coefficient. Numerical solutions of Reynolds equation
for a finite oil-lubricated journal bearing also reveal the same information. According to
[25], in a bearing whose length is equal to the shaft diameter (B/D =1), the value of f
(C/R) varies from 53.4294 at ε =0.05 to 0.6896 for ε =0.95, where f is the coefficient of
friction; C is the radial clearance; and R is the radius of the journal.
In the hydrodynamic lubrication regime, the friction coefficient drops almost
linearly with increasing load at a specific velocity. The load is increased by 222 N evenly
40
from 667 N, to 890 N, to 1112 N. For example, at the speed of 300 rpm, the friction
coefficient decreases respectively by 0.0068 and 0.0053 in Fig. 3.1; by 0.0057 and 0.0030
in Fig. 3.2; by 0.0043 and 0.0011 in Fig. 3.3; by 0.0180 and 0.0204 in Fig. 3.4. The
variation of the friction coefficient reflects a change in the lubricant film thickness. With
increasing load, the film thickness becomes thinner. The load effect on the film thickness
becomes more distinctive in the case of less viscous lubricant (ALG#1 grease) and more
elastic and a bushing of smoother surface finish (bronze), as shown in Fig. 3.4.
In boundary or mixed lubrication regime, a higher load produces a greater friction
coefficient. Mixed lubrication is a lubrication state in which the load is supported by both
fluid pressure and asperities. When the load becomes greater, more metal-to-metal
asperity contact occurs and brings about a rise in the friction coefficient.
To probe further into the frictional characteristics of grease, it is useful to borrow
the concept of dimensionless Sommerfeld number from the well-established principles of
hydrodynamic lubrication theory. Let us introduce a “grease-Sommerfeld number”
defined as:
2
⎟⎠⎞
⎜⎝⎛×
=CR
PNS
L
sBOη (3.1)
where BOη is the viscosity of the grease base oil; sN is the shaft velocity (rev/s); LP is
the projected load RBWPL 2
= ; R is the shaft radius; C is the radial clearance
2RRC b −= . Applying this definition to the cases of steel bushing and Moly#5 grease
(the base oil viscosity: 357 cSt), the coefficient of friction is plotted against the grease-
Sommerfeld number as in Fig. 3.5, where the base oil viscosity is used in calculating the

41
Sommerfeld number. This figure reveals a shape similar to the friction characteristic of
oil-lubricated journal bearings.
Sommerfeld number0.00001 0.0001 0.001 0.01
Fric
tion
coef
ficie
nt
0.000
0.050
0.100
0.150
0.200 667 N 890 N 1112 N
Figure 3.5 - The friction coefficient as a function of Sommerfeld number (Moly#5 grease, steel bushing)
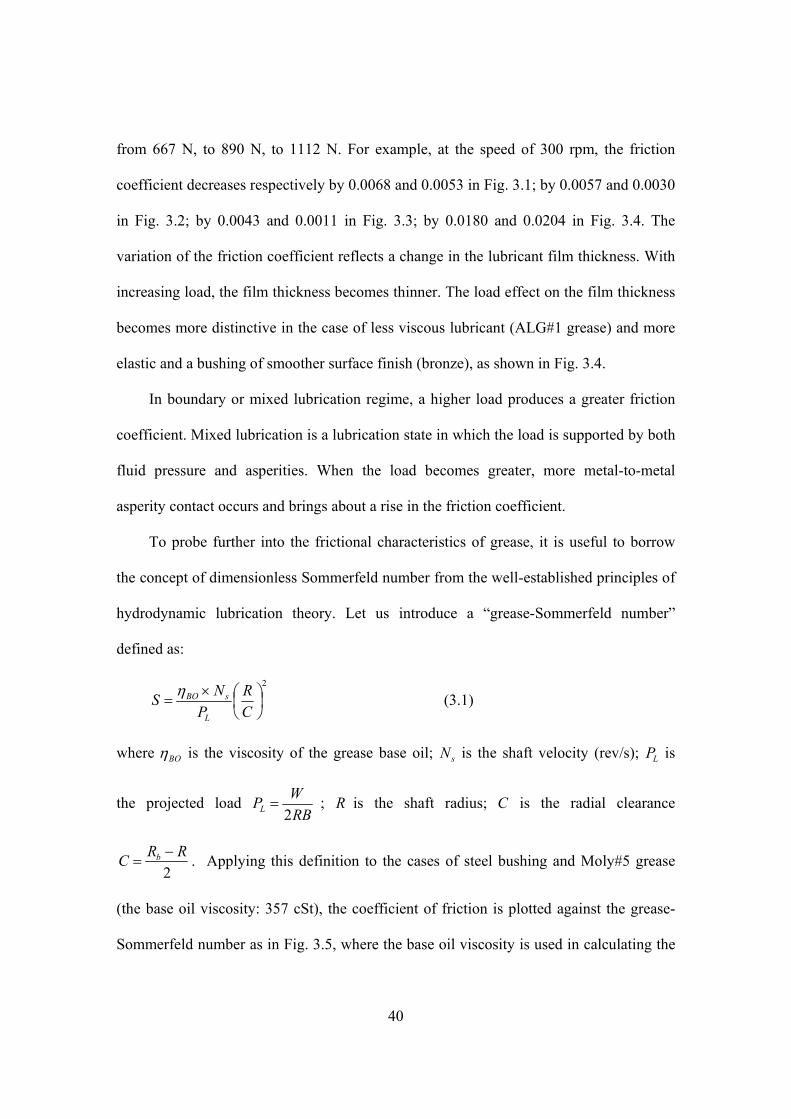
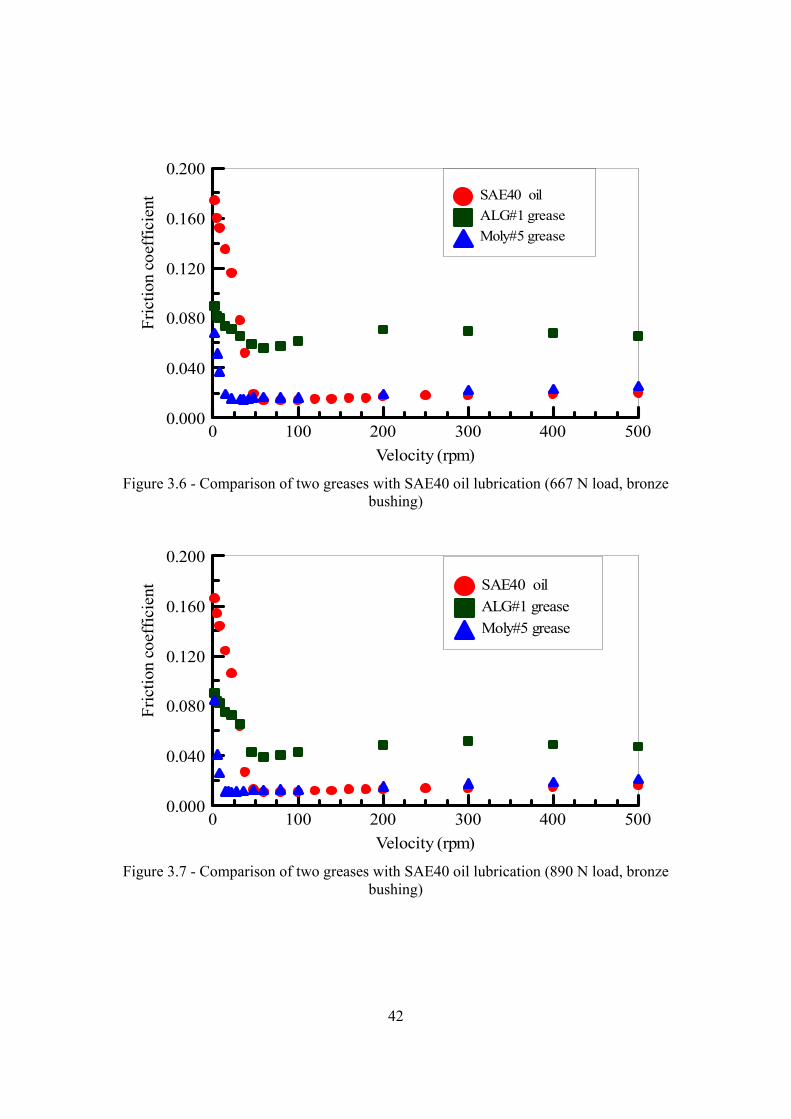
3.2.4. Comparison with Oil Lubrication
Since the frictional characteristic of the grease lubricated bearings exhibits a similar
trend to the Stribeck curve for oil, it is natural to compare their characteristics. SAE40 oil
is chosen to make the comparison, for its viscosity at 400C is 150 cSt which is identical to
that of the base oil of ALG#1 grease. The results are shown in Figs. 3.6-3.8.
Clearly, in the boundary or mixed lubrication regimes, the friction coefficient with
grease is lower than that of oil. Horth [74] added various percentage of soap into the base
oil to formulate different greases and obtained the same conclusion. The viscosities of the
base oils are 150 cSt for ALG#1 grease and 357 cSt for Moly#5 grease. At low speeds
42
Velocity (rpm)0 100 200 300 400 500
Fric
tion
coef
ficie
nt
0.000
0.040
0.080
0.120
0.160
0.200SAE40 oilALG#1 greaseMoly#5 grease
Figure 3.6 - Comparison of two greases with SAE40 oil lubrication (667 N load, bronze
bushing)
Velocity (rpm)0 100 200 300 400 500
Fric
tion
coef
ficie
nt
0.000
0.040
0.080
0.120
0.160
0.200
SAE40 oilALG#1 greaseMoly#5 grease
Figure 3.7 - Comparison of two greases with SAE40 oil lubrication (890 N load, bronze
bushing)
43
Velocity (rpm)
0 100 200 300 400 500
Fric
tion
coef
ficie
nt
0.000
0.050
0.100
0.150
0.200
SAE40 oilALG#1 greaseMoly#5 grease
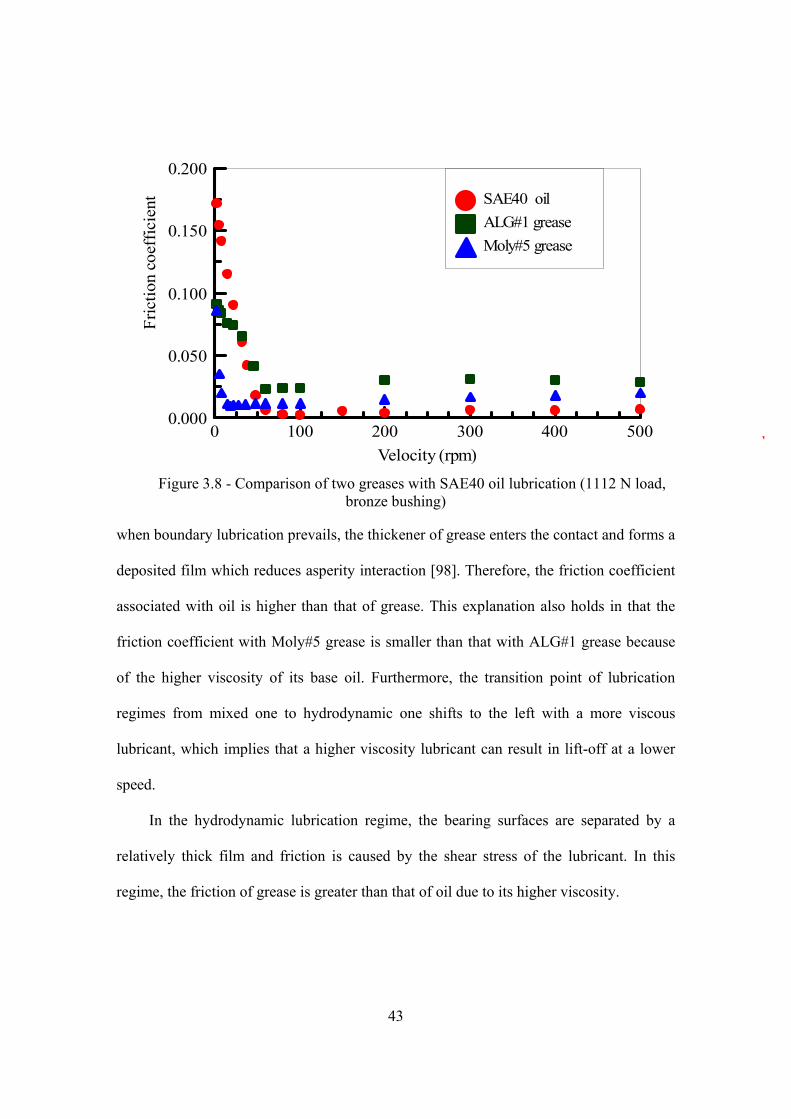
Figure 3.8 - Comparison of two greases with SAE40 oil lubrication (1112 N load,
bronze bushing)
when boundary lubrication prevails, the thickener of grease enters the contact and forms a
deposited film which reduces asperity interaction [98]. Therefore, the friction coefficient
associated with oil is higher than that of grease. This explanation also holds in that the
friction coefficient with Moly#5 grease is smaller than that with ALG#1 grease because
of the higher viscosity of its base oil. Furthermore, the transition point of lubrication
regimes from mixed one to hydrodynamic one shifts to the left with a more viscous
lubricant, which implies that a higher viscosity lubricant can result in lift-off at a lower
speed.
In the hydrodynamic lubrication regime, the bearing surfaces are separated by a
relatively thick film and friction is caused by the shear stress of the lubricant. In this
regime, the friction of grease is greater than that of oil due to its higher viscosity.
44
3.2.5 Theoretical Predictions
A mixed elastohydrodynamic lubrication model for line contacts is presented in
§2.2, Chapter 2. While the procedure is developed for oil lubricated bearings, it can
provide insight into the frictional characteristics of grease lubrication. The critical
procedure in calculating the coefficient of friction is to determine the thickness of the
lubricant film. For grease lubrication, although the role of thickener should not be
ignored [98], the properties of the base oil are assumed to be the key factors in predicting
the film thickness [99, 100].
The asperity-film load sharing concept is employed into a mixed
elastohydrodynamic lubrication model to determine the friction coefficient. As shown in
§2.2, Chapter 2, the mixed elastohydrodynamic lubrication model is described by three
equations:
21
111γγ
+= (3.2)
( ) ( ) ( ) ( )21
1
72
27
27
21
73
37
1514
137
2121
'
1
γγγγ
−
⎥⎥
⎦
⎤
⎢⎢
⎣
⎡⎟⎠⎞
⎜⎝⎛ ++⎟
⎠⎞
⎜⎝⎛ +=
−−−−−−
∑
ss
EPRP
ss
EIRI
s
c HHHHUh (3.3)
( )2
1
2''
1'
''
23'''' 11
32 44
23232
γγσ
σσσ
aaaaaas
a
s
dcTss WnadhFFn ⎥⎦
⎤⎢⎣⎡ +=⎟⎟
⎠
⎞⎜⎜⎝
⎛ − − (3.4)
Numerical solution of Eqs. (3.2)-(3.4) gives the Johnson’s scaling factor [47] 1γ and 2γ
associate with the hydrodynamic lifting force and asperity contact force, respectively.
This information in conjunction with an appropriate lubricant constitutive equation
allows one to predict the coefficient of friction in the mixed lubrication regime. See §2.2,
45
Chapter 2 for the details of formulation and numerical solution technique. The data used
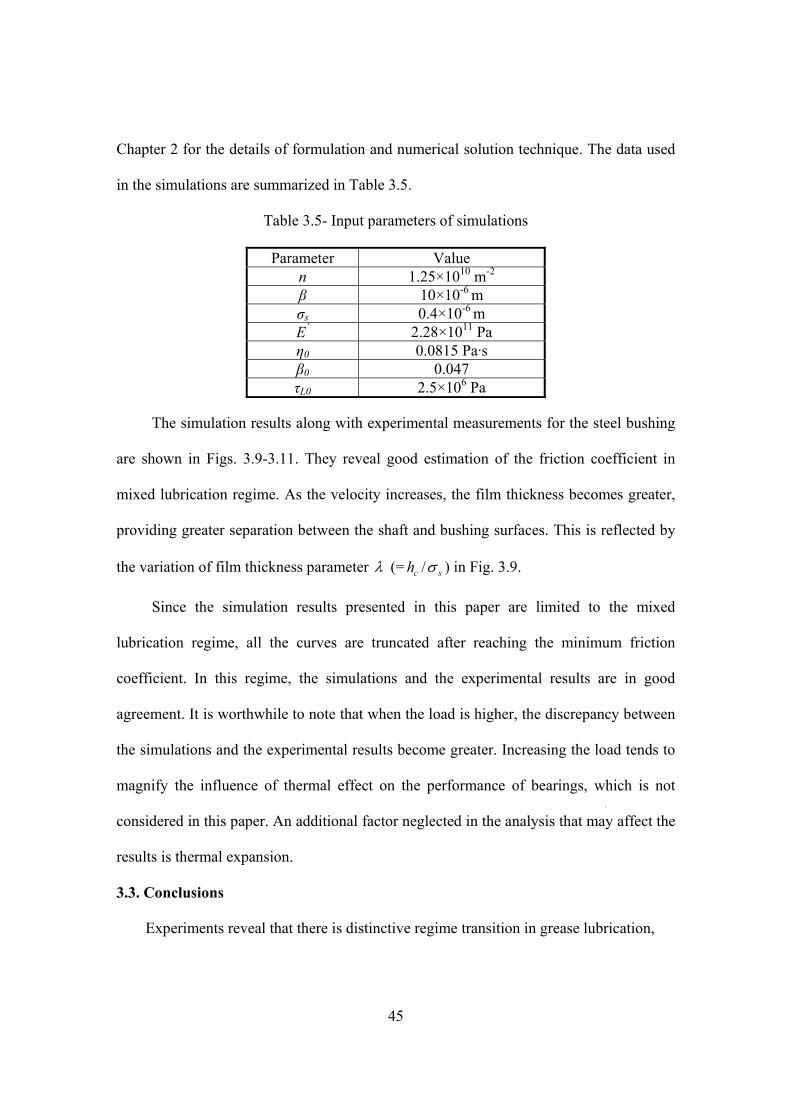
in the simulations are summarized in Table 3.5.
Table 3.5- Input parameters of simulations
Parameter Value n 1.25×10¹⁰ m-2
β 10×10-6 m σs 0.4×10⁻⁶ m E’ 2.28×10¹¹ Pa η0 0.0815 Pa·s β0 0.047 τL0 2.5×10⁶ Pa
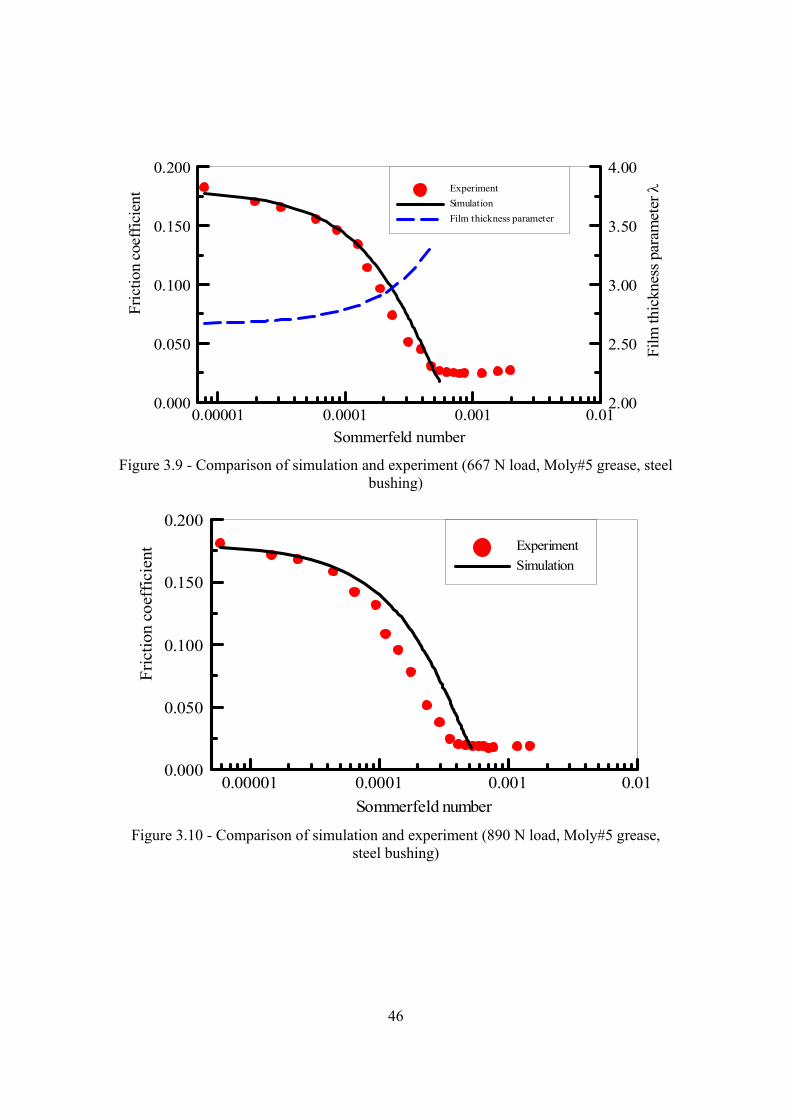
The simulation results along with experimental measurements for the steel bushing
are shown in Figs. 3.9-3.11. They reveal good estimation of the friction coefficient in
mixed lubrication regime. As the velocity increases, the film thickness becomes greater,
providing greater separation between the shaft and bushing surfaces. This is reflected by
the variation of film thickness parameter λ (= sch σ/ ) in Fig. 3.9.
Since the simulation results presented in this paper are limited to the mixed
lubrication regime, all the curves are truncated after reaching the minimum friction
coefficient. In this regime, the simulations and the experimental results are in good
agreement. It is worthwhile to note that when the load is higher, the discrepancy between
the simulations and the experimental results become greater. Increasing the load tends to
magnify the influence of thermal effect on the performance of bearings, which is not
considered in this paper. An additional factor neglected in the analysis that may affect the
results is thermal expansion.
3.3. Conclusions
Experiments reveal that there is distinctive regime transition in grease lubrication,
46
Sommerfeld number0.00001 0.0001 0.001 0.01
Fric
tion
coef
ficie
nt
0.000
0.050
0.100
0.150
0.200
Film
thic
knes
s par
amet
er λ
2.00
2.50
3.00
3.50
4.00ExperimentSimulationFilm thickness parameter
Figure 3.9 - Comparison of simulation and experiment (667 N load, Moly#5 grease, steel
bushing)
Sommerfeld number0.00001 0.0001 0.001 0.01
Fric
tion
coef
ficie
nt
0.000
0.050
0.100
0.150
0.200ExperimentSimulation
Figure 3.10 - Comparison of simulation and experiment (890 N load, Moly#5 grease,
steel bushing)

47
Sommerfeld number0.00001 0.0001 0.001 0.01
Fric
tion
coef
ficie
nt
0.000
0.050
0.100
0.150
0.200
ExperimentSimulation
Figure 3.11 - Comparison of simulation and experiment (1112 N load, Moly#5 grease,
steel bushing)
akin to that of an oil-lubricated bearing. Grease is the preferred lubricant for heavily-
loaded bearings operating in boundary or mixed lubrication regime, where it offers many
advantages including smaller friction coefficient than oil. A mixed elastohydrodynamic
lubrication model for line contact with consideration of starvation utilizing the viscosity
of the base oil in grease is presented. The simulation shows good agreement with
experimental results in mixed lubrication regime. Experiments also reveal that in the
hydrodynamic lubrication regime, grease presents similar lubricating characteristics as
oil. The friction coefficient is reduced by a higher load in this regime. When the base oil
viscosity of grease is the same as that of oil, the friction of grease is greater than that of
oil due to the existence of thickener.
3.4. Nomenclature
B bearing length, m
C radial clearance, m

48
'dd dimensionless distance between mean line of asperities and mean line of
surface
'E equivalent modulus of elasticity, = ( ) ( )( )b
EE b22 112 νν −+− , Pa
'TF dimensionless load
f coefficient of friction
'ch dimensionless film thickness
sN shaft velocity, rev/s
n density of asperities
'n dimensionless density of asperities
P load, N
LP projected load, = ( )RBP 2 , Pa
R shaft radius, m
bR bushing radius, m
S Sommerfeld number, = ( ) LT PCRN /2η
ΣU velocity number
W dimensionless load
α pressure-viscosity coefficient, 1/ Pa
β average radius of asperities, m
0β slope of the limiting shear stress-pressure relation, 0.047
γ scaling factor
λ film thickness parameter, sch σ/
49
BOη dynamic viscosity of the base oil, Pa.s
sσ standard deviation of asperities, m
'sσ dimensionless standard deviation of asperities
0Lτ limiting shear stress at ambient pressure, Pa

50
CHAPTER 4 AN EXPERIMENTAL INVESTIGATION OF DIMPLE EFFECT ON THE STRIBECK CURVE OF JOURNAL BEARINGS
4.1. Introduction
According to the hydrodynamic lubrication theory, two ideally flat, parallel surfaces,
with one sliding against the other, in the presence of an isothermal, Newtonian fluid will
not generate hydrodynamic pressure to support an external load. However, in 1946 and
1947, Fogg [101] and Shaw & Mass [102] reported experimental results that revealed the
existence of load carrying capacity in parallel thrust bearings. Later in 1961, Denny [3]
substantiated the generation of fluid pressure in parallel surfaces in a seal-like
configuration. Ever since publication of these reports, researchers have attempted to
explain this load-generation phenomenon by attributing it to thermal effect [101, 102,
104], roughness [105], macro-roughness [106, 107], micro-irregularities [108-1010],
waviness and corning [111] and non-Newtonian effect [112]. Further, to take advantage
of this phenomenon, with the recognition that the surface profile plays an important role
in creating the hydrodynamic pressure, researchers have made numerous attempts to
modify the shape of the mating surfaces to facilitate and optimize the generation of the
hydrodynamic pressure.
The recognition that the surface profile plays an important role in creating the
hydrodynamic pressure has led the researchers to actively seek techniques to modify the
shape of the mating surfaces in order to facilitate and optimize the generation of the
hydrodynamic pressure. The principle of enhancing performance via improved surface
pattern has been applied in seal industry to minimize friction and leakage [113-119]; in
computers to improve hard drive reading [120-122]; in thrust bearings to enhance load
carrying capacity [123-126]; and in automotive industry to reduce friction of piston rings

51
[127-129]. Theoretical studies have also been reported that suggest how to optimize the
parameters of patterned surface [130-132]. However, a review of articles in the open
literature reveals that this principle has not been thoroughly examined in journal bearings.
In this paper, we focus our attention to the friction performance of journal bearings
with dimpled bushing. General techniques available for implementing a desired patterned
profile on the surface include: machining [106], photo etching [109-110, 120], reactive
iron etching [124], micro-blasting [125], and laser-texturing [116-119, 123, 126-131, 133,
134]. In the current research, experiments were performed on journal bearings whose
bushings inner surfaces were dimpled by machining and chemical etching techniques.
Results are provided with different dimple sizes, shapes and depths. Their effects on the
Stribeck curve are investigated.
4.2. Experimental
Lewis LRI-8H tribometer is used for measuring the coefficient of friction of journal
bearings. Its detailed description is available in [97]. Briefly, the machine is capable of
measuring the friction coefficient under varying operating conditions such as load, speed,
and oil inlet temperature. Load is applied through a level mechanism. The friction force is
sensed by a measuring cell and data are continuously recorded into a computer via an
automated data acquisition system.
4.2.1. Bearings
The shaft is made of hardened AISI 1020 steel with 0.29 Poisson’s ratio, 200 GPa
elastic modulus. The shaft diameter is 24.54 mm. The bushing material is SAE660 alloy
bronze with 0.33 Poisson’s ratio, 100 GPa elastic modulus. The bushing has an inner
diameter 24.71 mm and an outer diameter 33.66 mm. The bearing length is 25.4 mm.
52
The dimpled bushings are prepared using two methods: machining and chemical
etching. For machining, carbide ball shape burs are used as the indenters. For chemical
etching, two steps are followed: imprinting pattern and etching. The designed pattern is
printed on press-and-peel PCB transfer film. Then the film is attached to the inner surface
of the bushing. They are put on a hot plate for 8 minutes, with temperature set to medium
(368 0C). The film is then firmly pressed against the bushing inner surface. After that,
immediately, the bushing and the film are dipped into iced water and cooled down for
one minute. Next, the film is peeled off, having the dimple pattern formed on the bushing
inner diameter. The outer surface and the end section are then sealed with bees wax and
the bushing is immersed into a solution of 30% percent FeCl3 and 70% percent distilled
water by weight. FeCl3 is dissolved in 50 0C water. The dimple depth is controlled by the
etching time. In the current study, it reaches 0.130 mm after one hour. When the etching
process is finished, the wax is cleaned out mechanically, while the PCB film coating is
washed away using acetone.
The specifications of bushings tested in the current paper are tabulated in Table 4.1
and 4.2. Those dimple shapes are illustrated by Fig. 4.1. The actual bushings are shown in
Fig. 4.2. There are two etched 4mm diameter circular dimpled bushings. Dimples are
distributed around the entire circumference of the inner surface (3600) on one bushing
and half of the circumference (1800) on the other.
The area ratio (the ratio of dimple area to bushing inner surface area) is set to 20%
[30, 31]. For 2 mm diameter circular dimpled bushing, there are 8×16=128 dimples; for 4
mm diameter circular dimpled bushing, there are 4×8=32 dimples for 3600 etched and
4×4=16 ones for 1800 etched; for elliptical dimpled bushing, there are also 4×8=32
dimples.

53
Table 4.1- Machined bushings
Bushing Dimple diameter (mm)
Dimple depth (mm)
Bur diameter (mm)
Conventional 0 0 0 Machined 1 2 0.165 6.223 Machined 2 4 0.448 9.373
Table 4.2- Etched bushings
Bushing Dimple shape Dimple depth (mm)
Etching time (hour)
Etched 1 4 mm diameter circle, 3600 0.130 1.0
Etched 2 4 mm diameter circle, 1800 0.130 1.0
Etched 3 4mm:1mm ellipse, 3600 1.040 8.0
Figure 4.1 - dimple illustration
Castrol SAE30 oil and Exxon Teresstic GT32 oil are applied as the lubricants with
properties shown in Table 4.3.
(a) machined dimple 1 & 2 (b) etched dimple 1 & 2 (c) etched dimple 3
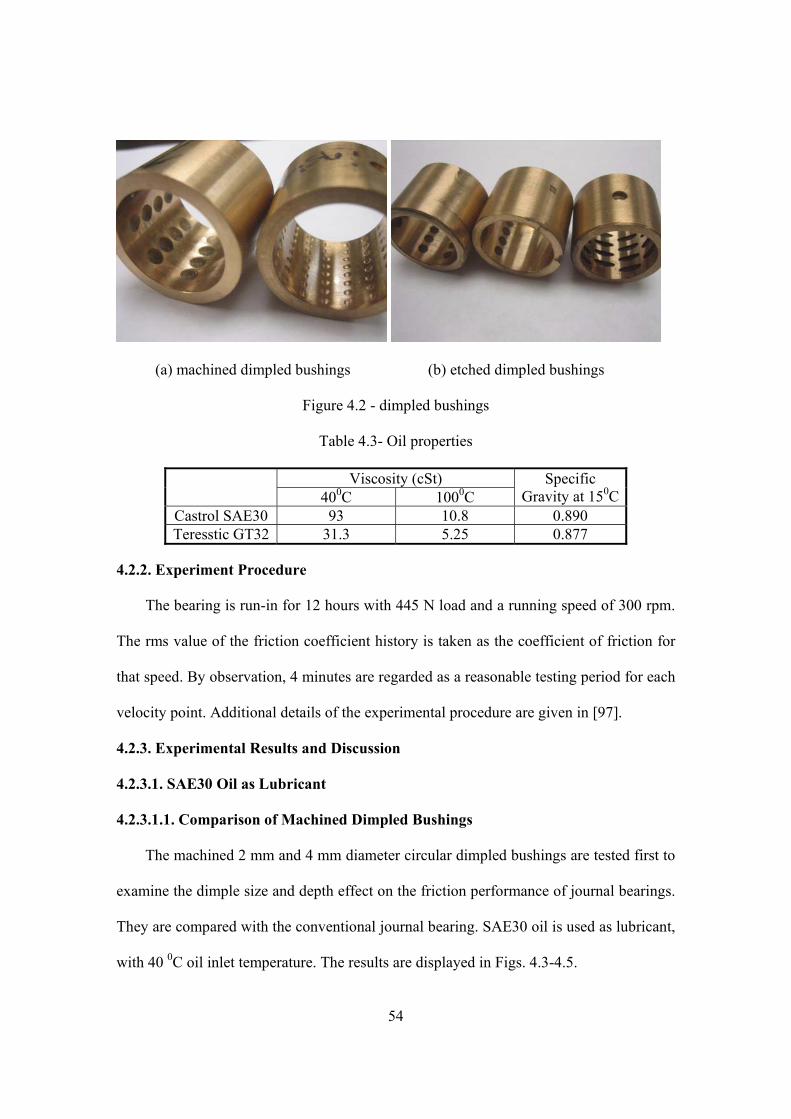
54
(a) machined dimpled bushings (b) etched dimpled bushings
Figure 4.2 - dimpled bushings
Table 4.3- Oil properties
Viscosity (cSt) 400C 1000C
Specific Gravity at 150C
Castrol SAE30 93 10.8 0.890 Teresstic GT32 31.3 5.25 0.877
4.2.2. Experiment Procedure
The bearing is run-in for 12 hours with 445 N load and a running speed of 300 rpm.
The rms value of the friction coefficient history is taken as the coefficient of friction for
that speed. By observation, 4 minutes are regarded as a reasonable testing period for each
velocity point. Additional details of the experimental procedure are given in [97].
4.2.3. Experimental Results and Discussion
4.2.3.1. SAE30 Oil as Lubricant
4.2.3.1.1. Comparison of Machined Dimpled Bushings
The machined 2 mm and 4 mm diameter circular dimpled bushings are tested first to
examine the dimple size and depth effect on the friction performance of journal bearings.
They are compared with the conventional journal bearing. SAE30 oil is used as lubricant,
with 40 0C oil inlet temperature. The results are displayed in Figs. 4.3-4.5.

55
Velocity (rpm)0 100 200 300 400 500
Fric
tion
coef
ficie
nt
0.000
0.050
0.100
0.150
0.200
0.250conventional2-mm dimples (machined)4-mm dimples (machined)
Figure 4.3 - friction coefficient as a function of velocity (667 N load, SAE30 oil)
Velocity (rpm)0 100 200 300 400 500
Fric
tion
coef
ficie
nt
0.000
0.050
0.100
0.150
0.200
0.250conventional2-mm dimples (machined)4-mm dimples (machined)
Figure 4.4 - friction coefficient as a function of velocity (890 N load, SAE30 oil)

56
Velocity (rpm)0 100 200 300 400 500
Fric
tion
coef
ficie
nt
0.000
0.050
0.100
0.150
0.200
0.250conventional2-mm dimples (machined)4-mm dimples (machined)
Figure 4.5 - friction coefficient as a function of velocity (1112 N load, SAE30 oil)
The friction characteristic of dimpled bearings is consistent with that of conventional
journal bearings detailed in [97]. With increasing speed, the friction coefficient drops in
the mixed lubrication regime before the lift-off and rises after the lift-off, as the
hydrodynamic regime prevails. The lift-off speed point distinguishes between the mixed
lubrication and the hydrodynamic lubrication. In the mixed lubrication regime, the
friction is dominated by asperity contact. With increasing speed, the separation gap (film
thickness) between surfaces becomes greater, and the friction coefficient drops. In the
hydrodynamic lubrication regime, the friction force can be predicted by examining the
fluid shearing. With increasing speed, the shear rate increases and so does the fluid shear
stress. As a result, the friction force becomes lager [25].
The friction coefficient of machined dimpled bushing of 2-mm diameter and circular
in shape is higher than that of the conventional and the corresponding 4-mm diameter
dimpled bushings throughout the mixed and the hydrodynamic regimes. Due to the

57
presence of dimples, the actual contact surface area of the bushing becomes smaller
leading to an increase of the actual contact pressure. If the dimpled bushing of 2-mm
diameter and circular in shape fail to generate extra hydrodynamic pressure to
compensate the increment of contact pressure [125], the friction coefficient will become
higher.
A bushing with 4-mm circular-shaped dimples has a greater potential than that with
2-mm circular-shaped dimples to improve friction performance. It has a higher friction
value than that of conventional bushing in the mixed lubrication regime. For instance,
f =0.0729 (dimpled bushing) compared to f =0.0542 (conventional bushing) at the
speed of 32 rpm with 667 N load. In hydrodynamic regime, on the other hand, a lower
friction value than the conventional bushing in hydrodynamic lubrication regime is
obtained. For instance, f =0.0044 (dimpled bushing) compared to f =0.0070
(conventional bushing) at the speed of 300 rpm with 1112 N load. This implies that extra
hydrodynamic pressure is developed in the dimpled areas.
4.2.3.1.2. Comparison of Machined and Etched Dimpled Bushings
The friction results of etched dimpled bushing of 4-mm diameter and circular in
shape (3600, 0.130 mm depth) are shown in Figs. 4.6-4.8. The lubricant is SAE30 oil and
inlet temperature is 40 0C.
In the mixed lubrication regime, the friction coefficient of etched dimpled bushing of
4-mm diameter and circular in shape is higher than that of the conventional bushing. For
instance, f =0.1060 (dimpled bushing) compared to f = 0.0542 (conventional bushing)
at the speed of 32 rpm with 667 N load. In the hydrodynamic lubrication regime, on the

58
Velocity (rpm)0 100 200 300 400 500
Fric
tion
coef
ficie
nt
0.000
0.050
0.100
0.150
0.200
0.250conventionalcircular dimples (etched)circular dimples (machined)
Figure 4.6 - friction coefficient as a function of velocity (667 N load, SAE30 oil)
Velocity (rpm)0 100 200 300 400 500
Fric
tion
coef
ficie
nt
0.000
0.050
0.100
0.150
0.200
0.250conventionalcircular dimples (etched)circular dimples (machined)
Figure 4.7 - friction coefficient as a function of velocity (890 N load, SAE30 oil)

59
Velocity (rpm)0 100 200 300 400 500
Fric
tion
coef
ficie
nt
0.000
0.050
0.100
0.150
0.200
0.250conventionalcircular dimples (etched)circular dimples (machined)
Figure 4.8 - friction coefficient as a function of velocity (1112 N load, SAE30 oil)
other hand, this trend reverses. For instance, f =0.0091 (dimpled bushing) compared to
0.0104 (conventional bushing) at the speed of 150 rpm with 667 N load. This is similar to
the effect of the machined dimpled bushing of 4-mm diameter and circular in shape.
However, the results show that the friction drops more with machined dimpled bushing
(0.448 mm depth) in hydrodynamic lubrication regime. The machined dimples have a
partial-spherical shape (See Fig. 4.1(a)) with 0.448 mm depth while the etched dimples
have a square shape (See Fig. 4.1(b)) with 0.130 mm depth. The shape and the depth of
machined dimples facilitate the generation of hydrodynamic pressure to lift-off the shaft.
4.2.3.2. GT32 Oil
The friction performance of dimpled bushings can be better distinguished with a
lighter oil. For this purpose, GT32 (31.3 cSt at 40 0C) is chosen for further comparison.
The speed range is extended from 2~500 rpm to 2~1500 rpm. The oil inlet temperature is
maintained at 40 0C.
60
4.2.3.2.1. Comparison of Machined and Etched Dimpled Bushings
The results of machined and etched dimpled bushings (3600) of 4-mm diameter and
circular in shape and conventional bushing are shown in Figs. 4.9-4.11. Both machined
and etched dimpled bushings create a smaller friction coefficient throughout mixed and
hydrodynamic lubrication regimes. The friction performance of dimpled bushings is close
in mixed lubrication regime. However, the machined dimpled bushing performs the best
in hydrodynamic lubrication regime. For instance, the friction coefficient is 0.1953
(conventional bushing), 0.1388 (etched bushing) and 0.1325 (machined bushing) at the
speed of 32 rpm with 667 N load; 0.0229 (conventional bushing), 0.0128 (etched
bushing) and 0.0088 (machined bushing) at the speed of 300 rpm with 667 N load.
It is noted that the in mixed lubrication regime, the friction coefficient of machined
and etched dimpled bushings is higher than that of conventional bushing for SAE30 oil,
while the opposite is true for GT32 oil. This can be attributed to the so-called secondary
lubrication effect in dimple surface [123, 124, 133, 135-136]. The oil retained in the
dimples works as a secondary lubricant source which permeates to the interspace of
asperities and causes a reduction in the friction. GT32 oil has a much smaller viscosity
(31.3 cSt at 40 0C) than SAE30 oil (93 cSt at 40 0C). Therefore, it is easier for GT32 oil
to flow into asperities interspaces and reduce the friction. The friction difference with
these two oils suggests that the secondary lubrication effect can be the dominant factor
for dimpled bearings in mixed lubrication regime.
4.2.3.2.2. Comparison of Conventional and Etched Elliptical Dimpled Bushings
In order to further explore the effect of dimple shape, a series of elliptical shape dimples
were etched into the bushing, as shown in Fig. 4.12. The semi-major axis of the ellipse is

61
4 mm and the semi-minor axis of the ellipse is 1 mm. The dimple depth is 1.040 mm. The
experimental results are exhibited in Figs. 4.13-4.15.
Velocity (rpm)0 500 1000 1500
Fric
tion
coef
ficie
nt
0.000
0.050
0.100
0.150
0.200
0.250
0.300
0.350conventionalcircular dimples (etched)circular dimples (machined)
Figure 4.9 - friction coefficient as a function of velocity (445 N load, GT32 oil)
Velocity (rpm)0 500 1000 1500
Fric
tion
coef
ficie
nt
0.000
0.050
0.100
0.150
0.200
0.250
0.300
0.350conventionalcircular dimples (etched)circular dimples (machined)
Figure 4.10 - friction coefficient as a function of velocity (560 N load, GT32 oil)
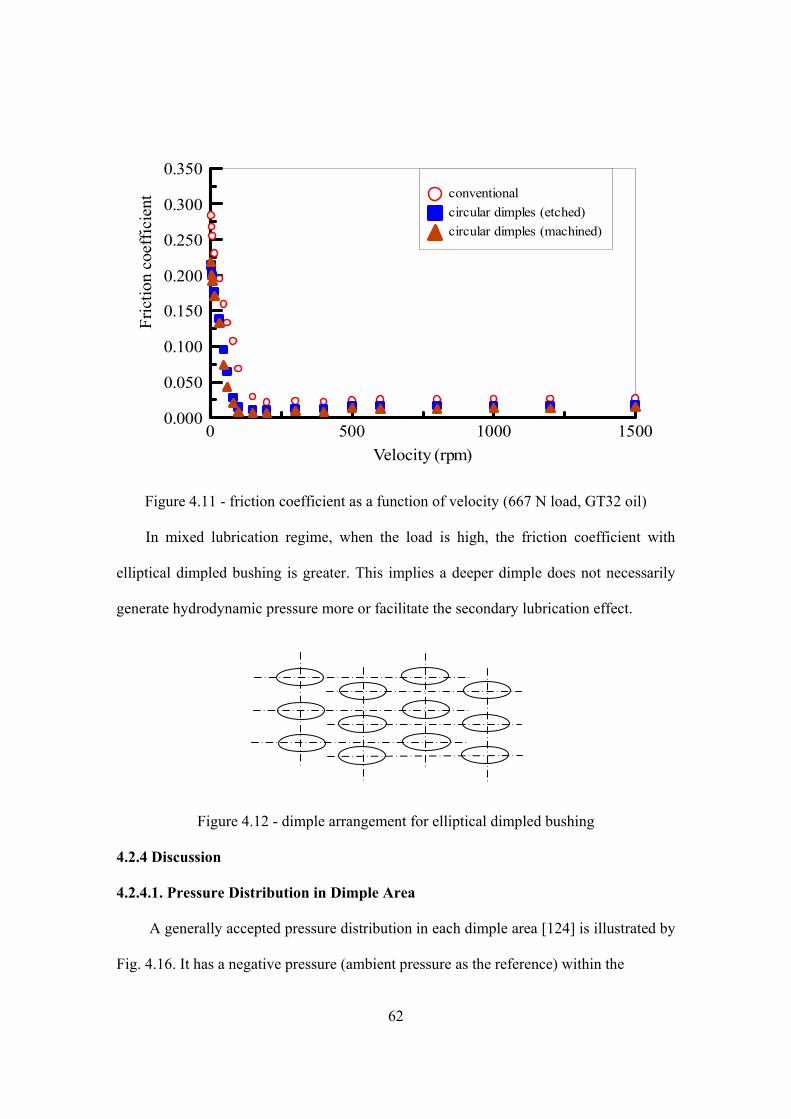
62
Velocity (rpm)0 500 1000 1500
Fric
tion
coef
ficie
nt
0.000
0.050
0.100
0.150
0.200
0.250
0.300
0.350conventionalcircular dimples (etched)circular dimples (machined)
Figure 4.11 - friction coefficient as a function of velocity (667 N load, GT32 oil)
In mixed lubrication regime, when the load is high, the friction coefficient with
elliptical dimpled bushing is greater. This implies a deeper dimple does not necessarily
generate hydrodynamic pressure more or facilitate the secondary lubrication effect.
Figure 4.12 - dimple arrangement for elliptical dimpled bushing
4.2.4 Discussion
4.2.4.1. Pressure Distribution in Dimple Area
A generally accepted pressure distribution in each dimple area [124] is illustrated by
Fig. 4.16. It has a negative pressure (ambient pressure as the reference) within the
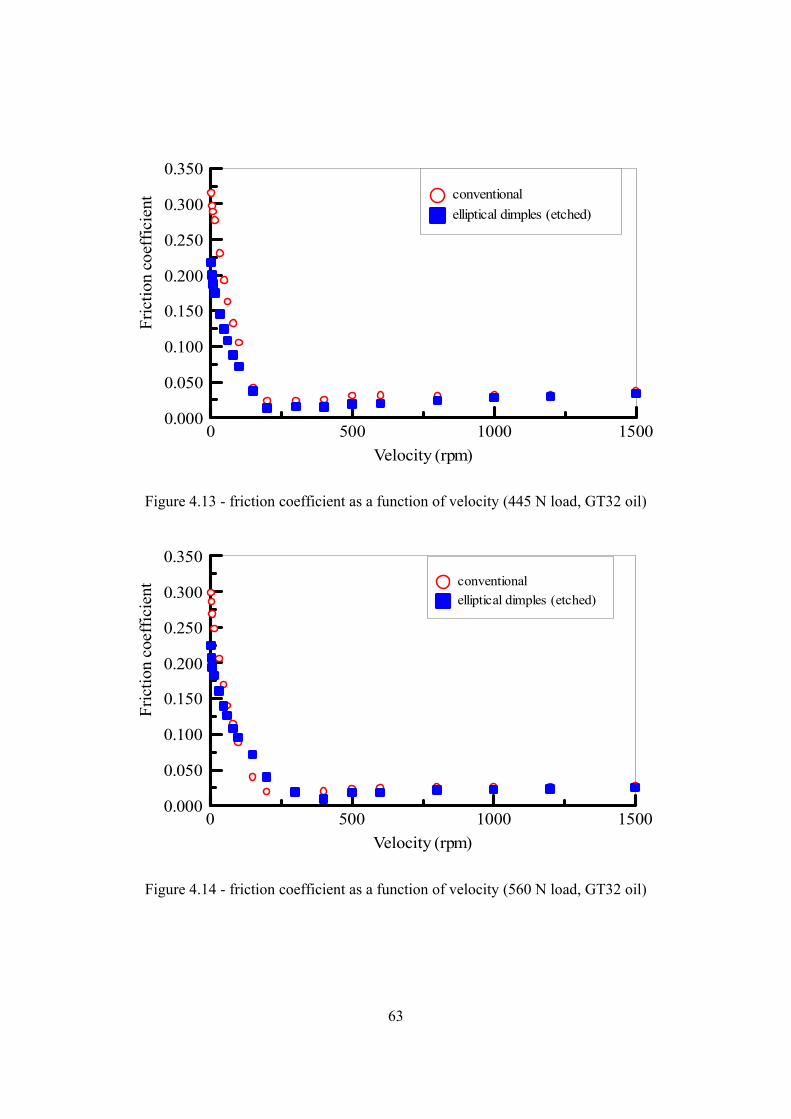
63
Velocity (rpm)0 500 1000 1500
Fric
tion
coef
ficie
nt
0.000
0.050
0.100
0.150
0.200
0.250
0.300
0.350conventional elliptical dimples (etched)
Figure 4.13 - friction coefficient as a function of velocity (445 N load, GT32 oil)
Velocity (rpm)0 500 1000 1500
Fric
tion
coef
ficie
nt
0.000
0.050
0.100
0.150
0.200
0.250
0.300
0.350conventionalelliptical dimples (etched)
Figure 4.14 - friction coefficient as a function of velocity (560 N load, GT32 oil)
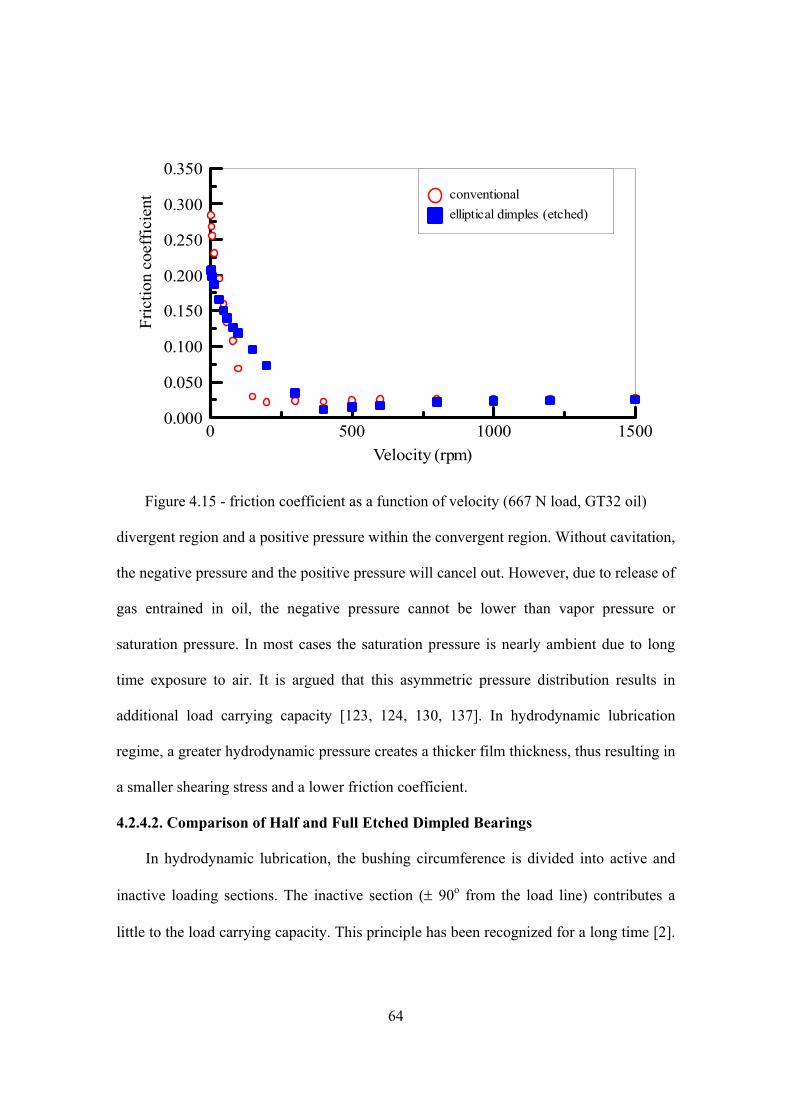
64
Velocity (rpm)0 500 1000 1500
Fric
tion
coef
ficie
nt
0.000
0.050
0.100
0.150
0.200
0.250
0.300
0.350conventionalelliptical dimples (etched)
Figure 4.15 - friction coefficient as a function of velocity (667 N load, GT32 oil)
divergent region and a positive pressure within the convergent region. Without cavitation,
the negative pressure and the positive pressure will cancel out. However, due to release of
gas entrained in oil, the negative pressure cannot be lower than vapor pressure or
saturation pressure. In most cases the saturation pressure is nearly ambient due to long
time exposure to air. It is argued that this asymmetric pressure distribution results in
additional load carrying capacity [123, 124, 130, 137]. In hydrodynamic lubrication
regime, a greater hydrodynamic pressure creates a thicker film thickness, thus resulting in
a smaller shearing stress and a lower friction coefficient.
4.2.4.2. Comparison of Half and Full Etched Dimpled Bearings
In hydrodynamic lubrication, the bushing circumference is divided into active and
inactive loading sections. The inactive section (± 90o from the load line) contributes a
little to the load carrying capacity. This principle has been recognized for a long time [2].
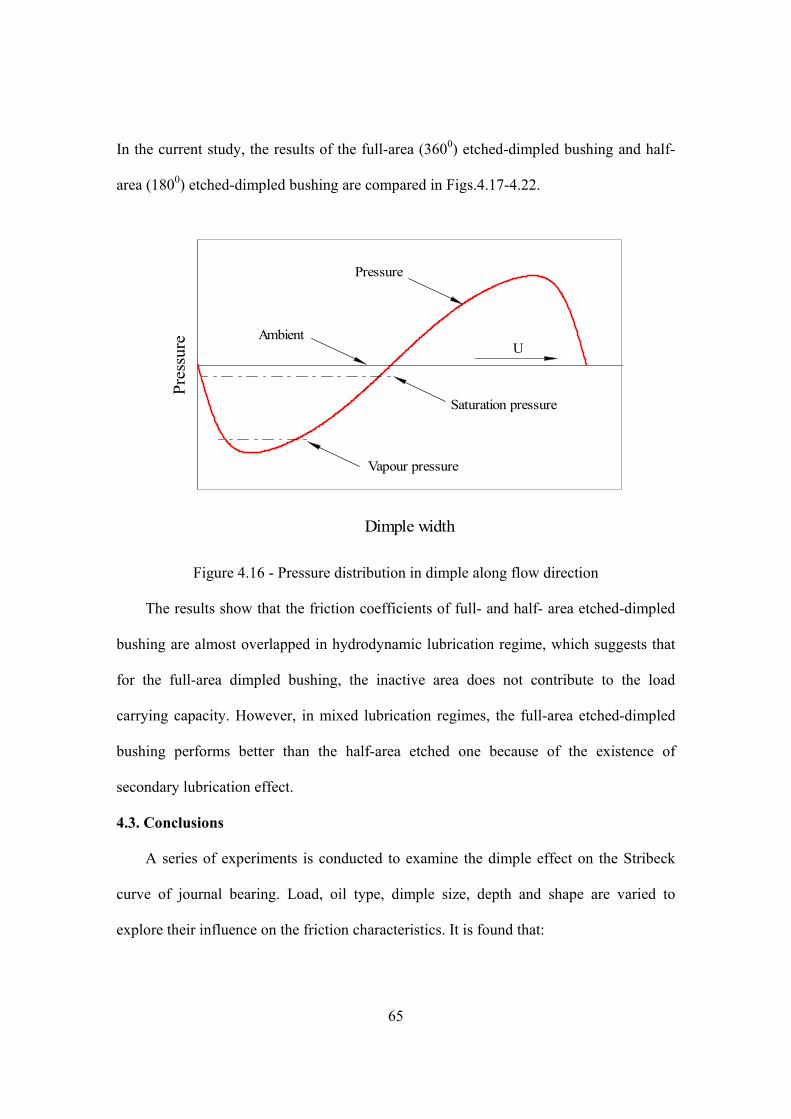
65
In the current study, the results of the full-area (3600) etched-dimpled bushing and half-
area (1800) etched-dimpled bushing are compared in Figs.4.17-4.22.
Dimple width
Pres
sure
Pressure
Ambient
Saturation pressure
Vapour pressure
U
Figure 4.16 - Pressure distribution in dimple along flow direction
The results show that the friction coefficients of full- and half- area etched-dimpled
bushing are almost overlapped in hydrodynamic lubrication regime, which suggests that
for the full-area dimpled bushing, the inactive area does not contribute to the load
carrying capacity. However, in mixed lubrication regimes, the full-area etched-dimpled
bushing performs better than the half-area etched one because of the existence of
secondary lubrication effect.
4.3. Conclusions
A series of experiments is conducted to examine the dimple effect on the Stribeck
curve of journal bearing. Load, oil type, dimple size, depth and shape are varied to
explore their influence on the friction characteristics. It is found that:
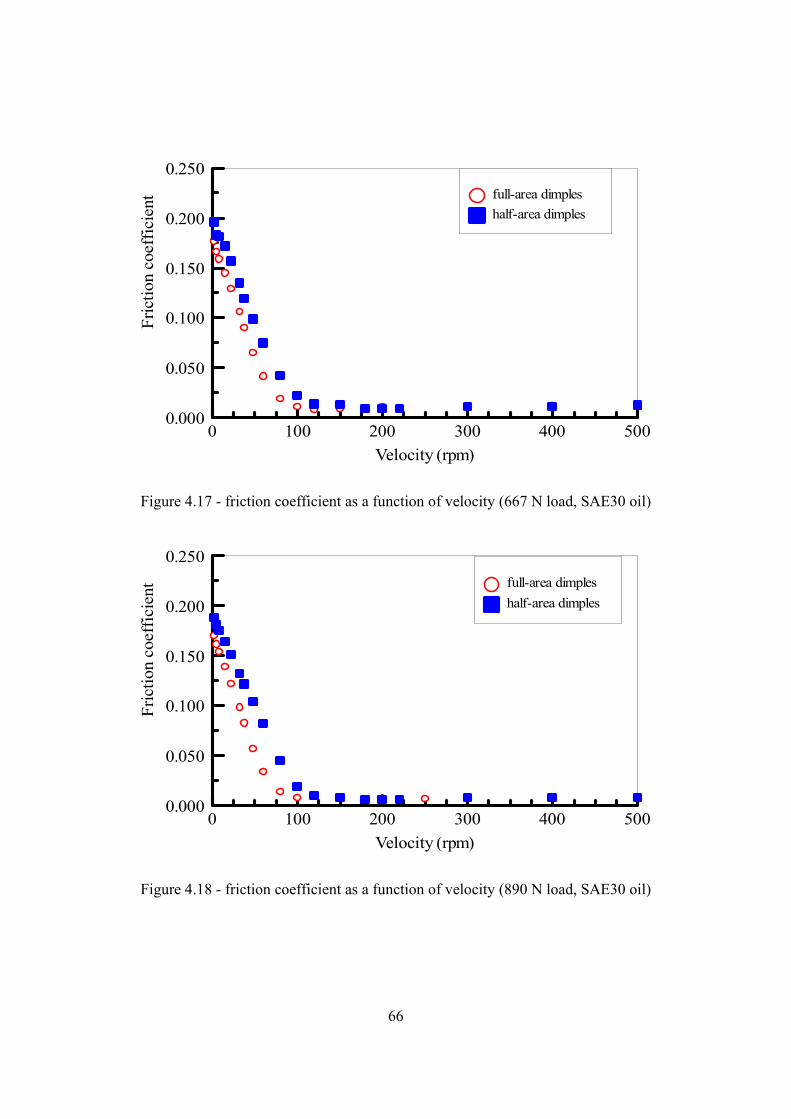
66
Velocity (rpm)0 100 200 300 400 500
Fric
tion
coef
ficie
nt
0.000
0.050
0.100
0.150
0.200
0.250full-area dimpleshalf-area dimples
Figure 4.17 - friction coefficient as a function of velocity (667 N load, SAE30 oil)
Velocity (rpm)0 100 200 300 400 500
Fric
tion
coef
ficie
nt
0.000
0.050
0.100
0.150
0.200
0.250full-area dimpleshalf-area dimples
Figure 4.18 - friction coefficient as a function of velocity (890 N load, SAE30 oil)

67
Velocity (rpm)0 100 200 300 400 500
Fric
tion
coef
ficie
nt
0.000
0.050
0.100
0.150
0.200
0.250full-area dimpleshalf-area dimples
Figure 4.19 - friction coefficient as a function of velocity (1112 N load, SAE30 oil)
Velocity (rpm)0 500 1000 1500
Fric
tion
coef
ficie
nt
0.000
0.050
0.100
0.150
0.200
0.250full-area dimpleshalf-area dimples
Figure 4.20 - friction coefficient as a function of velocity (445 N load, GT32 oil)
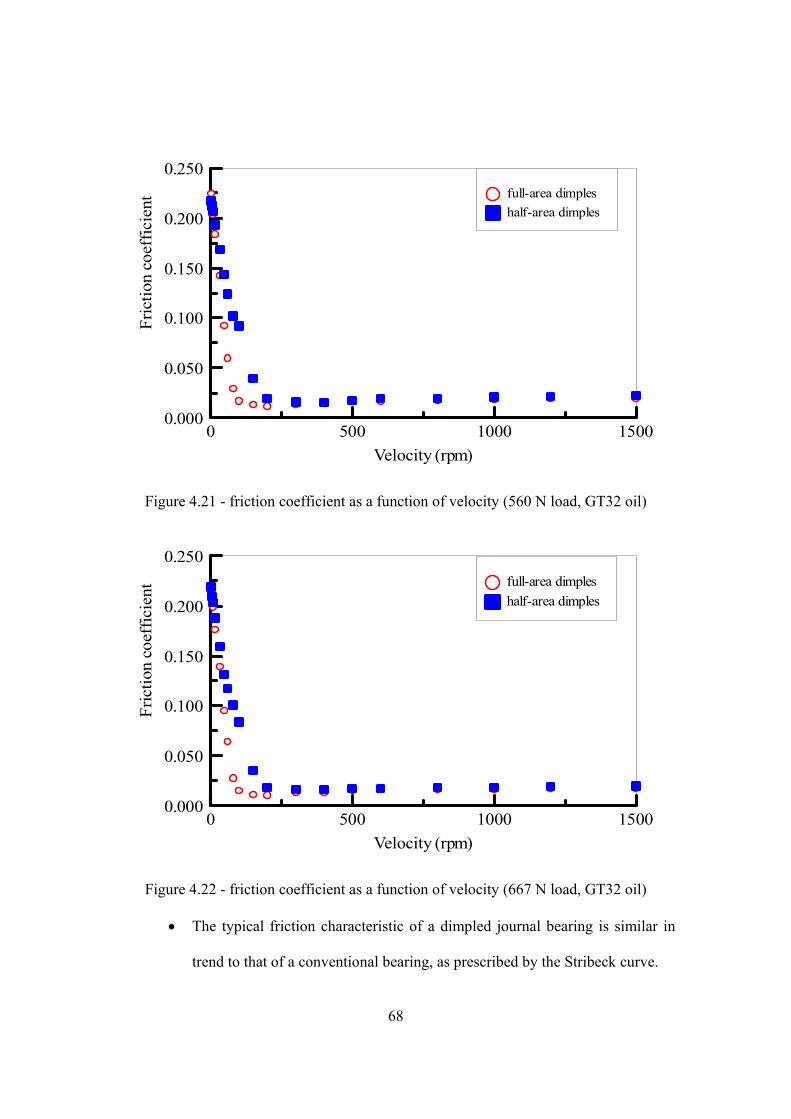
68
Velocity (rpm)0 500 1000 1500
Fric
tion
coef
ficie
nt
0.000
0.050
0.100
0.150
0.200
0.250full-area dimpleshalf-area dimples
Figure 4.21 - friction coefficient as a function of velocity (560 N load, GT32 oil)
Velocity (rpm)0 500 1000 1500
Fric
tion
coef
ficie
nt
0.000
0.050
0.100
0.150
0.200
0.250full-area dimpleshalf-area dimples
Figure 4.22 - friction coefficient as a function of velocity (667 N load, GT32 oil)
• The typical friction characteristic of a dimpled journal bearing is similar in
trend to that of a conventional bearing, as prescribed by the Stribeck curve.

69
• Proper dimple size, shape and depth are essential to improve the friction
performance. It becomes more pronounced if an oil with lower viscosity is
utilized.
• In mixed lubrication regime, the secondary lubrication effect is dominant for
dimpled journal bearings. Improper size of dimple will be deleterious to the
friction reduction.
• In hydrodynamic lubrication regime, the asymmetric pressure distribution in
the dimple area generates extra hydrodynamic pressure to separate the
surfaces, resulting in a lower friction coefficient.
• In mixed lubrication regime, the full-area etched bushing (dimpled over the
entire circumference, 360o) performs better than the half-area (dimpled over
the active zone, 180o) bushing due to secondary lubrication effect; in
hydrodynamic lubrication regime, their performance is nearly the same.
4.4. Nomenclature
f friction coefficient
70
CHAPTER 5 AN EXPERIMENTAL STUDY OF OIL LUBRICATED JOURNAL BEARINGS UNDERGOING OSCILLATORY MOTION
5.1. Introduction
Journal bearings have broad range of applications in industry. Most journal bearings
are designed to rotate uni-directionally and operate with a relatively thick film of fluid
that separates the journal and the bushing so that the hydrodynamic lubrication regime
prevails. There are volumes of archival publications devoted to this subject, many of
which deal with performance analyses, experimental investigations, and design aspects.
Nevertheless, there are applications where the journal does not rotate uni-directionally,
rather it is designed to oscillate periodically at a specified frequency and amplitude.
Correspondingly, the state of lubrication undergoes a transition from boundary, to mixed,
and to hydrodynamic regimes. This shift of regime considerably complicates the analysis
of bearing performance.
A distinctive behavior of oscillating bearings is the evolution of friction hysteresis
which is a retardation phenomenon of the friction coefficient when the velocity changes
direction while traversing through the zero speed, manifesting itself in the form of a
friction hysteresis.
Research dealing with friction hysteresis originated with stick-slip phenomenon.
Sampson [138] is probably the first researcher who witnessed this behavior
experimentally. Bell [139-141] recorded the friction force and the velocity history in
machine tool slideway and reported hysteresis loop behavior. Thereafter, researchers
[142-150] continued their efforts on studies devoted to the understanding of hysteresis
phenomenon. Among the noteworthy publications relevant to the present paper are the
work of Polycarpou [151-153], Hess [154, 155] and Harnoy [156-160] who carried out a
71
series of experiments and presented distinct feature for the friction hysteresis of oil-
lubricated oscillatory journal bearings. However, the lubrication mechanism and the
affecting factors of the hysteresis behavior remain largely unexplored.
In the current paper, the friction performance of oil-lubricated oscillatory journal
bearings is investigated. The effects of load, with or without oil, oil type, oil inlet
temperature, oscillating frequency, and bushing type are examined. The cause and the
variation of the friction hysteresis loop are analyzed qualitatively.
5.2. Experimental
The apparatus employed in this research is LRI-8H—a versatile journal bearing
friction tester manufactured by Lewis. A detailed description of the apparatus is
described in [57]. Briefly, the machine is capable of measuring the friction coefficient
under varying operating conditions such as load and oscillating frequency. Load is
applied through a level mechanism. The friction force is read by a measuring cell and
data are continuously recorded into a computer via an automated data acquisition system.
The coefficient of friction, the oscillating frequency, and the load are processed by
software, displayed on computer screen, and recorded for future analysis. The interval for
recording data is adjustable and is independent of the duration of the test. Two types of
sampling frequencies are adopted. One is for recording the global history of the
coefficient of friction. The other is for recording the local history of the coefficient of
friction in one oscillation cycle. In the current study, a minimum of 20 seconds for the
global history and a 0.0185 second for the local history are taken.
5.2.1 Bearing Properties
The shaft is made up of hardened AISI 1020 steel. Its diameter is 24.54 mm. Bronze
and steel bushings are used in tests. The inner diameters are 24.71 mm and 25.4 mm,

72
respectively. Their length is 25.4 mm. SAE30 oil and SAE40 oil are applied as the
lubricants with properties shown in Table 5.1.
Table 5.1- Oil properties
Viscosity (cSt) 400C 1000C
Specific Gravity at 150C
SAE30 93 10.8 0.890 SAE40 134 13.7 0.895
The applied loads are: 222 N (50 lb), 450 N (100 lb), 667 N (150 lb), and 890 N
(200 lb). The measuring error of the friction coefficient is based on the accuracy of the
load cell. A 44 N load cell is used in experiments. For a given load cell, the amount of the
friction force error is fixed. With increasing loads, the error of the friction coefficient
becomes smaller. It is tabulated in Table 5.2.
Table 5.2- Error of the friction coefficient associated with load
Load (N) 222 450 667 890 Error (±) 0.0069 0.0034 0.0023 0.0017
5.2.2 Experiment Procedure
Before any measurement is taken, the system is balanced so that the coefficient of
friction is nil when the shaft is in its static position. The system is run-in for one hour
with 1.0 Hz oscillating frequency and 445 N load. When each test is complete, the system
is given enough time, typically 2 hours, to cool down. For each test, the global history of
the coefficient of friction is monitored. The friction coefficient tends to oscillate
periodically around a relatively constant value. By observation, this state is normally
reached in 4 minutes. The total measuring time for each test is 8 minutes. Starting from
the moment of 4 minutes, the local history loop of the coefficient of friction in one
oscillation cycle is extracted for processing.

73
5.2.3 Development of Oscillatory Motion
The oscillatory motion of the shaft is generated by a four-bar linkage device. The
derivation of the oscillating speed can be referred to [161]. The result is displayed in Fig.
5.1.
Time (s)0.00 0.50 1.00 1.50 2.00
Ang
ular
vel
ocity
(rad
/s)
-8.0
-6.0
-4.0
-2.0
0.0
2.0
4.0
6.0
8.01.5 Hz
1.0 Hz
0.5 Hz
Figure 5.1 - the angular velocity of the shaft with different oscillating frequencies
5.2.4 Results and Discussion
The repeatability of the coefficient of friction in several oscillation cycles is
demonstrated in Fig. 5.2. As the discrepancy between cycles is small, in the analysis that
follows, only one cycle for a given test will be shown.
In what follows, the coefficient of friction is plotted against the shaft velocity (rpm).
The measured friction registers negative when the velocity is reversed. In the vicinity of
zero velocity, the coefficient of friction experiences a steep change due to the static-
kinetic traverse. It should be pointed out that coefficient of friction may not be a closed
loop, for one cannot expect that the coefficient of friction to remain exactly the same
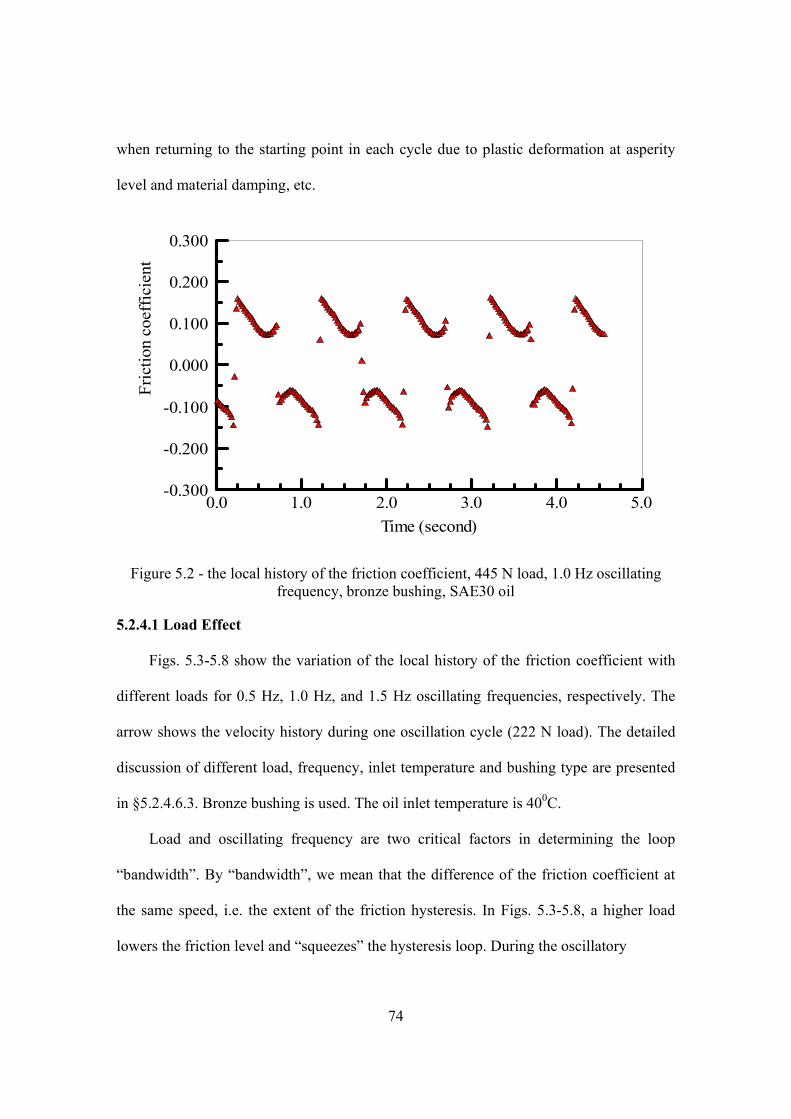
74
when returning to the starting point in each cycle due to plastic deformation at asperity
level and material damping, etc.
Time (second)0.0 1.0 2.0 3.0 4.0 5.0
Fric
tion
coef
ficie
nt
-0.300
-0.200
-0.100
0.000
0.100
0.200
0.300
Figure 5.2 - the local history of the friction coefficient, 445 N load, 1.0 Hz oscillating frequency, bronze bushing, SAE30 oil
5.2.4.1 Load Effect
Figs. 5.3-5.8 show the variation of the local history of the friction coefficient with
different loads for 0.5 Hz, 1.0 Hz, and 1.5 Hz oscillating frequencies, respectively. The
arrow shows the velocity history during one oscillation cycle (222 N load). The detailed
discussion of different load, frequency, inlet temperature and bushing type are presented
in §5.2.4.6.3. Bronze bushing is used. The oil inlet temperature is 400C.
Load and oscillating frequency are two critical factors in determining the loop
“bandwidth”. By “bandwidth”, we mean that the difference of the friction coefficient at
the same speed, i.e. the extent of the friction hysteresis. In Figs. 5.3-5.8, a higher load
lowers the friction level and “squeezes” the hysteresis loop. During the oscillatory
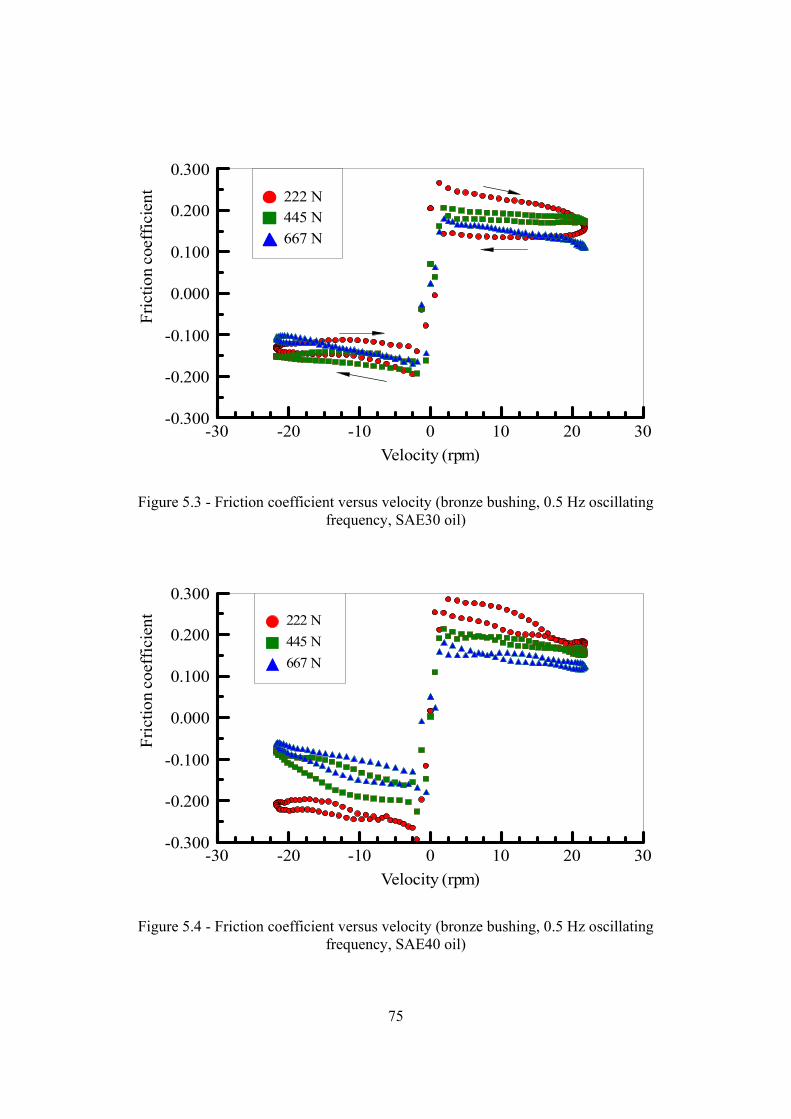
75
Velocity (rpm)-30 -20 -10 0 10 20 30
Fric
tion
coef
ficie
nt
-0.300
-0.200
-0.100
0.000
0.100
0.200
0.300222 N445 N667 N
Figure 5.3 - Friction coefficient versus velocity (bronze bushing, 0.5 Hz oscillating frequency, SAE30 oil)
Velocity (rpm)-30 -20 -10 0 10 20 30
Fric
tion
coef
ficie
nt
-0.300
-0.200
-0.100
0.000
0.100
0.200
0.300222 N445 N667 N
Figure 5.4 - Friction coefficient versus velocity (bronze bushing, 0.5 Hz oscillating frequency, SAE40 oil)

76
Velocity (rpm)-60 -40 -20 0 20 40 60
Fric
tion
coef
ficie
nt
-0.300
-0.200
-0.100
0.000
0.100
0.200
0.300222 N445 N667 N
Figure 5.5 - Friction coefficient versus velocity (bronze bushing, 1.0 Hz oscillating frequency, SAE30 oil)
Velocity (rpm)-60 -40 -20 0 20 40 60
Fric
tion
coef
ficie
nt
-0.300
-0.200
-0.100
0.000
0.100
0.200
0.300222 N450 N667 N
Figure 5.6 - Friction coefficient versus velocity (bronze bushing, 1.0 Hz oscillating frequency, SAE40 oil)
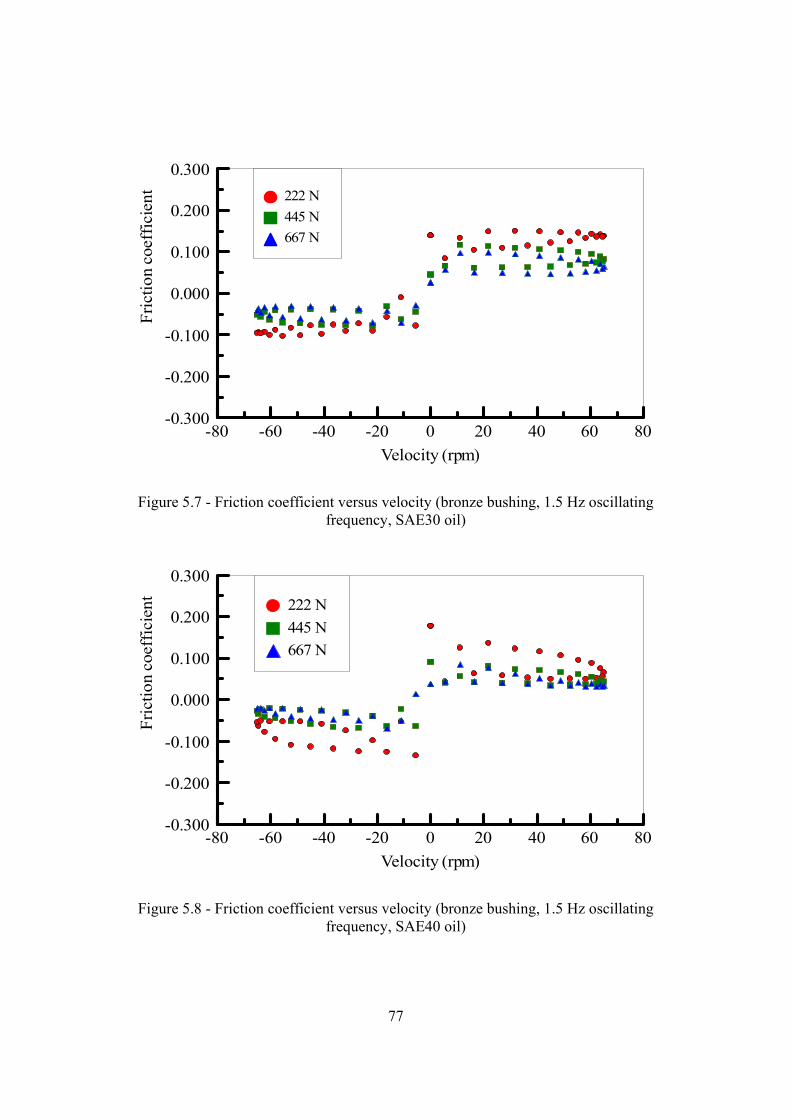
77
Velocity (rpm)-80 -60 -40 -20 0 20 40 60 80
Fric
tion
coef
ficie
nt
-0.300
-0.200
-0.100
0.000
0.100
0.200
0.300222 N445 N667 N
Figure 5.7 - Friction coefficient versus velocity (bronze bushing, 1.5 Hz oscillating frequency, SAE30 oil)
Velocity (rpm)-80 -60 -40 -20 0 20 40 60 80
Fric
tion
coef
ficie
nt
-0.300
-0.200
-0.100
0.000
0.100
0.200
0.300
222 N445 N667 N
Figure 5.8 - Friction coefficient versus velocity (bronze bushing, 1.5 Hz oscillating frequency, SAE40 oil)
78
motion, the oil flow is wedged into the contact track by the journal rotation and oscillates
with it. Different from typical journal bearings that operate under a constant, uni-
directional motion, in our tests the shaft always accelerates/decelerates during cycles.
When the load on the shaft is higher, the inertia of the shaft is greater, and the interaction
of shaft and oil becomes stronger. As a result, the retardation effect of the friction
coefficient is reduced. The shaft induces more oil into contact region to separate shaft and
bushing asperities. The friction hysteresis loop becomes narrower and the friction level
gets lower.
Under 667 N load and 0.5 Hz oscillating frequency for SAE30 oil, the hysteresis
loop almost vanishes. A flatter or narrower hysteresis loop implies that the friction
difference between increasing velocity and decreasing velocity is smaller. In precision
control industry, such as robotic positioning, the control engineer requires a suitable
friction model to compensate the effects of friction [162-168]. When the area within the
loop vanishes, the friction is easier to model. In addition, a flatter friction curve suggests
more stable friction performance.
5.2.4.2 Oil Inlet Temperature Effect
Figs. 5.9-5.14 demonstrate the oil inlet temperature effect on the local history of the
friction coefficient for 0.5 Hz, 1.0 Hz, and 1.5 Hz frequencies, respectively. The oil inlet
temperatures are 400C, 500C, and 600C. 445 N load is imposed on the bronze bushing.
To identify the lubrication regime which the tested journal bearing undergoes, the
Stribeck curve for a uni-directional rotation motion is characterized in Figs. 15 and 16.
The applied load is 445 N. The speed ranges from 2 to 500 rpm. The oil inlet temperature
changes from 400C, 500C, to 600C.
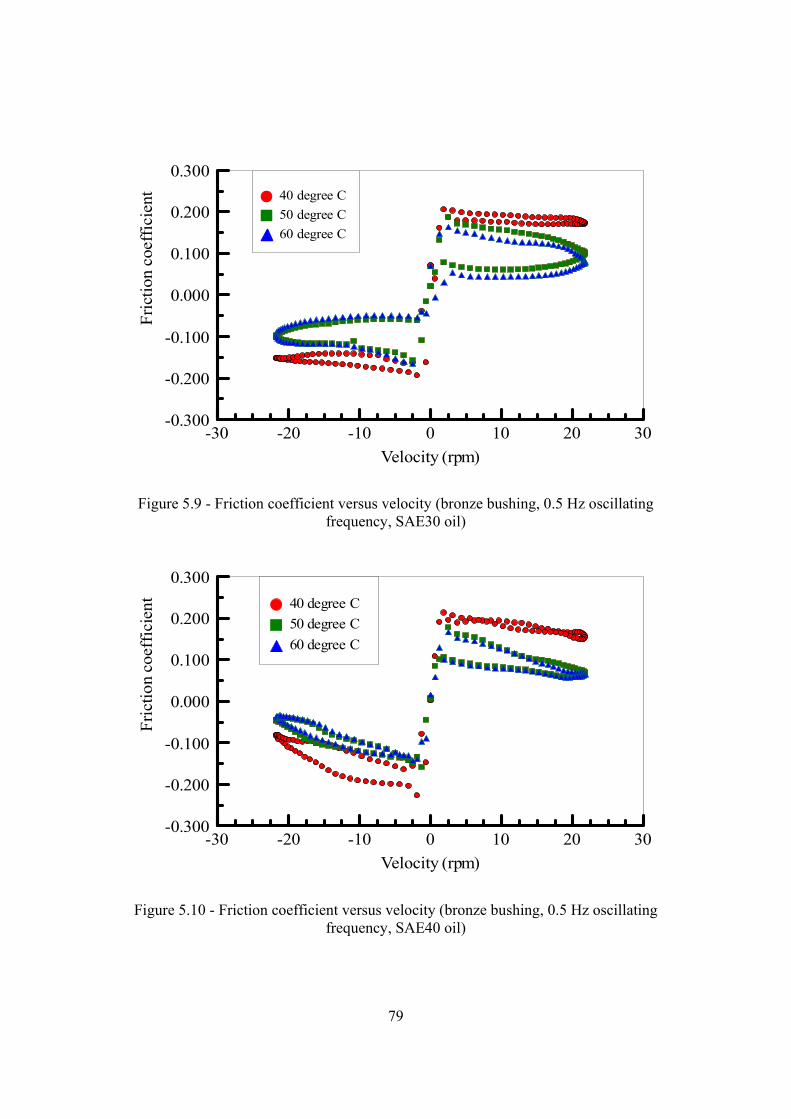
79
Velocity (rpm)-30 -20 -10 0 10 20 30
Fric
tion
coef
ficie
nt
-0.300
-0.200
-0.100
0.000
0.100
0.200
0.30040 degree C50 degree C60 degree C
Figure 5.9 - Friction coefficient versus velocity (bronze bushing, 0.5 Hz oscillating frequency, SAE30 oil)
Velocity (rpm)-30 -20 -10 0 10 20 30
Fric
tion
coef
ficie
nt
-0.300
-0.200
-0.100
0.000
0.100
0.200
0.30040 degree C50 degree C60 degree C
Figure 5.10 - Friction coefficient versus velocity (bronze bushing, 0.5 Hz oscillating frequency, SAE40 oil)
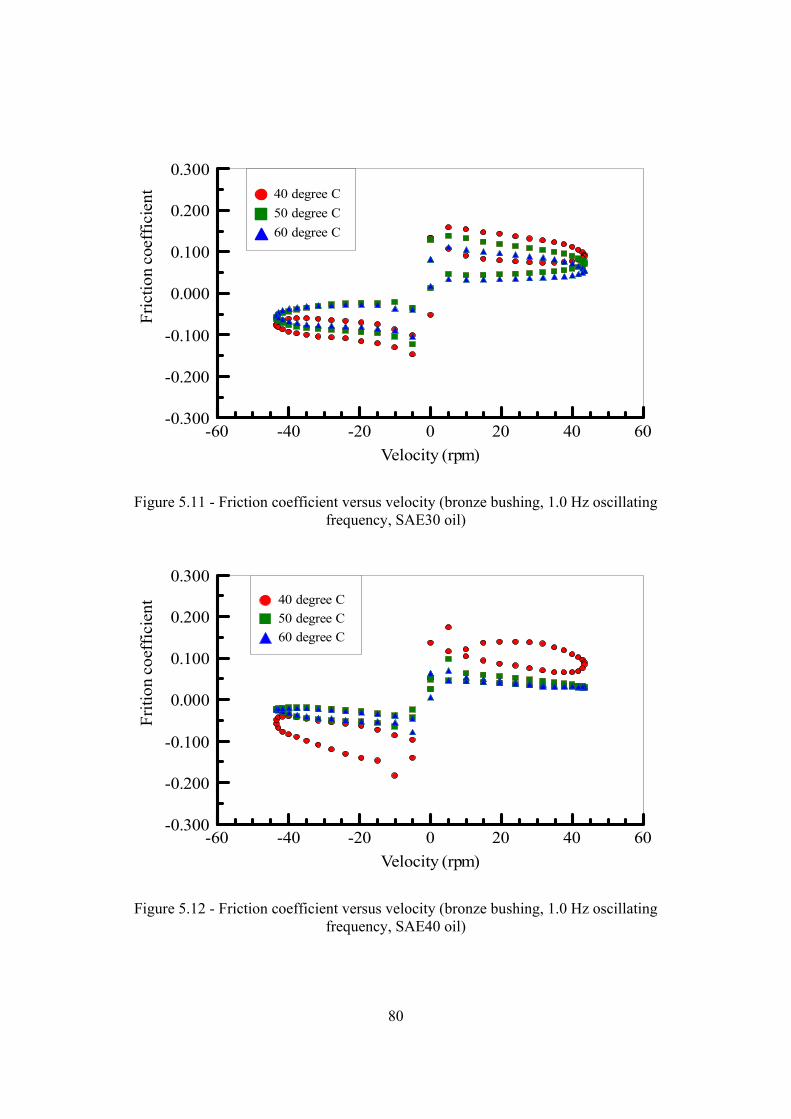
80
Velocity (rpm)-60 -40 -20 0 20 40 60
Fric
tion
coef
ficie
nt
-0.300
-0.200
-0.100
0.000
0.100
0.200
0.30040 degree C50 degree C60 degree C
Figure 5.11 - Friction coefficient versus velocity (bronze bushing, 1.0 Hz oscillating frequency, SAE30 oil)
Velocity (rpm)-60 -40 -20 0 20 40 60
Friti
on c
oeff
icie
nt
-0.300
-0.200
-0.100
0.000
0.100
0.200
0.30040 degree C50 degree C60 degree C
Figure 5.12 - Friction coefficient versus velocity (bronze bushing, 1.0 Hz oscillating frequency, SAE40 oil)
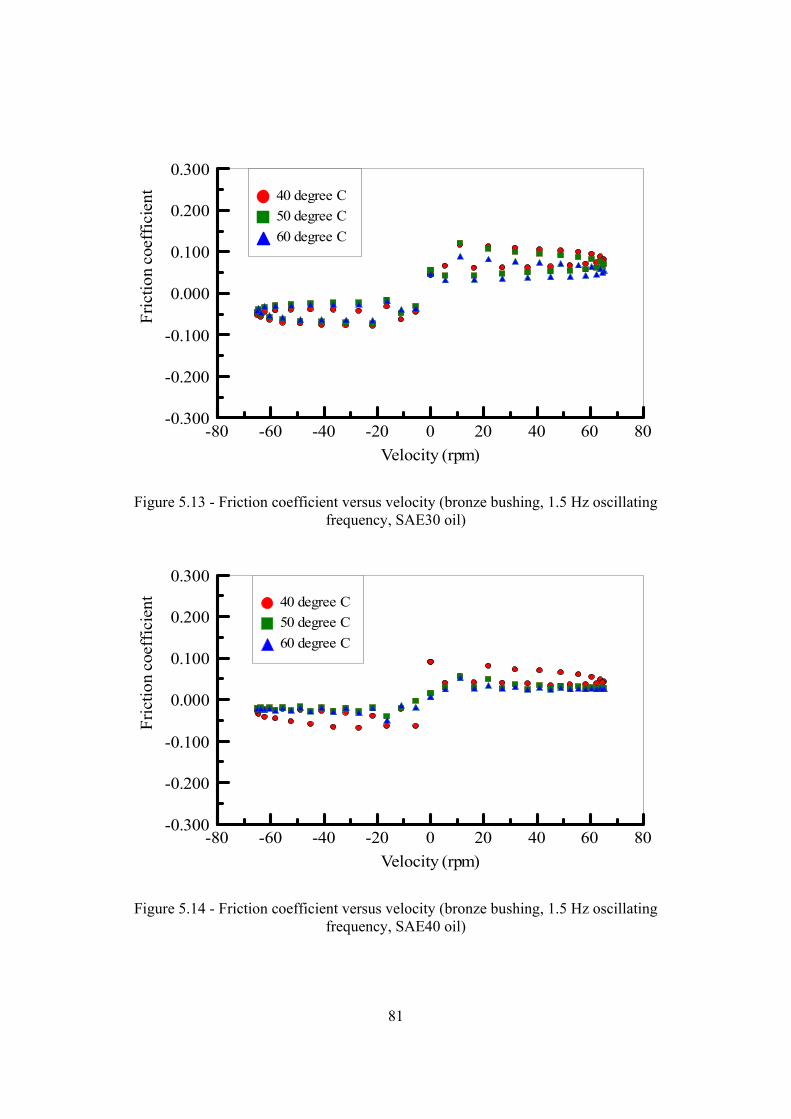
81
Velocity (rpm)-80 -60 -40 -20 0 20 40 60 80
Fric
tion
coef
ficie
nt
-0.300
-0.200
-0.100
0.000
0.100
0.200
0.30040 degree C50 degree C60 degree C
Figure 5.13 - Friction coefficient versus velocity (bronze bushing, 1.5 Hz oscillating frequency, SAE30 oil)
Velocity (rpm)-80 -60 -40 -20 0 20 40 60 80
Fric
tion
coef
ficie
nt
-0.300
-0.200
-0.100
0.000
0.100
0.200
0.30040 degree C50 degree C60 degree C
Figure 5.14 - Friction coefficient versus velocity (bronze bushing, 1.5 Hz oscillating frequency, SAE40 oil)

82
0.000
0.050
0.100
0.150
0.200
Fric
tion
coef
ficie
nt0.250
0 100 200 300 400 500Velocity (rpm)
40 degree C 50 degree C 60 degree C
Figure 5.15 - The Stribeck curve (SAE30 oil, 445N load, bronze bushing, unidirectional rotation)
Velocity (rpm)0 100 200 300 400 500
Fric
tion
coef
ficie
nt
0.000
0.050
0.100
0.150
0.200
0.25040 degree C50 degree C60 degree C
Figure 5.16 - The Stribeck curve (SAE40 oil, 445N load, bronze bushing, unidirectional
rotation)
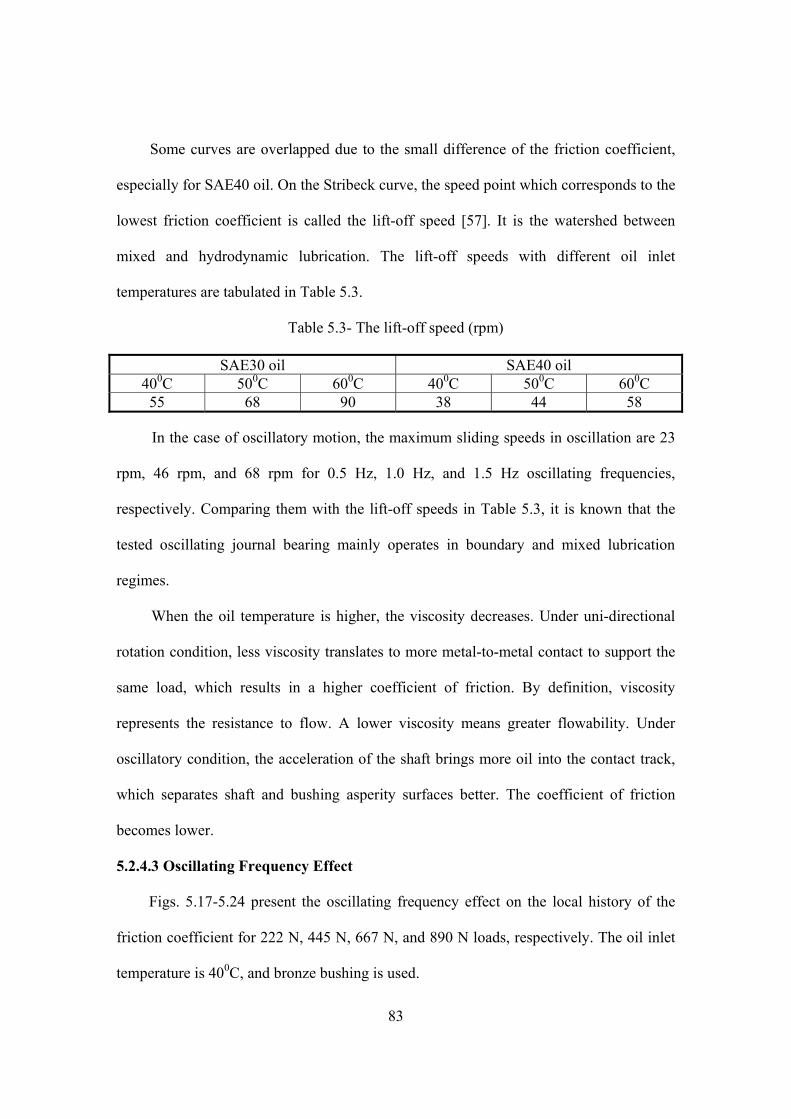
83
Some curves are overlapped due to the small difference of the friction coefficient,
especially for SAE40 oil. On the Stribeck curve, the speed point which corresponds to the
lowest friction coefficient is called the lift-off speed [57]. It is the watershed between
mixed and hydrodynamic lubrication. The lift-off speeds with different oil inlet
temperatures are tabulated in Table 5.3.
Table 5.3- The lift-off speed (rpm)
SAE30 oil SAE40 oil 400C 500C 600C 400C 500C 600C 55 68 90 38 44 58
In the case of oscillatory motion, the maximum sliding speeds in oscillation are 23
rpm, 46 rpm, and 68 rpm for 0.5 Hz, 1.0 Hz, and 1.5 Hz oscillating frequencies,
respectively. Comparing them with the lift-off speeds in Table 5.3, it is known that the
tested oscillating journal bearing mainly operates in boundary and mixed lubrication
regimes.
When the oil temperature is higher, the viscosity decreases. Under uni-directional
rotation condition, less viscosity translates to more metal-to-metal contact to support the
same load, which results in a higher coefficient of friction. By definition, viscosity
represents the resistance to flow. A lower viscosity means greater flowability. Under
oscillatory condition, the acceleration of the shaft brings more oil into the contact track,
which separates shaft and bushing asperity surfaces better. The coefficient of friction
becomes lower.
5.2.4.3 Oscillating Frequency Effect
Figs. 5.17-5.24 present the oscillating frequency effect on the local history of the
friction coefficient for 222 N, 445 N, 667 N, and 890 N loads, respectively. The oil inlet
temperature is 400C, and bronze bushing is used.

84
Velocity (rpm)-80 -60 -40 -20 0 20 40 60 80
Fric
tion
coef
ficie
nt
-0.300
-0.200
-0.100
0.000
0.100
0.200
0.3000.5 Hz1.0 Hz1.5 Hz
Figure 5.17 - Friction coefficient versus velocity (bronze bushing, 222 N load, SAE30 oil)
Velocity (rpm)-80 -60 -40 -20 0 20 40 60 80
Fric
tion
coef
ficie
nt
-0.300
-0.200
-0.100
0.000
0.100
0.200
0.3000.5 Hz1.0 Hz1.5 Hz
Figure 5.18 - Friction coefficient versus velocity (bronze bushing, 222 N load, SAE40 oil)
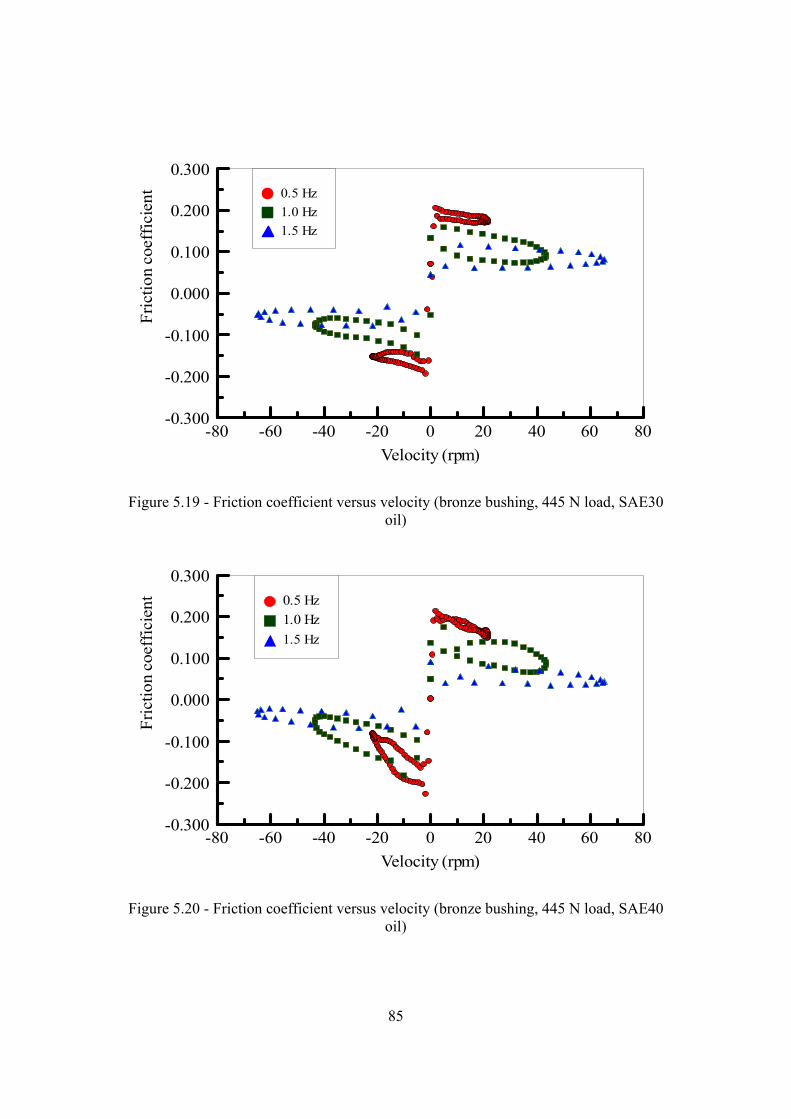
85
Velocity (rpm)-80 -60 -40 -20 0 20 40 60 80
Fric
tion
coef
ficie
nt
-0.300
-0.200
-0.100
0.000
0.100
0.200
0.3000.5 Hz1.0 Hz1.5 Hz
Figure 5.19 - Friction coefficient versus velocity (bronze bushing, 445 N load, SAE30 oil)
Velocity (rpm)-80 -60 -40 -20 0 20 40 60 80
Fric
tion
coef
ficie
nt
-0.300
-0.200
-0.100
0.000
0.100
0.200
0.3000.5 Hz1.0 Hz1.5 Hz
Figure 5.20 - Friction coefficient versus velocity (bronze bushing, 445 N load, SAE40 oil)
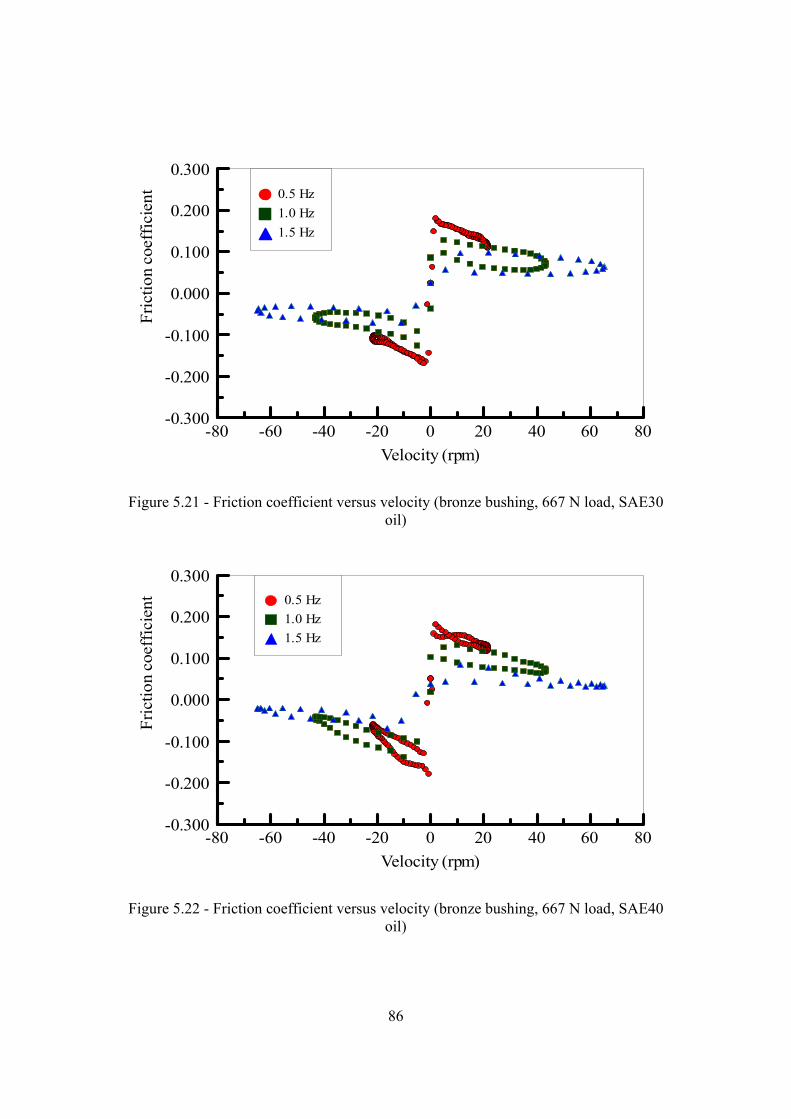
86
Velocity (rpm)-80 -60 -40 -20 0 20 40 60 80
Fric
tion
coef
ficie
nt
-0.300
-0.200
-0.100
0.000
0.100
0.200
0.3000.5 Hz1.0 Hz1.5 Hz
Figure 5.21 - Friction coefficient versus velocity (bronze bushing, 667 N load, SAE30 oil)
Velocity (rpm)-80 -60 -40 -20 0 20 40 60 80
Fric
tion
coef
ficie
nt
-0.300
-0.200
-0.100
0.000
0.100
0.200
0.3000.5 Hz1.0 Hz1.5 Hz
Figure 5.22 - Friction coefficient versus velocity (bronze bushing, 667 N load, SAE40 oil)

87
Velocity (rpm)-80 -60 -40 -20 0 20 40 60 80
Fric
tion
coef
ficie
nt
-0.300
-0.200
-0.100
0.000
0.100
0.200
0.3000.5 Hz1.0 Hz1.5 Hz
Figure 5.23 - Friction coefficient versus velocity (bronze bushing, 890 N load, SAE30 oil)
Velocity (rpm)-80 -60 -40 -20 0 20 40 60 80
Fric
tion
coef
ficie
nt
-0.300
-0.200
-0.100
0.000
0.100
0.200
0.3000.5 Hz1.0 Hz1.5 Hz
Figure 5.24 - Friction coefficient versus velocity (bronze bushing, 890 N load, SAE40 oil)

88
Under each load, the friction hysteresis loop is flattened by a higher oscillating
frequency. The higher the velocity of the shaft, the greater is the amount of oil drawn into
the shaft and bushing contact track, which results in a thicker film thickness and a lower
friction coefficient.
A flatter friction coefficient curve implies that there is less variability for the
coefficient of friction as the velocity changes, which translates to more stable friction
performance. This is preferred for friction control of precision machinery in which the
bearings operate in oscillatory fashion.
The analysis on the load effect, the oil inlet temperature effect and the oscillating
frequency effect reveals that when more oil is drawn into asperity contact region, the
friction level is lower and the friction hysteresis loop is narrower and flatter.
The area under the friction-velocity curve represents the total frictional heat flux
∑q in that period. According to its variation, the velocity can be divided into four
stages: positive acceleration, positive deceleration, negative acceleration and negative
deceleration (referring to Fig. 5.1). In one stage, the total frictional heat flux can be
expressed as
( )∫∑ =v
pdvvfq (5.1)
Assuming that the pressure p is constant, Eq. (1) simplifies into
( )∫∑ =v
dvvfpq (5.2)
Let ∑ 1q represent the area under the friction curve with an increasing velocity and
∑ 2q denote the area under the friction curve with a decreasing velocity. Then, the area
within the hysteresis loop can be formulated as
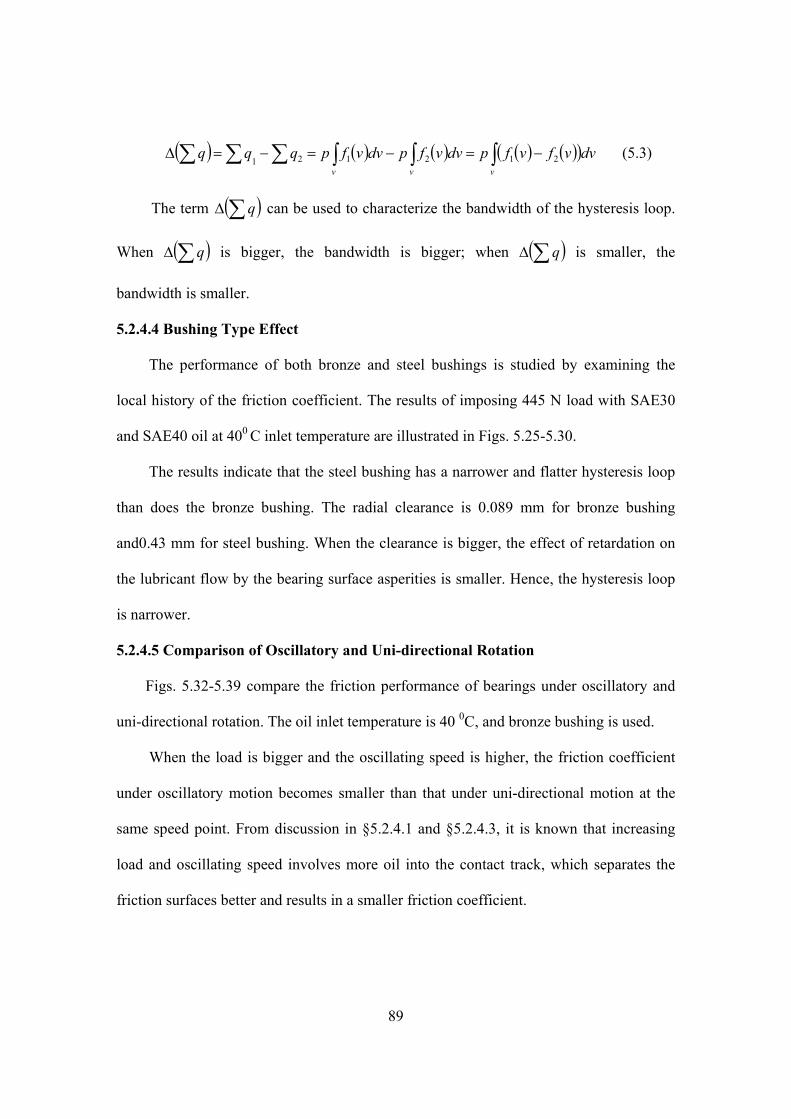
89
( ) ( ) ( ) ( ) ( )( )∫∫∫∑∑∑ −=−=−=∆vvv
dvvfvfpdvvfpdvvfpqqq 212121 (5.3)
The term ( )∑∆ q can be used to characterize the bandwidth of the hysteresis loop.
When ( )∑∆ q is bigger, the bandwidth is bigger; when ( )∑∆ q is smaller, the
bandwidth is smaller.
5.2.4.4 Bushing Type Effect
The performance of both bronze and steel bushings is studied by examining the
local history of the friction coefficient. The results of imposing 445 N load with SAE30
and SAE40 oil at 400 C inlet temperature are illustrated in Figs. 5.25-5.30.
The results indicate that the steel bushing has a narrower and flatter hysteresis loop
than does the bronze bushing. The radial clearance is 0.089 mm for bronze bushing
and0.43 mm for steel bushing. When the clearance is bigger, the effect of retardation on
the lubricant flow by the bearing surface asperities is smaller. Hence, the hysteresis loop
is narrower.
5.2.4.5 Comparison of Oscillatory and Uni-directional Rotation
Figs. 5.32-5.39 compare the friction performance of bearings under oscillatory and
uni-directional rotation. The oil inlet temperature is 40 0C, and bronze bushing is used.
When the load is bigger and the oscillating speed is higher, the friction coefficient
under oscillatory motion becomes smaller than that under uni-directional motion at the
same speed point. From discussion in §5.2.4.1 and §5.2.4.3, it is known that increasing
load and oscillating speed involves more oil into the contact track, which separates the
friction surfaces better and results in a smaller friction coefficient.
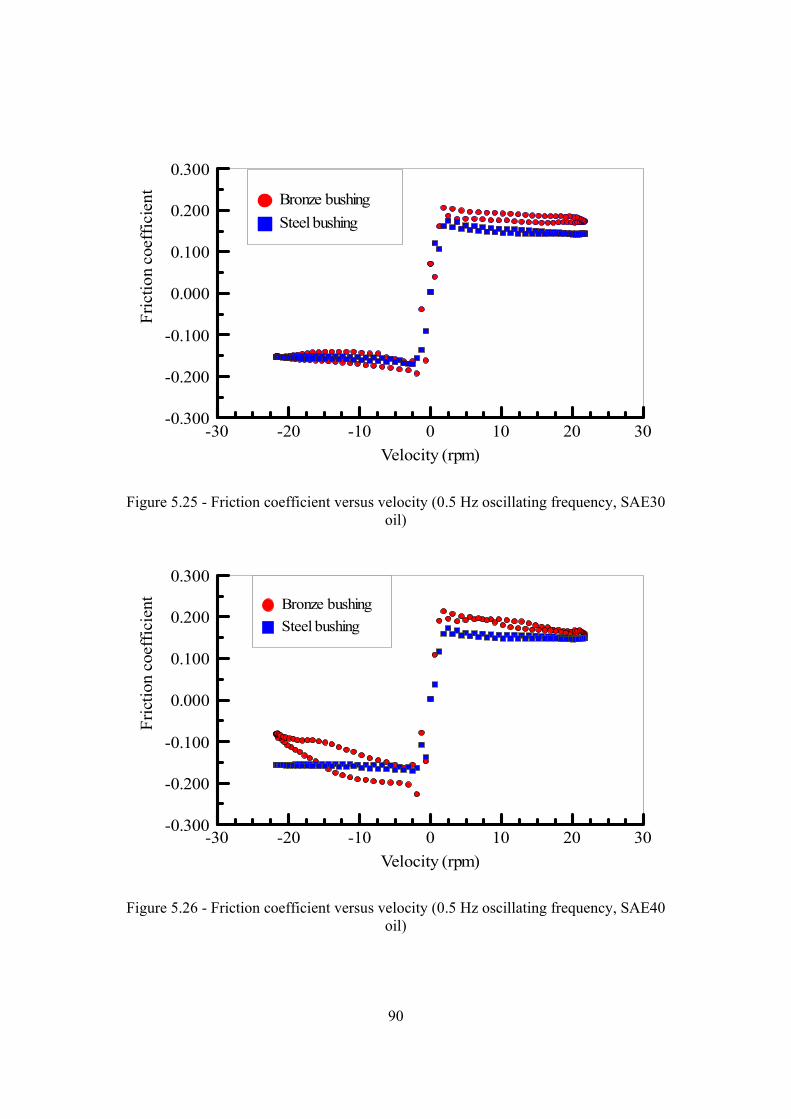
90
Velocity (rpm)-30 -20 -10 0 10 20 30
Fric
tion
coef
ficie
nt
-0.300
-0.200
-0.100
0.000
0.100
0.200
0.300
Bronze bushingSteel bushing
Figure 5.25 - Friction coefficient versus velocity (0.5 Hz oscillating frequency, SAE30 oil)
Velocity (rpm)-30 -20 -10 0 10 20 30
Fric
tion
coef
ficie
nt
-0.300
-0.200
-0.100
0.000
0.100
0.200
0.300Bronze bushingSteel bushing
Figure 5.26 - Friction coefficient versus velocity (0.5 Hz oscillating frequency, SAE40 oil)
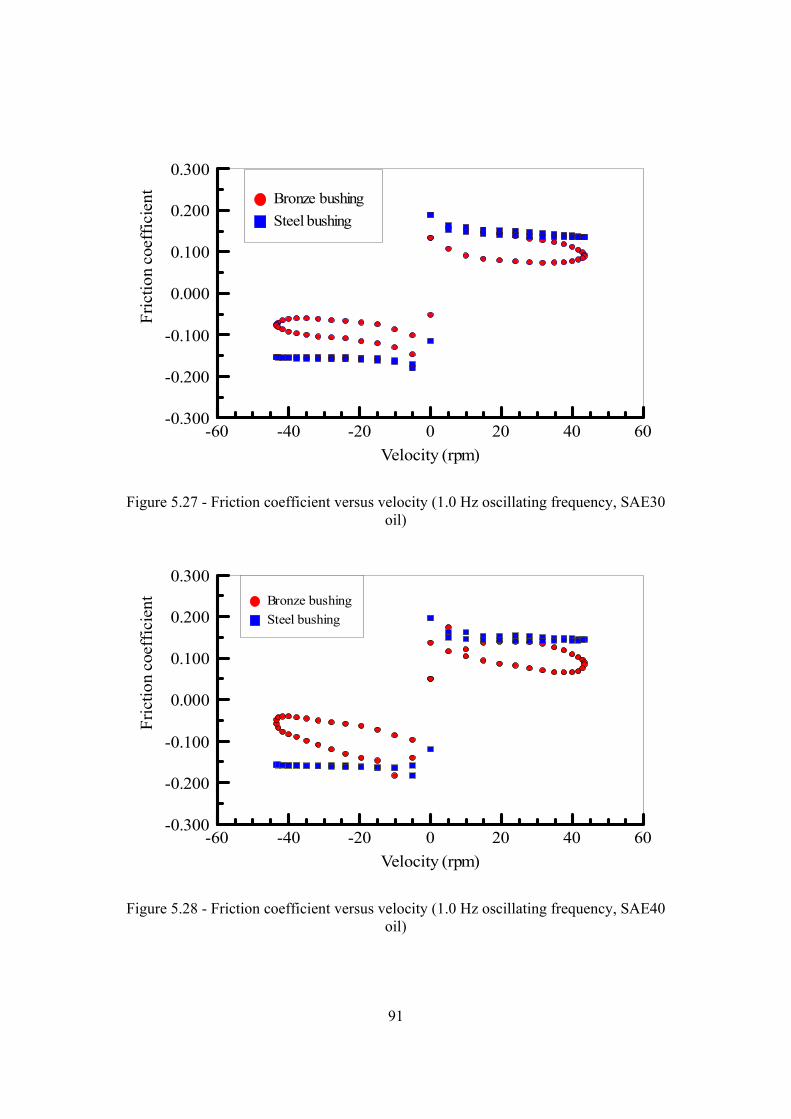
91
Velocity (rpm)-60 -40 -20 0 20 40 60
Fric
tion
coef
ficie
nt
-0.300
-0.200
-0.100
0.000
0.100
0.200
0.300
Bronze bushingSteel bushing
Figure 5.27 - Friction coefficient versus velocity (1.0 Hz oscillating frequency, SAE30 oil)
Velocity (rpm)-60 -40 -20 0 20 40 60
Fric
tion
coef
ficie
nt
-0.300
-0.200
-0.100
0.000
0.100
0.200
0.300Bronze bushingSteel bushing
Figure 5.28 - Friction coefficient versus velocity (1.0 Hz oscillating frequency, SAE40 oil)
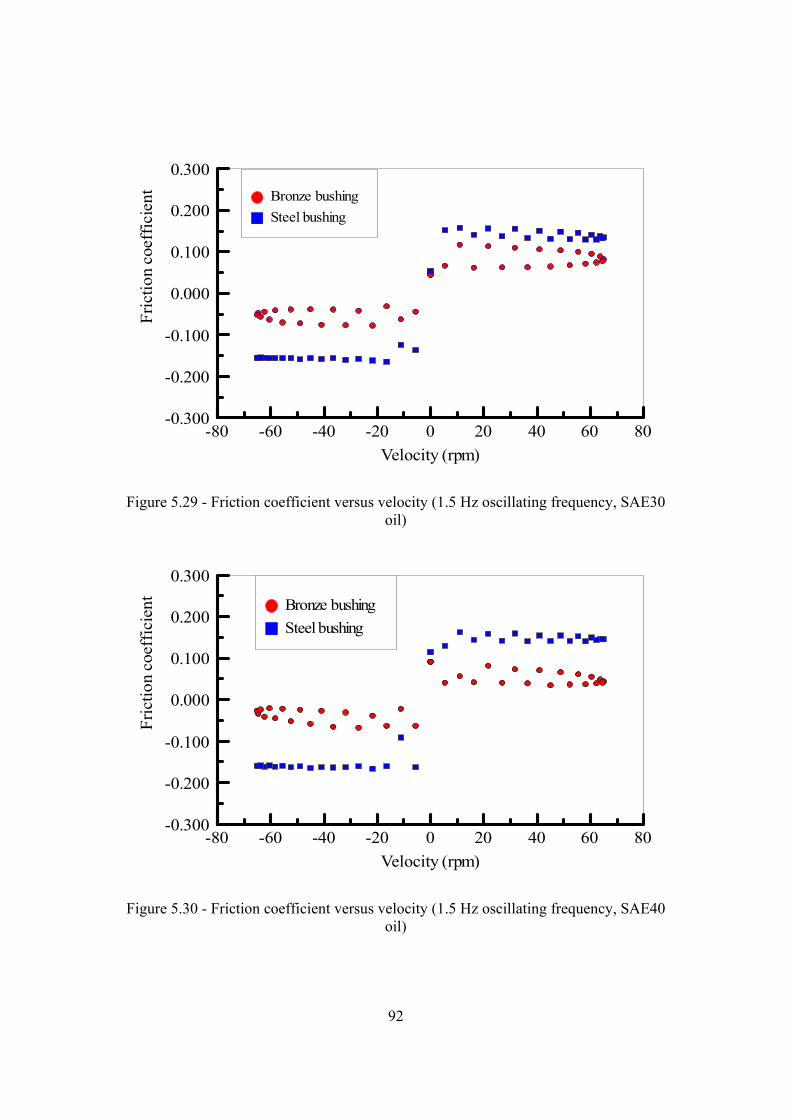
92
Velocity (rpm)-80 -60 -40 -20 0 20 40 60 80
Fric
tion
coef
ficie
nt
-0.300
-0.200
-0.100
0.000
0.100
0.200
0.300Bronze bushingSteel bushing
Figure 5.29 - Friction coefficient versus velocity (1.5 Hz oscillating frequency, SAE30 oil)
Velocity (rpm)-80 -60 -40 -20 0 20 40 60 80
Fric
tion
coef
ficie
nt
-0.300
-0.200
-0.100
0.000
0.100
0.200
0.300
Bronze bushingSteel bushing
Figure 5.30 - Friction coefficient versus velocity (1.5 Hz oscillating frequency, SAE40 oil)
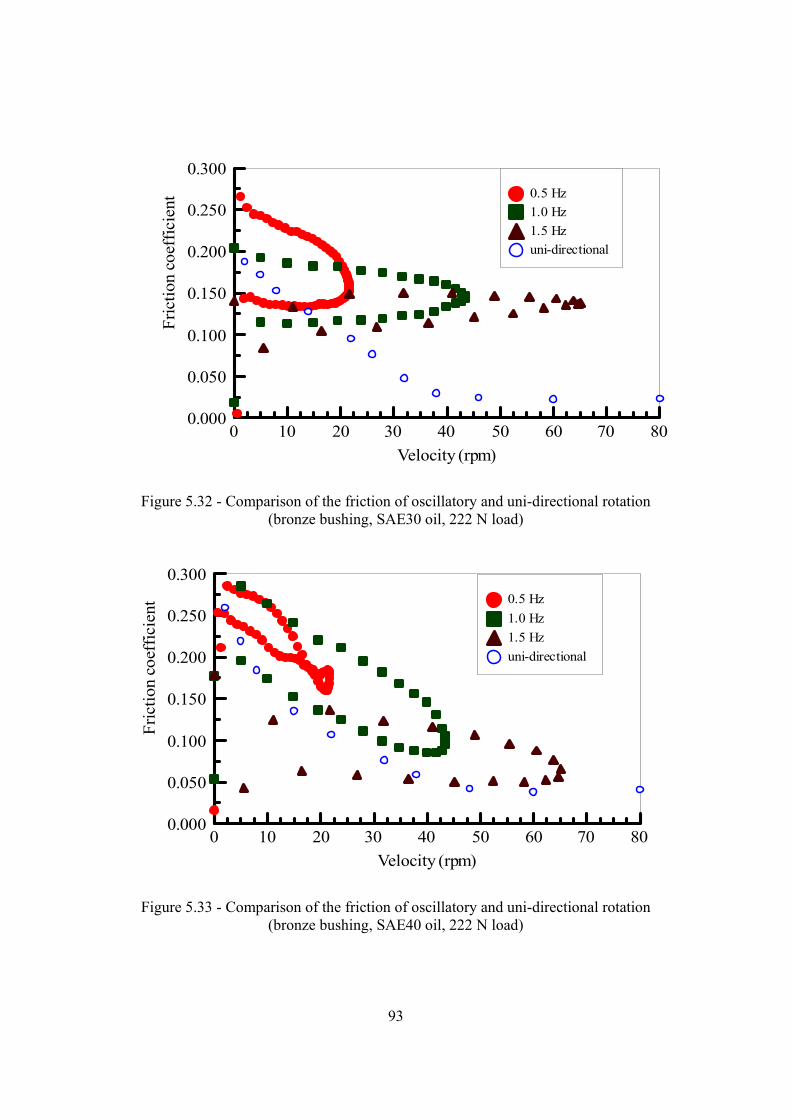
93
Velocity (rpm)0 10 20 30 40 50 60 70 80
Fric
tion
coef
ficie
nt
0.000
0.050
0.100
0.150
0.200
0.250
0.3000.5 Hz1.0 Hz1.5 Hzuni-directional
Figure 5.32 - Comparison of the friction of oscillatory and uni-directional rotation (bronze bushing, SAE30 oil, 222 N load)
Velocity (rpm)0 10 20 30 40 50 60 70 80
Fric
tion
coef
ficie
nt
0.000
0.050
0.100
0.150
0.200
0.250
0.3000.5 Hz1.0 Hz1.5 Hzuni-directional
Figure 5.33 - Comparison of the friction of oscillatory and uni-directional rotation (bronze bushing, SAE40 oil, 222 N load)

94
Velocity (rpm)0 10 20 30 40 50 60 70 80
Fric
tion
coef
ficie
nt
0.000
0.050
0.100
0.150
0.200
0.250
0.3000.5 Hz1.0 Hz1.5 Hzuni-directional
Figure 5.34 - Comparison of the friction of oscillatory and uni-directional rotation (bronze bushing, SAE30 oil, 445 N load)
Velocity (rpm)0 10 20 30 40 50 60 70 80
Fric
tion
coef
ficie
nt
0.000
0.050
0.100
0.150
0.200
0.250
0.3000.5 Hz1.0 Hz1.5 Hzuni-directional
Figure 5.35 - Comparison of the friction of oscillatory and uni-directional rotation (bronze bushing, SAE40 oil, 445 N load)
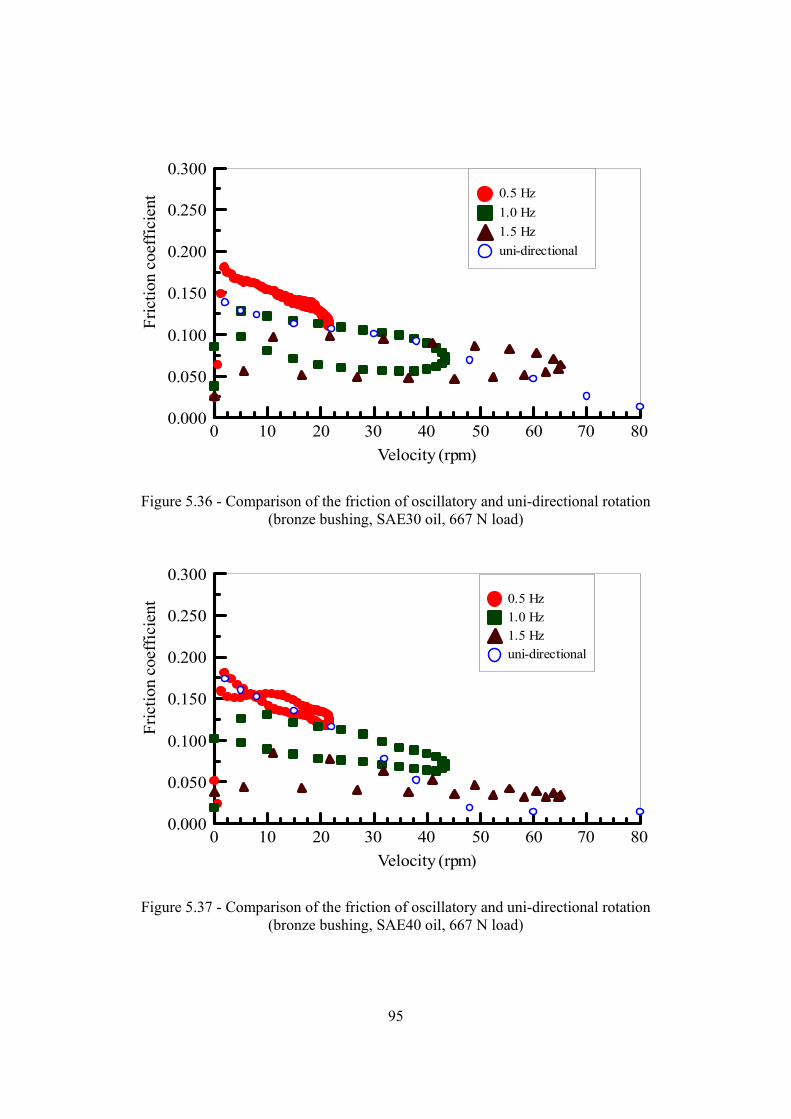
95
Velocity (rpm)0 10 20 30 40 50 60 70 80
Fric
tion
coef
ficie
nt
0.000
0.050
0.100
0.150
0.200
0.250
0.3000.5 Hz1.0 Hz1.5 Hzuni-directional
Figure 5.36 - Comparison of the friction of oscillatory and uni-directional rotation (bronze bushing, SAE30 oil, 667 N load)
Velocity (rpm)0 10 20 30 40 50 60 70 80
Fric
tion
coef
ficie
nt
0.000
0.050
0.100
0.150
0.200
0.250
0.3000.5 Hz1.0 Hz1.5 Hzuni-directional
Figure 5.37 - Comparison of the friction of oscillatory and uni-directional rotation (bronze bushing, SAE40 oil, 667 N load)
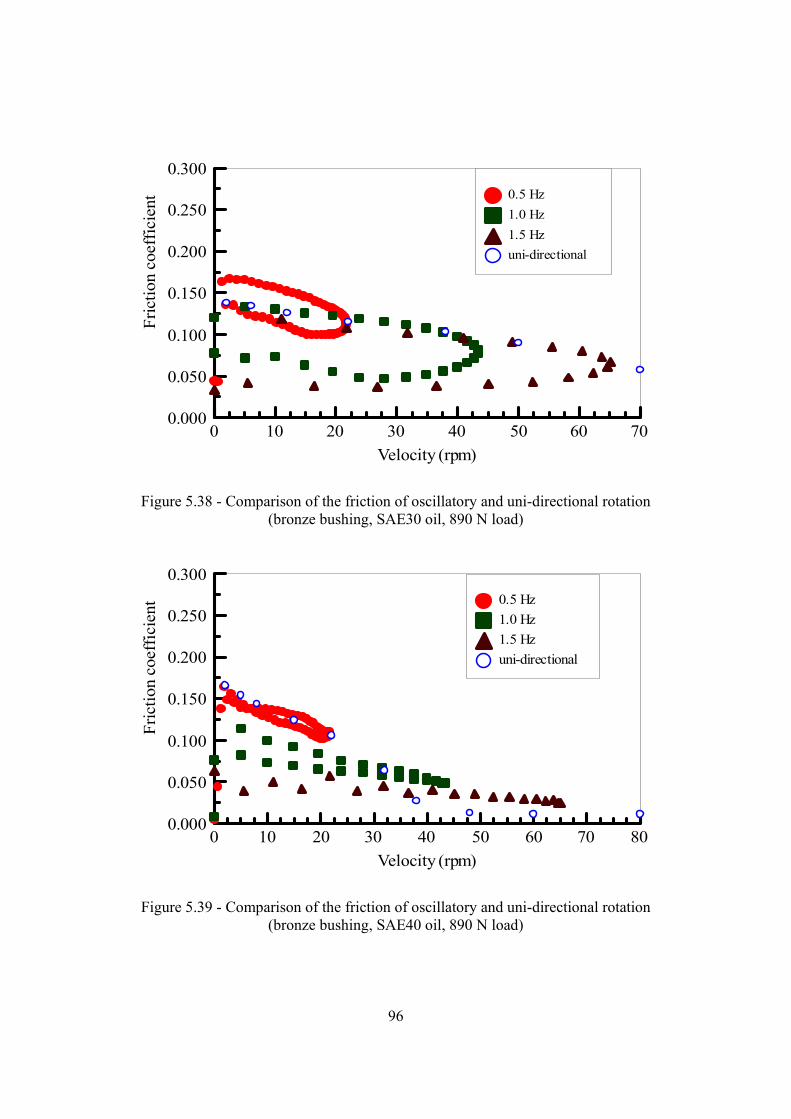
96
Velocity (rpm)0 10 20 30 40 50 60 70
Fric
tion
coef
ficie
nt
0.000
0.050
0.100
0.150
0.200
0.250
0.3000.5 Hz1.0 Hz1.5 Hzuni-directional
Figure 5.38 - Comparison of the friction of oscillatory and uni-directional rotation (bronze bushing, SAE30 oil, 890 N load)
Velocity (rpm)0 10 20 30 40 50 60 70 80
Fric
tion
coef
ficie
nt
0.000
0.050
0.100
0.150
0.200
0.250
0.3000.5 Hz1.0 Hz1.5 Hzuni-directional
Figure 5.39 - Comparison of the friction of oscillatory and uni-directional rotation (bronze bushing, SAE40 oil, 890 N load)
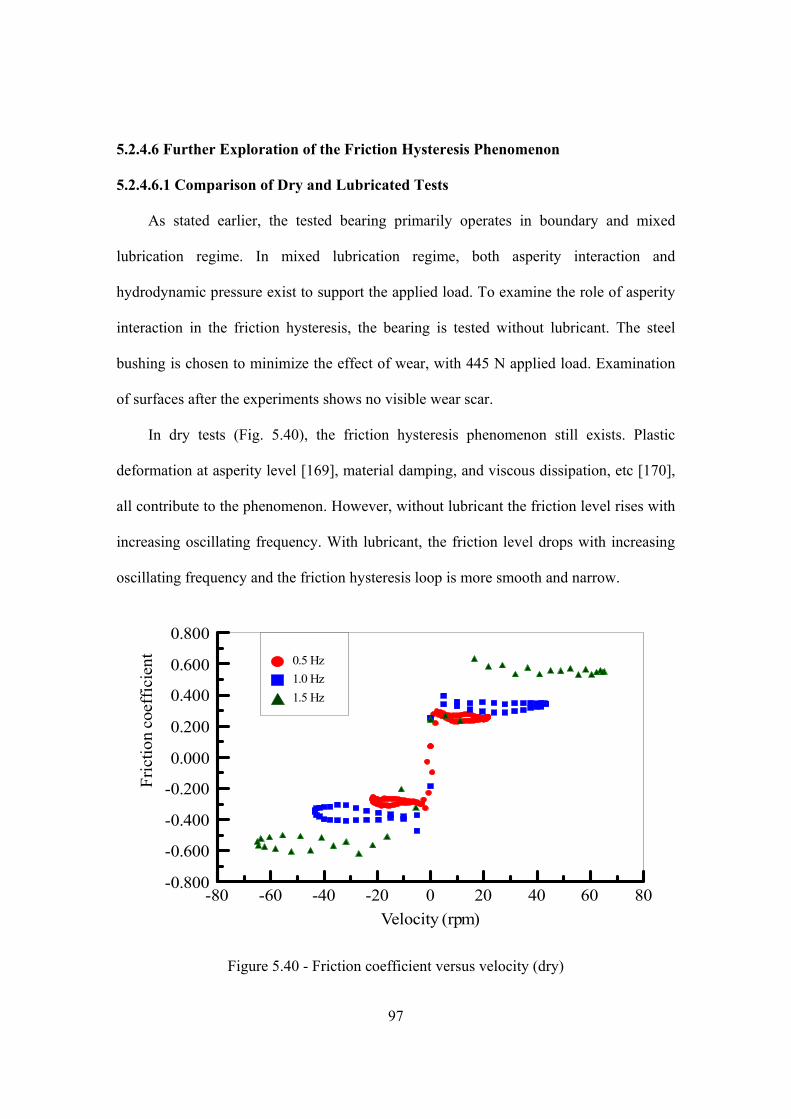
97
5.2.4.6 Further Exploration of the Friction Hysteresis Phenomenon
5.2.4.6.1 Comparison of Dry and Lubricated Tests
As stated earlier, the tested bearing primarily operates in boundary and mixed
lubrication regime. In mixed lubrication regime, both asperity interaction and
hydrodynamic pressure exist to support the applied load. To examine the role of asperity
interaction in the friction hysteresis, the bearing is tested without lubricant. The steel
bushing is chosen to minimize the effect of wear, with 445 N applied load. Examination
of surfaces after the experiments shows no visible wear scar.
In dry tests (Fig. 5.40), the friction hysteresis phenomenon still exists. Plastic
deformation at asperity level [169], material damping, and viscous dissipation, etc [170],
all contribute to the phenomenon. However, without lubricant the friction level rises with
increasing oscillating frequency. With lubricant, the friction level drops with increasing
oscillating frequency and the friction hysteresis loop is more smooth and narrow.
Velocity (rpm)-80 -60 -40 -20 0 20 40 60 80
Fric
tion
coef
ficie
nt
-0.800
-0.600
-0.400
-0.200
0.000
0.200
0.400
0.600
0.8000.5 Hz1.0 Hz1.5 Hz
Figure 5.40 - Friction coefficient versus velocity (dry)
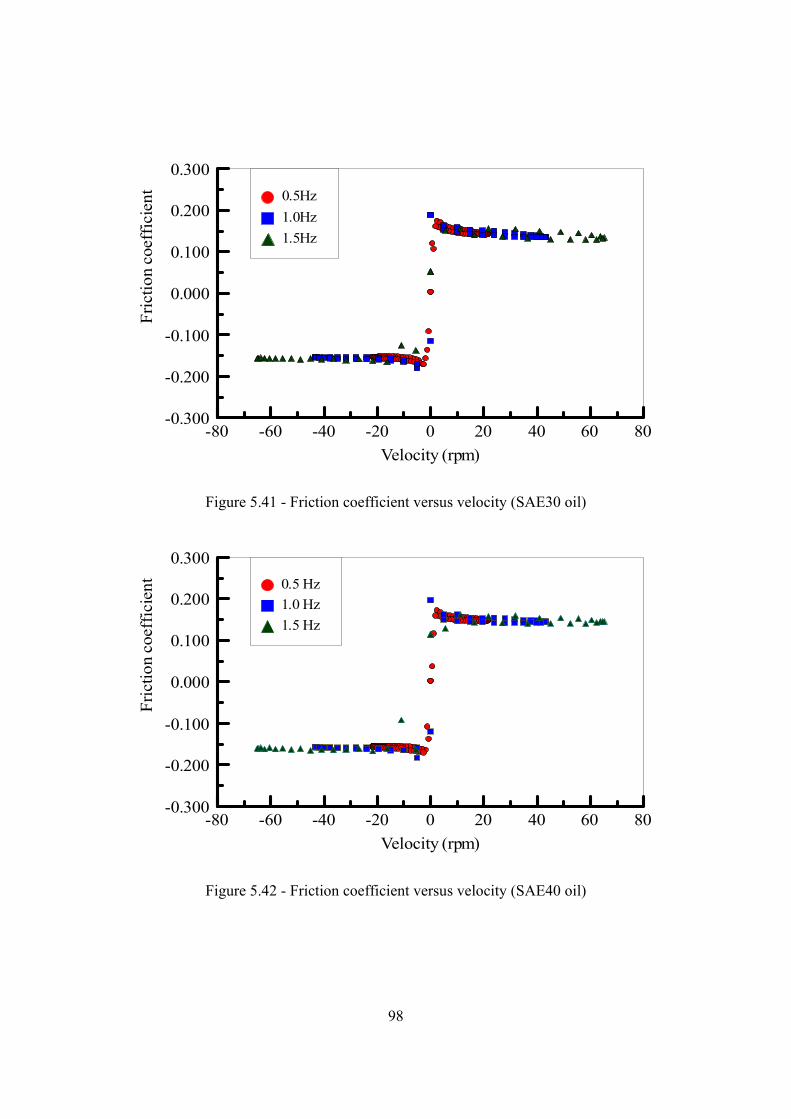
98
Velocity (rpm)-80 -60 -40 -20 0 20 40 60 80
Fric
tion
coef
ficie
nt
-0.300
-0.200
-0.100
0.000
0.100
0.200
0.3000.5Hz1.0Hz1.5Hz
Figure 5.41 - Friction coefficient versus velocity (SAE30 oil)
Velocity (rpm)-80 -60 -40 -20 0 20 40 60 80
Fric
tion
coef
ficie
nt
-0.300
-0.200
-0.100
0.000
0.100
0.200
0.3000.5 Hz1.0 Hz1.5 Hz
Figure 5.42 - Friction coefficient versus velocity (SAE40 oil)
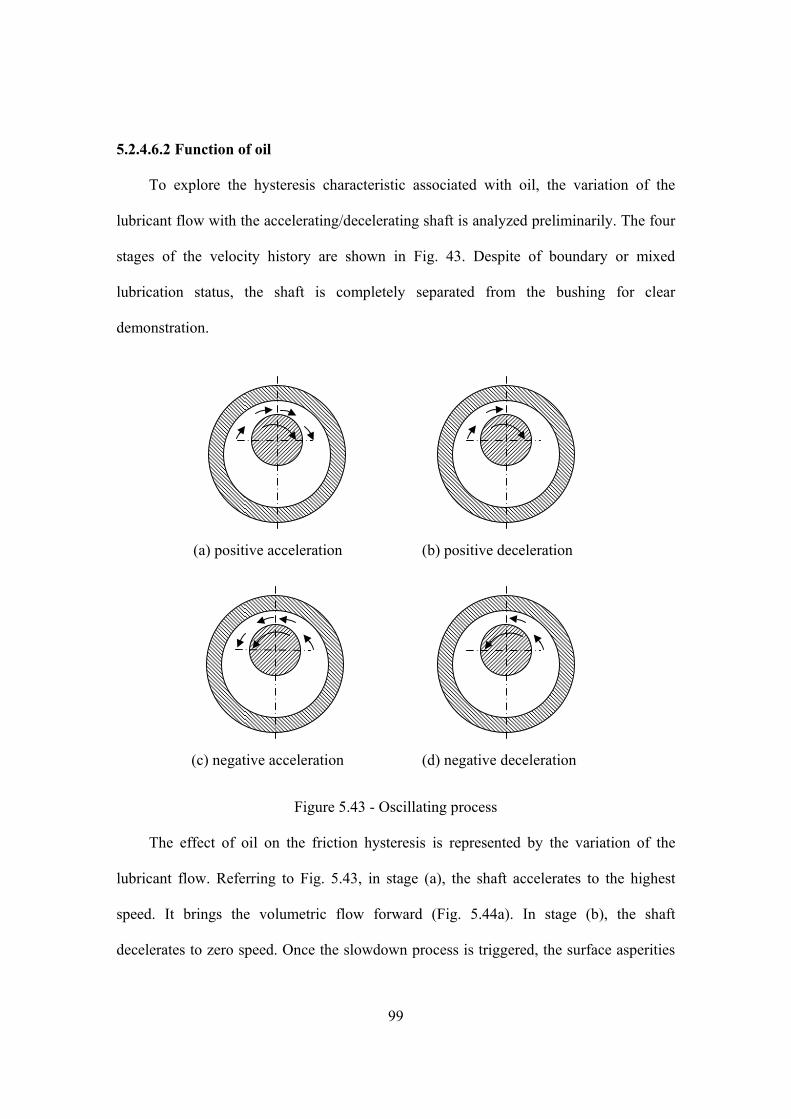
99
5.2.4.6.2 Function of oil
To explore the hysteresis characteristic associated with oil, the variation of the
lubricant flow with the accelerating/decelerating shaft is analyzed preliminarily. The four
stages of the velocity history are shown in Fig. 43. Despite of boundary or mixed
lubrication status, the shaft is completely separated from the bushing for clear
demonstration.
Figure 5.43 - Oscillating process
The effect of oil on the friction hysteresis is represented by the variation of the
lubricant flow. Referring to Fig. 5.43, in stage (a), the shaft accelerates to the highest
speed. It brings the volumetric flow forward (Fig. 5.44a). In stage (b), the shaft
decelerates to zero speed. Once the slowdown process is triggered, the surface asperities
(a) positive acceleration (b) positive deceleration
(c) negative acceleration (d) negative deceleration
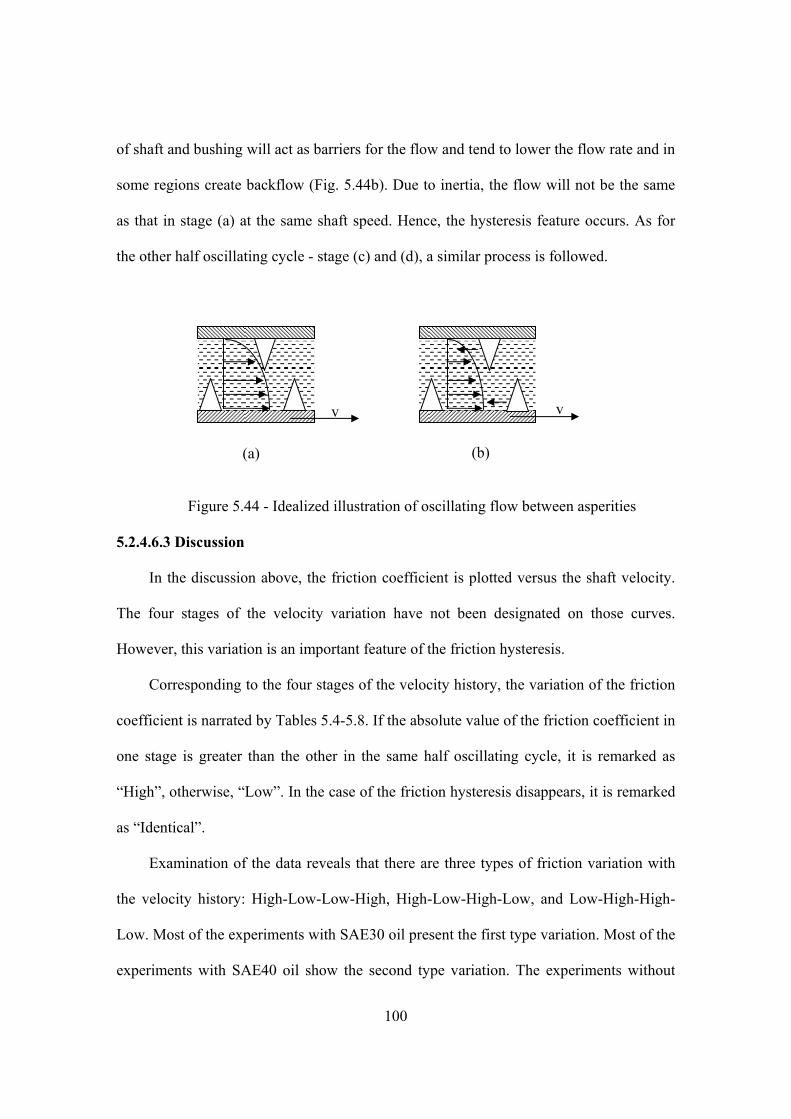
100
of shaft and bushing will act as barriers for the flow and tend to lower the flow rate and in
some regions create backflow (Fig. 5.44b). Due to inertia, the flow will not be the same
as that in stage (a) at the same shaft speed. Hence, the hysteresis feature occurs. As for
the other half oscillating cycle - stage (c) and (d), a similar process is followed.
Figure 5.44 - Idealized illustration of oscillating flow between asperities
5.2.4.6.3 Discussion
In the discussion above, the friction coefficient is plotted versus the shaft velocity.
The four stages of the velocity variation have not been designated on those curves.
However, this variation is an important feature of the friction hysteresis.
Corresponding to the four stages of the velocity history, the variation of the friction
coefficient is narrated by Tables 5.4-5.8. If the absolute value of the friction coefficient in
one stage is greater than the other in the same half oscillating cycle, it is remarked as
“High”, otherwise, “Low”. In the case of the friction hysteresis disappears, it is remarked
as “Identical”.
Examination of the data reveals that there are three types of friction variation with
the velocity history: High-Low-Low-High, High-Low-High-Low, and Low-High-High-
Low. Most of the experiments with SAE30 oil present the first type variation. Most of the
experiments with SAE40 oil show the second type variation. The experiments without
v v
(a) (b)
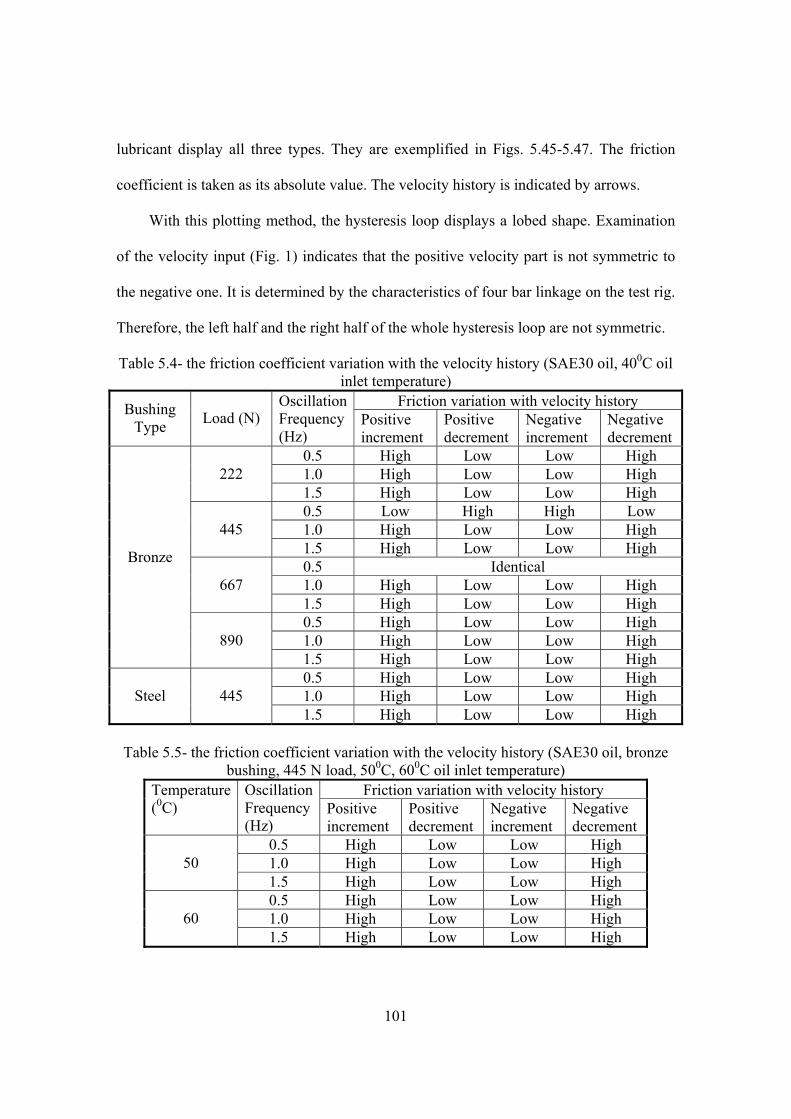
101
lubricant display all three types. They are exemplified in Figs. 5.45-5.47. The friction
coefficient is taken as its absolute value. The velocity history is indicated by arrows.
With this plotting method, the hysteresis loop displays a lobed shape. Examination
of the velocity input (Fig. 1) indicates that the positive velocity part is not symmetric to
the negative one. It is determined by the characteristics of four bar linkage on the test rig.
Therefore, the left half and the right half of the whole hysteresis loop are not symmetric.
Table 5.4- the friction coefficient variation with the velocity history (SAE30 oil, 400C oil inlet temperature)
Friction variation with velocity history Bushing Type Load (N)
OscillationFrequency (Hz)
Positive increment
Positive decrement
Negative increment
Negative decrement
0.5 High Low Low High 1.0 High Low Low High 222 1.5 High Low Low High 0.5 Low High High Low 1.0 High Low Low High 445 1.5 High Low Low High 0.5 Identical 1.0 High Low Low High 667 1.5 High Low Low High 0.5 High Low Low High 1.0 High Low Low High
Bronze
890 1.5 High Low Low High 0.5 High Low Low High 1.0 High Low Low High Steel 445 1.5 High Low Low High
Table 5.5- the friction coefficient variation with the velocity history (SAE30 oil, bronze
bushing, 445 N load, 500C, 600C oil inlet temperature) Friction variation with velocity history Temperature
(0C) Oscillation Frequency (Hz)
Positive increment
Positive decrement
Negative increment
Negative decrement
0.5 High Low Low High 1.0 High Low Low High 50 1.5 High Low Low High 0.5 High Low Low High 1.0 High Low Low High 60 1.5 High Low Low High
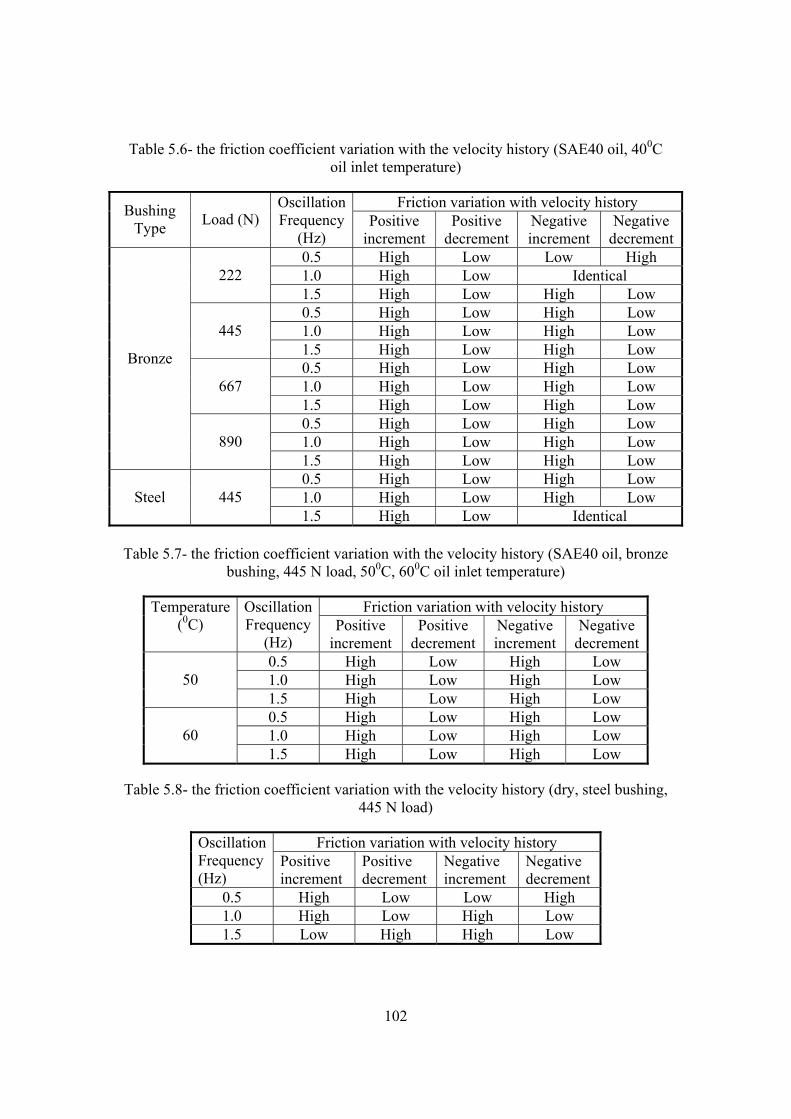
102
Table 5.6- the friction coefficient variation with the velocity history (SAE40 oil, 400C oil inlet temperature)
Friction variation with velocity history Bushing Type Load (N)
OscillationFrequency
(Hz) Positive
increment Positive
decrement Negative increment
Negative decrement
0.5 High Low Low High 1.0 High Low Identical 222 1.5 High Low High Low 0.5 High Low High Low 1.0 High Low High Low 445 1.5 High Low High Low 0.5 High Low High Low 1.0 High Low High Low 667 1.5 High Low High Low 0.5 High Low High Low 1.0 High Low High Low
Bronze
890 1.5 High Low High Low 0.5 High Low High Low 1.0 High Low High Low Steel 445 1.5 High Low Identical
Table 5.7- the friction coefficient variation with the velocity history (SAE40 oil, bronze
bushing, 445 N load, 500C, 600C oil inlet temperature)
Friction variation with velocity history Temperature (0C)
Oscillation Frequency
(Hz) Positive
increment Positive
decrement Negative increment
Negative decrement
0.5 High Low High Low 1.0 High Low High Low 50 1.5 High Low High Low 0.5 High Low High Low 1.0 High Low High Low 60 1.5 High Low High Low
Table 5.8- the friction coefficient variation with the velocity history (dry, steel bushing, 445 N load)
Friction variation with velocity history Oscillation Frequency (Hz)
Positive increment
Positive decrement
Negative increment
Negative decrement
0.5 High Low Low High 1.0 High Low High Low 1.5 Low High High Low

103
Velocity (rpm)-60 -40 -20 0 20 40 60
Fric
tion
coef
ficie
nt
0.000
0.050
0.100
0.150
0.200
0.250
Figure 5.45 - the friction coefficient variation with the velocity history (445 N load, bronze bushing, 1.0 Hz oscillating frequency, SAE30 oil, 400C
oil inlet temperature)
Velocity (rpm)-60 -40 -20 0 20 40 60
Fric
tion
coef
ficie
nt
0.000
0.050
0.100
0.150
0.200
0.250
Figure 5.46 - the friction coefficient variation with the velocity history (445 N load, bronze bushing, 1.0 Hz oscillating frequency, SAE40 oil, 400C
oil inlet temperature)

104
Velocity (rpm)-30 -20 -10 0 10 20 30
Fric
tion
coef
ficie
nt
0.000
0.050
0.100
0.150
0.200
0.250
Figure 5.47 - the friction coefficient variation with the velocity history (445 N load, bronze bushing, 0.5 Hz oscillating frequency, SAE30 oil, 400C
oil inlet temperature)
5.3. Conclusions
The friction hysteresis phenomenon of an oil lubricated oscillatory journal bearing
is investigated by varying load, oil type, inlet oil temperature, oscillating frequency, and
bushing type. The following conclusions can be drawn on the basis of the experimental
results.
• Heavier load, faster oscillating speed, and higher oil inlet temperature lower the
magnitude of the friction hysteresis loop. Heavier load narrows the bandwidth of the
loop.
• In the cases of 667 N load, 0.5 Hz oscillating frequency, bronze bushing, SAE30
oil, the bandwidth of the hysteresis loop tends to zero. A flatter or narrower friction
hysteresis loop requires less friction compensation in precision machine control.
• The friction hysteresis loop is narrower when the bearing clearance is bigger.
105
• With oil, the friction level is lower when the oscillating frequency increases.
Without lubricant, the friction hysteresis still exists, while the friction level increases with
increasing oscillating frequency.
• The inertia of the lubricant flow contributes to the friction hysteresis. The friction
variation with the velocity history displays three types of lobed shapes of hysteresis.
5.4. Nomenclature
f coefficient of friction
p pressure, Pa
q heat flux, W/m2
r bar length, m
v linear velocity, rpm
θ angle, radian
ω angular velocity, rad/s
Subscripts
1, 2, 3, 4 bar number, oscillating stage

106
CHAPTER 6 AN EXPERIMENTAL STUDY OF GREASE-LUBRICATED JOURNAL BEARINGS UNDERGOING
OSCILLATORY MOTION
6.1. Introduction
Journal bearings have broad range of applications in industry. Most of them are
designed to rotate uni-directionally and operate with a relatively thick film of fluid that
separates the journal and the bushing so that the hydrodynamic lubrication regime
prevails. Nevertheless, in some applications such as robotic arms and construction
machinery, the bearings oscillate periodically at a specified frequency and amplitude.
Correspondingly, their lubrication state often traverses from boundary, to mixed, and to
hydrodynamic regime.
Grease is widely used in journal bearings that are intended to function under
relatively low speed and heavily loaded operating conditions. Grease offers some
advantages over conventional oil in terms of leakage, maintenance, and stability. The
dimensions of a grease bearing are smaller than that of an oil-lubricated bearing with the
identical load capacity [76], and there is no need for an elaborate oil supply system.
Moreover, experiments have shown that in boundary or mixed lubrication regime, the
coefficient of friction with certain grease can be even lower than that of oil due to a
deposited thickener layer [98].
Compared with oil lubrication, the mechanism of grease lubrication is much less
understood [77, 78]. Furthermore, an extensive literature survey [171] reveals that
experimental grease studies [73-75, 79-84] have primarily concentrated on constant
rotational motion, and that there exists very limited data for bearings that undergo
oscillation.
107
This paper is devoted to the examination of the friction performance of a grease-
lubricated journal bearing under oscillatory motion. The effects of load, oscillating
frequency, and grease type are examined. The variation of hysteresis loop is analyzed
qualitatively.
6.2. Experimental
Lewis LRI-8H tribometer is used for measuring the coefficient of friction of journal
bearings. Its detailed description is available in [57]. Briefly, the machine is capable of
measuring the friction coefficient under varying operating conditions such as load and
speed. Load is applied through a level mechanism. The friction force is registered by a
measuring cell and data are continuously recorded into a computer via an automated data
acquisition system. The coefficient of friction, the oscillating frequency, and the load are
processed by software, displayed on computer screen, and recorded for future analysis.
The time interval of data reading is adjustable and is independent of the duration of
the test. Two types of sampling frequencies are adopted. One is for recording the global
history of the coefficient of friction. The other is for recording the local history of the
coefficient of friction in one oscillation cycle. In the current study, a minimum of 20
seconds for the global history and a 0.0185 second for the local history are taken.
6.2.1 Bearing Parameters
The shaft is made up of hardened AISI 1020 steel. Its diameter is 24.54 mm. Steel
bushing is used in tests. The inner diameter and the length are 25.4 mm.
Two different greases are chosen as the lubricant. One is Moly#5. The other is
ALG#1.
The following table shows the combination of load and grease tested.

108
Table 6.1- Grease properties
NLGI Grade Thickener type Dropping point (0C)
Viscosity (cSt) @ 40 0C
Moly #5 1 Lithium complex 260 357 ALG #1 1 Calcium sulfonate 260 150
Table 6.2- Experiment cases
Bushing Grease Load (N) 445 667 Moly#5 890 445 667
Steel
ALG#1 890
The error of the friction coefficient is based on the accuracy of the load cell. A 44 N
load cell is used in experiments reported in this paper. For a given load cell, the amount
of the friction force error is fixed. With increasing loads, the error of the friction
coefficient becomes smaller. It is tabulated in Table 6.3.
Table 6.3- Error of the friction coefficient associated with load
Load (N) 445 667 890 Error (±) 0.0034 0.0023 0.0017
6.2.2 Experiment Procedure
Before any measurement is taken, the system is balanced so that the coefficient of
friction is nil when the shaft is in its static position. The system is run-in for one hour
with 1.0 Hz oscillating frequency and 450 N load. Upon completion of each test, the
system is given enough time—typically 2 hours— to cool down. For each test, the global
history of the coefficient of friction is monitored. The friction coefficient tends to
oscillate periodically around a relatively constant value. By observation, this state is
normally reached in 4 minutes. The total measuring time for each test is 8 minutes.

109
Starting from the moment of 4 minutes, the local history loop of the coefficient of friction
in one oscillation cycle is extracted for comparison.
6.2.3 Development of Oscillatory Motion
The oscillatory motion of the shaft is generated by a four-bar linkage device. Its
schematic is like Fig. 6.1.
Figure 6.1 - A four-bar linkage device
The active bar (rotational) is bar 2 ( 2r ) and the passive one (oscillatory) is bar 4
( 4r ). The angular velocity of the shaft is the same as that of bar 4. The objective is to
establish an appropriate expression for the angular velocity of bar 4 as a function of time
( )t4ω for a specified oscillating frequency.
By the geometric dimension, the following equations can be established.
( ) ( ) ( ) 0tcosrtcosrtcosrr 3322441 =θ−θ−θ+ (6.1)
( ) ( ) ( ) 0tsinrtsinrtsinr 332244 =θ−θ−θ (6.2)
where ( )t2θ is the corresponding oscillating angle. Combining Eqs. (6.1) and (6.2), ( )t3θ
and ( )t4θ can be solved numerically.
θ2
θ3
θ4
V43
r1
r2
r3
r4 V23
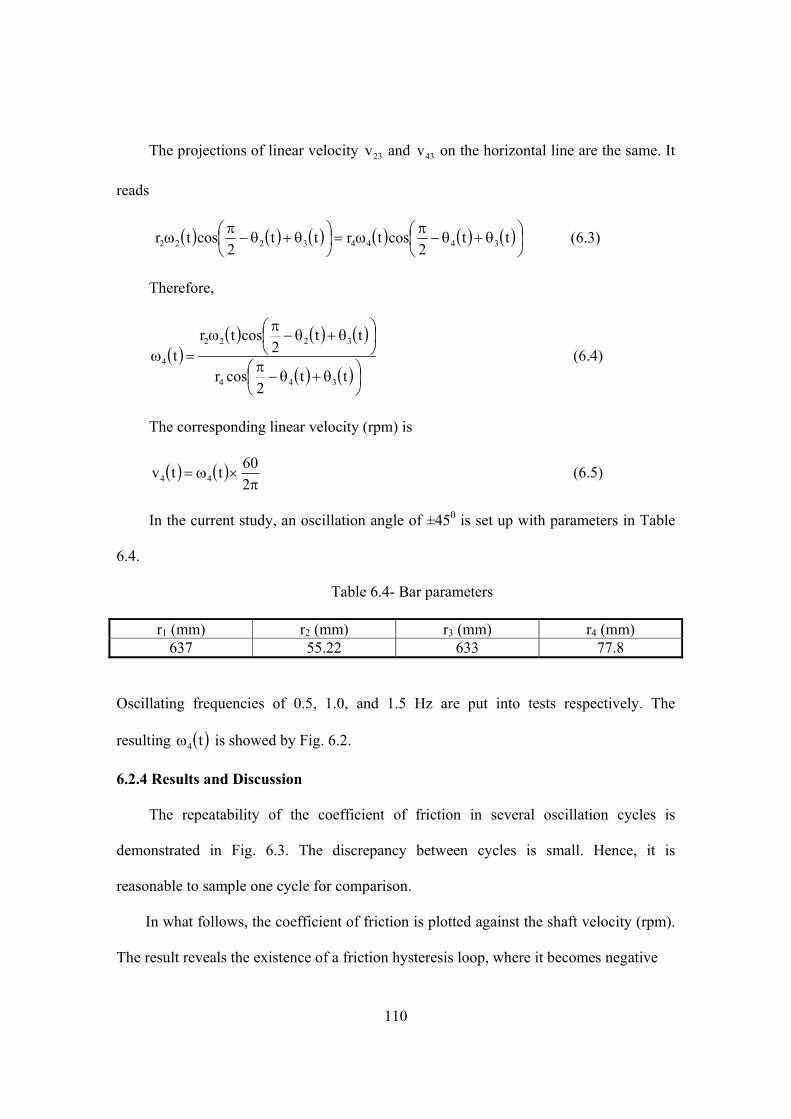
110
The projections of linear velocity 23v and 43v on the horizontal line are the same. It
reads
( ) ( ) ( ) ( ) ( ) ( )⎟⎠⎞
⎜⎝⎛ θ+θ−π
ω=⎟⎠⎞
⎜⎝⎛ θ+θ−π
ω tt2
costrtt2
costr 34443222 (6.3)
Therefore,
( )( ) ( ) ( )
( ) ( )⎟⎠⎞
⎜⎝⎛ θ+θ−π
⎟⎠⎞
⎜⎝⎛ θ+θ−π
ω=ω
tt2
cosr
tt2
costrt
344
3222
4 (6.4)
The corresponding linear velocity (rpm) is
( ) ( )π
×ω=260ttv 44 (6.5)
In the current study, an oscillation angle of ±450 is set up with parameters in Table
6.4.
Table 6.4- Bar parameters
r1 (mm) r2 (mm) r3 (mm) r4 (mm) 637 55.22 633 77.8
Oscillating frequencies of 0.5, 1.0, and 1.5 Hz are put into tests respectively. The
resulting ( )t4ω is showed by Fig. 6.2.
6.2.4 Results and Discussion
The repeatability of the coefficient of friction in several oscillation cycles is
demonstrated in Fig. 6.3. The discrepancy between cycles is small. Hence, it is
reasonable to sample one cycle for comparison.
In what follows, the coefficient of friction is plotted against the shaft velocity (rpm).
The result reveals the existence of a friction hysteresis loop, where it becomes negative
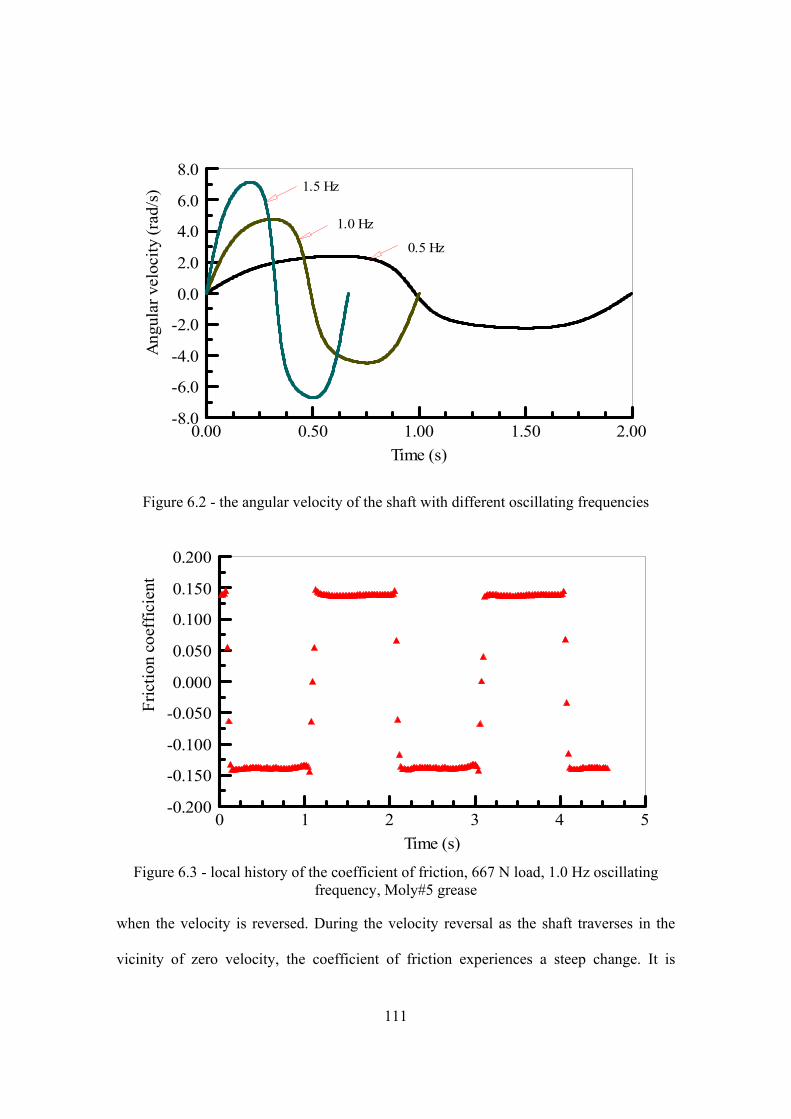
111
Time (s)0.00 0.50 1.00 1.50 2.00
Ang
ular
vel
ocity
(rad
/s)
-8.0
-6.0
-4.0
-2.0
0.0
2.0
4.0
6.0
8.01.5 Hz
1.0 Hz
0.5 Hz
Figure 6.2 - the angular velocity of the shaft with different oscillating frequencies
Time (s)0 1 2 3 4 5
Fric
tion
coef
ficie
nt
-0.200
-0.150
-0.100
-0.050
0.000
0.050
0.100
0.150
0.200
Figure 6.3 - local history of the coefficient of friction, 667 N load, 1.0 Hz oscillating
frequency, Moly#5 grease
when the velocity is reversed. During the velocity reversal as the shaft traverses in the
vicinity of zero velocity, the coefficient of friction experiences a steep change. It is
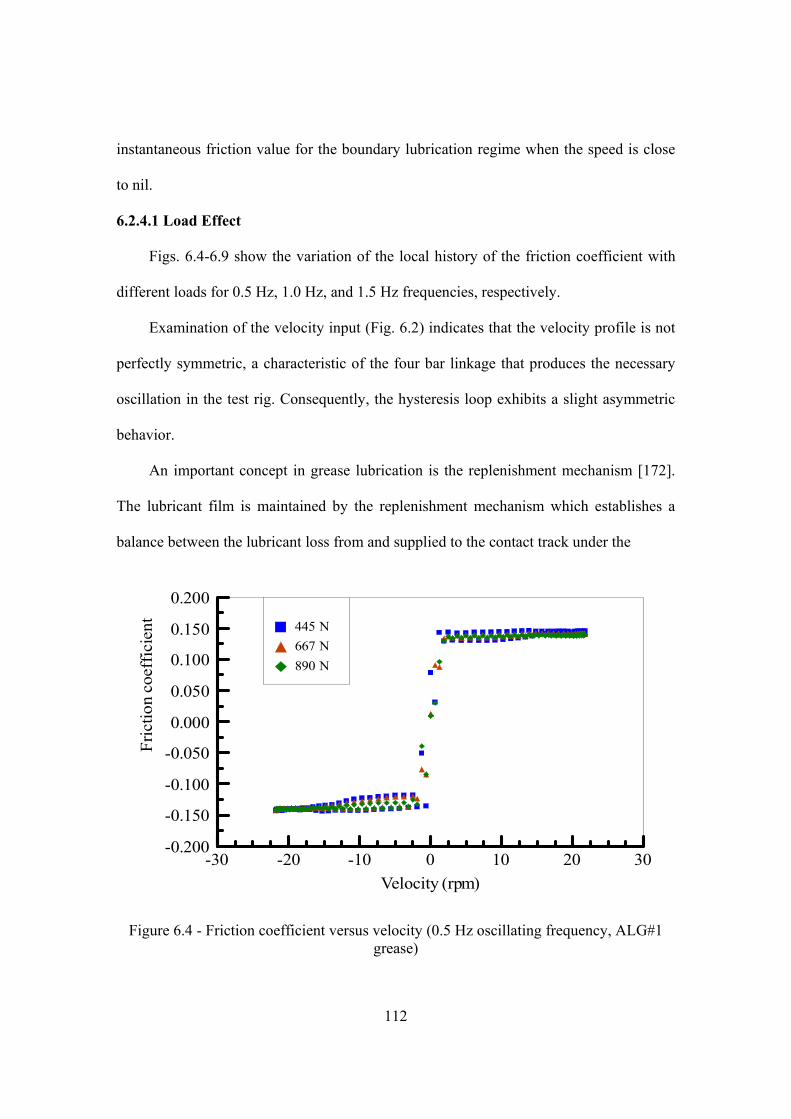
112
instantaneous friction value for the boundary lubrication regime when the speed is close
to nil.
6.2.4.1 Load Effect
Figs. 6.4-6.9 show the variation of the local history of the friction coefficient with
different loads for 0.5 Hz, 1.0 Hz, and 1.5 Hz frequencies, respectively.
Examination of the velocity input (Fig. 6.2) indicates that the velocity profile is not
perfectly symmetric, a characteristic of the four bar linkage that produces the necessary
oscillation in the test rig. Consequently, the hysteresis loop exhibits a slight asymmetric
behavior.
An important concept in grease lubrication is the replenishment mechanism [172].
The lubricant film is maintained by the replenishment mechanism which establishes a
balance between the lubricant loss from and supplied to the contact track under the
Velocity (rpm)-30 -20 -10 0 10 20 30
Fric
tion
coef
ficie
nt
-0.200
-0.150
-0.100
-0.050
0.000
0.050
0.100
0.150
0.200445 N667 N890 N
Figure 6.4 - Friction coefficient versus velocity (0.5 Hz oscillating frequency, ALG#1 grease)
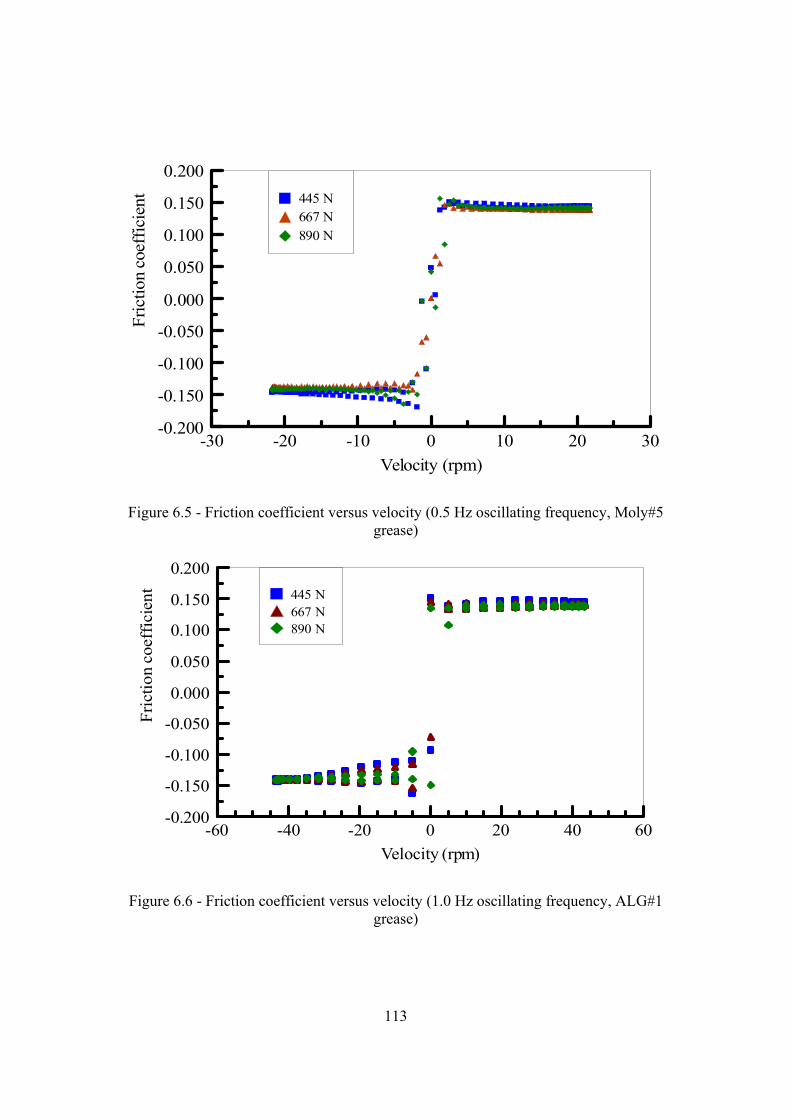
113
Velocity (rpm)-30 -20 -10 0 10 20 30
Fric
tion
coef
ficie
nt
-0.200
-0.150
-0.100
-0.050
0.000
0.050
0.100
0.150
0.200445 N667 N890 N
Figure 6.5 - Friction coefficient versus velocity (0.5 Hz oscillating frequency, Moly#5 grease)
Velocity (rpm)-60 -40 -20 0 20 40 60
Fric
tion
coef
ficie
nt
-0.200
-0.150
-0.100
-0.050
0.000
0.050
0.100
0.150
0.200445 N667 N890 N
Figure 6.6 - Friction coefficient versus velocity (1.0 Hz oscillating frequency, ALG#1 grease)

114
Velocity (rpm)-60 -40 -20 0 20 40 60
Fric
tion
coef
ficie
nt
-0.200
-0.150
-0.100
-0.050
0.000
0.050
0.100
0.150
0.200445 N667 N890 N
Figure 6.7 - Friction coefficient versus velocity (1.0 Hz oscillating frequency, Moly#5 grease)
Velocity (rpm)-80 -60 -40 -20 0 20 40 60 80
Fric
tion
coef
ficie
nt
-0.200
-0.150
-0.100
-0.050
0.000
0.050
0.100
0.150
0.200445 N667 N890 N
Figure 6.8 - Friction coefficient versus velocity (1.5 Hz oscillating frequency, ALG#1 grease)
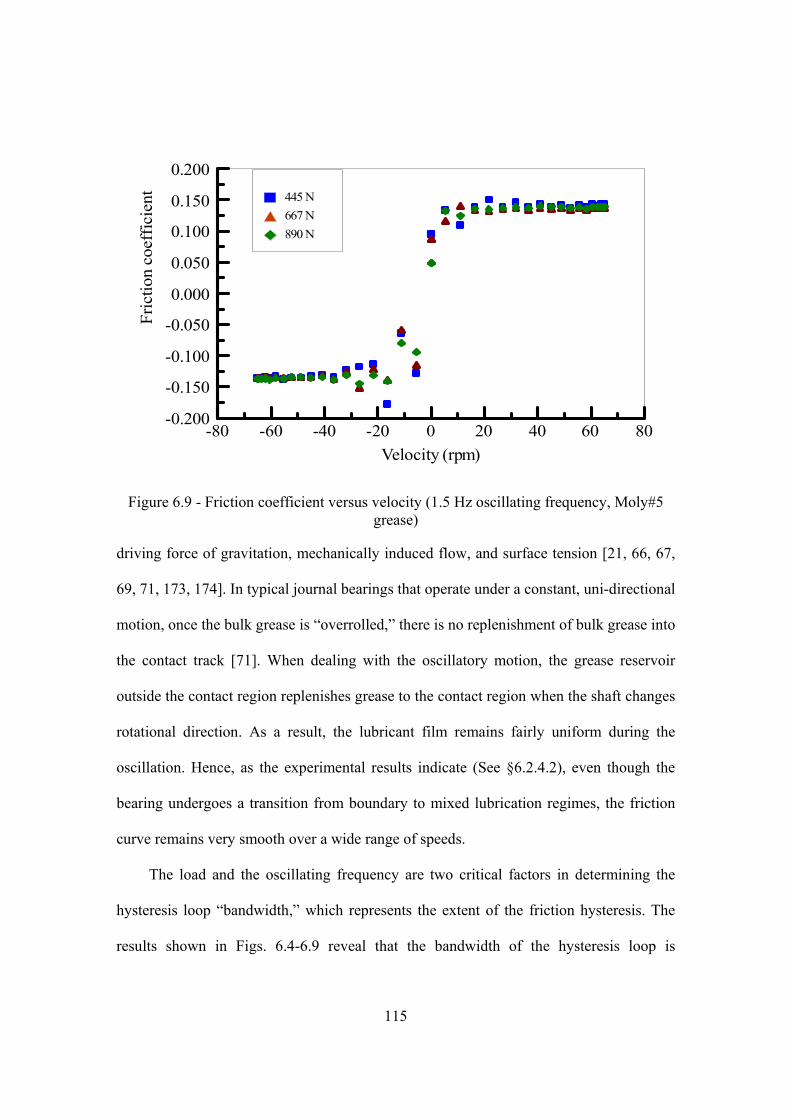
115
Velocity (rpm)-80 -60 -40 -20 0 20 40 60 80
Fric
tion
coef
ficie
nt
-0.200
-0.150
-0.100
-0.050
0.000
0.050
0.100
0.150
0.200445 N667 N890 N
Figure 6.9 - Friction coefficient versus velocity (1.5 Hz oscillating frequency, Moly#5 grease)
driving force of gravitation, mechanically induced flow, and surface tension [21, 66, 67,
69, 71, 173, 174]. In typical journal bearings that operate under a constant, uni-directional
motion, once the bulk grease is “overrolled,” there is no replenishment of bulk grease into
the contact track [71]. When dealing with the oscillatory motion, the grease reservoir
outside the contact region replenishes grease to the contact region when the shaft changes
rotational direction. As a result, the lubricant film remains fairly uniform during the
oscillation. Hence, as the experimental results indicate (See §6.2.4.2), even though the
bearing undergoes a transition from boundary to mixed lubrication regimes, the friction
curve remains very smooth over a wide range of speeds.
The load and the oscillating frequency are two critical factors in determining the
hysteresis loop “bandwidth,” which represents the extent of the friction hysteresis. The
results shown in Figs. 6.4-6.9 reveal that the bandwidth of the hysteresis loop is
116
“squeezed” when the load is greater. In general, occurrence of hysteresis is representative
of a retardation of the friction coefficient. When the load on the shaft is greater, the
interaction of shaft and grease becomes stronger, and the retardation effect of the friction
coefficient with the shaft velocity variation becomes less pronounced. As a result, the
friction hysteresis loop becomes narrower.
A flatter or narrower bandwidth implies that the friction difference between
increasing velocity and decreasing velocity is smaller. In precision control industry, such
as in robotic applications, the control engineer requires a suitable friction model to
compensate the effects of friction [162-168, 175-177]. A flatter friction curve offers a
more stable performance, and less complication in terms of modeling for control
purposes.
The area under the friction-velocity curve represents the total frictional heat flux,
∑q , in that period. The velocity in one oscillation cycle can be divided into four stages:
positive acceleration, positive deceleration, negative acceleration and negative
deceleration (referring to Fig. 6.2). In one stage, the total frictional heat flux can be
expressed as
( )∫∑ =v
pdvvfq (6.6)
Assuming that the pressure p is constant, Eq. (6.6) simplifies into
( )∫∑ =v
dvvfpq (6.7)
Let ∑ 1q represent the area under the friction curve with an increasing velocity and
∑ 2q denote the area under the friction curve with a decreasing velocity. Then, the area
within the hysteresis loop can be formulated as
117
( ) ( ) ( ) ( ) ( )( )∫∫∫∑∑∑ −=−=−=∆vvv
dvvfvfpdvvfpdvvfpqqq 212121 (6.8)
The term ( )∑∆ q can be used to characterize the bandwidth of the hysteresis loop.
When ( )∑∆ q is bigger, the bandwidth is bigger; when ( )∑∆ q is smaller, the
bandwidth is smaller.
6.2.4.2 Oscillating Frequency Effect
The local history of the coefficient of friction varying with oscillating frequency is
shown in Figs. 6.10-6.15. The results show that the hysteresis loop is “stretched” when
the oscillating frequency is increased. When the oscillating frequency is large, the
maximum velocity becomes higher. At 1.5 Hz oscillating frequency, a maximum speed
of 68 rpm (7.1 rad/s) is reached. The speed at which lift-off occurs corresponds to the
lowest friction coefficient when plotted against the unidirectional speed, i.e. the so-called
Stribeck curve [57]. This point is the watershed between mixed and hydrodynamic
lubrication. From the experiment results under constant rotation (Figs. 6.16 and 6.17), the
smallest lift-off speed is about 85 rpm (8.9 rad/s). Hence, it may be concluded that under
these operating conditions, the oscillatory bearing operates in boundary and mixed
lubrication regimes. With increasing speed, the friction becomes lower.
The experimental results also indicate that for a given load, the hysteresis loops
have a similar shape for three different oscillating frequencies. Therefore, the load has a
greater effect on the shape of the hysteresis loop compared to that of the oscillating
frequency.
Figs. 6.18-6.20 compare the hysteresis loop of ALG#1 and Moly#5 greases under an
imposed load of 445 N. The results reveal that the retardation effect of the friction
coefficient is less distinct with Moly#5 grease. This can be attributed to the reduction of

118
Velocity (rpm)-80 -60 -40 -20 0 20 40 60 80
Fric
tion
coef
ficie
nt
-0.200
-0.150
-0.100
-0.050
0.000
0.050
0.100
0.150
0.2000.5 Hz1.0 Hz1.5 Hz
Figure 6.10 - Friction coefficient versus velocity (445 N load, ALG#1 grease)
Velocity (rpm)-80 -60 -40 -20 0 20 40 60 80
Fric
tion
coef
ficie
nt
-0.200
-0.150
-0.100
-0.050
0.000
0.050
0.100
0.150
0.2000.5 Hz1.0 Hz1.5 Hz
Figure 6.11 - Friction coefficient versus velocity (445 N load, Moly#5 grease)

119
Velocity (rpm)-80 -60 -40 -20 0 20 40 60 80
Fric
tion
coef
ficie
nt
-0.200
-0.150
-0.100
-0.050
0.000
0.050
0.100
0.150
0.2000.5 Hz1.0 Hz1.5 Hz
Figure 6.12 - Friction coefficient versus velocity (667 N load, ALG#1 grease)
Velocity (rpm)-80 -60 -40 -20 0 20 40 60 80
Fric
tion
coef
ficie
nt
-0.200
-0.150
-0.100
-0.050
0.000
0.050
0.100
0.150
0.2000.5 Hz1.0 Hz1.5 Hz
Figure 6.13 - Friction coefficient versus velocity (667 N load, Moly#5 grease)
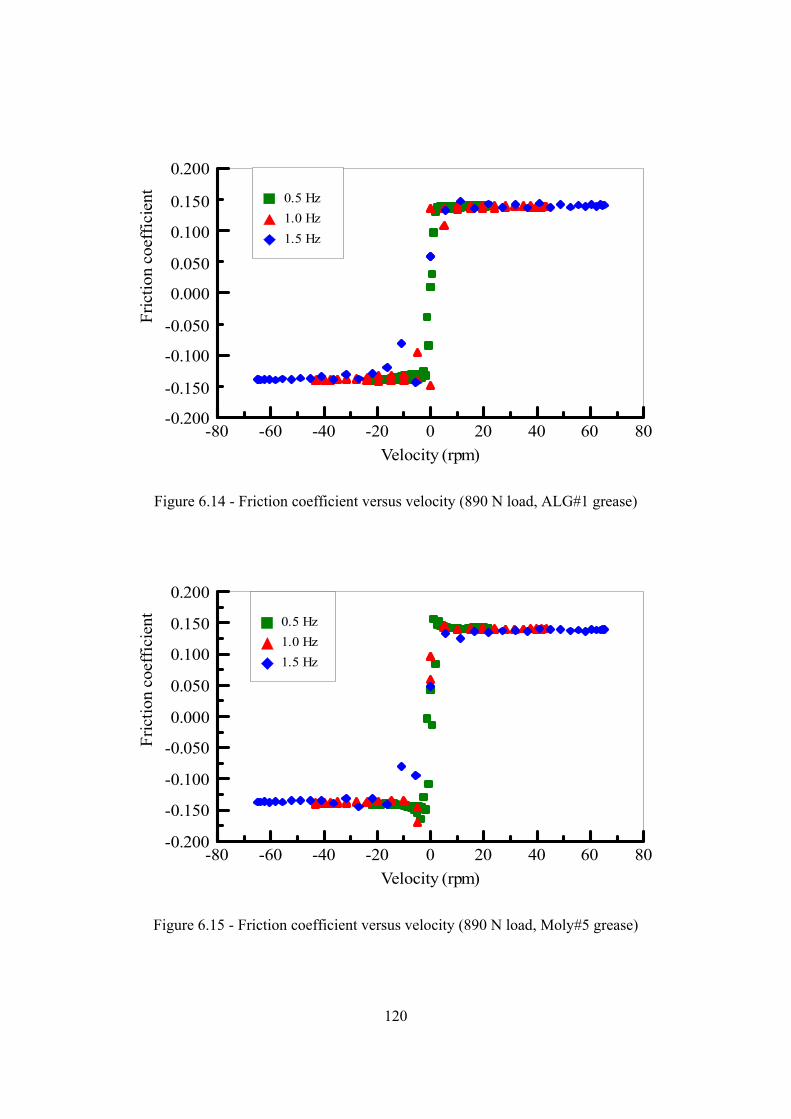
120
Velocity (rpm)-80 -60 -40 -20 0 20 40 60 80
Fric
tion
coef
ficie
nt
-0.200
-0.150
-0.100
-0.050
0.000
0.050
0.100
0.150
0.200
0.5 Hz1.0 Hz1.5 Hz
Figure 6.14 - Friction coefficient versus velocity (890 N load, ALG#1 grease)
Velocity (rpm)-80 -60 -40 -20 0 20 40 60 80
Fric
tion
coef
ficie
nt
-0.200
-0.150
-0.100
-0.050
0.000
0.050
0.100
0.150
0.200
0.5 Hz1.0 Hz1.5 Hz
Figure 6.15 - Friction coefficient versus velocity (890 N load, Moly#5 grease)

121
Velocity (rpm)0 100 200 300 400 500
Fric
tion
coef
ficie
nt
0.000
0.025
0.050
0.075
0.100
0.125
0.150
0.175
0.200450 N667 N890 N
Figure 6.16 - The friction coefficient as a function of velocity (ALG#1 grease, constant rotation)
Velocity (rpm)0 100 200 300 400 500
Fric
tion
coef
ficie
nt
0.000
0.025
0.050
0.075
0.100
0.125
0.150
0.175
0.200450 N667 N890 N
Figure 6.17 - The friction coefficient as a function of velocity (Moly #5 grease, constant
rotation)
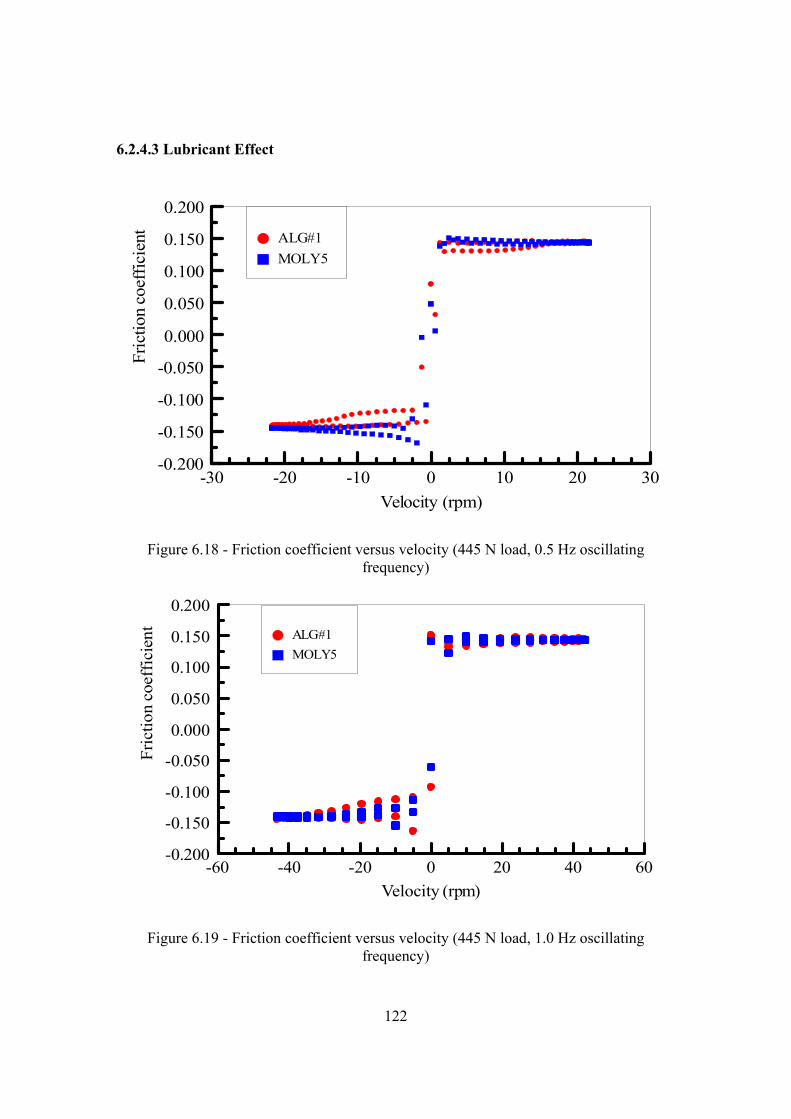
122
6.2.4.3 Lubricant Effect
Velocity (rpm)-30 -20 -10 0 10 20 30
Fric
tion
coef
ficie
nt
-0.200
-0.150
-0.100
-0.050
0.000
0.050
0.100
0.150
0.200
ALG#1MOLY5
Figure 6.18 - Friction coefficient versus velocity (445 N load, 0.5 Hz oscillating frequency)
Velocity (rpm)-60 -40 -20 0 20 40 60
Fric
tion
coef
ficie
nt
-0.200
-0.150
-0.100
-0.050
0.000
0.050
0.100
0.150
0.200
ALG#1MOLY5
Figure 6.19 - Friction coefficient versus velocity (445 N load, 1.0 Hz oscillating frequency)

123
Velocity (rpm)-80 -60 -40 -20 0 20 40 60 80
Fric
tion
coef
ficie
nt
-0.200
-0.150
-0.100
-0.050
0.000
0.050
0.100
0.150
0.200
ALG#1MOLY5
Figure 6.20 - Friction coefficient versus velocity (445 N load, 1.5 Hz oscillating frequency)
the bandwidth of the hysteresis loop with heavier lubricant. From Table 6.3, the base oil
viscosity of Moly#5 grease (357 cSt) is much greater than that of ALG#1 grease (150
cSt). A greater viscosity means less “flowability.” Therefore, the velocity of Moly#5
grease is more easily changed when the shaft speed varies.
6.2.4.4 Comparison with Oil Lubrication
Figs. 6.21-6.23 compare the friction performance of grease and oil lubricated journal
bearings. SAE 40 oil is chosen for comparison, for it has the same viscosity (150 cSt) as
the base oil of ALG#1 grease at 400 C inlet temperature. The applied load is 445 N. As
stated earlier, the bearing operates in boundary and mixed lubrication regimes. At low
speeds the thickener of grease enters the contact and deposits a film which reduces
asperity interaction [98], a characteristic that oil lacks. The friction with grease is lower
than that with oil. In boundary and mixed lubrication regimes, ALG#1 grease produces
better friction performance than SAE40 oil.
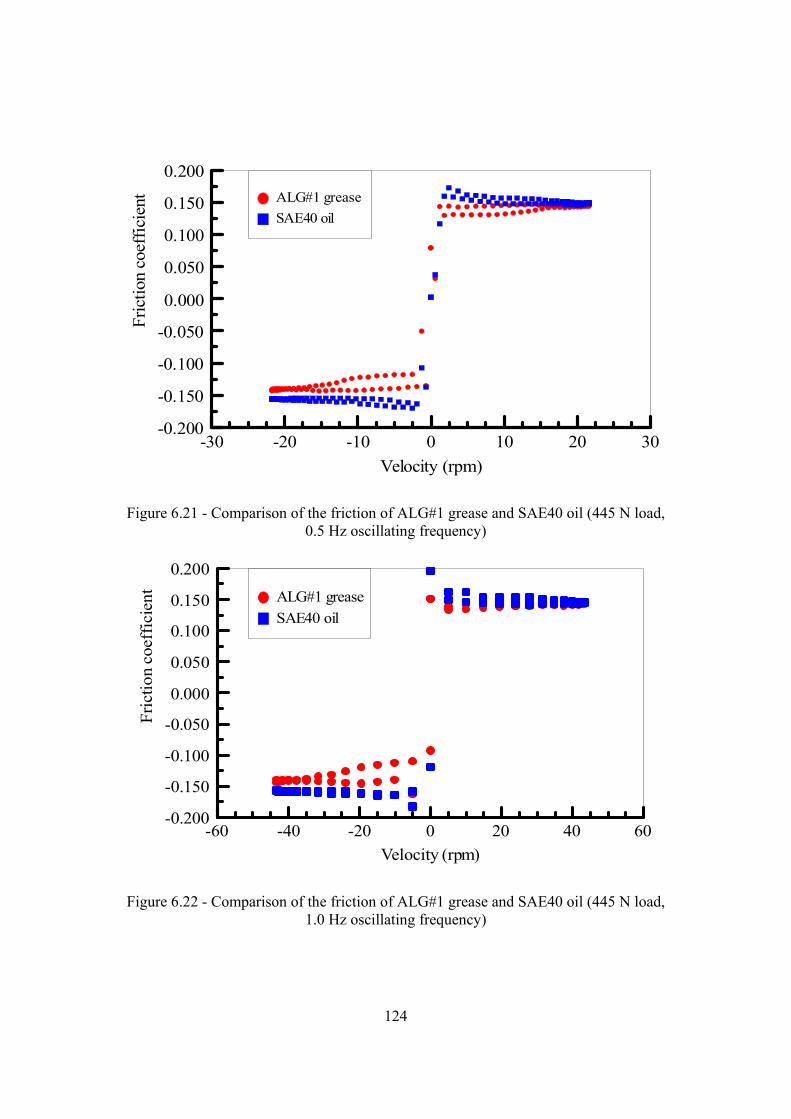
124
Velocity (rpm)-30 -20 -10 0 10 20 30
Fric
tion
coef
ficie
nt
-0.200
-0.150
-0.100
-0.050
0.000
0.050
0.100
0.150
0.200ALG#1 greaseSAE40 oil
Figure 6.21 - Comparison of the friction of ALG#1 grease and SAE40 oil (445 N load, 0.5 Hz oscillating frequency)
Velocity (rpm)-60 -40 -20 0 20 40 60
Fric
tion
coef
ficie
nt
-0.200
-0.150
-0.100
-0.050
0.000
0.050
0.100
0.150
0.200ALG#1 greaseSAE40 oil
Figure 6.22 - Comparison of the friction of ALG#1 grease and SAE40 oil (445 N load, 1.0 Hz oscillating frequency)
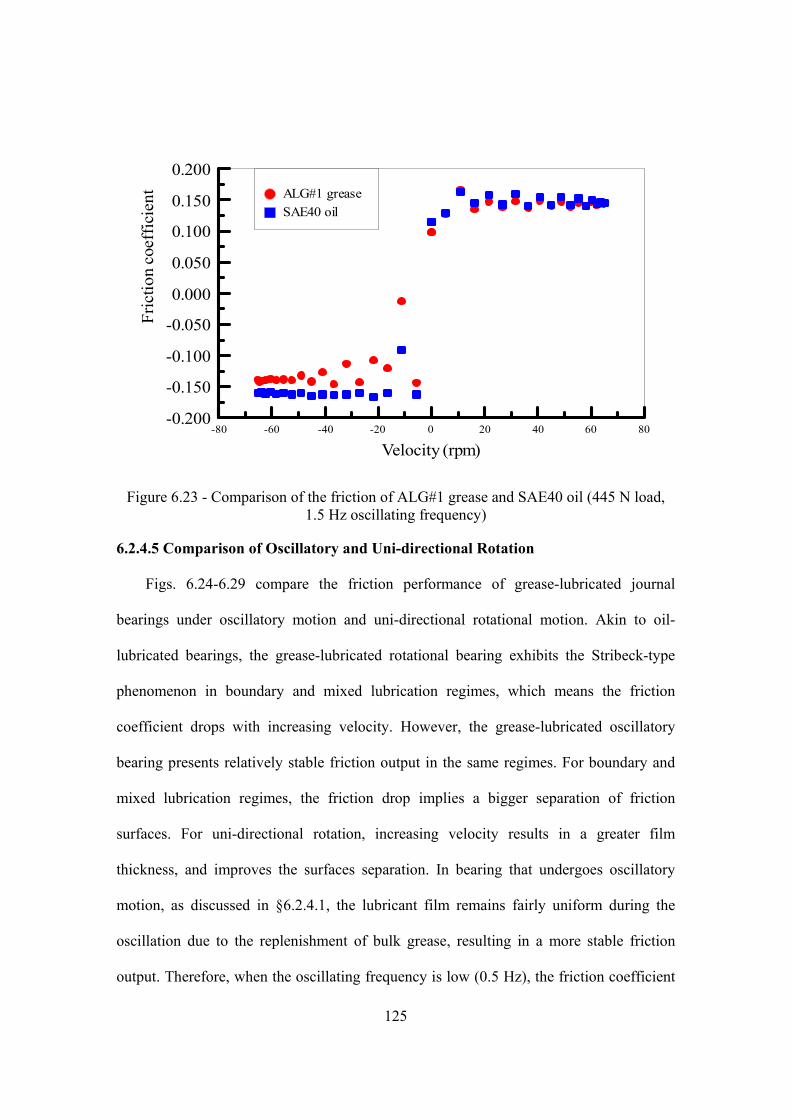
125
Velocity (rpm)-80 -60 -40 -20 0 20 40 60 80
Fric
tion
coef
ficie
nt
-0.200
-0.150
-0.100
-0.050
0.000
0.050
0.100
0.150
0.200ALG#1 greaseSAE40 oil
Figure 6.23 - Comparison of the friction of ALG#1 grease and SAE40 oil (445 N load, 1.5 Hz oscillating frequency)
6.2.4.5 Comparison of Oscillatory and Uni-directional Rotation
Figs. 6.24-6.29 compare the friction performance of grease-lubricated journal
bearings under oscillatory motion and uni-directional rotational motion. Akin to oil-
lubricated bearings, the grease-lubricated rotational bearing exhibits the Stribeck-type
phenomenon in boundary and mixed lubrication regimes, which means the friction
coefficient drops with increasing velocity. However, the grease-lubricated oscillatory
bearing presents relatively stable friction output in the same regimes. For boundary and
mixed lubrication regimes, the friction drop implies a bigger separation of friction
surfaces. For uni-directional rotation, increasing velocity results in a greater film
thickness, and improves the surfaces separation. In bearing that undergoes oscillatory
motion, as discussed in §6.2.4.1, the lubricant film remains fairly uniform during the
oscillation due to the replenishment of bulk grease, resulting in a more stable friction
output. Therefore, when the oscillating frequency is low (0.5 Hz), the friction coefficient
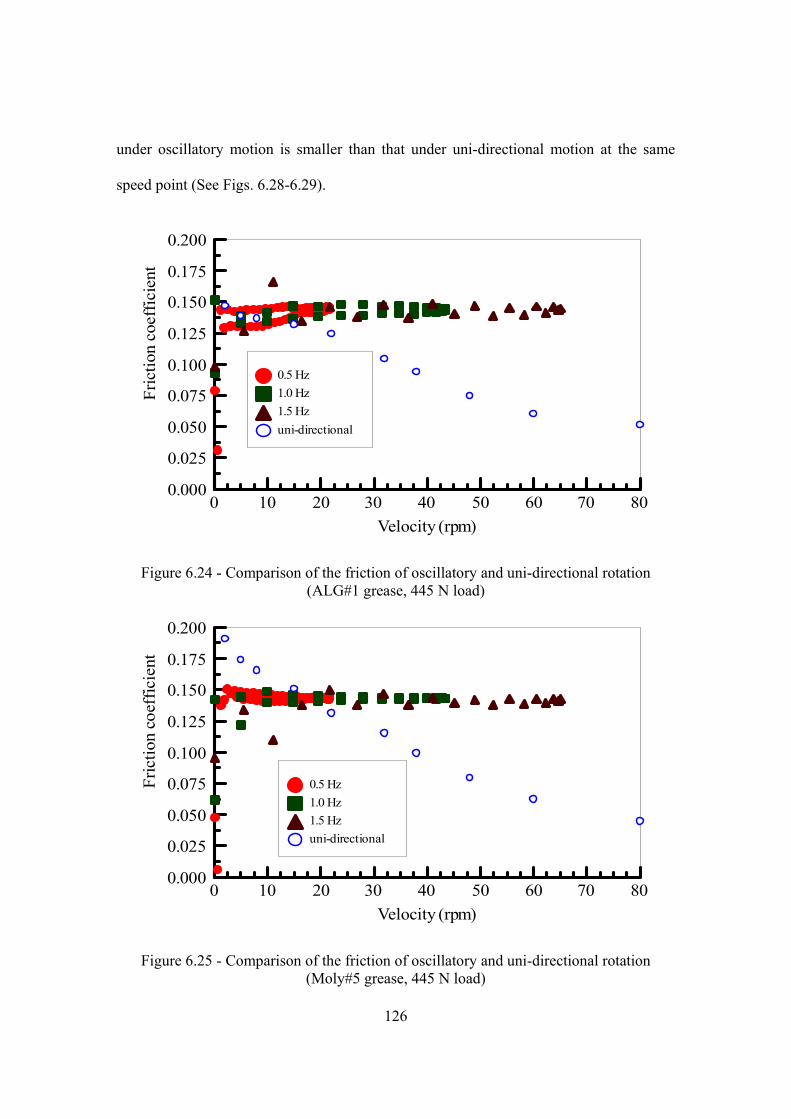
126
under oscillatory motion is smaller than that under uni-directional motion at the same
speed point (See Figs. 6.28-6.29).
Velocity (rpm)0 10 20 30 40 50 60 70 80
Fric
tion
coef
ficie
nt
0.000
0.025
0.050
0.075
0.100
0.125
0.150
0.175
0.200
0.5 Hz1.0 Hz1.5 Hzuni-directional
Figure 6.24 - Comparison of the friction of oscillatory and uni-directional rotation (ALG#1 grease, 445 N load)
Velocity (rpm)0 10 20 30 40 50 60 70 80
Fric
tion
coef
ficie
nt
0.000
0.025
0.050
0.075
0.100
0.125
0.150
0.175
0.200
0.5 Hz1.0 Hz1.5 Hzuni-directional
Figure 6.25 - Comparison of the friction of oscillatory and uni-directional rotation (Moly#5 grease, 445 N load)
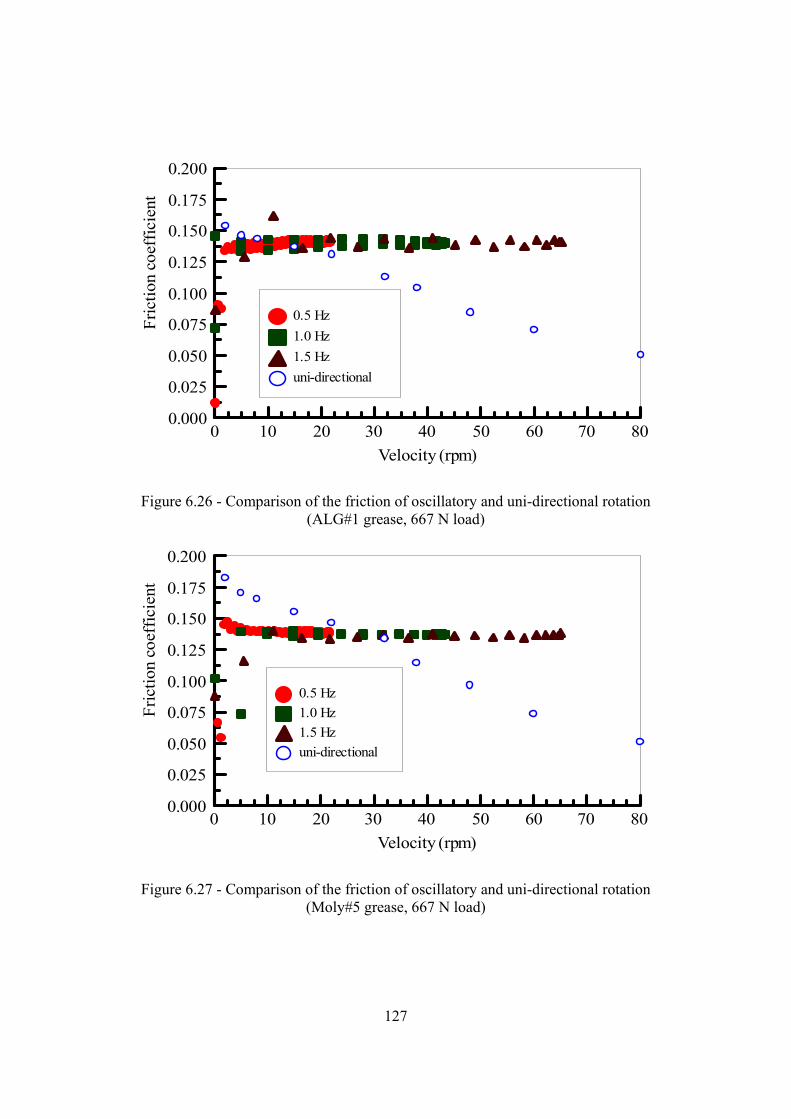
127
Velocity (rpm)0 10 20 30 40 50 60 70 80
Fric
tion
coef
ficie
nt
0.000
0.025
0.050
0.075
0.100
0.125
0.150
0.175
0.200
0.5 Hz1.0 Hz1.5 Hzuni-directional
Figure 6.26 - Comparison of the friction of oscillatory and uni-directional rotation (ALG#1 grease, 667 N load)
Velocity (rpm)0 10 20 30 40 50 60 70 80
Fric
tion
coef
ficie
nt
0.000
0.025
0.050
0.075
0.100
0.125
0.150
0.175
0.200
0.5 Hz1.0 Hz1.5 Hzuni-directional
Figure 6.27 - Comparison of the friction of oscillatory and uni-directional rotation (Moly#5 grease, 667 N load)
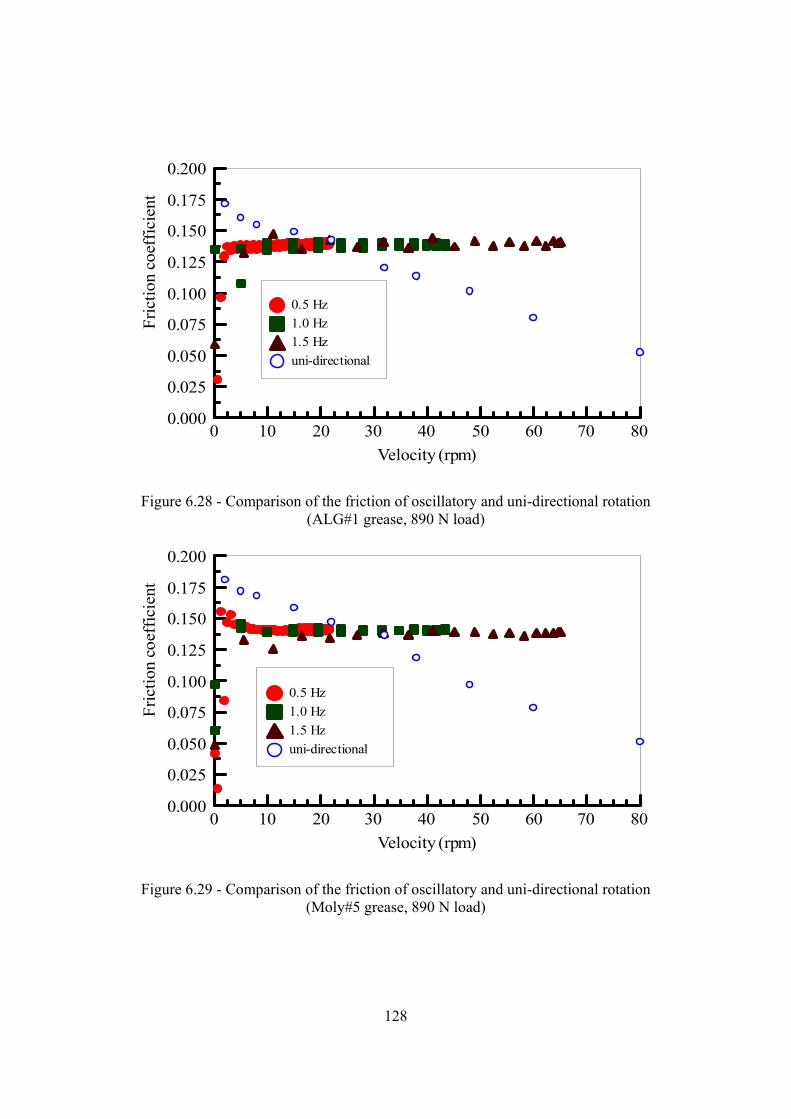
128
Velocity (rpm)0 10 20 30 40 50 60 70 80
Fric
tion
coef
ficie
nt
0.000
0.025
0.050
0.075
0.100
0.125
0.150
0.175
0.200
0.5 Hz1.0 Hz1.5 Hzuni-directional
Figure 6.28 - Comparison of the friction of oscillatory and uni-directional rotation (ALG#1 grease, 890 N load)
Velocity (rpm)0 10 20 30 40 50 60 70 80
Fric
tion
coef
ficie
nt
0.000
0.025
0.050
0.075
0.100
0.125
0.150
0.175
0.200
0.5 Hz1.0 Hz1.5 Hzuni-directional
Figure 6.29 - Comparison of the friction of oscillatory and uni-directional rotation (Moly#5 grease, 890 N load)

129
6.2.4.6 Exploration of the Friction Hysteresis Phenomenon
6.2.4.6.1 Comparison of Dry and Lubricated Tests
In mixed lubrication regime, both asperity interaction and hydrodynamic pressure
support the applied load. To examine the role of asperity interaction in the friction
hysteresis, the bearing was tested without lubricant. A steel bushing was used in these
experiments and the applied load was 445 N. There was no visible debris after each test.
Velocity (rpm)-80 -60 -40 -20 0 20 40 60 80
Fric
tion
coef
ficie
nt
-0.800
-0.600
-0.400
-0.200
0.000
0.200
0.400
0.600
0.8000.5 Hz1.0 Hz1.5 Hz
Figure 6.30 - Friction coefficient versus velocity (445 N load, dry)
In dry tests, the friction hysteresis phenomenon still exists. Plastic deformation,
material damping, and viscous dissipation, etc. [170], all contribute to the friction
hysteresis. However, the use of lubricant has a pronounced influence on both the friction
level and the friction hysteresis loop. Without lubricant (Fig. 6.30), the friction level rises
with increasing oscillating frequency; with lubricant (Figs. 6.10-6.11), the friction level
drops with increasing oscillating frequency.

130
6.2.4.6.2 Function of grease
To explore the hysteresis characteristic associated with grease, the lubricant flow at
the scale of asperities is analyzed. The velocity history in one oscillation cycle is divided
into four stages: positive acceleration, positive deceleration, negative acceleration and
negative deceleration. This is illustrated in Fig. 6.31, where for clarity the shaft is shown
completely separated from the bushing. Despite of boundary or mixed lubrication status,
the shaft is completely separated from the bushing for clear demonstration.
The effect of grease on the friction hysteresis is represented by the variation of the
lubricant flow. Referring to Fig. 6.31, in stage (a), the shaft accelerates to the highest
speed. It brings the volumetric flow forward (Fig. 6.32a). In stage (b), the shaft
decelerates to zero speed. Once the slowdown process is triggered, the surface asperities
of shaft and bushing will act as barriers for the flow and tend to lower the flow rate and in
some regions create backflow (Fig. 6.32b). Due to inertia, the flow will not be the same
as that in stage (a) at the same shaft speed. Hence, the hysteresis feature occurs. As for
the other half oscillating cycle - stage (c) and (d), a similar process is followed.
6.3. Conclusions
The friction performance of grease-lubricated oscillatory journal bearing is
examined by varying load, oscillating frequency and grease type. The following
conclusions can be drawn based on results of the experiments.
• The area within the friction hysteresis loop tends to be squeezed by higher load.
• A flatter or narrower friction hysteresis loop requires less friction compensation in
precision machine control.
• The friction hysteresis is stretched by higher oscillating frequency.

131
Figure 6.31 - Oscillating process
Figure 6.32 - Idealized illustration of oscillating flow between asperities
• Under the identical load, the hysteresis loops have a similar shape for different
frequencies.
• Higher viscosity tends to reduce the bandwidth of the hysteresis loop.
v v
(a) (b)
(a) positive acceleration (b) positive deceleration
(c) negative acceleration (d) negative decrement
132
• For bearings operating in boundary or mixed lubrication regimes, the use of
appropriate grease is preferred to oil.
• At low oscillating frequencies (0.5 Hz), the friction coefficient under oscillatory
motion is smaller than that under uni-directional motion at the same speed point.
• The inertia of the lubricant flow contributes to the friction hysteresis.
6.4. Nomenclature
f coefficient of friction
p pressure, Pa
q heat flux, W/m2
r bar length, m
v linear velocity, rpm
θ angle, radian
ω angular velocity, rad/s
Subscripts
1, 2, 3, 4 bar number
133
CHAPTER 7 DYNAMIC FRICTION MODELING OF OIL-LUBRICATED LONG JOURNAL BEARINGS
7.1 Introduction
The application of oscillatory bearings in automation industry and necessity of
friction compensation has been instrumental in encouraging researchers in control area to
devote much effort to the modeling of dynamic friction. Frictional characteristics of oil-
lubricated journal bearings undergoing uni-directional sliding motion can be described by
the classic Stribeck curve. However, for journal bearings undergoing oscillatory sliding
motion, this curve is not able to represent the friction properties completely. The friction
hysteresis occurs. It is a friction retardation phenomenon when the sliding velocity
increases or decrease to the same value.
Significant progress has been made ever since Bell [139-141] disclosed the
existence of friction hysteresis in lubricated sliding surfaces. The proposed models
include: classic model [162] which approximates the discontinuity at the origin by linear
function; Dahl model [142, 143] which describes the time derivative of the friction as a
function of displacement; Karnopp model [175] which reduces the order of the system at
the instant of zero velocity; the reset-integrator model [162] which attempts to overcome
the complexity of Karnopp model; the bristle-model [162] which represents the friction
force by the number of bristles; Armstrong model [147, 163, 164, 176, 177] which
describes tribological behavior by seven parameters; and LuGre model [165-167] which
expresses friction by the average deflection force of elastic springs. While these models
simple or complicated capture the friction hysteresis, they are not intended to describe it
from the view of the underlying lubrication mechanism which is the ultimate cause of the
friction hysteresis.

134
Three models made the attempt. The first was introduced by Hess et al. [154, 155]
who simulated hysteresis by superimposing a time lag into an empirical model under
steady operation conditions. The time lag was defined as the time difference between the
lowest velocity and the biggest friction force. The results were limited to particular
conditions, such as the amplitude of oscillation, under which the time delay was
determined. Instead of time lag, Polycarpou [151-153] proposed two models by
incorporating sliding velocity and instantaneous separation of sliding surfaces. They
showed that fluctuation in normal separation was the principal cause of hysteresis. To
apply these models, instantaneous film thickness must be measured. Harnoy [156-160]
modeled the mixed lubrication regime simply as a “spring” and applied the short bearing
theory to predict bearing friction in the hydrodynamic regime. He successfully predicted
the general characteristics of friction hysteresis loop.
In the current chapter, a dynamic friction model of oil-lubricated long journal
bearings is developed. Simulation results capture the general trend of friction hysteresis
loop. The assumption of long bearing is more pertinent for the bearings tested in the
experimental studies conducted in this dissertation.
7.2 Theoretical Development
7.2.1 Mixed Lubrication Modeling
Mixed lubrication is a lubrication state in which both fluid film and asperity contact
exist to support the applied load. A thorough understanding of this lubrication state still
remains rudimentary. When the minimum film thickness mh is below a certain transition
value trh , asperity contact occurs. It is assumed that the reaction force is an increasing
function of elastic deformation δ of asperities. The parameter δ is simply expressed as
135
mtr hh −=δ (7.1)
The elastic reaction force eW is represented by:
( )δδKWe = (7.2)
where ( )δK is an equivalent stiffness of the surface asperities.
The eccentricity ratio trε corresponds to the transition speed trU and the transition
minimum film thickness trh . It is known that:
( )ε−= 1Chm (7.3)
( )trtr Ch ε−= 1 (7.4)
where C is the radial clearance.
Combining these equations, the elastic reaction force eW reads:
( ) ( ) 1∆−= tre CW εεεκ (7.5)
where ( ) ( )εεκ K= and 1∆ is defined as:
⎩⎨⎧
ε>εε<ε
=∆tr
tr1 at1
at0
In the mixed lubrication condition, the total bearing load capacity W is a
summation of the elastic reaction eW and the hydrodynamic force hW :
he WWW += (7.6)
7.2.2 The Friction Coefficient
The friction force fhF for a long journal bearing in hydrodynamic lubrication regime is
[25]:

136
( ) SS
CRLUFfh
11
22
sin5.02
2
⎟⎟⎠
⎞⎜⎜⎝
⎛
−+⎟
⎠⎞
⎜⎝⎛=
επϕε
πµ
where
( )( )( )
( ) ]12
[tan
411
612
5.021
5.0
222
22
εεπϕ
εεππεεε
−=
⎥⎦
⎤⎢⎣
⎡+−
−+=
−
S
The friction force fF is the sum of mechanical and viscous forces. fF is described as:
( ) ( ) ( ) 25.02
2
11
12
2sin
∆⎟⎟⎠
⎞⎜⎜⎝
⎛
−+⎟
⎠⎞
⎜⎝⎛+∆−=
SS
CRLUCfF trcf
επϕε
πµεεεκ (7.7)
Where
⎩⎨⎧
ε<εε>ε
=∆tr
tr2 at1
at0
where cf is the Coulomb’s friction coefficient.
Introducing dimensionless parameters
FLRU
CFtr
2
2
µ=
( ) ( )εκµ
εκ 2
3
LRUC
tr
=
trUUU =
Equation (7.7) becomes
( )( ) ( ) 25.02
2
11
12
2sin
∆⎟⎟⎠
⎞⎜⎜⎝
⎛
−++∆−=
SS
RUCfF trcf
επϕε
πεεεκ (7.8)
The friction coefficient is a ratio of the friction force and the external load F :

137
FF
f f= (7.9)
7.2.3 Load Capacity of Constant Velocity
For long journal bearings at steady speed, the load capacity considering the elastic
reaction force of asperity contact is [25]:
( ) ( ) ( )( )
( ) ( ) 22
2
25.02
22
2
22
2
1
216sin
2112cos
∆+−
=
∆+−
+∆−=
UCLRF
UCLRCF tr
µεε
πεϕ
µεε
εεεεκϕ (7.10)
Its dimensionless form is
( )( ) ( )( )
( ) ( ) 225.02
222
2
1
216sin
2112cos
∆+−
=
∆+−
+∆−=
UF
UF tr
εεπεϕ
εεεεεεκϕ
(7.11)
The friction coefficient can be obtained from
FF
f f= (7.12)
7.2.4 Dynamic Modeling of Long Journal Bearings
A long journal bearing configuration is shown in Figure 7.1. The bearing sleeve
center is 1O . 2O is the journal center. X coordinate is along these two centers and Y is
perpendicular to it. x is the tangential direction. ϕ is the attitude angle. e is the
eccentricity.
The general Reynolds’ equation for a dynamic loaded long journal bearing is [178]:
0
3
1266 VdxdUh
dxdhU
dxdPh
dxd
++=⎟⎟⎠
⎞⎜⎜⎝
⎛µ
(7.13)
Where
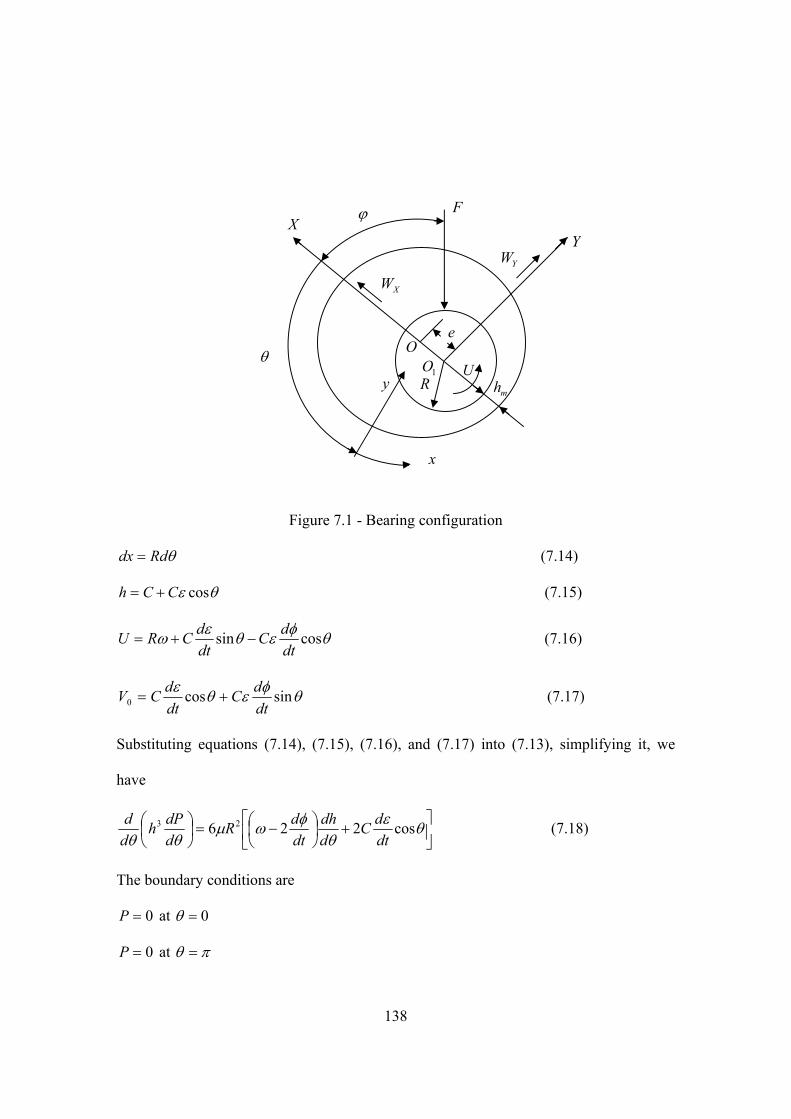
138
Figure 7.1 - Bearing configuration
θRddx = (7.14)
θε cosCCh += (7.15)
θφεθεω cossindtdC
dtdCRU −+= (7.16)
θφεθε sincos0 dtdC
dtdCV += (7.17)
Substituting equations (7.14), (7.15), (7.16), and (7.17) into (7.13), simplifying it, we
have
⎥⎦
⎤⎢⎣
⎡+⎟
⎠⎞
⎜⎝⎛ −=⎟
⎠⎞
⎜⎝⎛ θε
θφωµ
θθcos226 23
dtdC
ddh
dtdR
ddPh
dd (7.18)
The boundary conditions are
0=P at 0=θ
0=P at πθ =
x
y
YW
XW
Y
X ϕ
θ
R
e
mh
F
O 1O U

139
Integrating equation (7.18) twice with two boundary conditions, the pressure expression
is
( )( )( ) ( )⎪
⎩
⎪⎨
⎧
⎪⎭
⎪⎬⎫
⎥⎥
⎦
⎤
⎢⎢
⎣
⎡
+−
+−
−+⎟⎟⎠
⎞⎜⎜⎝
⎛+
+⎟⎠⎞
⎜⎝⎛ −=
dtdIIII
dtd
CRP ε
εεεπε
εεφεωεµ
20032
21
2103
0032
0132
2
11
2182
2326
(7.19)
Using the table in [179]
( ) ( )
( ) ( )
( ) ( )
( )
( )2103
002
003
013
001
00222
003
0012
002
1
21
2
001
cos121
1
3cos1sin
121
cos1sin
11
cos1coscos
1
1
θεε
ε
θεθε
ε
θεθε
ε
θεθε
ε
+=
+−=
⎥⎦
⎤⎢⎣
⎡−+
+−
−=
⎥⎦
⎤⎢⎣
⎡+
+−
−=
⎟⎟⎠
⎞⎜⎜⎝
⎛++
−= −
I
III
III
II
I
Introducing dimensionless parameters,
tt
RR
UUU
PRCP
tr
trtrtr
tr
ω
ωω
ωω
ωµ
=
===
= 2
2
the pressure expression becomes
( )( )( ) ( )⎪
⎩
⎪⎨
⎧
⎪⎭
⎪⎬⎫
⎥⎥
⎦
⎤
⎢⎢
⎣
⎡
+−
+−
−+⎟⎟⎠
⎞⎜⎜⎝
⎛+
+⎟⎠⎞
⎜⎝⎛ −=
tddIIII
tddUP ε
εεεπε
εεφεε 2
0032
21
2103
0032
013 1
12
1822
326 (7.20)
The loading capacity is obtained by integrating the pressure in the region of
πθ <<0 :
140
∫
∫
=
−=
π
π
θθ
θθ
0
0
sin
cos
dPRLW
dPRLW
Y
X
(7.21)
Introducing the dimensionless parameter
WLR
CWtr
3
2
µω=
equation (7.21) reads:
( )
( )UWdPW
UWdPW
YY
XX
,,,sin
,,,cos
0
0
ϕεεθθ
ϕεεθθ
π
π
==
=−=
∫
∫ (7.22)
Applying Newton’s second law to X and Y directions, the dynamic equations are:
( ) ( ) ( )21cos ϕεεεκϕ eemCWF trX −=∆−−− (7.23)
( ) ( ) ( )ϕϕεεεκϕ eemCfWF trcY 2sin 1 +−=∆−+− (7.24)
Introducing the dimensionless parameter
mLR
Cm tr3
3
µω
=
equations (7.23) and (7.24) becomes:
( )( ) 21cos ϕεεεεεκϕ mmWF trX −=∆−−− (7.25)
( )( ) ( )ϕεϕεεεεκϕ mmfWF trcY 2sin 1 +−=∆−+− (7.26)
7.3 Numerical Solutions
In this chapter, it is assumed that ( )εκ is linear function of ε [157].

141
( ) ( )( )
( )trb
trb
tr
Fεε
κ
εεεεκεκ
−=
−−
=
0
0
(7.27)
where bε is the eccentricity ratio corresponding to the mark between mixed lubrication
boundary lubrication.
The oscillating velocity takes the form of
( )tU αsin1.1 += (7.28)
Equation (7.25) and (7.26) are solved for ε and ϕ using a forth-order Runge-Kutta
method. The solution is Combined with equation (7.8) and (7.12) to evaluate the friction
coefficient can be calculated.
7.4 Results and Discussion
The input parameters [157] are listed in Table 7.1.
Table 7.1 - input parameters
bε trε cf 2L
RC m
0.99 0.96 0.2 0.0001 100
F can be calculated with 1=U and trεε = . From those input parameters, F reads
53. The oscillating frequency effect on the hysteresis is shown in Figure 7.2. α is varied
from 0.4 to 0.5 to 0.6. The mass effect on the hysteresis is examined in Figure 7.3. m is
changed from 10 to 50 to 100.
As it is shown in Figure 7.2, the friction hysteresis is captured by the dynamic
friction modeling. The general trend of friction hysteresis of long journal bearings agrees
with Harnoy’s theory for short journal bearings. With higher oscillating frequency,
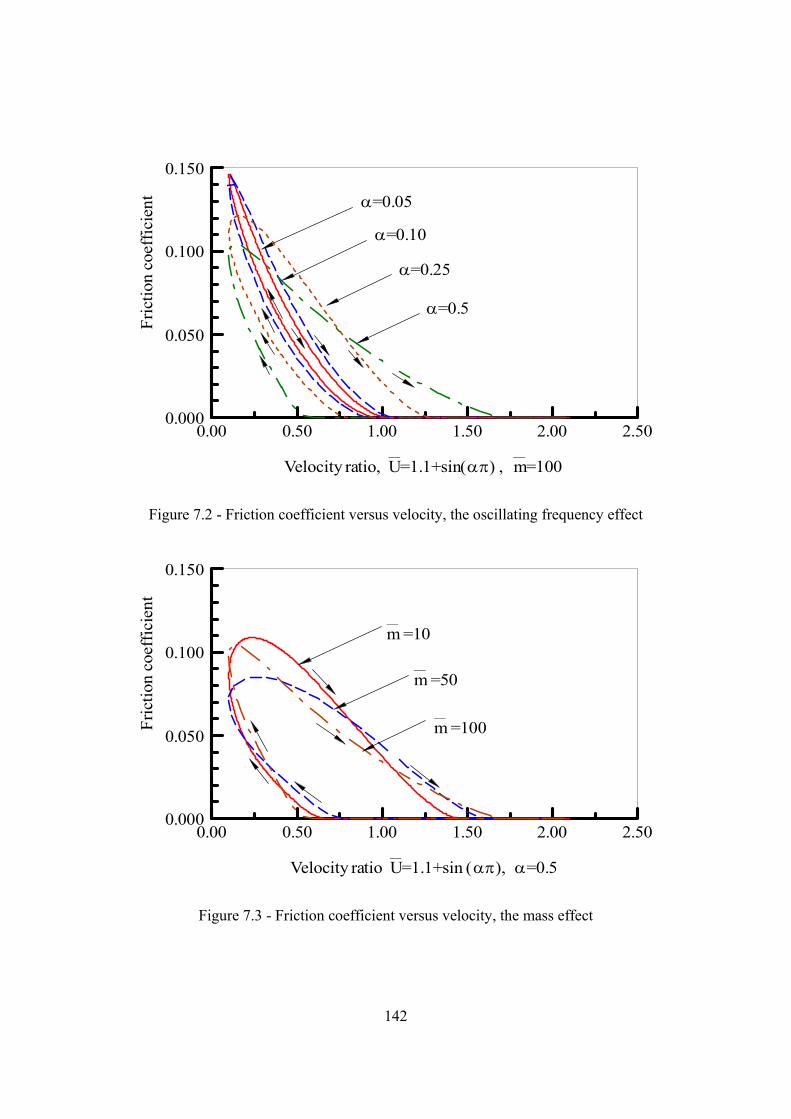
142
Velocity ratio, __U=1.1+sin(απ) ,
__m=100
0.00 0.50 1.00 1.50 2.00 2.50
Fric
tion
coef
ficie
nt
0.000
0.050
0.100
0.150
α=0.05
α=0.10
α=0.25
α=0.5
Figure 7.2 - Friction coefficient versus velocity, the oscillating frequency effect
Velocity ratio __U=1.1+sin (απ), α=0.5
0.00 0.50 1.00 1.50 2.00 2.50
Fric
tion
coef
ficie
nt
0.000
0.050
0.100
0.150
__m =10
__m =50
__m =100
Figure 7.3 - Friction coefficient versus velocity, the mass effect

143
the hysteresis loop becomes flatter; with bigger mass, the bandwidth of the loop is
squeezed.
However, the difference between simulation and experiment (See Chapters 5 and 6)
is big. In Chapter 2, a mixed EHL model is used to describe the load carrying mechanism
in mixed lubrication regime. Instead of using the simple spring concept as described in
this chapter, it is worthwhile to combine the mixed EHL model into equations of motion
to improve the prediction of the friction hysteresis.
7.5 Conclusion
A dynamic friction model of oil-lubricated long journal bearings is developed. In
mixed lubrication regime, the load carrying mechanism is simply treated as a spring.
Combining with hydrodynamic load carrying capacity developed in long journal bearing
theory, the dynamic equations of journal bearings are established. The model predicts the
general characteristics of the friction hysteresis phenomenon. Parametric study is carried
out to examine the variation of the hysteresis loop. With higher oscillating frequency, the
hysteresis loop becomes flatter; with bigger mass, the bandwidth of the loop is squeezed.
A more accurate model of the load carrying mechanism in the mixed lubrication regime
is required to improve the prediction.
7.6 Nomenclature
C radial clearance, m
F external load, N
fF friction force, N
fhF viscous force, N
f friction coefficient
144
cf Coulomb’s friction coefficient
h film thickness, m
K equivalent stiffness of asperities, N/m
L bearing length, m
m shaft mass, kg
P oil pressure, Pa
R shaft radius, m
U shaft velocity, m/s
W load capacity, N
δ elastic deformation of asperities, m
µ dynamic viscosity, Pa.s
ε eccentricity ratio
ϕ attitude angle, rad
ω shaft angular velocity, rad/s
Subscripts
b boundary lubrication
e elastic
h hydrodynamic
m minimum
tr transition from mixed lubrication to hydrodynamic lubrication
X X direction
Y Y direction

145
CHAPTER 8 FINITE ELEMENT ANALYSIS OF THERMAL FIELD IN OSCILLATORY JOURNAL BEARINGS
8.1 Introduction
Friction and heat occur simultaneously. They are internally connected by energy
transmission. When friction is not severe, like in oil-lubricated cases, heat generated by
friction is minute and it might not cause serious problems. However, wherever the
friction coefficient, the load, or the sliding velocity is severe, the frictional heat flux
( )fPV might become excessive to the extent that it may result in failure.
Pin and bushing (journal bearing) assemblies undergoing oscillatory motion are
considered to be vital components of large earth moving machinery. These machines are
heavily-loaded, often to thousands of lbs. Typically the lubricant is grease and the friction
coefficient is around 0.1. The sliding velocity is in the order of 0.01 m/s. Therefore, the
friction heat is very high. It is necessary to understand the thermal field of oscillatory pin
and bushing system.
The methodology of analyzing the thermal behavior of oscillatory pin and bushing
has been addressed by Hazlett [180-182] and Krithivasan [183, 184]. However, their
analysis has not been verified by experimental data. In this chapter, both simulation and
experiment are carried out. Their comparison show good agreement.
8.2 Model Development
A schematic of pin and bushing assembly is illustrated by Figure 8.1. The contact
angle is α2 . An oscillation cycle is exhibited in Figure 8.2. For the convenience of
demonstration, it is assumed that the contact region is divided into two sections. The
oscillation angle is represented by one section.
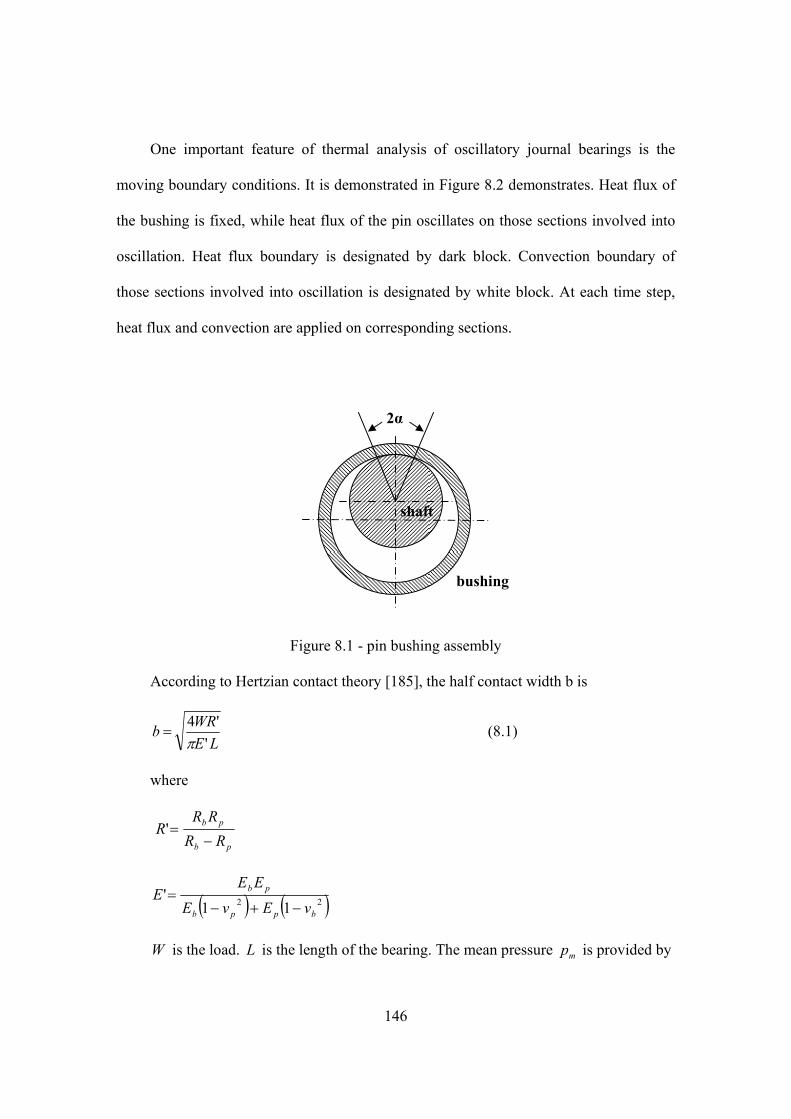
146
One important feature of thermal analysis of oscillatory journal bearings is the
moving boundary conditions. It is demonstrated in Figure 8.2 demonstrates. Heat flux of
the bushing is fixed, while heat flux of the pin oscillates on those sections involved into
oscillation. Heat flux boundary is designated by dark block. Convection boundary of
those sections involved into oscillation is designated by white block. At each time step,
heat flux and convection are applied on corresponding sections.
Figure 8.1 - pin bushing assembly
According to Hertzian contact theory [185], the half contact width b is
LEWRb
''4
π= (8.1)
where
pb
pb
RRRR
R−
='
( ) ( )22 11'
bppb
pb
vEvE
EEE
−+−=
W is the load. L is the length of the bearing. The mean pressure mp is provided by
shaft
bushing
2α

147
Figure 8.2 - one oscillation cycle
bLWpm 2
= (8.2)
The heat flux mq is calculated from
vfpq mm = (8.3)
f is the friction coefficient. v is the sliding velocity of pin.
Assuming the sliding velocity is constant, the oscillation period T can be obtained
from
vR
T pβ4= (8.4)
Contact section
Non-contact section
(1) (2) (3)
(4) (5)

148
β is the oscillating angle.
ANSYS software is employed to apply this methodology for thermal analysis of pin
and bushing.
8.3 Simulation of Pin and Bushing Assemblies
Two pin and bushing assemblies are simulated. Their parameters are listed in Table
8.1.
Table 8.1 - Bearing parameters
Bearing Pin A Pin B Shaft diameter (mm) 179.83 119.85 Radial clearance (mm) 0.358 0.36 Inside diameter of bushing (mm) 180.546 120.57 Outside diameter of bushing (mm) 230.05 168.07 Bearing length (mm) 130 149 L/D Ratio 0.72 1.24 Load (KN) 3673 1541.5 Oscillation angle (0) ± 45 ± 42 Oscillation velocity (rpm) 1.46 1.71
Applying equations (8.1)-(8.4), the calculated contact and oscillation parameters
are:
Table 8.2 - Contact and oscillation parameters
Bearing Pin A Pin B Contact angle (0) 109.52 66 Contact pressure (MPa) 164.38 149.52 Heat flux (kW/m2) 226.433 160.929 Oscillating period (s) 20.55 16.37
Material properties of pin and bushing are tabulated in Table 8.3 [186].
Table 8.3 - Material properties
Density (kg/m3) 7680 Thermal capacity (J/kg·K) 460 Thermal conductivity (W/m·K) 52
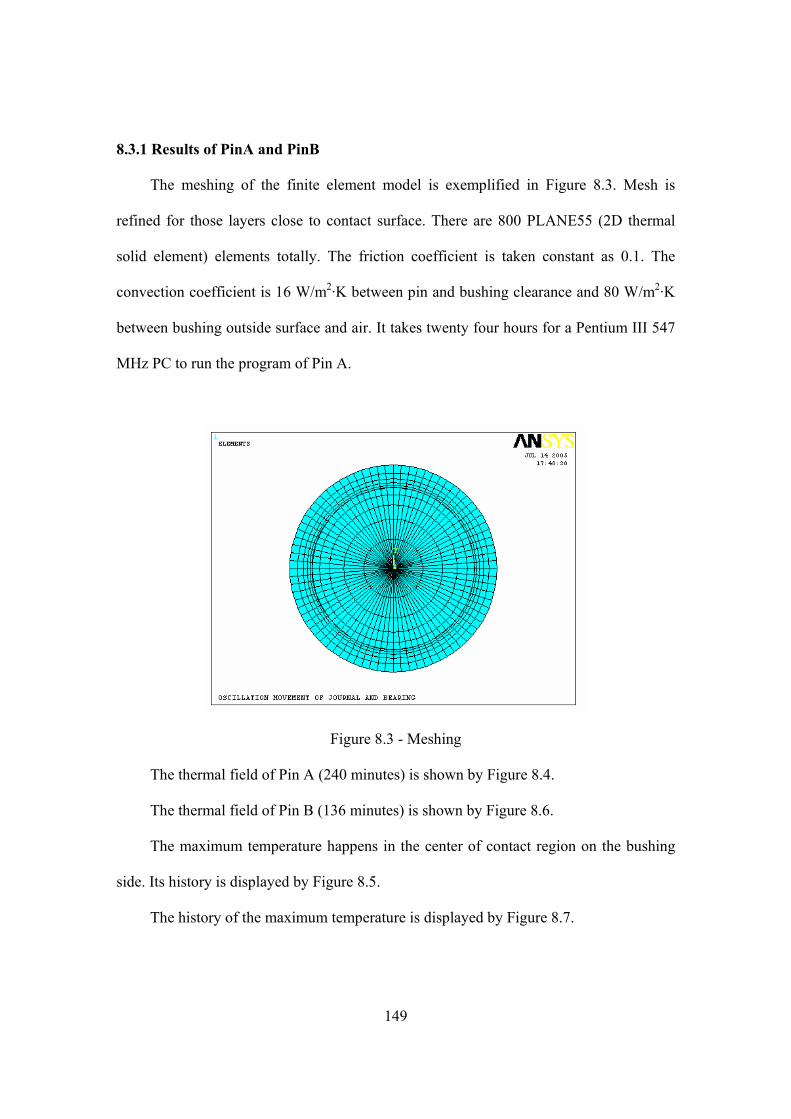
149
8.3.1 Results of PinA and PinB
The meshing of the finite element model is exemplified in Figure 8.3. Mesh is
refined for those layers close to contact surface. There are 800 PLANE55 (2D thermal
solid element) elements totally. The friction coefficient is taken constant as 0.1. The
convection coefficient is 16 W/m2·K between pin and bushing clearance and 80 W/m2·K
between bushing outside surface and air. It takes twenty four hours for a Pentium III 547
MHz PC to run the program of Pin A.
Figure 8.3 - Meshing
The thermal field of Pin A (240 minutes) is shown by Figure 8.4.
The thermal field of Pin B (136 minutes) is shown by Figure 8.6.
The maximum temperature happens in the center of contact region on the bushing
side. Its history is displayed by Figure 8.5.
The history of the maximum temperature is displayed by Figure 8.7.

150
Figure 8.4 – Thermal field of Pin A, 240 minutes
Time (min)0 50 100 150 200 250 300 350
Tem
pera
ture
(0 C)
0
200
400
600
800
1000
Figure 8.5 – History of the maximum temperature, Pin A

151
Figure 8.6 – Thermal field of Pin B, 136 minutes
Time (min)0 50 100 150 200 250 300
Tem
pera
ture
(0 C)
0
50
100
150
200
250
300
350
400
Figure 8.7 – History of the maximum temperature, Pin B
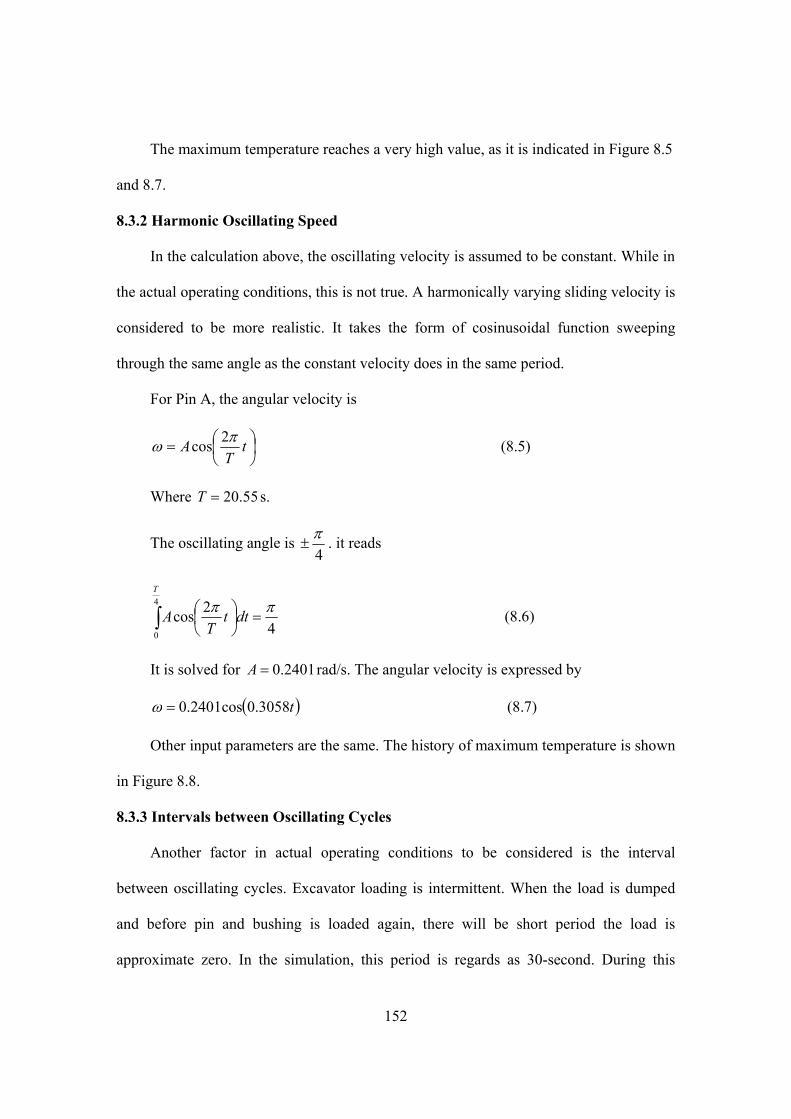
152
The maximum temperature reaches a very high value, as it is indicated in Figure 8.5
and 8.7.
8.3.2 Harmonic Oscillating Speed
In the calculation above, the oscillating velocity is assumed to be constant. While in
the actual operating conditions, this is not true. A harmonically varying sliding velocity is
considered to be more realistic. It takes the form of cosinusoidal function sweeping
through the same angle as the constant velocity does in the same period.
For Pin A, the angular velocity is
⎟⎠⎞
⎜⎝⎛= t
TA πω 2cos (8.5)
Where 55.20=T s.
The oscillating angle is 4π
± . it reads
∫ =⎟⎠⎞
⎜⎝⎛4
0 42cos
T
dttT
A ππ (8.6)
It is solved for 0.2401=A rad/s. The angular velocity is expressed by
( )t3058.0cos2401.0=ω (8.7)
Other input parameters are the same. The history of maximum temperature is shown
in Figure 8.8.
8.3.3 Intervals between Oscillating Cycles
Another factor in actual operating conditions to be considered is the interval
between oscillating cycles. Excavator loading is intermittent. When the load is dumped
and before pin and bushing is loaded again, there will be short period the load is
approximate zero. In the simulation, this period is regards as 30-second. During this
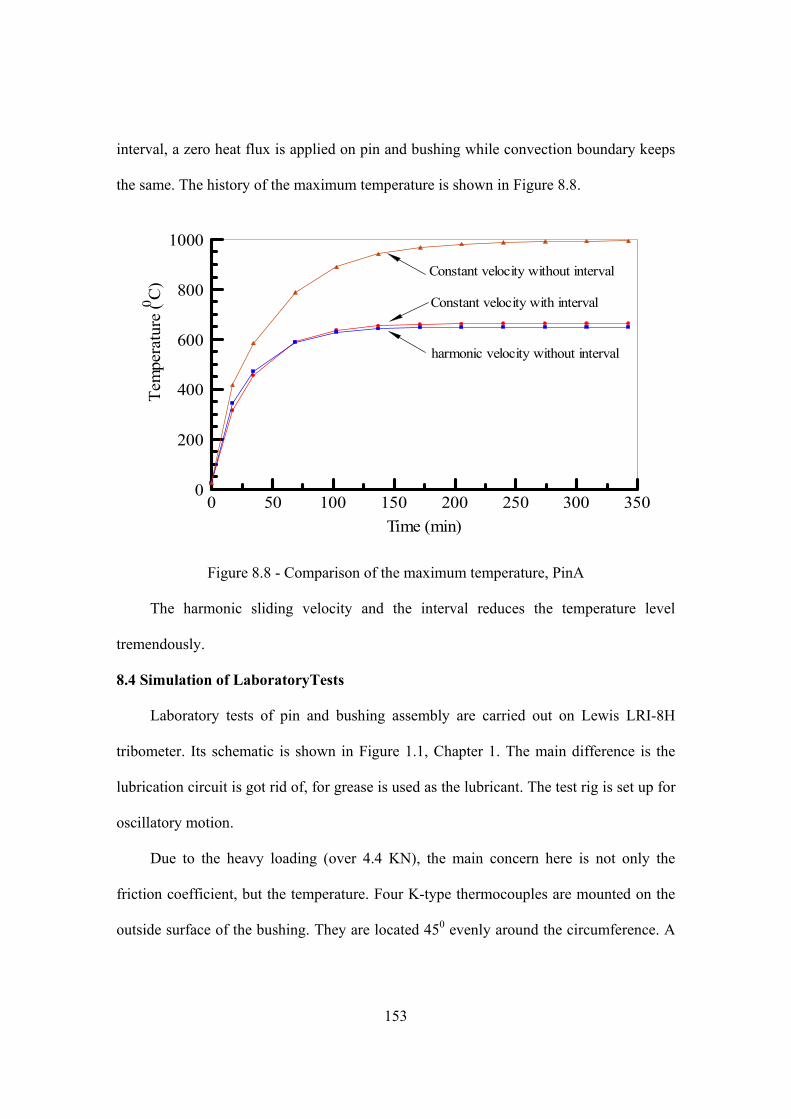
153
interval, a zero heat flux is applied on pin and bushing while convection boundary keeps
the same. The history of the maximum temperature is shown in Figure 8.8.
Time (min)0 50 100 150 200 250 300 350
Tem
pera
ture
(0 C)
0
200
400
600
800
1000
Constant velocity without interval
Constant velocity with interval
harmonic velocity without interval
Figure 8.8 - Comparison of the maximum temperature, PinA
The harmonic sliding velocity and the interval reduces the temperature level
tremendously.
8.4 Simulation of LaboratoryTests
Laboratory tests of pin and bushing assembly are carried out on Lewis LRI-8H
tribometer. Its schematic is shown in Figure 1.1, Chapter 1. The main difference is the
lubrication circuit is got rid of, for grease is used as the lubricant. The test rig is set up for
oscillatory motion.
Due to the heavy loading (over 4.4 KN), the main concern here is not only the
friction coefficient, but the temperature. Four K-type thermocouples are mounted on the
outside surface of the bushing. They are located 450 evenly around the circumference. A
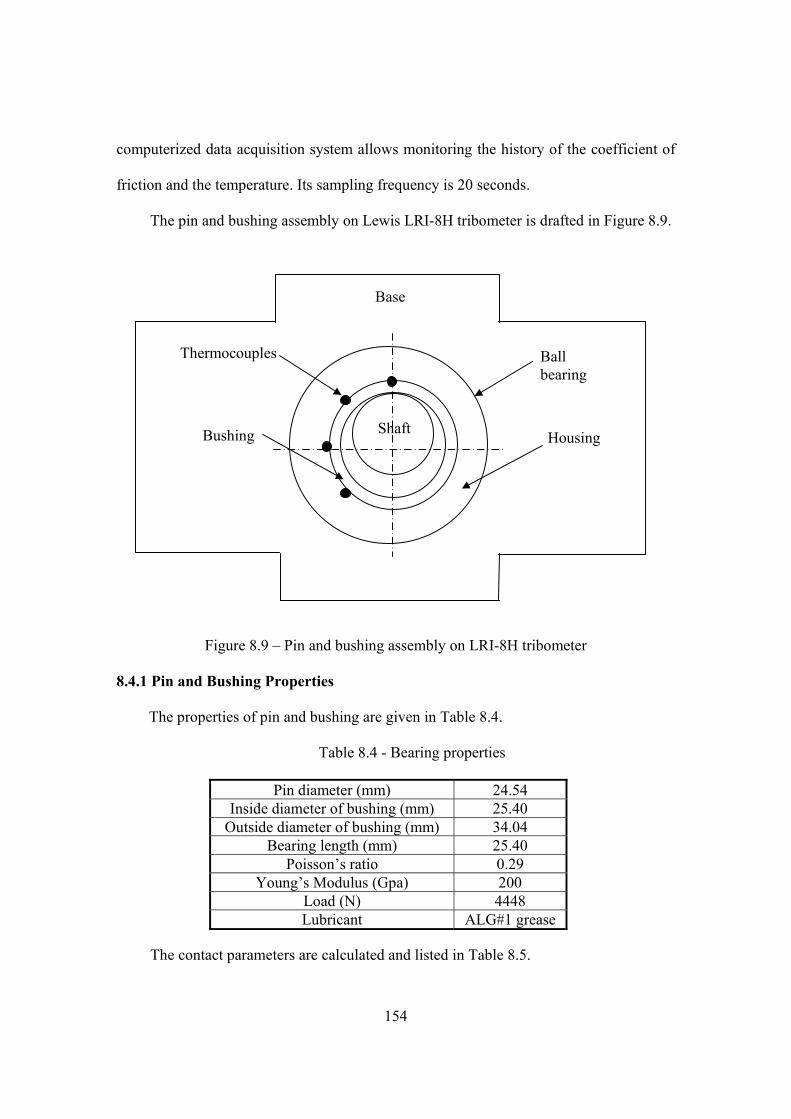
154
computerized data acquisition system allows monitoring the history of the coefficient of
friction and the temperature. Its sampling frequency is 20 seconds.
The pin and bushing assembly on Lewis LRI-8H tribometer is drafted in Figure 8.9.
Figure 8.9 – Pin and bushing assembly on LRI-8H tribometer
8.4.1 Pin and Bushing Properties
The properties of pin and bushing are given in Table 8.4.
Table 8.4 - Bearing properties
Pin diameter (mm) 24.54 Inside diameter of bushing (mm) 25.40
Outside diameter of bushing (mm) 34.04 Bearing length (mm) 25.40
Poisson’s ratio 0.29 Young’s Modulus (Gpa) 200
Load (N) 4448 Lubricant ALG#1 grease
The contact parameters are calculated and listed in Table 8.5.
Ball bearing
Housing Shaft
Base
Bushing
Thermocouples

155
Table 8.5 – Contact parameters
Contact angle (0) 8 Contact pressure (MPa) 103
Material properties are the same as those in Table 8.3.
The oscillating frequency is 1.34 Hz. The oscillation angle is ± 450.
8.4.2 Experimental Results
Numerous experiments have been done. They are exemplified by Figures 8.10-8.15
The friction coefficient reaches steady state after 60 minutes. It oscillates around
0.123. The reading of thermocouple 1 has the highest value because its position is the
closet to the contact center. The further the position away from the contact center, the
lower the temperature is. Those experiments show good repeatability. Success in
simulating one of them would verify the validity of simulation methodology.
0 50 100 150 200 250
Time (min)
0.125
0.130
0.135
0.140
0.145
0.150
0.155
Fric
tion
coef
ficie
nt
Figure 8.10 - History of the friction coefficient
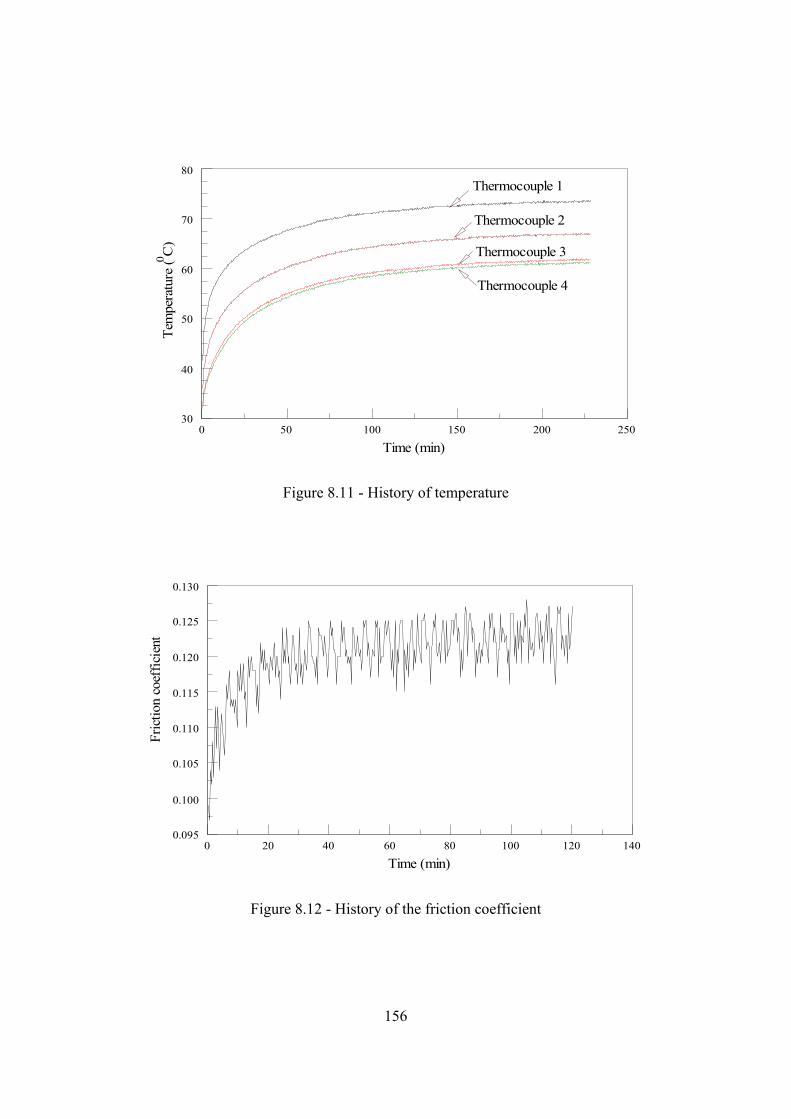
156
0 50 100 150 200 250
Time (min)
30
40
50
60
70
80Te
mpe
ratu
re (0 C
)Thermocouple 1
Thermocouple 2
Thermocouple 3
Thermocouple 4
Figure 8.11 - History of temperature
0 20 40 60 80 100 120 140
Time (min)
0.095
0.100
0.105
0.110
0.115
0.120
0.125
0.130
Fric
tion
coef
ficie
nt
Figure 8.12 - History of the friction coefficient

157
0 20 40 60 80 100 120 140
Time (min)
40.0
45.0
50.0
55.0
60.0
65.0
70.0
75.0
80.0Te
mpe
ratu
re (0 C
)
Thermocouple 1
Thermocouple 2
Thermocouple 3
Thermocouple 4
Figure 8.13 - History of temperature
0 50 100 150 200 250
Time (min)
0.095
0.100
0.105
0.110
0.115
0.120
0.125
0.130
Fric
tion
coef
ficie
nt
Figure 8.14 - History of the friction coefficient

158
0 50 100 150 200 250
Time (min)
35.0
40.0
45.0
50.0
55.0
60.0
65.0
70.0
75.0
80.0Te
mpe
ratu
re (0 C
)
Thermocouple 1
Thermocouple 2
Thermocouple 3Thermocouple 4
Figure 8.15 - History of temperature
8.4.3 Simulation
Besides applying the strategy of moving boundary conditions into ANSYS code,
several other factors are considered into simulation of dummy tests.
8.4.3.1 Curve Fitting of the Friction Coefficient
The friction coefficient of experiments is curve fitted by a power function
21
ctcf = (8.8)
Where t is in minute.
The curve fitting of experimental result in Figure 8.14 is
0366.01024.0 tf = (8.9)
The graph is shown in Figure 8.16.
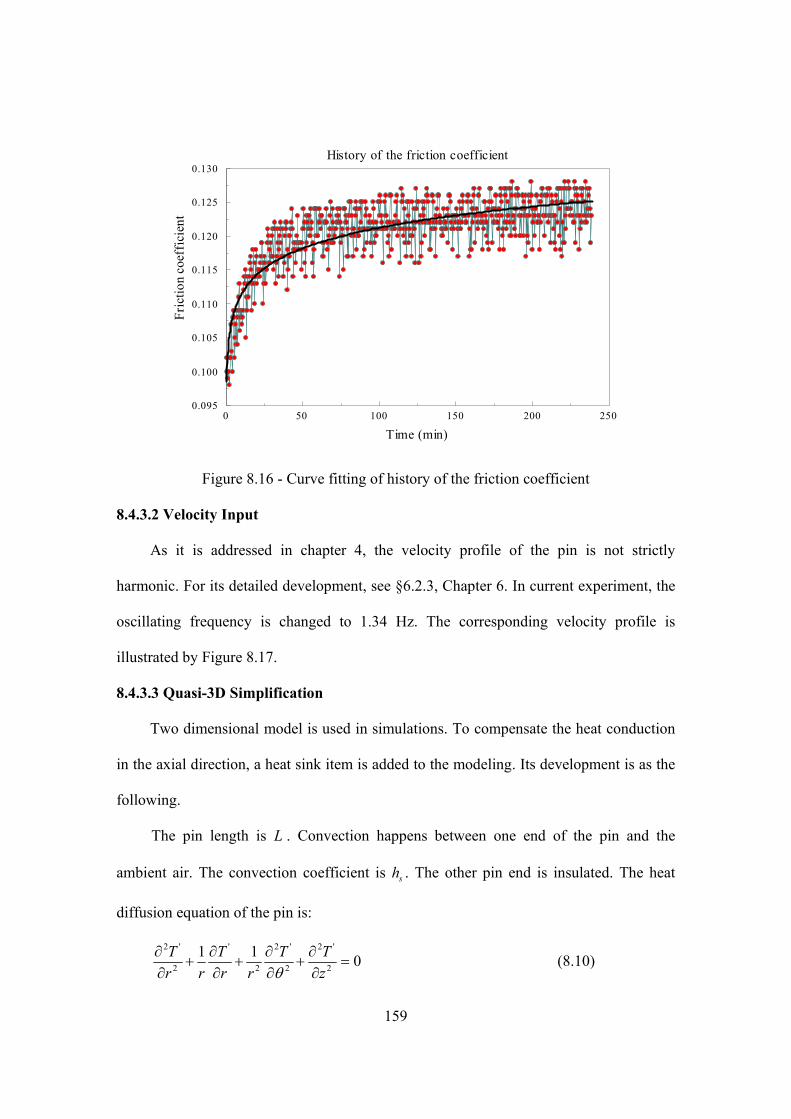
159
Time (min)0 50 100 150 200 250
Fric
tion
coef
fici
ent
0.095
0.100
0.105
0.110
0.115
0.120
0.125
0.130History of the friction coefficient
Figure 8.16 - Curve fitting of history of the friction coefficient
8.4.3.2 Velocity Input
As it is addressed in chapter 4, the velocity profile of the pin is not strictly
harmonic. For its detailed development, see §6.2.3, Chapter 6. In current experiment, the
oscillating frequency is changed to 1.34 Hz. The corresponding velocity profile is
illustrated by Figure 8.17.
8.4.3.3 Quasi-3D Simplification
Two dimensional model is used in simulations. To compensate the heat conduction
in the axial direction, a heat sink item is added to the modeling. Its development is as the
following.
The pin length is L . Convection happens between one end of the pin and the
ambient air. The convection coefficient is sh . The other pin end is insulated. The heat
diffusion equation of the pin is:
0112
'2
2
'2
2
'
2
'2
=∂∂
+∂∂
+∂∂
+∂∂
zTT
rrT
rrT
θ (8.10)

160
Time (s)0.0 0.1 0.2 0.3 0.4 0.5 0.6 0.7 0.8
Ang
ular
vel
ocity
(rad
/s)
-6.0
-4.0
-2.0
0.0
2.0
4.0
6.0
8.0
Figure 8.17 - the angular velocity of the shaft
Figure 8.18 - Pin in polar coorinate
Where
∞−= TTT '
Integrating equation (8.10) in z direction, it reads
L
r
z
θ

161
011
0
'
02
'2
2
'
2
'2
=∂∂
+⎟⎟⎠
⎞⎜⎜⎝
⎛∂∂
+∂∂
+∂∂
∫∫ dzzTdzT
rrT
rrT LL
θ
011
0
'
02
'2
2
'
2
'2
=∂∂
+⎟⎟⎠
⎞⎜⎜⎝
⎛∂∂
+∂∂
+∂∂
LL
zTzT
rrT
rrT
θ
( ) 0011
0
''
2
'2
2
'
2
'2
=⎟⎟⎠
⎞⎜⎜⎝
⎛
∂∂
−∂∂
+−⎟⎟⎠
⎞⎜⎜⎝
⎛∂∂
+∂∂
+∂∂
zT
zTLT
rrT
rrT
Lθ (8.11)
The boundary condition at 0=z is
( )TThdzdTk s −=− ∞
0
'
Which is equivalent to
kTh
dzdT s
'
0
'
= (8.12)
The boundary condition at Lz = is
0'
=−Ldz
dTk
Which is equivalent to
0'
=Ldz
dT (8.13)
Substituting equations (8.12) and (8.13) into (8.11), it obtains
kLThT
rrT
rrT s
'
2
'2
2
'
2
'2 11=
∂∂
+∂∂
+∂∂
θ (8.14)
The right hand side of equation (8.14) acts like a heat sink item. In ANSYS
modeling, a heat generation item (negative to represent heat sink, LThs
'
−= ) is applied to
shaft and bushing element by the command of “BF”.

162
8.4.3.4 Simulation Results
Simulation of the thermal field in Figure 8.15 is carried out. The comparison of
simulation and experiment is demonstrated by Figure 8.19.
Time (min)0 20 40 60 80 100 120 140
Tem
pera
ture
(0 C)
20
30
40
50
60
70
80
ExperimentSimulation
Figure 8.19 – Comparison of simulation and experiment
The simulation captures the right trend of experiment results. The temperature
shows rapid increment during the initial stage. It is in this part that the discrepancy
between simulation and experiment is big. Quasi-3D simplification introduces error, for
the pin has a tapered end mounted in a bracket whose boundary is not insulated. Due to
the way of applying load, the pin behaves like a cantilevered beam which causes the non-
uniform heat flux along the axial direction. The housing and the ball bearing between
housing and the supporting base causes some error also. More importantly, this modeling
does not include thermo-mechanical coupling. The deformation of pin and bushing varies
with temperature. So is the contact region. A model considering thermo-mechanical
coupling will improve the results effectively.

163
8.5 Conclusion
The thermal field of oscillatory pin and bushing is examined. It is proved that
moving boundary can represent the oscillatory motion effectively. Simulation of a pin
and bushing system shows good results. A proper interval between oscillation cycles
drops the temperature tremendously. Experiment results of laboratory tests are presented,
and their simulation captures the right trend of temperature measurements on four
positions. The friction coefficient reaches steady state after certain time. So does the
thermal field. The further the position away from the contact center (heat source), the
lower the temperature is.
8.6 Nomenclature
b half contact width, m
'E equivalent modulus, Pa
f friction coefficient
L length, m
mp mean pressure, Pa
mq heat flux, W/m2
'R equivalent radius, m
t time,
T oscillation period, s
v linear velocity, m/s
W load, N
ω angular velocity, rad/s
α half contact angle, rad

164
β oscillation angle, rad
ν possion’s ratio
Subscripts
b bushing
p pin

165
REFERENCES
[1] Stribeck, R., 1902, “Kugellager für beliebige Belastungen,” Zeitschrift des Vereines deutscher Ingenieure, 46 (37), pp. 1341-1348 (part I), 46 (38), pp. 1432-1438 (part II), 46 (39), pp. 1463-1470.
[2] Hirn, G., 1854, “Sur les principaux phénomènes qui presentment les frottements médiats,” Bulletin of the Industrial Society of Mulhouse, 26, pp. 188-277.
[3] Thurston, R. H., 1885, A Treatise on Friction and Lost Work on Machinery and Millwork, Wiley, New York.
[4] Dowson, Duncan, 1998, History of Tribology, 2nd Edition, Professional Engineering Publishing, London and Bury St Edmunds, UK.
[5] Hersey, M. D., 1938, Theory of Lubrication, 2nd Edition, John Wiley & Sons, Inc, New York, NY.
[6] Hersey, M. D., 1966, Theory and Research In Lubrication, John Wiley & Sons, Inc, New York, NY.
[7] Tzeng, Huey-M., 1995, “Dynamic Torque Characteristics of Disc-Drive Spindle Bearings,” Advances in Information Storage and Processing Systems, 1995; Presented at the 1995 ASME International Mechanical Engineering Congress and Exposition, 1, pp. 57-63.
[8] Shimomura, Takao, Hirabayashi, Hiroshi, and Nakajima, Toshikatsu, 1991, “A Study of the Relationship Between Frictional Characteristics and Surface Condition of Mechanical Face seals,” Tribology Transactions, 34 (4), pp. 513-520.
[9] Kaneta, M., Todoroki, H., Nishikawa, H., Kanzaki, Y., and Kawahara, Y., Oct 2000, “Tribology of Flexible Seals for Reciprocating Motion,” Journal of Tribology, 122, pp. 787-795.
[10] Eguchi, Masao, Takesue, Masahiko, and Yamamoto, Takashi, 1991, “Friction Characteristic of A Paper-based Facing for A Wet Clutch, Experimental Results and Consideration by Stribeck Curve,” Journal of Japanese Society of Tribologists, 36 (7), pp. 535-542.
[11] Tanaka, Kazuhiko, Kyogoku, Keiji, and Nakahara, Tsunamitsu, 1999, “Lubrication Characteristics on Sliding Surfaces in A Piston Pump and Motor During Running-in Tests,” Fatigue and Fracture Mechanics, National Symposium on Fracture Mechanics, ASTM Special Technical Publication, N01339, West Conshohocken, PA, pp. 47-59.
[12] Smith, S. L., Dowson, D. and Goldsmith, A. A. J., 2001, “The Lubrication of Metal-on-metal Total Hip Joints: A Slide Down the Stribeck Curve,” Proc. of the Institution of Mechanical Engineers, Part J, Journal of Engineering Tribology, 215 (5), pp. 483-493.
166
[13] Tu, Ching-Fang, and Fort, Tomlinson, Sept 2004, “A Study of Fiber-capstan Friction. 1. Stribeck Curves,” Tribology International, 37 (9), pp. 701-710.
[14] Wilson, Robert E. and Barnard, Daniel P., 1922, “The Mechanism of Lubrication,” Transactions of the Society of Automotive Engineers, 51, pp. 203-238.
[15] McKee, S. A. and McKee, T. R., 1932, “Journal Bearing Friction in the Region of Thin-Film Lubrication,” SAE journal, 31 (3), pp. 371-377.
[16] Bridgeman, O. C., McKee, S. A., and Bitner, F. G., 1932, “The Effect of Viscosity on Friction in the Region of Thin-Film Lubrication,” Proc. of Annual meeting of American Petroleum Institute, 13 (3), pp. 154-158.
[17] Burwell, J. T., Kaye, J., Nymegen, D. W. V., and Morgan, D. A., June 1941, “Effects of Surface Finish,” Journal of Applied Mechanics, 8 (T63, A), pp. 49-58.
[18] Ocvirk, F. W. and DuBois, G. B., June 1959, “Surface Finish and Clearance Effects on Journal-Bearing Load Capacity and Friction,” Journal of Basic Engineering, Transactions of A.S.M.E, 81, pp. 245-253.
[19] Vogelpohl, Georg, 1965, “Thermal Effects and Elasto-Kinetics in Self-acting Bearing Lubrication,” Proc. of International Symposium on Lubrication and Wear, Houston, pp. 766-815.
[20] Forrester, P. G., 1946, “Kinetic Friction in or near the Boundary Region, II-The influence of Sliding Velocity and other Variables on Kinetic Friction in or near the Boundary Region,” Proc. of the Royal Society of London, Series A, 187 (A1011), pp. 439-463.
[21] Lovell, M. R., Khonsari, M. M. and Marangoni, R. D., Apr 1993, “The response of Balls Undergoing Oscillatory Motion-Crossing from Boundary to Mixed Lubrication Regimes,” Journal of Tribology, 115 (2), pp. 787-795.
[22] Spikes, H. A., 1997, “Mixed Lubrication - an Overview,” Lubrication Science, 9 (3), pp. 2-33.
[23] Spikes, H. A. and Olver, A. V., 2003, “Basics of Mixed Lubrication,” Lubrication Science, 16 (1), pp. 3-28.
[24] Jacobson, Bo, 2003, “The Stribeck Memorial Lecture,” Tribology International, 36, pp. 781-789.
[25] Khonsari, M. M. and Booser, E. R., 2001, Applied Tribology Bearing– Design and Lubrication, John Wiley & Sons, Inc, New York, NY.
[26] Raimoindi, A. A. and Szeri, A. Z., 1984, “Journal and Thrust Bearings,” Handbook of Lubrication, Vol. 2, CRC Press, Boca Raton, FL, pp. 413-462.

167
[27] Tarasov, L. P., April 1945, “Relation of Surface Roughness Readings to Actual Surface Profile,” Transactions of The ASME, 67, pp. 189-196.
[28] Martin, F. A., 1963-1964, “Minimum Allowable Oil Film Thickness in Steadily Loaded Journal Bearings,” Proc. of Institution of Mechanical Engineers, 178, part 3N, pp. 161-167.
[29] Rubert, M. P., 1959, “Confusion in Measuring Surface Roughness,” Engineering, London, 23, pp. 393.
[30] Ocvirk, F. W., 1952, “Short Bearing Approximation for Full Journal Bearings,” Technical Notes, TN2808, NACA, Washington.
[31] Davis, A. J., 1957, “Sleeve-bearings-Part II, running in characteristics,” Pro. of Institution of Mechanical Engineers, London, 171 (35), pp. 951.
[32] Hamrock, Bernard J., Aug 1991, Fundamentals of Fluid Film Lubrication, NASA Reference Publication 1255.
[33] Cann, P., Ioannides, E., Jacobson, B., and Lubrecht, A. A., June 1994, “The lambda ratio- a re-examination,” Wear, 175, pp. 177-188.
[34] Masen, MA, C. H. Venner, P. M. Lugt and J. H. Tripp, 2002, “Effects of Surface Micro-Geometry On the Lift-off Speed Of an EHL Contact,” Tribology Transactions, 45 (1), pp. 21-30.
[35] Blok, H., 1950, “Fundamental Mechanical Aspects of Thin-Film Lubrication,” Annals of the New York Academy of Sciences, 53, pp. 779-795.
[36] Givens, J. W. and Talley S. K., Oct 1962, “Friction Measurement with the Tapered Spindle Top,” Lubrication Engineering, 18, pp. 443-449.
[37] Dowson, Duncan, and Higginson, G. R., 1977, Elasto-Hydrodynamic Lubrication, Pergamon Press, Oxford, England.
[40] Gümbel, L., 1916, “Das Problem Der Lagerreibung,” Mbl. berl. BezVer. dt. Ing. (VDI), pp. 87-104 and pp. 109-120.
[41] Falz, E., 1937, “Principles of the Design of Journal Bearings, General Discussion of Lubrication and Lubricants,” the Institution of Mechanical Engineers, London, 1, pp. 93-103.
[42] Cameron, A., 1966, Principles of Lubrication, Longmans Greens & Co Ltd, U.S.A.
[43] Greenwood, J. A., and Williamson, J. B. P., 1966, “Contact of Nominally Flat Surfaces,” Proceedings of the Royal Society of London, Series A, 295, pp. 300-319.

168
[44] Patir, N., and Cheng, H. S., 1978, “An Average Flow Model for Determining Effects of Three-dimensional Roughness On Partial Hydrodynamic Lubrication,” Transactions of ASME, Journal of Lubrication Technology, 100, pp. 8-14.
[45] Chang, L., 1995, “A Deterministic Model for Line Contact Partial Elastohydrodynamic Lubrication,” Tribology International, 28, pp. 75-84.
[46] Johnson, K. L., Greenwood, J. A., and Poon, S. Y., 1972, “A Simple Theory of Asperity Contact In Elastohydrodynamic Lubrication,” Wear, 19, pp. 91-108.
[47] Tallian, T.E., 1972, “The Theory of Partial Elastohydrodynamic Contacts,” Wear, 21 (1), pp. 49-101.
[48] Karelitz, G. B., 1926, “The Lubrication of Waste-Packed Bearings,” Transactions of ASME, 48, pp. 1165-1199.
[49] Fuller, D. D., 1954, “Mixed Friction Conditions in Lubrication,” Lubrication Engineering, September-October, pp. 256-261.
[50] Lenning, R. L., 1960, “The Transition from Boundary to Mixed Friction,” Lubrication Engineering, December, pp. 575-582.
[51] Tsao, Yuh-Hwang, 1975, “A Model for Mixed Lubrication,” Transactions of American Society of Lubrication Engineers, 18 (2), pp. 90-96.
[52] Soda, N., 1978, “Effect of Bearing Area and Surface Roughness in Fluid and Mixed Lubrication,” Journal of Japanese Society of Lubrication Engineers, 23 (9), pp. 22-30.
[53] Soda, N., 1985, “Effect of Abbott Bearing Area on Characteristics of Stribeck Curve,” Journal of Japanese Society of Tribologists, 31 (9), pp. 637-642.
[54] Yamaguchi, A. and Matsuoka, H., 1992, “A Mixed Lubrication Model Applicable to Bearing/Seal Parts of Hydraulic Equipment,” Journal of Tribology, 114, pp. 116-121.
[55] Gelinck, E. R. M. and Schipper, D. J., 1999, “Deformation of Rough Line Contacts,” Journal of Tribology, 121 (3), pp. 449-454.
[56] Gelinck, E. R. M. and Schipper, D. J., 2000, “Calculation of Stribeck Curves for Line Contacts,” Tribology International, 33, pp. 175-181.
[57] Olsson, H., Åström, K. J., de Wit, Canudas C., Gäfvert, M., and Lischinsky, P., 1998, “Friction Models and Friction Compensation,” European Journal of Control, 4 (3), pp. 176-195.
[58] Wang, Q., Shi, F. H. and Lee, S. C., 1997, “A Mixed-Lubrication Study of Journal Bearing Conformal Contacts,” Journal of Tribology, 119 (3), pp. 456-461.
169
[59] Wang, Q., Shi, F. H. and Lee, S. C., 1998, “A Mixed-TEHD Model for Journal-Bearing Conformal Contact-Part II: Contact, Film Thickness, and Performance Analysis,” 120 (2), pp. 206-213.
[60] Liu, W. K., Xiong, S. W., Guo, Y., Wang, Q., Wang, Y. S., Yang, Q. M. and Vaidyanathan, K., 2004, “Finite Element Method for Mixed Elastohydrodynamic Lubrication of Journal-Bearing Systems,” International Journal For Numerical Methods in Engineering, 60 (10), pp. 1759-1790.
[61] Bair, S. and Winer, W. O., 1979, “A Rheological Model for EHL Contacts Based on Primary Laboratory Data,” ASME Journal of Lubrication Technology, 101 (3), pp. 258-265.
[62] Khonsari, M. M. and Hua, D. Y., 1994, “Thermal Elastohydrodynamic Analysis Using a Generalized Non-Newtonian Formulation With Application to Bair-Winer Constitutive Equation,” Journal of Tribology, 116 (1), pp. 37-45.
[63] Fein, R. S., 1997, “High Pressure Viscosity and EHL Pressure-Viscosity Coefficients,” Tribology Data Handbook, CRC Press, Boca Raton, FL, pp. 638-644.
[64] Moes, H., 1992, “Optimum Similarity Analysis with Application to Elastohydrodynamic Lubrication,” Wear, 159, pp. 57-66.
[65] Whitehouse, D. J. and Archard J. F., 1970, “The Properties of Random Surfaces of Significance in Their Contact,” Proceedings of the Royal Society of London, Series A, 316, pp. 97-121.
[66] Baker, A. E., 1958, “Grease Bleeding – A Factor in Ball bearing Performance,” NLGI Spokesman, 22, pp. 271-277.
[67] Bauer, W. H., Finkelstein, A. P. and Wiberley, S. E., 1960, “Flow Properties of Lithium Stearate-Oil Model Greases as Function of Soap Concentration and Temperature,” ASLE Transactions, 3, pp. 215-224.
[68] Kageyama, H., Machidori, W. and Moriuchi, T., 1984, “Grease Lubrication in Elastohydrodynamic Contacts,” NLGI Spokesman, 48 (3), pp. 72-81.
[69] Pemberton, J. and Cameron, A., 1976, “A Mechanism of Fluid Replenishment in Elastohydrodynamic Contacts,” Wear, 37 (1), pp. 185-190.
[70] Aström, H., Östensen, J. O. and Höglund, E., 1993, “Lubricating Grease Replenishment in an Elastohydrodynamic Point Contact,” Journal of Tribology, 115 (3), pp. 501-506.
[71] Cann, P. M. and Spikes, H. A., 1995, “Visualization of Starved Grease and Fluid Lubricant Films,” Lubricants and Lubrication, Elsevier Science, pp. 161-166.
[72] Lewis, Walter J, 1990, “The Design of High Speed Grease Lubricated Spindles for Machine Tool Production Equipment,” SAE Transactions, 99, sect 5, pp. 1061-1070.
170
[73] Bradford, L. J., Barber, E. M. and Muenger, J. R., 1961, “Grease Lubrication Studies with Plain Bearings, Transactions of Journal of Basic Engineering,” 83, pp. 153-161.
[74] Horth, A. C., 1968, “Friction Reduction with Greases,” NLGI Spokesman, 32, pp. 155-161.
[75] Godfrey, D., 1964, “Friction of Greases and Grease Components during Boundary Lubrication,” ASLE Transactions, 7, pp. 24-31.
[76] Reinhoudt, J. P., 1970, “A Grease-lubricated Hydrodynamic Bearing System for A Satellite Flywheel,” Journal of the American Society of Lubrication Engineers, 26 (3), pp. 95-100.
[77] Wikström, V., 1996, “Rolling Bearing Lubrication at Low Temperature,” Doctoral Thesis, Division of Machine Elements, Lulea University of Technology.
[78] Östensen, J. O., 1995, “Lubrication of Elastohydrodynamic Contacts mainly Concerning Low Temperature,” Doctoral Thesis, Division of Machine Elements, Lulea University of Technology.
[79] Westcott, A. L., 1913, “The Lubricating Value of Cup Greases,” Journal of the American Society of Mechanical Engineers, 35, pp. 1143-1167.
[80] Cohn, G. and Oren, J. W., 1949, “Film pressure in Grease-lubricated Sleeve Bearings,” Transactions of the American Society of Mechanical Engineers, 71, pp. 555-560.
[81] Chakrabarti, R. K. and Harker, R. J., 1960, “Frictional Resistance of a Radially Loaded Journal Bearing with Grease Lubrication,” Lubrication Engineering, 16, pp. 274-280.
[82] Glaeser, W. A., 1977, “Operating Limitations of Heavily Loaded Grease-lubricated Cast Bronze Bearings,” ASLE Transactions, 20 (4), pp. 309-314.
[83] Stolarski, T. and Olszewski O., 1976, “An Experimental Study of the Frictional Mechanism in a Journal Bearing Lubricated with Grease Containing Powered PTFE,” Wear, 39, pp. 377-387.
[84] Muijderman, E.A., Remmers, G. and Tielemans, L. P. M., 1980, “Grease-lubricated Spiral-groove Bearings,” Phillips Technical Review, 39 (6/7), pp. 184-198.
[85] Lawrence, K. B., 1950, “A Mathematical Evaluation of Pressures in a grease-lubricated bearing,” Transactions of the American Society of Mechanical Engineers, 72, pp. 429-443.
[86] Milne, A. A., 1958, “A Theory of Grease Lubrication of A Slider Bearing,” Proc. International Congress on Rheology (2nd, Oxford), pp. 427-436.

171
[87] Wada, S. and Hayashi, H., 1971, “Hydrodynamic Lubrication of Journal Bearings by Pseudo-plastic Lubricants-Part 1, Theoretical Studies,” Bulletin of the JSME, 14, pp. 268-278.
[88] Wada, S. and Hayashi, H., 1971, “Hydrodynamic Lubrication of Journal Bearings by Pseudo-plastic Lubricants-Part 2, Experimental Studies,” Bulletin of the JSME, 14, pp. 279-286.
[89] Wada, S. and Hayashi, H., 1974, “Hydrodynamic Lubrication of Journal Bearings by Pseudo-plastic Lubricants-Part 3, Application to Journal Bearings,” Bulletin of the JSME, 17, pp. 1182-1191.
[90] Wada, S. and Kawakami, Y., 1986, “Hydrodynamic Lubrication of Porous Journal Bearings with grease,” Bulletin of the JSME, 29 (249), pp. 943-949.
[91] Hayashi, H., Wada, S. and Nakarai N., 1977, “Hydrodynamic Lubrication of Journal Bearings by Non-Newtonian Lubricants,” Bulletin of the JSME, 20, pp. 224-231.
[92] Tichy, J.A., 1991, “Hydrodynamic Lubrication Theory for the Bingham Plastic Flow Model,” Journal of Rheology, 35 (4), pp. 477-496.
[93] Wen, Shi Zhu and Ying, Tsi Neng, 1988, “A Theoretical and Experimental Study of EHL Lubricated With Grease,” Journal of Tribology, 110 (1), pp. 38-43.
[94] Dong, Daming, 1988, “Theory of Elastohydrodynamic Grease-lubricated Line Contact Based on a Refined Rheological Model,” Tribology International, 21 (5), pp. 261-267.
[95] Cheng, Jun, 1994, “Elastohydrodynamic Grease Lubrication Theory and Numerical Solution in Line Contacts,” Tribology Transactions, 37 (4), pp. 711-718.
[96] Jang, J. Y. and Khonsari, M. M, 1997, “Performance Analysis of Grease-lubricated Journal Bearings Including Thermal Effects,” Journal of Tribology, 119, pp. 859-868.
[97] Lu, X. B. and Khonsari, M. M., 2005, “On the Lift-off Speed in Journal bearings,” Tribology Letters, 20 (3-4), pp. 299-305.
[98] Cann, P. M., 2002, “Friction Properties of Grease in Elastohydrodynamic Lubrication,” NLGI Spokesman, 66 (1), pp. 6-15.
[99] Harris, T., 2001, Rolling Bearing Analysis, John Wiley & Sons, New York, NY.
[100] Aihara, S. and Dowson, D., 1979, “A Study of Film Thickness in Grease-lubricated Elastohydrodynamic Contacts,” Proc. of the Society of Photo-optical Instrumentation Engineers, pp. 104-115.
[101] Fogg, A., 1946, “Fluid Film Lubrication of Parallel Thrust Surfaces,” Proc. of the Institution of Mechanical Engineers, 155, pp. 49-69.
172
[102] Shaw, M. C. and Mass, C., 1947, “An Analysis of the Parallel-surface Thrust Bearing,” Transactions of ASME, 69, pp. 381-387.
[103] Denny, D. F., 1961, “Some Measurements of Fluid Pressures between Plan Parallel Thrust Surfaces with Special Reference to Radial Face Seals,” Wear, 4, pp. 64-83.
[104] Zienkiewicz, O. C., 1957, “Temperature Distribution within Lubricating Films between Parallel Bearing Surfaces and Its Effect on the Pressures Developed,” Proc. of the Conference on Lubrication and Wear, London, October 1-3, pp. 135-141.
[105] Davies, M. G., 1961, “The Generation of Lift by Surface Roughness in a Radial Face Seal,” Proc. of the 3rd International Conference on Fluid Sealing, British Hydromechanics Research Association, Harlow, Essex, UK, pp. 1-15.
[106] Salama, M. E., 1950, “The Effect of Macro-roughness on the Performance of Parallel Thrust Bearings,” Proc. of the Institution of Mechanical Engineers, 161, pp. 149-161.
[107] Pape, J. G., 1968, “Fundamental Research on a Radial Face Seal,” ASLE Transactions, 11 (4), pp. 302-309.
[108] Hamilton, D. B., Walowit, J. A., and Allen, C. M., 1966, “A Theory of Lubrication by Micro-irregularities,” Journal of Basic Engineering, 88 (1), pp. 177-185.
[109] Anno, J. N., Walowit, J. A., and Allen, C. M., 1968, “Microasperity Lubrication,” Journal of Lubrication Technology, Transactions of ASME, Series F, 9 (2), pp. 351-355.
[110] Anno, J. N., Walowit, J. A., and Allen, C. M., 1969, “Load Support and Leakage from Microasperity-lubricated Face Seals,” Journal of Lubrication Technology, Transactions of ASME, Series F, 10, pp. 726-731.
[111] Etsion, I., 1980, “The Effect of Combined Coning and Waviness on the Separating Force in Mechanical Face Seals,” Journal of Mechanical Engineering Science, 22 (2), pp. 59-64.
[112] Tanner, R. I., 1960, “Non-Newtonian Flow and the Oil Seal Problem,” Journal of Mechanical Engineering Sciences, 2 (1), pp. 25-28.
[113] Etsion, I., 1984, “A New Concept of Zero-leakage Noncontacting Mechanical Face Seal,” Journal of Tribology, 106, pp. 338-343.
[114] Lipschitz, A., 1985, “A Zero-leakage Film Riding Face Seal,” Journal of Tribology, 107 (3), pp. 326-332.
[115] Lai, T., 1994, “Development of Non-contacting, Non-leaking Spiral Groove Liquid Face Seals,” Lubrication Engineering, 50 (8), pp. 625-631.
173
[116] Etsion, I., Halperin, G. and Greenberg, Y., 1997, “Increasing Mechanical Seals Life with Laser-textured Seal Faces,” Papers Presented at the 15th International Conference on Fluid Sealing, Maastricht, The Netherland, pp. 3-11.
[117] Etsion, I., 2000, “Improving Tribological Performance of Mechanical Seals by Laser Surface Texturing,” Proc. of the 17th International Pump Users Symposium, Mainz, Germany, pp. 17-21.
[118] Kligerman, Y. and Etsion, I., 2001, “Analysis of the Hydrodynamic Effects in a Surface Textured Circumferential Gas Seal,” Tribology Transactions, 44 (3), pp. 472-478.
[119] Etsion, I. and Halperin, G., 2002, “A Laser Surface Textured Hydrostatic Mechanical Seal,” Tribology Transactions, 45 (3), pp. 430-434.
[120] Tanaka, H., Gomi, K., and Miyake, Y., 1993, “Micro-Tribology of Carbon-coated Thin Film Media with Well-defined Surface Texture,” IEEE Transactions on Magnetics, 29 (1), pp. 270-275.
[121] Tagawa, N. and Bogy, D. B., 2002, “Air Film Dynamics for Micro-textured Flying Head Slider Bearings in Magnetic Hard Disk Drives,” Journal of Tribology, 124 (3), pp. 568-574.
[122] Tagawa, N. and Mori, A., 2003, “Thin Film Gas Lubrication Characteristics of Flying Head Slider Bearings over Patterned Media in Hard Disk Drives,” Microsystem Technologies, 9 (5), pp. 362-368.
[123] Wang, X. L., Kato, K., Adachi, K. and Aizawa, K., 2001, “The Effect of Laser Texturing of SiC Surface on the Critical Load for the Transition of Water Lubrication Mode from Hydrodynamic to Mixed,” Tribology International, 34 (10), pp. 703-711.
[124] Wang, X. L., Kato, K., Adachi, K. and Aizawa, K., 2003, “Loads Carrying Capacity Map for the Surface Texture Design of SiC Thrust Bearing Sliding in Water,” Tribology International, 36 (3), pp. 189-197.
[125] Wakuda, M., Yamauchi, Y., Kanzaki, S. and Yasuda, Y., 2003, “Effect of Surface Texturing on Friction Reduction between Ceramic and Steel Materials under Lubricated Sliding Contact,” Wear, 254 (3-4), pp. 356-363.
[126] Brizmer, V., Etsion, I., 2003, “A Laser Surface Textured Parallel Thrust Bearing,” Tribology Transactions, 46 (3), pp. 387-403.
[127] Ronen, A., Etsion, I. and Kligerman, Y., 2001, “Friction-Reducing Surface-Texturing in Reciprocating Automotive Components,” Tribology Transactions, 44 (3), pp. 359-366.
[128] Ryk, G., Kligerman, Y. and Etsion, I., 2002, “Experimental Investigation of Laser Surface Texturing for Reciprocating Automotive Components,” Tribology Transactions, 45 (4), pp. 444-449.
174
[129] Kligerman, Y., Etsion, I. and Shinkarenko, A., 2005, “Improving Tribological Performance of Piston Rings by Partial Surface Texturing,” Journal of Tribology, 127 (3), pp. 632-638.
[130] Etsion, I. and Burstein, L., 1996, “A Model for Mechanical Seals with Regular Microsurface Structure,” Tribology Transactions, 39 (3), pp. 677-683.
[131] Etsion, I., Kligerman, Y. and Halperin, G., 1999, “Analytical and Experimental Investigation of Laser-textured Mechanical Seal Faces,” Tribology Transactions, 42 (3), pp. 511-516.
[132] Wang, Q. Jane and Zhu, D., 2005, “Virtual Texturing: Modeling the Performance of Lubricated Contacts of Engineered Surfaces,” Journal of Tribology, 127 (4), pp. 722-728.
[133] Geiger, M., Roth, S., and Becker, W., 1998, “Influence of Laser-produced Microstructures on the Tribological Behavior of Ceramics,” Surface & Coating Technology, 100-101, pp. 17-22.
[134] Etsion, I., 2005, “State of the Art in Laser Surface Texturing,” Journal of Tribology, 127 (1), pp. 248-253.
[135] Lo, Sy-Wei and Wilson, W. R. D., 1999, “A Theoretical Model of Micro-Pool Lubrication in Metal Forming,” Journal of Tribology, 121 (4), pp. 731-738.
[136] Lo, Sy-Wei and Tzu-Chern Horng, 1999, “Lubricant Permeation from Micro Oil Pits Under Intimate Contact Condition,” Journal of Tribology, 121 (4), pp. 633-638.
[137] Dowson, D. and Taylor, C. M., 1979, “Cavitation in Bearings”, Annual Review of Fluid Mechanics, 11, pp. 35-66.
[138] Sampson, J. B., Morgan, F., Reed, D. W. and Muskat, M., 1943, “Study in Lubrication, XII, Friction Behavior during the Slip Portion of the Stick-Slip Process,” Journal of Applied Physics, 14 (12), pp. 689-700.
[139] Bell, R. and Burdekin, M., 1966-67, “Dynamic Behavior of Plain Slideways,” Proceedings of Institution of Mechanical Engineers, 181 (1), pp. 169-181.
[140] Bell, R. and Burdekin, M., 1969-70, “A Study of the Stick-Slip Motion of Machine Tool Feed Drives,” Proceedings of Institution of Mechanical Engineers, 184 (1), pp. 543-557.
[141] Bell, R. and Burdekin, M., 1969-70, “An Investigation into the Steady-State Characteristics of Plain Slideways,” Proceedings of Institution of Mechanical Engineers, 184 (1), pp. 1075-1087.
[142] Dahl, P. R., May 1968, “A Solid Friction Model,” TOR0158 (3107-18)-1, the Aerospace Corporation, El Segundo, California.
175
[143] Dahl, P. R., 1976, “Solid Friction Damping of Mechanical Vibrations,” AIAA Journal, 14 (12), pp. 1675-1682.
[144] Dahl, P. R., May 24-27, 1977, “Measurement of Solid Friction Parameters of Ball Bearings,” Proceedings of 6th Symposium on Incremental Motion Control Systems and Devices, pp. 1910-1914.
[145] Fleischer, G., Gröger, H., and Thum, H., 1980, Verschleiss und Zuverlässigkeit, VEB Verlag Technik, Berlin.
[146] Todd, M. J. and Johnson, K. L., 1987, “A Model for Coulomb Torque Hysteresis In Ball Bearings,” International Journal of Mechanical Science, 29 (5), pp. 339-354.
[147] Armstrong-Helouvry, B., 1994, “Survey of Models, Analysis Tools and Compensation Methods for the Control of Machines with Friction,” Automatica, the Journal of International Federation of Automatic Control, 30 (7), pp. 1083-1138.
[148] Dupont, P. E. and Dunlap, E. P., 1995, “Friction Modeling and PD Compensation at Very Low Velocities,” Journal of Dynamic Systems, Measurements, and Control, 117 (1), pp. 8-14.
[149] Yang, Chii-Rong, Lee, Rong-Tsong, and Chiou, Yuang-Cheng, 1997, “Study on Dynamic Friction Characteristics in Reciprocating Friction Drive System,” Tribology International, 30 (10), pp. 719-731.
[150] F. Van De Velde, P. De Baets, and J. Degreck, 1998, “The Friction Force During Stick-Slip with Velocity Reversal,” Wear, 216 (2), pp. 138-149.
[151] Polycarpou, A. A. and Soom, A., 1995, ‘Boundary and Mixed Friction in the Presence of Dynamic Normal loads: Part I – System Model,” Journal of Tribology, 117 (2), pp. 255-260.
[152] Polycarpou, A. A. and Soom, A., 1995, “Boundary and Mixed Friction in the Presence of Dynamic Normal loads: Part II – Friction Transients,” Journal of Tribology, 117 (2), pp. 261-266.
[153] Polycarpou, A. A. and Soom, A., 1995, “Two Dimensional Models of Boundary and Mixed Friction at a Line Contact,” Journal of Tribology, 117 (1), pp. 178-184.
[154] Hess, D. P. and Soom, A., 1990, “Friction at A Lubricated Line Contact Operating at Oscillating Sliding Velocities,” Journal of Tribology, 112 (1), pp. 147-152.
[155] Hess, D. P., 1997, “Apparent Multi-Valued Friction in Lubricated Contact Systems from Tangential Dynamics,” Journal of Tribology, 119 (4), pp. 632-636.
[156] Harnoy, A. and Rachoor, H., 1993, “Angular-Compliant Hydrodynamic Bearing Performance under Dynamic Loads,” Journal of Tribology, 115 (3), pp. 342-347.
176
[157] Harnoy, A. and Friedland, B., 1994, “Dynamic Friction Model of Lubricated Surfaces for Precise Motion Control,” Tribology Transactions, 37 (3), pp. 608-614.
[158] Harnoy, A., Friedland, B., Semenock, R., Rachoor, H., and Aly, A., June 1994, “Apparatus for Empirical Determination of Dynamic Friction,” Proceedings of the American Control Conference, Baltimore, Maryland, pp. 546-550.
[159] Harnoy, A., Friedland, B., Semenock, and R., Rachoor, H., 1994, “Modeling and Simulation of Elastic and Friction Forces in Lubricated Bearings for Precise Motion Control,” Wear, 172, pp. 155-165.
[160] Rachoor, H., January 1996, Investigation of Dynamic Friction in Lubricated Surfaces, Ph. D thesis, New Jersey Institute of Technology.
[161] Lu, X. B. and Khonsari, M. M., “An Experimental Study of Grease-lubricated Journal Bearings undergoing Oscillatory Motion,” in process.
[162] D. A. Haessig, Jr. and Friedland, B., 1991, “On the Modeling and Simulation of Friction,” Journal of Dynamic Systems, Measurements, and Control, 113 (3), pp. 354-362.
[163] Armstrong-Helouvry, B., June 19-21, 1989, “Control of Machine with Non-linear Low-Velocity Friction: A Dimensional Analysis,” Experimental Robotics I: the First International Symposium, Montreal, pp. 180-195.
[164] Armstrong-Helouvry, B., 1991, Control of Machines with Friction, Kluwer Academic Publishers, New York.
[165] de Wit, Canudas C., Olsson, H., Åström, K. J., and Lischinsky, P., June 1993, “Dynamic Friction Models and Control Design,” Proceedings of the American Control Conference, San Francisco, California, pp. 1920-1926.
[166] de Wit, Canudas C., Olsson, H., Åström, K. J., and Lischinsky, P., March 1995, “A New Model for Control of Systems with Friction,” IEEE Transactions on Automatic Control, 40 (3), pp. 419-425.
[167] Olsson, H., Åström, K. J., de Wit, Canudas C., Gäfvert, M., and Lischinsky, P., 1998, “Friction Models and Friction Compensation,” European Journal of Control, 4 (3), pp. 176-195.
[168] Berger, E. J., 2002, “Friction Modeling for Dynamic System Simulation,” Applied Mechanics Review, 55 (6), pp. 535-577.
[169] Tabor, D., 1964, “Friction and Wear,” Proceedings of International Symposium on Lubrication and Wear, pp. 701-761.
[170] Salehi, M. and Heshmat, H., September 3-7, 2001, “Frictional Dampers Dynamic Characterization – Theory and Experiments,” Boundary and Mixed Lubrication: Science

177
and Applications, the 28th Leed – Lyon Symposium on Boundary and Mixed Lubrication, Elsevier Science Publisher, pp. 515-526.
[171] Lu, X. B. and Khonsari, M. M., 2006, “An Experimental Investigation of Grease-lubricated Journal Bearings”, to appear in ASME Journal of Tribology.
[172] Cann, P. M., 1999, “Thin-film Grease Lubrication,” Proceedings of the Institution of Mechanical Engineers, Part J, Journal of Engineering Tribology, 213 (5), pp. 405-416.
[173] Cann, P. M., 1999, “Starved Grease Lubrication of Rolling Contacts,” Tribology Transactions, 42 (4), pp. 867-873.
[174] Cann, P. M., Damiens, B., and Lubrecht, A. A., 2004, “The Transition between Fully Flooded and Starved Regimes in EHL,” Tribology International, 37 (10), pp. 859-864.
[175] Karnopp, D., 1985, “Computer Simulation of Slip-Stick Friction in Mechanical Dynamic Systems,” Journal of Dynamic Systems, Measurements, and Control, 107 (1), pp. 100-103.
[176] Armstrong-Helouvry, B., May 1992, “Frictional Lag and Stick-Slip,” Proceedings of the 1992 IEEE International Conference on Robotics and Automation, Nice, France, 2, pp. 1448-1453.
[177] Armstrong-Helouvry, B., October, 1993, “Stick Slip and Control in Low-Speed Motion,” IEEE Transactions on Automatic Control, 38 (10), pp. 1483-1496.
[178] Pinkus, O. and Sternlicht, B., 1961, Theory of Hydrodynamic Lubrication, McGraw-Hill Book Company, Inc.
[179] Booker, F., 1965, “A table of the journal-bearing integral,” Journal of Basic Engineering, 87 (2), pp. 533-535.
[180] Hazlett, T. L., 1990, “Thermalelastic Behavior of Journal Bearings Undergoing Seizure - A Finite Element Study,” M.S. Thesis, University of Pittsburgh, Pittsburgh, Pennsylvania.
[181] Hazlett, T.L. and Khonsari, M.M., 1992, “Finite element model of journal bearing undergoing rapid thermally induced seizure,” Tribology International, 25 (3), pp. 177-182.
[182] Hazlett, T.L. and Khonsari, M.M., 1992, “Thermalelastic Behavior of Journal Bearings Undergoing Seizure,” 25 (3), pp. 183-187.
[183] Krithivasan, R., 2002, “Transient Thermomechanical Interactions of Shaft-Bushing Pair in Bearings - A Finite Element Study,” M.S. Thesis, Louisiana State University, Baton Rouge, Louisiana.

178
[184] Krithivasan, R. and Khonsari, M.M., 2003, “Thermally induced seizure in journal bearings during startup and transient flow disturbance,” Journal of Tribology, 125 (4), pp. 833-841.
[185] Stachowiak, G. W. and Batchelor, A. W., 2001, Engineering Tribology, Butterworth-Heinemann, 2nd Edition, U.S.A.
[186] Incropera, F. P. and DeWitt, D. P., 1996, Introduction to Heat Transfer, 3rd Edition, John Wiley & Sons, Inc.

179
VITA
Xiaobin Lu was born in Shandong, China, on June 27, 1975. He finished his
education through high school at Laizhou, Shandong. In 1993, he became an
undergraduate student at Zhongyuan Institute of Technology, where he spent four years
studying machine design and manufacturing. After that, he was enrolled in the graduate
program at University of Petroleum, China. He was awarded a master degree in May
2000.
After graduation, he was hired by China Academy of Launch Vehicle as a
mechanical engineer and developed seals used in cryogenic environment.
In January 2002, he joined in Center for Rotating Machinery (CeRoM) at Louisiana
State University as a doctoral candidate under the supervision of Professor Michael M.
Khonsari.