Tribal Renewable Energy Final Technical Report
159
Tribal Renewable Energy Final Technical Report Final Report Project Title: Flathead Reservation Renewable Energy Feasibility Study Date of Report: September 2006 Recipient Organization: Salish & Kootenai Holding Company, Inc. Award Number: DE-FG36-04GO14024 Partners: Salish & Kootenai Holding Company, Inc. 53205 Highway 93 Ronan, MT 59864 (406) 883-4317 Distributed Generation Systems, Inc. (Disgen) 200 Union Blvd, Suite 304 Lakewood, CO 80228 (303) 531-5523 (303) 531-5527 (fax) www.disgenonline.com
Transcript of Tribal Renewable Energy Final Technical Report

Tribal Renewable Energy Final Technical Report
Final Report
Project Title: Flathead Reservation Renewable Energy Feasibility Study
Date of Report: September 2006
RecipientOrganization: Salish & Kootenai Holding Company, Inc.
Award Number: DE-FG36-04GO14024
Partners: Salish & Kootenai Holding Company, Inc. 53205 Highway 93
Ronan, MT 59864 (406) 883-4317
Distributed Generation Systems, Inc. (Disgen) 200 Union Blvd, Suite 304 Lakewood, CO 80228 (303) 531-5523 (303) 531-5527 (fax) www.disgenonline.com

Tribal Renewable Energy Final Technical Report
Tab 1
Executive Summary
Project Title: Flathead Reservation Renewable Energy Feasibility Study
Date of Report: September 2006
RecipientOrganization: Salish & Kootenai Holding Company, Inc.
Award Number: DE-FG36-04GO14024
Partners: Salish & Kootenai Holding Company, Inc. Distributed Generation Systems, Inc. (cost sharing partner)

Distributed Generation Systems, Inc. 1 DOE Award Number: DE-FG36-04GO14024
Executive Summary
Background
The Confederated Salish and Kootenai Tribes of the Flathead Nation (Tribe) is a Federally Recognized Sovereign Nation, whose Tribal Lands are located in western Montana, and including portions of Flathead, Lake and Sanders counties. The Tribe, by and through its wholly owned enterprise, S & K Holding Company (SKHC) is pleased to report its findings to the Department of Energy’s Solicitation on Renewable Energy Development on Tribal Lands. SKHC has selected Distributed Generation Systems, Inc. (Disgen), of Lakewood, Colorado as its contractor to aid in the preparation of this report and to manage and conduct the study.
Core Objective
The study shall assess the feasibility of a commercial wind facility on lands selected and owned by the Tribe and shall examine the potential for the development of solar and biomass resources located on Tribal Lands.
Summary Results
1. Wind resource assessment sufficient to obtain financing
SKHC in conjunction with Disgen selected a tribally-owned parcel of land as the subject of the commercial wind facility feasibility assessment in the Salish Mountain Range. SKHC and Disgen erected a 35-meter tower on the selected site. The 35-meter meteorological tower was use for this site since the topography did not meet the safety standard for a 50 meter meteorological tower. An environmental assessment report was written for the installation of the meteorological tower dated, August 2004 (Document # 208-36204). Evidence of a good wind resource was found in tree “flagging” in the Salish Mountain region, near Oliver Point, indicating solid winds from the west and northwest. The northern portion, approximately 2 miles of the ridge and the southern 5 miles are not heavily forested and thus represent the best opportunity for installing wind turbines. Other sites were evaluated such as the Camas prairie area but a continuous large tract of trust land is not available as required for wind farm.The average wind speed for the site was found to be 11.2 mph (m/s) at the height of 35 meters, a Class 1 Wind Resource. This low wind resource resulted in a low capacity factor ranged from 16% to 20% for different manufacturers of wind turbines. The analysis was completed by a meteorologist, Ed McCarthy in Martinez, CA after collecting over 12 months of wind data. The final report and data can be found in Tab 2. The average annual wind speed of 11.2 mph or Class 1 wind resource is not feasible for a commercial wind project for the project area.

Distributed Generation Systems, Inc. 2 DOE Award Number: DE-FG36-04GO14024
2. Phase I Avian resource assessment
Disgen, upon approval of the SKHC, contracted with Western EcoSystems Technology, Inc (West) of Cheyenne, Wyoming to conduct the Phase One Screening Report for the possible wind farm area, Salish Mountain. The final report was completed on May 2005. West is the leading biological research firm with special skills in avian assessments as they related to wind turbines.
The Phase One research focused on identifying any potential environmental impediments to proceeding with the development of a wind energy project, a “show stopper analysis”. The research is guided by the Endangered Species Act, the Eagle Protection Act and the Migratory Bird Treat Act. The biological resources are evaluated through a search of existing data, including communications with local scientist in the state of Montana. A site visitation to evaluate habitat, loom for raptor nests, prey populations and other biological resources was conducted
The Phase One screening reported that the proposed project area has a number of issues to mitigate prior to development of an industrial infrastructure such as a wind farm. These issues included: a bald eagle population, a possible reintroduction of sage grouse, and trumpeter swans.
A detailed report is enclosed Tab 3 for further review and discussion.
3. Preliminary cultural assessment
Class I Cultural Resource Records and Literature Survey
The Class I Cultural Resource Records and Literature Survey was conducted by the Confederate Salish and Kootenai Tribal Historical Preservation Department. The final report was submitted in February, 2006.
This survey screened existing literature for the presence of culturally sensitive resources with in the prospective project area. The survey found no mitigating circumstances for a possible development project.
A detailed report is enclosed in Tab 4 for further review and discussion.
4. Review of local Transmission Capabilities and Market Assessment.
Disgen performed a preliminary evaluation of the transmission capabilities using a wind project size of 70 MW to determine the potential points of interconnection to the nearest transmission system. Disgen has identified a 115kV transmission line owed by Northwestern Energy at Kerr-Thompson Falls as the most feasible interconnection for a possible wind farm.

Distributed Generation Systems, Inc. 3 DOE Award Number: DE-FG36-04GO14024
SKHC was made aware that the interconnection procedure is a three tier process that could take 165 days to complete and require deposits made to the connecting utility of approximately $160,000. Disgen identified the most likely buyer for the wind energy would be People Power and Light with a market price beginning at $31 MWh (3.1 cents/kWh)
A more detailed explanation is located in Tab 5.
5. Preliminary set of economic projections;
Disgen has provided a set of preliminary project economics for a 30MW facility to be interconnected to the Northwestern Energy 115kV Transmission Line as a baseline to the economic viability of this proposed project. This model assumed a Tribally- owned project on Tribal trust lands, without using the existing production tax credit, and using no loans. It also assumed no property taxes being paid to the state Montana and Federal Government and no landowner payments to the Confederate Tribes of Salish & Kootenai. Given the low capacity of 19.3% for a Suzlon 88 Wind Turbine 2100kW, the breakeven energy sales price is 10.0 cents per kWh to make this propose wind project to deliver a rate of return of 9.0%. If the Tribe chooses to partner with a private investment partner who needs to utilize the existing Production Tax Credit, and negotiates a landowner payment, the rate of return and price per kWh can only improve to 8.5 cents per kWh.
A large component in delivering a competitive price is the amount of energy produced from the wind turbine. If the Salish Mountains had the wind resource of an annual average wind speed of more than 16 mph and at least a 35% capacity factor, the energy prices to be sold could go as low as 3.5 cents per kWh.
Tab 6 shows the preliminary economic values.
6. Biomass and solar resources on tribal lands.
The Confederate Tribes of Salish & Kootenai has a tremendous amount of forestry products and have established an economic entity in selling forestry products to the lumber mills in the area. Unfortunately, the mills are operated by non-tribal entities, so tribal involvement is very limited. The waste from the initial log cutting was reviewed but overcoming the handling and transportation issue is expensive and not feasible for an economic opportunity.
7. Preliminary assessment wind/pumped storage hybrid systems
The wind resource on Salish Mountain proved not to be economically feasible which made it more difficult in economically justifying a hydro pumped storage system. The pumped storage system would have been used to deliver power when the wind resources were low. The recharging of storage reservoir would have used the wind power during low power consumptions.

Distributed Generation Systems, Inc. 4 DOE Award Number: DE-FG36-04GO14024
Recommendations
Disgen at the sole direction of SKHC reviewed other energy opportunities during this study.
1. Salish & Kootenai small-scale hydro power plan. This was a study conducted in 1984 to identify and inventory possible small scale hydro facility on the Flathead Reservation. It identified and accumulated over 70 MW of possible hydro sites. Since the release of the report two sites have been developed and are operating.
2. A geothermal heat source was also reviewed but the temperature of the source was not sufficient to produce steam. The location of the source was also a lengthy distance from a heat load to justify a hot water distribution system. If a heating load is identified then the Tribes should review this geothermal option again.

Tribal Renewable Energy Final Technical Report
Tab 2
Wind Assessment
Project Title: Flathead Reservation Renewable Energy Feasibility Study
Date of Report: September 2006
RecipientOrganization: Salish & Kootenai Holding Company, Inc.
Award Number: DE-FG36-04GO14024
Partners: S & K Holding Company, Inc Distributed Generation Systems, Inc. (cost sharing partner)

1
TO: Belvin Pete, Project Manager Native American Programs and Resources Distributed Generation Systems, Inc (Disgen)
FROM: Ed McCarthy
DATE: March 31, 2006
SUBJ: Preliminary Wind Resource Assessment, Flathead Indian Reservation
Summary: One year of wind speed and wind direction measurements are completed on the Flathead Indian Reservation in northwestern Montana. The wind measurements are obtained from state-of-the-art monitoring equipment installed at Irvine Hill on the Reservation. In addition, some supplemental wind measurements are obtained from an existing communications tower at Oliver Point, south of the Irvine Hill Site. The wind measurements over this 1-year period imply that this area has a Class 1 Wind Resource. The measurements generally confirm the classification of the region by the Montana Wind Map.
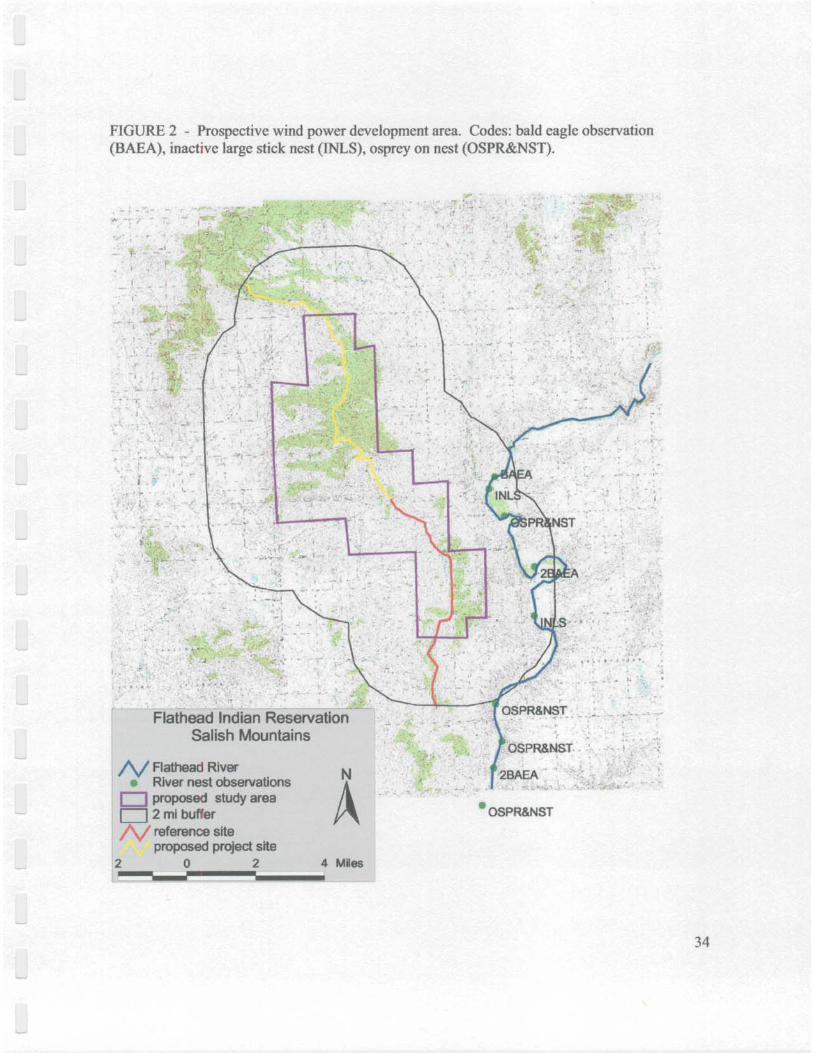
Site Location: The meteorological monitoring equipment is installed on a 35-meter NRG Systems TallTower. This tower is located on Irvin Hill at 47o 41.65’ N and 114o 27.46’ W at an elevation of 4410 feet msl. The existing communications tower is located on Oliver Point at 47.5758o N and 114.3921o W at an elevation of 4782 feet msl. The location of the Flathead Indian Reservation south of Kalispell, Montana is shown in Figure 2.
Meteorological Equipment: Wind speed data are collected by use of the Maximum #40 wind speed cups and the NRG #200P wind direction vane. Two wind speed sensors are mounted at 35 meters agl; two wind speed sensors are mounted at 25 meters agl; and one wind speed sensor are mounted at 15 meters agl. One wind direction sensor is mounted at 35 meters agl and one wind direction sensor is mounted at 25 meters agl. Ambient temperature is measured at a height of 3-meters agl using an NRG Systems 110S temperature probe mounted in a self –aspirated shield. Solar radiation measurements are made with a Licor Pyranometer mounted at the 10-meter level of the tower. An NRG Systems Symphonie Data Loggers is used to record and average (10-minute intervals) the wind speed and wind direction measurements. The meteorological equipment was installed on November 2004.
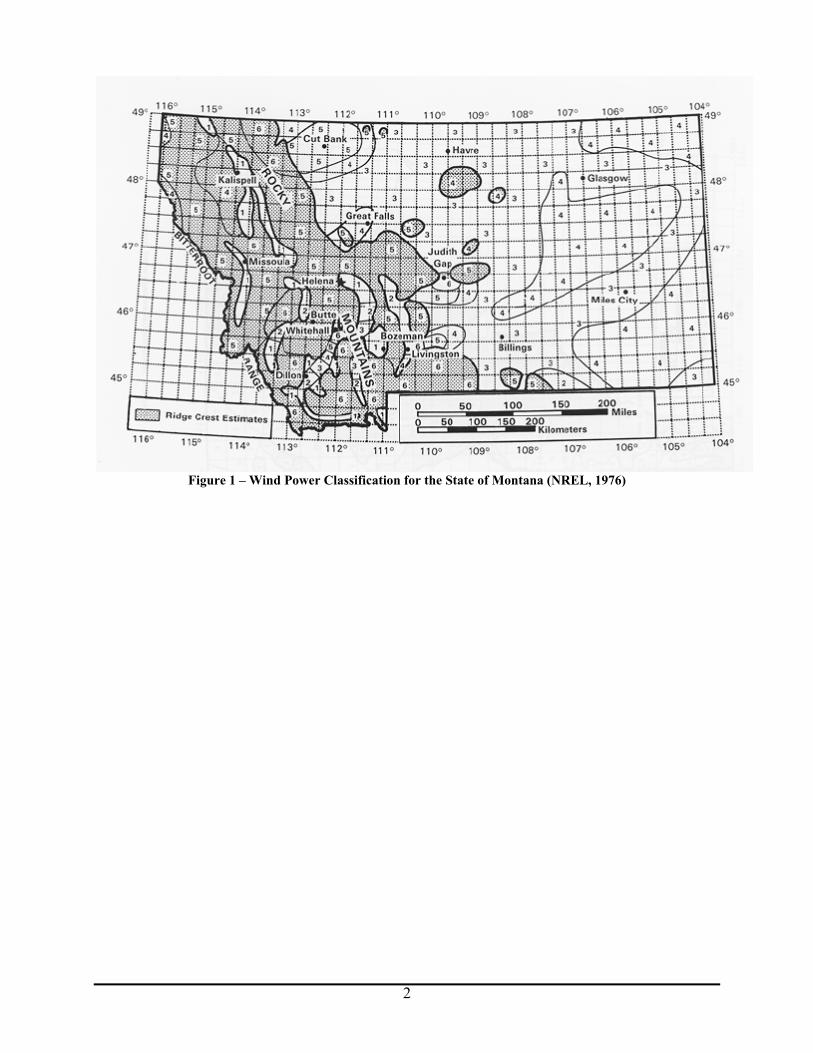
Montana Wind Map: The wind power classification for the State of Montana based on the 1976 edition of the Wind Atlas of the United States is presented in Figure 1. The wind map of the State of Montana was updated by staff at the National Renewable Energy Laboratory (NREL) in 2002 and is presented in Figure 2. The map represents the estimated annual average wind speeds at a height of 50 meters (164 feet) above ground level. For central Montana, the average annual wind speeds are estimated to be less than 5.6 mps (12.5 mph) at 50 meters above ground level.
Wind Power and Wind Speed Classifications: The standard wind power and wind speed classifications for wind resource assessment are presented in Table 1. The classifications range from Class 1 (lowest wind power density) to Class 7 (highest wind power density). Typical economically developable wind power classifications are Class 3 and higher.
2
Figure 1 – Wind Power Classification for the State of Montana (NREL, 1976)

3
Figu
re 2
– M
onta
na W
ind
Map

4
Tabl
e 1
- Cla
sses
of A
nnua
l Win
d Po
wer
Den
sity
and
Ann
ual W
ind
Spee
d at
10
m a
nd 5
0 m
eter
s(a)
10 m
(33
ft)
50 m
(164
ft)
Pow
er D
ensi
ty, W
atts
per
squ
are
met
er
Spee
d(b) , m
eter
s pe
r sec
ond
(mile
s pe
r hou
r)
Pow
er D
ensi
ty, W
atts
per
squ
are
met
er
Spee
d(b) , m
eter
s pe
r sec
ond
(mile
s pe
r hou
r)
Win
d Po
wer
C
lass
low
er li
mit
uppe
r lim
it lo
wer
lim
it up
per l
imit
low
er li
mit
uppe
r lim
it lo
wer
lim
it up
per l
imit
1 0
100
0 4.
4 (9
.8)
0 20
0 0
5.6
(12.
5)
2 10
0 15
0 4.
4 (9
.8)
5.1
(11.
5)
200
300
5.6
(12.
5)
6.4
(14.
3)
3 15
0 20
0 5.
1 (1
1.5)
5.
6 (1
2.5)
30
0 40
0 6.
4 (1
4.3)
7.
0 (1
5.7)
4 20
0 25
0 5.
6 (1
2.5)
6.
0 (1
3.4)
40
0 50
0 7.
0 (1
5.7)
7.
5 (1
6.8)
5 25
0 30
0 6.
0 (1
3.4)
6.
4 (1
4.3)
50
0 60
0 7.
5 (1
6.8)
8.
0 (1
7.9)
6 30
0 40
0 6.
4 (1
4.3)
7.
0 (1
5.7)
60
0 80
0 8.
0 (1
7.9)
8.
8 (1
9.7)
7 40
0 10
00
7.0
(15.
7)
9.4
(21.
1)
800
2000
8.
8 (1
9.7)
11
.9 (2
6.6)
(a) V
ertic
al e
xtra
pola
tion
of w
ind
spee
d ba
sed
on th
e 1/
7 po
wer
law
: (m
ean
win
d sp
eed
at d
esire
d he
ight
) = (k
now
n m
ean
win
d sp
eed
at o
ther
hei
ght)
x [(d
esire
d he
ight
÷ k
now
n he
ight
)^(1
/7)
(b) M
ean
win
d sp
eed
is b
ased
on
Ray
leig
h sp
eed
dist
ribut
ion
of e
quiv
alen
t mea
n w
ind
pow
er d
ensi
ty. W
ind
spee
d is
for s
tand
ard
sea-
leve
l con
ditio
ns. T
o m
aint
ain
the
sam
e po
wer
den
sity
, spe
ed in
crea
ses
3%/1
000
m (5
%/5
000
ft) e
leva
tion.
5
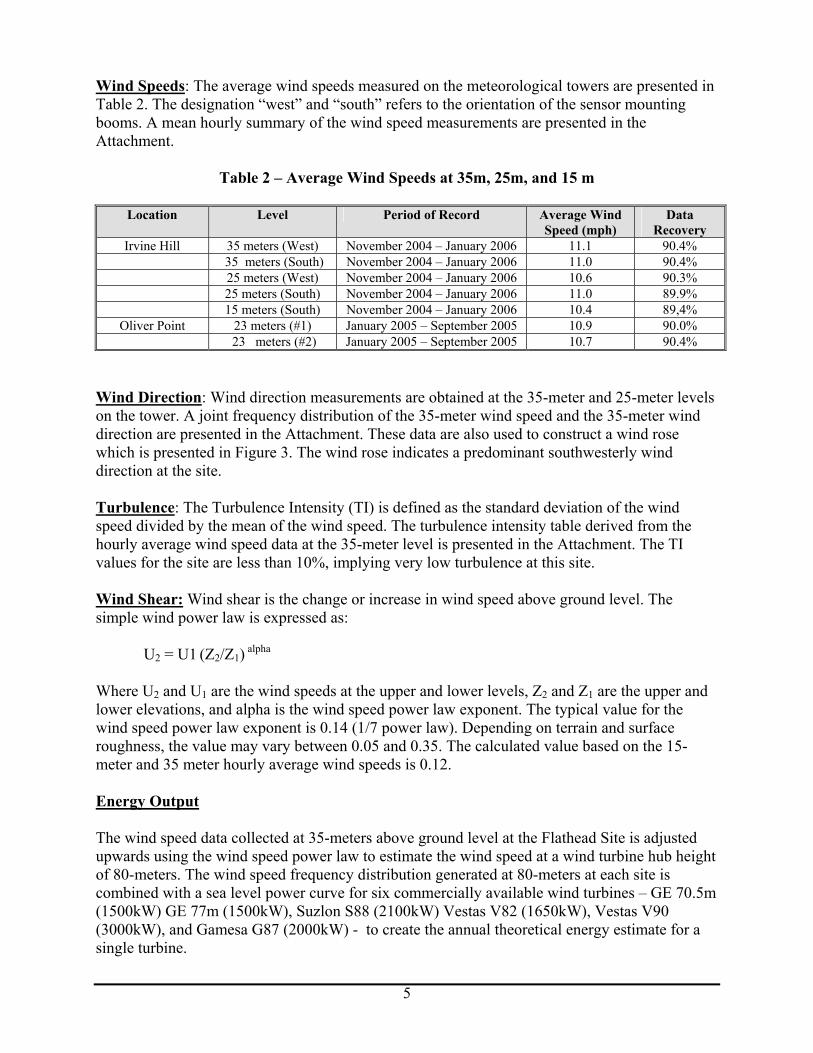
Wind Speeds: The average wind speeds measured on the meteorological towers are presented in Table 2. The designation “west” and “south” refers to the orientation of the sensor mounting booms. A mean hourly summary of the wind speed measurements are presented in the Attachment.
Table 2 – Average Wind Speeds at 35m, 25m, and 15 m
Location Level Period of Record Average Wind Speed (mph)
Data Recovery
Irvine Hill 35 meters (West) November 2004 – January 2006 11.1 90.4% 35 meters (South) November 2004 – January 2006 11.0 90.4% 25 meters (West) November 2004 – January 2006 10.6 90.3% 25 meters (South) November 2004 – January 2006 11.0 89.9% 15 meters (South) November 2004 – January 2006 10.4 89,4%
Oliver Point 23 meters (#1) January 2005 – September 2005 10.9 90.0% 23 meters (#2) January 2005 – September 2005 10.7 90.4%
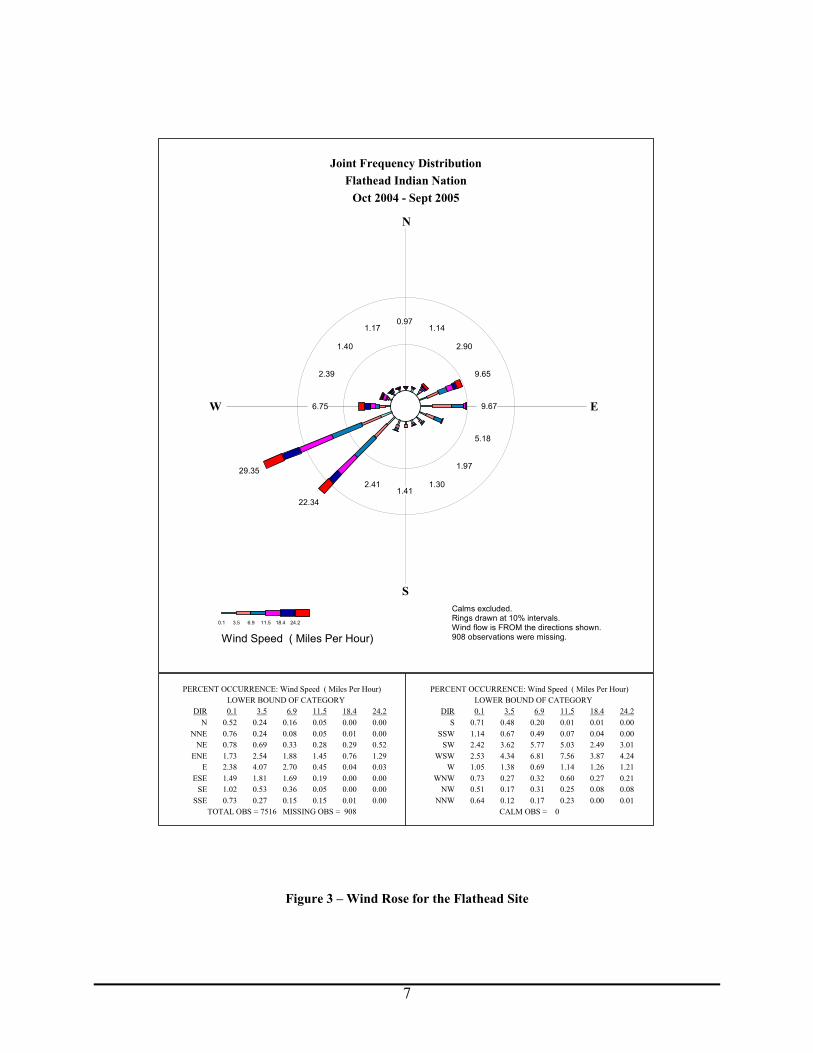
Wind Direction: Wind direction measurements are obtained at the 35-meter and 25-meter levels on the tower. A joint frequency distribution of the 35-meter wind speed and the 35-meter wind direction are presented in the Attachment. These data are also used to construct a wind rose which is presented in Figure 3. The wind rose indicates a predominant southwesterly wind direction at the site.
Turbulence: The Turbulence Intensity (TI) is defined as the standard deviation of the wind speed divided by the mean of the wind speed. The turbulence intensity table derived from the hourly average wind speed data at the 35-meter level is presented in the Attachment. The TI values for the site are less than 10%, implying very low turbulence at this site.
Wind Shear: Wind shear is the change or increase in wind speed above ground level. The simple wind power law is expressed as:
U2 = U1 (Z2/Z1) alpha
Where U2 and U1 are the wind speeds at the upper and lower levels, Z2 and Z1 are the upper and lower elevations, and alpha is the wind speed power law exponent. The typical value for the wind speed power law exponent is 0.14 (1/7 power law). Depending on terrain and surface roughness, the value may vary between 0.05 and 0.35. The calculated value based on the 15-meter and 35 meter hourly average wind speeds is 0.12.
Energy Output
The wind speed data collected at 35-meters above ground level at the Flathead Site is adjusted upwards using the wind speed power law to estimate the wind speed at a wind turbine hub height of 80-meters. The wind speed frequency distribution generated at 80-meters at each site is combined with a sea level power curve for six commercially available wind turbines – GE 70.5m (1500kW) GE 77m (1500kW), Suzlon S88 (2100kW) Vestas V82 (1650kW), Vestas V90 (3000kW), and Gamesa G87 (2000kW) - to create the annual theoretical energy estimate for a single turbine.

6
The gross annual theoretical energy output is presented in Table 3. The gross annual theoretical energy output is adjusted by various loss factors to estimate the actual or net energy delivered to the substation. These losses take into account the wind turbine out-of-service time associated with scheduled and unscheduled downtime (-3%), electrical line losses from the turbine to the substation (-2%), control system losses (-1%), array losses due to wake effects between adjoining turbines (-5%), and lost power associated with blade icing and blade soiling (-1%). The net energy output, the net turbine capacity factor, and the annual average wind speed are also presented in Table 3.
Table 1 – Energy Output Projection Summary for the Flathead Indian Reservation
Gross Net Turbine Annual Rotor Theoretical Theoretical Capacity Wind
Turbine Diameter Rating Hub Height Energy Energy Factor (Net) Speed (m) (kW) (m) (kWh) (kWh) (%) (mps)
Suzlon 88 2100 80 4,025,483 3,542,425 19.3% 5.4
Vestas V-82 82 1650 80 3,277,191 2,883,928 20.0% 5.4
Vestas V-90 90 3000 80 4,903,634 4,315,198 16.4% 5.4
Gamesa G87 87 2000 80 3,927,923 3,456,572 19.7% 5.4
GE 70.5 1500 80 2,794,333 2,459,013 18.7% 5.4
GE 71 1500 80 2,964,180 2,608,478 19.9% 5.4
7
Joint Frequency DistributionFlathead Indian Nation
Oct 2004 - Sept 2005
N
S
W E
908 observations were missing.Wind flow is FROM the directions shown.Rings drawn at 10% intervals.Calms excluded.
0.97 1.14
2.90
9.65
9.67
5.18
1.97
1.30 1.41
2.41
22.34
29.35
6.75
2.39
1.40
1.17
Wind Speed ( Miles Per Hour)0.1 3.5 6.9 11.5 18.4 24.2
PERCENT OCCURRENCE: Wind Speed ( Miles Per Hour) LOWER BOUND OF CATEGORY
DIR 0.1 3.5 6.9 11.5 18.4 24.2N
NNENE
ENEE
ESESE
SSE
0.52 0.76 0.78 1.73 2.38 1.49 1.02 0.73
0.24 0.24 0.69 2.54 4.07 1.81 0.53 0.27
0.16 0.08 0.33 1.88 2.70 1.69 0.36 0.15
0.05 0.05 0.28 1.45 0.45 0.19 0.05 0.15
0.00 0.01 0.29 0.76 0.04 0.00 0.00 0.01
0.00 0.00 0.52 1.29 0.03 0.00 0.00 0.00
PERCENT OCCURRENCE: Wind Speed ( Miles Per Hour) LOWER BOUND OF CATEGORY
DIR 0.1 3.5 6.9 11.5 18.4 24.2S
SSWSW
WSWW
WNWNW
NNW
0.71 1.14 2.42 2.53 1.05 0.73 0.51 0.64
0.48 0.67 3.62 4.34 1.38 0.27 0.17 0.12
0.20 0.49 5.77 6.81 0.69 0.32 0.31 0.17
0.01 0.07 5.03 7.56 1.14 0.60 0.25 0.23
0.01 0.04 2.49 3.87 1.26 0.27 0.08 0.00
0.00 0.00 3.01 4.24 1.21 0.21 0.08 0.01
TOTAL OBS = 7516 MISSING OBS = 908 CALM OBS = 0
Figure 3 – Wind Rose for the Flathead Site

8
Attachments

9
MEAN HOURLY WIND SPEEDS
FLATHEAD INDIAN NATION 15M WIND SPEED (MPH)
11/01/04 - 01/31/06
Hour Jan Feb Mar Apr May Jun Jul Aug Sep Oct Nov Dec | Mean ---- ---- ---- ---- ---- ---- ---- ---- ---- ---- ---- ---- ---- + ---- 01 10.1 8.5 12.5 10.9 7.8 6.8 7.2 7.1 7.9 8.2 10.4 10.8 | 9.2 02 11.2 8.8 11.9 10.0 7.7 6.6 7.4 6.6 7.9 7.7 8.9 11.2 | 9.0 03 12.5 8.2 11.7 10.1 7.5 6.1 8.1 5.9 7.7 7.9 9.3 11.1 | 9.0 04 12.1 8.6 10.2 9.3 7.6 5.9 7.2 5.8 7.3 7.4 10.2 10.6 | 8.8 05 10.6 7.9 10.7 8.4 7.7 5.9 7.3 5.6 6.9 7.2 10.8 10.7 | 8.6 06 11.3 8.1 11.0 8.6 8.1 6.6 7.3 6.1 6.8 7.4 10.5 9.6 | 8.7 07 11.2 6.9 9.3 9.3 7.1 7.1 7.0 5.9 7.9 7.9 10.7 9.1 | 8.5 08 11.5 6.3 9.2 9.5 8.3 6.3 7.7 6.5 8.1 8.6 10.1 9.0 | 8.6 09 10.9 6.8 10.0 11.0 8.6 7.2 8.3 6.9 7.4 8.8 9.3 8.9 | 8.8 10 11.1 7.1 10.5 12.3 8.9 9.0 9.2 8.0 8.4 9.8 9.5 8.5 | 9.3 11 11.8 7.4 12.2 12.8 9.6 10.4 10.9 9.6 9.3 9.6 10.6 9.5 | 10.3 12 13.6 8.8 13.3 14.6 10.4 11.2 12.9 10.7 12.2 10.5 10.4 9.6 | 11.4 13 12.8 9.2 14.1 15.3 10.9 11.6 14.0 11.2 13.3 10.5 11.2 10.9 | 12.0 14 12.4 10.3 15.7 15.6 12.4 14.0 16.5 13.1 14.4 11.1 12.6 10.8 | 13.1 15 12.2 10.2 16.4 17.0 13.3 12.5 17.7 13.1 16.0 10.9 11.8 10.9 | 13.3 16 12.3 10.3 16.9 17.5 13.0 13.0 18.3 14.3 17.2 10.8 12.0 10.7 | 13.6 17 12.2 10.4 16.4 18.8 13.3 13.3 18.5 14.0 15.2 10.3 11.2 10.9 | 13.4 18 11.5 9.0 15.5 16.1 13.0 11.6 19.6 13.8 13.3 9.5 11.0 10.6 | 12.7 19 10.2 9.0 12.5 14.1 12.8 10.5 18.0 12.8 11.5 9.5 10.8 9.7 | 11.6 20 11.1 9.6 12.6 13.0 12.0 11.0 13.7 12.1 10.2 8.9 10.6 9.8 | 11.1 21 10.0 9.4 11.9 13.3 9.9 9.3 10.8 10.1 8.8 8.0 10.1 9.4 | 10.0 22 10.9 8.6 11.9 12.5 9.8 8.8 9.7 9.2 8.3 8.0 9.5 9.0 | 9.7 23 11.3 8.4 10.5 11.5 9.0 8.6 8.2 7.6 7.8 8.0 9.9 10.5 | 9.4 24 10.2 8.1 10.7 10.8 7.8 8.1 7.0 7.2 7.3 8.9 10.6 10.4 | 9.1 ---- ---- ---- ---- ---- ---- ---- ---- ---- ---- ---- ---- ---- + ---- Mean 11.5 8.6 12.4 12.6 9.9 9.2 11.4 9.3 10.1 9.0 10.5 10.1 | 10.4
Good Hours 879 672 744 706 744 720 744 744 720 744 1095 1296
Missing Hours 609 0 0 14 0 0 0 0 0 0 345 192
9,808 Hours of Good Data 1,160 Hours Missing 89.4% Data Recovery

10
MEAN HOURLY WIND SPEEDS
FLATHEAD INDIAN NATION 25M WIND SPEED (W) (MPH)
11/01/04 - 01/31/06
Hour Jan Feb Mar Apr May Jun Jul Aug Sep Oct Nov Dec | Mean ---- ---- ---- ---- ---- ---- ---- ---- ---- ---- ---- ---- ---- + ---- 01 10.1 8.1 12.7 11.5 8.2 6.8 7.5 7.1 8.1 8.7 10.6 11.1 | 9.4 02 11.0 8.4 12.2 10.4 8.1 6.6 7.7 6.7 8.0 8.1 9.0 11.3 | 9.1 03 12.3 8.1 12.1 10.6 7.8 6.0 8.5 6.0 8.0 8.0 9.4 11.3 | 9.2 04 11.9 8.5 10.5 9.7 7.7 6.0 7.5 5.8 7.4 8.0 10.4 10.8 | 8.9 05 11.0 7.7 10.9 8.5 7.7 5.7 7.5 5.7 7.2 7.7 11.1 10.8 | 8.7 06 11.1 7.9 11.2 8.5 8.4 6.7 7.7 6.3 7.0 7.7 10.9 9.9 | 8.8 07 11.1 6.7 9.6 9.6 7.4 7.1 7.1 5.9 8.1 8.3 11.0 9.4 | 8.7 08 11.2 6.0 9.5 9.9 8.4 6.3 7.8 6.5 8.3 9.0 10.5 9.4 | 8.8 09 10.6 6.5 10.2 11.2 8.8 7.2 8.4 6.8 7.3 9.1 9.9 9.2 | 8.9 10 10.8 6.8 10.6 12.5 9.0 9.0 9.2 7.9 8.3 10.2 10.1 8.8 | 9.5 11 11.6 7.1 12.2 13.3 9.8 10.5 11.1 9.6 9.3 10.0 11.1 9.8 | 10.5 12 13.1 8.2 13.3 15.1 10.6 11.3 13.1 10.7 12.2 10.7 10.9 9.8 | 11.5 13 12.5 8.7 14.2 15.6 11.2 11.7 14.0 11.1 13.3 10.7 11.7 11.0 | 12.1 14 12.1 9.9 15.8 15.8 12.6 14.0 16.6 13.1 14.4 11.3 13.1 10.9 | 13.2 15 11.7 9.7 16.5 17.6 13.7 12.5 17.7 12.9 16.1 11.2 12.3 11.1 | 13.4 16 11.8 9.9 17.1 18.3 13.4 13.0 18.3 14.2 17.4 11.0 12.5 11.1 | 13.8 17 11.8 10.1 16.5 19.9 13.9 13.1 18.5 13.8 15.3 10.6 11.5 11.3 | 13.6 18 11.3 8.8 15.6 17.2 13.5 11.4 19.7 13.9 13.4 9.9 11.6 10.9 | 12.9 19 10.1 9.1 12.9 14.7 13.4 10.7 18.1 13.0 11.7 9.8 11.2 9.9 | 11.9 20 10.9 9.4 12.9 13.6 12.8 11.1 14.2 12.3 10.5 9.3 10.8 10.2 | 11.4 21 10.0 9.5 12.1 13.8 10.6 9.5 11.2 10.4 9.1 8.3 10.4 10.0 | 10.4 22 10.8 8.6 12.0 13.0 10.5 9.0 10.2 9.7 8.8 8.6 9.7 9.3 | 10.0 23 11.1 8.2 10.7 12.0 9.4 8.8 8.6 7.8 8.1 8.5 10.2 10.9 | 9.7 24 10.2 8.0 10.8 11.4 8.3 8.2 7.3 7.1 7.5 9.5 10.9 10.9 | 9.4 ---- ---- ---- ---- ---- ---- ---- ---- ---- ---- ---- ---- ---- + ---- Mean 11.3 8.3 12.6 13.1 10.2 9.3 11.6 9.3 10.2 9.3 10.9 10.4 | 10.6
Good Hours 953 672 744 706 744 720 744 744 720 744 1113 1303
Missing Hours 535 0 0 14 0 0 0 0 0 0 327 185
9,907 Hours of Good Data 1,061 Hours Missing 90.3% Data Recovery

11
MEAN HOURLY WIND SPEEDS
FLATHEAD INDIAN NATION 25M WIND SPEED (S) (MPH)
11/01/04 - 01/31/06
Hour Jan Feb Mar Apr May Jun Jul Aug Sep Oct Nov Dec | Mean ---- ---- ---- ---- ---- ---- ---- ---- ---- ---- ---- ---- ---- + ---- 01 10.8 8.7 13.0 11.7 8.5 7.4 7.8 7.7 8.5 9.1 10.8 11.3 | 9.8 02 11.7 9.2 12.5 10.6 8.5 7.1 8.1 7.3 8.4 8.3 9.1 11.7 | 9.6 03 12.9 8.5 12.3 10.9 8.3 6.6 8.8 6.5 8.3 8.3 9.7 11.6 | 9.6 04 12.4 9.0 10.8 10.0 8.2 6.5 7.9 6.4 7.8 8.2 10.6 11.0 | 9.3 05 11.1 8.2 11.1 8.8 8.3 6.3 8.0 6.3 7.6 7.9 11.3 11.1 | 9.1 06 11.7 8.4 11.4 9.1 8.8 7.2 8.2 6.8 7.4 7.9 11.1 10.1 | 9.2 07 11.7 7.3 9.8 9.9 7.8 7.7 7.5 6.4 8.5 8.5 11.2 9.6 | 9.0 08 11.9 6.5 9.7 10.3 8.9 6.8 8.2 7.0 8.7 9.1 10.6 9.5 | 9.1 09 11.2 7.0 10.4 11.5 9.3 7.8 8.8 7.3 7.7 9.3 9.8 9.4 | 9.2 10 11.4 7.3 10.7 12.7 9.6 9.4 9.7 8.5 8.8 10.4 10.0 9.0 | 9.8 11 12.2 7.6 12.4 13.5 10.3 10.9 11.5 10.2 9.7 10.2 10.8 10.1 | 10.8 12 13.9 8.9 13.7 15.5 11.0 11.8 13.6 11.4 12.7 10.9 11.2 10.0 | 11.9 13 13.1 9.4 14.6 16.2 11.6 12.2 14.4 11.7 13.8 11.0 12.0 11.3 | 12.5 14 12.7 10.6 16.2 16.3 13.2 14.7 17.2 13.7 14.9 11.7 13.4 11.3 | 13.7 15 12.4 10.4 17.0 18.0 14.1 13.2 18.4 13.6 16.6 11.4 12.6 11.4 | 13.9 16 12.6 10.6 17.5 18.8 13.9 13.6 19.0 14.9 17.8 11.3 12.8 11.3 | 14.2 17 12.4 10.7 16.9 20.3 14.5 13.9 19.3 14.8 15.9 10.8 12.0 11.5 | 14.1 18 11.8 9.3 16.0 17.5 14.2 12.2 20.5 14.7 14.2 10.1 11.8 11.1 | 13.4 19 10.7 9.4 13.2 15.2 14.1 11.2 18.8 13.6 12.4 10.2 11.4 10.0 | 12.3 20 11.4 9.8 13.2 13.8 13.2 11.7 14.8 12.7 10.9 9.5 11.1 10.3 | 11.7 21 10.5 9.8 12.4 14.2 10.9 9.9 11.6 10.9 9.5 8.5 10.7 10.0 | 10.7 22 11.3 9.0 12.3 13.2 10.7 9.4 10.6 10.0 9.0 8.8 10.1 9.4 | 10.3 23 11.8 8.7 10.9 12.4 9.8 9.2 9.0 8.3 8.4 8.7 10.5 11.0 | 10.0 24 10.7 8.4 11.2 11.7 8.6 8.8 7.7 7.8 7.9 9.8 11.2 11.0 | 9.7 ---- ---- ---- ---- ---- ---- ---- ---- ---- ---- ---- ---- ---- + ---- Mean 11.8 8.9 12.9 13.4 10.7 9.8 12.1 9.9 10.6 9.6 11.1 10.6 | 11.0
Good Hours 903 672 744 706 744 720 744 744 720 744 1103 1309
Missing Hours 585 0 0 14 0 0 0 0 0 0 337 179
9,853 Hours of Good Data 1,115 Hours Missing 89.8% Data Recovery

12
MEAN HOURLY WIND SPEEDS
FLATHEAD INDIAN NATION 35M WIND SPEED (W) (MPH)
11/01/04 - 01/31/06
Hour Jan Feb Mar Apr May Jun Jul Aug Sep Oct Nov Dec | Mean ---- ---- ---- ---- ---- ---- ---- ---- ---- ---- ---- ---- ---- + ---- 01 10.5 8.7 13.2 12.1 8.7 7.3 8.1 7.9 8.7 9.4 11.1 11.6 | 10.0 02 11.7 9.3 12.8 10.9 8.6 7.0 8.4 7.5 8.5 8.6 9.4 11.9 | 9.7 03 12.6 8.5 12.6 11.3 8.5 6.5 9.1 6.8 8.5 8.4 10.0 11.9 | 9.8 04 12.3 9.1 11.1 10.2 8.4 6.5 8.3 6.5 8.0 8.3 10.8 11.3 | 9.5 05 11.4 8.2 11.3 9.0 8.4 6.2 8.2 6.5 7.8 8.2 11.6 11.2 | 9.3 06 11.5 8.4 11.8 9.2 9.0 7.2 8.6 7.1 7.5 8.1 11.4 10.3 | 9.4 07 11.4 7.3 10.1 9.9 7.8 7.5 7.7 6.4 8.8 8.7 11.5 9.8 | 9.1 08 11.5 6.3 9.9 10.2 8.7 6.4 8.3 7.2 9.0 9.3 10.9 9.8 | 9.1 09 11.0 7.0 10.5 11.4 9.0 7.5 8.8 7.3 7.8 9.3 10.1 9.7 | 9.2 10 11.2 7.2 10.7 12.7 9.3 9.2 9.8 8.5 8.7 10.4 10.3 9.3 | 9.8 11 12.0 7.4 12.6 13.5 10.3 10.8 11.6 10.3 9.7 10.3 11.2 10.4 | 10.9 12 13.6 8.7 13.6 15.4 11.0 11.8 13.8 11.6 12.7 10.9 11.0 10.2 | 11.9 13 13.0 9.0 14.7 16.1 11.7 12.2 14.6 12.0 14.0 11.0 12.3 11.5 | 12.6 14 12.6 10.3 16.3 16.4 13.2 14.7 17.3 13.9 15.1 11.8 13.5 11.6 | 13.7 15 12.2 10.1 17.1 18.0 14.1 13.2 18.5 13.9 16.8 11.6 12.8 11.5 | 13.9 16 12.3 10.4 17.6 18.9 14.2 13.6 19.3 15.2 18.0 11.4 13.1 11.5 | 14.4 17 12.2 10.5 16.8 20.5 14.6 13.9 19.5 15.0 16.1 11.1 12.2 11.8 | 14.2 18 11.8 9.3 16.1 17.8 14.4 12.2 20.7 14.9 14.5 10.3 12.1 11.2 | 13.5 19 10.5 9.4 13.5 15.6 14.3 11.2 19.0 13.8 12.9 10.4 11.7 10.2 | 12.5 20 11.3 9.7 13.6 14.1 13.5 11.7 15.3 13.1 11.2 9.6 11.4 10.4 | 11.9 21 10.4 9.9 12.8 14.5 11.2 10.0 12.0 11.2 9.9 8.7 10.9 10.3 | 10.9 22 11.3 9.1 12.5 13.6 10.9 9.5 10.9 10.4 9.4 9.0 10.4 9.6 | 10.5 23 11.5 8.7 11.3 12.6 9.9 9.3 9.2 8.5 8.6 8.8 10.9 11.1 | 10.2 24 10.7 8.5 11.4 12.1 8.8 8.8 7.8 7.9 8.1 10.1 11.5 11.3 | 9.9 ---- ---- ---- ---- ---- ---- ---- ---- ---- ---- ---- ---- ---- + ---- Mean 11.7 8.8 13.1 13.6 10.8 9.8 12.3 10.1 10.8 9.7 11.3 10.8 | 11.1
Good Hours 965 672 744 706 744 720 744 744 720 744 1101 1309
Missing Hours 523 0 0 14 0 0 0 0 0 0 339 179
9,913 Hours of Good Data 1,055 Hours Missing 90.4% Data Recovery
13
MEAN HOURLY WIND SPEEDS
FLATHEAD INDIAN NATION 35M WIND SPEED (S) (MPH)
11/01/04 - 01/31/06
Hour Jan Feb Mar Apr May Jun Jul Aug Sep Oct Nov Dec | Mean ---- ---- ---- ---- ---- ---- ---- ---- ---- ---- ---- ---- ---- + ---- 01 10.4 8.7 13.2 12.2 8.7 7.3 8.0 7.8 8.6 9.3 11.0 11.5 | 9.9 02 11.7 9.3 12.8 10.9 8.6 7.1 8.3 7.4 8.5 8.6 9.4 11.8 | 9.7 03 12.7 8.6 12.6 11.4 8.5 6.6 9.1 6.7 8.5 8.4 9.9 11.7 | 9.8 04 12.2 9.2 11.1 10.4 8.4 6.7 8.3 6.4 8.0 8.3 10.7 11.2 | 9.5 05 11.4 8.3 11.4 9.1 8.3 6.3 8.2 6.4 7.8 8.1 11.5 11.1 | 9.3 06 11.5 8.5 11.8 9.2 8.9 7.2 8.3 7.0 7.5 8.1 11.3 10.3 | 9.3 07 11.3 7.5 10.2 9.9 7.8 7.6 7.6 6.3 8.7 8.6 11.4 9.8 | 9.1 08 11.4 6.5 10.1 10.4 8.7 6.5 8.1 7.0 8.9 9.2 10.8 9.8 | 9.1 09 10.9 7.0 10.6 11.5 9.0 7.5 8.7 7.1 7.8 9.2 10.0 9.7 | 9.2 10 11.2 7.3 10.8 12.8 9.2 9.1 9.6 8.2 8.6 10.3 10.1 9.2 | 9.7 11 12.1 7.5 12.5 13.6 10.1 10.6 11.4 10.0 9.6 10.2 11.1 10.2 | 10.8 12 13.6 8.7 13.5 15.5 10.9 11.6 13.5 11.2 12.5 10.8 10.9 10.0 | 11.8 13 12.9 9.0 14.6 16.0 11.5 12.0 14.3 11.5 13.6 10.8 11.8 11.3 | 12.4 14 12.5 10.3 16.1 16.3 13.0 14.3 16.9 13.5 14.7 11.5 13.1 11.5 | 13.5 15 12.1 10.1 16.8 17.9 14.0 12.8 18.0 13.4 16.4 11.4 12.4 11.5 | 13.7 16 12.2 10.4 17.4 18.8 13.8 13.2 18.7 14.7 17.7 11.2 12.9 11.5 | 14.1 17 12.2 10.5 16.6 20.4 14.3 13.4 18.9 14.3 15.8 10.9 12.0 11.7 | 14.0 18 11.7 9.5 15.9 17.7 14.2 11.7 20.2 14.4 14.0 10.2 11.9 11.1 | 13.3 19 10.6 9.5 13.4 15.3 14.0 11.0 18.5 13.4 12.6 10.3 11.6 10.1 | 12.3 20 11.3 9.9 13.4 14.1 13.5 11.5 15.0 12.9 11.1 9.5 11.3 10.4 | 11.9 21 10.4 10.0 12.7 14.4 11.2 9.9 11.9 11.0 9.9 8.7 10.8 10.3 | 10.9 22 11.3 9.2 12.5 13.6 11.0 9.5 10.8 10.3 9.4 9.0 10.3 9.6 | 10.5 23 11.5 8.8 11.3 12.6 10.0 9.3 9.2 8.4 8.7 8.8 10.7 11.0 | 10.1 24 10.6 8.6 11.4 12.1 8.9 8.7 7.8 7.7 8.1 10.0 11.4 11.3 | 9.9 ---- ---- ---- ---- ---- ---- ---- ---- ---- ---- ---- ---- ---- + ---- Mean 11.6 8.9 13.0 13.6 10.7 9.6 12.1 9.9 10.7 9.6 11.2 10.7 | 11.0
Good Hours 965 672 744 708 744 720 744 744 720 744 1098 1313
Missing Hours 523 0 0 12 0 0 0 0 0 0 342 175
9,916 Hours of Good Data 1,052 Hours Missing 90.4% Data Recovery

14
MEAN HOURLY VALUES
FLATHEAD INDIAN NATION 35M WIND DIRECTION (DEG)
11/01/04 - 01/31/06
Hour Jan Feb Mar Apr May Jun Jul Aug Sep Oct Nov Dec | Mean ---- ---- ---- ---- ---- ---- ---- ---- ---- ---- ---- ---- ---- + ---- 01 193 172 196 164 166 210 226 185 201 174 201 204 | 192 02 184 173 193 169 180 204 234 182 199 189 205 199 | 194 03 181 188 199 149 148 196 219 173 210 195 199 198 | 189 04 192 184 192 147 140 187 212 168 209 205 205 207 | 189 05 191 185 177 144 138 181 200 199 205 178 203 183 | 183 06 205 175 197 153 139 183 195 168 206 177 202 183 | 183 07 212 189 191 135 156 195 160 168 217 198 203 190 | 186 08 192 182 176 158 157 191 163 160 201 175 191 204 | 181 09 212 168 169 149 146 202 154 161 189 174 203 190 | 179 10 202 172 157 129 136 172 183 148 211 170 199 196 | 176 11 200 172 161 145 156 182 173 151 186 157 207 194 | 177 12 211 165 169 149 164 177 201 151 197 175 205 180 | 181 13 208 170 181 157 161 206 216 181 195 186 222 178 | 190 14 212 145 196 169 166 200 207 171 195 185 214 190 | 190 15 209 181 204 170 156 190 211 188 205 183 216 193 | 194 16 201 168 221 178 162 188 210 184 196 194 203 178 | 190 17 215 203 191 159 161 189 213 182 198 190 204 200 | 194 18 205 185 208 148 157 170 214 179 203 192 225 204 | 194 19 219 191 193 155 164 174 225 191 186 195 214 183 | 192 20 216 208 200 171 158 194 194 180 193 174 201 177 | 189 21 209 213 196 168 154 204 213 187 184 199 201 195 | 194 22 205 223 189 171 158 219 227 215 204 197 204 201 | 201 23 207 217 199 160 179 221 223 207 204 174 204 197 | 200 24 204 198 185 175 167 192 223 189 210 185 207 192 | 195 ---- ---- ---- ---- ---- ---- ---- ---- ---- ---- ---- ---- ---- + ---- Mean 203 184 189 157 157 193 204 178 200 184 206 192 | 189
Good Hours 939 672 744 705 744 720 744 744 720 744 1132 1358
Missing Hours 549 0 0 15 0 0 0 0 0 0 308 130
9,966 Hours of Good Data 1,002 Hours Missing 90.9% Data Recovery

15
MEAN HOURLY VALUES
FLATHEAD INDIAN NATION TEMPERATURE (DEG)
11/01/04 - 01/31/06
Hour Jan Feb Mar Apr May Jun Jul Aug Sep Oct Nov Dec | Mean ---- ---- ---- ---- ---- ---- ---- ---- ---- ---- ---- ---- ---- + ---- 01 27.6 30.4 34.3 38.9 48.4 51.9 64.6 64.3 52.8 42.8 31.0 25.4 | 40.3 02 26.9 29.9 33.6 38.4 47.9 51.1 63.6 63.2 52.3 42.4 30.8 25.4 | 39.7 03 27.0 29.3 33.2 37.9 47.3 50.6 62.7 62.3 51.5 42.1 30.5 25.4 | 39.3 04 26.8 28.9 32.7 37.3 46.8 49.9 62.0 61.5 51.0 41.9 30.1 25.2 | 38.9 05 26.9 28.4 32.5 36.7 46.0 49.6 61.1 60.4 50.4 41.7 30.0 25.4 | 38.6 06 26.7 27.9 31.9 37.0 46.7 50.0 62.0 60.1 49.8 41.3 29.8 25.0 | 38.5 07 26.7 27.4 31.9 37.7 48.0 51.1 63.2 61.7 50.1 41.1 29.5 25.0 | 38.8 08 26.5 27.8 32.7 38.7 48.7 52.5 64.7 63.0 51.7 41.4 29.5 24.8 | 39.4 09 26.5 30.1 34.1 39.8 49.7 53.9 66.3 65.0 53.1 41.9 30.4 25.4 | 40.5 10 27.8 31.1 35.4 42.0 51.4 55.6 68.7 67.1 54.9 42.7 31.2 26.0 | 41.8 11 29.4 32.1 36.7 43.5 53.1 57.3 71.0 69.0 56.9 43.8 31.9 26.9 | 43.2 12 29.8 33.0 38.2 44.7 54.5 58.6 73.0 71.0 58.3 45.1 32.5 27.6 | 44.4 13 30.8 34.3 40.0 46.3 55.4 59.1 74.3 72.4 59.8 46.0 33.3 27.7 | 45.4 14 31.1 35.3 41.1 46.9 56.3 59.8 75.5 73.8 60.6 46.9 33.9 28.1 | 46.1 15 30.8 36.5 41.6 47.8 56.6 59.6 76.4 74.8 61.5 47.6 34.0 28.3 | 46.6 16 30.3 36.8 41.1 47.7 56.6 59.6 76.6 74.9 61.1 48.0 33.4 27.9 | 46.4 17 29.2 35.9 40.2 47.0 56.2 59.1 76.1 74.7 60.4 46.7 32.6 26.8 | 45.6 18 28.6 33.7 38.7 46.3 54.9 58.6 75.2 73.4 58.8 45.4 32.1 26.6 | 44.6 19 28.1 32.8 37.3 44.2 53.7 57.9 73.4 71.4 56.3 44.9 31.8 26.2 | 43.6 20 28.2 32.6 36.6 42.2 52.2 56.0 70.4 68.5 55.3 44.4 31.7 26.2 | 42.6 21 28.0 32.3 35.9 41.3 51.0 54.7 67.8 67.2 54.8 44.1 31.4 25.7 | 41.9 22 28.3 32.0 35.6 40.2 50.5 54.4 67.0 66.7 54.2 44.1 31.3 25.7 | 41.6 23 27.8 31.4 35.0 40.0 49.9 54.0 66.3 65.8 53.9 43.2 31.1 25.7 | 41.1 24 27.9 31.1 34.6 39.4 49.3 53.3 65.8 64.9 53.0 43.0 30.9 25.5 | 40.7 ---- ---- ---- ---- ---- ---- ---- ---- ---- ---- ---- ---- ---- + ---- Mean 28.2 31.7 36.0 41.7 51.3 54.9 68.6 67.4 55.1 43.9 31.5 26.2 | 42.1
Good Hours 1140 672 744 720 744 720 744 744 720 744 1355 1488
Missing Hours 348 0 0 0 0 0 0 0 0 0 85 0
10,535 Hours of Good Data 433 Hours Missing 96.1% Data Recovery

16
MEAN HOURLY VALUES
FLATHEAD INDIAN NATION SOLAR RADIATION (LY)
02/01/05 - 05/31/05
Hour Jan Feb Mar Apr May Jun Jul Aug Sep Oct Nov Dec | Mean ---- ---- ---- ---- ---- ---- ---- ---- ---- ---- ---- ---- ---- + ---- 01 .0 .0 .0 .0 | .0 02 .0 .0 .0 .0 | .0 03 .0 .0 .0 .0 | .0 04 .0 .0 .0 .0 | .0 05 .0 .0 .0 2.7 | .7 06 .0 .0 11.0 53.4 | 16.2 07 .0 8.6 80.9151.0 | 60.7 08 24.4 68.8169.9266.1 |133.6 09 133.3168.8279.1360.6 |236.6 10 243.0250.7444.4453.3 |348.8 11 332.6311.7501.0503.7 |412.8 12 378.6392.6501.5519.4 |446.9 13 382.4392.7525.8519.5 |455.3 14 345.3353.7429.1509.0 |409.9 15 276.0290.9422.6398.5 |347.7 16 180.5192.9286.4324.6 |246.7 17 79.9 94.7188.8235.1 |150.3 18 3.5 22.4 99.6133.9 | 65.5 19 .0 .2 10.3 22.8 | 8.4 20 .0 .0 .0 3.0 | .8 21 .0 .0 .0 .0 | .0 22 .0 .0 .0 .0 | .0 23 .0 .0 .0 .0 | .0 24 .0 .0 .0 .0 | .0 ---- ---- ---- ---- ---- ---- ---- ---- ---- ---- ---- ---- ---- + ---- Mean 99.1106.2164.6182.8 |138.6
Good Hours 672 744 720 720
Missing Hours 0 0 0 24
2,856 Hours of Good Data 24 Hours Missing 99.2% Data Recovery

17
MEAN HOURLY WIND SPEEDS
FLATHEAD INDIAN NATION OLIVER PT - 77 FT WIND SPEED (MPH)
01/01/05 - 09/30/05
Hour Jan Feb Mar Apr May Jun Jul Aug Sep Oct Nov Dec | Mean ---- ---- ---- ---- ---- ---- ---- ---- ---- ---- ---- ---- ---- + ---- 01 11.9 11.0 13.5 12.5 10.2 10.6 10.1 8.0 8.5 | 10.8 02 12.7 10.6 12.6 12.8 9.9 10.6 9.9 7.7 7.2 | 10.5 03 12.3 10.6 12.3 12.5 10.1 10.6 9.9 7.5 7.1 | 10.4 04 11.4 10.2 12.1 12.0 9.3 10.2 10.2 7.2 7.2 | 10.1 05 11.0 10.4 11.7 11.8 9.3 10.2 10.0 7.6 8.4 | 10.1 06 11.4 10.4 11.8 11.4 9.6 10.8 9.0 8.1 7.9 | 10.1 07 10.9 9.7 11.3 10.3 9.0 10.2 7.8 7.5 8.8 | 9.5 08 10.8 8.9 11.3 10.1 8.4 8.9 7.7 6.4 9.0 | 9.0 09 10.7 8.5 11.1 10.2 8.0 8.1 7.8 6.8 9.1 | 8.8 10 10.6 8.2 10.6 10.3 7.9 8.3 8.7 7.4 9.0 | 8.9 11 9.9 8.3 11.3 10.3 8.6 9.4 9.2 8.4 9.3 | 9.4 12 9.4 8.4 11.6 10.6 9.5 9.7 10.7 9.5 9.3 | 9.9 13 9.3 8.6 12.7 11.8 10.2 10.5 11.5 10.7 8.8 | 10.7 14 10.1 9.4 14.1 13.0 10.7 11.7 12.9 11.5 10.1 | 11.7 15 9.8 9.7 14.1 12.3 11.7 11.3 14.0 12.6 11.5 | 12.0 16 10.7 9.6 13.2 14.0 12.2 11.7 16.2 13.0 10.1 | 12.5 17 12.0 9.8 13.5 13.8 12.2 11.3 16.2 12.5 10.0 | 12.6 18 12.6 10.3 12.5 13.2 12.7 10.9 16.8 13.0 9.4 | 12.6 19 13.2 10.9 12.7 13.3 12.8 11.3 16.3 12.9 10.9 | 12.8 20 12.8 11.0 13.5 14.5 12.6 11.8 15.5 12.0 10.0 | 12.8 21 12.9 9.9 12.5 15.3 12.2 12.1 13.7 11.8 9.2 | 12.4 22 13.5 9.7 12.0 14.3 11.6 12.4 12.6 10.7 8.2 | 11.9 23 13.5 10.2 12.6 13.0 11.0 12.1 11.2 9.1 8.4 | 11.3 24 12.7 10.5 13.0 12.1 10.5 12.0 10.6 8.3 9.0 | 11.0 ---- ---- ---- ---- ---- ---- ---- ---- ---- ---- ---- ---- ---- + ---- Mean 11.5 9.8 12.4 12.3 10.4 10.7 11.6 9.6 9.0 | 10.9
Good Hours 515 672 744 689 744 720 744 744 324
Missing Hours 229 0 0 31 0 0 0 0 396
5,896 Hours of Good Data 656 Hours Missing 90.0% Data Recovery

18
MEAN HOURLY WIND SPEEDS
FLATHEAD INDIAN NATION OLIVER PT - 77 FT WIND SPEED (2) (MPH)
01/01/05 - 09/30/05
Hour Jan Feb Mar Apr May Jun Jul Aug Sep Oct Nov Dec | Mean ---- ---- ---- ---- ---- ---- ---- ---- ---- ---- ---- ---- ---- + ---- 01 11.4 10.7 13.3 12.3 10.2 10.4 9.9 7.7 8.2 | 10.5 02 12.3 10.3 12.5 12.6 9.9 10.4 9.7 7.6 7.0 | 10.4 03 11.8 10.4 12.3 12.4 10.3 10.4 9.7 7.4 6.8 | 10.3 04 10.9 9.9 12.1 11.9 9.4 10.0 9.9 7.1 6.8 | 9.9 05 10.6 10.2 11.8 11.8 9.3 10.0 9.9 7.4 8.1 | 10.0 06 10.9 10.2 11.8 11.3 9.5 10.5 8.9 7.9 7.6 | 10.0 07 10.5 9.5 11.4 10.2 8.8 9.9 7.6 7.3 8.5 | 9.3 08 10.4 8.7 11.3 10.1 8.2 8.6 7.7 6.2 8.7 | 8.8 09 10.4 8.2 11.2 9.9 7.9 7.9 7.7 6.6 8.8 | 8.7 10 10.4 8.0 10.6 9.9 7.6 8.1 8.6 7.2 8.8 | 8.7 11 9.6 7.9 11.3 10.3 8.4 9.2 9.1 8.2 9.0 | 9.2 12 9.2 8.0 11.6 10.4 9.3 9.5 10.6 9.2 8.9 | 9.7 13 9.2 8.2 12.6 11.1 10.1 10.3 11.3 10.4 8.4 | 10.4 14 10.0 9.0 13.8 12.6 10.6 11.4 12.6 11.1 9.6 | 11.4 15 9.7 9.3 13.9 12.0 11.5 11.1 13.5 12.2 10.8 | 11.7 16 10.7 9.2 12.9 13.7 11.9 11.4 15.5 12.6 9.7 | 12.2 17 12.0 9.5 13.3 13.7 12.0 11.0 15.5 12.0 9.6 | 12.3 18 12.6 10.1 12.2 13.0 12.5 10.6 16.0 12.5 8.7 | 12.3 19 13.2 10.7 12.5 13.0 12.7 11.1 15.4 12.5 10.3 | 12.5 20 12.9 10.7 13.4 14.0 12.5 11.7 14.7 11.5 9.6 | 12.5 21 12.8 9.7 12.4 14.8 12.0 12.1 13.1 11.3 8.9 | 12.1 22 13.3 9.4 12.1 13.8 11.6 12.2 12.1 10.3 7.9 | 11.6 23 12.8 9.8 12.7 12.7 11.0 11.9 10.8 8.9 8.2 | 11.1 24 12.1 10.1 12.8 11.8 10.7 11.7 10.3 8.0 8.7 | 10.8 ---- ---- ---- ---- ---- ---- ---- ---- ---- ---- ---- ---- ---- + ---- Mean 11.3 9.5 12.3 12.1 10.3 10.5 11.3 9.3 8.6 | 10.7
Good Hours 538 672 744 690 744 720 744 744 324
Missing Hours 206 0 0 30 0 0 0 0 396
5,920 Hours of Good Data 632 Hours Missing 90.4% Data Recovery

19
MEAN HOURLY VALUES
FLATHEAD INDIAN NATION OLIVER PT - 63 FT WIND DIRECTION (DEG)
01/01/05 - 09/30/05
Hour Jan Feb Mar Apr May Jun Jul Aug Sep Oct Nov Dec | Mean ---- ---- ---- ---- ---- ---- ---- ---- ---- ---- ---- ---- ---- + ---- 01 219 219 220 181 189 214 245 199 212 | 211 02 218 212 220 169 196 207 243 176 221 | 206 03 216 213 207 158 202 220 238 188 229 | 206 04 209 207 210 188 187 218 237 196 245 | 209 05 211 221 205 171 185 215 233 203 249 | 208 06 208 208 208 170 186 213 222 192 247 | 203 07 198 205 207 150 175 206 217 195 244 | 197 08 193 194 203 152 186 209 209 189 236 | 194 09 197 182 205 151 192 213 207 189 230 | 194 10 199 190 192 148 185 218 208 201 232 | 195 11 194 196 207 152 179 217 213 191 222 | 196 12 197 206 194 176 190 203 207 183 236 | 197 13 207 211 208 177 189 236 220 209 237 | 209 14 209 198 216 185 186 207 219 209 224 | 205 15 218 205 221 191 183 205 221 198 223 | 206 16 211 204 212 185 177 196 217 187 207 | 199 17 215 196 225 187 182 184 230 179 189 | 199 18 208 197 223 179 179 191 225 187 217 | 199 19 213 204 223 174 173 191 233 204 195 | 201 20 211 204 226 182 170 199 246 227 196 | 208 21 216 219 213 181 179 208 279 204 204 | 212 22 222 215 206 177 176 214 262 224 229 | 213 23 218 212 204 186 195 220 256 221 229 | 215 24 220 219 208 167 183 224 252 210 216 | 211 ---- ---- ---- ---- ---- ---- ---- ---- ---- ---- ---- ---- ---- + ---- Mean 210 206 211 172 184 209 231 198 224 | 204
Good Hours 462 672 744 686 744 720 744 744 324
Missing Hours 282 0 0 34 0 0 0 0 396
5,840 Hours of Good Data 712 Hours Missing 89.1% Data Recovery

20
FREQUENCY DISTRIBUTION - Hours of Occurrence 11/15/04 - 01/15/06
Parameter 1: FLATHEAD INDIAN NATION 35M WIND SPEED (W) (MPH)
2: FLATHEAD INDIAN NATION 35M WIND DIRECTION (DEG)
Parameter 1: MPH 0.0 10.1 15.1 20.1 25.1 30.1 35.1 to to to to to to to Parm 2 - DEG 10.0 15.0 20.0 25.0 30.0 35.0 50.0 Total
0.0 to 22.5 114 5 1 0 0 0 0 120
22.6 to 45.0 168 9 8 10 4 3 0 202
45.1 to 67.5 527 98 74 56 48 45 27 875
67.6 to 90.0 864 65 15 5 2 0 0 951
90.1 to 112.5 465 48 1 0 0 0 0 514
112.6 to 135.0 155 18 0 0 0 0 0 173
135.1 to 157.5 119 14 4 1 0 0 0 138
157.6 to 180.0 134 12 2 0 0 0 0 148
180.1 to 202.5 198 8 4 0 0 0 0 210
202.6 to 225.0 646 200 117 112 66 34 12 1187
225.1 to 247.5 1212 827 511 362 248 168 99 3427
247.6 to 270.0 514 128 142 137 99 57 23 1100
270.1 to 292.5 153 34 40 24 15 5 3 274
292.6 to 315.0 84 21 9 11 4 1 1 131
315.1 to 337.5 74 20 3 0 1 0 0 98
337.6 to 360.1 74 6 1 0 0 0 0 81
Total 5501 1513 932 718 487 313 165 9629
9,631 Good Hours 617 Hours Missing 94.0% Net Data Recovery

21
FREQUENCY DISTRIBUTION - Percent Occurrence 11/15/04 - 01/15/06
Parameter 1: FLATHEAD INDIAN NATION 35M WIND SPEED (W) (MPH)
2: FLATHEAD INDIAN NATION 35M WIND DIRECTION (DEG)
Parameter 1: MPH 0.0 10.1 15.1 20.1 25.1 30.1 35.1 to to to to to to to Parm 2 - DEG 10.0 15.0 20.0 25.0 30.0 35.0 50.0 Total
0.0 to 22.5 1.2 .1 .0 .0 .0 .0 .0 1.2
22.6 to 45.0 1.7 .1 .1 .1 .0 .0 .0 2.1
45.1 to 67.5 5.5 1.0 .8 .6 .5 .5 .3 9.1
67.6 to 90.0 9.0 .7 .2 .1 .0 .0 .0 9.9
90.1 to 112.5 4.8 .5 .0 .0 .0 .0 .0 5.3
112.6 to 135.0 1.6 .2 .0 .0 .0 .0 .0 1.8
135.1 to 157.5 1.2 .1 .0 .0 .0 .0 .0 1.4
157.6 to 180.0 1.4 .1 .0 .0 .0 .0 .0 1.5
180.1 to 202.5 2.1 .1 .0 .0 .0 .0 .0 2.2
202.6 to 225.0 6.7 2.1 1.2 1.2 .7 .4 .1 12.3
225.1 to 247.5 12.6 8.6 5.3 3.8 2.6 1.7 1.0 35.6
247.6 to 270.0 5.3 1.3 1.5 1.4 1.0 .6 .2 11.4
270.1 to 292.5 1.6 .4 .4 .2 .2 .1 .0 2.8
292.6 to 315.0 .9 .2 .1 .1 .0 .0 .0 1.4
315.1 to 337.5 .8 .2 .0 .0 .0 .0 .0 1.0
337.6 to 360.1 .8 .1 .0 .0 .0 .0 .0 .8
Total 57.1 15.7 9.7 7.5 5.1 3.3 1.7 100.0
9,631 Good Hours 617 Hours Missing 94.0% Net Data Recovery

22
FLATHEAD INDIAN NATION 35M WIND SPEED (S)
01/01/05 to 12/31/05
Wind Speed Frequency and Concurrent TI
Wind Frequency of Mean Speed Occurrence Turbulence (mps) Hrs % Intensity ----- ---- --- ----- 0-2 2910 34.8 0.331 3 1229 14.7 0.177 4 871 10.4 0.151 5 648 7.8 0.128 6 502 6.0 0.120 7 404 4.8 0.114 8 336 4.0 0.102 9 301 3.6 0.096 10 260 3.1 0.096 11 231 2.8 0.086 12 184 2.2 0.083 13 151 1.8 0.080 14 133 1.6 0.076 15 73 .9 0.076 16 56 .7 0.070 17 31 .4 0.066 18 20 .2 0.084 19 10 .1 0.075 20 2 .0 0.061 21 3 .0 0.072 22 1 .0 0.084 23 0 0.0 ***** 24 1 .0 0.035 25 0 0.0 ***** 26 0 0.0 ***** 27 0 0.0 ***** 28 0 0.0 ***** 29 0 0.0 ***** 30 0 0.0 *****
Total Hrs 8357 8357


Tribal Renewable Energy Final Technical Report
Tab 3
Environmental ReviewPhase One Avian Screening
Project Title: Flathead Reservation Renewable Energy Feasibility Study
Date of Report: September 2006
RecipientOrganization: Salish & Kootenai Holding Company, Inc. Award Number: DE-FG36-04GO14024
Partners: Salish & Kootenai Holding Company, Inc. Distributed Generation Systems, Inc. (cost sharing partner)


Tribal Renewable Energy Final Technical Report
Tab 4
Cultural Assessment
Project Title: Flathead Reservation Renewable Energy Feasibility Study
Date of Report: September 2006
RecipientOrganization: Salish & Kootenai Holding Company, Inc.
Award Number: DE-FG36-04GO14024
Partners: Salish & Kootenai Holding Company, Inc. Distributed Generation Systems, Inc. (cost sharing partner)


Tribal Renewable Energy Final Technical Report
Tab 5
Transmission Review and Market Study
Project Title: Flathead Reservation Renewable Energy Feasibility Study
Date of Report: September 2006
RecipientOrganization: Salish & Kootenai Holding Company, Inc.
Award Number: DE-FG36-04GO14024
Partners: Salish & Kootenai Holding Company, Inc. Distributed Generation Systems, Inc. (cost sharing partner)


Tribal Renewable Energy Final Technical Report
Tab 6
Project Economics
Project Title: Flathead Reservation Renewable Energy Feasibility Study
Date of Report: September 2006
RecipientOrganization: Salish & Kootenai Holding Company, Inc.
Award Number: DE-FG36-04GO14024
Partners: Salish & Kootenai Holding Company, Inc. Distributed Generation Systems, Inc. (cost sharing partner)

PRELIMINARY
PROJECT ECONOMICS FOR WIND FACILTY
For
S&K Holding Company
Summary
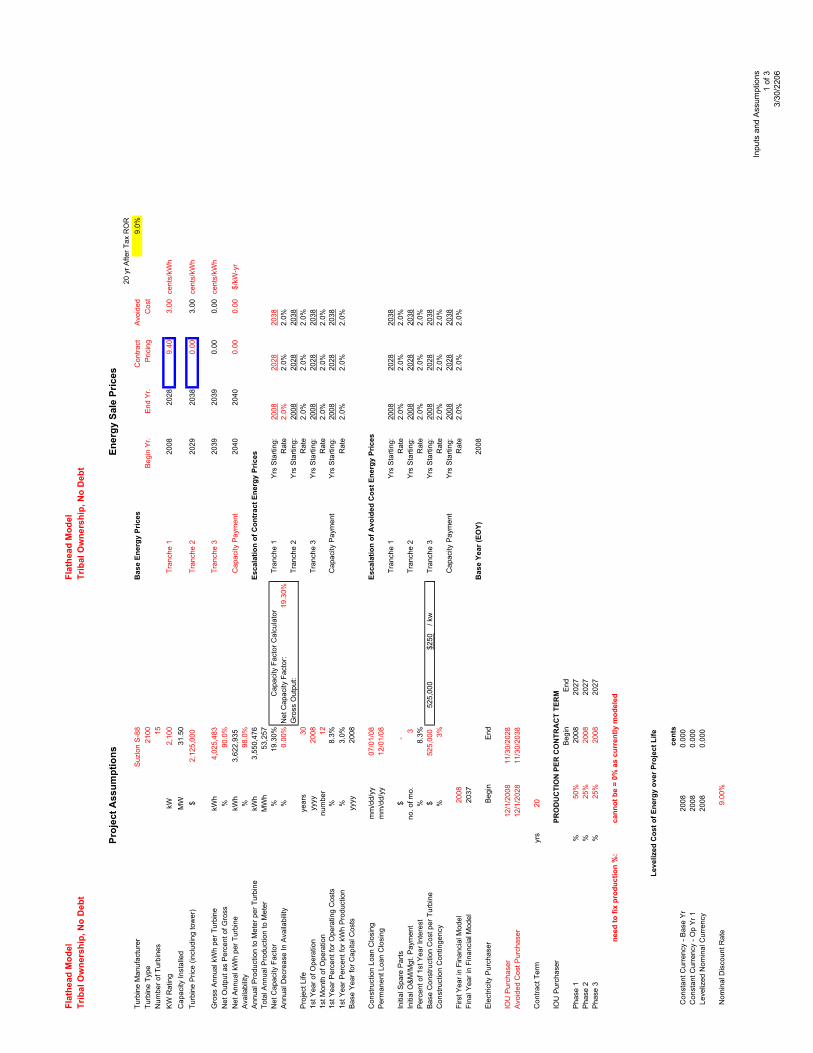
Distributed Generations Systems, Inc produced a financial model for consideration by the S&K Holding Company.
Disgen has provided a set of preliminary project economics for a 30MW facility to be interconnected to the Northwestern Energy 115kV Transmission Line as a baseline to the economic viability of this proposed project. This model assumed a Tribally owned project on Tribal trust lands, without using the existing production tax credit, and using no loans. It also assumed no property taxes being paid to the state Montana and Federal Government and no landowner payments to the Confederate Tribes of Salish & Kootenai. Given the low capacity of 19.3% for a Suzlon 88 Wind Turbine 2100kW, the breakeven energy sales price is 10.0 cents per kWh to make this propose wind project to deliver a rate of return of 9.0%. If the Tribe chooses to partner with a private investment partner who needs to utilize the existing Production Tax Credit, and negotiates a landowner payment, the rate of return and price per kWh can only improve to 8.4 cents per kWh.
A large component in delivering a competitive price is the amount of energy produced from the wind turbine. If the Salish Mountains had the wind resource of an annual average wind speed of more than 16 mph and at least a 35% capacity factor, the energy prices to be sold could go as low as 3.5 cents per kWh.

Sources and Uses of Funds Flathead ModelTribal Ownership, No Debt
SOURCES Unit Price Units Percent Amount
Senior Loan 0.0% Other Debt 0.0% Equity 100.0% 45,850,725
Total Sources 100.0% 45,850,725
USES
1.0 Wind Turbine Cost1.01 Wind Turbines and Towers 2,125,000 15 69.5% 31,875,0001.02 Wind Turbine Contingency - 15 0.0% 01.03 Shipping and Packing 100,000 15 3.3% 1,500,0001.04 Turbine Warranty (Years 3-5 total) 90,000 15 2.9% 1,350,0001.05 Sales Tax 0 15 0.0% 0
Subtotal 75.7% 34,725,000
2.0 Balance of Construction2.01 Base Construction Cost 525,000 15 17.2% 7,875,0002.02 Dynamic VAR Comp - 1 0.0% 02.03 Substation 2,000,000 1 4.4% 2,000,0002.04 O & M Building - 1 0.0% 02.05 Construction Interest 1.6% 741,9632.06 Construction Contingency 0.6% 296,2502.07 Sales Tax 0.0% 0
Subtotal Construction 23.8% 10,913,213
3.0 Working Capital and Initial Operating Expenses3.01 Working Capital Funding 0.1% 34,387 3.02 Spare Parts 0.0% -3.03 First Half -Year Insurance Premium 0.3% 118,125 3.04 Initial Operations and Management Fee 0.0% -3.05 Other Initial Operating Expense 0.0% -
Subtotal Working Capital and Initial Operating Expenses 0.3% 152,512
3.0 Lender Transaction Expenses3.01 Legal Expenses 0.0% -3.02 Construction Loan Fee 0.0% -3.03 Permanent Loan Fee 0.0% -3.04 Lender Consulting Expenses 0.0% -3.05 Other Lender Costs 0.0% -3.06 Title Insurance 0.0% 5,000 3.07 Other 0.0% -3.08 Initial Debt Reserve Funding 0.0% -3.09 First Year Agency Fee 0.0% -
Subtotal Lender Transaction Expenses 0.0% 5,000
4.0 Equity Financing and Other Expenses4.01 Equity Consulting Expenses 0.0% -4.02 Development Costs 0.0% -4.03 Legal Expenses 0.1% 50,000 4.04 Organizational Costs 0.0% 5,000
Subtotal Equity Financing and Other Expenses 0.1% 55,000
5.0 Development Costs and Fees5.01 Developer Development Cost Reimbursement 0.0% -5.02 Other Development Cost Reimbursement 0.0%5.03 Base Development Fee 0.0% -5.04 Additional Development Fee 0.0% -5.05 Project Construction Management 0.0% -5.06 Land Owner Installation Fee ($/MW) 0 31.5 0.0% -5.07 Substation Installation Fee 0.0% -5.08 Development Contingency 0.0% -
Subtotal Development Costs and Fees 0.0% -
Total Budget 100.0% 45,850,725
Sources and Uses 1 of 1
3/30/2006
Flat
head
Mod
elFl
athe
ad M
odel
Trib
al O
wne
rshi
p, N
o D
ebt
Trib
al O
wne
rshi
p, N
o D
ebt
Ener
gy S
ale
Pric
es20
yr A
fter T
ax R
OR
Turb
ine
Man
ufac
ture
rS
uzlo
n S
-88
Bas
e En
ergy
Pric
esC
ontra
ctA
void
ed9.
0%Tu
rbin
e Ty
pe21
00B
egin
Yr.
End
Yr.
Pric
ing
Cos
tN
umbe
r of T
urbi
nes
15K
W R
atin
gkW
2,10
0Tr
anch
e 1
2008
2028
9.40
3.00
cent
s/kW
hC
apac
ity In
stal
led
MW
31.5
0Tu
rbin
e P
rice
(incl
udin
g to
wer
)$
2,12
5,00
0
Tran
che
220
2920
380.
003.
00ce
nts/
kWh
Gro
ss A
nnua
l kW
h pe
r Tur
bine
kWh
4,02
5,48
3Tr
anch
e 3
2039
2039
0.00
0.00
cent
s/kW
hN
et O
utpu
t as
Per
cent
of G
ross
%90
.0%
Net
Ann
ual k
Wh
per T
urbi
nekW
h3,
622,
935
C
apac
ity P
aym
ent
2040
2040
0.00
0.00
$/kW
-yr
Ava
ilabi
lity
%98
.0%
Ann
ual P
rodu
ctio
n to
Met
er p
er T
urbi
nekW
h3,
550,
476
Esca
latio
n of
Con
trac
t Ene
rgy
Pric
esTo
tal A
nnua
l Pro
duct
ion
to M
eter
MW
h53
,257
Net
Cap
acity
Fac
tor
%19
.30%
Tran
che
1Y
rs S
tarti
ng:
2008
2028
2038
Ann
ual D
ecre
ase
In A
vaila
bilit
y%
0.00
%N
et C
apac
ity F
acto
r:19
.30%
Rat
e2.
0%2.
0%2.
0%G
ross
Out
put:
Tran
che
2Y
rs S
tarti
ng:
2008
2028
2038
Pro
ject
Life
year
s30
Rat
e2.
0%2.
0%2.
0%1s
t Yea
r of O
pera
tion
yyyy
2008
Tran
che
3Y
rs S
tarti
ng:
2008
2028
2038
1st M
onth
of O
pera
tion
num
ber
12R
ate
2.0%
2.0%
2.0%
1st Y
ear P
erce
nt fo
r Ope
ratin
g C
osts
%8.
3%C
apac
ity P
aym
ent
Yrs
Sta
rting
:20
0820
2820
381s
t Yea
r Per
cent
for k
Wh
Pro
duct
ion
%3.
0%R
ate
2.0%
2.0%
2.0%
Bas
e Y
ear f
or C
apita
l Cos
tsyy
yy20
08
Con
stru
ctio
n Lo
an C
losi
ngm
m/d
d/yy
07/0
1/08
Esca
latio
n of
Avo
ided
Cos
t Ene
rgy
Pric
esP
erm
anen
t Loa
n C
losi
ngm
m/d
d/yy
12/0
1/08
Tran
che
1Y
rs S
tarti
ng:
2008
2028
2038
Initi
al S
pare
Par
ts$
-
Rat
e2.
0%2.
0%2.
0%In
itial
O&
M/M
gt. P
aym
ent
no. o
f mo.
3
Tr
anch
e 2
Yrs
Sta
rting
:20
0820
2820
38P
erce
nt o
f 1st
Yea
r Int
eres
t%
8.3%
Rat
e2.
0%2.
0%2.
0%B
ase
Con
stru
ctio
n C
ost p
er T
urbi
ne$
525,
000
525,
000
$2
50 /
kwTr
anch
e 3
Yrs
Sta
rting
:20
0820
2820
38C
onst
ruct
ion
Con
tinge
ncy
%3%
Rat
e2.
0%2.
0%2.
0%C
apac
ity P
aym
ent
Yrs
Sta
rting
:20
0820
2820
38Fi
rst Y
ear i
n Fi
nanc
ial M
odel
2008
Rat
e2.
0%2.
0%2.
0%Fi
nal Y
ear i
n Fi
nanc
ial M
odel
2037
Bas
e Ye
ar (E
OY)
2008
Ele
ctric
ity P
urch
aser
Beg
inE
nd
IOU
Pur
chas
er12
/1/2
008
11/3
0/20
28A
void
ed C
ost P
urch
aser
12/1
/202
811
/30/
2038
Con
tract
Ter
myr
s20
IOU
Pur
chas
erPR
OD
UC
TIO
N P
ER C
ON
TRA
CT
TER
MB
egin
End
Pha
se 1
%50
%20
0820
27P
hase
2%
25%
2008
2027
Pha
se 3
%25
%20
0820
27
need
to fi
x pr
oduc
tion
%:
cann
ot b
e =
0% a
s cu
rren
tly m
odel
ed
Leve
lized
Cos
t of E
nerg
y ov
er P
roje
ct L
ife
cent
s C
onst
ant C
urre
ncy
- Bas
e Y
r20
080.
000
Con
stan
t Cur
renc
y - O
p Y
r 120
080.
000
Lev
eliz
ed N
omin
al C
urre
ncy
2008
0.00
0
Nom
inal
Dis
coun
t Rat
e9.
00%
Cap
acity
Fac
tor C
alcu
lato
r
Proj
ect A
ssum
ptio
ns
Inpu
ts a
nd A
ssum
ptio
ns1
of 3
3/30
/220
6

Flat
head
Mod
elFl
athe
ad M
odel
Trib
al O
wne
rshi
p, N
o D
ebt
Trib
al O
wne
rshi
p, N
o D
ebt
Sen
ior L
oan
Bas
e Y
ear
2008
Am
ortiz
edC
over
. Rat
ios
- Sen
ior D
ebt
Ope
ratio
ns &
Mai
nten
ance
Fee
Opt
ions
%
Deb
t (if
amor
t) or
Cov
erag
e R
atio
0%M
inim
umA
vera
ge
Cen
ts/k
Wh
(esc
alat
ing)
cent
s0.
00
Fix
ed In
tere
st R
ate
5.00
%0.
000.
00
Fix
ed A
nnua
l Pm
t (es
cala
ting)
$
Am
ortiz
atio
n P
erio
d (Y
ears
)20
F
ixed
Ann
ual P
mt p
er T
urbi
ne (e
scal
atin
g)$
25,0
00
Inte
rest
Onl
y P
erio
d (Y
ears
)
Per
cent
of R
even
ues
%0.
00%
%
of T
otal
O&
M S
ubor
dina
ted
%0.
00%
Tota
l Ter
m20
1
st Y
ear/M
onth
Fee
s B
egin
2008
12
V
aria
ble
Cov
erag
e R
atio
Yrs
Sta
rting
:20
0820
0720
10P
erce
nt L
ando
wne
r Pym
t Opt
ions
F
ixed
Ann
ual P
ymt
$(L
ando
wne
r ele
ctric
bill
reim
burs
emen
t) I
nitia
l Loa
n Fe
e1.
00%
P
er k
W (e
sc)
$ A
nnua
l Age
ncy
Fee
-$
% o
f Rev
enue
s (fi
xed)
%0.
00%
%
of R
even
ues
(var
iabl
e)Y
ear
Per
cent
A
pplie
d to
Yrs
Sta
rting
2008
Oth
er D
ebt
A
pplie
d to
Yrs
Sta
rting
2020
Am
ortiz
edC
over
. Rat
ios
- Tot
al D
ebt
A
pplie
d to
Yrs
Sta
rting
2026
%
Deb
t (if
amor
t) or
Cov
erag
e R
atio
0%M
inim
umA
vera
geM
inim
um A
nnua
l Pym
t$/
Turb
ine
In
tere
st R
ate
8.25
%0.
000.
00
Ter
m (Y
ears
)15
Sta
ndby
Ele
ctric
Rat
e (e
scal
atin
g)$/
kWh
0.06
0
Inte
rest
Onl
y P
erio
d (Y
ears
)1
Sta
ndby
Ele
ctric
Con
sum
ptio
nkW
h50
,000
To
tal T
erm
16 I
nter
conn
ect F
ee to
Util
ity (f
ixed
$/K
W-y
r)$
-
Ins
uran
ce/k
W (e
scal
atin
g)$
7.50
Adm
inis
tratio
n (e
sc)
$20
,000
A
udit/
Lega
l/Mis
cella
neou
s (e
sc)
$20
,000
M
anag
emen
t Ove
rsig
ht E
xpen
se (e
sc)
$20
,000
D
ebt S
ervi
ce R
eser
ve O
ther
Exp
ense
(esc
)$
-
Deb
t Ser
vice
Res
erve
(% o
f Ann
ual)
50%
Oth
er E
xpen
se (%
of r
ev)
%0.
0%In
itial
DS
R (%
of 1
st Y
ear D
ebt S
ervi
ce)
50%
Oth
er E
xpen
se (c
onst
ant)
$%
of C
ash
Flow
to F
und
Res
erve
50%
Oth
er E
xpen
se S
ubor
dina
ted
(esc
)$
-
Dev
elop
er S
ubor
dina
ted
Fee
(% o
f rev
)%
0.0%
Con
stru
ctio
n D
ebt
Int
eres
t Rat
e (In
com
e) o
n D
ebt R
esv/
Cas
h2.
0%C
onst
ruct
ion
Loan
?(Y
es/N
o)Y
es A
ccru
ed In
tere
st a
s a
% o
f Cas
h In
tere
st P
ymt
100%
Am
ount
% o
f Cos
t10
0% W
orki
ng C
apita
l Req
uire
men
t as
% o
f 1st
Yea
r Exp
ense
s5.
0%
Inte
rest
Rat
e%
5.3%
Com
mitm
ent F
ee o
n U
nuse
d Fu
nds
%0.
5%In
itial
Loa
n Fe
e%
0.0%
Cap
ital C
osts
& G
ener
al In
flatio
n(a
ll ye
ars)
2.0%
Ope
ratin
g E
xpen
se E
scal
atio
n(a
ll ye
ars)
2.0%
Boo
k Li
fe o
f Pro
ject
year
s30
Am
ortiz
atio
n P
erio
d fo
r Int
angi
ble
Ass
ets
year
s5
N/A
A
vera
ge L
ife (Y
ears
)
A
vera
ge L
ife (Y
ears
)N
/A
Deb
t Fin
anci
ngO
pera
tions
and
Mai
nten
ance
Exp
ense
s
Inpu
ts a
nd A
ssum
ptio
ns2
of 3
3/30
/220
6

Flat
head
Mod
elFl
athe
ad M
odel
Trib
al O
wne
rshi
p, N
o D
ebt
Trib
al O
wne
rshi
p, N
o D
ebt
Inco
me
Taxe
sFe
dera
lC
OTa
x R
ates
0.00
%0.
00%
Yr P
lace
d in
Ser
vice
2008
Inte
rnal
Rat
es o
f Ret
urn
Sho
rt fir
st y
r?N
o A
t-Ris
k Li
mita
tions
?N
oN
o1s
t Yea
r Per
cent
8.3%
Util
ize
Tax
Loss
es?
Yes
Yes
Year
sPr
e-ta
xA
fter-
tax
Pre-
tax
Dep
r Met
hods
5+C
ode
Type
Yrs
or D
B%
DB
/SL
Yrs
Boo
k Li
feD
/A10
+1.
2%1.
2%1.
2%Fa
cilit
y C
osts
1M
AC
RS
42,3
385
30D
15+
6.9%
6.9%
6.9%
Inte
rcon
nect
Cos
ts2
SL
2,00
020
30D
20+
9.0%
9.0%
9.0%
Loan
Exp
ense
s3
SL
520
20A
25+
9.2%
9.2%
9.2%
Org
aniz
atio
nal C
osts
4S
L5
55
A30
+9.
4%9.
4%9.
4%44
,348
1st Y
r PTC
cent
s/kW
h-
1.
820
03P
TC B
ase
Yea
ryy
yy20
081.
827
2004
Last
Yea
r of P
TCyy
yy20
181.
8544
0520
05P
TC A
nnua
l Esc
alat
ion
%1.
5%1.
8822
2107
520
06D
evel
opm
ent F
ees
1.91
0454
391
2007
1.93
9111
207
2008
Bas
e D
evel
opm
ent F
ee%
of c
ost
0.0%
of fi
rst
200
MW
Add
ition
al D
evel
opm
ent F
ee%
of c
ost
0.0%
all o
ver
200
MW
Prop
erty
Tax
es C
ost o
f Equ
ipm
ent
45,6
38,2
13To
tal W
ind
Turb
ine
Cos
ts (b
udge
t)34
,725
,000
Ass
esse
d V
alue
as
Per
cent
29.0
%To
tal B
alan
ce o
f Pla
nt C
osts
(bud
get)
10,9
13,2
13 M
il R
ate
($ p
er $
1000
)-
TO
TAL
CO
ST
OF
EQ
UIP
ME
NT
45,6
38,2
13 D
ecr i
n P
rop
Val
ue/Y
r5.
0% M
in. M
il R
ate
(% o
f orig
.)20
%
Sale
s Ta
xes
Rat
e0.
00%
App
roxU
nlev
erag
edR
etur
ns
PTC
Esc
alat
or
Inte
rnal
Rat
es o
f Ret
urns
/Dev
elop
men
t Fee
sIn
com
e &
Oth
er T
axes
Ret
urns
Inpu
ts a
nd A
ssum
ptio
ns3
of 3
3/30
/220
6

Income StatementFlathead ModelTribal Ownership, No Debt
Closing 2008 2009 2010 2011 2012 2013 20141 2 3 4 5 6 7
Operating Revenue
Capacity Sales Electricity Sales 150 5,106 5,208 5,313 5,419 5,527 5,638
Total Revenues 150 5,106 5,208 5,313 5,419 5,527 5,638
Operating Expenses
Operations & Maintenance 31 383 390 398 406 414 422 Landowner Payments - - - - - - - Interconnect and Electricity Consumption 0 3 3 3 3 3 3 Insurance 20 241 246 251 256 261 266 General and Administrative 2 20 21 21 22 22 23 Audit, Legal, Miscellaneous 20 20 21 21 22 22 23 Property Taxes - Management 2 20 21 21 22 22 23 Lender Agency Fee - - - - - - - Other - - - - - - -
Total Operating Expenses 75 688 701 716 730 744 759
NET OPERATING INCOME 76 4,419 4,507 4,597 4,689 4,783 4,878
Depreciation 123 1,478 1,478 1,478 1,478 1,478 1,478 Amortization 0 1 1 1 1 1 0 Subordinated Expenses Interest Income (0) (44) (45) (46) (47) (48) (49) Interest Expense
PRETAX INCOME (47) 2,984 3,073 3,164 3,257 3,352 3,449
Production Tax Credit Tax Provision
NET INCOME (47) 2,984 3,073 3,164 3,257 3,352 3,449
Income and Cash Flow Statements1 of 8
3/30/2206
Income Statement
Operating Revenue
Capacity Sales Electricity Sales
Total Revenues
Operating Expenses
Operations & Maintenance Landowner Payments Interconnect and Electricity Consumption Insurance General and Administrative Audit, Legal, Miscellaneous Property Taxes Management Lender Agency Fee Other
Total Operating Expenses
NET OPERATING INCOME
Depreciation Amortization Subordinated Expenses Interest Income Interest Expense
PRETAX INCOME
Production Tax Credit Tax Provision
NET INCOME
Flathead ModelTribal Ownership, No Debt
2015 2016 2017 2018 2019 2020 2021 20228 9 10 11 12 13 14 15
5,751 5,866 5,983 6,102 6,225 6,349 6,476 6,606
5,751 5,866 5,983 6,102 6,225 6,349 6,476 6,606
431 439 448 457 466 476 485 495- - - - - - - -
3 4 4 4 4 4 4 4 271 277 282 288 294 300 306 312 23 23 24 24 25 25 26 26 23 23 24 24 25 25 26 26
23 23 24 24 25 25 26 26 - - - - - - - - - - - - - - - -
775 790 806 822 838 855 872 890
4,976 5,076 5,177 5,281 5,386 5,494 5,604 5,716
1,478 1,478 1,478 1,478 1,478 1,478 1,478 1,4780 0 0 0 0 0 0 0
(50) (51) (52) (53) (54) (55) (56) (57)
3,548 3,648 3,751 3,855 3,962 4,071 4,182 4,295
3,548 3,648 3,751 3,855 3,962 4,071 4,182 4,295
Income and Cash Flow Statements2 of 8
3/30/2206

Income Statement
Operating Revenue
Capacity Sales Electricity Sales
Total Revenues
Operating Expenses
Operations & Maintenance Landowner Payments Interconnect and Electricity Consumption Insurance General and Administrative Audit, Legal, Miscellaneous Property Taxes Management Lender Agency Fee Other
Total Operating Expenses
NET OPERATING INCOME
Depreciation Amortization Subordinated Expenses Interest Income Interest Expense
PRETAX INCOME
Production Tax Credit Tax Provision
NET INCOME
Flathead ModelTribal Ownership, No Debt
2023 2024 2025 2026 2027 2028 2029 203016 17 18 19 20 21 22 23
6,738 6,872 7,010 7,150 7,293 2,374 2,422 2,470
6,738 6,872 7,010 7,150 7,293 2,374 2,422 2,470
505 515 525 536 546 557 568 580- - - -
4 4 4 4 4 4 5 5 318 324 331 337 344 351 358 365 27 27 28 29 29 30 30 3127 27 28 29 29 30 30 31
27 27 28 29 29 30 30 31- - - - - - - - - - - -
907 926 944 963 982 1,002 1,022 1,042
5,830 5,947 6,066 6,187 6,311 1,372 1,400 1,428
1,478 1,478 1,478 1,478 1,478 1,478 1,478 1,4780 0 0 0 0 0
(58) (59) (61) (62) (63) (14) (14) (14)
4,410 4,528 4,648 4,771 4,896 (92) (64) (36)
4,410 4,528 4,648 4,771 4,896 (92) (64) (36)
Income and Cash Flow Statements3 of 8
3/30/2206
Income Statement
Operating Revenue
Capacity Sales Electricity Sales
Total Revenues
Operating Expenses
Operations & Maintenance Landowner Payments Interconnect and Electricity Consumption Insurance General and Administrative Audit, Legal, Miscellaneous Property Taxes Management Lender Agency Fee Other
Total Operating Expenses
NET OPERATING INCOME
Depreciation Amortization Subordinated Expenses Interest Income Interest Expense
PRETAX INCOME
Production Tax Credit Tax Provision
NET INCOME
Flathead ModelTribal Ownership, No Debt
2031 2032 2033 2034 2035 2036 203724 25 26 27 28 29 30
2,519 2,570 2,621 2,674 2,727 2,782 2,837
2,519 2,570 2,621 2,674 2,727 2,782 2,837
591 603 615 628 640 653 666
5 5 5 5 5 5 5373 380 0 0 0 0 032 32 33 33 34 35 3632 32 33 33 34 35 36
32 32 33 33 34 35 36- - - - - - -
1,063 1,084 719 733 748 763 778
1,456 1,485 1,902 1,940 1,979 2,019 2,059
1,478 1,478 1,478 1,478 1,478 1,478 1,478
(15) (15) (19) (19) (20) (20) (21)
(7) 22 443 482 521 561 602
(7) 22 443 482 521 561 602
Income and Cash Flow Statements4 of 8
3/30/2206

Cash Flow Statement Flathead ModelTribal Ownership, No Debt
2008 2009 2010 2011 2012 2013 2014
PRETAX INCOME (47) 2,984 3,073 3,164 3,257 3,352 3,449
Increased by:
Book Depreciation 123 1,478 1,478 1,478 1,478 1,478 1,478 Book Amortization 0 1 1 1 1 1 0 Subordinated Expenses Accrued Interest Expense
Cash Flow before Debt Service, Reserves & Taxes 76 4,463 4,552 4,643 4,736 4,831 4,927
Decreased by:
Interest Payments 0 0 0 0 0 0 0 Principal Payments 0 0 0 0 0 0 0
Cash Flow before Reserves & Taxes 76 4,463 4,552 4,643 4,736 4,831 4,927
Debt Reserve Releases (Additions) Equity Investment (45,851)
PRETAX CASH FLOW (45,851) 76 4,463 4,552 4,643 4,736 4,831 4,927
Production Tax Credit 0 0 0 0 0 0 0 Income Tax Benefit (Payment)
AFTER-TAX CASH FLOW (45,851) 76 4,463 4,552 4,643 4,736 4,831 4,927
Income and Cash Flow Statements5 of 8
3/30/2206
Cash Flow Statement
PRETAX INCOME
Increased by:
Book Depreciation Book Amortization Subordinated Expenses Accrued Interest Expense
Cash Flow before Debt Service, Reserves & Taxes
Decreased by:
Interest Payments Principal Payments
Cash Flow before Reserves & Taxes
Debt Reserve Releases (Additions) Equity Investment
PRETAX CASH FLOW
Production Tax Credit Income Tax Benefit (Payment)
AFTER-TAX CASH FLOW
Flathead ModelTribal Ownership, No Debt
2015 2016 2017 2018 2019 2020 2021 2022
3,548 3,648 3,751 3,855 3,962 4,071 4,182 4,295
1,478 1,478 1,478 1,478 1,478 1,478 1,478 1,4780 0 0 0 0 0 0 0
5,026 5,126 5,229 5,333 5,440 5,549 5,660 5,773
0 0 0 0 0 0 0 00 0 0 0 0 0 0 0
5,026 5,126 5,229 5,333 5,440 5,549 5,660 5,773
5,026 5,126 5,229 5,333 5,440 5,549 5,660 5,773
0 0 0 0 0 0 0 0
5,026 5,126 5,229 5,333 5,440 5,549 5,660 5,773
Income and Cash Flow Statements6 of 8
3/30/2206

Cash Flow Statement
PRETAX INCOME
Increased by:
Book Depreciation Book Amortization Subordinated Expenses Accrued Interest Expense
Cash Flow before Debt Service, Reserves & Taxes
Decreased by:
Interest Payments Principal Payments
Cash Flow before Reserves & Taxes
Debt Reserve Releases (Additions) Equity Investment
PRETAX CASH FLOW
Production Tax Credit Income Tax Benefit (Payment)
AFTER-TAX CASH FLOW
Flathead ModelTribal Ownership, No Debt
2023 2024 2025 2026 2027 2028 2029 2030
4,410 4,528 4,648 4,771 4,896 (92) (64) (36)
1,478 1,478 1,478 1,478 1,478 1,478 1,478 1,4780 0 0 0 0 0
5,888 6,006 6,126 6,249 6,374 1,386 1,414 1,442
0 0 0 0 0 0 0 00 0 0 0 0 0 0 0
5,888 6,006 6,126 6,249 6,374 1,386 1,414 1,442
5,888 6,006 6,126 6,249 6,374 1,386 1,414 1,442
0 0 0 0 0 0 0 0
5,888 6,006 6,126 6,249 6,374 1,386 1,414 1,442
Income and Cash Flow Statements7 of 8
3/30/2206
Cash Flow Statement
PRETAX INCOME
Increased by:
Book Depreciation Book Amortization Subordinated Expenses Accrued Interest Expense
Cash Flow before Debt Service, Reserves & Taxes
Decreased by:
Interest Payments Principal Payments
Cash Flow before Reserves & Taxes
Debt Reserve Releases (Additions) Equity Investment
PRETAX CASH FLOW
Production Tax Credit Income Tax Benefit (Payment)
AFTER-TAX CASH FLOW
Flathead ModelTribal Ownership, No Debt
2031 2032 2033 2034 2035 2036 2037
(7) 22 443 482 521 561 602
1,478 1,478 1,478 1,478 1,478 1,478 1,478
1,471 1,500 1,921 1,960 1,999 2,039 2,080
0 0 0 0 0 0 00 0 0 0 0 0 0
1,471 1,500 1,921 1,960 1,999 2,039 2,080
1,471 1,500 1,921 1,960 1,999 2,039 2,080
0 0 0 0 0 0 0
1,471 1,500 1,921 1,960 1,999 2,039 2,080
Income and Cash Flow Statements8 of 8
3/30/2206