Tribal Leader Forum: Waste-to-Energy Introductionenergy.gov/sites/prod/files/2014/09/f18/Tribal...
48
NREL is a national laboratory of the U.S. Department of Energy Office of Energy Efficiency and Renewable Energy operated by the Alliance for Sustainable Energy, LLC Tribal Leader Forum: Waste-to-Energy Introduction July 24, 2014 Randy Hunsberger
Transcript of Tribal Leader Forum: Waste-to-Energy Introductionenergy.gov/sites/prod/files/2014/09/f18/Tribal...

NREL is a national laboratory of the U.S. Department of Energy Office of Energy Efficiency and Renewable Energy operated by the Alliance for Sustainable Energy, LLC
Tribal Leader Forum:Waste-to-Energy Introduction
July 24, 2014
Randy Hunsberger

Waste-to-energy Introduction
Feedstocks
Recycling
Conversion Products and Pathways
Major Equipment
WTE Economics and Opportunities
Presentation Outline
National Renewable Energy Laboratory Innovation for Our Energy Future

Waste-to-Energy Introduction
The issues, for much of the world:• Waste disposal is a major expense• High energy prices• Limited landfill space
The opportunity• Waste as an alternative fuel source through
• Landfill gas methane collection• Waste to energy
Benefits• Reduces electricity cost• Helps to meet renewable energy mandates• Improves waste management and reduces
land filling• Environmental benefits
National Renewable Energy Laboratory Innovation for Our Energy Future

WTE Highlights
Waste-to-energy (WTE) is considered renewable energy
WTE offers firm, dispatchable power
There are no commercial WTE projects that have been constructed in the US using advanced generation technologies (e.g. gasification/plasma, pyrolysis)
WTE projects receive income from energy sales and tipping fees
National Renewable Energy Laboratory Innovation for Our Energy Future

WTE Introduction--QUIZ
National Renewable Energy Laboratory Innovation for Our Energy Future
List three benefits of WTE• Reduces electricity cost• Helps to meet renewable energy mandates• Improves waste management and reduces land filling• + Other environmental benefits

Feedstocks
An accurate feedstock resource estimate is the basis for estimating the performance and economics of a biomass-or waste-to-energy project.

Biopower Pyramid
Project economics
Equipment sizing and energy production
Feedstock characteristics and availability

National Renewable Energy Laboratory Innovation for Our Energy Future
Tons per day at various heat rates and energy contents to generate 1 MW gross
Capacity Sizing Chart
0
10
20
30
40
50
60
70
80
0 1,000 2,000 3,000 4,000 5,000 6,000 7,000 8,000 9,000 10,000
Am
ount
of f
eeds
tock
requ
ired
[ton
per d
ay]
Feedstock heating value [Btu/lbm]
MSW or biomass required to generate 1-MWfor various system heat rates
17,500 Btu/kWh
15,000 Btu/kWh
12,500 Btu/kWh
10,000 Btu/kWh
8,500 Btu/kWh

MSW PropertiesM
unic
ipal
sol
id w
aste
(MSW
) is
a he
tero
gene
ous
mix
ture
Organic material is the primary fuel source for energy projects
Can be composted
Inorganic / inert materials
Many can be recycled
MSW is a low-energy content fuel
Average of 5,900 Btu per pound (US)
WTE systems can be co-fired with other feedstock
34%
13%12%12%
8%
7%
5%6%
3%
MSW Composition (EPA 2005) Paper
Yard Trimmings
Food Scraps
Plastics
Metals
Rubber, Leather &TextilesGlass
Wood
Other
Sustainable Supply

RDF is feedstock derived by processing of municipal solid waste
• RDF-1: Municipal solid waste used as a fuel in as-discarded form
• RDF-2: MSW processed to coarse particle size, with or without ferrous
metal separation, such that 95% by weight passes through a 6-inch square
mesh screen.
• RDF-3: Shredded fuel derived from MSW and processed for the removal of
metal, glass, and other entrained in-organics. The particle size of this
material is such that 95% by weight passes through a 2-inch square mesh
screen. Also called “fluff” RDF.
The American Society for Testing and
Materials has established
classifications RDF-1 to RDF-7
Refuse Derived Fuel (RDF)

How much waste is available?
What types of waste are available?• Municipal waste• Commercial / Industrial Waste• Tires• Sewage sludge• Wood waste• Medical waste
Who controls the waste and where it goes?
How far away is the waste?
Resource Assessment
National Renewable Energy Laboratory Innovation for Our Energy Future
Biopower Pyramid--QUIZ
Project economics
Equipment sizing and energy production
???

Biopower Pyramid--ANSWER
Project economics
Equipment sizing and energy production
Feedstock characteristics and availability

•Paper•Plastics•Glass•Metals•Miscellaneous
Typical recycled materials
Recycling
National Renewable Energy Laboratory Innovation for Our Energy Future

PaperHigh-grade paper
• White copy and computer paper • Letterhead • White notebook paper • White envelopes
Mixed office paper • Colored paper • File folders • Sticky notes • Boxboard (such as cereal boxes) • Junk mail • Catalogues • Paper bags • Packing/wrapping papers • Greeting cards
Newspaper• Coated paper • Magazines
Glossy paper
Corrugated cardboard

Plastics#1 – PET (Polyethylene terephthalate)
•Soda bottles•Bottles for liquor, liquid cleaners, detergents, and antacids
#2 – HDPE (High-density polyethylene)•Water, juice, and milk jugs•Bottles for laundry detergent, fabric softener, lotion, motor oil, and antifreeze
#3 – PVC or vinyl (Polyvinyl chloride)•Bottles for cooking oil, salad dressing, floor polish, mouthwash, and liquor•“Blister packs” used for batteries and other hardware and toys
#4 – LDPE (Low-density polyethylene)•Grocery bags•Trash bags•Film products
#5 – Polypropylene•Packaging such as yogurt containers, shampoo bottles, and margarine tubs •Cereal box liners, rope and strapping, combs, and battery cases
#6 – Polystyrene•Styrofoam coffee cups, food trays, and “clamshell” packaging •Some yogurt tubs, clear carry-out containers, and plastic cutlery •Foam applications [Note: Polystyrene used for foam applications is sometimes called EP or •expanded polystyrene]
#7 – Other•Applications that use some of the above six resins in combination•Collection of individual resins as mixed plastics

Glass
Clear glass
Green glass
Brown glass

MetalsAluminum
• Cans • Foil
Tin-Coated Steel Containers• Food packaging (e.g., canned food)
Bimetal Containers• Example includes tin-plated steel cans with an aluminum “pop top”
Non-Ferrous Metals• Scrap metal that does not contain iron (e.g., copper and brass)
Ferrous Metals• Iron • Iron-containing metal scrap • Steel

Batteries
Lead-acid batteries
Household batteries

•Paper•Plastics•Glass•Metals•Miscellaneous
Typical recycled materials
Recycling—QUIZ—Which of these can also be used for energy?
National Renewable Energy Laboratory Innovation for Our Energy Future

Primary Bioenergy Products
National Renewable Energy Laboratory Innovation for Our Energy Future
Electricity
Heat
Combined heat and power (CHP)

Heat Fuel Gases (producer gas) (CO + H2+CH4)
Char, gases, liquids (syn gas)
Waste-to-energy Pathways
National Renewable Energy Laboratory Innovation for Our Energy Future
Heat/power/CHP
Boiler, steam turbine
Co-fire with coalBurn gas for hot water/steam (commercial)
Use in IC engine, gas turbine or fuel cell for CHP (pre-commercial)
Catalytic conversion to alcohols, chemicals, synthetic diesel (development)
Torrefied wood for pellets, coal replacement
Pyrolysis oil for boilers and power (early commercial)
Specialty chemicals (commercial)
Further refining for transportation fuels (in development)
No Oxygen
Thermal
Combustion Gasification/Plasma Pyrolysis
Partial Oxygen
Excess Oxygen
BiochemicalBiochemical
DigestionDigestion
Biochemical
Pretreatment
FermentationTransesterification
EthanolBiodiesel
Digestion
CH4CO2

Thermochemical Technologies
National Renewable Energy Laboratory Innovation for Our Energy Future
Thermochemical technologies include:• Combustion• Gasification (and plasma gasification)• Pyrolysis

Combustion
National Renewable Energy Laboratory Innovation for Our Energy Future
Thermal conversion in an atmosphere of excess oxygen
Commercial technology
Inefficient but reliable
Emissions need to be controlled
Large water requirements

Combustion OverviewIn the US, 88 existing commercial facilities in 25 states combust 26.3 million tons of MSW per year.
Typical minimum for economic feasibility is 500 tons per day (tpd)
National Renewable Energy Laboratory Innovation for Our Energy Future
Typical Mass Burn WTE Layout

Gasification Technologies
National Renewable Energy Laboratory Innovation for Our Energy Future
PrimaryFeedstock
ProductsGasification/Plasma
Biomass
MSW
Others
Syngas(CO+H2)
Syngas to Liquids
Syngas to Chemicals
Fischer Tropsch Upgrading
Liquid Fuels
Others
HydrogenMixed alcohols•Ethanol•Propanol
Others
Close Coupled Combustion
Boiler IC Engine Combustion Turbine

Plasma Reactor
National Renewable Energy Laboratory Innovation for Our Energy Future

BioOilReactor
HEAT
Gas & Vapor
Gas
BioOil
Char
Biomass
Condenser
No oxygen
Relatively low temperatures
Courtesy: Renewable Oil International
Pyrolysis

Landfill-Gas-to-Energy (LFG or LFGtE)
Anaerobic Digestion (AD)
Biochemical Conversion Technologies
National Renewable Energy Laboratory Innovation for Our Energy Future

Landfill-Gas-to-Energy
National Renewable Energy Laboratory Innovation for Our Energy Future

Anaerobic Digestion
Breaks down organic material in absence of oxygen• Sewage, food waste, waste grease, organics from waste stream
Produces low to medium Btu biogas and residues
Emerging technology in U.S, widespread in Europe, Asia
Limited cost data available at this time
Possible opportunity at sewage treatment plant
Scalable
National Renewable Energy Laboratory Innovation for Our Energy Future
Two-phase thermophilic anaerobic digestion of MSW, Anyang City, S. KoreaFrom CADDET Technical Brochure No. 66

WTE Pathways--QUIZ
National Renewable Energy Laboratory Innovation for Our Energy Future
Combustion Gasification/Plasma Pyrolysis
No Oxygen
Thermal
Partial Oxygen
Excess Oxygen

Pit and GrappleArrangement
Materials Handling
National Renewable Energy Laboratory Innovation for Our Energy Future

Trommel Screen
National Renewable Energy Laboratory Innovation for Our Energy Future
Used to separate materials by size
Primarily for WTE pre-sorting

Sloping Grate Furnace
National Renewable Energy Laboratory Innovation for Our Energy Future

Roller Grate Furnace
National Renewable Energy Laboratory Innovation for Our Energy Future
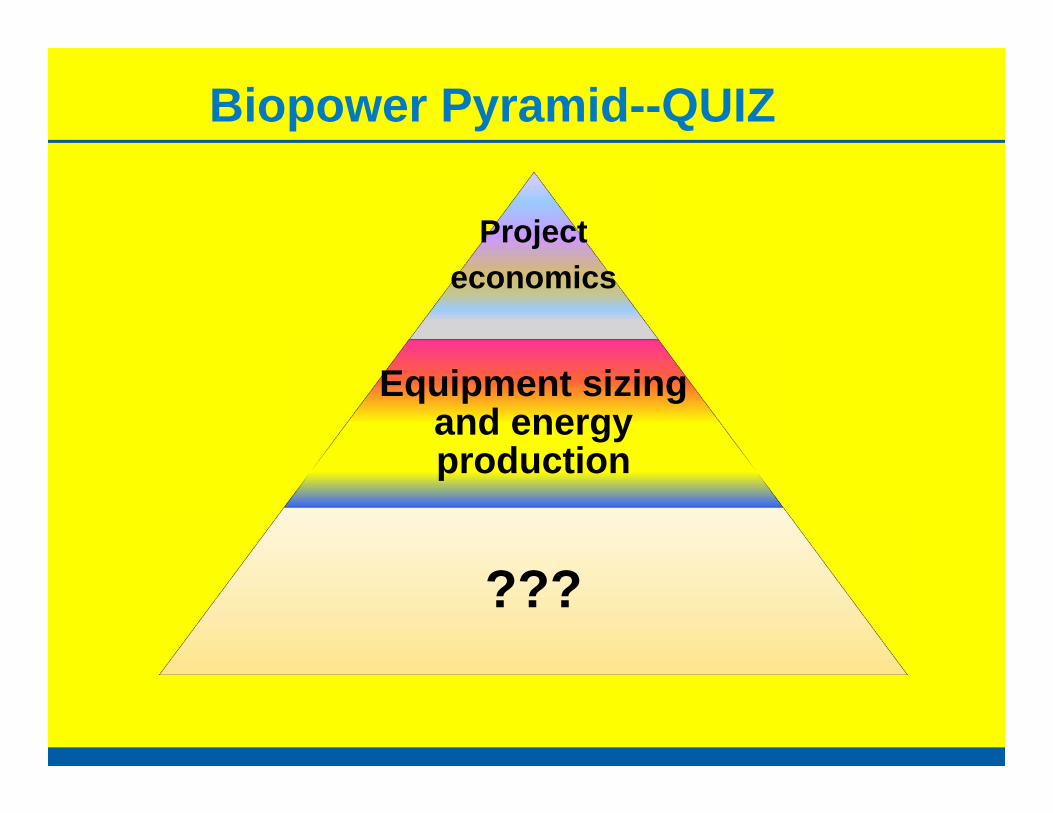
Reciprocating Grates
National Renewable Energy Laboratory Innovation for Our Energy Future

Reciprocating Grate Furnace
National Renewable Energy Laboratory Innovation for Our Energy Future

Stepped Hearth Grate
National Renewable Energy Laboratory Innovation for Our Energy Future

QUIZ—What is this?
National Renewable Energy Laboratory Innovation for Our Energy Future
Roller Grate Furnace

State of WTE Technology - large
Large scale (>300 tpd) combustion units commercially viable
National Renewable Energy Laboratory Innovation for Our Energy Future
Almost all commercial power systems are combustion/steam turbine
Efficiencies in 15% – 30% range power only, (60%-70% CHP)
550-650 kWh per ton MSW
Stokers and fluidized bed
1-110 MW (average is ~20)
Installed costs $4,000/kW
Smaller systems (< 5 MW) challenging economics
Residual material (ash) about 10% by
volume, 20% by weight
LCOE = $0.06 - $0.20/kWh (depends on
tipping fee revenue)
National Renewable Energy Laboratory Innovation for Our Energy Future
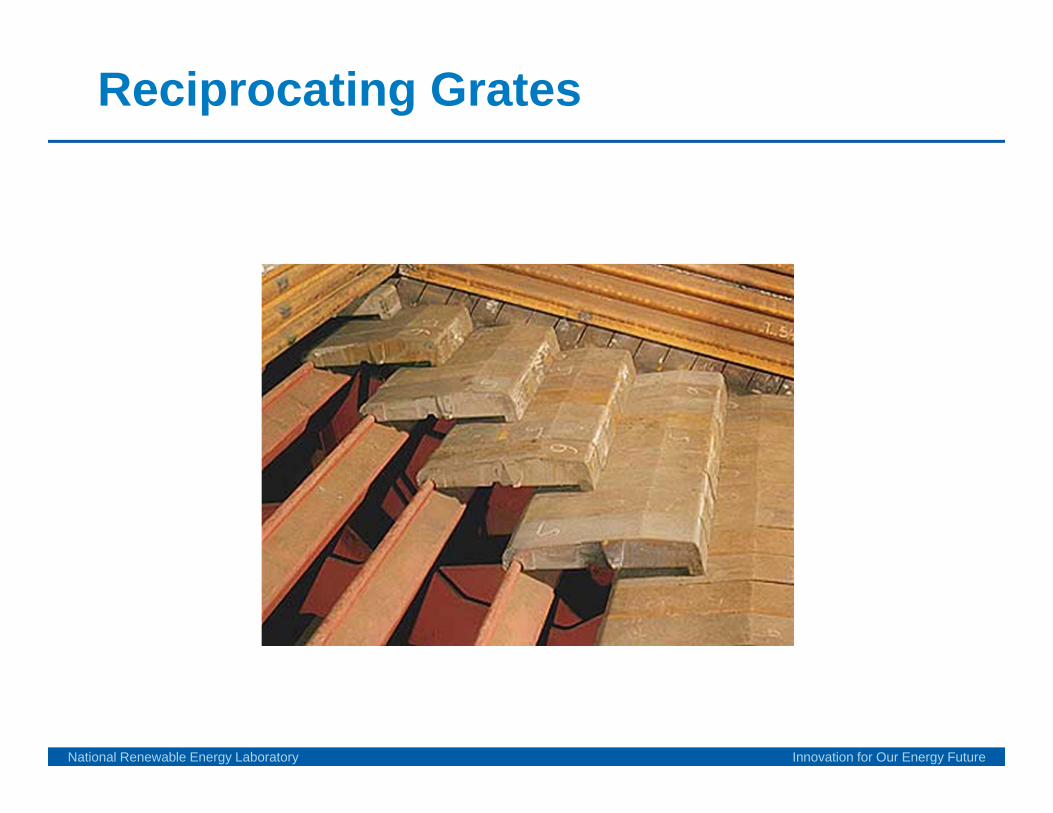
State of WTE Technology - small
IES 30 ton per day unit Mecca, CA
Small scale (10-300 tpd) advanced conversion technologies in demonstration phase
• More efficient than combustion, 30%- 40%
• Syngas (CO + H2 + CH4) can be used in IC engines, gas turbines, steam turbines or to make liquid fuels
• Installed cost $6,000 per kW, and up
• Residual material:
• about 10% by volume
• 20% by weight
• LCOE: $0.15 - $0.20+ per kWh
• (LCOE depends on tipping fee revenue)
• Reduced water usage
• 600-800 kWh per ton MSW

State of WTE Technology - mobile
Expeditionary scale (0.5-3 tpd) WTE entering limited demonstration phase• Demonstration projects beginning at Ft Irwin, Aberdeen
Proving Grounds, Edwards AFB• 250-600 kWh per ton MSW
National Renewable Energy Laboratory Innovation for Our Energy Future
Community Power Corp: MEWEPS System

WTE Economics
WTE facilities are expensive to construct
• Emissions control equipment requirements are a primary driver
Operation and maintenance costs are relatively high, approximately $100/MWh of generation• MSW fuel is hard on system components, requiring replacement
earlier than systems using other fuels
Revenue is generated from selling electricity and from fees charges for the disposal of solid waste (tipping fee)• Due to economies of scale, larger plants (>500tpd) can compete with
local electricity rates and tipping fees• Tipping fees in the U.S. range from $15/ton in Oklahoma to $92/ton in
Vermont
National Renewable Energy Laboratory

Evaluating WTE Opportunities
Waste stream• Large-scale, commercially proven, systems require >300
ton per day (tpd) of MSW• Small-scale, yet-to-be proven systems can operate with
less feedstock, but economics are marginal
Potential sites• WTE is typically favorable in cities, islands, and other areas
with land constraints, due to high costs to build new landfills• Tipping fees over $70/ton could support WTE
Energy price• Over $.12/kWh is favorable for WTE
National Renewable Energy Laboratory Innovation for Our Energy Future

Air Emissions and Ash
AshBy-product of conversion process
15-25% by weight of MSW and 5-15% of the volume
Fly ash (top) Particles and residues removed from flue gas and pollution control devices
Bed ash (bottom) Silica (sand, quartz), CaO, Fe2O3, and Al2O3
Potential re-use
Concrete, bricks, artificial reefs
AirModern air pollution control technology removes most contaminants
Scrubbers, baghouse, ESP, etc.
Varies by WTE technology, fuel composition, and controls used

ReferencesLauber J.D., Morris M.E., Ulloa P., Hasselriis F., 2006. Local waste-to-energy vs. long distance disposal of municipal waste. In: AWMA Conference, New Orleans, Louisiana, June 21.
Themelis N.J., 2007. Thermal review, Waste Management World (July-August), 37-45.
Kaplan P.O., Decarolis J., Thorneloe S., 2009. Is It Better To Burn or Bury Waste for Clean Electricity Generation?, Environmental Science Technology, 43, 1711-1717.
National Renewable Energy Laboratory Innovation for Our Energy Future

National Renewable Energy LaboratoryEnergy Integration Systems / DESI Group15013 Denver West Parkway, Golden, CO 80401
Randy [email protected]
Contact
National Renewable Energy Laboratory Innovation for Our Energy Future