TRI Webinar: RBM - Protocol Risk Assessment and Designing Site Quality Risk Indicators
33
RBM – Protocol Risk Assessment and Designing Site Quality Risk Indicators Presented By: Tammy Finnigan, COO, TRI 17 September, 2015 the risk-based monitoring company
-
Upload
tri-the-risk-based-monitoring-company -
Category
Healthcare
-
view
287 -
download
0
Transcript of TRI Webinar: RBM - Protocol Risk Assessment and Designing Site Quality Risk Indicators

RBM – Protocol Risk Assessment and
Designing Site Quality Risk Indicators
Presented By: Tammy Finnigan, COO, TRI
17 September, 2015
the risk-based monitoring company
Illustrate the process of using the
outputs of protocol risk assessment to
identify protocol risk indicators
Illustrate the process of designing
protocol risk indicators
Explore the characteristics of good
indicators of site quality risk
Explore the practical application of
surrogate risk indicators in RBM

Tammy Finnigan, COO, Triumph Consultancy Services
Tammy’s entire career has been focused on clinical research, having worked in project management and clinical operations for 10 years, with both large Pharma and CRO businesses prior to joining Triumph in 2007. Tammy is the product sponsor for TRIs risk based monitoring platform and services, OPRA and the lead facilitator for the Metrics Champion Consortium’s Risk-Based Monitoring Work Group.
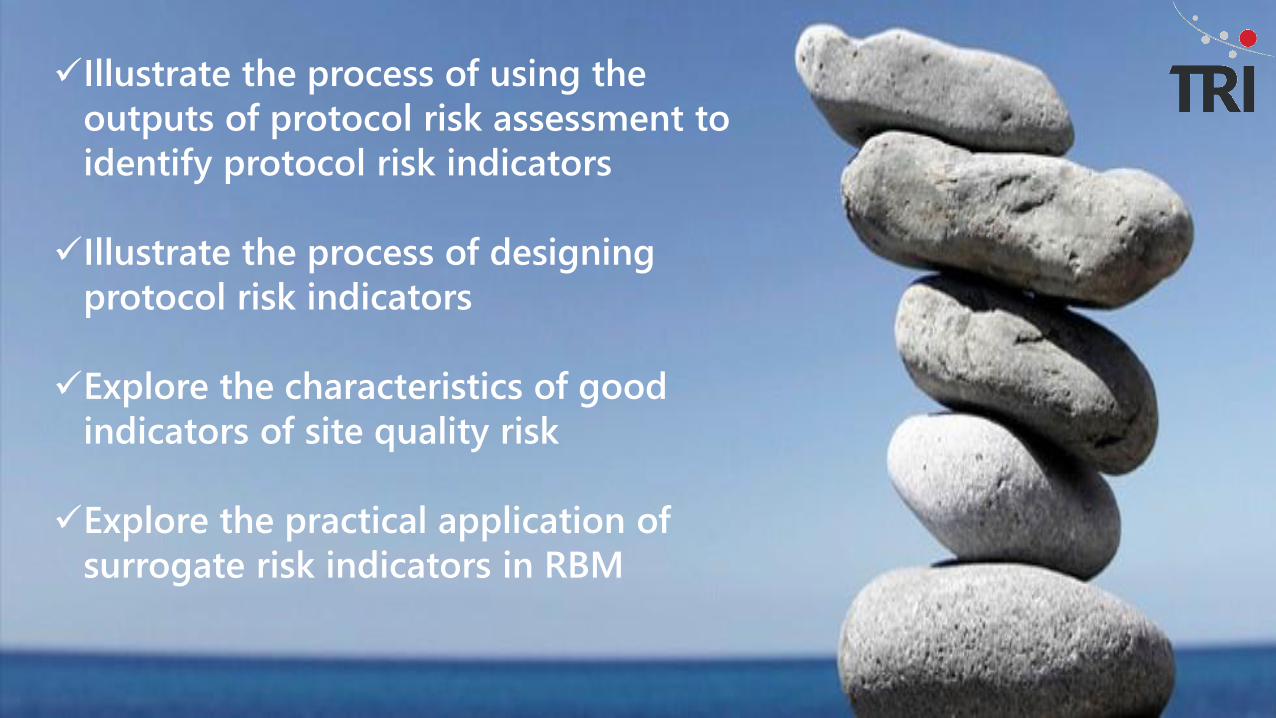
Our Journey
Founded in 2013
Sister company to Triumph Consultancy
Entirely Quality Oversight and RBM focused
Creators of OPRA RBM platform
One complete solution
Technology
Study specific services
Implementation services
Hosting

AudienceIntroductions

Synopsis
Synopsis: In 2013 the regulatory authorities provided guidance that
oversight and monitoring of clinical trials should take into consideration
the risks associated with the protocol in particular critical processes and
data. Since then, there have been many publications on risk assessment
and site quality risk indicators but the 2 processes often remain distinct
from one another. This presentation will aim to walk the attendees
through the process of taking outputs of the protocol risk assessment to
designing specific measurements or risk indicators, to identify site quality
risks. The process considers common risk indicators across studies,
therapy/indication indicators and protocol specific indicators.
Learning Objectives
Illustrate the process of using the outputs of protocol
risk assessment to identify protocol risk indicators.
Illustrate the process of designing protocol risk
indicators.
Explore the characteristics of good indicators of site
quality risk.
Explore the practical application of surrogate risk
indicators in RBM.

Part of a wider change program to implement risk-based/adaptive monitoring
Several studies being used to pilot components of process and technology
In this presentation we will focus on one component of the project
To pilot the end-to-end process of protocol risk assessment through to the implementation of site quality risk indicators to direct monitoring activities
To evaluate if there is correlation in the process of collecting primary clinical outcome data and overall site quality
Current state:
• 12 months into the project, 1 protocol, 21 countries, 169 sites, 647 subjects.
• Plans to extend into additional protocols in 2016.
Project Objectives

You can conduct protocol risk assessment without conducting risk-based monitoring, but you cannot
conduct risk-based monitoring without first conducting protocol risk assessment ...
Risk Assessment

Where does Protocol Risk Assessment fit?
QbD
Build quality by design into the planning of the trial
Risk Assessment
Conduct early and ongoing risk assessments of the protocol
Critical Variables
Identify critical process and data
Focus mitigation plans on critical data and processes
Functional Plans
Create functional plans that demonstrate how risks will be mitigated and monitored
Use risk indicators, thresholds and action plans
Refine
Adjust monitoring activities based on risks during the trial
Cross Functional Process

Process of risk assessment and defining KRIs
Process Analysis Measurements
Data collection process
definition
Process Measurements
Risk Identification
Critical Data
Critical Process
KRI design
Protocol Risk Assessment
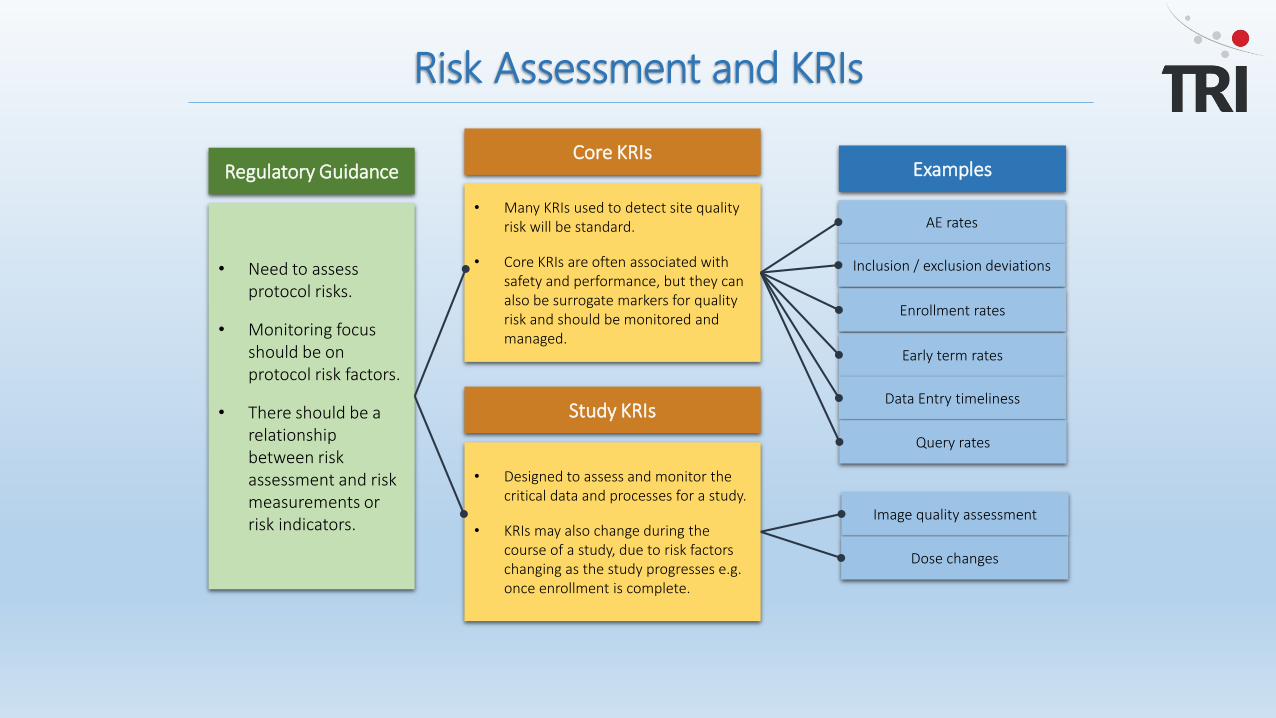
Risk Assessment and KRIs
Regulatory Guidance
• Need to assess protocol risks.
• Monitoring focus should be on protocol risk factors.
• There should be a relationship between risk assessment and risk measurements or risk indicators.
Core KRIs
• Many KRIs used to detect site quality risk will be standard.
• Core KRIs are often associated with safety and performance, but they can also be surrogate markers for quality risk and should be monitored and managed.
Study KRIs
• Designed to assess and monitor the critical data and processes for a study.
• KRIs may also change during the course of a study, due to risk factors changing as the study progresses e.g. once enrollment is complete.
Examples
AE rates
Inclusion / exclusion deviations
Enrollment rates
Early term rates
Data Entry timeliness
Query rates
Image quality assessment
Dose changes

Poll
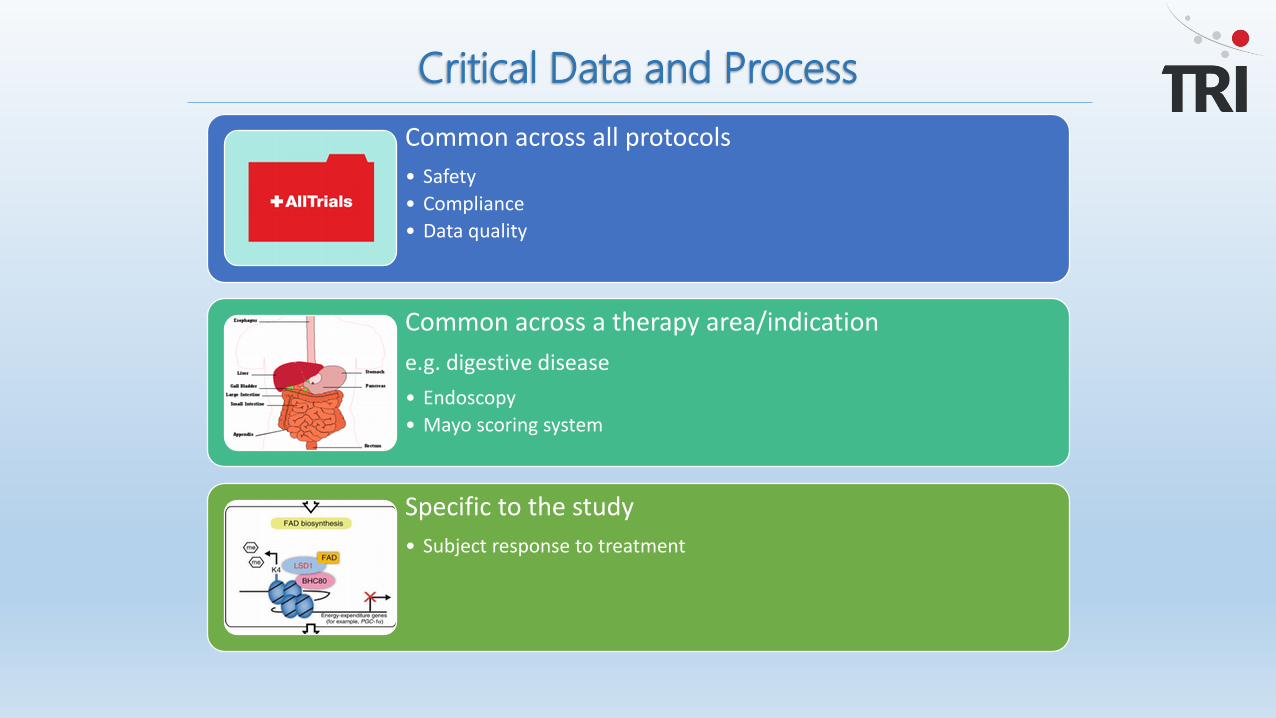
Critical Data and Process
Common across all protocols
• Safety
• Compliance
• Data quality
Common across a therapy area/indication
e.g. digestive disease
• Endoscopy
• Mayo scoring system
Specific to the study
• Subject response to treatment

Why is it important to distinguish ?
• Many KRIs used to detect site quality risk will be standard.
• Core KRIs are often associated with safety and performance, but they can also be surrogate markers for quality risk and should be monitored and managed.
• Designed to assess and monitor the critical data and processes for a study.
• KRIs may also change during the course of a study, due to risk factors changing as the study progresses e.g. once enrollment is complete.
Examples
• AE rates
• Inclusion/ exclusion deviations
• Recruitment ratios
• Early term rates
• Data entry timeliness
• Query rates
• Image quality assessment• Therapy specific assessment
scores• Dose changes
Design Impact
• Availability of historical data
• Ability to determine thresholds based on historical data
• Use of companion data
• Threshold may be influenced by therapeutic area
• Thresholds likely to be based on population
• More likely to be exploratory
KRIs
Stu
dy
KR
IsC
ore
KR
Is

A surrogate indicator is one which does not measure data directly related to the area of risk
Typically data that focuses on site process
Ideally data that is collected early, and is high in volume
Surrogate Indicators

If the critical data is an endoscopy image and additional actions are required based on the image assessment, the risk is that the site do not assess the image correctly, putting patients at risk and impacting the primary end point data
There is typically a 3rd party adjudicator looking at the clinical assessment, so that is mitigating the risk somewhat
What other, early measures would help us to identify that something may be awry at a site and will it correlate with other indicators?
Example

Let’s work through designing a quality indicator to assess risk around the critical data
Endoscopy images
Design – Process Analysis
Site creates test image
Site sends test image to central
reader
Image is received
Image quality is assessed
Test image is accepted
Site conducts subject
endoscopy
Site sends image to central reader
Image is received
Image is assessed
Image is reported
T1 Q1T2 T3
T4 T5 Q2

Hypothesis 1.
Sites with a high number of non-reportable images will present quality issues in other areas
Hypothesis 2
Sites with a high turnaround time on image data will present quality issues in other areas
What is our hypotheses?
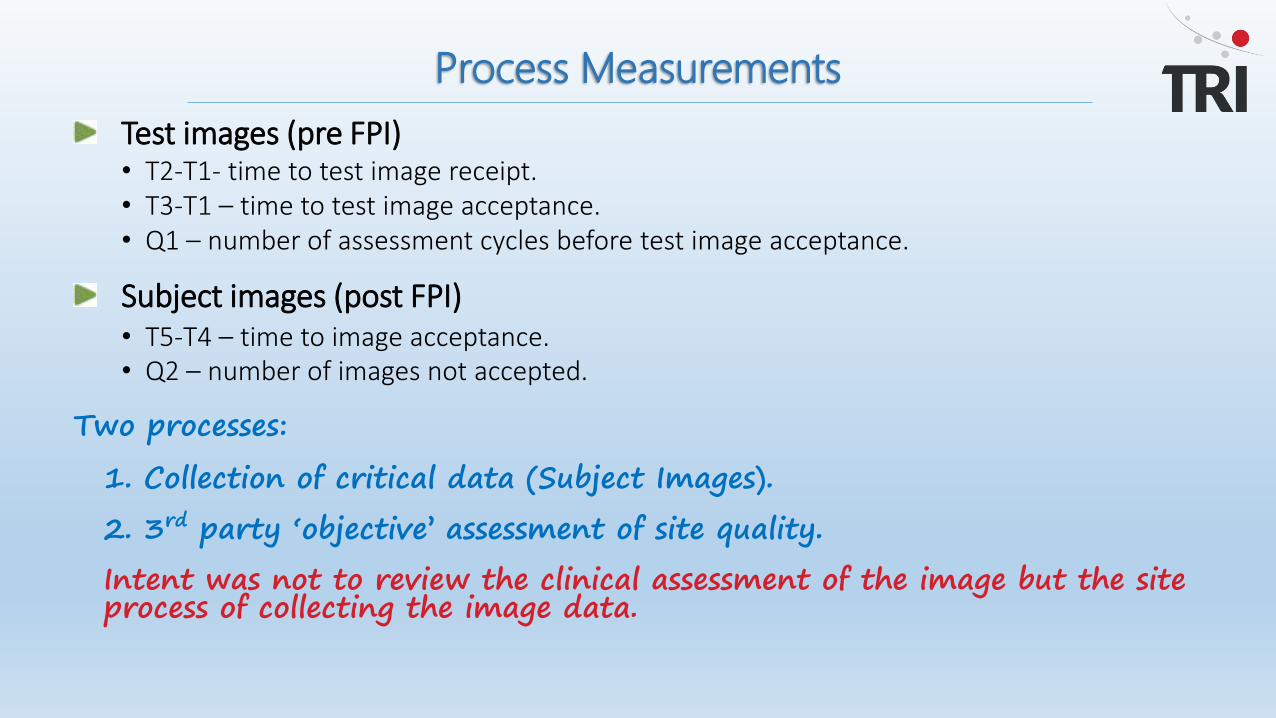
Test images (pre FPI)• T2-T1- time to test image receipt.• T3-T1 – time to test image acceptance.• Q1 – number of assessment cycles before test image acceptance.
Subject images (post FPI)• T5-T4 – time to image acceptance.• Q2 – number of images not accepted.
Two processes:
1. Collection of critical data (Subject Images).
2. 3rd party ‘objective’ assessment of site quality.
Intent was not to review the clinical assessment of the image but the site process of collecting the image data.
Process Measurements

Why did we select the measurements as defined?
Image assessment was a primary endpoint
Image assessment may result in a dose change being required
There was a 3rd party objective and consistent assessment of the sites process i.e. the central reader.
There was no reliance on the site entering data into EDC therefore less delay in accessing the data.
Why?
KRI Characteristics
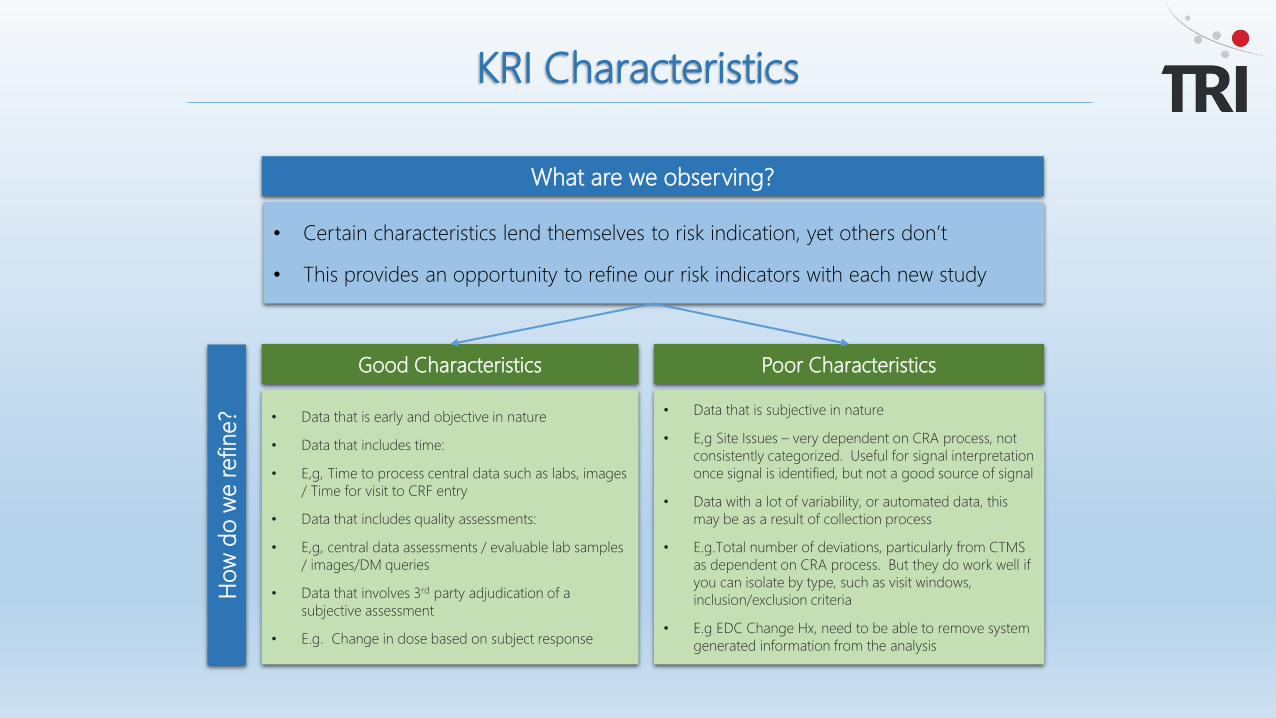
What are we observing?
• Certain characteristics lend themselves to risk indication, yet others don’t
• This provides an opportunity to refine our risk indicators with each new study
Good Characteristics
• Data that is early and objective in nature
• Data that includes time:
• E,g, Time to process central data such as labs, images
/ Time for visit to CRF entry
• Data that includes quality assessments:
• E,g, central data assessments / evaluable lab samples
/ images/DM queries
• Data that involves 3rd party adjudication of a
subjective assessment
• E.g. Change in dose based on subject response
Poor Characteristics
• Data that is subjective in nature
• E,g Site Issues – very dependent on CRA process, not
consistently categorized. Useful for signal interpretation
once signal is identified, but not a good source of signal
• Data with a lot of variability, or automated data, this
may be as a result of collection process
• E.g.Total number of deviations, particularly from CTMS
as dependent on CRA process. But they do work well if
you can isolate by type, such as visit windows,
inclusion/exclusion criteria
• E.g EDC Change Hx, need to be able to remove system
generated information from the analysis
Ho
w d
o w
e r
efine?
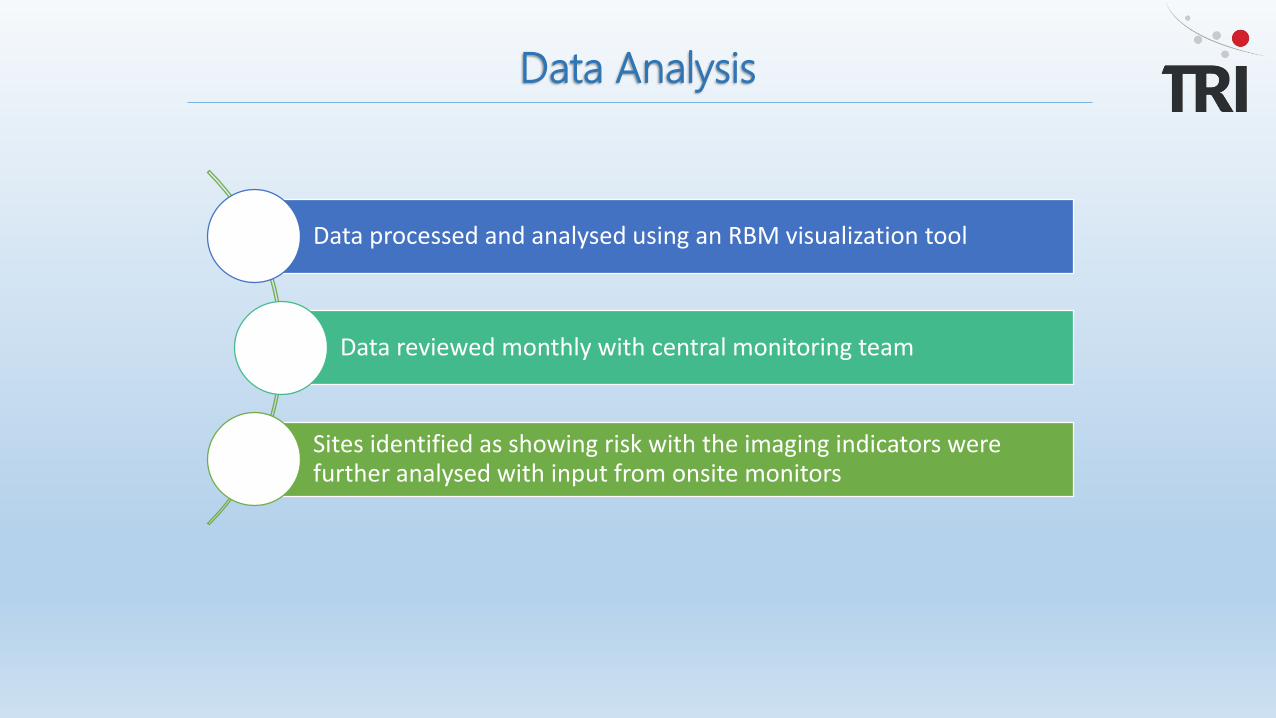
Data Analysis
Data processed and analysed using an RBM visualization tool
Data reviewed monthly with central monitoring team
Sites identified as showing risk with the imaging indicators were further analysed with input from onsite monitors

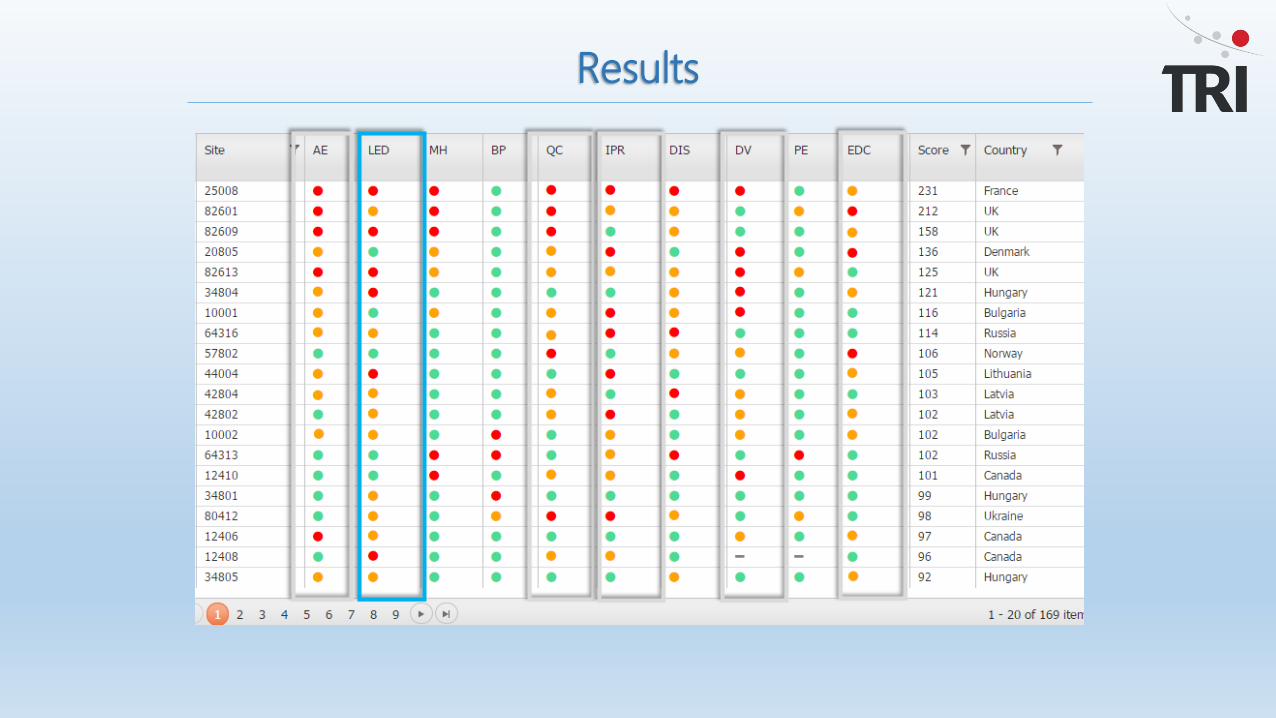
Image reporting timeliness
Time to image acceptance plotted as % missing or reported after 10 days of procedure
KRI Visualizations

Hypothesis 1.
Sites with a high number of non-reportable images will present quality issues in other areas
Incidence rate of number of non-reportable images currently too low to assess for statistical significance or correlate to other site quality risk factors
Results

Hypothesis 2
Sites with a high turnaround time on image data will present quality issues in other areas
Sites with higher than normal reporting times on the images did rank in the higher risk scores for the sites, top 26%
Corroborated by independent onsite monitor assessments of sites with high number of significant issues
Results

Sites with higher than normal reporting times on images also demonstrated elevated risk in the following areas during the first 3-6 months
• AE rates
• Data entry timelines
• Query rates
• Query response times
• Deviations
• And correlated with another study indicator – high incidence of incorrect subject response assessment
Observation
Results
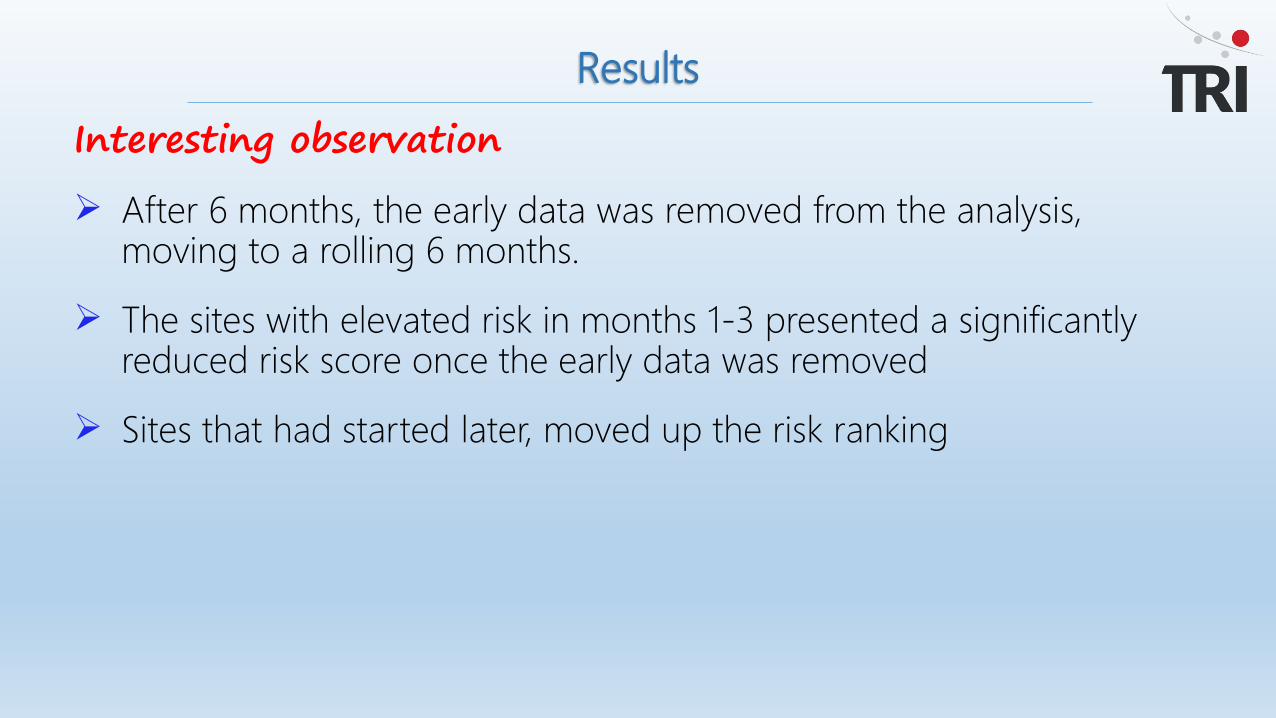
Interesting observation
After 6 months, the early data was removed from the analysis, moving to a rolling 6 months.
The sites with elevated risk in months 1-3 presented a significantly reduced risk score once the early data was removed
Sites that had started later, moved up the risk ranking
Results

Results
Dec 2014
June 2015
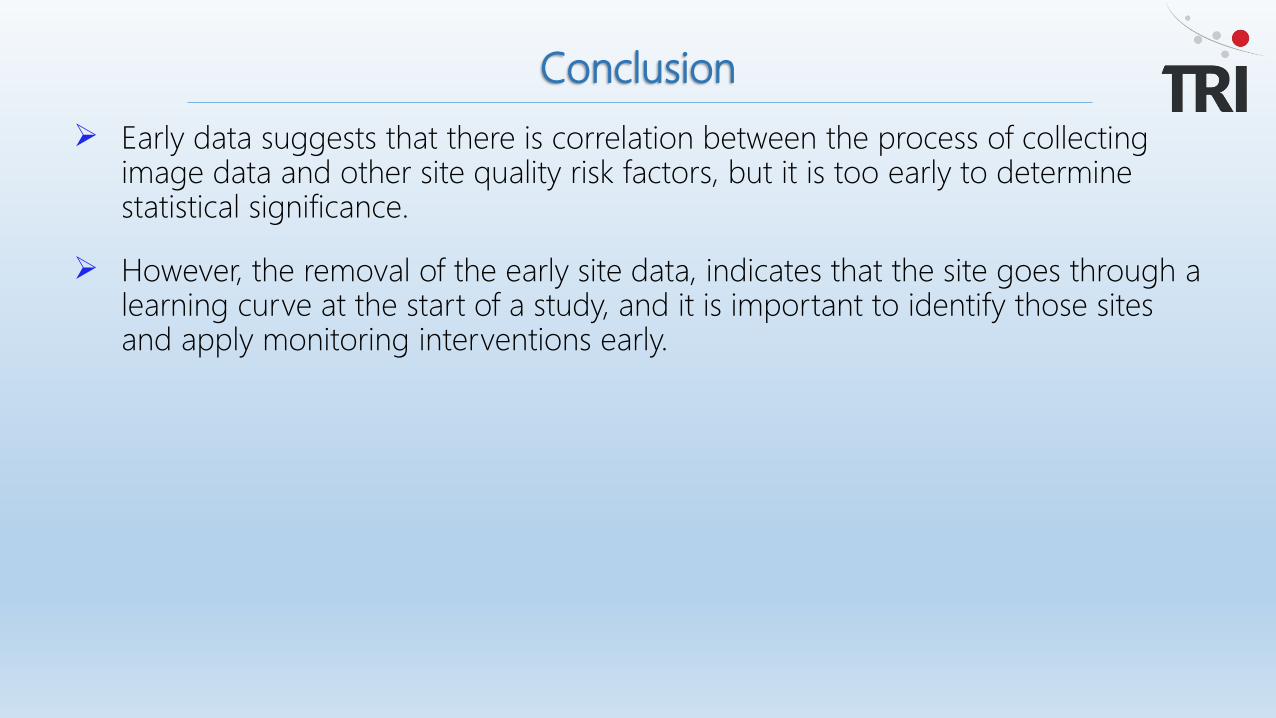
Early data suggests that there is correlation between the process of collecting image data and other site quality risk factors, but it is too early to determine statistical significance.
However, the removal of the early site data, indicates that the site goes through a learning curve at the start of a study, and it is important to identify those sites and apply monitoring interventions early.
Conclusion

Pre-activation indicators
Sites that demonstrate higher than normal time to test image acceptance and/or higher than normal number of cycles to acceptance will also demonstrate quality risks during study conduct
Sites that demonstrate higher than normal time and/or higher than normal number of cycles to finalise/approve critical documents e.g. contracts will also demonstrate quality risks during study conduct• Investigating the potential predictive nature of these 2 KRIs, could they signify the sites
propensity for lower than normal data quality, before FPI?
• Are there other similar processes that occur prior to FPI that could be investigated for correlation to data quality? e.g. more eTMF data
Next Steps

TRI – Where’s The Risk?
Join the official LinkedIn RBM Group, Risk-Based Monitoring in Clinical Trials and follow our LinkedIn Page, Triumph Research Intelligence!
Follow us on Twitter @TRI_OPRA_RBM
Visit us on www.tritrials.com or email at [email protected]
Thank you
…the risk-based monitoring company