TRF2 inhibits a cell-extrinsic pathway through which ...
22
ARTICLES TRF2 inhibits a cell-extrinsic pathway through which natural killer cells eliminate cancer cells Annamaria Biroccio 1,2,18,20 , Julien Cherfils-Vicini 3,18 , Adeline Augereau 1,3,18 , Sébastien Pinte 1,19 , Serge Bauwens 1 , Jing Ye 1,3,4 , Thomas Simonet 1 , Béatrice Horard 1 , Karine Jamet 3 , Ludovic Cervera 3 , Aaron Mendez-Bermudez 3 , Delphine Poncet 1,19 , Renée Grataroli 1 , Claire T’kint de Rodenbeeke 1 , Erica Salvati 2 , Angela Rizzo 2 , Pasquale Zizza 2 , Michelle Ricoul 5 , Céline Cognet 6,7 , Thomas Kuilman 8 , Helene Duret 9 , Florian Lépinasse 10,11 , Jacqueline Marvel 12 , Els Verhoeyen 13 , François-Loïc Cosset 13 , Daniel Peeper 8 , Mark J. Smyth 9,14 , Arturo Londoño-Vallejo 15 , Laure Sabatier 5 , Vincent Picco 3 , Gilles Pages 3 , Jean-Yves Scoazec 10,11 , Antonella Stoppacciaro 16 , Carlo Leonetti 2 , Eric Vivier 6,7 and Eric Gilson 1,3,17,20 Dysfunctional telomeres suppress tumour progression by activating cell-intrinsic programs that lead to growth arrest. Increased levels of TRF2, a key factor in telomere protection, are observed in various human malignancies and contribute to oncogenesis. We demonstrate here that a high level of TRF2 in tumour cells decreased their ability to recruit and activate natural killer (NK) cells. Conversely, a reduced dose of TRF2 enabled tumour cells to be more easily eliminated by NK cells. Consistent with these results, a progressive upregulation of TRF2 correlated with decreased NK cell density during the early development of human colon cancer. By screening for TRF2-bound genes, we found that HS3ST4 —a gene encoding for the heparan sulphate (glucosamine) 3-O -sulphotransferase 4—was regulated by TRF2 and inhibited the recruitment of NK cells in an epistatic relationship with TRF2. Overall, these results reveal a TRF2-dependent pathway that is tumour-cell extrinsic and regulates NK cell immunity. Telomeres are key features of chromosome termini that preserve genome integrity 1 and emerge as cellular integrators of various stresses 2 . Consequently, changes in their structure profoundly affect the ability of cells to proliferate and to adapt to a new environment. Cells respond intrinsically to the perception of telomere dysfunction resulting from their excessive shortening by initiating the DNA damage response (DDR) that leads to senescence or apoptosis. For instance, critically short telomeres are recognized as damaged DNA and signal growth arrest 3 . Consequently, telomere dysfunction prevents cancer progression through DDR activation 4–9 . 1 Laboratory of Molecular Biology of the Cell, CNRS UMR5239, IFR128, Ecole Normale Supérieure de Lyon, Lyon 69364, France. 2 Regina Elena National Cancer Institute, Rome 00158, Italy. 3 Institute for Research on Cancer and Aging, Nice (IRCAN), Nice University, CNRS UMR7284/INSERM U1081, Faculty of Medicine, Nice 06107, France. 4 Shanghai Jiaotong University, Shanghai Ruijin Hospital, Shanghai 200025, China. 5 Commissariat à l’Energie Atomique, DSV-Radiobiology and Oncology Unit, BP6 92265 Fontenay-aux-Roses, France. 6 Centre d’Immunologie de Marseille-Luminy, Aix-Marseille Université,UM2 INSERM UMR1104, CNRS UMR7280, Marseille 13288, France. 7 Hôpital de la Conception, Assistance Publique–Hôpitaux de Marseille, Marseille 13005, France. 8 Division of Molecular Genetics, The Netherlands Cancer Institute, 1066 CX Amsterdam, The Netherlands. 9 Cancer Immunology Program, Peter MacCallum Cancer Centre, St Andrews Place, East Melbourne, 3002 Victoria, Australia. 10 Hospices Civils de Lyon, Hôpital Edouard Herriot, Service d’Anatomie Pathologique, 69437 Lyon cedex 03, France. 11 INSERM, UMR1052, Faculté Laennec, 69372 Lyon cedex 08, France. 12 Université Lyon 1, IFR128, Institut National de la Santé et de la Recherche Médicale, U851, Lyon 69366, France. 13 INSERM U758. ENS de Lyon, 46 Allee d’Italie, 69364 Lyon Cedex 07, France. 14 Immunology in Cancer and Infection, Queensland Institute of Medical Research, 300 Herston Road, Herston, 4006 Queensland, Australia. 15 UMR3244, Institut Curie-UPMC-CNRS 26, rue d’Ulm, 75248 Paris, France. 16 Experimental Medicine and Pathology Department II Faculty, S. Andrea, Rome 00189, Italy. 17 Department of Medical Genetics, Archet 2 Hospital, CHU of Nice, BP 3079, 06202 Nice cedex 3, France. 18 These authors contributed equally to this work. 19 Present addresses: Biology Institute of Lille, CNRS UMR8161, Pasteur Institute of Lille, BP 447, 59021, LILLE cedex, France (S.P.); EA 3738, Laboratoire de Radiobiologie Cellulaire et Moléculaire, Faculté de Médecine Lyon-sud, 69 921 Oullins cedex, Lyon, France (D.P.). 20 Correspondence should be addressed to A.B or E.G. (e-mail: [email protected] or [email protected]) Received 25 February 2013; accepted 1 May 2013; published online 23 June 2013; DOI: 10.1038/ncb2774 The integrity of telomeres depends on at least two types of mechanism. The first relies on telomerase, which can compensate for replicative erosion 1,10 . The second relies on a particular chromatin organization protecting chromosome ends from aberrant signalization and repair 11 . The chromatin-mediated pathway depends on the binding of several telomeric DNA-binding proteins, including the shelterin complex 12 . The shelterin protein TRF2 (telomere repeats binding factor 2) is at the heart of the molecular events that maintain telomere integrity in mammals 13,14 and is essential for embryogenesis 15 . At 818 NATURE CELL BIOLOGY VOLUME 15 | NUMBER 7 | JULY 2013 © 2013 Macmillan Publishers Limited. All rights reserved.
Transcript of TRF2 inhibits a cell-extrinsic pathway through which ...

ART I C L E S
TRF2 inhibits a cell-extrinsic pathway through whichnatural killer cells eliminate cancer cellsAnnamaria Biroccio1,2,18,20, Julien Cherfils-Vicini3,18, Adeline Augereau1,3,18, Sébastien Pinte1,19, Serge Bauwens1,Jing Ye1,3,4, Thomas Simonet1, Béatrice Horard1, Karine Jamet3, Ludovic Cervera3, Aaron Mendez-Bermudez3,Delphine Poncet1,19, Renée Grataroli1, Claire T’kint de Rodenbeeke1, Erica Salvati2, Angela Rizzo2,Pasquale Zizza2, Michelle Ricoul5, Céline Cognet6,7, Thomas Kuilman8, Helene Duret9, Florian Lépinasse10,11,Jacqueline Marvel12, Els Verhoeyen13, François-Loïc Cosset13, Daniel Peeper8, Mark J. Smyth9,14,Arturo Londoño-Vallejo15, Laure Sabatier5, Vincent Picco3, Gilles Pages3, Jean-Yves Scoazec10,11,Antonella Stoppacciaro16, Carlo Leonetti2, Eric Vivier6,7 and Eric Gilson1,3,17,20
Dysfunctional telomeres suppress tumour progression by activating cell-intrinsic programs that lead to growth arrest. Increasedlevels of TRF2, a key factor in telomere protection, are observed in various human malignancies and contribute to oncogenesis. Wedemonstrate here that a high level of TRF2 in tumour cells decreased their ability to recruit and activate natural killer (NK) cells.Conversely, a reduced dose of TRF2 enabled tumour cells to be more easily eliminated by NK cells. Consistent with these results,a progressive upregulation of TRF2 correlated with decreased NK cell density during the early development of human colon cancer.By screening for TRF2-bound genes, we found that HS3ST4—a gene encoding for the heparan sulphate (glucosamine)3-O -sulphotransferase 4—was regulated by TRF2 and inhibited the recruitment of NK cells in an epistatic relationship with TRF2.Overall, these results reveal a TRF2-dependent pathway that is tumour-cell extrinsic and regulates NK cell immunity.
Telomeres are key features of chromosome termini that preservegenome integrity1 and emerge as cellular integrators of variousstresses2. Consequently, changes in their structure profoundly affectthe ability of cells to proliferate and to adapt to a new environment.Cells respond intrinsically to the perception of telomere dysfunctionresulting from their excessive shortening by initiating the DNA damageresponse (DDR) that leads to senescence or apoptosis. For instance,critically short telomeres are recognized as damaged DNA and signalgrowth arrest3. Consequently, telomere dysfunction prevents cancerprogression through DDR activation4–9.
1Laboratory of Molecular Biology of the Cell, CNRS UMR5239, IFR128, Ecole Normale Supérieure de Lyon, Lyon 69364, France. 2Regina Elena National CancerInstitute, Rome 00158, Italy. 3Institute for Research on Cancer and Aging, Nice (IRCAN), Nice University, CNRS UMR7284/INSERM U1081, Faculty of Medicine,Nice 06107, France. 4Shanghai Jiaotong University, Shanghai Ruijin Hospital, Shanghai 200025, China. 5Commissariat à l’Energie Atomique, DSV-Radiobiology andOncology Unit, BP6 92265 Fontenay-aux-Roses, France. 6Centre d’Immunologie de Marseille-Luminy, Aix-Marseille Université,UM2 INSERM UMR1104, CNRSUMR7280, Marseille 13288, France. 7Hôpital de la Conception, Assistance Publique–Hôpitaux de Marseille, Marseille 13005, France. 8Division of MolecularGenetics, The Netherlands Cancer Institute, 1066 CX Amsterdam, The Netherlands. 9Cancer Immunology Program, Peter MacCallum Cancer Centre, St Andrews Place,East Melbourne, 3002 Victoria, Australia. 10Hospices Civils de Lyon, Hôpital Edouard Herriot, Service d’Anatomie Pathologique, 69437 Lyon cedex 03, France.11INSERM, UMR1052, Faculté Laennec, 69372 Lyon cedex 08, France. 12Université Lyon 1, IFR128, Institut National de la Santé et de la Recherche Médicale,U851, Lyon 69366, France. 13INSERM U758. ENS de Lyon, 46 Allee d’Italie, 69364 Lyon Cedex 07, France. 14Immunology in Cancer and Infection, QueenslandInstitute of Medical Research, 300 Herston Road, Herston, 4006 Queensland, Australia. 15UMR3244, Institut Curie-UPMC-CNRS 26, rue d’Ulm, 75248 Paris,France. 16Experimental Medicine and Pathology Department II Faculty, S. Andrea, Rome 00189, Italy. 17Department of Medical Genetics, Archet 2 Hospital, CHU ofNice, BP 3079, 06202 Nice cedex 3, France. 18These authors contributed equally to this work. 19Present addresses: Biology Institute of Lille, CNRS UMR8161,Pasteur Institute of Lille, BP 447, 59021, LILLE cedex, France (S.P.); EA 3738, Laboratoire de Radiobiologie Cellulaire et Moléculaire, Faculté de Médecine Lyon-sud,69 921 Oullins cedex, Lyon, France (D.P.).20Correspondence should be addressed to A.B or E.G. (e-mail: [email protected] or [email protected])
Received 25 February 2013; accepted 1 May 2013; published online 23 June 2013; DOI: 10.1038/ncb2774
The integrity of telomeres depends on at least two types ofmechanism. The first relies on telomerase, which can compensatefor replicative erosion1,10. The second relies on a particular chromatinorganization protecting chromosome ends from aberrant signalizationand repair11. The chromatin-mediated pathway depends on thebinding of several telomeric DNA-binding proteins, including theshelterin complex12.The shelterin protein TRF2 (telomere repeats binding factor 2)
is at the heart of the molecular events that maintain telomereintegrity in mammals13,14 and is essential for embryogenesis15. At
818 NATURE CELL BIOLOGY VOLUME 15 | NUMBER 7 | JULY 2013
© 2013 Macmillan Publishers Limited. All rights reserved.
ART I C L E S
pWPIR
pWPIR
-hTR
F2
pWPIR
-hTR
F2dn
Scram
ble shR
NA
0
200
400
600
Tu
mo
ur
vo
lum
e (m
m3)
0 5 10 15 200
20
40
60
80
100
pWPIR
pWPIR-hTRF2
pWPIR-TRF2dn
0 5 10 15 200
20
40
60
80
100
Perc
en
tag
e o
f
tum
ou
r-fr
ee m
ice
Scramble shRNA
hTERF2 shRNA1
0
200
400
600
0 10 20 300
20
40
60
80
100
Overa
ll su
rviv
al
0
20
40
60
80
100
Overa
ll su
rviv
al
pWPIR
pWPIR-mTRF2
0 10 20 30 40
Scramble shRNA
mTERF2 shRNA1
mTERF2 shRNA2
0 5 10 15
Time (days) Time (days) Time (days)
Perc
en
tag
e o
f
tum
ou
r-fr
ee m
ice
0 5 10 150
20
40
60
80
100
Time (days)
Time (days) Time (days)
pWPIR
pWPIR-mTRF2
0 5 10 15 20
Time (days)
Scramble shRNA
mTERF2 shRNA1
mTERF2 shRNA2
0 5 10 15 200
1,000
2,000
3,000
4,000
Time (days)
pWPIR
pWPIR-mTRF2
b
∗∗
∗ ∗
B1
6F
10
Tu
mo
ur
vo
lum
e (m
m3)
a
0
1,000
2,000
3,000
4,000
Tu
mo
ur
vo
lum
e (m
m3)
Tu
mo
ur
vo
lum
e (m
m3)
0
200
400
600
Tu
mo
ur
vo
lum
e (m
m3)
∗
∗∗
∗∗∗
∗
∗
∗ ∗
∗∗
∗∗∗
∗∗∗
∗
∗ ∗ ∗
c
B1
6F
10
Perc
en
tag
e o
f
tum
ou
r-fr
ee m
ice
BJ-H
EL
TR
as
Perc
en
tag
e o
f
tum
ou
r-fr
ee m
ice
e
d
∗∗∗
∗∗
∗
f
∗∗∗
∗∗
∗∗∗
∗∗∗
∗∗
∗∗
∗∗
pWPIR
-mTR
F2
pWPIR
mTE
RF2 sh
RNA2
mTE
RF2 sh
RNA1
Scram
ble shR
NA
hTERF2
shRNA1
Scramble shRNA
mTERF2 shRNA1
mTERF2 shRNA2
0
20
40
60
80
100
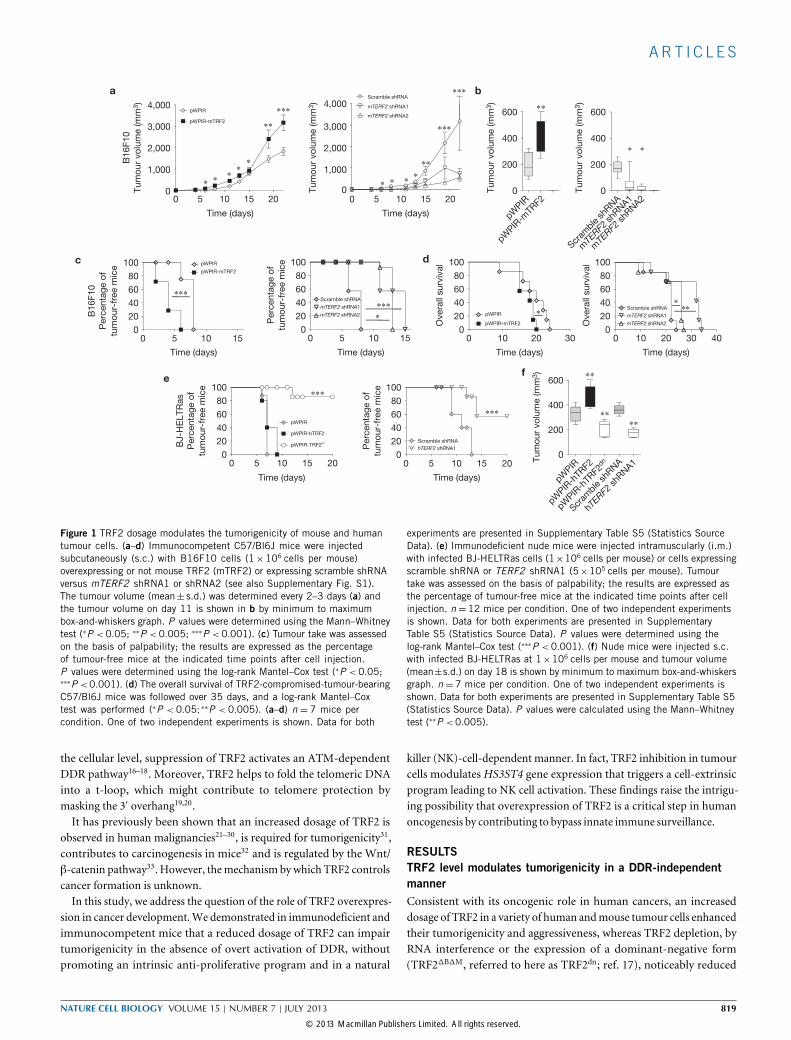
Figure 1 TRF2 dosage modulates the tumorigenicity of mouse and humantumour cells. (a–d) Immunocompetent C57/Bl6J mice were injectedsubcutaneously (s.c.) with B16F10 cells (1×10⁶ cells per mouse)overexpressing or not mouse TRF2 (mTRF2) or expressing scramble shRNAversus mTERF2 shRNA1 or shRNA2 (see also Supplementary Fig. S1).The tumour volume (mean± s.d.) was determined every 2–3 days (a) andthe tumour volume on day 11 is shown in b by minimum to maximumbox-and-whiskers graph. P values were determined using the Mann–Whitneytest (∗P <0.05; ∗∗P <0.005; ∗∗∗P <0.001). (c) Tumour take was assessedon the basis of palpability; the results are expressed as the percentageof tumour-free mice at the indicated time points after cell injection.P values were determined using the log-rank Mantel–Cox test (∗P <0.05;∗∗∗P <0.001). (d) The overall survival of TRF2-compromised-tumour-bearingC57/Bl6J mice was followed over 35 days, and a log-rank Mantel–Coxtest was performed (∗P < 0.05;∗∗P < 0.005). (a–d) n = 7 mice percondition. One of two independent experiments is shown. Data for both
experiments are presented in Supplementary Table S5 (Statistics SourceData). (e) Immunodeficient nude mice were injected intramuscularly (i.m.)with infected BJ-HELTRas cells (1×10⁶ cells per mouse) or cells expressingscramble shRNA or TERF2 shRNA1 (5×10⁵ cells per mouse). Tumourtake was assessed on the basis of palpability; the results are expressed asthe percentage of tumour-free mice at the indicated time points after cellinjection. n =12 mice per condition. One of two independent experimentsis shown. Data for both experiments are presented in SupplementaryTable S5 (Statistics Source Data). P values were determined using thelog-rank Mantel–Cox test (∗∗∗P <0.001). (f) Nude mice were injected s.c.with infected BJ-HELTRas at 1×10⁶ cells per mouse and tumour volume(mean±s.d.) on day 18 is shown by minimum to maximum box-and-whiskersgraph. n =7 mice per condition. One of two independent experiments isshown. Data for both experiments are presented in Supplementary Table S5(Statistics Source Data). P values were calculated using the Mann–Whitneytest (∗∗P <0.005).
the cellular level, suppression of TRF2 activates an ATM-dependentDDR pathway16–18. Moreover, TRF2 helps to fold the telomeric DNAinto a t-loop, which might contribute to telomere protection bymasking the 3′ overhang19,20.It has previously been shown that an increased dosage of TRF2 is
observed in human malignancies21–30, is required for tumorigenicity31,contributes to carcinogenesis in mice32 and is regulated by the Wnt/β-catenin pathway33. However, themechanism bywhich TRF2 controlscancer formation is unknown.In this study, we address the question of the role of TRF2 overexpres-
sion in cancer development.We demonstrated in immunodeficient andimmunocompetent mice that a reduced dosage of TRF2 can impairtumorigenicity in the absence of overt activation of DDR, withoutpromoting an intrinsic anti-proliferative program and in a natural
killer (NK)-cell-dependent manner. In fact, TRF2 inhibition in tumourcells modulates HS3ST4 gene expression that triggers a cell-extrinsicprogram leading to NK cell activation. These findings raise the intrigu-ing possibility that overexpression of TRF2 is a critical step in humanoncogenesis by contributing to bypass innate immune surveillance.
RESULTSTRF2 level modulates tumorigenicity in a DDR-independentmannerConsistent with its oncogenic role in human cancers, an increaseddosage of TRF2 in a variety of human andmouse tumour cells enhancedtheir tumorigenicity and aggressiveness, whereas TRF2 depletion, byRNA interference or the expression of a dominant-negative form(TRF21B1M, referred to here as TRF2dn; ref. 17), noticeably reduced
NATURE CELL BIOLOGY VOLUME 15 | NUMBER 7 | JULY 2013 819
© 2013 Macmillan Publishers Limited. All rights reserved.

ART I C L E S
a b B16F10
0 50 100 150 2000
50
100
150
200
Time (h)
0 50 100 150 200
Time (h)
Perc
en
tag
e o
f
red
uced
ala
mar
blu
e
0
50
100
150
200
Perc
en
tag
e o
f
red
uced
ala
mar
blu
e
pWPIRpWPIR-mTRF2pWPIR + bleomycin
B16F10
∗
∗
∗
Scramble shRNAmTERF2 shRNA1mTERF2 shRNA2
BJ-HELTRas
BJ-HELTRas
Mean
nu
mb
er
of
co
lon
ies
Mean
nu
mb
er
of
co
lon
ies
BJ-HELTd
pW
PIR
pW
PIR
-hT
RF
2
pW
PIR
-hT
RF
2d
n
D5
70
nm
0.4
0.3
0.2
0.1
0
e
f
pWPIR pWPIR-hTRF2 pWPIR-hTRF2dn
BJ-H
ELT
Ras
BJ-H
ELT
Ras
pc
WI3
8
BJ-HELTRas
Annexin V
DNA content
G0/G1 = 44.6
S = 37.7
G2/M = 17.7
G0/G1 = 47.1
S = 37.2
G2/M = 15.7
6.5% 7.2%
Nu
mb
er
of
cells
Fo
rward
scatt
er
pWPIR pWPIR-TRF2 pWPIR-TRF2dn
G0/G1 = 46.5
S = 36.1
G2/M = 17.4
7.5%
580 560
512 532 492
144
c
pWPIR
pWPIR-hTRF2dn
pWPIR-hTRF2
Number of cells plated Number of cells plated
0
0
100 101 102 103 104 100 101 102 103 104 100 101 102 103 104
200
400
600
800
1,000
0
200
400
600
800
1,000
0
200
400
600
800
1,000
0 200 400 600 8001,000 0 200 400 600 8001,000 0 200 400 600 8001,000
120
240
360
480
600
0
120
240
360
480
600
0
120
240
360
480
600
0 0
20
40
60
80
50 100 200 50 100 200
10
20
30
40
pWPIR pWPIR-mTRF2 pWPIR + bleomycin
Scramble shRNA mTERF2 shRNA1 mTERF2 shRNA2
pWPIR
pWPIR-hTRF2dn
pWPIR-hTRF2
Figure 2 Partial TRF2 inhibition does not impair in vitro growth propertiesof various tumour cell lines. (a) The viability of transduced B16F10 cellswas determined at the indicated times by a colorimetric assay. Bleomycinwas used as a negative control for cell growth. Data represent mean±s.d.of n =3 independent experiments; P values were calculated using t test(∗P < 0.05). (b) The clonogenicity of the different transduced B16F10cells was analysed using a colony assay. After 7 days, the clones werefixed and stained with crystal violet. Data represent n = 3 independentexperiments. (c) Cells were infected with the indicated lentiviral vectors andviability was determined in two independent experiments after 10 days ofculture using the MTT assay. The attenuance (D ) was measured at 570nm.Mean±s.d., n =3 independent wells. One of two independent experimentsis shown. Data for both experiments are presented in Supplementary Table
S5 (Statistics Source Data). (d) To evaluate the ability to form colonies,increasing numbers of indicated cells from each condition were plated andcolonies were quantified at 10 days. Data represent the mean±s.d. of n=3independent experiments. (e) Transduced BJ-HELTRas cells were subjectedto an SA-β-galactosidase assay to visualize senescence. Senescent WI38cells were used as a positive control. Images representative of 3 independentexperiments are shown. Scale bar, 10 µm. (f) A flow cytometry analysis of theDNA content (upper panel) and Annexin V staining (lower panel) performedin BJHELT-Ras cells infected with a control lentiviral vector (pWPIR) orlentivirus expressing the wild-type (TRF2) or dominant-negative (TRF2dn)form of TRF2. The numbers reported in the Annexin V+ region of eachhistogram represent the percentage of apoptotic cells. Data are from oneexperiment performed in triplicate.
tumour growth (Fig. 1 and Supplementary Fig. S1 and Table S1).The effect of TRF2 modulation on the tumorigenic potential ofseveral cancer lines cannot be merely explained by variation in growthrate, viability, clonogenicity, senescence or apoptosis during their
in vitro expansion and it appeared also distinct from the effectsof the TRF2-binding protein Rap1 on NF-κB (ref. 34; Fig. 2 andSupplementary Fig. S2a–d). Similarly, the anti-tumour effects of TRF2inhibition cannot be attributed to DDR activation because the level of
820 NATURE CELL BIOLOGY VOLUME 15 | NUMBER 7 | JULY 2013
© 2013 Macmillan Publishers Limited. All rights reserved.
ART I C L E S
β-actin
p21
p-ATM
ATM
Chk2Chk1
p-Chk1
p-Chk2
p-p38
p38
p16
p27
a
pW
PIR
-hT
RF
2p
WP
IR-h
TR
F2
dn
pW
PIR
pW
PIR
-TR
F2
pW
PIR
-TR
F2
dn
pW
PIR
BJ-HELT
BJ-
HELTRas
c
Myc–TRF2Myc–TRF2dn
b
TRF1 53BP1
TIF
Scramble shRNA TERF2 shRNA1
Scramble shRNA TERF2 shRNA1
BJ-H
ELT
BJ-H
ELT
Ras
pWPIRpWPIR-hTRF2dn
pW
PIR
pW
PIR
-hT
RF
2
pW
PIR
-hT
RF
2d
n
0
2
4
6
8
10
pW
PIR
pW
PIR
-hT
RF
2d
n
Scra
mb
le s
hR
NA
TER
F2 s
hR
NA
1
pW
PIR
-hT
RF
2
BJ-HELT BJ-HELTRas
∗∗∗
∗∗∗
Scra
mb
le s
hR
NA
TER
F2 s
hR
NA
1
12
pW
PIR
pW
PIR
-hT
RF
2d
n
pW
PIR
-hT
RF
2
MDA-MB231
pW
PIR
pW
PIR
-hT
RF
2d
n
HeLa
∗∗∗
14
16
Mean n
um
ber
of
TIF
per
nucle
us
pW
PIR
pW
PIR
-mT
RF
2
Scra
mb
le s
hR
NA
mTE
RF2
shR
NA
1
mTE
RF2
shR
NA
2
B16F1018
BJ-HELTRaspc BJ-HELTRas
pW
PIR
pW
PIR
-hT
RF
2
pW
PIR
-hT
RF
2d
n
pW
PIR
pW
PIR
-hT
RF
2
pW
PIR
-hT
RF
2d
n
e
d
Telomere
fusion
Telomere
breakage
Perc
enta
ge o
f chro
mo
so
mes
0
5
10
20
25
30
35
40
15
2,503 2,585
2,124
2,276
2,618
2,644
BJ-
HELTRas
TRF2
β-actin
BJ-HELT
TER
F2 s
hR
NA
2
TER
F2 s
hR
NA
2
Scra
mb
le s
hR
NA
Scra
mb
le s
hR
NA
pWPIR pWPIR-hTRF2dn
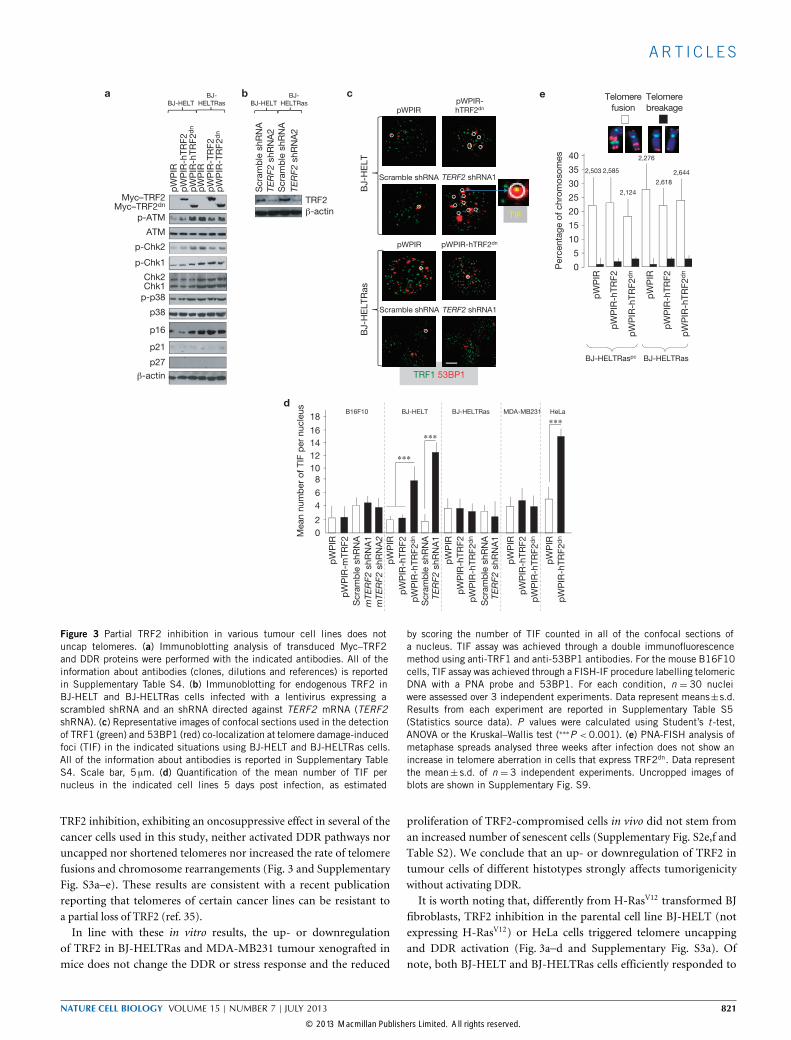
Figure 3 Partial TRF2 inhibition in various tumour cell lines does notuncap telomeres. (a) Immunoblotting analysis of transduced Myc–TRF2and DDR proteins were performed with the indicated antibodies. All of theinformation about antibodies (clones, dilutions and references) is reportedin Supplementary Table S4. (b) Immunoblotting for endogenous TRF2 inBJ-HELT and BJ-HELTRas cells infected with a lentivirus expressing ascrambled shRNA and an shRNA directed against TERF2 mRNA (TERF2shRNA). (c) Representative images of confocal sections used in the detectionof TRF1 (green) and 53BP1 (red) co-localization at telomere damage-inducedfoci (TIF) in the indicated situations using BJ-HELT and BJ-HELTRas cells.All of the information about antibodies is reported in Supplementary TableS4. Scale bar, 5 µm. (d) Quantification of the mean number of TIF pernucleus in the indicated cell lines 5 days post infection, as estimated
by scoring the number of TIF counted in all of the confocal sections ofa nucleus. TIF assay was achieved through a double immunofluorescencemethod using anti-TRF1 and anti-53BP1 antibodies. For the mouse B16F10cells, TIF assay was achieved through a FISH-IF procedure labelling telomericDNA with a PNA probe and 53BP1. For each condition, n = 30 nucleiwere assessed over 3 independent experiments. Data represent means±s.d.Results from each experiment are reported in Supplementary Table S5(Statistics source data). P values were calculated using Student’s t -test,ANOVA or the Kruskal–Wallis test (∗∗∗P <0.001). (e) PNA-FISH analysis ofmetaphase spreads analysed three weeks after infection does not show anincrease in telomere aberration in cells that express TRF2dn. Data representthe mean± s.d. of n = 3 independent experiments. Uncropped images ofblots are shown in Supplementary Fig. S9.
TRF2 inhibition, exhibiting an oncosuppressive effect in several of thecancer cells used in this study, neither activated DDR pathways noruncapped nor shortened telomeres nor increased the rate of telomerefusions and chromosome rearrangements (Fig. 3 and SupplementaryFig. S3a–e). These results are consistent with a recent publicationreporting that telomeres of certain cancer lines can be resistant toa partial loss of TRF2 (ref. 35).In line with these in vitro results, the up- or downregulation
of TRF2 in BJ-HELTRas and MDA-MB231 tumour xenografted inmice does not change the DDR or stress response and the reduced
proliferation of TRF2-compromised cells in vivo did not stem froman increased number of senescent cells (Supplementary Fig. S2e,f andTable S2). We conclude that an up- or downregulation of TRF2 intumour cells of different histotypes strongly affects tumorigenicitywithout activating DDR.It is worth noting that, differently from H-RasV12 transformed BJ
fibroblasts, TRF2 inhibition in the parental cell line BJ-HELT (notexpressing H-RasV12) or HeLa cells triggered telomere uncappingand DDR activation (Fig. 3a–d and Supplementary Fig. S3a). Ofnote, both BJ-HELT and BJ-HELTRas cells efficiently responded to
NATURE CELL BIOLOGY VOLUME 15 | NUMBER 7 | JULY 2013 821
© 2013 Macmillan Publishers Limited. All rights reserved.

ART I C L E S
50 100 200
IL-6 shRNA2 – – + + – –– – – – + +
– – + + – –– – – –
– – + +– – – –
– – + +– – – –+ +IL-6 shRNA4
TIFs
a
Rela
tive IL
-6 m
RN
A level
80
72
64
56
48
40
32
24
12
80
IL-6 shRNA4
BJ-HELT BJ-HELTRas MDA-
MB231
HeLa
IL-6 shRNA2
Scramble shRNA + – –
– + –
– – +
+ – –
– + –
– –
+ –
– –
– +
+ –
– –
– ++
0.3
± 0
.05
2 ±
0.5
0.3
± 0
.04
0.3
5 ±
0.0
5
1
pWPIR-hTRF2dn + IL-6 shRNA2/4
pWPIR-hTRF2dn + scramble shRNA
Mean n
um
ber
of
TIF
per
nucle
us
0
2
4
6
8
10
12
14
∗∗
∗∗∗
∗∗∗
∗∗∗ ∗∗∗
b Scramble shRNA
pW
PIR
-hT
RF
2d
np
WP
IR
cBJ-HELT MDA-MB231 HeLaBJ-HELTRas
pWPIR + scramble shRNA pWPIR + IL-6 shRNA2/4
IL-6 shRNA2
TRF1 53BP1
vIL-6
MOI = 2
Mean n
um
ber
of
co
lonie
s
Number of cells plated
pWPIR
pWPIR-TRF2dn
vE
50
45
40
35
30
25
20
15
10
0
Scramble shRNA
IL-6 shRNA2
IL-6 shRNA2
Scramble shRNA
Mean n
um
ber
of
co
lonie
s
80
70
60
50
40
30
20
10
0
Number of cells plated
50 100 200
pWPIR
pWPIR-TRF2dn
Rela
tive IL
-6 m
RN
A level
pWPIR
MOI : 5vE vEvIL-6 vIL-6 vIL-6 vIL-6 vE vEvIL-6 vIL-6 vIL-6vIL-6
2 5 5 2 5
Mean n
um
ber
of
TIF
per
nucle
us
0
2
4
6
8
10
12
14
16
pWPIR-
TRF2dn
100
80
60
40
20
01 1
pWPIR
MOI : 5 2 5 5 2 5
pWPIR-
TRF2dn
+
++
+
+
+
+
+
+
+
+
+
+
++
+ +
+
+
+
×
×
××
×
×
××××××
× ××
×
×
×
××
+
+
+
+
++×
× ×
×
+
+
×
×
×
+++
+×
×
+
×
×
+++
++
×
×
×
×
+
×
×
+×
d ge f
Figure 4 IL-6 is necessary and sufficient to prevent telomere uncappingon TRF2 partial inhibition. (a) The indicated cells were analysed forIL6 transcript levels by qRT-PCR. Levels are represented relative tothose found in control-infected BJ-HELT cells, as mean± s.d. from 3independent experiments. (b) Quantification of the mean number oftelomere damage-induced foci (TIF) per nucleus in the indicated cell lines5 days post infection, estimated by scoring the number of TIF counted inall of the confocal sections of a nucleus. n =30 nuclei were analysed foreach condition assessed over 3 independent experiments and the data showthe mean±s.d., ∗∗P <0.005; ∗∗∗P <0.001 with Student’s t -test, ANOVAor the Kruskal–Wallis test. (c) Representative images of confocal sectionsfrom BJ-HELTRas cells used to detect TRF1 and 53BP1 co-localization inthe indicated situations. Scale bar, 2 µm. (d) In the indicated situations of
transduced BJ-HELTRas cells, the clonogenic ability is determined as thenumber of viable colonies issued from the indicated number of plated cells.Data are from 1 experiment performed in triplicate. All values are plotted onthe graph. (e) TIF analysis of BJ-HELT cells infected with a control emptylentivirus (vE) or with a lentivirus expressing full-length IL-6 (vIL-6) at theindicated MOI (multiplicity of infection), in the presence or not of TRF2dn.n=30 nuclei were analysed for each condition assessed over 2 independentexperiments; the data represent the mean±s.d. (f) Samples from e wereanalysed for IL-6 mRNA levels by qRT-PCR in a single experiment. Levelsare represented relative to those found in cells infected with the emptycontrol (vE=1) as mean±s.d. (g) Clonogenicity determined as in d withvarious situations of transduced BJ-HELT cells. Data from one experimentperformed in triplicate. All values are plotted on the graph.
γ-ray irradiation (Supplementary Fig. S3f–h), excluding a generalimpairment of DDR pathways. As expected36–38, the ectopic expressionof H-RasV12 in BJ-HELT cells triggered a marked increase in theexpression of IL-6 (Fig. 4a). A high level of IL-6 expression is alsoobserved in MDA-MB231 cells, expressing a mutated K-Ras isoform39,but not in HeLa cells, revealing a striking correlation between TRF2resistance and a high level of IL-6 expression (Fig. 4a).The link between IL6 expression and telomere resistance to TRF2
dysfunction was directly assessed by showing that, on one hand, areduced IL-6 expression by two different short hairpin RNAs (shRNAs)restored the sensitivity of BJ-HELTRas and MDA-MB231 cells toTRF2 dysfunction (Fig. 4b–d and Supplementary Fig. S4a) and, onthe other hand, an ectopic expression of IL-6 in BJ-HELT cells wassufficient to render the cells resistant to TRF2 dysfunction (Fig. 4e–gand Supplementary Fig. S4b). We conclude that a high level of IL-6expression in transformed cells can protect telomeres from DDRactivation in response to a partial loss of TRF2 function.
TRF2 level in tumour cells modulates NK cell mobilizationThe above results show that the oncogenic properties of TRF2 can beuncoupled from a cell-autonomous pathway of telomere protectionand growth control, raising the interesting possibility that TRF2triggers cell non-autonomous functions. In agreement with thisview, TRF2-compromised cells exerted an oncosuppressive paracrineeffect on RasV12-transformed fibroblasts when both types of cell wereco-injected into mice (Supplementary Table S1).Therefore, we explored whether TRF2 could modify the tumour
microenvironment by examining immune cell infiltration intoMatrigelplugs after the subcutaneous injection of B16F10 cells. Neither theup- nor the downregulation of mouse TRF2 (mTRF2) modulated theglobal infiltration of CD45+ cells or CD45+CD3+ T cells (Fig. 5a,b andSupplementary Fig. S5a,b). In contrast, the modulation of mTRF2markedly affected NK cell infiltration, as revealed by the presenceof NKp46+CD3− cells (Fig. 5c,d), and activation, as determined byscoring NK cells positive for the activation markers CD107a and
822 NATURE CELL BIOLOGY VOLUME 15 | NUMBER 7 | JULY 2013
© 2013 Macmillan Publishers Limited. All rights reserved.

ART I C L E S
0
20
40
60
80
100P
erc
en
tag
e o
f
CD
45+
cells
0
20
40
60
80
100
Perc
enta
ge o
f
CD
45+
cells
a b
e
∗∗
c
NK
p46
CD3
0
10
20
30
0
10
20
30
Perc
en
tag
e o
f
CD
45+
CD
3+
cells
Scram
ble shR
NA
mTE
RF2 shR
NA1
mTE
RF2 shR
NA2
Perc
en
tag
e o
f
CD
45+
CD
3+
cells
NKp46+ CD3– cells
Empty
mTR
F2 W
T0
5
10
15
20
Perc
en
tag
e o
f
CD
3– N
Kp
46+
cells
∗
∗∗NKp46+ CD3– cells
Scram
ble shR
NA
Scram
ble shR
NA
mTE
RF2 shR
NA1
mTE
RF2 shR
NA1
mTE
RF2 shR
NA2
0
5
10
15
20
Perc
en
tag
e o
f
CD
3– N
Kp
46
+ c
ells
NK
p46
CD3
Perc
en
tag
e o
f
CD
107
a+
cells
0
20
40
60 ∗ CD107a+ NKp46+ cells
15,5%
SS
C
CD107a
Scramble shRNA
34,6% 15,6%
SS
CCD69
CD69+ NKp46+ cells
Scramble shRNA mTERF2 shRNA1
CD45+ cells CD45+ CD3+ cells
NKcells
NKcells
NKcells
NKcells
NKcells
36,6%
mTERF2 shRNA1
d
Scram
ble shR
NA
pWPIR
pWPIR
-mTR
F2
pWPIR
pWPIR
-mTR
F2
mTE
RF2 shR
NA1
mTE
RF2 shR
NA2
Perc
en
tag
e o
f
CD
69
+ c
ells
0
20
40
60 ∗f
Scram
ble shR
NA
mTE
RF2 sh
RNA1
CD107+ CD107+ CD69+ CD69+
pWPIR pWPIR-mTRF2
Scramble shRNA mTERF2 shRNA1 mTERF2 shRNA2
Figure 5 The modulation of tumorigenicity by TRF2 dosage correlates withNK cell recruitment and activation. (a–d) Immune recruitment inducedby mTRF2 in B16F10 cells was assayed using Matrigel plugs. SevenC57/Bl6J mice were injected s.c. with 1×10⁶ mTRF2-overexpressingB16F10 cells or mTERF2 -shRNA-expressing B16F10 cells in Matrigel.After 5 days of incubation, the immune infiltrate was examined by flowcytometry. Total immune cell infiltration (CD45+ cells) is representedin a, T lymphocyte infiltration (CD45+ CD3+ cells) is represented inb, and NK cell infiltration (CD45+CD3−NKp46+ cells) is representedin c,d as minimum to maximum box-and-whiskers graphs. n = 5 miceper condition. One of two independent experiments is shown. Data for
both experiments are presented in Supplementary Table S5 (StatisticsSource Data), and P values were determined using the Mann–Whitneytest (∗P < 0.05; ∗∗P < 0.005). (e,f) The activation of NK cells towardsTRF2-compromised B16F10 cells was examined using a Matrigel assay.The percentage of CD107a-positive and CD69-positive NK cells infiltratingthe Matrigel plugs was determined by flow cytometry 5 days after injectioninto C57/Bl6J mice (n =6 mice per group). Data from 1 experiment arerepresented with a minimum to maximum box-and-whiskers graph andare presented in Supplementary Table S5 (Statistics Source Data). Foreach panel, P values were determined using the Mann–Whitney test(∗P <0.05).
CD69 (Fig. 5e,f). The effects of TRF2 dosage on NK cell immunitywere not dependent on cell type or mouse background because anidentical correlation was observed with human TRF2 modulationin BJ-HELTRas cells injected into nude mice (Fig. 6a). That TRF2dn
tumour cells can activate NK cells was directly assayed by co-culturingmouse splenocytes with tumour cells expressing various amounts ofTRF2, showing that the production of IFN-γ by NK cells increased 24 hafter incubation with BJ-HELTRas TRF2dn cells (Fig. 6b).Consistent with these observations, as soon as 2 days after
cell injection, histological analysis revealed an inverse correlationbetween the density of NKp46+ cells and TRF2 dosage (Fig. 6c andSupplementary Fig. S5c,d and Table S2). Moreover, the high densityof NK cells triggered by TRF2 inhibition correlated with a strongincrease of IFN-γ in infiltrating cells (Fig. 6c and Supplementary TableS2), with a slight increase in apoptosis (Supplementary Table S2),
which may have resulted from the cytotoxic effects of NK cells, andfinally with less neovascularization, as revealed by a decreased numberof CD31+ cells (Fig. 6c and Supplementary Table S2). Confirmingthe specificity of the effect of TRF2 on NK cell infiltration observedin B16F10 cells, we found that the sites of the injection of TRF2-compromised BJ-HELTRas cells did not contain larger numbers ofinfiltrating macrophages, neutrophils or DEC-205+ dendritic cells(Supplementary Fig. S5d and Table S2), even though we cannot excludethe possibility that other types of dendritic cell or immunoregulatorycell may have been recruited.
The reduced tumorigenicity of TRF2-compromised cellsdepends on NK cellsThe above results, together with the observation that BJ-HELTRasTRF2-compromised cells did not form tumours in SCID or Rag1−/−
NATURE CELL BIOLOGY VOLUME 15 | NUMBER 7 | JULY 2013 823
© 2013 Macmillan Publishers Limited. All rights reserved.
ART I C L E S
0
20
40
60
80
100
pWPIR
pWPIR
-hTR
F2
pWPIR
-hTR
F2dn
0
2
4
6
8
10
Perc
enta
ge o
f N
Kp
46+
cells
Perc
enta
ge o
f N
Kp
46+
cells
Scram
ble shR
NA
TERF2
shRNA1
0
2
4
6
8
10
NKp46+ CD3– cells
∗∗
∗
∗∗
BJ-HELTRas +
pWPIR-hTRF2dn
d
12 16 200
40
20
60
80
100
–α-NK1.1 +α-NK1.1
Days post injection
Perc
enta
ge o
f tu
mo
ur–
free m
ice
10
2050
60
70
∗
Ki6
7N
Kp
46
IFN
-γC
D31
0
5
10
15
20
25
0
5
10
15
20 ∗ ∗
– –+ + – - + +– –+ +
∗ ∗f
KU-55933
pWPIR
pWPIR-hTRF2dn
+ +– – + +
–
– –+ +– –
– +– + – +– +– +– +
Perc
enta
ge o
f p
-AT
M+
cells
Perc
enta
ge o
f N
Kp
46+
cells
e
Perc
enta
ge o
f IF
Nγ+
NK
cells
IL-1
2 + IL
-18
pWPIR
-hTR
F2dn
pWPIR
-hTR
F2
pWPIR
Moc
k
+α-NK1.1 orα-IFN-γ
–α-NK1.1 orα-IFN-γ
Perc
enta
ge o
f IF
N-γ
+ c
ells
pWPIR
Scramble shRNA TERF2 shRNA1
pWPIR-hTRF2
pWPIR-hTRF2dn
(NK1.1-treatedmice)pWPIR-hTRF2dna b c
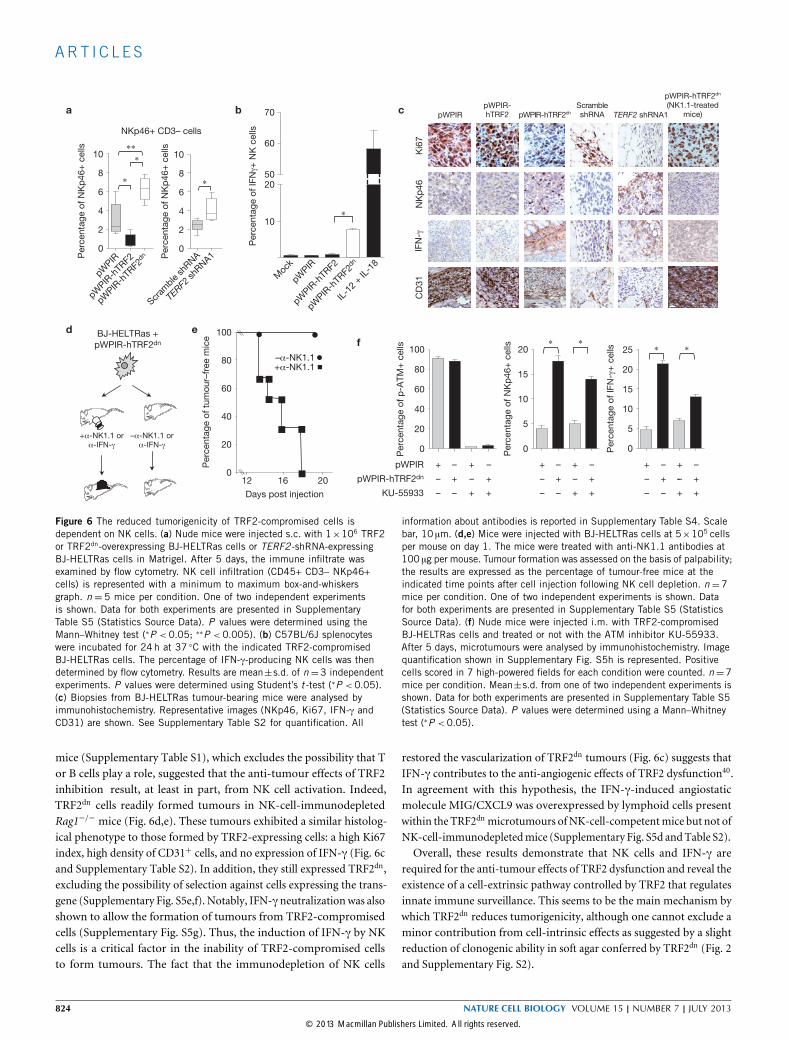
Figure 6 The reduced tumorigenicity of TRF2-compromised cells isdependent on NK cells. (a) Nude mice were injected s.c. with 1×10⁶ TRF2or TRF2dn-overexpressing BJ-HELTRas cells or TERF2 -shRNA-expressingBJ-HELTRas cells in Matrigel. After 5 days, the immune infiltrate wasexamined by flow cytometry. NK cell infiltration (CD45+ CD3– NKp46+cells) is represented with a minimum to maximum box-and-whiskersgraph. n = 5 mice per condition. One of two independent experimentsis shown. Data for both experiments are presented in SupplementaryTable S5 (Statistics Source Data). P values were determined using theMann–Whitney test (∗P < 0.05; ∗∗P < 0.005). (b) C57BL/6J splenocyteswere incubated for 24h at 37 ◦C with the indicated TRF2-compromisedBJ-HELTRas cells. The percentage of IFN-γ-producing NK cells was thendetermined by flow cytometry. Results are mean±s.d. of n=3 independentexperiments. P values were determined using Student’s t -test (∗P <0.05).(c) Biopsies from BJ-HELTRas tumour-bearing mice were analysed byimmunohistochemistry. Representative images (NKp46, Ki67, IFN-γ andCD31) are shown. See Supplementary Table S2 for quantification. All
information about antibodies is reported in Supplementary Table S4. Scalebar, 10 µm. (d,e) Mice were injected with BJ-HELTRas cells at 5×10⁵ cellsper mouse on day 1. The mice were treated with anti-NK1.1 antibodies at100 µg per mouse. Tumour formation was assessed on the basis of palpability;the results are expressed as the percentage of tumour-free mice at theindicated time points after cell injection following NK cell depletion. n =7mice per condition. One of two independent experiments is shown. Datafor both experiments are presented in Supplementary Table S5 (StatisticsSource Data). (f) Nude mice were injected i.m. with TRF2-compromisedBJ-HELTRas cells and treated or not with the ATM inhibitor KU-55933.After 5 days, microtumours were analysed by immunohistochemistry. Imagequantification shown in Supplementary Fig. S5h is represented. Positivecells scored in 7 high-powered fields for each condition were counted. n=7mice per condition. Mean±s.d. from one of two independent experiments isshown. Data for both experiments are presented in Supplementary Table S5(Statistics Source Data). P values were determined using a Mann–Whitneytest (∗P <0.05).
mice (Supplementary Table S1), which excludes the possibility that Tor B cells play a role, suggested that the anti-tumour effects of TRF2inhibition result, at least in part, from NK cell activation. Indeed,TRF2dn cells readily formed tumours in NK-cell-immunodepletedRag1−/− mice (Fig. 6d,e). These tumours exhibited a similar histolog-ical phenotype to those formed by TRF2-expressing cells: a high Ki67index, high density of CD31+ cells, and no expression of IFN-γ (Fig. 6cand Supplementary Table S2). In addition, they still expressed TRF2dn,excluding the possibility of selection against cells expressing the trans-gene (Supplementary Fig. S5e,f). Notably, IFN-γ neutralizationwas alsoshown to allow the formation of tumours from TRF2-compromisedcells (Supplementary Fig. S5g). Thus, the induction of IFN-γ by NKcells is a critical factor in the inability of TRF2-compromised cellsto form tumours. The fact that the immunodepletion of NK cells
restored the vascularization of TRF2dn tumours (Fig. 6c) suggests thatIFN-γ contributes to the anti-angiogenic effects of TRF2 dysfunction40.In agreement with this hypothesis, the IFN-γ-induced angiostaticmolecule MIG/CXCL9 was overexpressed by lymphoid cells presentwithin the TRF2dn microtumours ofNK-cell-competentmice but not ofNK-cell-immunodepletedmice (Supplementary Fig. S5d andTable S2).Overall, these results demonstrate that NK cells and IFN-γ are
required for the anti-tumour effects of TRF2 dysfunction and reveal theexistence of a cell-extrinsic pathway controlled by TRF2 that regulatesinnate immune surveillance. This seems to be the main mechanism bywhich TRF2dn reduces tumorigenicity, although one cannot exclude aminor contribution from cell-intrinsic effects as suggested by a slightreduction of clonogenic ability in soft agar conferred by TRF2dn (Fig. 2and Supplementary Fig. S2).
824 NATURE CELL BIOLOGY VOLUME 15 | NUMBER 7 | JULY 2013
© 2013 Macmillan Publishers Limited. All rights reserved.

ART I C L E S
HS3ST4 (25,610,847–26,056,510)
Chr.16
50 kb
5'–CTAACCCTAACCCTAACCCTAACCCTAACCCTAACCCTAACCCTAAC–3'
Interstitial telomeric sequence
0
pWPIR
Scram
ble shR
NA
Scram
ble shR
NA
Unt
reat
ed
Bleom
ycin
0.1
mg
ml–1
hTERF2
shR
NA1
hHS3S
T4 shR
NA1
pWPIR
-hTR
F2 W
T
0.5
1.0
1.5
2.0
2.5
∗
∗∗
∗
HS
3ST4
mR
NA
level
pW
PIR
pW
PIR
-hT
RF
2
Scra
mb
le s
hR
NA
hTE
RF2
shR
NA
#1
Scra
mb
le s
hR
NA
hTE
RF2
shR
NA
#1
hH
S3S
T4 s
hR
NA
1
hH
S3S
T4 s
hR
NA
2
β-actin
CHK1
ATM
β-actin
p-CHK1
p-ATM
Untr
eate
d
Ble
om
ycin
0.1
mg
ml–
1
HS3ST4
β-actin 0
pWPIR
pWPIR
-hTR
F2
2
4
6
8
Rela
tive f
old
enrichm
ent
eNS NS
f g
0
10
20
30
+ +
+ +
+ +
∗∗ ∗∗ ∗∗ ∗∗
∗∗
0
20
40
60∗
∗
∗
Scramble shRNA
hHS3ST4 shRNA1
hHS3ST4 shRNA2
Scra
mb
le s
hR
NA
Scra
mb
le s
hR
NA
Scra
mb
le s
hR
NA
hTE
RF2
shR
NA
1
hTE
RF2
shR
NA
1
hTE
RF2
shR
NA
1
–
– –
– –
– –
– –
– –
–
+ +
+ +
+ +
Scramble shRNA
hHS3ST4 shRNA1
hHS3ST4 shRNA2
–
– –
– –
– –
– –
– –
–
Perc
enta
ge o
f N
Kp
46+
cells
Perc
enta
ge o
f C
D107a+
cells
NS
Scra
mb
le s
hR
NA
Scra
mb
le s
hR
NA
Scra
mb
le s
hR
NA
hTE
RF2
shR
NA
1
hTE
RF2
shR
NA
1
hTE
RF2
shR
NA
1
NS
b c
d
a
Figure 7 TRF2 dosage influences NK cell infiltration in a HS3ST4-dependent manner. (a) Schematic diagram of the HS3ST4 gene andrepresentation of the interstitial localization of telomeric sequences withinthe introns of HS3ST4. (b) Analysis of HS3ST4 mRNA expression relativeto GAPDH mRNA by RT-qPCR in BJ-HELTRas either overexpressing ordownregulating TRF2 or treated with the genotoxic drug bleomycin. Thedata represent the mean±s.d. of n=5 independent experiments performedin triplicate. P values were calculated using the Mann–Whitney test(∗P <0.05; ∗∗P <0.005). (c) Western blot analysis of the phosphorylationof ATM and CHK1 in BJ-HELTRas cells treated with bleomycin. Allinformation about antibodies is reported in Supplementary Table S4.(d) Analysis of the HS3ST4 protein level by western blotting usingproteins from BJ-HELTRas cells either overexpressing or downregulatingTRF2. (e) Quantitative PCR analysis of chromatin immunoprecipitates
obtained from empty or TRF2 WT-overexpressing BJ-HELTRas cells probedfor the HS3ST4 ITS are reported as mean± s.d. of n = 3 independentChIP experiments. (f,g) Scramble-shRNA- or mTERF2 -shRNA-transducedBJ-HELTRas cells were infected with lentiviruses expressing scrambleshRNA or HS3ST4 shRNA. The different cell batches were assessedfor NK cell recruitment in a Matrigel assay as described previously (f),and the activity of the infiltrating NK cells was determined on the basisof the percentage of CD107a-positive NK cells in the Matrigel plug (g).Data are represented by minimum to maximum box-and-whiskers graphs.n = 6 mice per condition. One experiment is shown. Data are presentedin Supplementary Table S5 (Statistics Source Data); P values weredetermined using the Mann–Whitney test (∗P < 0.05; ∗∗P < 0.005; NS,not significant). Uncropped images of blots are shown in SupplementaryFig. S9.
TRF2 level regulates the expression of HS3ST4, a gene involvedin heparan sulphate biosynthesisThe key question remained the molecular mechanism by which TRF2regulates NK cells.We first excluded the possibility that TRF2-mediatedNK cell activation was a result of its role in telomere protectionand DNA damage control. Indeed, KU-55933 (2-morpholin-4-yl-6-thianthren-1-yl-pyran-4-one), a specific and very potent small-molecule inhibitor of ATM (ref. 41), the main kinase mediatingtelomere dysfunction triggered by TRF2 inhibition42, as well asknockdown of ATM and ATR by RNA interference, did not affect theability of TRF2dn to activate NK cells, to trigger IFN-γ production andto impair tumorigenicity (Fig. 6f and Supplementary Fig. S5h and TableS1). We conclude that TRF2 can control NK cells and tumorigenicityindependently of its role in telomere protection andDDR.Next, we examined the possibility that TRF2 modulates the
expression of NK cell receptor ligands, but we failed to detect anychanges in the expression of a vast panel of NK cell receptor ligands43–45
(Supplementary Fig. S6a). Next, by examining whether TRF2 could
modify the secretion of other molecules involved in NK cell immunity,we found that, as expected from RasV12 expression, BJ-HELTRas cellssecreted large quantities of factors included in the senescence-associatedsecretory profile37 (SASP) or senescence-messaging secretome46 (SMS;Supplementary Fig. S6b). However, we failed to detect any notableSASP/SMS differences between control fibroblasts and cells expressingTRF2 and TRF2dn, suggesting that modification of the SASP/SMS is notresponsible for the anti-tumour properties of TRF2-compromised cells.Nevertheless, among the SASP/SMS factors, high levels of IL-6 and -12were triggered by the injection of TRF2-compromised cells comparedwith control cells (Supplementary Table S2), even if the depletion ofIL-6 in tumour cells or the neutralization of IL-6 and -12 in mice didnot affect the ability of TRF2-compromised cells to activate NK cellsand did not restore the tumorigenicity (Supplementary Tables S1 andS2). Therefore, the NK cell stimulation and oncosuppression caused byTRF2 inhibition in BJ-HELTRas cells can be explained neither by thehigh expression level of IL-6 in these cells nor by the increased level ofIL-6 and IL-12 at the site of injection.
NATURE CELL BIOLOGY VOLUME 15 | NUMBER 7 | JULY 2013 825
© 2013 Macmillan Publishers Limited. All rights reserved.

ART I C L E S
Normal colon
mucosa
Low-grade
adenoma
High-grade
adenoma
TRF2
Focal intramucous
adenocarcinoma
∗ ∗ ∗ ∗ ∗ ∗N
um
ber
of
cells
mm
–2
Normal colon
mucosa
n = 60
Low-grade
adenoma
n = 30
High-grade
adenoma
n = 30
Focal intramucous
adenocarcinoma
n = 15
No detectable expression
Faint and heterogeneous expression
Faint and homogeneous expression
Strong and heterogeneous expression
Strong and homogeneous expression
Perc
en
tag
e o
f cases
Normal colon
mucosa
Low-grade
adenoma
High-grade
adenoma
Focal intramucous
adenocarcinoma
Normal colon
mucosa
10
30
50
70
90
110
130
0 2 4 6 8 10
Normal mucosa (n = 60)
Low-grade adenoma (n = 30)
High-grade adenoma (n = 30)
Focal intramucous
adenocarcinoma (n = 15)
CD56+ cells mm–2
TR
F2
exp
ressio
n s
co
re
Clin
ical sco
re (sp
here
dia
mete
r)
Focal intramucous
adenocarcinoma
n = 15
n' = 5
High-grade
adenoma
n = 30
n' = 5
Low-grade
adenoma
n = 30
n' = 5
Normal colon
mucosa
n = 60
n' = 6
CD56+
hNKP46+
100
80
60
40
20
0
0
2
4
6
8
10
12
14d
b
c
e
a
CD56 hNKp46
Figure 8 TRF2 expression is negatively correlated with NK cell densityduring the early stages of colon carcinogenesis. (a) Representativeimages showing TRF2 expression in normal, preneoplastic and neoplasticcolonic mucosa. Original magnifications: normal mucosa, ×320; low-and high-grade adenomas, ×270; adenocarcinoma, ×260. (b) Scoringof TRF2 expression. The apparent levels of expression were gradedaccording to the colour code shown in the panel. (c) Representativeimages of CD56 and hNKp46 expression. Original magnifications: normalmucosa, ×400; low- and high-grade adenomas, ×420; adenocarcinoma,×430. (d) Mean±s.e.m. of CD56+ (black bars; n = 60 normal colon
mucosa; n=30 low-grade adenoma; n=30 high-grade adenoma; n=15focal intramucous adenoma) and hNKp46+ (open bars; n = 6 normalcolon mucosa; n=5 low-grade adenoma; n=5 high-grade adenoma andn=5 focal intramucous adenoma) cell densities. Significant differencesfrom the control (normal mucosa) are indicated by asterisks. P valueswere determined using the Mann–Whitney test (∗P < 0.05). Data arepresented in Supplementary Table S5. (e) Three-parameter graphrepresenting the relative TRF2 expression score; NK cell infiltration persquare millimetre; and relative clinical score, which is proportional to thespherical diameter.
As we could explain the effect of TRF2 on NK cells neither byits canonical role in telomere protection against the DDR, nor bythe identification of known modulators of NK cells regulated byTRF2, we reasoned that TRF2 could directly regulate the expressionof NK cell modulator genes. Therefore, we used TRF2 chromatinimmunoprecipitation sequencing (ChIP-seq) data, previously ob-tained using BJ-HELTRas cells47, to search for TRF2 direct targetgenes involved in NK cell function. Among the genes containing ahigh-affinity DNA-binding site for TRF2 either within an intron or<10 kb from the transcription start site47, HS3ST4 was the only onethat encoded a protein involved in extracellular functions (sulphationof heparan sulphate proteoglycans) and whose expression (at boththe messenger RNA and protein levels) was positively regulated byTRF2 (Fig. 7a–d). In agreement with a DDR-independent role of TRF2
in this regulation, the TRF2-compromised cells used for assayingHS3ST4 expression did not show DDR activation (SupplementaryFig. S7) and an activation of the DDR by bleomycin treatment did notalter HS4ST4 expression (Fig. 7b,c). In line with the ChIP-seq data,TRF2 bound the interstitial telomeric sequence48 (ITS) located withinthe HS3ST4 intron, as revealed by the quantitative PCR analysis ofchromatin immunoprecipitates, and this binding was dependent onTRF2 expression (Fig. 7e).Reduced HS3ST4 expression triggered by two different shRNAs
increased the recruitment of NK cells in Matrigel co-injected withBJ-HELTRas cells to a level similar to that seen with the knockdownof TERF2 (Fig. 7d,f), and the double knockdown of HS3ST4 andTERF2 did not increase NK cell recruitment further (Fig. 7f), indicatingthat these genes act in the same pathway. It is worth noting that
826 NATURE CELL BIOLOGY VOLUME 15 | NUMBER 7 | JULY 2013
© 2013 Macmillan Publishers Limited. All rights reserved.

ART I C L E S
HS3ST4 does not seem to be involved in NK cell activation, as revealedby the quantity of NK cells within the plugs expressing CD107amarkers (Fig. 7g), suggesting that other genes involved in NK cellimmunity are regulated by TRF2. We conclude that the level of TRF2in tumour cells shapes the NK cell response independently of aneffect on telomere protection by directly targeting the expression ofHS3ST4. This provides an explanation for the DDR-independent effectof TRF2 on tumorigenicity.
Inverse correlation between TRF2 level and NK cell densityduring early stages of human colon carcinogenesisFinally, we addressed the relevance of these findings to humanoncogenesis by analysing samples of human colon for TRF2 expressionand NK cell density. Although TRF2 was typically undetectable innormal colonic mucosa, most epithelial cells in neoplastic lesionsexhibited faint to strong nuclear TRF2 expression (Fig. 8a). Weidentified an increasing number of TRF2-positive cells in low- tohigh-grade adenomas and intramucosal adenocarcinomas (Fig. 8a,b).These data further support the notion that TRF2 is frequentlyoverexpressed during the early stages of human oncogenesis21,28. Whatis remarkable is that the density of NK cells in the same samples, assayedusing antibodies raised against both CD56 andNKp46, was significantlyhigher in normal colonic mucosa than in early neoplastic lesions andtended to decrease with neoplastic progression (Fig. 8c,d).We observedno apparent change in the density of CD3+ cells, which account formost of the resident lymphocytes in the studied samples or in CD8+or CD20+ cells, which were more infrequent (Supplementary Fig. S8).A three-parameter graph in which values of NK cell density within thetumour microenvironment were plotted against the relative expressionof TRF2 in tumour cells and the severity of disease (Fig. 8e) revealedan inverse association between TRF2 expression, clinical grade andNK cell infiltration. Taken together, these data reveal a specific declinein NK cell number with a concomitant, progressive increase in TRF2expression during the early stages ofmalignant transformation.
DISCUSSIONMany unknowns remain in the description and understanding of thecell non-autonomous response to genome damage. Our work bringsthe notion that NK cells can be called by TRF2 changes in tumour cellsthat do not lead to DDR and growth arrest. These findings suggest asophisticated mechanism of co-evolution between the telomere andthe immune systems to keep tissue integrity in check.The fact that the expression of H-RasV12 protects telomeres against
a partial TRF2 dysfunction by increasing IL-6 expression offered usthe unique opportunity to separate the in vivo growth defects ofTRF2 loss in cancer cells from telomere deprotection, DDR activationand cell-intrinsic inhibition of cell growth. The finding that IL-6 isrequired for the growth of TRF2-compromised H-RasV12 cells seemsat odds with its role in oncogene-induced senescence, in which itmaintains the senescent state38. Overall, these findings suggest that IL-6has antagonist effects on proliferation, being anti-mitogenic in DNAdamage checkpoint-proficient cells and pro-mitogenic in transformedcells such as the BJ-HELTRas cells used in this study.Importantly, we identified one mechanism by which TRF2 controls
NK cell biology in a DDR-independent manner. The level of TRF2positively regulates the expression of HS3ST4, a gene encoding
for the heparan sulphate (glucosamine) 3-O-sulphotransferase 4,involved in NK cell modulation (this study) and containing theintronic ITS (ref. 47). This finding sheds light on the mechanismsof NK cell recognition by tumour cells through the regulation of thesulphation of heparan sulphate molecules. It is tempting to speculatethat the sulphation of cell surface heparan sulphate proteoglycan byHS3ST4 affects the binding of cytokines and chemokines around thetumour cells49,50, thereby modifying their capacity to be eliminatedby NK cells. The role of carbohydrate recognition by NK cells isa new avenue of research that remains to be explored in depth51.In addition, the identification of the ITS-associated HS3ST4 geneas a TRF2 target provides a paradigm for studying ITS function.As TRF2 binds a large number of non-telomeric sites throughoutthe genome47,52,53, we propose that, in addition to HS3ST4, TRF2regulates the expression of a network of genes involved in tissuehomeostasis. Whether these extratelomeric roles of TRF2 are coupledto telomere chromatin structure, for example by releasing TRF2molecules from telomeres on shortening, is an interesting possibilitythat would be reminiscent of the budding yeast situation where changesin telomere structure can influence the expression of genes locatedat the interior of chromosomes by triggering the delocalization ofspecific telomeric factors54,55.In summary, we propose a model in which a high TRF2 level in
tumour cells contributes to early oncogenesis, not only by delayingreplicative senescence but also by a non-cell autonomous mechanismpreventing innate immune surveillance. �
METHODSMethods and any associated references are available in the onlineversion of the paper.
Note: Supplementary Information is available in the online version of the paper
ACKNOWLEDGEMENTSThe work done in the laboratory of E.G. was supported by La Ligue NationaleContre Le Cancer (Équipe Labellisée), Institut National du Cancer (TELOFUNand TELOCHROM programme), ANR (INNATELO programme) and theEuropean Union (FP7-Telomarker, Health-F2-2007-200950). The E.V. laboratoryis supported by ANR (programme INNATELO) and the European Union (ERCadvanced grant THINK). We thank L. Zitvogel (Institut Gustave Roussy, France)for providing the XMG1.2 clone, R. Weinberg (Whitehead Institute for BiomedicalResearch, Cambridge, Massachusetts, USA) for providing the BJ-HELT cells, C.Delprat (University of Lyon, France) for Luminex analyses, J. Lingner (EcolePolytechnique Fdrale de Lausanne, Switzerland) for providing the ATR shRNAand ATM shRNA plasmids, and V. Leopold (IRCAN, France) for providing thesubcloning vectors.We are also grateful toC.D’Angelo andM. Scarsella for technicalsupport. This work was performed using the microscopy (PICMI), cytometry(CYTOMED) and animal house facilities of IRCAN. The work done by the A.B.group was supported by grants from the Italian Association for Cancer Research(#11567 and #9979). A.B. was supported by the Short-Term Fellowship Programmeof the EMBO. M.J.S. was supported by a National Health and Medical ResearchCouncil Australia Fellowship. J.C-V. was supported by a postdoctoral fellowshipfrom La Ligue Nationale Contre Le Cancer.
AUTHOR CONTRIBUTIONSA.B. designed and interpreted most of the experiments and wrote the manuscript;J.C-V. designed, performed and interpreted syngenic mouse experiments, NK cellexperiments and HS3ST4 experiments, and wrote the manuscript; A.A. designed,performed and interpreted the IL-6 experiments, contributed to several cell biologyexperiments and wrote the manuscript; S.P. performed and interpreted cell biologyexperiments; S.B. performed and interpreted TIF analyses and lentivirus production;J.Y. designed and performed NK cell experiments, and contributed to TIF analysesand lentivirus production; T.S., B.H. and A.M-B. performed and interpreted ChIPexperiments; K.J. performed bioinformatic analyses; L.C. performed cytometry
NATURE CELL BIOLOGY VOLUME 15 | NUMBER 7 | JULY 2013 827
© 2013 Macmillan Publishers Limited. All rights reserved.
ART I C L E S
analyses; C.T.d.R. and D. Poncet performed gene expression analysis; E.S., A.R., P.Z.and R.G. performed cell biology and mouse experiments; L.S. and M.R. performedand analysed metaphase experiments; C.C. performed and interpreted NK cellexperiments; T.K. and D. Peeper provided IL-6 tools and help in analysing thedata; H.D. produced IL-12 antibodies; F.L. performed the pathological analyses oncolon samples; J.M. provided mouse cell lines; E. Verhoeyen and F-L.C. contributedto lentiviral production; M.J.S. designed experiments, provided 1L-12 antibodiesand edited the manuscript; A.L.V. provided cell lines and contributed to telomereanalyses; V.P. and G.P. designed, performed and analysed the A375 experiments;J-Y.S. designed and interpreted the colon sample experiments, and wrote themanuscript; A.S. designed, performed and interpreted the pathological experimentswith mouse tumours; C.L. designed, performed and interpreted most of thexenograft experiments; E. Vivier designed and interpreted the NK cell experiments,and wrote the manuscript; E.G. designed and coordinated all of the experiments,interpreted the results and wrote the manuscript.
COMPETING FINANCIAL INTERESTSThe authors declare no competing financial interests.
Published online at www.nature.com/doifinder/10.1038/ncb2774Reprints and permissions information is available online at www.nature.com/reprints
1. Blackburn, E. H., Greider, C. W. & Szostak, J. W. Telomeres and telomerase: thepath from maize, Tetrahymena and yeast to human cancer and ageing. Nat. Med.12, 1133–1138 (2006).
2. Blackburn, E. H. Telomere states and cell fates. Nature 408, 53–56 (2000).3. d’Adda di Fagagna, F. et al. A DNA damage checkpoint response in telomere-initiated
senescence. Nature 426, 194–198 (2003).4. Rudolph, K. L., Millard, M., Bosenberg, M. W. & DePinho, R. A. Telomere
dysfunction and evolution of intestinal carcinoma in mice and humans. Nat. Genet.28, 155–159 (2001).
5. Gonzalez-Suarez, E., Samper, E., Flores, J. M. & Blasco, M. A. Telomerase-deficientmice with short telomeres are resistant to skin tumorigenesis. Nat. Genet. 26,114–117 (2000).
6. Guo, X. et al. Dysfunctional telomeres activate an ATM-ATR-dependent DNA damageresponse to suppress tumorigenesis. EMBO J. 26, 4709–4719 (2007).
7. Feldser, D. M. & Greider, C. W. Short telomeres limit tumour progression in vivo byinducing senescence. Cancer Cell 11, 461–469 (2007).
8. Cosme-Blanco, W. et al. Telomere dysfunction suppresses spontaneous tumorige-nesis in vivo by initiating p53-dependent cellular senescence. EMBO Rep. 8,497–503 (2007).
9. Ding, Z. et al. Telomerase reactivation following telomere dysfunction yields murineprostate tumours with bone metastases. Cell 148, 896–907 (2012).
10. Cech, T. R. Beginning to understand the end of the chromosome. Cell 116,273–279 (2004).
11. Giraud-Panis, M. J. et al. One identity or more for telomeres? Front Oncol. 3,48 (2013).
12. De Lange, T. Shelterin: the protein complex that shapes and safeguards humantelomeres. Genes Dev. 19, 2100–2110 (2005).
13. Broccoli, D., Smogorzewska, A., Chong, L. & de Lange, T. Human telomerescontain two distinct Myb-related proteins, TRF1 and TRF2. Nat. Genet. 17,231–235 (1997).
14. Bilaud, T. et al. Telomeric localization of TRF2, a novel human telobox protein. Nat.Genet. 17, 236–239 (1997).
15. Celli, G. B. & de Lange, T. DNA processing is not required for ATM-mediated telomeredamage response after TRF2 deletion. Nat. Cell Biol. 7, 712–718 (2005).
16. Karlseder, J., Broccoli, D., Dai, Y., Hardy, S. & de Lange, T. p53- and ATM-dependentapoptosis induced by telomeres lacking TRF2. Science 283, 1321–1325 (1999).
17. Van Steensel, B., Smogorzewska, A. & de Lange, T. TRF2 protects human telomeresfrom end-to-end fusions. Cell 92, 401–413 (1998).
18. Okamoto, K. et al. A two-step mechanism for TRF2-mediated chromosome-endprotection. Nature 494, 502–505 (2013).
19. Griffith, J. D. et al. Mammalian telomeres end in a large duplex loop [see comments].Cell 97, 503–514 (1999).
20. Amiard, S. et al. A topological mechanism for TRF2-enhanced strand invasion. Nat.Struct. Mol. Biol. 14, 147–154 (2007).
21. Nakanishi, K. et al. Expression of mRNAs for telomeric repeat binding factor (TRF)-1and TRF2 in atypical adenomatous hyperplasia and adenocarcinoma of the lung. Clin.Cancer Res. 9, 1105–1111 (2003).
22. Begemann, S., Galimi, F. & Karlseder, J. Moderate expression of TRF2 in thehematopoietic system increases development of large cell blastic T-cell lymphomas.Aging 1, 122–130 (2009).
23. Bellon, M. et al. Increased expression of telomere length regulating factors TRF1,TRF2 and TIN2 in patients with adult T-cell leukaemia. Int. J. Cancer 119,2090–2097 (2006).
24. Diehl, M. C. et al. Elevated TRF2 in advanced breast cancers with short telomeres.Breast Cancer Res. Treat. 127, 623–630 (2011).
25. Hu, H., Zhang, Y., Zou, M., Yang, S. & Liang, X. Q. Expression of TRF1, TRF2,TIN2, TERT, KU70, and BRCA1 proteins is associated with telomere shortening andmay contribute to multistage carcinogenesis of gastric cancer. J. Cancer Res. Clin.Oncol. 136, 1407–1414 (2010).
26. Hsu, C. P., Ko, J. L., Shai, S. E. & Lee, L. W. Modulation of telomere shelterin byTRF1 [corrected] and TRF2 interacts with telomerase to maintain the telomere lengthin non-small cell lung cancer. Lung Cancer 58, 310–316 (2007).
27. Ning, H. et al. TRF2 promotes multidrug resistance in gastric cancer cells. CancerBiol. Ther. 5, 950–956 (2006).
28. Oh, B. K., Kim, Y. J., Park, C. & Park, Y. N. Up-regulation of telomere-bindingproteins, TRF1, TRF2, and TIN2 is related to telomere shortening during humanmultistep hepatocarcinogenesis. Am. J. Pathol. 166, 73–80 (2005).
29. Dong, W. et al. Sp1 upregulates expression of TRF2 and TRF2 inhibitionreduces tumorigenesis in human colorectal carcinoma cells. Cancer Biol. Ther. 8,2166–2174 (2009).
30. Dong, W., Wang, L., Chen, X., Sun, P. & Wu, Y. Upregulation and CpG islandhypomethylation of the TRF2 gene in human gastric cancer. Dig. Dis. Sci. 55,997–1003.
31. Biroccio, A. et al. TRF2 inhibition triggers apoptosis and reduces tumourigenicity ofhuman melanoma cells. Eur. J. Cancer 42, 1881–1888 (2006).
32. Blanco, R., Munoz, P., Flores, J. M., Klatt, P. & Blasco, M. A. Telomerase abrogationdramatically accelerates TRF2-induced epithelial carcinogenesis. Genes Dev. 21,206–220 (2007).
33. Diala, I. et al. Telomere protection and TRF2 expression are enhanced by thecanonical Wnt signalling pathway. EMBO Rep. 14, 356–363 (2013).
34. Teo, H. et al. Telomere-independent Rap1 is an IKK adaptor and regulatesNF-κB-dependent gene expression. Nat. Cell Biol. 12, 758–767 (2010).
35. Takai, K. K., Hooper, S., Blackwood, S., Gandhi, R. & de Lange, T. In vivostoichiometry of shelterin components. J. Biol. Chem. 285, 1457–1467 (2010).
36. Ancrile, B., Lim, K. H. & Counter, C. M. Oncogenic Ras-induced secretion of IL6 isrequired for tumorigenesis. Genes Dev. 21, 1714–1719 (2007).
37. Coppe, J. P. et al. Senescence-associated secretory phenotypes reveal cell-nonautonomous functions of oncogenic RAS and the p53 tumour suppressor. PLoSBiol. 6, 2853–2868 (2008).
38. Kuilman, T. et al. Oncogene-induced senescence relayed by an interleukin-dependent inflammatory network. Cell 133, 1019–1031 (2008).
39. Kozma, S. C. et al. The human c-Kirsten ras gene is activated by a novel mutationin codon 13 in the breast carcinoma cell line MDA-MB231. Nucleic Acids Res. 15,5963–5971 (1987).
40. Naldini, A. & Carraro, F. Role of inflammatory mediators in angiogenesis. Curr. DrugTargets Inflamm. Allergy 4, 3–8 (2005).
41. Lau, A. et al. Suppression of HIV-1 infection by a small molecule inhibitor of theATM kinase. Nat. Cell Biol. 7, 493–500 (2005).
42. Denchi, E. L. & de Lange, T. Protection of telomeres through independent control ofATM and ATR by TRF2 and POT1. Nature 448, 1068–1071 (2007).
43. Gasser, S., Orsulic, S., Brown, E. J. & Raulet, D. H. The DNA damage pathwayregulates innate immune system ligands of the NKG2D receptor. Nature 436,1186–1190 (2005).
44. Soriani, A. et al. ATM-ATR-dependent up-regulation of DNAM-1 and NKG2Dligands on multiple myeloma cells by therapeutic agents results in enhancedNK-cell susceptibility and is associated with a senescent phenotype. Blood 113,3503–3511 (2009).
45. Brandt, C. S. et al. The B7 family member B7-H6 is a tumour cell ligand forthe activating natural killer cell receptor NKp30 in humans. J. Exp. Med. 206,1495–1503 (2009).
46. Kuilman, T. & Peeper, D. S. Senescence-messaging secretome: SMS-ing cellularstress. Nat. Rev. Cancer 9, 81–94 (2009).
47. Simonet, T. et al. The human TTAGGG repeat factors 1 and 2 bind to asubset of interstitial telomeric sequences and satellite repeats. Cell Res. 21,1028–1038 (2011).
48. Ruiz-Herrera, A., Nergadze, S. G., Santagostino, M. & Giulotto, E. Telomeric repeatsfar from the ends: mechanisms of origin and role in evolution. Cytogenet. GenomeRes. 122, 219–228 (2008).
49. Bishop, J. R., Schuksz, M. & Esko, J. D. Heparan sulphate proteoglycans fine-tunemammalian physiology. Nature 446, 1030–1037 (2007).
50. Hacker, U., Nybakken, K. & Perrimon, N. Heparan sulphate proteoglycans: the sweetside of development. Nat. Rev. Mol. Cell Biol. 6, 530–541 (2005).
51. Feizi, T. Carbohydrate-mediated recognition systems in innate immunity. Immunol.Rev. 173, 79–88 (2000).
52. Zhang, Y. W., Zhang, Z. X., Miao, Z. H. & Ding, J. The telomeric protein TRF2 iscritical for the protection of A549 cells from both telomere erosion and DNA double-strand breaks driven by salvicine. Mol. Pharmacol. 73, 824–832 (2008).
53. Yang, D. et al. Human telomeric proteins occupy selective interstitial sites. Cell Res.21, 1013–1027 (2011).
54. Marcand, S., Buck, S. W., Moretti, P., Gilson, E. & Shore, D. Silencing of genesat nontelomeric sites in yeast is controlled by sequestration of silencing factors attelomeres by Rap1 protein. Genes Dev. 10, 1297–1309 (1996).
55. Maillet, L. et al. Evidence for silencing compartments within the yeast nucleus : a rolefor telomere proximity and Sir-protein concentration in silencer-mediated repression.Genes Dev. 10, 1796–1811 (1996).
828 NATURE CELL BIOLOGY VOLUME 15 | NUMBER 7 | JULY 2013
© 2013 Macmillan Publishers Limited. All rights reserved.

DOI: 10.1038/ncb2774 METHODS
METHODSCell lines and reagents. The details of the DNA lentiviral constructs containingvarious forms of Myc–TRF2 will be furnished on request. The sequences of theshRNAs used in this study are given in Supplementary Table S3. The list ofantibodies used for western blotting, immunofluorescence and cytometry is givenin Supplementary Table S4.
We used human fibroblasts (BJ) and kidney epithelial (HEK) cells renderedtumorigenic by successive retroviral transductions of telomerase (hTERT), simianvirus 40 early region (SV40 ER) and oncogenic Ras (H-Ras[G12V] or RasV12)56
as well as MDA-MB231 human mammary carcinoma cells and A375 melanomacells. From the immortalized but not tumorigenic fibroblasts expressing hTERT andSV40 ER genes (termed BJ-HELT) we derived both a polyclonal and monoclonalpopulation of RasV12-transduced cells named, respectively, BJ-HELTRaspc andBJ-HELTRas. To obtain HEK-HELTRas, we introduced RasV12 into ER-SV40-HA1+hTERT cells57 and selected a clone overexpressing the protein. Mousemelanoma B16F10 cells were obtained from the American Type Culture Collection(Manassas). Cells were grown at 37 ◦C in DMEM with 10% fetal calf serum (FCS)and penicillin–streptomycin.
To create the lentiviruses, we transfected 10-cm dishes of 293T cells with8.6 µg pCMV1R8.91, 2.8 µg phCMV-G and 8.6 µg pWPIR-GFP plasmid58
containing different forms of the TRF2-coding sequence or pLKO plasmid bycalcium phosphate precipitation. Viral supernatants were collected 24 h aftertransfection. The infection efficiencywas investigated by determining the percentageof GFP-positive cells using FACS analysis 3 days after infection or the number ofclones after 1 week of selection with ampicillin.
A375 cells, which express the Tet repressor, were used for transfection withpcDNA4/TO, pcDNA4/TO-TRF2wt or pcDNA4/TO-TRF2dbdc (pTrex-A; LifeTechnologies). Zeocine-resistant clones (5 µgml−1) for each constructwere screenedby western blotting using anti-TRF2 antibodies (4A794; Imgenex) and anti-c-Mycantibodies (9E10; Santa Cruz Biotechnology) after tetracycline induction.
Immunofluorescence detection of telomere dysfunction-induced foci. Slideswere fixed with methanol at −20 ◦C or 4% formaldehyde at room temperaturefor 15min, and then incubated for 1 h with blocking buffer (0.8× PBS, 50mMNaCl, 0.5% Triton X-100 and 3% milk), followed by incubation overnight at 4 ◦Cwith anti-TRF1 (ab10579; Abcam) and -53BP1 (NB100-305; Novus Biologicals)antibodies. The cells were thenwashedwith 0.8×PBS, 50mMNaCl and 0.1%TritonX-100 and incubated with anti-mouse Alexa488 (A21202; Life Technologies) andanti-rabbit Alexa555 (A-31572; Life Technologies) antibodies. After washing with0.8× PBS, 50mM NaCl, and 0.1% Triton X-100, the nucleus was labelled withDAPI and/or TOTO-3. B16F10 cells were unmasked for 40minwith Target Retrievalsolution (Dako #S1699) at 95 ◦C and then for 20min at room temperature, followedby PBS rinses and successive ethanol dehydrations (3× 3min, 50%, 75%, 100%),then PNA probe was hybridized for 3min at 80 ◦C and for 2 h at room temperaturein a moist chamber in the dark (0.3 ng µl−1 dissolved in 70% formamide, 10mMTris at pH 7.2, 1% blocking reagent (from Roche Biochemicals)), washes were asfollows: 2×15min at room temperature in 70% formamide, 10mM Tris at pH 7.2and 3×5min in 50mMTris at pH 7.5, 150mMNaCl, 0.05% Tween-20; then 53BP1was stained as mentioned below. The list of antibodies is given in SupplementaryTable S4.
Confocal images were produced using a Zeiss LSM-510 confocal scanning lasermicroscope (Jena). Optical sections were recorded at an interval of×200 nm, with aPlan-Apochromat (×63, NA 1.4, oil-immersion lens). The excitation wavelengthswere 488, 543 and 633 nm for the FITC-labelled PNA and DNA probes, for theAlexa555-labelled secondary antibodies, and for TOTO-3-stainedDNA, respectively.Co-localizations were scored in each optical section by scrolling through the z stack.The appearance of the images was improved by whole-image operations withPhotoshop (Adobe Systems).
Mice. All procedures involving mice and their care were performed as describedpreviously59 following the guidelines set forth in European Directive 86/609/EEC,which are in compliance with national and international laws.
Tumorigenicity. For the intramuscular (i.m.) and intravenous (i.v.) injections,CD-1 male nude (nu/nu) mice, 6–8 weeks old and weighing 22–24 g each, werepurchased from Charles River Laboratories. To assess tumorigenicity, we injecteddifferent numbers of cells (from 5× 10⁵ to 2× 10⁶ per mouse) i.m. Mice (12 foreach group) were observed daily to establish tumour take, the time of tumourappearance, and tumour weight59. For the subcutaneous (s.c.) injections, male Swissnu/nu mice (Charles River Laboratories), 6–7 weeks old and weighing 22–24 g each,were housed according to the guidelines of the French Agriculture Ministry. Mice(three for each group) were injected s.c. in both flanks (n= 6) with 1× 10⁶ cells
in 0.1ml Matrigel (Becton, Dickinson, Franklin Lakes) diluted (v/v) in PBS. Forthe A375-control, A375-TRF2 and A375-TRF2dn cells were induced overnight withtetracycline (1 µgml−1) and 106 cells were injected s.c. into the flanks of 6-week-oldnude (nu/nu) mice (Harlan Laboratories). Doxycycline (750 µgml−1) was added tothe drinking water beginning immediately after injection. B16F10 cells (1×10⁶ cellsin 0.1ml PBS) were injected s.c. into the backs of 8-week-old C57BL/6Jmice (JanvierSAS), and mice were surveyed daily. Tumour volumes were calculated as follows:V =L × l2×0.5, where L and l represent the largest and smallest tumour diameters,respectively, measured at the indicated times. Rag1tm1Bal (ref. 60) mice deficientin Rag1 backcrossed in a C57BL/10JCrl background were bred at the Plateau deBiologie Expérimentale de la Souris (IFR128).
Tissue analysis of the mouse tumours. Fresh tissue samples were embedded inOCT compound (Miles Laboratories), snap-frozen in liquid nitrogen, stored at−80 ◦C, and used after sectioning for use with a TUNEL Apoptosis Detection Kitand β-galactosidase staining following themanufacturer’s instructions. Immunohis-tochemical analysis was performed on 100% acetone-fixed sections after quenchingendogenous peroxidase activity with 1% H2O2 in 100% methanol and inhibitingbiotin. The sections were incubated with optimal dilutions of primary antibodies(listed below) after pre-incubation to inhibit nonspecific protein binding. Thereactions were revealed using an UltraTek HRP Anti-Polivalent Lab Pack (ScytekLaboratories) according to the manufacturer’s instructions and counterstained withhaematoxylin.
For NKp46 immunofluorescence microscopy, frozen mouse muscle sections(8mm)were fixedwith acetone and stainedwith the following antibodies: polyclonalgoat anti-NKp46 (R&DSystems) or biotin-conjugated anti-CD3 (145-2C11; Becton,Dickinson). These antibodies were visualized, using Alexa488-donkey anti-goatIgG and Alexa-546-conjugated streptavidin (Life Technologies), respectively. Nucleiwere stainedwith Topro-3 (Life Technologies). Confocalmicroscopywas performedusing a Zeiss LSM510microscope. Image processing was performed using Zeiss LSMsoftware and Photoshop (Adobe Systems).
In vivoMatrigel assay. Each group of cells (1×10⁶ BJ-HELTRas or B16F10 cellsin 100 µl PBS) was mixed with 400 µl Matrigel (BD Biosciences) and injected s.c.Groups of eight mice were used for each experiment. The cells were replaced by100 µl PBS in the negative control and by 100 µl PBS supplemented with TNF-α,VEGF, SDF-1 and S1P in the positive control. Five days after injection, the Matrigelplugs were dissociated mechanically in serum-free medium containing DNase I(Roche), collagenase A (Roche) and dispase (BD Biosciences) and then incubatedfor 30min at 37 ◦Cwith agitation. Next, the cells were filtered, washed and saturatedwith anti-CD16/32 antibodies (clone 2.4G2; BD Biosciences) in PBS containing 2%FCS and 0.5mM EDTA. Finally, the cells were stained for 30min at 4 ◦C with FITC-conjugated anti-CD3, APC-conjugated anti-NKp46 or APC-Cy7-conjugated anti-CD45 antibodies (all from BDBiosciences). After washing and fixation, staining wasdetected by flow cytometry using a CANTO cytometer andDIVA6 software (BDBio-sciences). All samples are defined positive when the fluorescence intensity is higherthan that of the isotypic control. However, we noticed that the mean fluorescenceintensity of the NK cell population is low owing to the autofluorescence of Matrigel.
NK cell analysis. C57BL/6J splenocytes were used for the NK cell effectorfunction assay. The splenocytes were incubated for 24 h at 37 ◦C in the presenceof transformed human fibroblasts or rmIL-12 (20 ngml−1; R&D Systems) andrmIL-18 (5 ngml−1; R&D Systems). The effector/target ratio was 2.5:1. Six hoursbefore the end of stimulation, Golgi Stop (1/1500; Becton, Dickinson) was added.The cells were then stained for 30min at 4 ◦C with PerCP-conjugated anti-CD3(145- 2C11; Becton, Dickinson) or APC-conjugated anti-NK1.1 (PK136; Becton,Dickinson) antibodies. After fixation and permeabilization, the expression of IFN-γwas detected using PE-conjugated anti-IFN-γ antibodies (Becton, Dickinson) for 30min at 4 ◦C.
Tissue analysis of human colon samples. The study group consisted of a totalof 90 cases of early neoplastic lesions of the colon selected from the Departmentof Pathology, Hôpital Edouard Herriot, Hospices Civils. All cases were reviewedby an experienced gastrointestinal pathologist and classified according to therecommendations of the Vienna classification61.
In 75 cases, only archival formalin-fixed, paraffin-embedded tissue samples wereavailable. These were obtained from 75 different patients (40 males and 35 females,aged 41–75 years (median, 61± 8.9 years)) who underwent routine colonoscopy fordiagnostic, screening or follow-up purposes. Five patients had familial adenomatouspolyposis. Of the lesions examined, 30 were from the right colon, 20 from thetransverse colon and 25 from the left colon. A total of 30 lesions were classified aslow-grade adenomas, 30 were classified as high-grade adenomas and 15 contained
NATURE CELL BIOLOGY
© 2013 Macmillan Publishers Limited. All rights reserved.

METHODS DOI: 10.1038/ncb2774
at least a focus of well-differentiated, intramucosal adenocarcinoma developed withan adenoma. A total of 60 samples of normal colonic mucosa were studied inparallel.
In 15 cases, both formalin-fixed and frozen tissue samples were available. Thesecases represented 15 different patients who underwent routine colonoscopy (10males and 5 females, aged 22–56 years median, 44± 7.6 years)): 5 patients hadfamilial adenomatous polyposis and 1 had HNPCC syndrome. Of the lesionsexamined, 5 were classified as low- grade adenomas, 5 as high-grade adenomas and5 as intramucosal adenocarcinomas. Six samples of normal colonic mucosa werestudied in parallel.
For immunohistochemical analysis, anti-TRF2 (clone 4A794; Abcam), -CD56(clone C5.9; Dako, Glostrup), -CD3 (clone UCHT1; Dako) and -CD8 antibodies(clone C8/144B; Dako) were applied to deparaffinized serial sections (4 µm inthickness) of formalin-fixed tissue. Anti-hNKp46 antibodies (clone 195314; R&DSystems) were applied to acetone-fixed, air-dried, frozen tissue sections (6 µm inthickness). In all cases, after incubation with the primary antibody, an indirectimmunoperoxidase assay was performed according to the streptavidin–biotintechnique with DAB as the chromogen.
The apparent level of expression of TRF2 was evaluated against internal controlsformed by the proliferative lymphoid cells of germinal centres present in the sametissue sections in the adjacent colonic mucosa. The level of expression of TRF2 innormal or neoplastic epithelial cells was defined as faint when it was weaker than thatexhibited by the internal controls and as strong when it was at least equivalent to thatof the internal controls. A semiquantitative scoring system was used. The density of
CD56+ and hNKp46+ cells was evaluated in at least 10 consecutive surfaces of 1mm2
or across the entire lesion for lesions measuring<10mm2.
Statistics. All graphing and statistical analyses were done using GraphPad Prismsoftware. All results represent the mean± s.d. or with minimum to maximumbox-and-whiskers plots. The significance of differences between the means wasdetermined using the Mann–Whitney two-tailed test. To determine overall survival,we used a log-rank (Mantel–Cox) test. For each test, P < 0.05 was consideredstatistically significant.
56. Hahn, W. C. et al. Creation of human tumour cells with defined genetic elements.Nature 400, 464–468 (1999).
57. Counter, C. M. et al. Telomere shortening associated with chromosome instabilityis arrested in immortal cells which express telomerase activity. EMBO J. 11,1921–1929 (1992).
58. Salmon, P. & Trono, D. Production and titration of lentiviral vectors. Curr. Protoc.Hum. Genet. http://dx.doi.org/10.1002/0471142905.hg1210s54 (2007).
59. Leonetti, C. et al. Antitumour effect of c-myc antisense phosphorothioateoligodeoxynucleotides on human melanoma cells in vitro and and in mice. J. Natl.Cancer Inst. 88, 419–429 (1996).
60. Spanopoulou, E. et al. Functional immunoglobulin transgenes guide ordered B-celldifferentiation in Rag-1-deficient mice. Genes Dev. 8, 1030–1042 (1994).
61. Schlemper, R. J. et al. The Vienna classification of gastrointestinal epithelialneoplasia. Gut 47, 251–255 (2000).
NATURE CELL BIOLOGY
© 2013 Macmillan Publishers Limited. All rights reserved.

S U P P L E M E N TA RY I N F O R M AT I O N
WWW.NATURE.COM/NATURECELLBIOLOGY 1
DOI: 10.1038/ncb2774
Figure S1 TRF2 dosage modulates the tumorigenicity of mouse and human tumor cells. (a) Left: immunoblotting with antibodies directed against the Myc tag of the transduced TRF2 forms after the lentiviral infection of BJ-HELT cells. Right: immunoblotting of endogenous TRF2 in cells infected with a lentivirus expressing scramble shRNA (shCtrl) and an shRNA directed against TERF2 (shTERF2). Results of one representative experiment are shown. (b) Modulation of TRF2 expression in B16F10 cells. After the lentiviral transduction of B16F10 with lentivirus expressing TRF2 WT, the level of expression of the GFP tag was analyzed by flow cytometry and (c) the level of expression of mTERF2 after transduction of B16F10 cells with mTRF2-expressing or mTERF2 shRNA-expressing lentivirus was determined by RT-qPCR and expressed relative to GAPDH. Results of one representative experiment are shown. (d) Nude mice were injected intravenously with infected BJ-EHLT Rasmc at 1x10⁵ cells/mouse.
The mean (SE) number of lung nodules on day 50 is indicated. Arrows indicate metastatic nodules. Data from one experiment with n=6 mice per condition are shown and source data are presented in Table S5 (Statistics Source Data). p-values were determined using the Mann-Whitney test. (e) Derivatives of the A375 melanoma cell line injection into nude mice for tumor take. Tumor take was assessed based on palpability; the results are expressed as the percentage of tumor-free mice at the indicated time points after cell injection. n=7 mice per condition, results of one representative experiment are shown and data for two independent experiments are presented in Table S5 (Statistics Source Data). (f) The tumor volume (mean +/- s.d.) was determined and representative images of the tumors are presented in (g). Scale bar represent 1 cm; p-values were determined using the Mann-Whitney test (*p < 0.05; **p < 0.005; ***p < 0.001).
© 2013 Macmillan Publishers Limited. All rights reserved.

S U P P L E M E N TA RY I N F O R M AT I O N
2 WWW.NATURE.COM/NATURECELLBIOLOGY
Figure S2 Partial TRF2 inhibition in BJ-HELTRas cells does not trigger NF-κB, DNA damage and stress response. (a) Anchorage independent growth assay performed 2 weeks pos-infection. Five thousand cells were seeded and the colonies counted three weeks subsequently. Data represent the mean +/- s.d. of n=3 independent experiments and source data are provided in Table S5 (Statistics Source Data). *p<0.05 p-values were determined using the Mann-Whitney test. (b) An increasing number of cells from each sample were plated and colonies were numerated after 10 days. Data represent the mean +/- s.d. of n=3 independent experiments. (c) Growth properties of the indicated cell lines, shown as plots of cumulative population doubling versus the number of days postinfection. Data represent the mean of n=3 independent experiments and source data are provided in Table S5 (Statistics Source Data). (d) NF-κB gel shift analyses using nuclear extracts of the indicated cells. The probe used was a consensus sequence for the transcription factor NF-κB. A nuclear
extract of Jurkat cells was used as a positive control. These experiments were performed using a Gelshift NFκB/Rel Family Kit (#37319; Active Motif, Carlsbad, CA). (e) Histology of BJ-HELTRas cells transduced with the indicated lentiviral vector analyzed 7 days after their subcutaneous injection. Biopsies from at least four different mice were analyzed, and at least four sections from each tumor were evaluated. The boxes in the SA-β-galactosidase images represent positive staining in hair follicle and sebaceous gland. See Supplementary Table 2 for quantification. The white bar represent 10 µm. (f) Staining of mouse skin before and after γ-ray irradiation showing the activation of CHK2 and ATM. Immunoblotting of proteins from two TRF2dn BJ-HELTRas tumors formed in nude mice with anti-CHK1 and -phospho-CHK1 antibodies showing an absence of detectable DDR activation in contrast to cultured BJ-HELTRas cells treated with the DNA damaging agent campthotecin. The white bar represents 10 µm. All the information about antibodies is reported in Table S4.
© 2013 Macmillan Publishers Limited. All rights reserved.

S U P P L E M E N TA RY I N F O R M AT I O N
WWW.NATURE.COM/NATURECELLBIOLOGY 3
Figure S3 Partial TRF2 inhibition in various tumor cell lines does not uncap telomeres. (a) Chromatin immunoprecipitation experiments performed with BJ-HELT and RasV12 derivatives cell lines five days after infection with the indicated lentiviral vector using γ-H2AX and Myc antibodies and analyzed by slot-blotting hybridized with an Telo or an Alu probe. It is worth noting that we observed a significant binding of the TRF2dn protein at telomeres, although less pronounced than the one of an equivalent amount of overexpressed myc-TRF2. This was unanticipated since TRF2dn does not contain a DNA binding domain and is believed to work by displacing the endogenous TRF2 molecules. The telomeric binding of TRF2dn might be explained by an interaction with other shelterin components, data fromone experiment performed in triplicate, all values are plotted on the graph. (b,c) Multiplex fluorescence in situ hybridization analyses (M-FISH) establish that the lines transduced with pWPIR-TRF2dn does not show an increased number of chromosome rearrangement, both clonal, i.e. shared by at least two cells, or non-clonal. M-FISH was performed using multi-FISH probes
(MetaSystems, GmbH) according to the manufacturers’ recommendations. Images of hybridized metaphases were captured with a CCD camera (Zeisss) coupled to a Zeiss Axioplan microscope and were processed with ISIS software (MetaSystems, GmbH). Data represent the mean +/- S.D. of n=30 metaphases from a single experiment are shown. (d) Telomere length measurement by a Southern procedure. Genomic DNA was digested with HinfI and RsaI and hybridized with a radiolabeled TTAGGG probe, data from 1 experiment are shown. (e) Immunoblotting analysis of shelterin components with the indicated antibodies. (f) Immunoblotting analysis of DNA damage, with the indicated antibodies after exposure to 5 Gy of ionizing radiation. All the information about antibodies is reported in Table S4. (g) Analysis of the phospho-(Ser/Thr) ATM/ATR substrates. (h) Quantification of the total number of 53BP1 foci per nucleus in the indicated cell lines 5 days post-infection or 5 hours after exposure to 5 Gy of ionizing radiation. Data represents mean+/-S.D. of n=30 nuclei assessed over 2 independent experiments, ***p<0.001. p-values were determined using ANOVA test.
© 2013 Macmillan Publishers Limited. All rights reserved.

S U P P L E M E N TA RY I N F O R M AT I O N
4 WWW.NATURE.COM/NATURECELLBIOLOGY
Figure S4 IL-6 is necessary and sufficient to prevent growth inhibition upon TRF2 partial inhibition. (a,b) In the indicated situations, the clonogenic ability is determined as the number of viable colonies issued from the indicated number
of plated cells. MOI = Multiplicity of Infection. vIL-6 : lentiviral vector expressing full length IL-6; vE : control lentiviral vector not expressing IL-6. Data from 1 experiment performed in triplicate, all values are plotted on the graph.
© 2013 Macmillan Publishers Limited. All rights reserved.

S U P P L E M E N TA RY I N F O R M AT I O N
WWW.NATURE.COM/NATURECELLBIOLOGY 5
Figure S5 The modulation of tumorigenicity by TRF2 dosage correlates with Natural Killer (NK) cell recruitment and activation. (a) Positive controls from the Matrigel assays. PBS alone or containing TNF-α, VEGF-α, SDF-1, and sphingosine-1-phosphate (S1P) was mixed with Matrigel prior to its injection into 5 mice. Five days later, the immune infiltration of the Matrigel plug was assessed using flow cytometry. The min to max box-and-whiskers graph represents the NK cell infiltration of n=5 mice from1 experiment. Data are also presented in Table S5 (Statistics Source Data). p-values were calculated using the Mann-Whitney test (*p < 0.05). (b) Representative FACS dot plots showing CD45+ and CD45+ CD3+ infiltration into the Matrigel plugs quantified in Fig. 5. The data are representative of n=2 independent experiments conducted with 5 mice each. (c) Biopsies from BJ-HELTRas tumor-bearing mice were analyzed by immunohistochemistry. Images showing immunofluorescence staining for NKp46 are shown. The white bar represents 20 µm. (d) Histology of BJ-HELTRas cells transduced with the indicated lentiviral vector and analyzed 7 days after their subcutaneous injection. See Supplementary Table 2 for quantification. All the information about antibodies is reported in Table S4. The white bar represents 10 µm. (e) The expression of TRF2dn was assessed in tumors formed in NK1.1-treated mice by immunoblotting with
anti-Myc antibodies, which recognized Myc-tagged TRF2. (f) The percentage of tumor cells expressing TRF2dn was assayed by tissue analysis with anti-Myc antibodies. The values represent the mean percentage of Myc-positive cells from four tumors. “Untreated” refer to samples of TRF2dn cells two days after their injection in mice that have not been treated with NK1.1 antibodies. The white bar represents 10 µm. (g) Mice were injected with BJ-HELTRas cells at 5 × 10⁵ cells/mouse on day 1. The mice were treated with anti-IFN-γ monoclonal antibodies (clone XMG 1.2) at 0.5 mg/mouse on days 0, 4, and 7. Tumor formation was assessed based on palpability; the results are expressed as the percentage of tumor-free mice at the indicated time points after cell injection following NK cell depletion. n=3 mice per condition. One of two independent experiments is shown. Data for both experiments are presented in Table S5 (Statistics Source Data). (h) Nude mice were injected with i.m. with BJ-HELTRas cells or TRF2dn overexpressing BJ-HELTRas cells and treated or not with the ATM inhibitor KU-55933. After 5 days, microtumors were analyzed by immunohistochemistry for the phosphorylation of ATM, NKp46 infiltration and IFN-γ expression. The white bar represents 10 µm. Data for n=2 independent experiments are presented in Table S5 (Statistics Source Data). Quantifications are presented in Figure 6f.
© 2013 Macmillan Publishers Limited. All rights reserved.
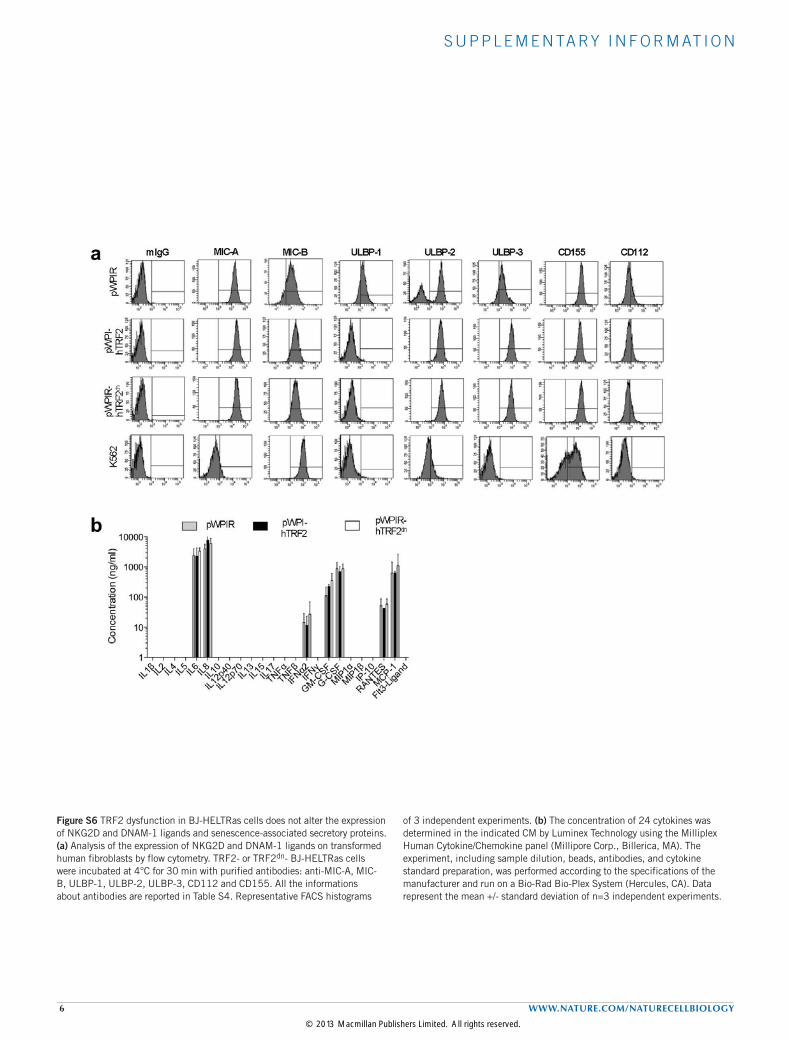
S U P P L E M E N TA RY I N F O R M AT I O N
6 WWW.NATURE.COM/NATURECELLBIOLOGY
Figure S6 TRF2 dysfunction in BJ-HELTRas cells does not alter the expression of NKG2D and DNAM-1 ligands and senescence-associated secretory proteins. (a) Analysis of the expression of NKG2D and DNAM-1 ligands on transformed human fibroblasts by flow cytometry. TRF2- or TRF2dn- BJ-HELTRas cells were incubated at 4°C for 30 min with purified antibodies: anti-MIC-A, MIC-B, ULBP-1, ULBP-2, ULBP-3, CD112 and CD155. All the informations about antibodies are reported in Table S4. Representative FACS histograms
of 3 independent experiments. (b) The concentration of 24 cytokines was determined in the indicated CM by Luminex Technology using the Milliplex Human Cytokine/Chemokine panel (Millipore Corp., Billerica, MA). The experiment, including sample dilution, beads, antibodies, and cytokine standard preparation, was performed according to the specifications of the manufacturer and run on a Bio-Rad Bio-Plex System (Hercules, CA). Data represent the mean +/- standard deviation of n=3 independent experiments.
© 2013 Macmillan Publishers Limited. All rights reserved.

S U P P L E M E N TA RY I N F O R M AT I O N
WWW.NATURE.COM/NATURECELLBIOLOGY 7
Figure S7 Cells used for assaying HS3ST4 expression did not show DDR activation. Western blot analysis of the phosphorylation of ATM and CHK1 in the samples of BJ-HELTRas cells either overexpressing or down-regulating TRF2 used for the HS3ST4 experiments of Figure 7. All the information about antibodies is reported in Table S4.
© 2013 Macmillan Publishers Limited. All rights reserved.
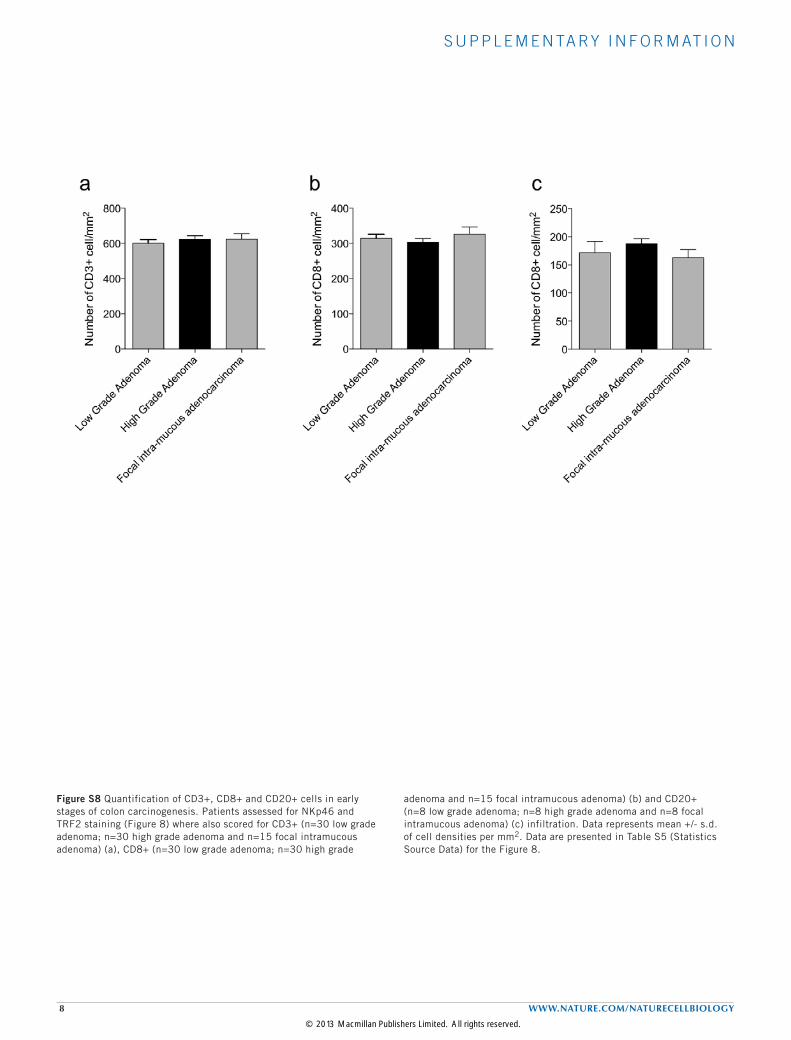
S U P P L E M E N TA RY I N F O R M AT I O N
8 WWW.NATURE.COM/NATURECELLBIOLOGY
Figure S8 Quantification of CD3+, CD8+ and CD20+ cells in early stages of colon carcinogenesis. Patients assessed for NKp46 and TRF2 staining (Figure 8) where also scored for CD3+ (n=30 low grade adenoma; n=30 high grade adenoma and n=15 focal intramucous adenoma) (a), CD8+ (n=30 low grade adenoma; n=30 high grade
adenoma and n=15 focal intramucous adenoma) (b) and CD20+ (n=8 low grade adenoma; n=8 high grade adenoma and n=8 focal intramucous adenoma) (c) infiltration. Data represents mean +/- s.d. of cell densities per mm2. Data are presented in Table S5 (Statistics Source Data) for the Figure 8.
© 2013 Macmillan Publishers Limited. All rights reserved.

S U P P L E M E N TA RY I N F O R M AT I O N
WWW.NATURE.COM/NATURECELLBIOLOGY 9
72 kD
55 kD 250 kD
100 kD
250 kD
100 kD
72 kD 55 kD 43 kD
72 kD 55 kD 43 kD
3a
4a 4b
Figure S9 Uncropped Western blots. The white boxes refer to the part of the blot presented in the main figure.
© 2013 Macmillan Publishers Limited. All rights reserved.