TRES: Tensor Regression with Envelope Structure
44
Package ‘TRES’ October 20, 2021 Type Package Title Tensor Regression with Envelope Structure Version 1.1.5 Date 2021-10-19 Description Provides three estimators for tensor response regression (TRR) and tensor predictor re- gression (TPR) models with tensor envelope structure. The three types of estimation ap- proaches are generic and can be applied to any envelope estimation problems. The full Grass- mannian (FG) optimization is often associated with likelihood-based estimation but re- quires heavy computation and good initialization; the one-directional optimization ap- proaches (1D and ECD algorithms) are faster, stable and does not require carefully chosen ini- tial values; the SIMPLS-type is motivated by the partial least squares regression and is computa- tionally the least expensive. For de- tails of TRR, see Li L, Zhang X (2017) <doi:10.1080/01621459.2016.1193022>. For de- tails of TPR, see Zhang X, Li L (2017) <doi:10.1080/00401706.2016.1272495>. For de- tails of 1D algo- rithm, see Cook RD, Zhang X (2016) <doi:10.1080/10618600.2015.1029577>. For de- tails of ECD algo- rithm, see Cook RD, Zhang X (2018) <doi:10.5705/ss.202016.0037>. For more de- tails of the package, see Zeng J, Wang W, Zhang X (2021) <doi:10.18637/jss.v099.i12>. License GPL-3 Encoding UTF-8 Language en-US LazyData true Depends R (>= 3.6.0), ManifoldOptim (>= 1.0.0) Imports MASS, methods, pracma (>= 2.2.5), rTensor (>= 1.4), stats URL https://github.com/leozeng15/TRES BugReports https://github.com/leozeng15/TRES/issues RcppModules ManifoldOptim_module RoxygenNote 7.1.2 NeedsCompilation no 1
Transcript of TRES: Tensor Regression with Envelope Structure
Package ‘TRES’October 20, 2021
Type Package
Title Tensor Regression with Envelope Structure
Version 1.1.5
Date 2021-10-19
Description Provides three estimators for tensor response regression (TRR) and tensor predictor re-gression (TPR) models with tensor envelope structure. The three types of estimation ap-proaches are generic and can be applied to any envelope estimation problems. The full Grass-mannian (FG) optimization is often associated with likelihood-based estimation but re-quires heavy computation and good initialization; the one-directional optimization ap-proaches (1D and ECD algorithms) are faster, stable and does not require carefully chosen ini-tial values; the SIMPLS-type is motivated by the partial least squares regression and is computa-tionally the least expensive. For de-tails of TRR, see Li L, Zhang X (2017) <doi:10.1080/01621459.2016.1193022>. For de-tails of TPR, see Zhang X, Li L (2017) <doi:10.1080/00401706.2016.1272495>. For de-tails of 1D algo-rithm, see Cook RD, Zhang X (2016) <doi:10.1080/10618600.2015.1029577>. For de-tails of ECD algo-rithm, see Cook RD, Zhang X (2018) <doi:10.5705/ss.202016.0037>. For more de-tails of the package, see Zeng J, Wang W, Zhang X (2021) <doi:10.18637/jss.v099.i12>.
License GPL-3
Encoding UTF-8
Language en-US
LazyData true
Depends R (>= 3.6.0), ManifoldOptim (>= 1.0.0)
Imports MASS, methods, pracma (>= 2.2.5), rTensor (>= 1.4), stats
URL https://github.com/leozeng15/TRES
BugReports https://github.com/leozeng15/TRES/issues
RcppModules ManifoldOptim_module
RoxygenNote 7.1.2
NeedsCompilation no
1

2 R topics documented:
Repository CRAN
Suggests testthat (>= 2.1.0)
Author Wenjing Wang [aut],Jing Zeng [aut, cre],Xin Zhang [aut]
Maintainer Jing Zeng <[email protected]>
Date/Publication 2021-10-20 05:20:16 UTC
R topics documented:
TRES-package . . . . . . . . . . . . . . . . . . . . . . . . . . . . . . . . . . . . . . . 3bat . . . . . . . . . . . . . . . . . . . . . . . . . . . . . . . . . . . . . . . . . . . . . . 4ECD . . . . . . . . . . . . . . . . . . . . . . . . . . . . . . . . . . . . . . . . . . . . . 5EEG . . . . . . . . . . . . . . . . . . . . . . . . . . . . . . . . . . . . . . . . . . . . . 6FGfun . . . . . . . . . . . . . . . . . . . . . . . . . . . . . . . . . . . . . . . . . . . . 8kroncov . . . . . . . . . . . . . . . . . . . . . . . . . . . . . . . . . . . . . . . . . . . 9manifold1D . . . . . . . . . . . . . . . . . . . . . . . . . . . . . . . . . . . . . . . . . 10manifoldFG . . . . . . . . . . . . . . . . . . . . . . . . . . . . . . . . . . . . . . . . . 11MenvU_sim . . . . . . . . . . . . . . . . . . . . . . . . . . . . . . . . . . . . . . . . . 13oneD_bic . . . . . . . . . . . . . . . . . . . . . . . . . . . . . . . . . . . . . . . . . . 14OptM1D . . . . . . . . . . . . . . . . . . . . . . . . . . . . . . . . . . . . . . . . . . . 16OptMFG . . . . . . . . . . . . . . . . . . . . . . . . . . . . . . . . . . . . . . . . . . . 17OptStiefelGBB . . . . . . . . . . . . . . . . . . . . . . . . . . . . . . . . . . . . . . . 19plot.Tenv . . . . . . . . . . . . . . . . . . . . . . . . . . . . . . . . . . . . . . . . . . 21PMSE . . . . . . . . . . . . . . . . . . . . . . . . . . . . . . . . . . . . . . . . . . . . 22predict.Tenv . . . . . . . . . . . . . . . . . . . . . . . . . . . . . . . . . . . . . . . . . 24simplsMU . . . . . . . . . . . . . . . . . . . . . . . . . . . . . . . . . . . . . . . . . . 24square . . . . . . . . . . . . . . . . . . . . . . . . . . . . . . . . . . . . . . . . . . . . 25std_err . . . . . . . . . . . . . . . . . . . . . . . . . . . . . . . . . . . . . . . . . . . . 27subspace . . . . . . . . . . . . . . . . . . . . . . . . . . . . . . . . . . . . . . . . . . . 27summary.Tenv . . . . . . . . . . . . . . . . . . . . . . . . . . . . . . . . . . . . . . . . 28Tenv_Pval . . . . . . . . . . . . . . . . . . . . . . . . . . . . . . . . . . . . . . . . . . 29TPR.fit . . . . . . . . . . . . . . . . . . . . . . . . . . . . . . . . . . . . . . . . . . . . 30TPRdim . . . . . . . . . . . . . . . . . . . . . . . . . . . . . . . . . . . . . . . . . . . 33TPRsim . . . . . . . . . . . . . . . . . . . . . . . . . . . . . . . . . . . . . . . . . . . 35TRR.fit . . . . . . . . . . . . . . . . . . . . . . . . . . . . . . . . . . . . . . . . . . . 36TRRdim . . . . . . . . . . . . . . . . . . . . . . . . . . . . . . . . . . . . . . . . . . . 39TRRsim . . . . . . . . . . . . . . . . . . . . . . . . . . . . . . . . . . . . . . . . . . . 41ttt . . . . . . . . . . . . . . . . . . . . . . . . . . . . . . . . . . . . . . . . . . . . . . 42
Index 44
TRES-package 3
TRES-package Tensor Regression with Envelope Structure
Description
Provides the ordinary least squares estimator and the three types of tensor envelope structured es-timators for tensor response regression (TRR) and tensor predictor regression (TPR) models. Thethree types of tensor envelope structured approaches are generic and can be applied to any envelopeestimation problems. The full Grassmannian (FG) optimization is often associated with likelihood-based estimation but requires heavy computation and good initialization; the one-directional op-timization approaches (1D and ECD algorithms) are faster, stable and does not require carefullychosen initial values; the SIMPLS-type is motivated by the partial least squares regression and iscomputationally the least expensive.
Author(s)
Wenjing Wang, Jing Zeng and Xin Zhang
References
Zeng J., Wang W., Zhang X. (2021) TRES: An R Package for Tensor Regression and EnvelopeAlgorithms. Journal of Statistical Software, 99(12), 1-31. doi:10.18637/jss.v099.i12.
Cook, R.D. and Zhang, X. (2016). Algorithms for envelope estimation. Journal of Computationaland Graphical Statistics, 25(1), pp.284-300.
Li, L. and Zhang, X. (2017). Parsimonious tensor response regression. Journal of the AmericanStatistical Association, 112(519), pp.1131-1146.
Zhang, X. and Li, L. (2017). Tensor envelope partial least-squares regression. Technometrics,59(4), pp.426-436.
Cook, R.D. and Zhang, X. (2018). Fast envelope algorithms. Statistica Sinica, 28(3), pp.1179-1197.
See Also
Useful links:
• https://github.com/leozeng15/TRES
• Report bugs at https://github.com/leozeng15/TRES/issues
Examples
library(TRES)## Load data "bat"data("bat")x <- bat$xy <- bat$y
## 1. Fitting with OLS method.fit_ols <- TRR.fit(x, y, method="standard")
4 bat
## Print cofficientcoef(fit_ols)
## Print the summarysummary(fit_ols)
## Extract the mean squared error, p-value and standard error from summarysummary(fit_ols)$msesummary(fit_ols)$p_valsummary(fit_ols)$se
## Make the prediction on the original datasetpredict(fit_ols, x)
## Draw the plots of two-way coefficient tensor (i.e., matrix) and p-value tensor.plot(fit_ols)
## 2. Fitting with 1D envelope algorithm. (time-consuming)
fit_1D <- TRR.fit(x, y, u = c(14,14), method="1D") # pass envelope rank (14,14)coef(fit_1D)summary(fit_1D)predict(fit_1D, x)plot(fit_1D)
bat Bat simulated data
Description
Synthetic data generated from tensor response regression (TRR) model. Each response observationis a two-dimensional image, and each binary predictor observation takes values 0 and 1, representingtwo groups.
Usage
data("bat")
Format
A list consisting of four components:
x A 1× 20 matrix, each entry takes values 0 and 1, representing two groups.
y A 64× 64× 20 tensor, each matrix y@data[,,i] represents an image.
coeffiicients A 64× 64× 1 tensor with the bat pattern.
Gamma A list consisting of two 64× 14 envelope basis.

ECD 5
Details
The dataset is generated from the tensor response regression (TRR) model:
Yi = BXi + εi, i = 1, . . . , n,
where n = 20 and the regression coefficient B ∈ R64×64 is a given image with rank 14, rep-resenting the mean difference of the response Y between two groups. To make the model con-form to the envelope structure, we construct the envelope basis Γk and the covariance matricesΣk, k = 1, 2, of error term as following. With the singular value decomposition of B, namelyB = Γ1ΛΓT
2 , we choose the envelope basis as Γk ∈ R64×14, k = 1, 2. Then the envelope di-mensions are u1 = u2 = 14. We generate another two matrices Ωk ∈ R14×14 = AkA
Tk and
Ω0k ∈ R50×50 = A0kAT0k, where Ak ∈ R14×14 and A0k ∈ R50×50 are randomly generated from
Uniform(0,1) elementwise. Then we set the covariance matrices Σk = ΓkΩkΓTk + Γ0kΩ0kΓT
0k, fol-lowed by normalization with their Frobenius norms. We set the first 10 predictorsXi, i = 1, . . . , 10,as 1 and the rest as 0. The error term is then generated from two-way tensor (matrix) normal distri-bution TN(0; Σ1,Σ2).
References
Li, L. and Zhang, X., 2017. Parsimonious tensor response regression. Journal of the AmericanStatistical Association, 112(519), pp.1131-1146.
Examples
## Fit bat dataset with the tensor response regression modeldata("bat")x <- bat$xy <- bat$y# Model fitting with ordinary least square.fit_std <- TRR.fit(x, y, method="standard")# Draw the coefficient and p-value plotsplot(fit_std)
ECD ECD algorithm for estimating the envelope subspace
Description
Estimate the envelope subspace with specified dimension based on ECD algorithm proposed byCook, R. D., & Zhang, X. (2018).
Usage
ECD(M, U, u, ...)

6 EEG
Arguments
M The p-by-p positive definite matrix M in the envelope objective function.
U The p-by-p positive semi-definite matrix U in the envelope objective function.
u An integer between 0 and n representing the envelope dimension.
... Additional user-defined arguments:
• maxiter: The maximal number of iterations.• tol: The tolerance used to assess convergence. See the ECD algorithm in
Cook, R. D., & Zhang, X. (2018).
The default values are: maxiter=500; tol=1e-08.
Details
Estimate M-envelope of span(U). The dimension of the envelope is u.
See FGfun for the generic objective function.
The ECD algorithm is similar to 1D algorithm proposed by Cook, R. D., & Zhang, X. (2016). Afast and stable algorithm is used for solving each individual objective function.
Value
Return the orthogonal basis of the envelope subspace with each column represent the sequentialdirection. For example, the first column is the most informative direction.
References
Cook, R.D. and Zhang, X., 2018. Fast envelope algorithms. Statistica Sinica, 28(3), pp.1179-1197.
Examples
##simulate two matrices M and U with an envelope structure#data <- MenvU_sim(p = 20, u = 5, wishart = TRUE, n = 200)M <- data$MU <- data$UG <- data$GammaGamma_ECD <- ECD(M, U, u=5)subspace(Gamma_ECD, G)
EEG Electroencephalography (EEG) dataset for alcoholism study.
Description
EEG images data of subjects in alcoholic and control groups.

EEG 7
Usage
data("EEG")
Format
A list consisting of two components:
x A binary vector with length of 61.y A 64× 64× 61 tensor, consisting of 61 channels by time EEG images.
Details
The original EEG data contains 77 alcoholic individuals and 45 controls. To reduce the size, werandomly select 61 samples and obtain 39 alcoholic individuals and 22 controls. Each individualwas measured with 64 electrodes placed on the scalp sampled at 256 Hz for 1 sec, resulting an EEGimage of 64 channels by 256 time points. More information about data collection and some analysiscan be found in Zhang et al. (1995) and Li, Kim, and Altman (2010). To facilitate the analysis, thedata is downsized along the time domain by averaging every four consecutive time points, yieldinga 64 × 64 matrix response.
References
URL: https://archive.ics.uci.edu/ml/datasets/EEG+Database.
Li, L. and Zhang, X., 2017. Parsimonious tensor response regression. Journal of the AmericanStatistical Association, 112(519), pp.1131-1146.
Zhang, X.L., Begleiter, H., Porjesz, B., Wang, W. and Litke, A., 1995. Event related potentialsduring object recognition tasks. Brain research bulletin, 38(6), pp.531-538.
Li, B., Kim, M.K. and Altman, N., 2010. On dimension folding of matrix-or array-valued statisticalobjects. The Annals of Statistics, 38(2), pp.1094-1121.
Examples
data("EEG")x <- EEG$xy <- EEG$y## Estimate the envelope dimension, the output should be c(1,1).
u <- TRRdim(x, y)$uu <- c(1,1)
## Fit the dataset with TRR.fit and draw the coefficient plot and p-value plotfit_1D <- TRR.fit(x, y, u, method = "1D")plot(fit_1D, xlab = "Time", ylab = "Channels")
## Uncomment display the plots from different methods.# fit_ols <- TRR.fit(x, y, method = "standard")# fit_pls <- TRR.fit(x, y, u, method = "PLS")# plot(fit_ols, xlab = "Time", ylab = "Channels")# plot(fit_pls, xlab = "Time", ylab = "Channels")
8 FGfun
FGfun The Objective function and its gradient
Description
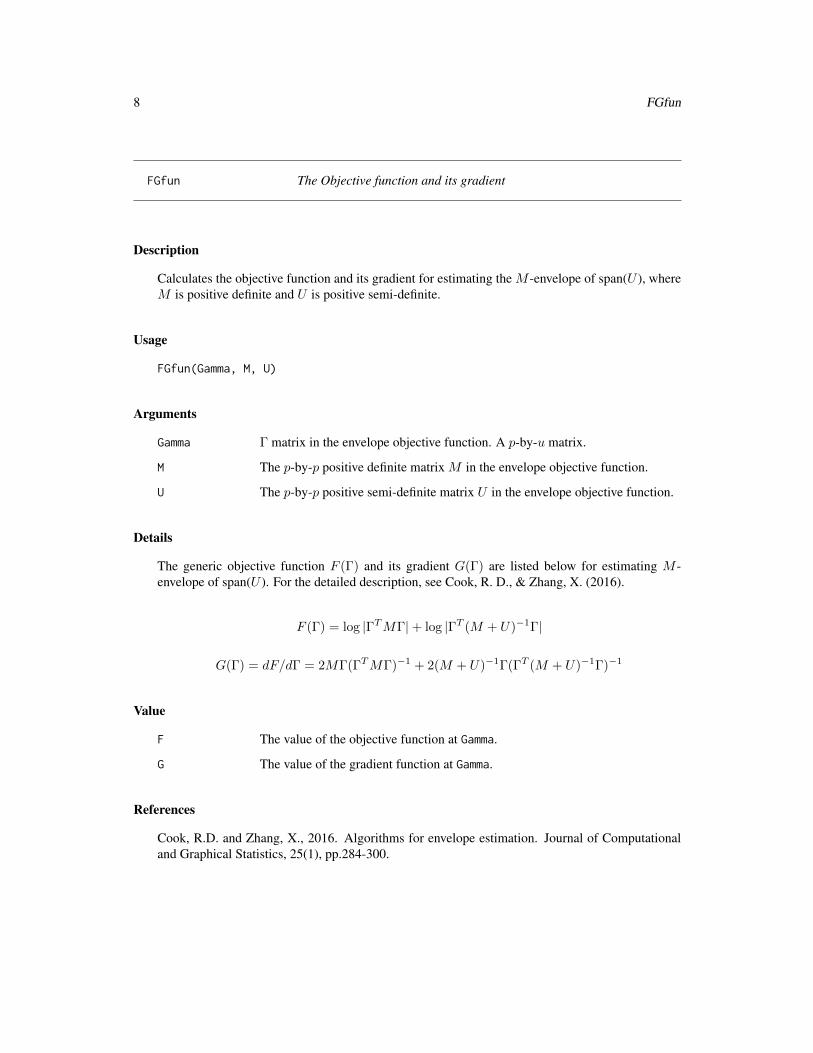
Calculates the objective function and its gradient for estimating the M -envelope of span(U ), whereM is positive definite and U is positive semi-definite.
Usage
FGfun(Gamma, M, U)
Arguments
Gamma Γ matrix in the envelope objective function. A p-by-u matrix.
M The p-by-p positive definite matrix M in the envelope objective function.
U The p-by-p positive semi-definite matrix U in the envelope objective function.
Details
The generic objective function F (Γ) and its gradient G(Γ) are listed below for estimating M -envelope of span(U ). For the detailed description, see Cook, R. D., & Zhang, X. (2016).
F (Γ) = log |ΓTMΓ|+ log |ΓT (M + U)−1Γ|
G(Γ) = dF/dΓ = 2MΓ(ΓTMΓ)−1 + 2(M + U)−1Γ(ΓT (M + U)−1Γ)−1
Value
F The value of the objective function at Gamma.
G The value of the gradient function at Gamma.
References
Cook, R.D. and Zhang, X., 2016. Algorithms for envelope estimation. Journal of Computationaland Graphical Statistics, 25(1), pp.284-300.
kroncov 9
kroncov The covariance estimation of tensor normal distribution
Description
This function provides the MLE of the covariance matrix of tensor normal distribution, where thecovariance has a separable Kronecker structure, i.e. Σ = Σm ⊗ . . . ⊗ Σ1. The algorithm is ageneralization of the MLE algorithm in Manceur, A. M., & Dutilleul, P. (2013).
Usage
kroncov(Tn, tol = 1e-06, maxiter = 10)
Arguments
Tn A p1 × · · · pm × n matrix, array or tensor, where n is the sample size.
tol The convergence tolerance with default value 1e-6. The iteration terminateswhen ||Σ(t+1)
i − Σ(t)i ||F < tol for some covariance matrix Σi.
maxiter The maximal number of iterations. The default value is 10.
Details
The individual component covariance matrices Σi, i = 1, . . . ,m are not identifiable. To overcomethe identifiability issue, each matrix Σi is normalized at the end of the iteration such that ||Σi||F =1. And an overall normalizing constant λ is extracted so that the overall covariance matrix Σ isdefined as
Σ = λΣm ⊗ · · · ⊗ Σ1.
If Tn is a p×n design matrix for a multivariate random variable, then lambda = 1 and S is a length-one list containing the sample covariance matrix.
Value
lambda The normalizing constant.
S A matrix list, consisting of each normalized covariance matrix Σ1, . . . ,Σm.
References
Manceur, A.M. and Dutilleul, P., 2013. Maximum likelihood estimation for the tensor normaldistribution: Algorithm, minimum sample size, and empirical bias and dispersion. Journal of Com-putational and Applied Mathematics, 239, pp.37-49.
10 manifold1D
manifold1D Estimate the envelope subspace (ManifoldOptim 1D)
Description
The 1D algorithm (Cook and Zhang 2016) implemented with Riemannian manifold optimizationfrom R package ManifoldOptim.
Usage
manifold1D(M, U, u, ...)
Arguments
M The p-by-p positive definite matrix M in the envelope objective function.
U The p-by-p positive semi-definite matrix U in the envelope objective function.
u An integer between 0 and n representing the envelope dimension.
... Additional user-defined arguments:
• maxiter: The maximal number of iterations.• tol: The tolerance used to assess convergence. See Huang et al. (2018) for
details on how this is used.• method: The name of optimization method supported by R package Mani-
foldOptim.– "LRBFGS": Limited-memory RBFGS– "LRTRSR1": Limited-memory RTRSR1– "RBFGS": Riemannian BFGS– "RBroydenFamily": Riemannian Broyden family– "RCG": Riemannian conjugate gradients– "RNewton": Riemannian line-search Newton– "RSD": Riemannian steepest descent– "RTRNewton": Riemannian trust-region Newton– "RTRSD": Riemannian trust-region steepest descent– "RTRSR1": Riemannian trust-region symmetric rank-one update– "RWRBFGS": Riemannian BFGS
• check: Logical value. Should internal manifold object check inputs andprint summary message before optimization.
The default values are: maxiter = 500; tol = 1e-08; method = "RCG"; check= FALSE.
Details
Estimate M-envelope of span(U). The dimension of the envelope is u.
manifoldFG 11
Value
Return the estimated orthogonal basis of the envelope subspace.
References
Cook, R.D. and Zhang, X., 2016. Algorithms for envelope estimation. Journal of Computationaland Graphical Statistics, 25(1), pp.284-300.
Huang, W., Absil, P.A., Gallivan, K.A. and Hand, P., 2018. ROPTLIB: an object-oriented C++library for optimization on Riemannian manifolds. ACM Transactions on Mathematical Software(TOMS), 44(4), pp.1-21.
See Also
MenvU_sim,subspace
Examples
## Simulate two matrices M and U with an envelope structuredata <- MenvU_sim(p = 20, u = 5, wishart = TRUE, n = 200)M <- data$MU <- data$UG <- data$GammaGamma_1D <- manifold1D(M, U, u = 5)subspace(Gamma_1D, G)
manifoldFG Estimate the envelope subspace (ManifoldOptim FG)
Description
The FG algorithm (Cook and Zhang 2016) implemented with Riemannian manifold optimizationfrom R package ManifoldOptim.
Usage
manifoldFG(M, U, u, Gamma_init = NULL, ...)
Arguments
M The p-by-p positive definite matrix M in the envelope objective function.
U The p-by-p positive semi-definite matrix U in the envelope objective function.
u An integer between 0 and n representing the envelope dimension. Ignored ifGamma_init is provided.
Gamma_init Initial envelope subspace basis. The default value is the estimator from manifold1D(M,U,u).
... Additional user-defined arguments:
12 manifoldFG
• maxiter: The maximal number of iterations.• tol: The tolerance used to assess convergence. See Huang et al. (2018) for
details on how this is used.• method: The name of optimization method supported by R package Mani-
foldOptim– "LRBFGS": Limited-memory RBFGS– "LRTRSR1": Limited-memory RTRSR1– "RBFGS": Riemannian BFGS– "RBroydenFamily": Riemannian Broyden family– "RCG": Riemannian conjugate gradients– "RNewton": Riemannian line-search Newton– "RSD": Riemannian steepest descent– "RTRNewton": Riemannian trust-region Newton– "RTRSD": Riemannian trust-region steepest descent– "RTRSR1": Riemannian trust-region symmetric rank-one update– "RWRBFGS": Riemannian BFGS
• check: Logical value. Should internal manifold object check inputs andprint summary message before optimization.
The default values are: maxiter = 500; tol = 1e-08; method = "RCG"; check= FALSE.
Details
Estimate M-envelope of span(U). The dimension of the envelope is u.
Value
Return the estimated orthogonal basis of the envelope subspace.
References
Cook, R.D. and Zhang, X., 2016. Algorithms for envelope estimation. Journal of Computationaland Graphical Statistics, 25(1), pp.284-300.
Huang, W., Absil, P.A., Gallivan, K.A. and Hand, P., 2018. ROPTLIB: an object-oriented C++library for optimization on Riemannian manifolds. ACM Transactions on Mathematical Software(TOMS), 44(4), pp.1-21.
Examples
##simulate two matrices M and U with an envelope structuredata <- MenvU_sim(p=20, u=5, wishart = TRUE, n = 200)M <- data$MU <- data$UG <- data$GammaGamma_FG <- manifoldFG(M, U, u=5)subspace(Gamma_FG, G)

MenvU_sim 13
MenvU_sim Generate matrices M and U
Description
This function generates the matrices M and U with envelope structure.
Usage
MenvU_sim(p,u,Omega = NULL,Omega0 = NULL,Phi = NULL,jitter = FALSE,wishart = FALSE,n = NULL
)
Arguments
p Dimension of p-by-p matrix M .
u The envelope dimension. An integer between 0 and p.
Omega The positive definite matrix Ω in M = ΓΩΓT + Γ0Ω0ΓT0 . The default is Ω =
AAT where the elements in A are generated from Uniform(0,1) distribution.
Omega0 The positive definite matrix Ω0 in M = ΓΩΓT + Γ0Ω0ΓT0 . The default is Ω0 =
AAT where the elements in A are generated from Uniform(0,1) distribution.
Phi The positive definite matrix Φ in U = ΓΦΓT . The default is Φ = AAT wherethe elements in A are generated from Uniform(0,1) distribution.
jitter Logical or numeric. If it is numeric, the diagonal matrix diag(jitter,nrow(M),ncol(M))is added to matrix M to ensure the positive definiteness of M . If it is TRUE, thenit is set as 1e-5 and the jitter is added. If it is FALSE (default), no jitter is added.
wishart Logical. If it is TRUE, the sample estimator from Wishart distributionWp(M/n, n)and Wp(U/n, n) are generated as the output matrices M and U.
n The sample size. If wishart is FALSE, then n is ignored.
Details
The matrices M and U are in forms of
M = ΓΩΓT + Γ0Ω0ΓT0 , U = ΓΦΓT .
The envelope basis Γ is randomly generated from the Uniform (0, 1) distribution elementwise andthen transformed to a semi-orthogonal matrix. Γ0 is the orthogonal completion of Γ.
14 oneD_bic
In some cases, to guarantee that M is positive definite which is required by the definition of enve-lope, a jitter should be added to M .
If wishart is TRUE, after the matricesM andU are generated, the samples from Wishart distributionWp(M/n, n) and Wp(U/n, n) are output as matrices M and U . If so, n is required.
Value
M The p-by-p matrix M.
U The p-by-p matrix U.
Gamma The p-by-u envelope basis.
References
Cook, R.D. and Zhang, X., 2018. Fast envelope algorithms. Statistica Sinica, 28(3), pp.1179-1197.
Examples
data1 <- MenvU_sim(p = 20, u = 5)M1 <- data1$MU1 <- data1$U
# Sample version from Wishart distributiondata2 <- MenvU_sim(p = 20, u = 5, wishart = TRUE, n = 200)M2 <- data2$MU2 <- data2$U
oneD_bic Envelope dimension selection based on 1D-BIC
Description
This function selects envelope subspace dimension using 1D-BIC proposed by Zhang, X., & Mai,Q. (2018). The constrained optimization in the 1D algorithm is based on the line search algorithmfor optimization on manifold. The algorithm is developed by Wen and Yin (2013) and the Matlabversion is in the Matlab package OptM.
Usage
oneD_bic(M, U, n, C = 1, maxdim = 10, ...)
Arguments
M The p-by-p positive definite matrix M in the envelope objective function.
U The p-by-p positive semi-definite matrix U in the envelope objective function.
n The sample size.
C The constant defined in 1D-BIC criterion, the default value is 1.
oneD_bic 15
maxdim The maximum dimension to consider, maxdim is smaller than p, the default valueis 10.
... Additional user-defined arguments for the line search algorithm:• maxiter: The maximal number of iterations.• xtol: The convergence tolerance for the relative changes of the consecutive
iterates w, e.g., ||w(k) − w(k−1)||F /√p
• gtol: The convergence tolerance for the gradient of Lagrangian, e.g., ||G(k)−w(k)(G(t))Tw(t)||F
• ftol: The convergence tolerance for relative changes of the consecutiveobjective function values F , e.g., |F (k)−F (k−1)|/(1+ |F (k−1)|). Usually,maxxtol,gtol > ftol
The default values are: maxiter=500; xtol=1e-08; gtol=1e-08; ftol=1e-12.
Details
The objective function F (w) and its gradient G(w) in line search algorithm are:
F (w) = log |wTMkw|+ log |wT (Mk + Uk)−1w|
G(w) = dF/dw = 2(wTMkw)−1Mkw + 2(wT (Mk + Uk)−1w)−1(Mk + Uk)−1w
See Cook, R. D., & Zhang, X. (2016) for more details of the 1D algorithm.
The 1D-BIC criterion is defined as
I(k) =
k∑j=1
φj(wj) + Ck log(n)/n, k = 0, 1, . . . , p,
where C > 0 is a constant, w is the 1D solver, the function φj is the individual objective functionsolved by 1D algorithm, n is the sample size. Then the selected dimension u is the one yielding thesmallest 1D-BIC I(k). See Zhang, X., & Mai, Q. (2018) for more details.
As suggested by Zhang, X., & Mai, Q. (2018), the number C should be set to its default valueC = 1 when there is no additional model assumption or prior information. However, if additionalmodel assumption or prior information are known, C should be set such that Ck best matches thedegree-of-freedom or total number of free parameters of the model or estimation procedure. Forexample, in TRR model where the predictor design matrix is of dimension p × n, C should be setas p. See Zhang, X., & Mai, Q. (2018) for more details.
Value
bicval The BIC values for different envelope dimensions.u The dimension selected which corresponds to the smallest BIC values.Gamma The estimation of envelope subspace basis.
References
Zhang, X. and Mai, Q., 2018. Model-free envelope dimension selection. Electronic Journal ofStatistics, 12(2), pp.2193-2216.
Wen, Z. and Yin, W., 2013. A feasible method for optimization with orthogonality constraints.Mathematical Programming, 142(1-2), pp.397-434.
16 OptM1D
See Also
OptM1D,MenvU_sim
Examples
##simulate two matrices M and U with an envelope structuredata <- MenvU_sim(p = 20, u = 5, wishart = TRUE, n = 200)M <- data$MU <- data$Ubic <- oneD_bic(M, U, n = 200)## visualizationplot(1:10, bic$bicval, type="o", xlab="Envelope Dimension", ylab="BIC values",main="Envelope Dimension Selection")
OptM1D Estimate the envelope subspace (OptM 1D)
Description
The 1D algorithm to estimate the envelope subspace based on the line search algorithm for op-timization on manifold. The line search algorithm is developed by Wen and Yin (2013) and theMatlab version is implemented in the Matlab package OptM.
Usage
OptM1D(M, U, u, ...)
Arguments
M The p-by-p positive definite matrix M in the envelope objective function.
U The p-by-p positive semi-definite matrix U in the envelope objective function.
u An integer between 0 and n representing the envelope dimension.
... Additional user-defined arguments for the line search algorithm:
• maxiter: The maximal number of iterations.• xtol: The convergence tolerance for the relative changes of the consecutive
iterates w, e.g., ||w(k) − w(k−1)||F /√p
• gtol: The convergence tolerance for the gradient of Lagrangian, e.g., ||G(k)−w(k)(G(t))Tw(t)||F
• ftol: The convergence tolerance for relative changes of the consecutiveobjective function values F , e.g., |F (k)−F (k−1)|/(1+ |F (k−1)|). Usually,maxxtol,gtol > ftol
The default values are: maxiter=500; xtol=1e-08; gtol=1e-08; ftol=1e-12.
OptMFG 17
Details
The objective function F (w) and its gradient G(w) in line search algorithm are:
F (w) = log |wTMkw|+ log |wT (Mk + Uk)−1w|
G(w) = dF/dw = 2(wTMkw)−1Mkw + 2(wT (Mk + Uk)−1w)−1(Mk + Uk)−1w
See Cook, R. D., & Zhang, X. (2016) for more details of the 1D algorithm.
Value
Return the estimated orthogonal basis of the envelope subspace.
References
Cook, R.D. and Zhang, X., 2016. Algorithms for envelope estimation. Journal of Computationaland Graphical Statistics, 25(1), pp.284-300.
Wen, Z. and Yin, W., 2013. A feasible method for optimization with orthogonality constraints.Mathematical Programming, 142(1-2), pp.397-434.
Examples
## Simulate two matrices M and U with an envelope structuredata <- MenvU_sim(p = 20, u = 5, wishart = TRUE, n = 200)M <- data$MU <- data$UG <- data$GammaGamma_1D <- OptM1D(M, U, u = 5)subspace(Gamma_1D, G)
OptMFG Estimate the envelope subspace (OptM FG)
Description
The FG algorithm to estimate the envelope subspace based on the curvilinear search algorithm foroptimization on Stiefel manifold. The curvilinear algorithm is developed by Wen and Yin (2013)and the Matlab version is implemented in the Matlab package OptM.
Usage
OptMFG(M, U, u, Gamma_init = NULL, ...)

18 OptMFG
Arguments
M The p-by-p positive definite matrix M in the envelope objective function.U The p-by-p positive semi-definite matrix U in the envelope objective function.u An integer between 0 and n representing the envelope dimension. Ignored if
Gamma_init is provided.Gamma_init Initial envelope subspace basis. The default value is the estimator from OptM1D(M,U,u).... Additional user-defined arguments for the curvilinear search algorithm:
• maxiter: The maximal number of iterations.• xtol: The convergence tolerance for Γ, e.g., ||Γ(k) − Γ(k−1)||F /
√p
• gtol: The convergence tolerance for the projected gradient, e.g., ||G(k) −Γ(k)(G(t))T Γ(t)||F
• ftol: The convergence tolerance for objective function F , e.g., |F (k) −F (k−1)|/(1 + |F (k−1)|). Usually, maxxtol,gtol > ftol
The default values are: maxiter=500; xtol=1e-08; gtol=1e-08; ftol=1e-12.
Details
If Gamma_init is provided, then the envelope dimension u = ncol(Gamma_init).
The function OptMFG calls the function OptStiefelGBB internally which implements the curvilinearsearch algorithm.
The objective function F (Γ) and its gradient G(Γ) in curvilinear search algorithm are:
F (Γ) = log |ΓTMΓ|+ log |ΓT (M + U)−1Γ|
G(Γ) = dF/dΓ = 2MΓ(ΓTMΓ)−1 + 2(M + U)−1Γ(ΓT (M + U)−1Γ)−1
Value
Return the estimated orthogonal basis of the envelope subspace.
References
Wen, Z. and Yin, W., 2013. A feasible method for optimization with orthogonality constraints.Mathematical Programming, 142(1-2), pp.397-434.
See Also
OptStiefelGBB
Examples
##simulate two matrices M and U with an envelope structuredata <- MenvU_sim(p=20, u=5, wishart = TRUE, n = 200)M <- data$MU <- data$UG <- data$GammaGamma_FG <- OptMFG(M, U, u=5)subspace(Gamma_FG, G)
OptStiefelGBB 19
OptStiefelGBB Optimization on Stiefel manifold
Description
Curvilinear search algorithm for optimization on Stiefel manifold developed by Wen and Yin (2013).
Usage
OptStiefelGBB(X, fun, opts = NULL, ...)
Arguments
X Initial value to start the optimization. A n by k orthonormal matrix such thatXTX = Ik.
fun The function that returns the objective function value and its gradient. The syn-tax for fun is fun(X,data1,data2) where data1,data2 are additional datapassed to ....
opts A list specifying additional user-defined arguments for the curvilinear searchalgorithm. Some important ones are listed in the following:
• maxiter: The maximal number of iterations.• xtol: The convergence tolerance for X , e.g., ||X(t) −X(t−1)||F /
√k.
• gtol: The convergence tolerance for the gradient of the Lagrangian func-tion, e.g., ||G(t) −X(t)(G(t))TX(t)||F .
• ftol: The convergence tolerance for objective function F , e.g., |F (t) −F (t−1)|/(1 + |F (t−1)|). Usually, maxxtol,gtol > ftol.
The default values are: maxiter=500; xtol=1e-08; gtol=1e-08; ftol=1e-12.
... Additional input passed to fun.
Details
The calling syntax is OptStiefelGBB(X,fun,opts,data1,data2), where fun(X,data1,data2)returns the objective function value and its gradient.
For example, for n by k matrix X , the optimization problem is
minX − tr(XTWX), such that XTX = Ik.
The objective function and its gradient are
F (X) = −tr(XTWX), G(X) = −2WX.
Then we need to provide the function fun(X,W) which returns F (X) and G(X). See Examplesfor details.
For more details of the termination rules and the tolerances, we refer the interested readers to Section5.1 of Wen and Yin (2013).
20 OptStiefelGBB
Value
X The converged solution of the optimization problem.
out Output information, including estimation error, function value, iteration timesetc.
• nfe: The total number of line search attempts.• msg: Message: "convergence" | "exceed max iteration".• feasi: The feasibility of solution: ||XTX − Ik||F .• nrmG: The convergence criterion based on the projected gradient ||G −XGTX||F .
• fval: The objective function value F (X) at termination.• iter: The number of iterations.
References
Wen, Z. and Yin, W., 2013. A feasible method for optimization with orthogonality constraints.Mathematical Programming, 142(1-2), pp.397-434.
Examples
n <- 1000k <- 6
# Randomly generated matrix MW <- matrix(rnorm(n^2), n, n)W <- t(W) %*% W
# Randomly generated orthonormal initial matrixX0 <- matrix(rnorm(n*k), n, k)X0 <- qr.Q(qr(X0))
# The objective function and its gradientfun <- function(X, W)
F <- - sum(diag(t(X) %*% W %*% X))G <- - 2*(W %*% X)return(list(F = F, G = G))
# Options listopts<-list(record = 0, maxiter = 1000, xtol = 1e-5, gtol = 1e-5, ftol = 1e-8)
# Main partoutput <- OptStiefelGBB(X0, fun, opts, W)X <- output$Xout <- output$out
plot.Tenv 21
plot.Tenv Plot coefficients and p-value for Tenv object.
Description
Plot method for object returned from TRR.fit and TPR.fit functions.
Usage
## S3 method for class 'Tenv'plot(x,level = 0.05,main = paste0("Coefficient plot ", "(", x$method, ")"),main_p = paste0("P value plot ", "(", x$method, ")"),xlab = "",ylab = "",axes = TRUE,ask = TRUE,...
)
Arguments
x An object of class "Tenv", as the ones returned from TPR.fit or TRR.fit.
level The significant level of p-value. Default is 0.05.
main The title of coefficient plot.
main_p The title of p-value plot.
xlab The title of x-axis.
ylab The title of y-axis.
axes A logical value specifying whether the axes should be drawn.
ask A logical value. If it is TRUE (default), user is prompted before the second plotis shown (if exists).
... Other parameters to be passed to the plotting functions.
Details
coef(x) must be a two-way tensor or a matrix.
Since p-value depend on cov−1vec(X)which is unavailable for the ultra-high dimensional vec(X)
in tensor predictor regression (TPR), the p-value plot is not provided for the object returned fromTPR.fit. Therefore, for the object return from TPR.fit, only the coefficients plot is displayed.And for the object return from TRR.fit, both the coefficients plot and p-value plot are displayed.
main and main_p control the titles of coefficient plot and p-value plot separately. Some otherarguments used in function graphics::image, e.g., xlim,ylim,zlim,col,xaxs,yaxs,etc., canbe passed to ...

22 PMSE
ask can be set as FALSE if the pause before the second plot is not preferred. If x is an object fromTPR.fit, no pause is enabled.
Value
No return value.
See Also
TRR.fit,TPR.fit
Examples
data("bat")x <- bat$xy <- bat$yfit <- TRR.fit(x, y, method="standard")plot(fit)
## Change the significant level to 0.1plot(fit, level = 0.1)
PMSE Prediction and mean squared error.
Description
Evaluate the tensor response regression (TRR) or tensor predictor regression (TPR) model throughthe mean squared error.
Usage
PMSE(x, y, B)
Arguments
x A predictor tensor, array, matrix or vector.
y A response tensor, array, matrix or vector.
B An coefficient tensor tensor, array, matrix or vector.
Details
There are three situations:
• TRR model: If y is an m-way tensor (array), x should be matrix or vector and B should betensor or array.
• TPR model: If x is an m-way tensor (array), y should be matrix or vector and B should betensor or array.
PMSE 23
• Other: If x and y are both matrix or vector, B should be matrix. In this case, the prediction iscalculated as pred = B*X.
In any cases, users are asked to ensure the dimensions of x, y and B match. See TRRsim and TPRsimfor more details of the TRR and TPR models.
Let Yi denote each prediction, then the mean squared error is defined as 1/n∑n
i=1 ||Yi − Yi||2F ,where || · ||F denotes the Frobenius norm.
Value
mse The mean squared error.
pred The predictions.
See Also
TRRsim,TPRsim.
Examples
## Dataset in TRR modelr <- c(10, 10, 10)u <- c(2, 2, 2)p <- 5n <- 100dat <- TRRsim(r = r, p = p, u = u, n = n)x <- dat$xy <- dat$y
# Fit data with TRR.fitfit_std <- TRR.fit(x, y, method="standard")result <- PMSE(x, y, fit_std$coefficients)## Dataset in TPR modelp <- c(10, 10, 10)u <- c(1, 1, 1)r <- 5n <- 200dat <- TPRsim(p = p, r = r, u = u, n = n)x <- dat$xy <- dat$y
# Fit data with TPR.fitfit_std <- TPR.fit(x, y, u, method="standard")result <- PMSE(x, y, fit_std$coefficients)
24 simplsMU
predict.Tenv Predict method for Tenv object.
Description
Predict response for the object returned from TRR.fit and TPR.fit functions.
Usage
## S3 method for class 'Tenv'predict(object, newdata, ...)
Arguments
object An object of class "Tenv", as the ones returned from TPR.fit or TRR.fit.
newdata The data to be used for prediction. It can be a vector, a matrix or a tensor ifobject is returned fromTRR.fit, and can be a matrix or a tensor if object isreturned from TPR.fit.
... Additional arguments. No available arguments exist in this version.
Value
Return the predicted response.
Note
If newdata is missing, the fitted response from object is returned.
Examples
data("bat")x <- bat$xy <- bat$yfit <- TRR.fit(x, y, method="standard")predict(fit, x)
simplsMU SIMPLS-type algorithm for estimating the envelope subspace
Description
This algorithm is a generalization of the SIMPLS algorithm in De Jong, S. (1993). See Cook(2018) Section 6.5 for more details of this generalized moment-based envelope algorithm; see Cook,Helland, and Su (2013) for a connection between SIMPLS and the predictor envelope in linearmodel.
square 25
Usage
simplsMU(M, U, u)
Arguments
M The p-by-p positive definite matrix M in the envelope objective function.
U The p-by-p positive semi-definite matrix U in the envelope objective function.
u An integer between 0 and n representing the envelope dimension.
Value
Returns the estimated orthogonal basis of the envelope subspace.
References
De Jong, S., 1993. SIMPLS: an alternative approach to partial least squares regression. Chemomet-rics and intelligent laboratory systems, 18(3), pp.251-263.
Cook, R.D., Helland, I.S. and Su, Z., 2013. Envelopes and partial least squares regression. Journalof the Royal Statistical Society: Series B (Statistical Methodology), 75(5), pp.851-877.
Cook, R.D., 2018. An introduction to envelopes: dimension reduction for efficient estimation inmultivariate statistics (Vol. 401). John Wiley & Sons.
Examples
##simulate two matrices M and U with an envelope structure#data <- MenvU_sim(p = 20, u = 5, wishart = TRUE, n = 200)M <- data$MU <- data$UG <- data$GammaGamma_pls <- simplsMU(M, U, u=5)subspace(Gamma_pls, G)
square Square simulated data
Description
Synthetic data generated from tensor predictor regression (TPR) model. Each response observationis univariate, and each predictor observation is a matrix.
Usage
data("square")
26 square
Format
A list consisting of four components:
x A 32× 32× 200 tensor, each matrix x@data[,,i] represents a predictor observation.
y A 1× 200 matrix, each entry represents a response observation.
coefficients A 32× 32× 1 tensor with a square pattern.
Gamma A list consisting of two 32× 2 envelope basis.
Details
The dataset is generated from the tensor predictor regression (TPR) model:
Yi = B(m+1)vec(Xi) + εi, i = 1, . . . , n,
where n = 200 and the regression coefficient B ∈ R32×32 is a given image with rank 2, whichhas a square pattern. All the elements of the coefficient matrix B are either 0.1 or 1. To make themodel conform to the envelope structure, we construct the envelope basis Γk and the covariancematrices Σk, k = 1, 2, of predictor X as following. With the singular value decomposition of B,namely B = Γ1ΛΓT
2 , we choose the envelope basis as Γk ∈ R32×2, k = 1, 2. Then the envelopedimensions are u1 = u2 = 2. We set matrices Ωk = I2 and Ω0k = 0.01I30, k = 1, 2. Then wegenerate the covariance matrices Σk = ΓkΩkΓT
k + Γ0kΩ0kΓT0k, followed by normalization with
their Frobenius norms. The predictor Xi is then generated from two-way tensor (matrix) normaldistribution TN(0; Σ1,Σ2). And the error term εi is generated from standard normal distribution.
References
Zhang, X. and Li, L., 2017. Tensor envelope partial least-squares regression. Technometrics, 59(4),pp.426-436.
Examples
## Fit square dataset with the tensor predictor regression modeldata("square")x <- square$xy <- square$y# Model fitting with ordinary least square.fit_std <- TPR.fit(x, y, method="standard")# Draw the coefficient plot.plot(fit_std)
std_err 27
std_err Elementwise standard error.
Description
Calculates the elementwise standard error for the object returned from TRR.fit. The standard errorfor the object returned from TPR.fit is unavailable.
Usage
std_err(object)
Arguments
object an object of class "Tenv", as the ones returned from TRR.fit.
Value
The standard error tensor is returned.
Note
The function only supports the object returned from TRR.fit since there is no standard error for theobject returned from TPR.fit.
Examples
data("bat")x <- bat$xy <- bat$yfit <- TRR.fit(x, y, method="standard")std_err(fit)
subspace The distance between two subspaces.
Description
This function calculates the distance between the two subspaces with equal dimensions span(A)and span(B), where A ∈ Rp×u and B ∈ Rp×u are the basis matrices of two subspaces. Thedistance is defined as
‖PA − PB‖F /√
2d,
where P is the projection matrix onto the given subspace with the standard inner product, and d isthe common dimension.
28 summary.Tenv
Usage
subspace(A, B)
Arguments
A A p-by-u full column rank matrix.
B A p-by-u full column rank matrix.
Value
Returns a distance metric that is between 0 and 1
summary.Tenv Summarize method for Tenv object.
Description
Summary method for object returned from TRR.fit and TPR.fit functions.
Usage
## S3 method for class 'Tenv'summary(object, ...)
## S3 method for class 'summary.Tenv'print(x, ...)
Arguments
object An object of class "Tenv", as the ones returned from TPR.fit or TRR.fit.
... Additional arguments. No available arguments exist in this version.
x An object of class "summary.Tenv", usually, a result of a call to summary.Tenv.
Details
Extract call, method, coefficients, residuals, Gamma from object. And append mse, p-valueand the standard error of estimated coefficient.
The mean squared error mse is defined as 1/n∑n
i=1 ||Yi − Yi||2F , where Yi is the prediction and|| · ||F is the Frobenius norm of tensor.
Since the p-value and standard error depend on the estimation of cov−1(vec(X)) which is unavail-able for the ultra-high dimensional vec(X) in tensor predictor regression (TPR), the two statisticsare only provided for the object returned from TRR.fit.
print.summary.Tenv provides a more readable form of the statistics contained in summary.Tenv.If object is returned from TRR.fit, then p-val and se are also returned.
Tenv_Pval 29
Value
Return object with additional components
call The matched call.
method The implemented method.
n The sample size.
xdim The dimension of predictor.
ydim The dimension of response.
coefficients The tensor coefficients estimated from TPR.fit or TRR.fit.
residuals The residuals, which equals to the response minus the fitted values.
Gamma A list of envelope subspace basis.
mse The mean squared error. The mean squared Frobenius norm of the differencebetween each response Yi and fitted value Yi.
p_val The p-value for coefficients. Only for the object returned from TRR.fit.
se The standard error for coefficients. Only for the object returned from TRR.fit.
See Also
Fitting functions TRR.fit, TPR.fit.
Examples
data("bat")x <- bat$xy <- bat$yfit <- TRR.fit(x, y, method="standard")##print summarysummary(fit)
##Extract the p-value and standard error from summarysummary(fit)$p_valsummary(fit)$se
Tenv_Pval The p-value and standard error of coefficient in tensor response re-gression (TRR) model.
Description
Obtain p-value of each element in the tensor regression coefficient estimator. Two-sided t-testsare implemented on the coefficient estimator, where asymptotic covariance of the OLS estimator isused.
30 TPR.fit
Usage
Tenv_Pval(x, y, Bhat)
Arguments
x The response tensor instance r1 × r2 × · · · × rm.
y A vector predictor of dimension p.
Bhat The estimator of tensor regression coefficient.
The p-value and the standard error of estimated coefficient are not providedfor tensor predictor regression since they depend on cov
−1vec(X) which isunavailable due to the ultra-high dimension of vec(X).
Value
p_ols The p-value tensor of OLS estimator.
p_val The p-value tensor of Bhat.
se The standard error tensor of Bhat.
Examples
## Use dataset batdata("bat")x <- bat$xy <- bat$yfit_std <- TRR.fit(x, y, method="standard")Tenv_Pval(x, y, fit_std$coefficients)
TPR.fit Tensor predictor regression
Description
This function is used for estimation of tensor predictor regression. The available method includingstandard OLS type estimation, PLS type of estimation as well as envelope estimation with FG, 1Dand ECD approaches.
Usage
TPR.fit(x, y, u, method=c('standard', 'FG', '1D', 'ECD', 'PLS'), Gamma_init = NULL)
TPR.fit 31
Arguments
x The predictor tensor instance of dimension p1×p2×· · ·×pm×n, where n is thesample size. Array with the same dimensions and matrix with dimension p× nare acceptable. If y is missing, x should be a list or an environment consistingof predictor and response datasets.
y The response matrix of dimension r × n, where n is the sample size. Vector oflength n is acceptable.
u The dimension of envelope subspace. u = (u1, · · · , um). Used for methods"FG", "1D", "ECD" and "PLS". User can use TPRdim to select dimension.
method The method used for estimation of tensor response regression. There are fourpossible choices.
• "standard": The standard OLS type estimation.• "FG": Envelope estimation with full Grassmannian (FG) algorithm.• "1D": Envelope estimation with one dimensional optimization approaches
by 1D algorithm.• "ECD": Envelope estimation with one dimensional optimization approaches
by ECD algorithm.• "PLS": The SIMPLS-type estimation without manifold optimization.
Gamma_init A list specifying the initial envelope subspace basis for "FG" method. By de-fault, the estimators given by "1D" algorithm is used.
Details
Please refer to Details part of TPRsim for the description of the tensor predictor regression model.
Value
TPR.fit returns an object of class "Tenv".
The function summary (i.e., summary.Tenv) is used to print the summary of the results, includingadditional information, e.g., the p-value and the standard error for coefficients, and the predictionmean squared error.
The functions coefficients, fitted.values and residuals can be used to extract different fea-tures returned from TPR.fit.
The function plot (i.e., plot.Tenv) plots the two-dimensional coefficients and p-value for objectof class "Tenv".
The function predict (i.e., predict.Tenv) predicts response for the object returned from TPR.fitfunction.
x The original predictor dataset.
y The original response dataset.
call The matched call.
method The implemented method.
coefficients The estimation of regression coefficient tensor.
Gamma The estimation of envelope subspace basis.
32 TPR.fit
Sigma A lists of estimated covariance matrices at each mode for the tensor predictors.
fitted.values The fitted response matrix.
residuals The residuals matrix.
References
Zhang, X. and Li, L., 2017. Tensor envelope partial least-squares regression. Technometrics, 59(4),pp.426-436.
See Also
summary.Tenv for summaries, calculating mean squared error from the prediction.
plot.Tenv(via graphics::image) for drawing the two-dimensional coefficient plot.
predict.Tenv for prediction.
The generic functions coef,residuals,fitted.
TPRdim for selecting the dimension of envelope by cross-validation.
TPRsim for generating the simulated data used in tensor prediction regression.
The simulated data square used in tensor predictor regression.
Examples
# The dimension of predictorp <- c(10, 10, 10)# The envelope dimensions u.u <- c(1, 1, 1)# The dimension of responser <- 5# The sample sizen <- 200
# Simulate the data with TPRsim.dat <- TPRsim(p = p, r = r, u = u, n = n)x <- dat$xy <- dat$yB <- dat$coefficients
fit_std <- TPR.fit(x, y, method="standard")fit_FG <- TPR.fit(x, y, u, method="FG")fit_pls <- TPR.fit(x, y, u, method="PLS")
rTensor::fnorm(B-stats::coef(fit_std))rTensor::fnorm(B-stats::coef(fit_FG))rTensor::fnorm(B-stats::coef(fit_pls))
## ----------- Pass a list or an environment to x also works ------------- ### Pass a list to xl <- dat[c("x", "y")]fit_std_l <- TPR.fit(l, method="standard")
TPRdim 33
# Pass an environment to xe <- new.env()e$x <- dat$xe$y <- dat$yfit_std_e <- TPR.fit(e, method="standard")
## ----------- Use dataset "square" included in the package ------------- ##data("square")x <- square$xy <- square$yfit_std <- TPR.fit(x, y, method="standard")
TPRdim Envelope dimension by cross-validation for tensor predictor regres-sion (TPR).
Description
Select the envelope dimension by cross-validation for tensor predictor regression.
Usage
TPRdim(x, y, maxdim = 10, nfolds = 5)
Arguments
x The predictor tensor instance of dimension p1 × p2 × · · · × pm × n, where nis the sample size. Array with the same dimensions and matrix with dimensionp× n are acceptable.
y The response matrix of dimension r × n, where n is the sample size. Vector oflength n is acceptable.
maxdim The largest dimension to be considered for selection.
nfolds Number of folds for cross-validation.
Details
According to Zhang and Li (2017), the dimensions of envelopes at each mode are assumed to beequal, so the u returned is a single value representing the equal envelope dimension.
For each dimension u in 1:maxdim, we obtain the prediction
Yi = B(m+1)vec(Xi)
for each predictor Xi in the k-th testing dataset, k = 1, . . . ,nfolds, where B is the estimatedcoefficient based on the k-th training dataset. And the mean squared error for the k-th testingdataset is defined as
1/nk
nk∑i=1
||Yi − Yi||2F ,
34 TPRdim
where nk is the sample size of the k-th testing dataset and || · ||F denotes the Frobenius norm. Then,the average of nfolds mean squared error is recorded as cross-validation mean squared error forthe dimension u.
Value
mincv The minimal cross-validation mean squared error.
u The envelope subspace dimension selected.
References
Zhang, X. and Li, L., 2017. Tensor envelope partial least-squares regression. Technometrics, 59(4),pp.426-436.
See Also
TPRsim.
Examples
# The dimension of predictorp <- c(10, 10, 10)# The envelope dimensions u.u <- c(1, 1, 1)# The dimension of responser <- 5# The sample sizen <- 200dat <- TPRsim(p = p, r = r, u = u, n = n)x <- dat$xy <- dat$yTPRdim(x, y, maxdim = 5)
## Use dataset square. (time-consuming)
data("square")x <- square$xy <- square$y# check the dimension of xdim(x)# use 32 as the maximal envelope dimensionTPRdim(x, y, maxdim=32)
TPRsim 35
TPRsim Generate simulation data for tensor predictor regression (TPR)
Description
This function is used to generate simulation data used in tensor prediction regression.
Usage
TPRsim(p, r, u, n)
Arguments
p The dimension of predictor, a vector in the form of (p1, · · · , pm).
r The dimension of response, a scale.
u The structural dimension of envelopes at each mode, a vector with the samelength as p.
n The sample size.
Details
The tensor predictor regression model is of the form,
Y = B(m+1)vec(X) + ε
where response Y ∈ Rr, predictor X ∈ Rp1×···×pm , B ∈∈ Rp1×···×pm×r and the error term ismultivariate normal distributed. The predictor is tensor normal distributed,
X ∼ TN(0; Σ1, . . . ,Σm)
According to the tensor envelope structure, we have
B = [Θ; Γ1, . . . ,Γm, Ip],
Σk = ΓkΩkΓTk + Γ0kΩ0kΓT
0k,
for some Θ ∈ Ru1×···×um×p, Ωk ∈ Ruk×uk and Ω0k ∈∈ R(pk−uk)×(pk−uk), k = 1, . . . ,m.
Value
x The predictor of dimension p1 × · · · × pm × n.
y The response of dimension r × n.
Gamma A list of envelope subspace basis of dimension pk × uk, k = 1, . . . ,m.
coefficients The tensor coefficients of dimension p1 × · · · × pm × r.
Sigma A lists of estimated covariance matrices at each mode for the tensor predictors,i.e., Σ1, . . . ,Σm.
p, r, u The input p,r,u.
36 TRR.fit
Note
The length of p must match that of u, and each element of u must be less than the correspondingelement in p.
References
Zhang, X. and Li, L., 2017. Tensor envelope partial least-squares regression. Technometrics, 59(4),pp.426-436.
See Also
TPR.fit,TRRsim.
Examples
p <- c(10, 10, 10)u <- c(1, 1, 1)r <- 5n <- 200dat <- TPRsim(p = p, r = r, u = u, n = n)x <- dat$xy <- dat$yfit_std <- TPR.fit(x, y, method="standard")
TRR.fit Tensor response regression
Description
This function is used for estimation of tensor response regression. The available method includingstandard OLS type estimation, PLS type of estimation as well as envelope estimation with FG, 1Dand ECD approaches.
Usage
TRR.fit(x, y, u, method=c('standard', 'FG', '1D', 'ECD', 'PLS'), Gamma_init = NULL)
Arguments
x The predictor matrix of dimension p × n. Vector of length n is acceptable. Ify is missing, x should be a list or an environment consisting of predictor andresponse datasets.
y The response tensor instance with dimension r1 × r2 × · · · × rm × n, where nis the sample size. Array with the same dimensions and matrix with dimensionr × n are acceptable.
u The dimension of envelope subspace. u = (u1, · · · , um). Used for methods"FG", "1D", "ECD" and "PLS". User can use TRRdim to select dimension.
TRR.fit 37
method The method used for estimation of tensor response regression. There are fourpossible choices.
• "standard": The standard OLS type estimation.• "FG": Envelope estimation with full Grassmannian (FG) algorithm.• "1D": Envelope estimation with one dimensional optimization approaches
by 1D algorithm.• "ECD": Envelope estimation with one dimensional optimization approaches
by ECD algorithm.• "PLS": The SIMPLS-type estimation without manifold optimization.
Gamma_init A list specifying the initial envelope subspace basis for "FG" method. By de-fault, the estimators given by "1D" algorithm is used.
Details
Please refer to Details part of TRRsim for the description of the tensor response regression model.
When samples are insufficient, it is possible that the estimation of error covariance matrix Sigma isnot available. However, if using ordinary least square method (method = "standard"), as long assample covariance matrix of predictor x is nonsingular, coefficients, fitted.values, residualsare still returned.
Value
TRR.fit returns an object of class "Tenv".
The function summary (i.e., summary.Tenv) is used to print the summary of the results, includingadditional information, e.g., the p-value and the standard error for coefficients, and the predictionmean squared error.
The functions coefficients, fitted.values and residuals can be used to extract different fea-tures returned from TRR.fit.
The function plot (i.e., plot.Tenv) plots the two-dimensional coefficients and p-value for objectof class "Tenv".
The function predict (i.e., predict.Tenv) predicts response for the object returned from TRR.fitfunction.
x The original predictor dataset.
y The original response dataset.
call The matched call.
method The implemented method.
coefficients The estimation of regression coefficient tensor.
Gamma The estimation of envelope subspace basis.
Sigma A lists of estimated covariance matrices at each mode for the error term.
fitted.values The fitted response tensor.
residuals The residuals tensor.
38 TRR.fit
References
Li, L. and Zhang, X., 2017. Parsimonious tensor response regression. Journal of the AmericanStatistical Association, 112(519), pp.1131-1146.
See Also
summary.Tenv for summaries, calculating mean squared error from the prediction.
plot.Tenv(via graphics::image) for drawing the two-dimensional coefficient plot and p-valueplot.
predict.Tenv for prediction.
The generic functions coef,residuals,fitted.
TRRdim for selecting the dimension of envelope by information criteria.
TRRsim for generating the simulated data used in tensor response regression.
The simulated data bat used in tensor response regression.
Examples
# The dimension of responser <- c(10, 10, 10)# The envelope dimensions u.u <- c(2, 2, 2)# The dimension of predictorp <- 5# The sample sizen <- 100
# Simulate the data with TRRsim.dat <- TRRsim(r = r, p = p, u = u, n = n)x <- dat$xy <- dat$yB <- dat$coefficients
fit_std <- TRR.fit(x, y, method="standard")fit_fg <- TRR.fit(x, y, u, method="FG")fit_1D <- TRR.fit(x, y, u, method="1D")fit_pls <- TRR.fit(x, y, u, method="PLS")fit_ECD <- TRR.fit(x, y, u, method="ECD")
rTensor::fnorm(B-stats::coef(fit_std))rTensor::fnorm(B-stats::coef(fit_fg))rTensor::fnorm(B-stats::coef(fit_1D))rTensor::fnorm(B-stats::coef(fit_pls))rTensor::fnorm(B-stats::coef(fit_ECD))
# Extract the mean squared error, p-value and standard error from summarysummary(fit_std)$msesummary(fit_std)$p_valsummary(fit_std)$se
TRRdim 39
## ----------- Pass a list or an environment to x also works ------------- ### Pass a list to xl <- dat[c("x", "y")]fit_std_l <- TRR.fit(l, method="standard")
# Pass an environment to xe <- new.env()e$x <- dat$xe$y <- dat$yfit_std_e <- TRR.fit(e, method="standard")
## ----------- Use dataset "bat" included in the package ------------- ##data("bat")x <- bat$xy <- bat$yfit_std <- TRR.fit(x, y, method="standard")
TRRdim Envelope dimension selection for tensor response regression (TRR)
Description
This function uses the 1D-BIC criterion proposed by Zhang, X., & Mai, Q. (2018) to select envelopedimensions in tensor response regression. Refer to oneD_bic for more details.
Usage
TRRdim(x, y, C = NULL, maxdim = 10, ...)
Arguments
x The predictor matrix of dimension p× n. Vector of length n is acceptable.
y The response tensor instance with dimension r1 × r2 × · · · × rm × n, where nis the sample size. Array with the same dimensions and matrix with dimensionr × n are acceptable.
C The parameter passed to oneD_bic. Default is nrow(x) = p.
maxdim The maximum envelope dimension to be considered. Default is 10.
... Additional arguments passed to oneD_bic.
Details
See oneD_bic for more details on the definition of 1D-BIC criterion and on the arguments C andthe additional arguments.
Let B denote the estimated envelope with the selected dimension u, then the prediction is Yi =B×(m+1)Xi for each observation. And the mean squared error is defined as 1/n
∑ni=1 ||Yi− Yi||2F ,
where || · ||F denotes the Frobenius norm.

40 TRRdim
Value
bicval The minimal BIC values for each mode.
u The optimal envelope subspace dimension (u1, u2, · · · , um).
mse The prediction mean squared error using the selected envelope basis.
References
Li, L. and Zhang, X., 2017. Parsimonious tensor response regression. Journal of the AmericanStatistical Association, 112(519), pp.1131-1146.
Zhang, X. and Mai, Q., 2018. Model-free envelope dimension selection. Electronic Journal ofStatistics, 12(2), pp.2193-2216.
See Also
oneD_bic, TRRsim.
Examples
# The dimension of responser <- c(10, 10, 10)# The envelope dimensions u.u <- c(2, 2, 2)# The dimension of predictorp <- 5# The sample sizen <- 100
# Simulate the data with TRRsim.dat <- TRRsim(r = r, p = p, u = u, n = n)x <- dat$xy <- dat$y
TRRdim(x, y) # The estimated envelope dimensions are the same as u.
## Use dataset bat. (time-consuming)
data("bat")x <- bat$xy <- bat$y# check the dimension of ydim(y)# use 32 as the maximal envelope dimensionTRRdim(x, y, maxdim=32)

TRRsim 41
TRRsim Generate simulation data for tensor response regression (TRR)
Description
This function is used to generate simulation data used in tensor response regression.
Usage
TRRsim(r, p, u, n)
Arguments
r The dimension of response, a vector with length larger than 2.
p The dimension of predictor, a scale.
u The structural dimension of envelopes at each mode, a vector with the samelength as r.
n The sample size.
Details
The tensor response regression model is of the form,
Y = B×(m+1)X + ε
where predictorX ∈ Rp, response Y ∈ Rr1×···×rm ,B ∈ Rr1×···×rm×p and the error term is tensornormal distributed as follows,
ε ∼ TN(0; Σ1, . . . ,Σm).
According to the tensor envelope structure, we have
B = [Θ; Γ1, . . . ,Γm, Ip],
Σk = ΓkΩkΓTk + Γ0kΩ0kΓT
0k,
for some Θ ∈ Ru1×···×um×p, Ωk ∈ Ruk×uk and Ω0k ∈∈ R(pk−uk)×(pk−uk), k = 1, . . . ,m.
Value
x The predictor of dimension p× n.
y The response of dimension r1 × · · · × rm × n.
Gamma The envelope subspace basis of dimension rk × uk, k = 1, . . . ,m.
coefficients The tensor coefficients of dimension r1 × · · · × rm × p.
Sigma A lists of estimated covariance matrices at each mode for the error term, i.e.,Σ1, . . . ,Σm.
p, r, u The input p,r,u.
42 ttt
Note
The length of r must match that of u, and each element of u must be less than the correspondingelement in r.
References
Li, L. and Zhang, X., 2017. Parsimonious tensor response regression. Journal of the AmericanStatistical Association, 112(519), pp.1131-1146.
See Also
TPR.fit,TPRsim.
Examples
r <- c(10, 10, 10)u <- c(2, 2, 2)p <- 5n <- 100dat <- TRRsim(r = r, p = p, u = u, n = n)x <- dat$xy <- dat$yfit_std <- TRR.fit(x, y, method="standard")
ttt Matrix product of two tensors
Description
Matrix product of two tensors unfolded on the specified modes.
Usage
ttt(x, y, ms)
Arguments
x A tensor instance.y A tensor instance.ms The indices of the modes to compute on. A single value or a vector.
Details
Suppose x is a s-way tensor with dimension p1 × . . . × ps and y is a t-way tensor with dimensionr1 × . . .× rt. ms specifies the indices on which the tensors x and y are unfolded as columns. Thus,ms must be a subset of 1:mins,t. Meanwhile, the sizes of the dimensions specified by ms mustmatch, e.g., if ms = 1:k where k <= mins,t, then p1× . . . pk = s1× . . . sk. LetX0 and Y0 denotethe unfolded matrices, the matrix X0 × Y T
0 is returned. See Examples for a better illustration.

ttt 43
Value
Return the matrix product of tensors x and y.
Examples
x <- rTensor::as.tensor(array(runif(24), c(3, 4, 2)))y <- rTensor::as.tensor(array(runif(24), c(3, 4, 2)))z <- ttt(x, y, 1:2)

Index
∗ datasetsbat, 4EEG, 6square, 25
bat, 4, 38
coef, 32, 38
ECD, 5EEG, 6
FGfun, 6, 8fitted, 32, 38
kroncov, 9
manifold1D, 10manifoldFG, 11MenvU_sim, 11, 13, 16
oneD_bic, 14, 39, 40OptM1D, 16, 16OptMFG, 17OptStiefelGBB, 18, 19
plot, 31, 37plot.Tenv, 21, 31, 32, 37, 38PMSE, 22predict, 31, 37predict.Tenv, 24, 31, 32, 37, 38print.summary.Tenv (summary.Tenv), 28
residuals, 32, 38
simplsMU, 24square, 25, 32std_err, 27subspace, 11, 27summary, 31, 37summary.Tenv, 28, 31, 32, 37, 38
Tenv_Pval, 29TPR (TPR.fit), 30TPR.fit, 22, 24, 28, 29, 30, 31, 36, 42TPRdim, 31, 32, 33TPRsim, 23, 31, 32, 34, 35, 42TRES (TRES-package), 3TRES-package, 3TRR (TRR.fit), 36TRR.fit, 22, 24, 28, 29, 36, 37TRRdim, 36, 38, 39TRRsim, 23, 36–38, 40, 41ttt, 42
44