Trends in UK deaths associated with abuse of volatile substances, 1971 … · associated with abuse...
46
Trends in UK deaths associated with abuse of volatile substances, 1971-2009 Hamid Ghodse John Corkery Kapil Ahmed Fabrizio Schifano Volatile Substance Abuse (VSA) Mortality Project International Centre for Drug Policy (ICDP) St George’s, University of London, UK Report 24
-
Upload
nguyenhuong -
Category
Documents
-
view
215 -
download
0
Transcript of Trends in UK deaths associated with abuse of volatile substances, 1971 … · associated with abuse...

Trends in UK deaths associated with
abuse of volatile substances,
1971-2009
Hamid Ghodse John Corkery Kapil Ahmed Fabrizio Schifano
Volatile Substance Abuse (VSA) Mortality Project International Centre for Drug Policy (ICDP) St George’s, University of London, UK
Report 24

VSA
International Centre for Drug Policy
ii
Published by International Centre for Drug Policy, St George’s, University of London
Cranmer Terrace, London SW17 0RE Telephone +44 (0)20 8725 2623 & Fax +44 (0)20 8725 3538
E-mail: [email protected]
© 2012 International Centre for Drug Policy
All rights reserved. No part of this publication may be reproduced, stored in a retrieval system, or transmitted in any
form, without the written permission of the publisher.
ISBN: 978 1 897778 78 4
The views expressed in this report are those of the authors.

VSA
International Centre for Drug Policy
iii
Volatile Substance Abuse (VSA) Mortality Project
Trends in UK deaths associated with abuse of volatile substances, 1971-2009
Report 24
Hamid Ghodse John Corkery Kapil Ahmed
Fabrizio Schifano
VSA
International Centre for Drug Policy
iv
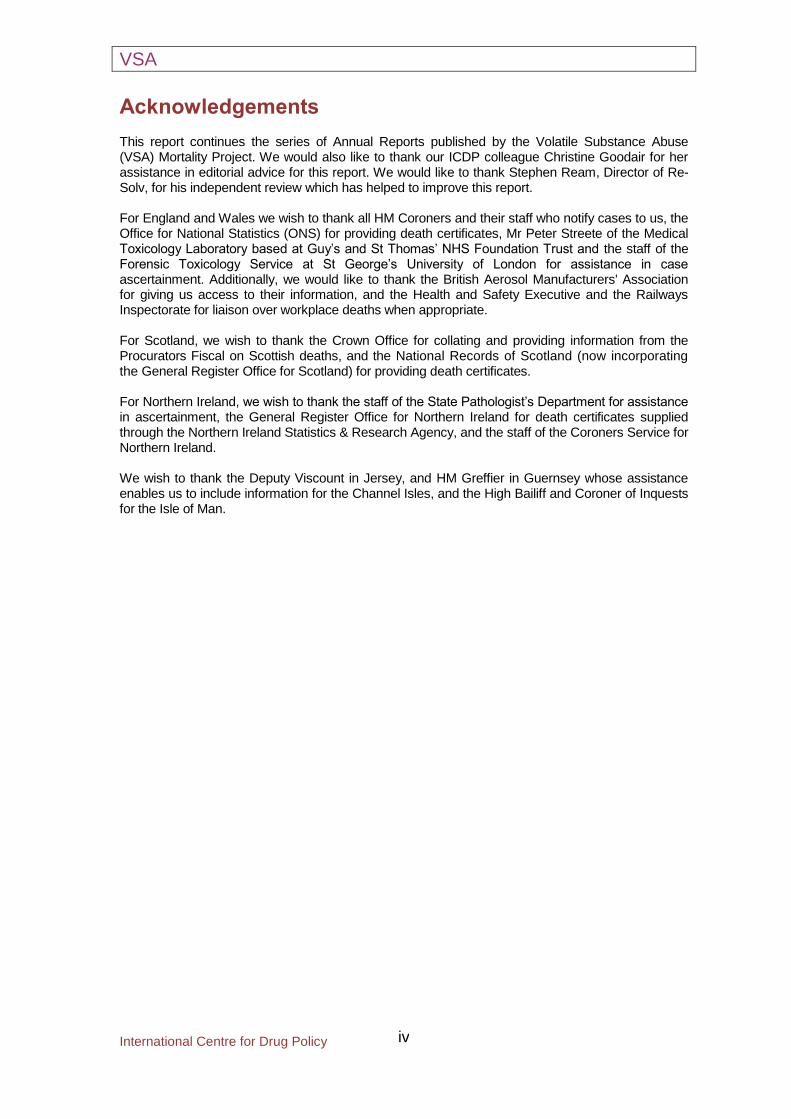
Acknowledgements This report continues the series of Annual Reports published by the Volatile Substance Abuse (VSA) Mortality Project. We would also like to thank our ICDP colleague Christine Goodair for her assistance in editorial advice for this report. We would like to thank Stephen Ream, Director of Re-Solv, for his independent review which has helped to improve this report. For England and Wales we wish to thank all HM Coroners and their staff who notify cases to us, the Office for National Statistics (ONS) for providing death certificates, Mr Peter Streete of the Medical Toxicology Laboratory based at Guy’s and St Thomas’ NHS Foundation Trust and the staff of the Forensic Toxicology Service at St George’s University of London for assistance in case ascertainment. Additionally, we would like to thank the British Aerosol Manufacturers' Association for giving us access to their information, and the Health and Safety Executive and the Railways Inspectorate for liaison over workplace deaths when appropriate. For Scotland, we wish to thank the Crown Office for collating and providing information from the Procurators Fiscal on Scottish deaths, and the National Records of Scotland (now incorporating the General Register Office for Scotland) for providing death certificates. For Northern Ireland, we wish to thank the staff of the State Pathologist’s Department for assistance in ascertainment, the General Register Office for Northern Ireland for death certificates supplied through the Northern Ireland Statistics & Research Agency, and the staff of the Coroners Service for Northern Ireland. We wish to thank the Deputy Viscount in Jersey, and HM Greffier in Guernsey whose assistance enables us to include information for the Channel Isles, and the High Bailiff and Coroner of Inquests for the Isle of Man.

VSA
International Centre for Drug Policy
v
Table of contents Acknowledgements iv
Table of contents v List of tables and figures vi Annual Report for January-December 2009
Executive summary incorporating key findings 1 Introduction 2
Definitions 3 Methods and procedures 4 Results Trends in total VSA deaths 5
Death by age 6 Death in young people 8
Death by gender 10 Regional variation 12
Substances abused 15 Products abused 17
Other psychoactive substances associated with VSA deaths 20 Method of administration 21
Mechanism of death 23 Previous history of solvent abuse 23 Place of fatal abuse and death 23 Suicide 26
Deaths associated with helium: a renewed warning 28 Commentary 30 References 31 Further reading list 34 Key legislation 35 Appendix Descriptions and examples of commonly abused volatile substances and solvents 36

VSA
International Centre for Drug Policy
vi
List of tables and figures Figure 1: VSA deaths for all ages, by year, 1983-2009 5 Figure 2: Trends in VSA deaths for all ages, 1983-2009 6 Table 1: Age-distribution (%) of VSA deaths, 1971-99 & each year to 2009 7 Figure 3: Age-distribution of VSA deaths, 1971-2008 & 2009 7 Figure 4: VSA mortality rates for ages 10-14 years by gender, 2000-2009 8 Figure 5: VSA mortality rates for ages 15-19 years by gender, 2000-2009 9 Table 2: Number of deaths in the UK for the 10-14 and 15-19 years 9 age-groups by cause of death, 2009 Table 3: Gender-distribution of VSA deaths, 1971-1999 & each year to 2009 10 Figure 6: Gender-distribution of VSA deaths by age (<18 years), 1971-99 & 11 each year to 2009 Figure 7: Gender-distribution of VSA deaths by age (18+ years), 1971-99 & 11
each year to 2009 Table 4: Number of VSA deaths by Government Office Region (England) 12 and Country, 1971-99 & each year to 2009 Table 5: Standardised Mortality Ratios for Govt. Office Region (England) 13 and Country, adjusted for age and gender, 2000-2009 Figure 8: Standardised Mortality Ratios for Govt. Office Region (England) 14 and Country, adjusted for age and gender, 2000-2009 Table 6: Substance abused, all ages, each year 2000-2009 15 Figure 9: Substance associated with fatal abuse, all ages, 2000-2009 16 Figure 10: Substance associated with fatal abuse, under 18 years of age, 16
2000-2009
Table 7: Substance abused, by product, 2009 18 Table 8: Substance abused, by product, 1971-2009 19 Table 9: Deaths associated with cigarette lighter refills, in persons under 18 20 years of age, 1971-1999 & each year to 2009 Figure 11: VSA deaths with other substances at post mortem, 2008 and 2009 20 Table 10: Methods of administration of main substances, 1971-1999 & 21 each year to 2009 Table 11: Methods of administration of main substances, by product, 22 1971-1999 & each year to 2009 Table 12: Principal mechanism of death for all ages, 2000-2009 23 Figure 12: Principal mechanism of VSA death for all ages, 2000-2009 24

VSA
International Centre for Drug Policy
vii
Figure 13: Place of fatal abuse, 2009 24 Figure 14: Place of fatal abuse by gender, 2000-2009 25 Table 13: Place of fatal abuse by age-group, 2000-2009 25 Figure 15: Place of VSA death, 2009 26 Table 14: Number of suicides associated with a volatile substance, 2000-2009 26 Figure 16: Age- and gender- distribution of suicides associated with 27 volatile substances Figure 17: Distribution of deaths associated with inhalation of helium, 2001-2009 28 Table 15: Age- and gender-distribution of deaths due to helium inhalation 29 Figure 18: Causes of death due to helium inhalation, 2001-2009 29

VSA
International Centre for Drug Policy
viii

VSA
International Centre for Drug Policy
1
Executive summary This is the twenty-fourth annual report of the Volatile Substance Abuse (VSA) Mortality Project, and has been produced by the International Centre for Drug Policy based at St. George’s, University of London. This report outlines the current trends, examines the nature of the problems, and identifies the factors associated with deaths from abuse of volatile substances occurring in the United Kingdom (UK) in 2009. It also identifies emerging issues and possible changes in solvent abuse. There were 46 deaths associated with volatile substance abuse in 2009 (38 in 2008). The cumulative total of VSA deaths in the UK since 1971 now stands at 2,390. Since 1992 there has been a significant fall in deaths which appears to have decreased further in recent years. During the last decade (2000-2009), age at death ranged from 15 to 66 years (mean = 30.2, Standard Deviation (SD) 11.6), and one-third (32.9%) of deaths occurred in the under-20 years age-group. Compared to earlier years, there is a shift to older age-groups. Four-fifths (78.5%) of deaths were male, and in 2009 deaths from volatile substance abuse accounted for 1.1% of all-cause deaths in males aged 15-19 years, and 0.7% of females of the same age in the UK. Standard Mortality Ratios (SMRs) differed significantly across countries and Government Office Regions in England: the highest SMRs were Northern Ireland (179) and Scotland (172), and the lowest in the South East region of England (37). Gas fuels continue to be associated with the majority of deaths; over 67% in 2009. A decrease in suicides associated with the inhalation of a volatile substance occurred during the last two years. However, this fall appears to have been off-set by a rapid increase in suicides involving the inhalation of helium. As with VSA deaths in general, the majority (86%) of suicides using helium involved males. This phenomenon merits further investigation. Volatile substance abuse remains an important problem in the UK, especially in terms of causing premature death amongst young people. This challenging issue still needs to be addressed through substance abuse education programmes and other initiatives, as well as examination of appropriate preventative measures and treatment provision, if required.
Key findings for deaths in 2009:
There were 46 deaths (including 17 in Scotland) associated with VSA in 2009, bringing the total number of such deaths in the UK since 1971 to 2,390.
Since 1992 there has been a significant fall in deaths, from an average of 89 per year in 1990-1999, to an average of 54 per year in 2000-2009.
Gas fuels continue to be associated with the majority of deaths. In 2009, butane from all sources, including aerosol propellants, accounted for 74% of VSA deaths (34 out of 46 deaths).
In under-18 year olds there were seven VSA deaths in 2009 compared with five in 2008. Of these seven deaths, two were associated with butane cigarette lighter refills, the sale of which to under-18s is prohibited by legislation, and three were associated with aerosols.
VSA deaths overall continue to be more common among males than females. In 2009, there were 34 deaths among males as compared to 12 deaths among females, a ratio of 2.8:1; in under-18 year olds this ratio was 2.5:1.
Of the 46 deaths in 2009, five were suicides in males involving the inhalation of a volatile substance. All of these deaths were of adults, aged from 22 to 49 years.
In 2009 there were five deaths (two in 2008) associated with the inhalation of nitrous oxide, which had been obtained for non-medical purposes.
Although, as an inert gas, helium is not a volatile substance, previous reports have provided some basic information on this gas. The number of helium-related deaths has risen since 2001, but at an increasing rate in the last three years, standing at 26 in 2008 and 46 in 2009.
During 2001-9, the majority (93%) of helium cases were suicides. Most deaths were among males, those aged 20-59 years, and caused by asphyxia (including plastic bag over head).

VSA
International Centre for Drug Policy
2
Introduction
This report is an annual statistical summary of data on trends in deaths associated with the deliberate inhalation of volatile substances. It has been produced by the International Centre for Drug Policy (ICDP) at St. George’s, University of London, which took over responsibility for this work from 2009. Data for deaths occurring in 2009 are analysed in this report, together with updated information for earlier years. Therefore, this report supersedes all previous ones. There is a necessary delay of more than twelve months between the end of a calendar year and publication of the annual report. This is to allow time for details to become available from HM Coroners, ONS, the National Records of Scotland, and the General Register Office for Northern Ireland. Volatile Substance Abuse (VSA) has been a global issue for several decades according to the World Health Organisation (1993, 1999), though the substances are not usually considered to be illegal. In contrast to the situation with respect to illicit drugs, in most countries there is little or no criminal involvement in the supply of products used for VSA. Compounds such as diethyl ether, chloroform and nitrous oxide have been deliberately inhaled for recreational purposes since the early 1800s. Many of the substances which have been abused by inhalation remain in widespread use. The first modern reports of VSA started to appear in the 1950s (Ramsey et al., 1989), involving petrol, glues and solvent-based thinning agents, initially in the United States, and then Western Europe, particularly Scandinavia. Volatile substance abuse is not automatically linked to gender, race or class, the substance abuse is often a group activity and peer-group influence may be a factor in encouraging the persistence of the practice (Flanagan et al., 1997). Abuse of volatile substances is an issue that can affect anyone, anywhere. For example, research indicates that the main issues underlying volatile substance abuse for indigenous youth in inner Brisbane, Australia, include: unstable living situations, lack of involvement with school, low levels of meaningful activity and boredom, existence of a substance-using peer group, lack of belonging to a culture, and high levels of mental health concerns (Butt, 2004). The results of the 2009 National Survey on Drug Use and Health in the USA show that the
average age at first use among recent inhalant initiates aged 12 to 49 was 16.3 years (Substance Abuse and Mental Health Services Administration, 2011). Another study held among young Native Indians in the USA indicates that the typical user of these substances is an adolescent
male with low
self-esteem and a family background of alcoholism
and physical aggression (Howard
et al., 1999). In the 2004 Canadian Addiction Survey, the majority of individuals (67%) reported first using inhalants between 12 and 16 years of age; 13% used before the age of 12 and 19% at age 17 or older (Adlaf et al., 2005). In the UK there was a steady increase in VSA deaths from the early 1960s onwards, with deaths peaking in the early 1990s at over 150 per year (Field-Smith et al, 2004). Data from the Office for National Statistics (ONS) reveal that the trends in prevalence and death from VSA continue to be serious substance-related issues, certainly for the younger teenage population in the UK (Harris, 2006). A survey of school children in England aged 11 to 15 years in 2009 found that 5.5% of pupils had used volatile substances in the previous 12 months; this compares to 7.1% in 2001. Use of these substances increases with age; from 3.3% of 11 year-olds to 7.2% of 15 year-olds (Fuller and Sanchez, 2010). In Northern Ireland last year use of such substances by 12-16 year olds fell from 4.5% in 2007 to 4.3% in 2010 (NISRA, 2011).
According to the National Advisory Committee on Drug (NACD) survey conducted in the Republic of Ireland in 2006/07, the proportion of the adult population who reported using a solvent or volatile inhalant in their lifetime was higher and more common for men than women (National Advisory Committee on Drugs and Drug and Alcohol Information and Research Unit, 2008). Results from the 2009/10 sweep of the British Crime Survey show that in England and Wales last year use amongst 16-59 year-olds of amyl nitrite was 1.1% and solvents 0.2%; the rates for those aged 16-24 years were 3.2% and 0.7% respectively. These figures translate into an estimated using population in the previous 12 months of 351,000 aged 16-59 years for amyl nitrite and 57,000 for solvents; the corresponding figures for those

VSA
International Centre for Drug Policy
3
aged 16-24 years were 210,000 and 44,000 (Hoare and Moon, 2010). The monitoring of deaths from deliberate inhalation of volatile substances is made difficult by the variety of substances abused, the various modes by which death may occur, and the lack of an appropriate code under the International Classification of Diseases (Anderson, 1990). In addition, international data collection systems on VSA vary from country to country. For example, a systematic information collection programme on inhalant-related deaths in the USA has been maintained by the North Carolina Office of the Chief Medical Examiner (Hall et al., 2010), another retrospective study of inhalant deaths collected information from autopsy examinations reported since 1983 by the Office of Forensic Science in South Australia (Wick et al., 2007). Information on all ascertained deaths associated with VSA in the UK was systematically collected by the Division of Community Health Sciences at St. George’s University of London from 1983 to 2009. Research by that team demonstrated that knowledge of, and interest in, the problem had grown, and there had probably been a real increase in the number of deaths (Anderson et al, 1985). Since 2009 data has been collected by the ICDP (Ghodse et al., 2010a). Various efforts have been made to prevent solvent abuse and reduce the risk of premature death among abusers. Many of these attempts, however, do not affect the scale of the problems, the pattern of substances abused, or the risk of accidental death among those abusing volatile substances. The most notable exception was the Department of Health’s advertising
campaign in February 1992 aimed at parents; this led to a fall from an all-time peak of 152 deaths in 1990 to 67 in 1994. There has been a continuing programme of health education, along with personal and social education in schools, addressing the issue of volatile substance abuse. Guidance has been published on how to approach this within the National Curriculum (Department for Education and Skills, 2004; Stradling et al, 2009). The Welsh Government (2011) has also published guidance on best practice for the prevention and education of volatile substance abuse (VSA), which provides advice and information to parents, schools, youth services, the police and retailers. The document details different intervention approaches for young people and provides good practice guidance for substance misuse education for young people as part of a whole organisation approach within schools, colleges and youth services. Re-Solv continues to play an important role in providing UK-wide advice, information, research and other resources (http://www.re-solv.org/). Recent reports in this series have noted that gas fuels continue to be associated with the majority of deaths, both for adults and children. In particular, the single product of butane gas lighter refills is responsible for over one-quarter of deaths from volatile substance abuse, usually in the home (Ghodse et al., 2010a). This report is intended to inform policy-making and service provision at local and national level. It will also be of interest to health professionals, academics, and other stake-holders.
Definitions The terms ‘glue sniffing’ and ‘solvent abuse’, which were commonly used in connection with the abuse of volatile substances, have for some years been inadequate to describe the problem, hence the adoption of the term ‘Volatile Substance Abuse’ or ‘VSA’. Other terms widely used are ‘inhalant abuse’ and ‘huffing’. VSA has been defined by this project since 1983 as: “the deliberate inhalation of a volatile substance (gas, aerosol propellants, solvents in glue and other solvents) to achieve a change in mental state”.
Solvents are a diverse group of substances whose chemical vapours can be inhaled to produce psychoactive or mind-altering effects (National Institute on Drug Abuse, 2007). Descriptions and examples of the most commonly abused substances are given in the Appendix. Inhaled volatiles produce a similar effect to hypnotics/sedatives or ethanol with hedonic (pleasurable) effects such as euphoria and distortion of consciousness (dissociation) being experienced within seconds from a low dosage (Flanagan and Ives, 1994; Steffee et al., 1996). Users employing high dosages report

VSA
International Centre for Drug Policy
4
more euphoria, talkativeness, and grandiosity than when using low dosages. However, they also report aversive experiences such as chest pain, depressed mood, and suicidal ideation (Garland and Howard, 2010). Death may occur from the direct toxic effects of the inhaled substances or from trauma. Fatalities often occur very quickly, and there is usually no opportunity to intervene medically and thus to prevent death. Mortality associated with the abuse of volatile substances is related
to many factors, including the chemical nature of the substance itself, the product containing it, the method of inhalation, use setting, and the prevalence of abuse. In this report, in the context of volatile substance abuse, the term ‘substance’ is used to denote the generic category within which ‘products’ are grouped. Thus, for example, the aerosol ’substance’ includes ‘products’ such as deodorants, air fresheners, and fly sprays.
Methods and procedures
The historic dataset includes cases where there is no direct toxicological proof, but circumstantial evidence of varying grades suggesting that these deaths were associated with volatile substance abuse. The data also include suicides where a volatile substance was deliberately inhaled. All such cases are coded accordingly so that they can be reviewed if necessary. When further cases or additional data for previous years come to notice they are added to the dataset. For example, this report contains two additional cases for 2008. Deaths can also be removed from the dataset if subsequent information puts them outside the case criteria. For 2009 deaths there were 47 cases ascertained initially, but one was later excluded from analysis after receipt of autopsy and toxicological reports and discussions with relevant pathologists and forensic toxicologists. The Project continues to employ both active and passive case-ascertainment approaches. The active approach involves: the use of press-clipping services, Google and other Internet searches of regional and national newspapers, as well as other media sources, to identify cases. Regular visits are made to the Medical Toxicology Laboratory at Guy’s and St Thomas’ Hospital Trust, and the Forensic Toxicology Service at St George’s, University of London, and a number of coroners’ offices to check their records for possible cases. For the passive approach, information on deaths associated with VSA in England and Wales is provided by HM Coroners. For Scotland, information is supplied by the Crown Office and the National Records for Scotland (now incorporating the General Register Office for Scotland). Details of Northern Ireland deaths are provided by the State Pathologist’s Department, the Coroners Service for Northern Ireland, and the Northern Ireland Statistics & Research Agency on behalf of the General Register Office for Northern Ireland. The Deputy Viscount in Jersey, HM Greffier in Guernsey, and the High Bailiff in the Isle of Man
supply information for their areas. Data on ‘all-cause’ mortality and population estimates are supplied by the Office for National Statistics, the National Records of Scotland and the Northern Ireland Statistics & Research Agency. To enable comparison with various national and international datasets all causes of death have been coded according to the International Classification of Diseases version 10. This is an international standard for the classification of diseases and health-related problems published by the World Health Organisation. The current on-line (2007) version is employed by this Project (World Health Organization, 2007). The method of data collection used by this project has been stable and systematic since 1983. The process of confirming cause of death is undertaken by reference to the case definition criteria; each case is critically checked against information provided by the Coroner or Procurator Fiscal, including toxicological information, autopsy reports, incident reports or witness statements, and other documents. Information from these sources is entered into coding sheets by two separate team members and any discrepancies reconciled, before being entered into the database. Deaths associated with VSA in 2009 and deaths occurring in any previous years have been added to the historic dataset. All data held, whether electronic or paper, is stored securely and treated as confidential. Access is restricted to project staff; only aggregated and anonymous data are released to third parties and only with the prior written consent of the relevant data-provider. This report has been produced following analysis of all available information in a cumulatively updated database. Data-cleaning

VSA
International Centre for Drug Policy
5
for a separate research project indicated that some relevant cases had been omitted and other non-relevant cases included in the historic database. As a result, a few of the numbers for some earlier years may be slightly different to those previously published. For some analyses all deaths have been used. For examining time trends, the period of stable data collection has been used (1983-2009), whilst for others the most recent ten-year period
has been employed. All tables have been designed using uni- and bi-variate tabulation formats, and related graphs/charts have also been drawn up using these tables. Statistical analysis was undertaken using IBM® SPSS® Statistics for Windows Release 18 (based on the previous EPI Info and Stata
® programs
used for reports on deaths up to and including 2007). The presentation of complex statistical techniques has been kept to a minimum to facilitate ease of reading.
Trends in total VSA deaths The total number of deaths between 1971 and 2009 was 2,390; during 2009 there were 46 deaths. Figure 1 gives the total number of deaths from 1983, when the methods of data collection became stable and systematic, to 2009. The Figure shows that there was a steady increase between 1985 and 1991 followed by a more gradual decline. A commonly-used technique is ‘smoothing’ which, when properly applied, reveals more clearly the underlying trend. The ‘moving average’ method is one of these techniques, which can smooth a data-series and make it easier to spot trends. It is routinely employed with time-series data to smooth out short-term fluctuations and highlight longer-term trends.
In Figure 2, the three-year moving average method was used to examine the underlying trend in VSA deaths for all ages between 1983 and 2009. An increasing upward trend in deaths is discernible during the 1980s, followed by a sharper decline in the early 1990s. This was followed by a period of stability, with a more gradual fall from the late 1990s. The decline since the peak around 1990 reflects the impact of the publicity campaign by the Department of Health in 1992. There are no noteworthy variations between 1997 and 1999 as well as in later periods, when the average number ranges from about 50 to 75 deaths per year.
Figure 1: VSA deaths for all ages, by year,
1983 to 2009 (n=2,176)
82 85
116 116
137
113122
66
77 78 78 8075
66 63 6559
46
152
51
100
8579
54
47 4638
0
20
40
60
80
100
120
140
160
180
19
83
19
84
19
85
19
86
19
87
19
88
19
89
19
90
19
91
19
92
19
93
19
94
19
95
19
96
19
97
19
98
19
99
20
00
20
01
20
02
20
03
20
04
20
05
20
06
20
07
20
08
20
09
Year
Nu
mb
er
of
death
s

VSA
International Centre for Drug Policy 6
Figure 2: Trends in VSA deaths for all ages, 1983-2009
0
20
40
60
80
100
120
140
160
Year
Nu
mb
er
of
death
s
Three-year moving average
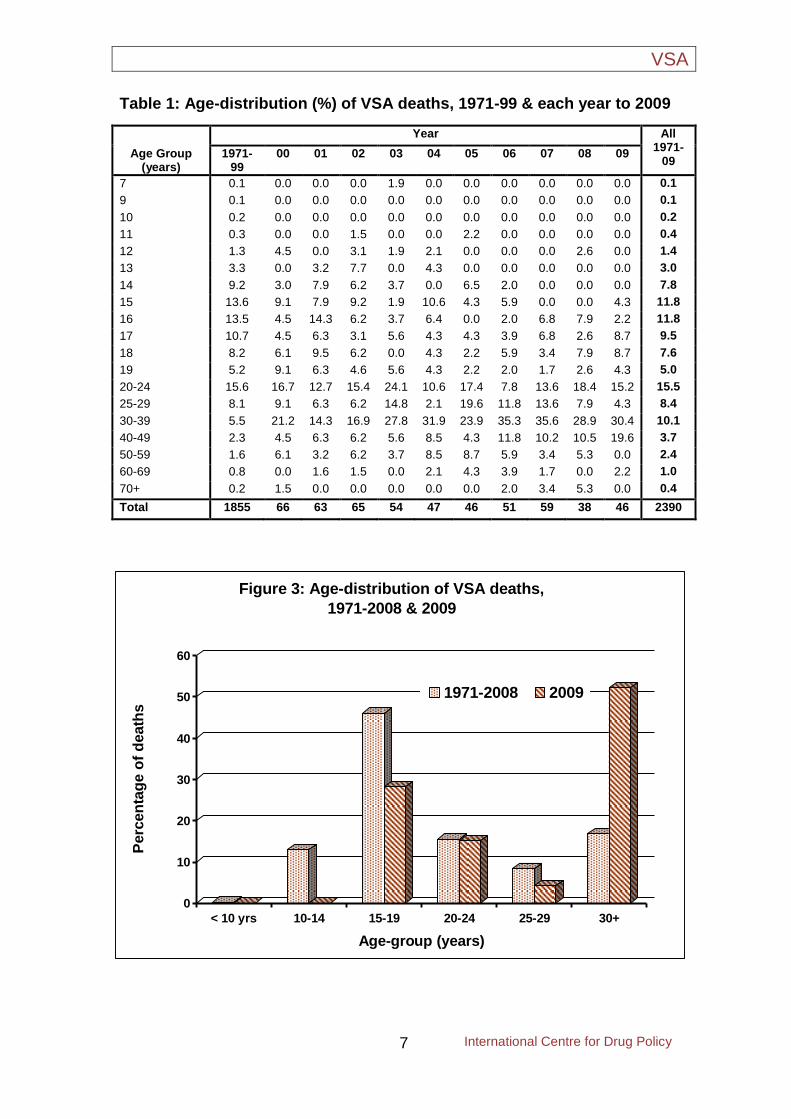
Death by age Table 1 presents the age-distribution of VSA deaths in 1971-99 and during the last 10 years. In 2009 the youngest person to die was aged 15 years and the oldest was aged 66 years. This table also shows that the fall in deaths since 1971 was predominantly among adolescents (<15 years) with a gradual decline among older teenagers (15-19 years). Just under half (47.9%) of VSA deaths occurred in the under-20 years age-group during the early part of this decade, falling to 23.1% in recent times. The proportion of deaths accounted for by adults (20 years and over) remained stable until about 2005. Since that time, this proportion has increased significantly. Changes in the age-distribution are illustrated in several ways, e.g. those aged 15-19 years
have been declining, whereas those aged 25 years or more have seen a sharp increase and those aged 20-24 years have remained stable. However, the proportion of teenagers and youths are more likely than those in other age-groups in the general population to die from abuse of volatile substances. Figure 3 shows a smaller proportion of deaths among teenagers (10-14 years) but less so for youths (15-19 years) as compared to their counterparts in both historic data (1971-2008) and in 2009. This Figure also shows a shift in the distribution of deaths towards higher age-groups when 2009 is compared with historic data. This shift is highly statistically significant (p<0.001 in the Mann-Whitney U test where all deaths were included).
VSA
International Centre for Drug Policy
7
Table 1: Age-distribution (%) of VSA deaths, 1971-99 & each year to 2009
Age Group (years)
Year All 1971-
09 1971-
99 00 01 02 03 04 05 06 07 08 09
7 0.1 0.0 0.0 0.0 1.9 0.0 0.0 0.0 0.0 0.0 0.0 0.1
9 0.1 0.0 0.0 0.0 0.0 0.0 0.0 0.0 0.0 0.0 0.0 0.1
10 0.2 0.0 0.0 0.0 0.0 0.0 0.0 0.0 0.0 0.0 0.0 0.2
11 0.3 0.0 0.0 1.5 0.0 0.0 2.2 0.0 0.0 0.0 0.0 0.4
12 1.3 4.5 0.0 3.1 1.9 2.1 0.0 0.0 0.0 2.6 0.0 1.4
13 3.3 0.0 3.2 7.7 0.0 4.3 0.0 0.0 0.0 0.0 0.0 3.0
14 9.2 3.0 7.9 6.2 3.7 0.0 6.5 2.0 0.0 0.0 0.0 7.8
15 13.6 9.1 7.9 9.2 1.9 10.6 4.3 5.9 0.0 0.0 4.3 11.8
16 13.5 4.5 14.3 6.2 3.7 6.4 0.0 2.0 6.8 7.9 2.2 11.8
17 10.7 4.5 6.3 3.1 5.6 4.3 4.3 3.9 6.8 2.6 8.7 9.5
18 8.2 6.1 9.5 6.2 0.0 4.3 2.2 5.9 3.4 7.9 8.7 7.6
19 5.2 9.1 6.3 4.6 5.6 4.3 2.2 2.0 1.7 2.6 4.3 5.0
20-24 15.6 16.7 12.7 15.4 24.1 10.6 17.4 7.8 13.6 18.4 15.2 15.5
25-29 8.1 9.1 6.3 6.2 14.8 2.1 19.6 11.8 13.6 7.9 4.3 8.4
30-39 5.5 21.2 14.3 16.9 27.8 31.9 23.9 35.3 35.6 28.9 30.4 10.1
40-49 2.3 4.5 6.3 6.2 5.6 8.5 4.3 11.8 10.2 10.5 19.6 3.7
50-59 1.6 6.1 3.2 6.2 3.7 8.5 8.7 5.9 3.4 5.3 0.0 2.4
60-69 0.8 0.0 1.6 1.5 0.0 2.1 4.3 3.9 1.7 0.0 2.2 1.0
70+ 0.2 1.5 0.0 0.0 0.0 0.0 0.0 2.0 3.4 5.3 0.0 0.4
Total 1855 66 63 65 54 47 46 51 59 38 46 2390
0
10
20
30
40
50
60
Perc
en
tag
e o
f d
eath
s
< 10 yrs 10-14 15-19 20-24 25-29 30+
Age-group (years)
Figure 3: Age-distribution of VSA deaths,
1971-2008 & 2009
1971-2008 2009

VSA
International Centre for Drug Policy 8
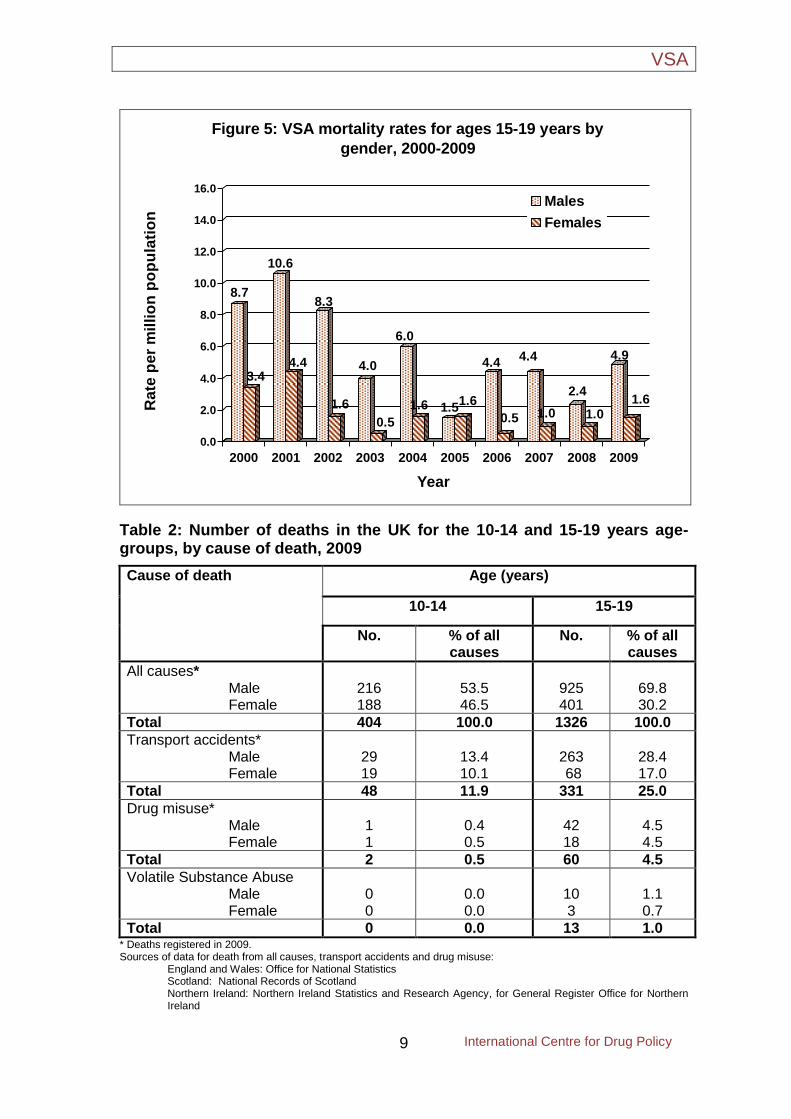
Death in young people (10-19 years) Figures 4 and 5 show the mortality rates per million populations for each year from 2000 to 2009, respectively for the 10-14 years and 15-19 years age-groups by gender. These rates were calculated by taking into account any possible changes over time in the general population. In both age-groups the mortality rates for females are generally lower than those for males. A few exceptions were observed in the 10-14 years age-group. Table 2 presents a comparison of deaths from VSA, from drug misuse (defined as deaths where the underlying causes is poisoning, drug abuse or dependence and where any of the substances controlled under the Misuse of Drugs Act 1971 are involved), from transport accidents and from all causes among the 10-14 and 15-19 years age-groups in the UK for 2009. Mortality data for all causes, transport accidents and drug misuse are for deaths registered in 2009, whereas those for VSA are those occurring in the calendar year. It should be noted that all drug misuse death numbers are collated by registration year, and that in England and Wales VSA deaths are ascribed to ICD 10 code F18; where an illicit
drug is mentioned on the death record it is included in the drug-related death figures. In 2009 there was no death in the 10-14 years age-group, but at the 15-19 years age-group VSA deaths accounted for 1.0% of deaths from all causes. In the same year, transport accidents (which are by far the most frequent cause of death), accounted for 11.9% of all deaths at age 10-14 years and 25.0% of all deaths at age 15-19 years. Deaths associated with drug misuse accounted for 0.5% of all deaths in the 10-14 years age-group and 4.5% of all deaths in the 15-19 years age-group. Looking more closely at individual age data for England and Wales for 2000 to 2008, the ratio of VSA to drug misuse deaths appears to cross over between the ages of 14 and 15 years. In the 10-14 year age-group there were 36 VSA deaths over the nine-year period compared with 15 deaths related to drug misuse. In the same period, at age 15 years there were 28 VSA deaths and 34 deaths related to drug misuse. At age 16 years there were 29 VSA deaths and 64 deaths related to drug misuse. This pattern continues into 2009.
2.0
0.5
2.0
1.6
4.0
2.1
0.5
1.11.0
0.5
1.01.1
0.0
0.6
0.00.0
0.5
0.0 0.00.0
0.00
0.50
1.00
1.50
2.00
2.50
3.00
3.50
4.00
4.50
5.00
Rate
per
mil
lio
n p
op
ula
tio
n
2000 2001 2002 2003 2004 2005 2006 2007 2008 2009
Year
Figure 4: VSA mortality rates for ages 10-14 years by
gender, 2000-2009
Males
Females
VSA
International Centre for Drug Policy
9
8.7
3.4
10.6
4.4
8.3
1.6
4.0
0.5
6.0
1.6 1.51.6
4.4
0.5
4.4
1.0
2.4
1.0
4.9
1.6
0.0
2.0
4.0
6.0
8.0
10.0
12.0
14.0
16.0
Ra
te p
er
mil
lio
n p
op
ula
tio
n
2000 2001 2002 2003 2004 2005 2006 2007 2008 2009
Year
Figure 5: VSA mortality rates for ages 15-19 years by
gender, 2000-2009
Males
Females
Table 2: Number of deaths in the UK for the 10-14 and 15-19 years age-groups, by cause of death, 2009
Cause of death Age (years)
10-14 15-19
No. % of all causes
No. % of all causes
All causes* Male Female
216 188
53.5 46.5
925 401
69.8 30.2
Total 404 100.0 1326 100.0
Transport accidents* Male Female
29 19
13.4 10.1
263 68
28.4 17.0
Total 48 11.9 331 25.0
Drug misuse* Male Female
1 1
0.4 0.5
42 18
4.5 4.5
Total 2 0.5 60 4.5
Volatile Substance Abuse Male Female
0 0
0.0 0.0
10 3
1.1 0.7
Total 0 0.0 13 1.0 * Deaths registered in 2009. Sources of data for death from all causes, transport accidents and drug misuse: England and Wales: Office for National Statistics Scotland: National Records of Scotland
Northern Ireland: Northern Ireland Statistics and Research Agency, for General Register Office for Northern Ireland
VSA
International Centre for Drug Policy 10
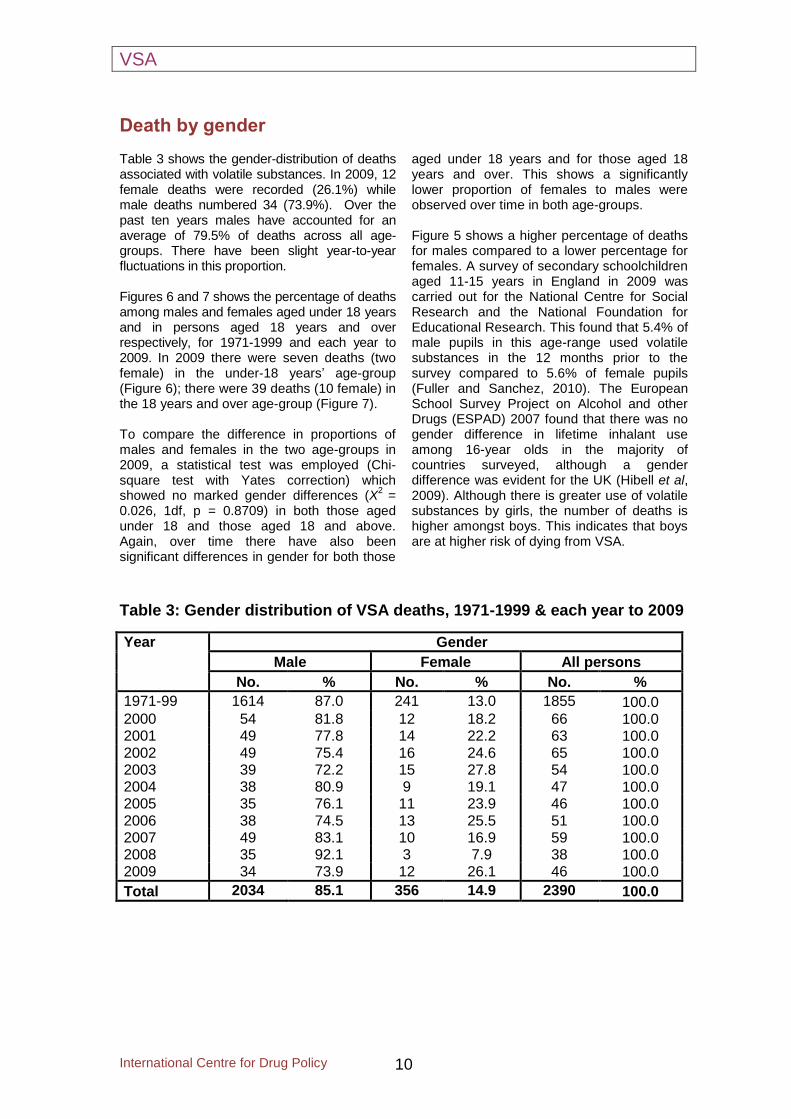
Death by gender Table 3 shows the gender-distribution of deaths associated with volatile substances. In 2009, 12 female deaths were recorded (26.1%) while male deaths numbered 34 (73.9%). Over the past ten years males have accounted for an average of 79.5% of deaths across all age-groups. There have been slight year-to-year fluctuations in this proportion. Figures 6 and 7 shows the percentage of deaths among males and females aged under 18 years and in persons aged 18 years and over respectively, for 1971-1999 and each year to 2009. In 2009 there were seven deaths (two female) in the under-18 years’ age-group (Figure 6); there were 39 deaths (10 female) in the 18 years and over age-group (Figure 7). To compare the difference in proportions of males and females in the two age-groups in 2009, a statistical test was employed (Chi-square test with Yates correction) which showed no marked gender differences (X
2 =
0.026, 1df, p = 0.8709) in both those aged under 18 and those aged 18 and above. Again, over time there have also been significant differences in gender for both those
aged under 18 years and for those aged 18 years and over. This shows a significantly lower proportion of females to males were observed over time in both age-groups. Figure 5 shows a higher percentage of deaths for males compared to a lower percentage for females. A survey of secondary schoolchildren aged 11-15 years in England in 2009 was carried out for the National Centre for Social Research and the National Foundation for Educational Research. This found that 5.4% of male pupils in this age-range used volatile substances in the 12 months prior to the survey compared to 5.6% of female pupils (Fuller and Sanchez, 2010). The European School Survey Project on Alcohol and other Drugs (ESPAD) 2007 found that there was no gender difference in lifetime inhalant use among 16-year olds in the majority of countries surveyed, although a gender difference was evident for the UK (Hibell et al, 2009). Although there is greater use of volatile substances by girls, the number of deaths is higher amongst boys. This indicates that boys are at higher risk of dying from VSA.
Table 3: Gender distribution of VSA deaths, 1971-1999 & each year to 2009
Year Gender
Male Female All persons
No. % No. % No. %
1971-99 1614 87.0 241 13.0 1855 100.0 2000 54 81.8 12 18.2 66 100.0 2001 49 77.8 14 22.2 63 100.0 2002 49 75.4 16 24.6 65 100.0 2003 39 72.2 15 27.8 54 100.0 2004 38 80.9 9 19.1 47 100.0 2005 35 76.1 11 23.9 46 100.0 2006 38 74.5 13 25.5 51 100.0 2007 49 83.1 10 16.9 59 100.0 2008 35 92.1 3 7.9 38 100.0 2009 34 73.9 12 26.1 46 100.0
Total 2034 85.1 356 14.9 2390 100.0

VSA
International Centre for Drug Policy
11
Figure 6: Gender-distribution of VSA deaths by age (<18
years), 1971-99 and each year to 2009
0
20
40
60
80
100
1971-
99
2000 2001 2002 2003 2004 2005 2006 2007 2008 2009
Year
Perc
en
tag
e o
f d
eath
s Male Female
Figure 7: Gender-distribution of VSA deaths by age (18+
years), 1971-99 and each year to 2009
0
20
40
60
80
100
120
1971-
99
2000 2001 2002 2003 2004 2005 2006 2007 2008 2009
Year
Perc
en
tag
e o
f d
eath
s Male Female
VSA
International Centre for Drug Policy 12
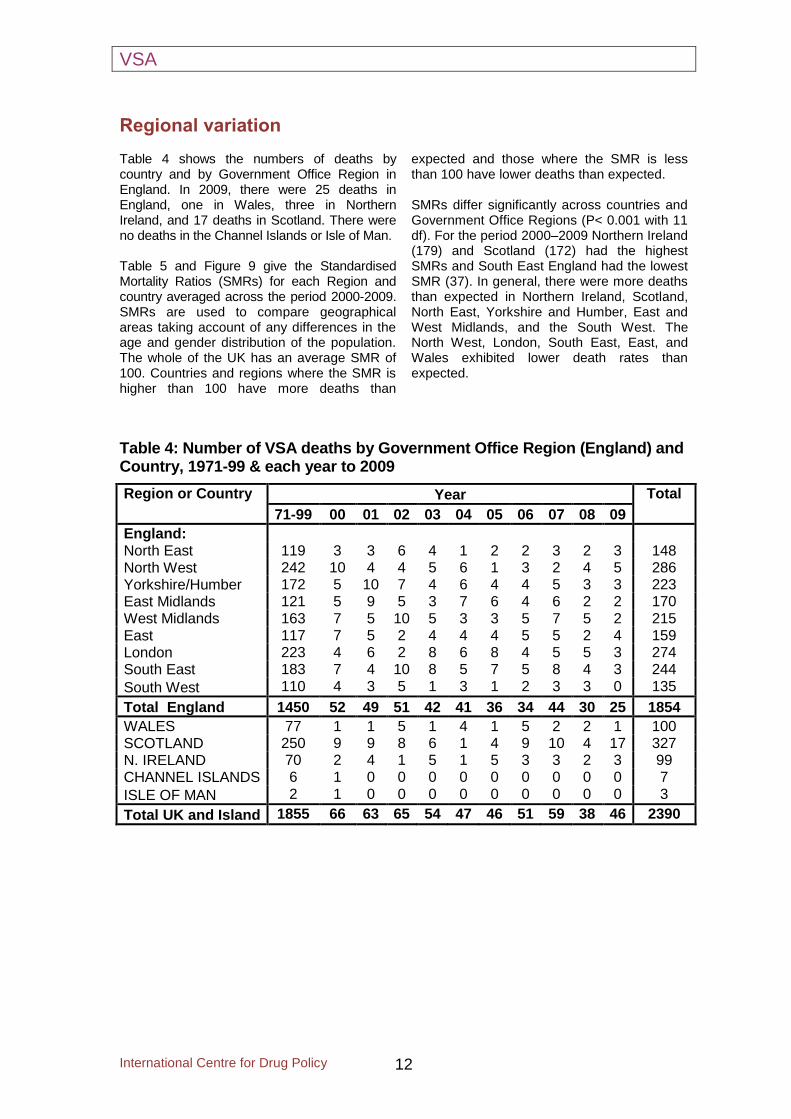
Regional variation Table 4 shows the numbers of deaths by country and by Government Office Region in England. In 2009, there were 25 deaths in England, one in Wales, three in Northern Ireland, and 17 deaths in Scotland. There were no deaths in the Channel Islands or Isle of Man. Table 5 and Figure 9 give the Standardised Mortality Ratios (SMRs) for each Region and country averaged across the period 2000-2009. SMRs are used to compare geographical areas taking account of any differences in the age and gender distribution of the population. The whole of the UK has an average SMR of 100. Countries and regions where the SMR is higher than 100 have more deaths than
expected and those where the SMR is less than 100 have lower deaths than expected. SMRs differ significantly across countries and Government Office Regions (P< 0.001 with 11 df). For the period 2000–2009 Northern Ireland (179) and Scotland (172) had the highest SMRs and South East England had the lowest SMR (37). In general, there were more deaths than expected in Northern Ireland, Scotland, North East, Yorkshire and Humber, East and West Midlands, and the South West. The North West, London, South East, East, and Wales exhibited lower death rates than expected.
Table 4: Number of VSA deaths by Government Office Region (England) and Country, 1971-99 & each year to 2009
Region or Country Year Total
71-99 00 01 02 03 04 05 06 07 08 09
England: North East 119 3 3 6 4 1 2 2 3 2 3 148 North West 242 10 4 4 5 6 1 3 2 4 5 286 Yorkshire/Humber 172 5 10 7 4 6 4 4 5 3 3 223 East Midlands 121 5 9 5 3 7 6 4 6 2 2 170 West Midlands 163 7 5 10 5 3 3 5 7 5 2 215 East 117 7 5 2 4 4 4 5 5 2 4 159 London 223 4 6 2 8 6 8 4 5 5 3 274 South East 183 7 4 10 8 5 7 5 8 4 3 244
South West 110 4 3 5 1 3 1 2 3 3 0 135
Total England 1450 52 49 51 42 41 36 34 44 30 25 1854
WALES 77 1 1 5 1 4 1 5 2 2 1 100 SCOTLAND 250 9 9 8 6 1 4 9 10 4 17 327 N. IRELAND 70 2 4 1 5 1 5 3 3 2 3 99 CHANNEL ISLANDS 6 1 0 0 0 0 0 0 0 0 0 7
ISLE OF MAN 2 1 0 0 0 0 0 0 0 0 0 3
Total UK and Island 1855 66 63 65 54 47 46 51 59 38 46 2390

VSA
International Centre for Drug Policy
13
Table 5: Standardised Mortality Ratios for Govt. Office Region (England) and Country, adjusted for age and gender, 2000-2009
Region or Country
Deaths SMR 95% confidence interval Observed Expected
ENGLAND North East 29 22.5 129 89 to 184 North West 44 60.5 73 54 to 97 Yorkshire/Humber 51 45.6 112 85 to 147 East Midlands 49 37.9 129 97 to 171 West Midlands 52 47.0 111 84 to 145 East 42 47.5 89 65 to 119 London 51 72.6 70 53 to 92 South East 26 70.8 37 25 to 53 South West 60 42.5 141 109 to 100
Total England 404 446.7 90 82 to 100
WALES 23 25.3 91 59 to 135 SCOTLAND 77 44.8 172 137 to 214 N. IRELAND 29 16.2 179 123 to 256
Total UK* 533 533 100
Crude Mortality Rates per million population per year
Male = 1.43 Female = 0.38 All persons = 0.89
* Channel Isles and Isle of Man are not included
Sources of population data (Average of censuses updated mid-year estimates for 2004 and 2005) England and Wales: Office for National Statistics Scotland: National Records of Scotland Northern Ireland: Northern Ireland Statistics and Research Agency, for General Register Office for Northern
Ireland

VSA
International Centre for Drug Policy 14
Figure 8: Standardised Mortality Ratios for Govt. Office Region (England) and Country, adjusted for age and gender, 2000-2009
172 Scotland
37
South East
129 East
Midlands
89 East
91 Wales
111 West
Midlands
73 North
West 112 Yorkshire/
Humber
179 Northern
Ireland
141
South West
129 North
East
70 London

VSA
International Centre for Drug Policy
15
Substances abused The main substances abused by all age-groups between 2000 and 2009 are shown in Table 6. Butane intended for fuel use and butane used as a propellant in aerosols are classified separately. The highest proportion of deaths is associated with only one volatile substance - butane. In 13 (2%) deaths over this 10-year period, two volatile substances in combination were known to be involved. Table 6 and Figure 9 show the number of times each substance was associated with death. Over the time-period 1971 to 2009 there was a notable change in the proportions of specific substances abused. In 2009 the total number of cases associated with gas fuels was 30, similar
to 2008. The declines in aerosol-related deaths in recent years and declines in glue-related deaths over time are more pronounced. Figure 10 gives the same information for those aged less than 18 years for the number of times each substance was associated with death. Changes in the proportion of substances abused in this age-group are also notable, with marked fluctuations observed in different periods between 2000 and 2009. In 2009 deaths associated with gas fuels sharply increased compared to 2008; whereas deaths associated with aerosols remained stable. Overall, there has been a fall over time in the number of such cases.
Table 6: Substance abused, all ages, 1971- 99 & each year to 2009 (n=2495*)
Substance Year Total
1971 -99
00 01 02 03 04 05 06 07 08 09
Gas fuels 844 38 47 46 38 33 29 28 42 28 30 1202
% 45.5 56.7 72.3 70.8 69.1 68.8 63.0 54.9 66.7 68.3 63.8 48.2
Aerosols 356 13 12 10 6 5 8 7 6 4 6 428
% 19.2 19.4 18.5 15.4 10.9 10.4 17.4 13.7 9.5 9.8 12.8 17.2
Glues 323 7 4 3 4 5 2 1 1 0 0 350
% 17.4 10.4 6.2 4.6 7.3 10.4 4.3 2.0 1.6 0.0 0.0 14.0
Other 361 8 1 6 7 5 7 15 12 8 9 440
% 19.5 11.9 1.5 9.2 12.7 10.4 15.2 29.4 19.0 19.5 19.1 17.6
Fire Extinguishers
58 0 0 0 0 0 0 0 0 0 0 58
% 3.1 0.0 0.0 0.0 0.0 0.0 0.0 0.0 0.0 0.0 0.0 2.3
Not known 12 1 0 0 0 0 0 0 1 1 2 17
% 0.6 1.5 0.0 0.0 0.0 0.0 0.0 0.0 1.6 2.4 4.3 0.7
All substances 1855 67 65 65 55 48 46 51 63 41 47 2495
* Number of substances is greater than the number of deaths as all substances associated with a death are included.

VSA
International Centre for Drug Policy 16
Figure 9: Substance associated with fatal abuse, all ages,
2000-2009 (n=548*)
0
5
10
15
20
25
30
35
40
45
50
2000 2001 2002 2003 2004 2005 2006 2007 2008 2009
Year
No
. o
f su
bsta
nces
Gas Fuels
Aerosols
Glues
Others
* All substances associated with a death are included.
Figure 10: Substance associated with fatal abuse, under
18 years of age, 2000-2009 (n=125*)
0
2
4
6
8
10
12
14
16
2000 2001 2002 2003 2004 2005 2006 2007 2008 2009
Year
No
. o
f s
ub
sta
nc
es
Gas Fuels
Aerosols
Glues
Others
* All substances associated with a death are included.
VSA
International Centre for Drug Policy
17
Products abused Table 7 shows products abused by substance for 2009. This also gives the type of products implicated in death, showing them as percentages of substances used, rather than as percentages of the total number of deaths. There were no multiple product fatalities in 2009. However, in previous years there were some instances of more than one product being involved and thus deaths can appear more than once in the table. Butane gas lighter fuel was associated with 17% of all substances fatally abused in 2009. In addition, unspecified butane (including butane gas can), some of which is likely to have been lighter fuel, accounted for another 35% of all substances in the same year. In 2009 there were five deaths (two in 2008) associated with the inhalation of anaesthetic agents. All cases involved nitrous oxide, supplied for non-medical use as cylinders or as caplets designed to be employed with cream-whipping devices, and were the result of asphyxiation where the nitrous oxide had been inhaled using a plastic bag over the head. The supply, other than by a registered pharmacist, of nitrous oxide for inhalation is an offence under Section 52 of the Medicines Act 1968. In addition one death was associated with the inhalation of chloroform and two deaths involved the inhalation of alkyl nitrites (‘poppers’). The supply of chloroform and one form of alkyl nitrite, isobutyl nitrite, is now controlled by legislation, The Dangerous Substances and Preparations (Safety) Regulations 2006, which came into full effect in August 2007. Table 8 gives similar information for the period 1971 to 2009. This shows the wide variety of products that has been abused within the broad substance categories. Since 1971, butane gas lighter fuel has been associated with a little lower than 80% of fatal abuses of gas fuel, and 38% of all substances fatally abused. Deodorants and anti-perspirants have been associated with 47% of fatal abuses of aerosols, and 8% of all substances, and contact adhesives with 54% of fatal abuses of glue, also 8% of all substances. Since 1995 there have been no deaths from text-correction fluid or pain-relief sprays and only one death from a fire extinguisher (involving an old product). Table 9 shows deaths associated with butane cigarette lighter refills in the time-period 1971-
1999 and for each year from 2000 to 2009 by gender for those aged under-18 years of age. Amongst those in this age-group, there were two deaths in 2009, as in 2008, compared with 4 in 2007 and 2 in both 2006 and 2005. Legislation which banned the sale of these items to under-18 year olds came into effect in October 1999 [The Cigarette Lighter Refill (Safety) Regulations 1999]. In this age-group the number of deaths associated with lighter fuel fell from an average of 19.8 per year between 1990 and 1999 to 6.2 per year between 2000 and 2009. The difference between these two periods is statistically significant (X
2=20.7, 1df, p<0.001). The
number of such deaths amongst those aged less than 18 fell from a peak of 40 in 1990 to 15 in 1999, and to 2 in recent years. About two-thirds of the fall in deaths occurred after the coming into force of these regulatory provisions. These changes provide evidence to suggest that the change in legislation had some beneficial impact. However, detailed analysis will be needed to evaluate the impact of changes in legislation over time. The coming into force of a European Union Directive (2005/95/EC) which restricted the use of toluene and trichlorobenzene in products harmful to man and the environment on 15 December 2006, together with the introduction of the first phase of provisions on 1 January 2007 of the Volatile Organic Compounds (VOCs) in Paints, Varnishes and Vehicle Refinishing Products Regulations 2005, as well as changes by industry anticipating the introduction of more stringent controls in the second phase from 1 January 2010, may have contributed to the low level in recent years of deaths involving the deliberate inhalation of products containing these substances. New commercial products, as well as ones which have been around for a long time, have the potential to emerge as substances of abuse due to their containing propellants. In the last year or so, the inhalation of computer cleaning duster sprays (Hahn et al., 2006; Garland and Howard, 2010; Hall et al., 2010; Howard et al., 2011), and air conditioner fluid in residential or commercial premises (Brady et al., 1994; Phatak and Walterscheid, 2010) have given rise to concern amongst health professionals and medical examiners in the USA.

VSA
International Centre for Drug Policy 18
Table 7: Substance abused, by product, 2009 (n=46*)
Substance and product No. % of substance group
% of all substances
GAS FUELS
Lighter fuel 8 25.8 17.4
Calor gas/domestic gas 2 6.5 4.3
Propane 2 6.5 4.3 Butane gas can 3 9.7 6.5
Butane unspecified 16 51.6 34.7
TOTAL OF GAS FUELS 31 100.0 67.4
AEROSOLS
Deodorant 5 100.0 10.9
TOTAL OF AEROSOLS 5 100.0 10.9
OTHER
Chloroform 1 12.5 2.2
Alkyl nitrites 2 25.0 4.3
Nitrous oxide (anaesthetic) 5 62.5 10.9
Total of Other 8 100.0 17.4
Substance not known 2 100.0 4.3
All Substances 46 - 100.0 * No multiple substances associated with a death

VSA
International Centre for Drug Policy
19
Table 8: Substance abused, by product, 1971-2009 (n=2,488)
Substance and product No. % of substance group
% of all substances
Lighter fuel 947 78.9 38.1 Calor gas/domestic gas 114 9.5 4.6 Propane 39 3.3 1.6 Acetylene 3 0.3 0.1 Butane gas can 49 4.1 2.0 Butane unspecified 48 4.0 1.9
TOTAL OF GAS FUELS 1200 100.0 48.2
Deodorant 205 46.9 8.2 Pain relief spray 63 14.4 2.5 Air freshener 51 11.7 2.0 Hair spray 33 7.6 1.3 Cleaning fluid 16 3.7 0.6 Fly spray 9 2.1 0.4 Paint spray 8 1.8 0.3 Aerosol glue 2 0.5 0.1 Other aerosols 50 11.4 2.0
TOTAL OF AEROSOLS 437 100.0 17.6
Contact adhesive 186 53.8 7.5 Puncture repair glue 11 3.2 0.4 Model glue 3 0.9 0.1 Other glues 146 42.2 5.9
TOTAL OF GLUES 346 100.0 13.9
Typewriter correction fluid 112 26.1 4.5 Chloroform 41 9.6 1.6 Unspecified trichloroethylene 38 8.9 1.5 Petrol 37 8.6 1.5 Paint thinners 15 3.5 0.6 Domestic cleaner-unspecified 19 4.4 0.8 Industrial solvent 18 4.2 0.7 Carbon tetrachloride 12 2.8 0.5 Nitromors paint stripper 6 1.4 0.2 Alkyl nitrites 23 5.4 0.9 Refrigerant gases 5 1.2 0.2 Ether 5 1.2 0.2 Benzene 1 0.2 0.0 Nitrous oxide (anaesthetic) 52 12.1 2.1 Misc other 45 10.5 1.8
TOTAL OF OTHERS 429 100.0 17.2
Fire extinguishers 58 100.0 2.3 Substance not known 18 100.0 0.7
TOTAL OF ALL SUBSTANCES 2488 100.0 100.0

VSA
International Centre for Drug Policy 20
Table 9: Deaths associated with cigarette lighter refills, in persons under 18 years of age, 1971-1999 & each year to 2009
Gender Year Total
71-99 00 01 02 03 04 05 06 07 08 09
Male 332 7 12 13 4 6 1 2 3 2 1 383
Female 59 1 3 2 2 2 1 0 1 0 1 72
All persons 391 8 15 15 6 8 2 2 4 2 2 455
VSA deaths (All) 974 17 25 24 10 13 8 7 8 5 7 1098
% all VSA deaths 40.1 47.1 60.0 62.5 60.0 61.5 25.0 28.6 50.0 40.0 28.6 41.4
Other psychoactive substances associated with VSA deaths Figure 11 shows that other psychoactive substances, including alcohol, were also present in the post mortem toxicology of VSA fatalities. This does not mean that they necessarily caused, or contributed to, death. Drugs were mentioned in 24 (54%) cases in 2009 and 25 (66%) cases in 2008. In 2009, methadone and hypnotics (such as benzodiazepines) were both recorded in 22% of cases, followed by analgesics (pain-killers) (17%), alcohol as a sole additional substance
(13%), and illicit drugs (11%). On the other hand, alcohol featured in 37% of cases in 2008, followed by illicit drugs (32%), and hypnotics (24%). The presence of methadone was also evident in both years: 13% in 2008, and 22% in 2009. These findings underline the continuing emergence of polysubstance abuse. Combining the use of psychoactive substances increases the risk of overdose and death (Ghodse et al., 2010b).
Figure 11: VSA deaths with other psychoactive substances
at post mortem, 2008 and 2009
32
24
5
11
5
13 13
5
37
0
11
22
2
74
17
22
2
13
4
0
5
10
15
20
25
30
35
40
Illicit
dru
gs
Hyp
no
tics
Sed
ati
ves
An
tid
ep
ressan
t
med
.
An
tip
sych
oti
c
med
.
An
alg
esic
s
Meth
ad
on
e
Oth
er
med
.
Alc
oh
ol
Mis
c
Pe
rce
nta
ge
of
de
ath
s 2008
2009

VSA
International Centre for Drug Policy
21
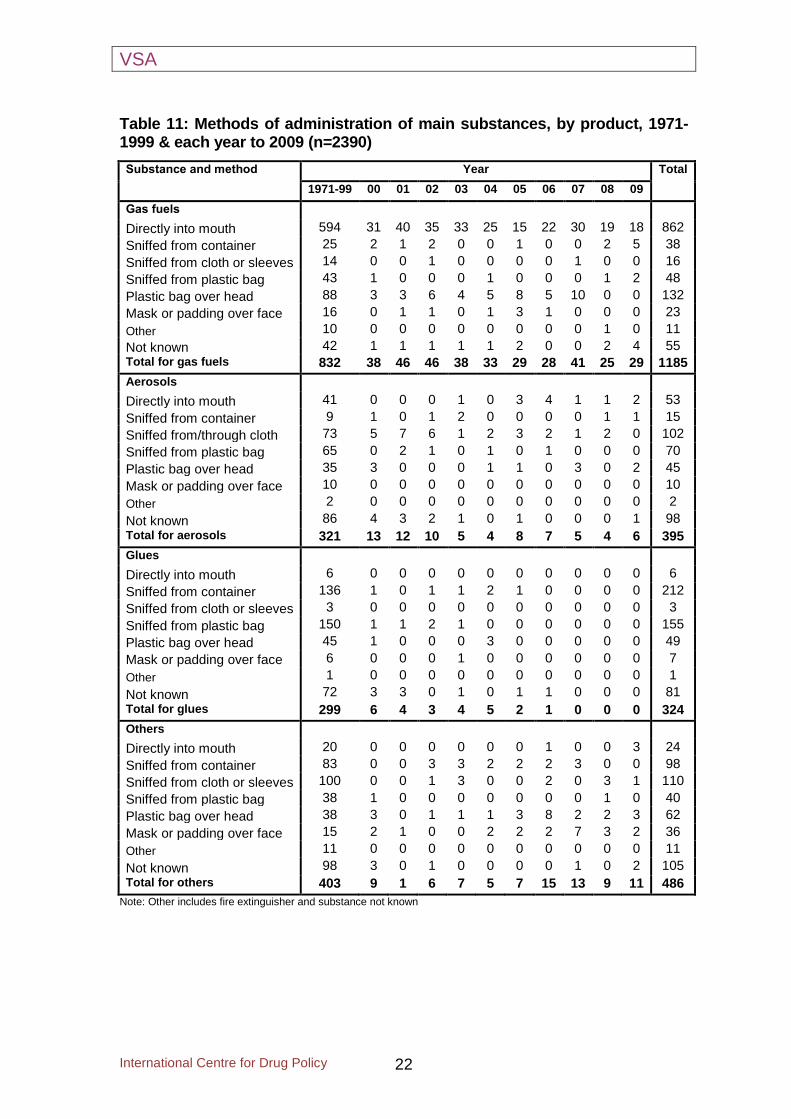
Method of administration Methods of administration of volatile substances are given in Table 10; Table 11 gives this information by product. Over the last ten years, the highest proportion of deaths occurred after substances were discharged directly into the mouth, followed by substances sniffed from plastic bags. The predominant method of abuse of butane lighter refills is believed to be by discharge directly into the mouth. In the absence of evidence to the
contrary, lighter fuel abuse has been coded to this method. The most common method of administration for aerosols used to be sniffing from a cloth covering the breathing passages (‘huffing’), but more recently has been by spraying through a cloth (‘tooting’), and for glues has been by inhalation of the fumes or vapours from plastic bags (‘bagging’).
Table 10: Methods of administration of main substances, 1971-1999 & each year to 2009
Method Year Total
1971-99 00 01 02 03 04 05 06 07 08 09
Directly into mouth 661 31 40 35 34 25 18 27 31 20 23 945
Sniffed from container 133 4 1 7 6 4 4 2 3 3 6 173
Sniffed from/through cloth 190 5 7 8 4 2 3 4 2 5 1 231
Sniffed from plastic bag 296 3 3 3 1 2 0 1 0 2 2 313
Plastic bag over head 206 10 3 7 5 10 12 13 15 2 5 288
Mask or padding over face 47 2 2 1 1 3 5 3 7 3 2 76
Other 24 0 0 0 0 0 0 0 0 1 0 25
Not known 298 11 7 4 3 1 4 1 1 2 7 339
Total 1855 66 63 65 54 47 46 51 59 38 46 2390
VSA
International Centre for Drug Policy 22
Table 11: Methods of administration of main substances, by product, 1971-1999 & each year to 2009 (n=2390)
Substance and method Year Total
1971-99 00 01 02 03 04 05 06 07 08 09
Gas fuels
Directly into mouth 594 31 40 35 33 25 15 22 30 19 18 862
Sniffed from container 25 2 1 2 0 0 1 0 0 2 5 38
Sniffed from cloth or sleeves 14 0 0 1 0 0 0 0 1 0 0 16
Sniffed from plastic bag 43 1 0 0 0 1 0 0 0 1 2 48
Plastic bag over head 88 3 3 6 4 5 8 5 10 0 0 132
Mask or padding over face 16 0 1 1 0 1 3 1 0 0 0 23
Other 10 0 0 0 0 0 0 0 0 1 0 11
Not known 42 1 1 1 1 1 2 0 0 2 4 55
Total for gas fuels 832 38 46 46 38 33 29 28 41 25 29 1185
Aerosols
Directly into mouth 41 0 0 0 1 0 3 4 1 1 2 53
Sniffed from container 9 1 0 1 2 0 0 0 0 1 1 15
Sniffed from/through cloth 73 5 7 6 1 2 3 2 1 2 0 102
Sniffed from plastic bag 65 0 2 1 0 1 0 1 0 0 0 70
Plastic bag over head 35 3 0 0 0 1 1 0 3 0 2 45
Mask or padding over face 10 0 0 0 0 0 0 0 0 0 0 10
Other 2 0 0 0 0 0 0 0 0 0 0 2
Not known 86 4 3 2 1 0 1 0 0 0 1 98
Total for aerosols 321 13 12 10 5 4 8 7 5 4 6 395
Glues
Directly into mouth 6 0 0 0 0 0 0 0 0 0 0 6
Sniffed from container 136 1 0 1 1 2 1 0 0 0 0 212
Sniffed from cloth or sleeves 3 0 0 0 0 0 0 0 0 0 0 3
Sniffed from plastic bag 150 1 1 2 1 0 0 0 0 0 0 155
Plastic bag over head 45 1 0 0 0 3 0 0 0 0 0 49
Mask or padding over face 6 0 0 0 1 0 0 0 0 0 0 7
Other 1 0 0 0 0 0 0 0 0 0 0 1
Not known 72 3 3 0 1 0 1 1 0 0 0 81
Total for glues 299 6 4 3 4 5 2 1 0 0 0 324
Others
Directly into mouth 20 0 0 0 0 0 0 1 0 0 3 24
Sniffed from container 83 0 0 3 3 2 2 2 3 0 0 98
Sniffed from cloth or sleeves 100 0 0 1 3 0 0 2 0 3 1 110
Sniffed from plastic bag 38 1 0 0 0 0 0 0 0 1 0 40
Plastic bag over head 38 3 0 1 1 1 3 8 2 2 3 62
Mask or padding over face 15 2 1 0 0 2 2 2 7 3 2 36
Other 11 0 0 0 0 0 0 0 0 0 0 11
Not known 98 3 0 1 0 0 0 0 1 0 2 105
Total for others 403 9 1 6 7 5 7 15 13 9 11 486
Note: Other includes fire extinguisher and substance not known

VSA
International Centre for Drug Policy
23
Mechanism of death VSA causes death either as a result of a direct toxic mechanism or as a result of other indirect mechanisms including plastic bag asphyxia, inhalation or aspiration of stomach contents, and trauma. Where there is a possibility of an indirect mechanism this is given priority, otherwise the death is recorded as due to ‘direct toxic effects’. Table 12 and Figure 12 show the numbers of deaths due to each mechanism over the past
decade. The majority of deaths (72% overall and 80% in 2009) are due to direct toxic effects. Between 2004 and 2007 there was an increase in the proportion of deaths associated with asphyxiation, mainly by plastic bag, followed by a decrease. The proportion of trauma deaths, which historically were more common with the abuse of glue, has largely decreased over time, from an average of 5.7% (2000-2004) to an average of 2.5% (2005-2009).
Table 12: Principal mechanism of death for all ages, 2000-2009
Mechanism Year Total
00 01 02 03 04 05 06 07 08 09
Direct toxic effect 40 48 44 43 32 30 38 44 31 37 387
% 60.6 76.2 67.7 79.6 68.1 65.2 74.5 74.6 81.6 80.4 72.3
Asphyxia-mainly plastic bag
8 2 6 2 9 8 11 10 5 5 66
% 12.1 3.2 9.2 3.7 19.1 17.4 21.6 16.9 13.2 10.9 12.3
Inhalation of vomit 6 10 9 6 5 3 1 2 0 1 43
% 9.1 15.9 13.8 11.1 10.6 6.5 2.0 3.4 0.0 2.2 8.0
Trauma 9 3 3 1 1 4 1 1 0 0 23
% 13.6 4.8 4.6 1.9 2.1 8.7 2.0 1.7 0.0 0.0 4.3
Other 1 0 0 0 0 1 0 1 1 2 6
% 1.5 0.0 0.0 0.0 0.0 2.2 0.0 1.7 2.6 4.3 1.1
Not known 2 0 3 2 0 0 0 1 1 1 10
% 1.5 0.0 4.6 3.7 0.0 0.0 0.0 1.7 2.6 2.2 1.9
Total 66 63 65 54 47 46 51 59 38 46 535
Previous history of solvent abuse In 2009, for 15 (33%) of the 46 VSA deaths there was evidence of a previous history of solvent abuse; for the remaining 67%, there was no evidence of previous volatile substance abuse (9%), or the history was unknown (58%).
However, an absence of evidence should not lead to the assumption that death occurred on the first occasion, as this fact is often difficult to establish.
Place of fatal abuse and death Figure 13 shows where the fatal abuse leading to death took place. In 2009 the most common place for abuse remained the abuser’s home (67%), followed by 9% in a friend’s house but only 2% of abuse cases occurred in a public place such as a park, shopping centre or the street. Abuse in other places accounted for
22%. Figure 14 shows the place of fatal abuse by gender for the period 2000-2009. There was a weak statistically significant difference between males and females in the place of fatal abuse (X2=7.6, 6 df, p<0.10).

VSA
International Centre for Drug Policy 24
0
10
20
30
40
50
Nu
mb
er
of
death
s
2000 2001 2002 2003 2004 2005 2006 2007 2008 2009
Year
Figure 12: Principal mechanism of VSA death for all ages,
2000-2009
Direct toxic effects Asphyxia-mainly plastic bagInhalation of vomit Trauma
Figure 13: Place of fatal abuse, 2009 (n=46)
Home
67%
Other places
22%
Public place
2%
Friend's home
9%
Home Friend's home Other places Public place

VSA
International Centre for Drug Policy
25
0.0
20.0
40.0
60.0
80.0
100.0
120.0P
erc
en
tag
e o
f d
ea
ths
Home Home of friend Public place Other places
Place of abuse
Figure 14: Place of fatal abuse by gender, 2000-2009 (n=535)
Male (n=420) Female (n=115)
The relationship between age and place of fatal abuse is shown in Table 13. Looking at the last ten years, the most common place of fatal abuse was the person’s home or the home of a friend. This proportion for those aged less than 18 years dying at home or the home of a friend was 62% and for those aged 18 years and over was 82%.
Figure 15 shows the place of VSA death in 2009. Just over half (52%) of deaths occurred at home and 22% of deaths were recorded as having occurred in hospital, or as ‘dead on arrival’ at hospital. Nearly nine per cent died at the home of a friend.
Table 13: Place of fatal abuse by age-group, 2000-2009
Age-group (Year)
Place of abuse Total
Home Home of friend
Public place
Other places
No. % No. % No % No % No
< 10 1 100.0 0 0.0 0 0.0 0 0.0 1 10-14 15 41.7 3 8.3 18 50.0 0 0.0 36 15-19 80 57.1 14 10.0 34 24.3 12 8.6 140 20-24 61 75.3 6 7.4 12 14.8 2 2.5 81 25-44 172 79.3 9 4.1 22 10.1 14 6.5 217 45+ 52 86.7 1 1.7 2 3.3 5 8.3 60
< 18 63 50.8 14 11.3 41 33.1 6 4.8 124 18+ 318 77.4 19 4.6 47 11.4 27 6.6 411
All ages 381 71.2 33 6.2 88 16.4 33 6.2 535

VSA
International Centre for Drug Policy 26
Figure 15: Place of VSA death, 2009 (n=46)
Public place
4.3%
Friend's
home
8.7%
Hospital
21.7%
Other place
13.0%Home
52.3%
Suicide Table 14 gives information on deaths since 2000 associated with the inhalation of a volatile substance where there was an inquest verdict or Procurator Fiscal finding of suicide. It is sometimes difficult to establish for suicides, particularly where no ‘suicide note’ is left (or found) (Gunnell et al., 2011), what influence the inhalation of a volatile substance had on the actions of the deceased. The use of ‘narrative’ verdicts also poses problems for determining intent (Gunnell et al., 2011).
The use of a volatile substance in combination with a plastic bag over the head often results in death by asphyxiation, which may be the intended result. However, it has to be emphasized that plastic bags can also be used to heighten sexual experience and thus death may be the result of an accident arising from impaired judgement due to lack of oxygen and/or the effects of psychoactive (including volatile) substances.
Table 14: Number of suicides associated with a volatile substance, 2000-2009
Year Suicide Total % of VSA deaths
Median age at death Male Female Suicide VSA
2000 3 0 3 66 4.5 38 2001 4 0 4 63 6.4 42 2002 4 2 6 65 9.2 48 2003 3 1 4 54 7.4 45 2004 3 0 3 47 6.4 53 2005 6 3 9 46 19.5 36 2006 8 2 10 51 19.6 42 2007 9 0 9 59 15.2 36 2008 4 0 4 38 10.5 46
2009 5 0 5 46 10.9 51
Total 49 8 57 535 10.7 45

VSA
International Centre for Drug Policy
27
Table 14 gives the frequency and median age at death by year, and Figure 17 shows the age- and gender-distribution of suicides involving VSA. In 2009 there were five suicides associated with the inhalation of a volatile substance. This is similar to the level in 2008 (4 cases). To put these figures in perspective, it is worth mentioning that the total (adults aged 15 years and over) number of suicides (defined using ICD-9 and ICD-10 codes) recorded in the UK from 2000-2009 by the General Register Offices was 57,446 with a male:female ratio of 3:1 (Personal communication to the Project from
ONS, 2011). For suicides associated with the inhalation of a volatile substance, a continuous decrease in the median age was found over time (2000-2009), with an exception in 2004. The median age of suicide was 38 years in 2000, which rose to 53 years in 2004, then fell to between 36 and 46 during 2005-8, but rising to 51 in 2009. For all suicides involving VSA since 2000, the male-female differences are more pronounced in different age-groups, particularly in those aged 20 and above (see Figure 16).
1 1
3
0
9
2
10
2
16
2 2
0
4
1
4
00
5
10
15
20
Nu
mb
er
of
death
s
15-19 20-24 25-34 35-44 45-54 55-64 65-74 >74
Age-group (years)
Figure 16: Age and gender distribution of suicides
associated with volatile substances, 2000-2009 (n=57)
Male
Female

VSA
International Centre for Drug Policy 28
Deaths associated with helium: a renewed warning Whilst inert gases, like helium and nitrogen, do not strictly come under the definition of volatile substances this report series has included reference to helium-related deaths since 1999. The cylinders of helium that can be used for inflating balloons are easily available from party shops and for purchase over the Internet. It has become evident to the team that, in the last few years, there has been a rapid increase in the number of deaths, especially suicides, resulting from the deliberate inhalation of helium.
This part of the report presents a brief overview of deaths resulting from the deliberate inhalation of helium gas between 2001 and 2009. Figure 17 gives the number of such deaths during this period; the total number of such deaths in this period was 111, of which 46 occurred in 2009, and 26 in 2008. The majority (93%) of the deaths were suicides, with the remaining 7 cases (6%) being regarded as of undetermined intent, e.g. open verdict, and one as misadventure.
Figure 17: Distribution of deaths associated with
inhalation of helium, 2001-2009
2 2
7 7
4
710
26
46
0
5
10
15
20
25
30
35
40
45
50
2001 2002 2003 2004 2005 2006 2007 2008 2009
Year
Nu
mb
er
Table 15 shows the distribution of deaths associated with helium inhalation by age-group and gender. In 2009, there were 43 cases identified of those who committed suicide by inhalation of helium while there were 23 in 2008, and 36 during the previous seven years (2001-2007). Overall, the majority (71%) were male, this percentage unchanging over time. Deaths were more pronounced among the 20-39 years age-group as compared to other age-groups shown in Table 15. Figure 18 shows causes of death due to
inhalation of helium between 2001 and 2009. The majority of deaths were caused by asphyxia, including plastic bag over the head, due to inhalation of the gas. The monitoring by this project of deaths involving the deliberate inhalation of gases and vapours has allowed the identification of a rapid increase in deaths resulting from the use of helium. This figure is particularly pronounced between 2007 and 2009, and principally involves suicides. Early indications show that this trend is continuing.

VSA
International Centre for Drug Policy
29
Table 15: Age and gender distribution of deaths due to helium inhalation Age group
2001-6 2007 2008 2009 2001-9
Male Female Male Female Male Female Male Female Male Female
< 20 years
0 1 0 0 1 0 2 0 3 1
% 0.0 16.7 0.0 0.0 4.8 0.0 5.7 0.0 3.4 4.2
20-39 13 3 4 0 9 2 16 2 42 7
% 56.5 50.0 50.0 0.0 42.9 40.0 45.7 18.2 48.3 29.2
40-59 7 2 3 1 10 3 12 6 32 12
% 30.4 33.3 37.5 50.0 47.6 60.0 34.30 54.5 36.8 50.0
60 & above
3 0 1 1 1 0 5 3 10 4
% 13.0 0.0 12.5 50.0 4.8 0.0 14.3 27.3 11.5 16.7
All ages
23 6 8 2 21 5 35 11 87 24
% 100.0 100.0 100.0 100.0 100.0 100.0 100.0 100.0 100.0 100.0
0
20
40
60
80
100
Pe
rce
nta
ge o
f d
ea
ths
2001-6 2007 2008 2009
Year
Figure 18: Causes of death due to helium inhalation, 2001-2009
Asphyxia
Poisoning by/ Intoxication
Inhalation of helium
Asphyxia/suffocation following inhalation of helium
Pulmonary oedema
Plastic bag asphyxia
Inhalation of gastric contents
Helium abuse

VSA
International Centre for Drug Policy 30
Commentary The purpose of this Project is to monitor trends in deaths associated with the abuse of volatile substances. This report reports on those trends rather than providing an exhaustive commentary. The results presented here indicate that there has been a significant overall decline in deaths from volatile substance abuse in the United Kingdom since 1992. However, this reduction appears to have stabilised in recent years. Therefore, efforts to educate people on the dangers of inhalation of volatile substances should continue, especially since young people are at greater risk of dying from VSA than from drug misuse or other causes of death. Overall, the patterns of death associated with VSA in the UK remained fairly stable in 2009. This was true, especially in respect of the products and substances abused, the place of death, as well as the age and gender distributions. However, the main change was an increase in the number of deaths from 38 to 46. This increase takes the number of cases back to a similar level as was reported for 2004 and 2005 but is still lower than the totals for 2006 and 2007. The decline in deaths between 2007 and 2008 reported last year would appear to be an actual decline rather than the result of changes in the project personnel. Methods of case-ascertainment have remained consistent with previous years and, if anything, made more robust through greater triangulation of sources and the use of additional information flows. However, this increase in deaths from one year to another should be seen as part of a longer-term downward trend. Data for recent years suggests that one-third of deaths associated with volatile substance abuse still occur amongst those aged under-20 years, predominantly among males. More than half of these premature fatalities are accidental in nature. Therefore, it is important to initiate and maintain public health strategies to prevent the risk of accidental death for those abusing volatile substances. In a high proportion (54%) of such deaths in 2009 other psychoactive substances, including alcohol, were found to be present at post mortem. These findings underline the continuing emergence of polysubstance abuse and the potentially fatal role in death of combining such substances, including ‘legal highs’ such
as piperazines which were present at significant levels in two VSA deaths in 2009. Deaths involving nitrous oxide and nitrites are still occurring, albeit at low levels. These still need to be monitored closely, as they are more frequent than in previous decades. Suicide rates associated with the inhalation of a volatile substance have fallen steadily, yet continue to occur predominantly amongst males. This decline may be due, in part, to an increase in the number of deaths involving the deliberate inhalation of helium, particularly in recent years. It should be possible to reduce the number of suicides using volatile substances and gases if the availability and accessibility of such substances were more restricted. For example, there is evidence that the introduction of the Intoxicating Substances (Supply) Act 1985 had an impact on deaths involving solvents (Esmail et al., 1992), as did the introduction of The Cigarette Lighter Refill (Safety) Regulations 1999 on those involving butane. If safer alternatives were in the market, there would be fewer and less easily accessible substances for committing suicide. This report further documents, noted for the first time anywhere in last year’s publication, the emerging issue of an increasing number of suicides due to deliberate helium inhalation. The numbers increased more than five-fold between 2006 and 2009, and appears to principally involve suicides. Those who committed suicide by inhalation of helium were mainly adult males, including those aged 20-39 years. This phenomenon merits further detailed research, as indications showed that this trend continued into 2011. Although helium is not a volatile substance, consideration may need to be given to raising awareness of this issue. This report, as well as demonstrating what has happened in 2009 and previous years in terms of deaths involving volatile substances, also provides an indication of possible evolving changes in use patterns, and newly-emerging issues. This surveillance project is the only UK-wide source of comprehensive information on the phenomena of deaths related to VSA and fatalities due to the deliberate inhalation of helium.

VSA
International Centre for Drug Policy
31
References Adlaf, E., Begin, P. and Sawka, E. (2005). A National Survey of Canadians’ Use of Alcohol and Other Drugs. Detailed report on Canadian Addiction Survey (CAS), Canadian Centre on Substance Abuse. Available at: http://www.ccsa.ca/2005%20CCSA%20Documents/ccsa-004028-2005.pdf. Accessed: 22 Dec 2011. Anderson, H. R. (1990). ‘Increase in deaths from deliberate inhalation of fuel gases and pressurised aerosols’, Br Med J, Jul 7, 301(6742):41. Anderson, H. R., MacNair, R. S. and Ramsey, J. D. (1985). ‘Deaths from the abuse of volatile substances: a national epidemiological study’, Br Med J (Clin Res Ed), Jan 26, 290(6464):304-7. Brady Jr, W.J., Stremski, E., Eljaiek, L. and Aufderheide, T.P. (1994). ‘Freon inhalational abuse presenting with ventricular fibrillation’. Amer J Emerg Med, Sep, 12(5):553-6. Butt, J. (2004). Independent evaluation of the Get Real Challenge: Issues facing Indigenous youth who misuse volatile substances, and the outcome of a program targeting these issues. March 2004, National Inhalant Prevention Coalition, Indigenous Youth Health Service and Brisbane City Council, Brisbane, Queensland. Available at: http://www.healthinfonet.ecu.edu.au/key-resources/bibliography/?lid=3510. Accessed: 22 Dec 2011. Department for Education and Skills. (2004). Drugs: Guidance for schools. February 2004. London: Department for Education and Skills. Available at: http://www.re-solv.org/downloads/Drugs%20Guidance%20For%20Schools%202004.pdf. Accessed: 22 Dec 2011. Esmail, A, Anderson, H.R., Ramsey, J.D., Taylor, J. and Pottier, A. (1992). ‘Controlling deaths from volatile substance abuse in under 18s: the effects of legislation’, Br Med J, Sep 19, 305(6855):692. Field-Smith M E, Butland, B.K., Ramsey, J.D. and Anderson, H.R. (2004). Trends in death associated with volatile substances. Report 17. June 2004. London: Department of Community Health Sciences, St. George’s Hospital Medical School. Flanagan, R.J. and Ives, R.J. (1994). ‘Volatile substance abuse’, Bull Narcot, 46(2):49-78. Flanagan, R. J., Streete, P. J. and Ramsey, J. D. (1997). Volatile Substance Abuse Practical Guidelines for Analytical Investigation of Suspected Cases and Interpretation of Results. Technical Series No 5, UNDCP. Available at: http://www.unodc.org/pdf/technical_series_1997-01-01_1.pdf. Accessed: 22 Dec 2011. Fuller, E. and Sanchez, M. (eds.). (2010). Smoking, drinking and drug use among young people in England in 2009. A survey carried out for the NHS Information Centre by the National Centre for Social Research and the National Foundation for Educational Research. 22 July 2010. Available at: http://www.ic.nhs.uk/cmsincludes/_process_document.asp?sPublicationID=1279784404203&sDocID=6325 . Accessed: 22 Dec 2011. Garland, E.L. and Howard, M.O. (2010). ‘Inhalation of computer duster spray among adolescents: an emerging public health threat?’ Am J Drug Alcohol Abuse, Nov, 36(6):320-4. Ghodse, H., Ahmed, K., Corkery, J., Naidoo, V. and Schifano, F. (2010a). Trends in deaths associated with abuse of volatile substances 1971-2008- Report 23. London: International Centre for Drug Policy, St George’s, University of London. August 2010. Available at: http://www.sgul.ac.uk/research/projects/icdp/pdf/1vsa-annual-report-2010-final-versioncorrigenda.pdf. Accessed: 22 Dec 2011. Ghodse, H., Corkery, J., Ahmed, K., Naidoo, V., Oyefeso, A. and Schifano, F. (2010b). Drug-

VSA
International Centre for Drug Policy 32
related deaths in the UK: Annual Report 2010. Drug-related deaths reported by Coroners in England, Wales, Northern Ireland, Guernsey, Jersey and the Isle of Man; Police forces in Scotland; & the Northern Ireland Statistics and Research Agency – Annual Report January-December 2009. London: International Centre for Drug Policy, St George's University of London. August 2010. Available at: http://www.sgul.ac.uk/research/projects/icdp/pdf/np-SAD%2011th%20annual%20report%20Final.pdf. Accessed: 22 Dec 2011. Gunnell, D. Hawton, K. and Kapur, N. (2011). Coroners’ verdicts and suicide statistics in England and Wales – Increasing use of narrative verdicts raises serious concerns’. BMJ, 6 Oct, 343 doi: 10.1136/bmj.d6030. Available at: http://www.bmj.com/content/343/bmj.d6030. Accessed: 22 Dec 2011. Hall, M.T., Edwards, J.D. and Howard, M.O. (2010). ‘Accidental deaths due to inhalant misuse in North Carolina: 2000-2008’. Subst Use Misuse, Jul, 45(9):1330-9. Hahn, T., Avella, J. and Lehrer, M. (2006). ‘Case report: A Motor Vehicle Accident Fatality Involving the Inhalation of 1,1-Difluoroethane’. J Anal Toxicol, Oct, 30(8):638-42. Hibell, B., Guttormsson, U., Ahlström, S., Balakireva, O., Bjarnason, T., Kokkevi, A. and Kraus, L. (eds.). (2009). The 2007 ESPAD Report: Substance Use among Students in 35 European Countries. 26 March 2009. The Swedish Council for Information on Alcohol and other Drugs (CAN); The European Monitoring Centre for Drugs and Drug Addiction (EMCDDA); Council of Europe, Co-operation Group to Combat Drug Abuse and Illicit Trafficking in Drugs (Pompidou Group). Available at: http://www.espad.org/espad-reports. Accessed: 22 Dec 2011. Hoare, J. and Moon, D. (2010). Drug misuse declared: Findings from the 2009/10 British Crime Survey, England and Wales. Home Office Statistical Bulletin 13/10. 22 July 2010. London: Home Office Research Development and Statistics Directorate. Available at: http://www.cjp.org.uk/EasySiteWeb/getresource.axd?AssetID=4438&type=full&servicetype=Attachment. Accessed: 22 Dec 2011. Howard, M., Walker, R.D., Walker, P.S., Cottler, L. and Compton, W. (1999). ‘Inhalant use among urban American Indian youth’. Addiction, Jan, 94(1):83-95. Howard, M.O., Bowen, S.E., Garland, E.L., Perron, B.E. and Vaughn, M.G. (2011). ‘Inhalant use and inhalant use disorders in the United States’. Addict Sci Clin Pract, Jul, 6(1):18-31. Harris, D. (2006). ‘Volatile Substance Abuse’, Arch Dis Child Educ Pract Ed, Dec; 91:ep93-ep100. doi:10.1136/adc.2005.076307. National Institute on Drug Abuse. (2007). Information Facts of inhalants. Washington DC: NIDA, Department of Health and Human Services. Available at: http://www.nida.nih.gov/infofacts/inhalants.html. Accessed: 22 Dec 2011. National Advisory Committee on Drugs and Drug and Alcohol Information and Research Unit. (2008) Drug use in Ireland and Northern Ireland: first results from the 2006/2007 drug prevalence survey. Bulletin 1, January 2008, Dublin: NACD. Available at: http://www.nacd.ie/publications/Survey_Final_25thJan.pdf. Accessed: 22 Dec 2011. NISRA. (2011). Young Person’s Behaviour and Attitudes Survey 2010: Topline Results. August 2011. Belfast: Northern Ireland Statistics & Research Agency. Available at: http://www.csu.nisra.gov.uk/YPBAS%202010%20Topline%20Results%20(Weighted).pdf. Accessed: 22 Dec 2011. Phatak, D.R. and Walterscheid, J. (2010). ‘Huffing air conditioner fluid: a cool way to die?’ Am J Forensic Med Pathol, Apr 19 [E-pub ahead of print. doi: 10.1097/PAF.0b013e3181dd5b5e http://www.ncbi.nlm.nih.gov/pubmed/20407359. Accessed: 22 Dec 2011.

VSA
International Centre for Drug Policy
33
Ramsey, J., Anderson, H. R., Bloor, K. and Flanagan, R. J. (1989). ‘An introduction to the practice, prevalence and chemical toxicology of volatile substance abuse’. Human Toxicology; Jul, 8(4):261-9. Steffee, C.H., Davies, G.J. and Nicol, K.K. (1996). ‘A whiff of death: fatal volatile solvent inhalation abuse’. South Med J, Sep, 89(9):879-84. Stradling, R., MacNeil, M., Cheyne, B., Scott, J. and Minty, S. (2009). Delivering Drug Education in the Classroom – Lessons from the Blueprint Programme. Edinburgh: School of Education, University of Edinburgh. Available at: http://www.management.stir.ac.uk/documents/blueprintpractioners.pdf. Accessed: 22 Dec 2011. Substance Abuse and Mental Health Services Administration. (2011). Results from the 2010 National Survey on Drug Use and Health: National Findings (Office of Applied Studies, NSDUH Series H-36, HHS Publication No. SMA 11-4658). Rockville, MD. Available at: http://oas.samhsa.gov/NSDUH/2k10NSDUH/2k10Results.pdf. Accessed: 22 Dec 2011. Welsh Government. (2011). Substance Misuse Treatment Framework (SMTF) Prevention and Education of Volatile Substance Abuse (VSA). Cardiff: Welsh Government. Available at: http://wales.gov.uk/docs/dsjlg/publications/commsafety/110518vsaen.pdf. Accessed: 22 Dec 2011. Wick, R., Gilbert, J.D., Felgate, P. and Byard, R.W. (2007). ‘Inhalant deaths in South Australia: a 20-year retrospective autopsy study’, Am J Forensic Med Pathol, Dec, 28(4):319-22. World Health Organization. (1993). Programme on substance abuse: Solvent abuse. Report of WHO consultation, Geneva, 7-9 December 1992. Geneva: World Health Organization. World Health Organization. (1999). Volatile Solvent Abuse: A global overview. Report WHO/HSE/SAB/99.7. Substance Abuse Department,. Geneva: World Health Organization. Available at: http://whqlibdoc.who.int/hq/1999/WHO_HSC_SAB_99.7.pdf. Accessed: 22 Dec 2011. World Health Organisation. (2007). International Statistical Classification of Diseases and Related Health Problems - 10th Revision. Geneva: WHO. Available at http://apps.who.int/classifications/apps/icd/icd10online/. Accessed: 22 Dec 2011.

VSA
International Centre for Drug Policy 34
Further reading list Anderson, H. R., Bloor, K., MacNair, R. S. and Ramsey, J. ‘Recent trends in mortality associated with the abuse of volatile substances in the UK’. Br Med J (Clin Res Ed), Dec 6, 293(6560): 1472 -3. . Anderson, H. R., Dick, B., MacNair, R. S., Palmer, J. C., and Ramsey, J D. (1982). ‘An investigation of 140 deaths associated with volatile substance abuse in the United Kingdom (1971-1981)’. Hum Toxicol, Jul, 1(3): 207-221. Byard, R. W., Gilbert, J D, and Terlet, J. (2007). ‘Death associated with volatile substance inhalation-histologic, scanning electron microscopic and energy dispersive X-ray spectral analysis of lung tissue’. Forensic Sci Int, Sep 13, 171(2-3):118-21. Dell, C.A., Gust, S.W. and MacLean, S. (2011). ‘Global issues in Volatile Substance Abuse. Substance Use & Misuse, May, 46(S1):1-7. [This is a special issue on the USA] Available at: http://informahealthcare.com/toc/sum/46/s1. Accessed: 22 Dec 2011. Department of Health. (2005). ‘Out of sight …. not out of mind’: Children, Young People and Volatile Substance Abuse (VSA). A Framework for VSA. Available at: http://www.dh.gov.uk/prod_consum_dh/groups/dh_digitalassets/@dh/@en/documents/digitalasset/dh_4115605.pdf. Accessed: 22 Dec 2011. Esmail, A., Meyer, L., Poittier, A. and Wright, S (1993). ‘Deaths from volatile substance abuse in those under 18 years: results from a national epidemiological study’. Arc Dis Child, Sep, 69(3):356-60. Esmail, A., Warburton, B., Bland, J. M., Anderson, H. R. and Ramsey, J. (1997). ‘Regional variations in deaths from volatile solvent abuse in Great Britain’. Addiction, Dec, 92(12):1765-71.
Ghodse, H. (2010). Ghodse’s Drugs and Addictive Behaviour: A Guide to Treatment. 4th edn. Cambridge & New York: Cambridge University Press. Health Research Board (2010). Drug-related deaths and deaths among drug users in Ireland, 1998 to 2007. Data from the National Drug-Related Deaths Index. Available at: http://www.hrb.ie/uploads/tx_hrbpublications/NDRDI_98_07.pdf. Accessed: 22 Dec 2011. Lyons, S., Lynn, E., Walsh, S. and Long, J. (2008). Trends in drug-related deaths and deaths among drug users in Ireland 1998 to 2005. HRB Trends Series 4. Dublin: Health Research Board. Available at: http://www.hrb.ie/uploads/tx_hrbpublications/HRB_Trend_Series_8.pdf. Accessed: 22 Dec 2011. National Institute of Drug Abuse (1995). Epidemiology of Inhalant Abuse: An International Perspective. NIDA Research Monograph number 148. National Institute of Drug Abuse. US Government Printing Office, USA. Available at: http://archives.drugabuse.gov/pdf/monographs/148.pdf. Accessed: 22 Dec 2011. Office for National Statistics. (2011). Suicides in the UK. 27 January 2011. Available at: http://www.ons.gov.uk/ons/rel/subnational-health4/suicides-in-the-united-kingdom/2009/index.html. Accessed: 22 Dec 2011. Office for National Statistics. (2011). Suicide rates in the UK 1991-2008. Available at: http://www.ons.gov.uk/ons/rel/subnational-health4/suicides-in-the-united-kingdom/suicide-rates/suicides-in-the-united-kingdom--1991-2008.xls. Accessed: 22 Dec 2011. Ramsey, J., Anderson, H. R., Bloor, K. and Flanagan, R. J. (1989). ‘An introduction to the practice, prevalence and chemical toxicology of volatile substance abuse’. Hum Toxicol, Jul, 8(4):261-9.

VSA
International Centre for Drug Policy
35
Walsh, S. and Long, J. (2010) Factsheet 5. Solvent and volatile inhalant use in Ireland. Dublin: Health Research Board. Available at: http://www.drugsandalcohol.ie/13067/1/Factsheet5Solvents_A4.pdf. Accessed: 22 Dec 2011.
Key Legislation Medicines Act 1968 (c. 67). Available at: http://www.opsi.gov.uk/RevisedStatutes/Acts/ukpga/1968/cukpga_19680067_en_1. Accessed: 22 Dec 2011. European Union Directive (2005/59/EC on the approximation of the laws, regulations and administrative provisions of the Member States relating to restrictions on the marketing and use of certain dangerous substances and preparations (toluene and trichlorobenzene). Available at: http://eur-lex.europa.eu/LexUriServ/LexUriServ.do?uri=CELEX:32005L0059:en:NOT Accessed: 22 Dec 2011. Intoxicating Substances (Supply) Act (c.85). Available at: http://www.legislation.gov.uk/ukpga/1985/26. Accessed: 22 Dec 2011. The Cigarette Lighter Refill (Safety) Regulations 1999. Statutory Instrument 1999 No. 1844. Available at: http://www.opsi.gov.uk/si/si1999/19991844.htm. Accessed: 22 Dec 2011. The Dangerous Substances and Preparations (Safety) Regulations 2006. Statutory Instrument 2916. Available at: http://www.opsi.gov.uk/si/si2006/uksi_20062916_en.pdf. Accessed: 22 Dec 2011. Volatile Organic Compounds (VOCs) in Paints, Varnishes and Vehicle Refinishing Products Regulations 2005. Available at: http://www.legislation.gov.uk/uksi/2005/2773/contents/made Accessed: 22 Dec 2011.

VSA
International Centre for Drug Policy 36
Appendix Description and examples of commonly abused volatile substances and solvents This is not meant to be an exhaustive list, but it does give some examples of the substances typically abused in the UK.
Type Description Examples
Aerosols Sprays containing propellants and solvents Air fresheners Contact adhesives Deodorants Hairsprays Fabric protector sprays Insect sprays Spray paints Vegetable oil sprays Computer cleaning duster sprays
Gases Medical anaethestics Gases used in household or commercial products
Chloroform, ether, halothane, nitrous oxide (laughing gas) Butane lighters, butane/ propane canisters, caplets/ cartridges for whipped cream dispensers, refrigerants, and home carbonation systems for soft drinks.
Nitrites ‘Poppers’ act primarily to dilate blood vessels and relax muscles, unlike most other volatile substances which are used to alter mood. Nitrites are used chiefly to enhance sexual experiences.
Amyl nitrite, butyl nitrite
Volatile solvents Liquids that vaporise at room temperature. Contained in a range of cheap, easily available products used for normal domestic and industrial purposes
Paint thinners and removers /strippers Dry-cleaning fluids Degreasers Petrol and petroleum products Glues

VSA
International Centre for Drug Policy
37
Ramsey, J., Anderson, H. R., Field-Smith, M. E. and Butland, B. K (2005). ‘Deaths from misuse of anesthetics’, (letter), The Pharmaceutical Journal, Aug 27, 275 (7364): 251.

Copies available from National Programme on Substance Abuse Deaths (np-SAD) International Centre for Drug Policy (ICDP) St George’s, University of London Cranmer Terrace London SW17 0RE Tel: +44 (0)20 8725 2623 Fax: +44 (0)20 8725 3538 E-mail: [email protected] Issued in October 2012