Trends in the Intergenerational Transmission of Education ...
21
DISCUSSION PAPER SERIES Forschungsinstitut zur Zukunft der Arbeit Institute for the Study of Labor Trends in the Intergenerational Transmission of Education among Black South Africans IZA DP No. 8546 October 2014 Prudence Magejo Miracle Ntuli Tendai Gwatidzo
Transcript of Trends in the Intergenerational Transmission of Education ...

DI
SC
US
SI
ON
P
AP
ER
S
ER
IE
S
Forschungsinstitut zur Zukunft der ArbeitInstitute for the Study of Labor
Trends in the Intergenerational Transmission of Education among Black South Africans
IZA DP No. 8546
October 2014
Prudence MagejoMiracle NtuliTendai Gwatidzo

Trends in the Intergenerational Transmission of Education among
Black South Africans
Prudence Magejo University of the Witwatersrand
Miracle Ntuli
University of the Witwatersrand and IZA
Tendai Gwatidzo
University of the Witwatersrand
Discussion Paper No. 8546 October 2014
IZA
P.O. Box 7240 53072 Bonn
Germany
Phone: +49-228-3894-0 Fax: +49-228-3894-180
E-mail: [email protected]
Any opinions expressed here are those of the author(s) and not those of IZA. Research published in this series may include views on policy, but the institute itself takes no institutional policy positions. The IZA research network is committed to the IZA Guiding Principles of Research Integrity. The Institute for the Study of Labor (IZA) in Bonn is a local and virtual international research center and a place of communication between science, politics and business. IZA is an independent nonprofit organization supported by Deutsche Post Foundation. The center is associated with the University of Bonn and offers a stimulating research environment through its international network, workshops and conferences, data service, project support, research visits and doctoral program. IZA engages in (i) original and internationally competitive research in all fields of labor economics, (ii) development of policy concepts, and (iii) dissemination of research results and concepts to the interested public. IZA Discussion Papers often represent preliminary work and are circulated to encourage discussion. Citation of such a paper should account for its provisional character. A revised version may be available directly from the author.

IZA Discussion Paper No. 8546 October 2014
ABSTRACT
Trends in the Intergenerational Transmission of Education among Black South Africans*
This paper investigates trends in intergenerational transmission of education among black South Africans – changes in correlation between parents’ and children’s education. Using data for 1954-1993 birth cohorts, we find a decrease in intergenerational transmission of education over the last four decades. The decline is strongest in the lower tail of the educational distribution. Nevertheless, a considerable portion of children’s education still depends on family background. Children from poor educational backgrounds face significant barriers to attaining higher levels of education while the reverse applies to those from rich backgrounds. This suggests that initiatives to weaken the intergenerational link, particularly at higher levels of education, should target the offspring of educationally deprived parents. JEL Classification: J62, I24 Keywords: intergenerational transmission, education, South Africa Corresponding author: Miracle Ntuli University of the Witwatersrand I Jan Smuts Avenue Braamfontein South Africa (Wits, 2050) E-mail: [email protected]
* We are grateful to the participants of the SEBS seminar series at University of the Witwatersrand for useful comments. All errors or omissions remain ours.

2
Introduction
Although South Africa is touted as an upper-middle income country, most of its black populace lives below par due to educational deprivation. This deficit has bestowed labour market vulnerability upon blacks, perpetuating the nation’s infamous triple burden of poverty, inequality and unemployment (see Mwabu and Schultz, 1996, 2000; Moll, 2000; Bhorat and Leibbrandt, 2001; Branson et al., 2012). The ensuing quest for socio-economic development has placed the notion of equal education opportunities for all at the centre of public policy. However, imposing a ‘level playing field’ is currently inadequate as the inequities result partly from inherited status (c.f. Louw et. al., 2006). Since Becker and Tomes’ (1979, 1986) seminal model of inheritance, evidence abounds that children partly inherit their parents’ social status inclusive of educational attainment (e.g. Haveman and Wolfe, 1995; Hertz et. al., 2007; Black and Devereux, 2005; Checchi et. al., 2007). This intricately links the efficacy of educational policies to the degree of intergenerational transmission in a given society. In the case of post-Apartheid South Africa, if policies are not designed to adequately break the inherited status among blacks, Apartheid-induced educational inequities may be persistently transmitted from one generation to another. In this context understanding whether the relentless educational inequality among blacks is reflective of low intergenerational mobility and changes thereof is vital for policy.
Several studies have examined intergenerational transmission of education in South
Africa (e.g. Lam, 1999; Case and Deaton, 1999; Louw et. al., 2006; Hertz et al., 2007; Nimubona and Vencatachellum, 2007; Girdwood and Leibbrandt, 2009; and Burns and Keswell, 2012). Their research thrust has mainly been at a particular point in time; snapshot view. This has left a dearth of knowledge on shifts that might have occurred to intergenerational transmission of education following South Africa’s educational reforms. Therefore, this study examines temporal developments in intergenerational transmission of education among black South Africans, over the last four decades. This informs the question whether black South Africans have become more mobile with time. The study utilizes data drawn from the 2011 South African population census for 1954-1993 birth cohorts. The sample herein comprises children entirely and partly educated within the Apartheid system, and the ‘born-frees’ fully educated in the post-Apartheid era. Exploiting this diversity, our analysis offers up-to-date historical evidence that is useful in assessing the effectiveness of past reforms in reducing inequalities in educational attainment. We hypothesise that if previous policy initiatives were successful in reducing inequality in the education system, then the intergenerational link between parents’ and children’s educational attainment should exhibit a downward trend.
Interesting findings emerge from our analysis. First, the intergenerational transmission of
education fell significantly over the last four decades. However, about a third of the variation in child’s educational attainment is still explained by maternal/paternal education, for the youngest cohort. Second, we find that the increased mobility occurred mainly in the lower rather than the upper tail of the education distribution. Thus, children from poor educational backgrounds still

3
face little prospects of attaining higher education despite the increases in educational mobility. The opportunities for attaining higher education appear to be ‘reserved’ for children from highly educated parents. Last, our results further indicate that mother’s education is generally more important in influencing child’s education than father’s; however, the effect is more pronounced among sons rather than daughters. Important policy implications of these results are drawn in the sequel.
The rest of the paper is organized as follows. Section 2 discusses the South African
education system and previous studies. Section 3 presents the conceptual framework and a description of data. Section 4 provides a discussion of the results and section 5 concludes.
2. The education system and previous studies in South Africa
In line with the broader racial segregation inherent in the Apartheid system, the Bantu Education Act (1953) legalized racial segregation in public schools. The objective was to train blacks as laborers and artisans for the white economy, but not as professionals (Zandile, 1997). To support the agenda, black schools were grossly under-resourced compared to white schools. Thomas (1996) and Samuel (1996) estimated that in 1975-6 government expenditure on a white student was 15-20 times that of a black student, for the duration of their studies. This race-based school funding system meant white schools received more teachers in terms of quantity and quality than black schools. For instance, over the period 1957-1993 the pupil teacher ratio for black public schools was in the range 50:1 to 70:1 while that for white schools had a maximum of 25:1 (Fedderke et al., 2000). This resulted in poor throughput rates among blacks - perpetuating earnings inequality in the labour market (Fedderke et al., 2000). The subsequent Education and Training Act (1980) did not significantly change the inequities. For instance, in 1989 expenditure on blacks was four times less than that on whites (Nimubona and Vencatachellum, 2007).
The post-Apartheid government was therefore tasked with transforming and dismantling a highly discriminatory education system to one that catered for all South Africans as is enshrined in the country’s Constitution (1996). A number of legal instruments were thus legislated to ensure an equitable educational system. These include the South African Schools Act of 1996 (aimed at ensuring universal access to quality education), the Further Education Act of 1997 (aimed at transforming the higher education sector) and the Employment of Educators Act of 1998. To facilitate the transformation of the sector, the government significantly increased its expenditure on education with money being spent on a number of programmes including: school renovation (particularly those areas hitherto neglected by the apartheid government), fee subsidy, primary school nutrition, as well as training and hiring of teachers. The above steps reduced the average pupil-teacher ratios from 47:1 in 1994 to 35:1 in 2000 (Department of Education South Africa, 2001). Between 1994 and 2000 per capita expenditure on pupils

4
increased from R2 222 to R3 253, an increase of more than 46% (Department of Education South Africa, 2001). By 2010 public expenditure on education was about 6% of the country’s GDP and about 20% of total government expenditure (see World Development Indicators online database). In 2007 the literacy rate was about 90%. The percentage of qualified educators increased from 53% in 1990 to 94% in 2008 (Department of Education South Africa, 2009). For black educators the percentage of qualified educators increased from 37% in 1990 to 93.9% in 2008 (Department of Education South Africa, 2009). Although the government has taken a number of steps to eradicate discrimination in the schooling system and to equalize access to education across all racial groups, this has not been without its own problems. For example, though the quantity of schooling may have increased significantly, post-Apartheid schooling quality still lags. Notwithstanding, it remains important to assess whether the shift from a highly discriminatory education system to a more equitable one has had an effect on intergenerational education mobility.
Studies on intergenerational transmission of education are vast in developed countries
(see Mulligan, 1999; Hertz, 2007; and Black and Devereux, 2011 for a more detailed discussion), yet, they remain limited within developing countries including South Africa. A summary of previous South African studies is presented in Table A.3 in the Appendix. Early contributions in the South African literature include Thomas (1996), Case and Deaton (1999) and Lam (1999) who presented evidence of educational persistence across generations, particularly among blacks. This result is also confirmed by more recent studies such as Nimubona and Vencatachellum (2007) and Girdwood and Leibbrandt (2009) suggesting that parental education is still relevant in determining children’s educational outcomes. Evidence on the link between parental and child education by gender is mixed. Lam (1999) found that the effect of a mother’s education on a child’s education is not different to that of a father’s. In contrast, Thomas (1996) found that mother’s education significantly affects daughters’ education than sons’ while Girdwood and Leibbrandt (2009) found that the link between child and father’s education is stronger than that between mother and child. More recently, Burns and Keswell, (2011) found a higher link between the education of daughters and parents, compared to that between parents and sons; suggesting higher educational mobility for third generation boys than girls.
Evidence on temporal developments, although limited, is also mixed. Thomas (1996)
found that children born before 1950 had higher mobility than those born after 1950; a result further collaborated by Girdwood and Leibbrandt (2009). In contrast, Burns and Keswell (2012) report higher educational persistence between parents and children compared to first and second generation (i.e. grandparents and parents); suggesting a decrease in educational mobility. Arguably, these variations in results are potentially an artifact of data sets which cover different time periods and populations. This study partly attempts to consolidate previous findings by providing a more disaggregated analysis.

5
3. Conceptual framework and Data 3.1. Conceptual framework
We estimate the intergenerational mobility of educational attainment among black South Africans using data for children born from 1954 to 1993. The estimations are carried out for five-year cohorts. The youngest cohort comprises children who had finished school in the survey period of our data; 18 year olds in 2011. Following international literature on intergenerational mobility, the general impact of parental education on a child’s education is estimated using equation (1):
)1(SS ici
Pi
ci ε+γ+β+α= X
where P
ici S and S denote child i’s and parent i’s years of education, respectively; p = father (f),
mother (m) and c denotes a five year birth cohort. X is a vector of child i’s characteristics: age, age squared, number of siblings, region of birth, indicator variable of whether a person resides in region of birth and gender. iε is an error term. The estimate of β is of main concern i.e.
p
ccp
ˆσσ
ρ=β
where pcpc ρ and ,σ ,σ are standard deviations for error terms of child and parent’s generations,
and correlation coefficient between child’s and parent’s education, respectively. An increase (decrease) in β̂ may be due to either an increase (decrease) in intergenerational mobility of
education ( cpρ ) or an increase (decrease) in p
c
σσ . Thus, β̂ gives an absolute measure of
intergenerational transmission of education as it does not account for a change in variance of education across generations. Accounting for the dispersion of education across generations is important within the South African context where
p
c
σσ has been decreasing overtime as
presented in Table A.2 in the Appendix. This issue is addressed in equation (2).
)2( SSi
ci
p
Pi
c
ci ν+γ+
σρ+α=
σX

6
where p
Pi
c
ci
σS and
σS are normalised years of child i and parent i’s education - by the respective
standard deviation. ρ may be interpreted as a relative measure of intergenerational transmission of education; it accounts for changes in inequality of educational attainment across child’s and parent’s generations. A high estimate of ρ indicates that a child’s schooling is heavily influenced by the parent’s. An estimate close to zero implies a lack of correlation between child and parent’s education. To assess if there is a gender bias in transmission of education, we further estimate equations (1) and (2) separately for sons and daughters.
Studies of intergenerational mobility (see for instance, Becker and Tomes, 1986;
Haveman and Wolfe, 1995; Black and Devereux, 2010; Checchi et. al., 2011) attribute the high correlation between parental education and child education to nature and nurture inter alia. Nature pertains to a genetic transmission of ability from parent to child; with an expectation that a high ability parent attains a high level of education which is naturally transmitted to the child. Similarly, a child can receive cultural resources which translate into human capital from a parent; e.g. learning skills (Haveman and Wolfe, 1995). Nurture relates to a parent’s time and economic investments in a child’s human capital. According to Haveman and Wolfe (1995), nurture is relatively more important in explaining the parental-child education transmission mechanism (Checchi et. al., 2011). It is also notable that this study does not attempt to estimate the causal effect of parental education on child education due to data concerns. The causal effect is usually estimated using Instrumental Variable Estimation (IV), to control for parental or child ability, and introduce exogenous variation in parental education, for example (Checchi et. al., 2011). Our data lacks instrumental variables for a proper IV estimation. Consequently we estimate a correlation between parental and child education using OLS. To some extent, this suffices for our study as we are mainly concerned with the evolution of the correlation over time. If the factors which might bias the estimates are time invariant, our analysis of changes in intergenerational transmission of education overtime is still informative without distinguishing nature and nurture elements (Heineck and Riphahn, 2007). 3.2. Data
This study utilises the 10% sample drawn from the 2011 South African population census. The survey provides detailed demographic and economic activity information such as year of birth, place of birth, population group and education levels of all household members. We construct our sample by matching children to their parents within a given household. The structure of the dataset only allows us to match children co-residing with their parents, thus we lack parental information on children who reside on their own. Bearing this limitation in mind, our analysis is restricted to a sample of black South Africans - who were born in South Africa and are South African citizens. This selection is essential given that our results could be biased
7
by immigrants who received their education elsewhere. To ensure that children’s education is measured after school completion, we drop individuals aged below 18 years and students. We also eliminate observations with missing information on our key variables. After the data cleaning process, our remaining sample consists of 303 106 children (149 204 male and 153 902 female) born between 1953 and 1994. The data is organised into five-year cohorts based on children’s year of birth.
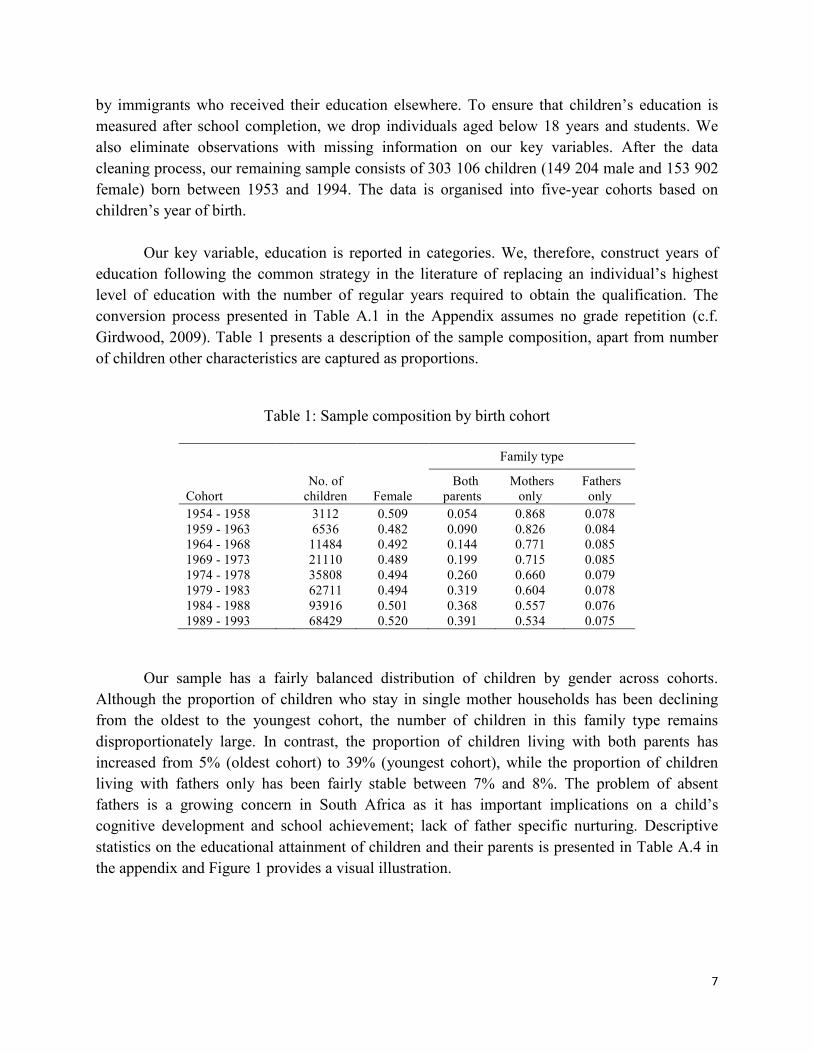
Our key variable, education is reported in categories. We, therefore, construct years of education following the common strategy in the literature of replacing an individual’s highest level of education with the number of regular years required to obtain the qualification. The conversion process presented in Table A.1 in the Appendix assumes no grade repetition (c.f. Girdwood, 2009). Table 1 presents a description of the sample composition, apart from number of children other characteristics are captured as proportions.
Table 1: Sample composition by birth cohort
Family type
Cohort No. of
children Female Both parents
Mothers only
Fathers only
1954 - 1958
3112 0.509 0.054 0.868 0.078 1959 - 1963
6536 0.482 0.090 0.826 0.084
1964 - 1968
11484 0.492 0.144 0.771 0.085 1969 - 1973
21110 0.489 0.199 0.715 0.085
1974 - 1978
35808 0.494 0.260 0.660 0.079 1979 - 1983
62711 0.494 0.319 0.604 0.078
1984 - 1988
93916 0.501 0.368 0.557 0.076 1989 - 1993 68429 0.520 0.391 0.534 0.075
Our sample has a fairly balanced distribution of children by gender across cohorts. Although the proportion of children who stay in single mother households has been declining from the oldest to the youngest cohort, the number of children in this family type remains disproportionately large. In contrast, the proportion of children living with both parents has increased from 5% (oldest cohort) to 39% (youngest cohort), while the proportion of children living with fathers only has been fairly stable between 7% and 8%. The problem of absent fathers is a growing concern in South Africa as it has important implications on a child’s cognitive development and school achievement; lack of father specific nurturing. Descriptive statistics on the educational attainment of children and their parents is presented in Table A.4 in the appendix and Figure 1 provides a visual illustration.

8
Figure 1: Education attainment of children and parents
0.00
2.00
4.00
6.00
8.00
10.00
12.00
1954 1959 1964 1969 1974 1979 1984 1989 1994
Years
of ed
ucati
on
Year of birth
Panel A: Parents and children years of education
Daughter Son Mother Father
0.00
0.10
0.20
0.30
0.40
0.50
0.60
0.70
0.80
0.90
1.00
1954 1959 1964 1969 1974 1979 1984 1989 1994
propo
rtion o
f chil
dren/p
arents
Year of birth
Panel B: Children's highest level of education
No schooling (daughter) Primary (daughter) Secondary (daughter)College (daughter) No schooling (son) Primary (son)Secondary (son) College (son)

9
Panel A of Figure 1 indicates that there has been a consistent upward trend in the average years of education for children (both sons and daughters) across cohorts; with the exception of the youngest cohort. The average years of education are higher for daughters than sons and the gender difference is statistically significant. In comparison, parents' education although increasing overtime, remains substantially lower (by about 50%) relative to children's education. We also note that there are no significant differences between mother and father's average years of education. Panel B of Figure 1, which presents children's highest levels of education, shows a general decrease in the proportion of children with low education levels, that is, no schooling and primary. Concomitantly, there is a boom in secondary education - thanks to expansion policies for higher education. Thus, the South African education system has made significant strides in availing primary and secondary education. Regrettably, the picture differs for tertiary education which lags behind. Compared to the education distribution of parents, Table A.4 shows that parents are relatively more concentrated in low echelons i.e. no schooling and primary. This parent-child differential in education distribution across cohorts suggests a weakening link between parents’ and children’s education overtime - in favour of upward mobility. 4. Empirical Results
Table 2 presents estimates of intergenerational transmission of education by cohort, for all children and separately for sons and daughters. pβ̂ is an absolute measure of intergenerational
transmission as per equation (1), while pρ̂ is the relative measure as per equation (2).
Table 2: Estimates of intergenerational transmission of education
Absolute measure Relative measure
motherβ̂ std. err fatherβ̂ std. err motherρ̂ std. err fatherρ̂ std. err
Panel A: All children 1954 - 1958
0.483 (0.020) 0.444 (0.051)
0.418 (0.017)
0.406 (0.047)
1959 - 1963
0.408 (0.014) 0.377 (0.031)
0.366 (0.013)
0.360 (0.029) 1964 - 1968
0.392 (0.010) 0.370 (0.019)
0.363 (0.009)
0.360 (0.019)
1969 - 1973
0.314 (0.007) 0.291 (0.012)
0.328 (0.007)
0.309 (0.013) 1974 - 1978
0.278 (0.005) 0.245 (0.007)
0.331 (0.005)
0.294 (0.009)
1979 - 1983
0.241 (0.003) 0.215 (0.004)
0.341 (0.004)
0.302 (0.006) 1984 - 1988
0.215 (0.002) 0.199 (0.003)
0.334 (0.003)
0.310 (0.005)
1989 - 1993 0.207 (0.003) 0.183 (0.004) 0.314 (0.004) 0.278 (0.005) Panel B: Daughters 1954 - 1958
0.507 (0.028) 0.530 (0.077)
0.436 (0.024)
0.459 (0.066)
1959 - 1963
0.425 (0.020) 0.382 (0.041)
0.383 (0.018)
0.376 (0.040) 1964 - 1968
0.407 (0.014) 0.427 (0.027)
0.380 (0.013)
0.406 (0.026)
1969 - 1973
0.316 (0.009) 0.283 (0.016)
0.341 (0.010)
0.310 (0.018) 1974 - 1978
0.276 (0.006) 0.248 (0.010)
0.340 (0.008)
0.307 (0.013)
1979 - 1983
0.234 (0.004) 0.207 (0.006)
0.343 (0.006)
0.305 (0.009) 1984 - 1988
0.211 (0.003) 0.197 (0.004)
0.343 (0.005)
0.323 (0.007)
1989 - 1993 0.203 (0.003) 0.177 (0.005) 0.326 (0.005) 0.287 (0.008)

10
Panel C: Sons 1954 - 1958
0.459 (0.029) 0.349 (0.070)
0.400 (0.025)
0.339 (0.068)
1959 - 1963
0.391 (0.020) 0.378 (0.046)
0.350 (0.018)
0.350 (0.043) 1964 - 1968
0.377 (0.014) 0.319 (0.027)
0.349 (0.013)
0.319 (0.027)
1969 - 1973
0.312 (0.010) 0.297 (0.017)
0.319 (0.010)
0.309 (0.018) 1974 - 1978
0.279 (0.007) 0.244 (0.011)
0.326 (0.008)
0.287 (0.012)
1979 - 1983
0.248 (0.004) 0.221 (0.006)
0.342 (0.006)
0.302 (0.009) 1984 - 1988
0.218 (0.003) 0.201 (0.004)
0.328 (0.005)
0.300 (0.007)
1989 - 1993 0.212 (0.004) 0.188 (0.005) 0.306 (0.006) 0.272 (0.008) Notes: Standard errors in parentheses. The model control variables are - child's age, age-squared, female, province of birth, urban, dummy indicating if individual moved from province of birth, number of children of siblings.
The absolute measure indicates that the correlation between parent’s and child’s education started at a high level - 0.49. For the oldest cohort (1954-1958), the correlation between mother’s and child’s education is 0.48 while that between father and child is 0.44. Over the past four decades, the intergenerational link declined by more than 50%. For mother and child, education transmission declined by 56% to 0.21 similarly the correlation between father and child’s education declined by 58% to 0.18. This downward trend in parent-child transmission of education suggests an increase in educational mobility. Notably, the rate of increase is not evenly distributed across cohorts – it is higher for older compared to younger cohorts. The relatively larger increases in educational mobility for older cohorts are possibly due to the initial opening up of the education system to blacks following the establishment of the Bantu education system in 1953 (Burns and Keswell, 2012). Thus, unlike the earlier elitist missionary education system, the Bantu education system was more accessible to blacks, although poor in quality (Pampallis 1997, 2007). A slowdown in educational mobility started for children born in the 1970s. These results indicate that educational mobility has been increasing but at a decreasing rate.
The overall decline in intergenerational transmission of education uncovered by the absolute measure might be solely due to a reduction in the dispersion of education between
parents and children across cohorts, that is, p
c
σσ (see Table A.2). When this is factored out, we
find a higher (lower) parent-child correlation in educational attainment for children born before (after) 1969. While our absolute and relative mobility measures are somewhat quantitatively different, our conclusion remains unchanged. The mother-child transmission of education fell significantly from 0.42 (oldest cohort) to 0.31 (youngest cohort) while the father-child correlation declined from 0.41 (oldest cohort) to 0.28 (youngest cohort). This finding of an increased intergenerational mobility is in line with Thomas (1996).
Pertaining to paternal/maternal differences in influencing child’s educational outcomes, we find significant (insignificant) differences between maternal and paternal education on children’s schooling among children born after (before) 1974. The mother-child educational correlation is 7-10% more than the father-child one. Disaggregating this by child’s gender, we find statistically similar effects of mother’s and father’s education on daughters’; except for the youngest cohort. In contrast, mother’s education is significantly more important than father’s in determining schooling outcomes of sons born after 1974. In contrast, Burns and Keswell (2012) find that mother’s education is significantly more important for both sons and daughters.
11
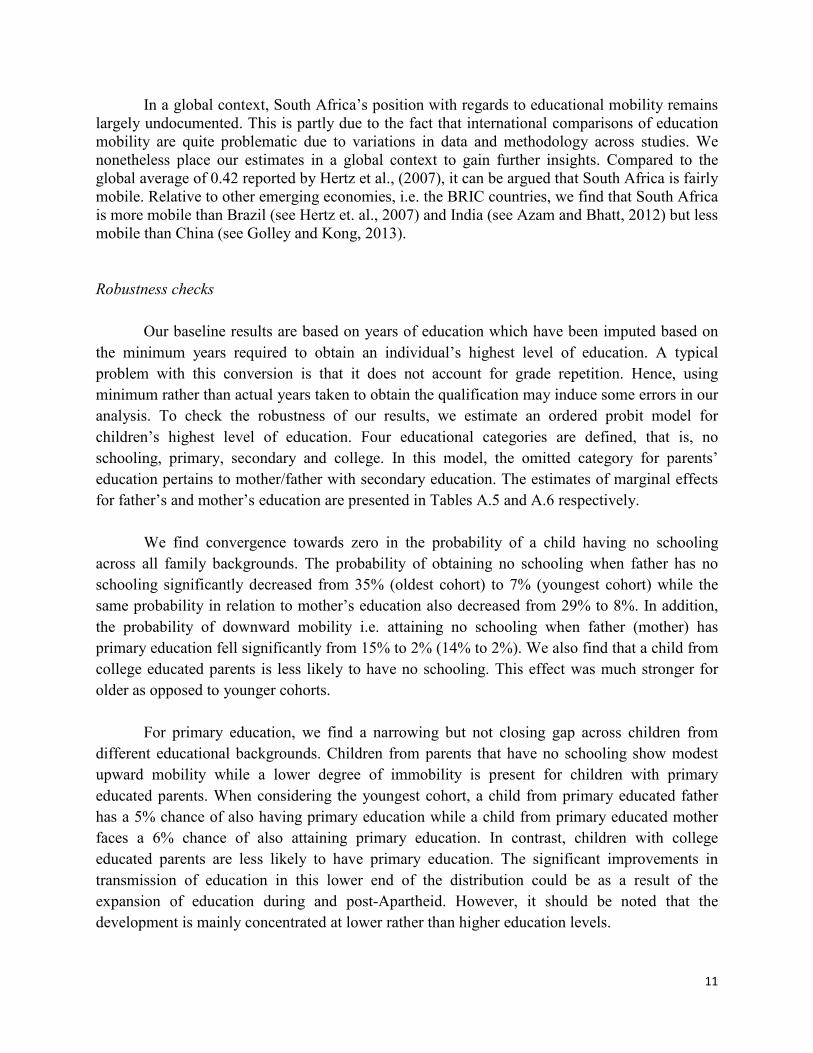
In a global context, South Africa’s position with regards to educational mobility remains largely undocumented. This is partly due to the fact that international comparisons of education mobility are quite problematic due to variations in data and methodology across studies. We nonetheless place our estimates in a global context to gain further insights. Compared to the global average of 0.42 reported by Hertz et al., (2007), it can be argued that South Africa is fairly mobile. Relative to other emerging economies, i.e. the BRIC countries, we find that South Africa is more mobile than Brazil (see Hertz et. al., 2007) and India (see Azam and Bhatt, 2012) but less mobile than China (see Golley and Kong, 2013).
Robustness checks
Our baseline results are based on years of education which have been imputed based on the minimum years required to obtain an individual’s highest level of education. A typical problem with this conversion is that it does not account for grade repetition. Hence, using minimum rather than actual years taken to obtain the qualification may induce some errors in our analysis. To check the robustness of our results, we estimate an ordered probit model for children’s highest level of education. Four educational categories are defined, that is, no schooling, primary, secondary and college. In this model, the omitted category for parents’ education pertains to mother/father with secondary education. The estimates of marginal effects for father’s and mother’s education are presented in Tables A.5 and A.6 respectively.
We find convergence towards zero in the probability of a child having no schooling across all family backgrounds. The probability of obtaining no schooling when father has no schooling significantly decreased from 35% (oldest cohort) to 7% (youngest cohort) while the same probability in relation to mother’s education also decreased from 29% to 8%. In addition, the probability of downward mobility i.e. attaining no schooling when father (mother) has primary education fell significantly from 15% to 2% (14% to 2%). We also find that a child from college educated parents is less likely to have no schooling. This effect was much stronger for older as opposed to younger cohorts.
For primary education, we find a narrowing but not closing gap across children from
different educational backgrounds. Children from parents that have no schooling show modest upward mobility while a lower degree of immobility is present for children with primary educated parents. When considering the youngest cohort, a child from primary educated father has a 5% chance of also having primary education while a child from primary educated mother faces a 6% chance of also attaining primary education. In contrast, children with college educated parents are less likely to have primary education. The significant improvements in transmission of education in this lower end of the distribution could be as a result of the expansion of education during and post-Apartheid. However, it should be noted that the development is mainly concentrated at lower rather than higher education levels.

12
The results also indicate that a child from parents with an education less than secondary is less likely to achieve college education while children from college educated parents are more likely to attain college education. This suggests that the observed increase in education mobility could be mainly as a result of improvements in prospects in the lower tail which do not extend to the upper tail of the educational distribution. A possible explanation for this is the higher education system’s overreliance on the market mechanism. 5. Conclusion
This study examines trends in intergenerational transmission of education among black South Africans. Using data for children born over the period 1954-1993, we find increased educational mobility among black South Africans over the last four decades. This development can be accredited to the education expansion policies during- and post-Apartheid. Nevertheless, children’s educational attainment still depends, to a larger extent, on parental education. The relative measure of intergenerational mobility shows that, for the youngest cohort, approximately one third of the variation in a child’s schooling is explained by maternal/paternal education. We find increased mobility in the lower tail of the education distribution and lower mobility in the upper tail. This result suggests that past education reforms have been mostly successful in expanding educational opportunities at lower educational levels. Our results further indicate that a mother’s education is generally more important in influencing a child’s education though the effect is more pronounced among sons rather than daughters.
Our results have important policy implications. Clearly, purely market based educational policies are likely to be inadequate in dealing with educational impediments resulting from family background. Educational interventions aimed at reducing the intergenerational transmission of education, i.e. by making access to education lesser dependent on family background will undoubtedly be more effective in reducing inequality in South Africa. Such policies should place more emphasis on children from poor educational backgrounds as they face higher risk of attaining low education than those from high educational backgrounds. This study has two main limitations. First, the child-parent pairs used in this study are based on children co-residing with their parents. Consequently, information on education for non-coresiding parents is missing. Due to this restriction, our results may potentially suffer from selection bias if the children who live on their own (or with their parents) are not a random sample. Second, due to the unavailability of data, this analysis fails to account for the changes in quality of education. Third, our dataset is cross sectional in nature such that we cannot assess the extent of measurement error, if any, in our education variable. Last, our analysis does not distinguish between the effects of nature and nurture – this kind of analysis can be accomplished by using instrumental variables for education which are generally difficult to find. Future studies should endeavour to examine the relative importance of these elements in the intergenerational transmission of education among black South Africans.

13
REFERENCES Azam, M., and V. Bhatt. 2012. Like Father, Like Son? Intergenerational Education Mobility in
India. Working Paper No. 6549. Bonn: The Institute for the Study of Labor (IZA) discussion http://ssrn.com/abstract=2062748.
Becker, G. K., and N. Tomes. 1979. “An Equilibrium Theory of the Distribution of Income and Intergenerational Mobility.” Journal of Political Economy 87(6): 1153-1189.
Bhorat, H., and M. Leibbrandt. 2001. “Correlates of Vulnerability in the South African Labour Market.” Chap. 3 in Fighting poverty: Labour markets and inequality in South Africa, edited by H. Bhorat, M. Leibbrandt, M. Muzi, S.Van der Berg and I. Woolard, 74-106. University of Cape Town (UCT) Press: Lansdowne.
Bingley, P., C. Kaare, M. Vibeke and V. M. Jensen. 2009. Parental Schooling and Child Development: Learning from Twin Parents. SFI Working Paper No. 07.
Black, S. E., and P. J. Devereux. 2011. “Recent Developments in Intergenerational Mobility.” Chap. 16 in Handbook of Labor Economics, edited by O. Ashenfelter and D. Card, 5-16. North-Holland, Amsterdam.
Black, S. E., P. J. Devereux, and K. G., Salvanes. (2005). Why the Apple Doesn’t Fall Far: Understanding Intergenerational Transmission of Human Capital. American Economic Review 95: 437- 449.
Branson, N., J. Garlick, D. Lam and M. Leibbrandt. 2012. “Education and Inequality: The South African Case.” Working Paper No. 75. University Cape Town: Southern Africa Labour and Development Research Unit. http://www.opensaldru.uct.ac.za/handle/11090/168.
Burns, J., and M. Keswell.2012. “Inheriting the Future: Intergenerational Persistence of Education Status in KwaZulu Natal.” Economic History of Developing Regions 27 (1): 150-175.
Case, A., and A. Deaton. 1999. “School Inputs and Educational Outcomes in South Africa.” The Quarterly Journal of Economics 14 (3): 1047-1084.
Checchi, D., C. V. Fiorio, and M. Leornadi. 2013. “Intergenerational Persistence of Educational Attainment in Italy.” Economic Letters 118: 229-136.
Department of Education South Africa. 2001. “Education in South Africa: Achievements Since 1994.” Department of Education, Government of South Africa. http://www.dhet.gov.za/Reports%20Doc%20Library/Education%20in%20South%20Africa%20Achievements%20since%201994.pdf.
Department of Education South Africa. 2009. Trends in Education Macro Indicators. Department of Education, Government of South Africa. http://www.education.gov.za/LinkClick.aspx?fileticket=kKd2AHtjxYo%3D&tabid=422&mid=1261.
Fedderke, J. W., R. Kadt, and J. M. Luiz. 2000. “Uneducating South Africa: The failure to Address the 1910-1993 Legacy.” International Review of Education 46: 257–281.
Girdwood, S., and M. Leibbrandt. 2009. “Intergenerational Mobility: Analysis of the NIDS Wave 1 Dataset.” Discussion Paper No. 15, National Income Dynamics Study. http://www.nids.uct.ac.za/documents/discussion-papers/106-nids-discussion-paper-no15/file.
Golley, J., and S. T. Kong. 2013. “Inequality in Intergenerational Mobility of Education in China.” China and World Economy 21(2): 15-37.
Haveman, R., and B. Wolfe. 1995. “The Determinants of Children's Attainments: A Review of

14
Methods and Findings.” Journal of Economic Literature 33(4): 1829-1878. Heineck, G., and R. T. Riphahn, 2007. “Intergenerational Transmission of Educational
Attainment in Germany: The Last Five Decades.” Discussion Paper Series, 2985. Bonn: The Institute for the Study of Labor (IZA). http://ftp.iza.org/dp2985.pdf.
Hertz, T., J. Tamara, P. Piraino, S. Selcuk, N. Smith, and A. Verashchagina. 2007. “The Inheritance of Educational Inequality: International Comparisons and Fifty-year Trends.” The B.E. Journal of Economic Analysis and Policy 7(2): 1-48.
Lam, D, 1999. “Generating Extreme Inequality: Schooling, Earnings and Intergenerational Transmission of Human Capital in South Africa and Brazil.” Ann Arbor, Michigan, Unites States of America: Population Studies Centre.
Louw, M., S.Van Der Berg and D. Yu. 2006. “Educational Attainment and Intergenerational Social Mobility in South Africa.” Working Paper No. 09/06. Stellenbosch. http://www.ekon.sun.ac.za/wpapers/2006/wp092006/wp-09-2006.pdf.
Moll, P, 2000. “Discrimination is Declining in South Africa but Inequality is Not.” Studies in Economics and Econometrics 24(3): 91-108.
Mwabu, G., and T. P. Schultz. 2000. “Wage Premiums for Education and Location of South African Workers, by Gender and Race.” Economic Development and Cultural Change 48(2), 307-34.
Mulligan, C. B. 1999. “Galton Versus the Human Capital Approach to Inheritance.” Journal of Political Economy 107(6): S184–S224.
Nimubona, A. and D. Vencatachellum. 2007. “Intergenerational Education Mobility of Black and White South Africans.” Journal of Population Studies 20: 149-182.
Nkabinde, Z. P. 1997. “An Analysis of Educational Challenges in the New South Africa.” University Press of America, Inc. Lanham, Maryland.
Pampallis, J, 1997. “Foundations of the New South Africa.” Zed Books, Cape Town. Pampallis, J. 2007. “The Establishment and Transformation of a Repressive system: A
Historical Perspective on Educational Change in South Africa.” In Education and Society: Explorations from South Africa and Sweden, edited by C. Odora Hoppers, B. Gustavsson, E. Motala and J. Pampallis, Democracy and Human Rights. Durban.
Samuel, J, 1996. “The State of Education in South Africa.” In Education: from poverty to liberty, edited by B. Nasson, and J. Samuel. David Philip Publishers, Cape Town.
Thomas, D. 1996. “Education Across Generations in South Africa.” American Economic Review 86 (2): 330-334.

15
APPENDIX
Table A.1: Years of education conversion Education category Years of education
No schooling
0 years Grades 1-12
1-12 years
Certificate < grade 12
10 years Diploma < grade 12
11 years
Certificate + grade 12
13 years Diploma + grade 12
14 years
National Technical Certificate (NTC) I
10 years National Technical Certificate (NTC) II
11 years
National Technical Certificate (NTC) III
12 years National Technical Certificate (NTC) IV
13 years
National Technical Certificate (NTC) V
14 years National Technical Certificate (NTC) VI
15 years
Bachelor’s degree
15 years Higher diploma
15 years
Bachelor’s degree and post-graduate diploma
16 years Honours degree
16 years
Higher degree 18 years
Table A.2: Standard deviation of children and parent’s years of education Cohort N childσ motherσ fatherσ motherchild σσ fatherchild σσ
1954 - 1958 3112 4.307 3.736 3.946 1.153 1.092 1959 - 1963 6536 4.317 3.866 4.124 1.116 1.047 1964 - 1968 11484 4.240 3.929 4.125 1.079 1.028 1969 - 1973 21110 3.911 4.088 4.148 0.957 0.943 1974 - 1978 35808 3.543 4.227 4.262 0.838 0.831 1979 - 1983 62711 3.147 4.454 4.430 0.706 0.710 1984 -1988 93916 2.903 4.511 4.519 0.644 0.642 1989 -1993 68429 2.906 4.394 4.419 0.661 0.658

16
Table A.3: Previous studies on intergenerational mobility in South Africa
Author Data and sample characteristics Child's outcome
Parent's education measure
Method Results
Thomas, (1996) 1991 South African census. Children’s age: 20- 70 years
Years of schooling
Years of schooling OLS Blacks and Asians: 0.3-0.4
Whites or Coloureds: 0.2
Lam, (1999) October Household Survey (OHS), 1995 Children’s age: 13-17 years
Grades completed per year
Years of schooling
OLS Mother's university degree: 0.22 Father's university degree: 0.25
Case and Deaton, (1999) South African Living Standard Survey, 1993 Children's age: 10-18 years
Grades completed per year
Highest level of education
OLS Whites: 0.061 Blacks: 0.076
Louw et.al, (2006) South African population census data 1970, 1985, 1991, 1996 and 2001 Children's age: 10-21 years
Grades completed per year
Years of schooling
Mobility indices Sch. mobility index: 0.1-0.19 for 1991 and 0.04-0.13 for 2001
Nimubona and Vencatachellum, (2007)
October Household Surveys (OHS), 1995-1999 Children's age: ≥ 15 years
Years of schooling
Years of schooling
OLS and pseudo panel estimates, ordered logit and
probit models.
Blacks: 0.228 - 0.25 Whites: 0.188
Girdwood, (2009) National Income Dynamics Study (NIDS), 2008 Children's age:???
Years of schooling
Years of schooling
Transition matrices Ordered Probit
African and White child had 32% and 17%, respectively, chance of having education
level similar to his/her father.
Burns and Keswell, (2012)
KwaZulu Income Dynamics Study (KIDS), 1993 and 1998 Children's age: ≥ 21 years
Years of schooling
Years of schooling
OLS father to child : 0.42 mother to child: 0.43
Paternal grandfather to father: 0.33 Paternal grandfather to mother: 0.38
Maternal grandmother to mother:0.37 Maternal grandmother to father: 0.3

17
Table A.4: Education attainment of children and their parents
Years of education
No schooling Primary Secondary College
Children 1954 - 1958 6.381 0.194 0.342 0.431 0.033 1959 - 1963 7.174 0.147 0.321 0.492 0.040
1964 - 1968 8.099 0.111 0.265 0.566 0.058 1969 - 1973 9.162 0.072 0.195 0.659 0.074 1974 - 1978 9.804 0.055 0.135 0.733 0.077 1979 - 1983 10.231 0.038 0.102 0.774 0.086 1984 - 1988 10.486 0.030 0.083 0.801 0.086 1989 - 1993 10.075 0.033 0.105 0.822 0.040
Mother 1954 - 1958 3.137 0.495 0.316 0.178 0.010 1959 - 1963 3.506 0.450 0.332 0.206 0.012
1964 - 1968 3.758 0.412 0.358 0.216 0.015 1969 - 1973 4.204 0.373 0.358 0.248 0.022 1974 - 1978 4.692 0.327 0.366 0.281 0.026 1979 - 1983 5.493 0.270 0.353 0.336 0.041 1984 - 1988 6.236 0.220 0.333 0.399 0.047 1989 - 1993 6.592 0.190 0.324 0.449 0.037
Father 1954 - 1958 3.254 0.473 0.327 0.180 0.020 1959 - 1963 3.433 0.474 0.307 0.196 0.023
1964 - 1968 3.881 0.412 0.335 0.237 0.016 1969 - 1973 4.265 0.365 0.347 0.269 0.019 1974 - 1978 4.652 0.329 0.356 0.291 0.024 1979 - 1983 5.413 0.270 0.353 0.343 0.034 1984 - 1988 6.072 0.225 0.341 0.389 0.044 1989 - 1993 6.283 0.202 0.343 0.420 0.035

18
Table A.5: Ordered probit marginal effect for Father’s education
Father: No sch. Father: Primary Father: College mfx std.err mfx std.err mfx std.err
Panel A: Child - No schooling 1954 - 1958 0.349 (0.047)
0.151 (0.052)
-0.125 (0.038)
1959 - 1963 0.196 (0.022)
0.092 (0.023)
-0.041 (0.030) 1964 - 1968 0.158 (0.013)
0.083 (0.011)
-0.063 (0.006)
1969 - 1973 0.108 (0.007)
0.041 (0.005)
-0.035 (0.004) 1974 - 1978 0.086 (0.005)
0.034 (0.003)
-0.035 (0.002)
1979 - 1983 0.068 (0.003)
0.023 (0.002)
-0.023 (0.001) 1984 - 1988 0.063 (0.002)
0.018 (0.001)
-0.018 (0.001)
1989 - 1993 0.067 (0.003)
0.019 (0.001)
-0.018 (0.001) Panel B: Child - Primary
1954 - 1958 0.172 (0.029)
0.074 (0.022)
-0.177 (0.101) 1959 - 1963 0.195 (0.020)
0.089 (0.018)
-0.061 (0.056)
1964 - 1968 0.199 (0.013)
0.114 (0.013)
-0.173 (0.014) 1969 - 1973 0.172 (0.009)
0.077 (0.008)
-0.101 (0.014)
1974 - 1978 0.132 (0.006)
0.061 (0.005)
-0.101 (0.004) 1979 - 1983 0.120 (0.004)
0.050 (0.003)
-0.077 (0.002)
1984 - 1988 0.113 (0.003)
0.041 (0.002)
-0.062 (0.001) 1989 - 1993 0.136 (0.004)
0.051 (0.003)
-0.071 (0.002)
Panel C: Child -Secondary 1954 - 1958 -0.489 (0.056)
-0.217 (0.068)
0.264 (0.097)
1959 - 1963 -0.313 (0.030)
-0.153 (0.035)
0.078 (0.059) 1964 - 1968 -0.264 (0.019)
-0.149 (0.019)
0.053 (0.029)
1969 - 1973 -0.186 (0.011)
-0.075 (0.009)
0.025 (0.011) 1974 - 1978 -0.127 (0.007)
-0.048 (0.005)
-0.120 (0.022)
1979 - 1983 -0.096 (0.005)
-0.023 (0.002)
-0.195 (0.015) 1984 - 1988 -0.092 (0.004)
-0.013 (0.001)
-0.196 (0.010)
1989 - 1993 -0.166 (0.006)
-0.048 (0.003)
-0.005 (0.006) Panel D: Child -College
1954 - 1958 -0.032 (0.012)
-0.008 (0.004)
0.039 (0.043) 1959 - 1963 -0.078 (0.011)
-0.028 (0.006)
0.025 (0.059)
1964 - 1968 -0.093 (0.008)
-0.047 (0.006)
0.183 (0.054) 1969 - 1973 -0.094 (0.005)
-0.043 (0.004)
0.111 (0.028)
1974 - 1978 -0.090 (0.003)
-0.047 (0.003)
0.255 (0.026) 1979 - 1983 -0.091 (0.002)
-0.050 (0.003)
0.295 (0.016)
1984 - 1988 -0.085 (0.002)
-0.046 (0.002)
0.276 (0.007) 1989 - 1993 -0.037 (0.001) -0.021 (0.001) 0.095 (0.008)
Controls: child's age, age-squared, female, province of birth, urban, dummy indicating if individual moved from province of birth, number of children of siblings.

19
Table A.6: Ordered probit marginal effect for Mother’s education
Mother: No sch. Mother: Primary Mother: College mfx std.err mfx std.err mfx std.err
Panel A: Child - No schooling 1954 - 1958 0.292 (0.016)
0.135 (0.018)
-0.122 (0.015)
1959 - 1963 0.223 (0.010)
0.100 (0.010)
-0.083 (0.011) 1964 - 1968 0.183 (0.007)
0.081 (0.006)
-0.073 (0.004)
1969 - 1973 0.114 (0.004)
0.043 (0.003)
-0.049 (0.002) 1974 - 1978 0.099 (0.003)
0.035 (0.002)
-0.038 (0.001)
1979 - 1983 0.081 (0.002)
0.027 (0.001)
-0.026 (0.001) 1984 - 1988 0.068 (0.002)
0.021 (0.001)
-0.019 (0.000)
1989 - 1993 0.079 (0.002)
0.023 (0.001)
-0.019 (0.001) Panel B: Child - Primary
1954 - 1958 0.171 (0.011)
0.069 (0.008)
-0.193 (0.046) 1959 - 1963 0.183 (0.008)
0.086 (0.007)
-0.149 (0.032)
1964 - 1968 0.197 (0.006)
0.100 (0.007)
-0.179 (0.006) 1969 - 1973 0.174 (0.005)
0.078 (0.005)
-0.154 (0.006)
1974 - 1978 0.150 (0.004)
0.065 (0.003)
-0.114 (0.002) 1979 - 1983 0.139 (0.003)
0.059 (0.002)
-0.087 (0.001)
1984 - 1988 0.125 (0.002)
0.051 (0.002)
-0.070 (0.001) 1989 - 1993 0.153 (0.003)
0.063 (0.002)
-0.076 (0.002)
Panel C: Child -Secondary 1954 - 1958 -0.399 (0.019)
-0.185 (0.023)
0.231 (0.027)
1959 - 1963 -0.346 (0.014)
-0.164 (0.015)
0.168 (0.021) 1964 - 1968 -0.299 (0.010)
-0.145 (0.010)
0.110 (0.008)
1969 - 1973 -0.203 (0.007)
-0.083 (0.006)
-0.007 (0.014) 1974 - 1978 -0.167 (0.005)
-0.060 (0.003)
-0.106 (0.013)
1979 - 1983 -0.135 (0.004)
-0.039 (0.002)
-0.171 (0.009) 1984 - 1988 -0.117 (0.003)
-0.027 (0.001)
-0.189 (0.007)
1989 - 1993 -0.199 (0.005)
-0.065 (0.003)
-0.006 (0.004) Panel D: Child -College
1954 - 1958 -0.063 (0.007)
-0.019 (0.003)
0.084 (0.034) 1959 - 1963 -0.060 (0.004)
-0.023 (0.002)
0.064 (0.021)
1964 - 1968 -0.081 (0.004)
-0.036 (0.002)
0.141 (0.025) 1969 - 1973 -0.085 (0.003)
-0.038 (0.002)
0.209 (0.020)
1974 - 1978 -0.082 (0.002)
-0.040 (0.002)
0.258 (0.015) 1979 - 1983 -0.084 (0.001)
-0.047 (0.001)
0.284 (0.010)
1984 - 1988 -0.076 (0.001)
-0.045 (0.001)
0.278 (0.005) 1989 - 1993 -0.034 (0.001) -0.022 (0.001) 0.101 (0.006)
Controls: child's age, age-squared, female, province of birth, urban, dummy indicating if individual moved from province of birth, number of children of siblings.