TRENDS IN SUPPLY OF DOCTORS AND NURSES IN EU AND OECD ... · TRENDS IN SUPPLY OF DOCTORS AND NURSES...
32
TRENDS IN SUPPLY OF DOCTORS AND NURSES IN EU AND OECD COUNTRIES Gaétan Lafortune and Liliane Moreira OECD Health Division 16 November 2015, DG Sante, Brussels Expert Group Meeting on European Health Workforce
Transcript of TRENDS IN SUPPLY OF DOCTORS AND NURSES IN EU AND OECD ... · TRENDS IN SUPPLY OF DOCTORS AND NURSES...

TRENDS IN SUPPLY OF
DOCTORS AND NURSES IN EU
AND OECD COUNTRIES
Gaétan Lafortune and Liliane Moreira
OECD Health Division 16 November 2015, DG Sante, Brussels
Expert Group Meeting on European Health Workforce

Analytical framework (Stock/Flow model)
Source: OECD

OECD/EUROSTAT/WHO-EUROPE JOINT QUESTIONNAIRE
(NON-MONETARY HEALTH CARE STATISTICS)

4
Background on OECD/Eurostat/WHO-Europe
Joint Questionnaire
Started in 2010 with data collection on health human resources and physical
resources:
Extended in 2013 (health care activities)
Extended in 2015 (health workforce migration)
Aim is to collect internationally comparable data to monitor key aspects and
trends in health workforce development (and other resources and activities of
health systems)
Aim of joint data collection is to:
Reduce data collection burden on national authorities
Improve consistency of data in international databases
5
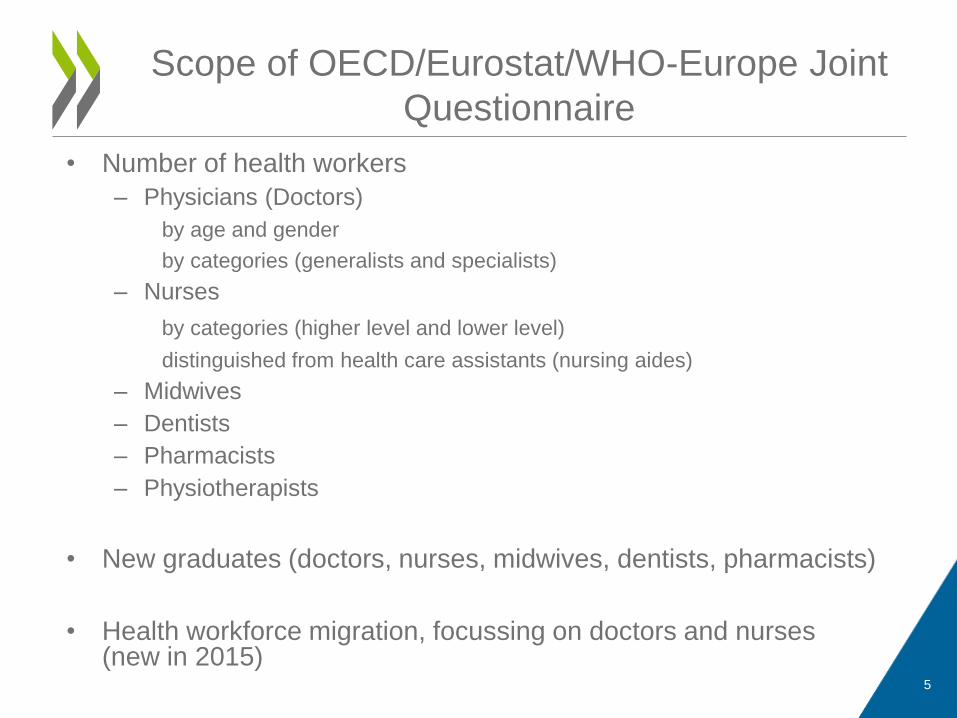
• Number of health workers
– Physicians (Doctors)
by age and gender
by categories (generalists and specialists)
– Nurses
by categories (higher level and lower level)
distinguished from health care assistants (nursing aides)
– Midwives
– Dentists
– Pharmacists
– Physiotherapists
• New graduates (doctors, nurses, midwives, dentists, pharmacists)
• Health workforce migration, focussing on doctors and nurses (new in 2015)
Scope of OECD/Eurostat/WHO-Europe Joint
Questionnaire
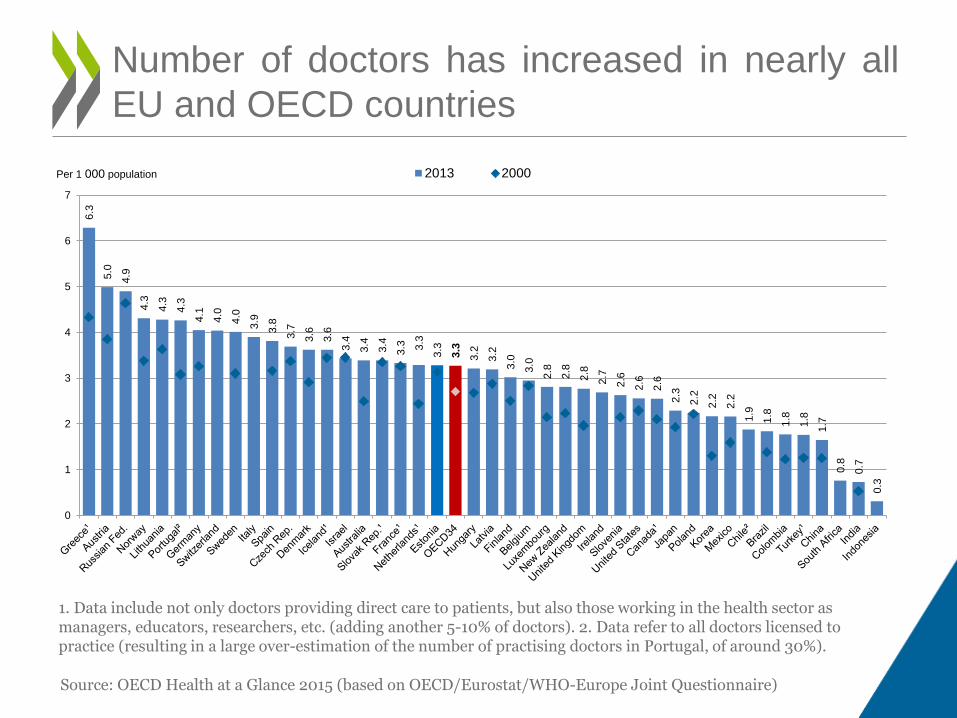
Number of doctors has increased in nearly all
EU and OECD countries
Source: OECD Health at a Glance 2015 (based on OECD/Eurostat/WHO-Europe Joint Questionnaire)
6.3
5.0
4.9
4.3
4.3
4.3
4.1
4.0
4.0
3.9
3.8
3.7
3.6
3.6
3.4
3.4
3.4
3.3
3.3
3.3
3.3
3.2
3.2
3.0
3.0
2.8
2.8
2.8
2.7
2.6
2.6
2.6
2.3
2.2
2.2
2.2
1.9
1.8
1.8
1.8
1.7
0.8
0.7
0.3
0
1
2
3
4
5
6
7
2013 2000Per 1 000 population
1. Data include not only doctors providing direct care to patients, but also those working in the health sector as managers, educators, researchers, etc. (adding another 5-10% of doctors). 2. Data refer to all doctors licensed to practice (resulting in a large over-estimation of the number of practising doctors in Portugal, of around 30%).

And in some countries, the number of doctors
has increased strongly
Evolution in the number of doctors, selected OECD countries, 2000 – 2013 (or nearest year)
100
110
120
130
140
150
160
170
2000 2003 2006 2009 2012
Australia Canada
Japan United States
Index (2000=100)
100
110
120
130
140
150
160
170
2000 2003 2006 2009 2012
France Germany
Spain United Kingdom
Index (2000=100)
Source: OECD Health Statistics 2015

8
Driven by inflows of new medical graduates
and foreign-trained doctors
0
2 000
4 000
6 000
8 000
10 000
12 000
14 000
16 000
Domestic graduates Foreign-trained
Annual inflows of foreign-trained doctors and domestic medical graduates, UK, 2000 – 2014
Source: OECD Health Statistics 2015 (based on OECD/Eurostat/WHO-Europe Joint Questionnaire)
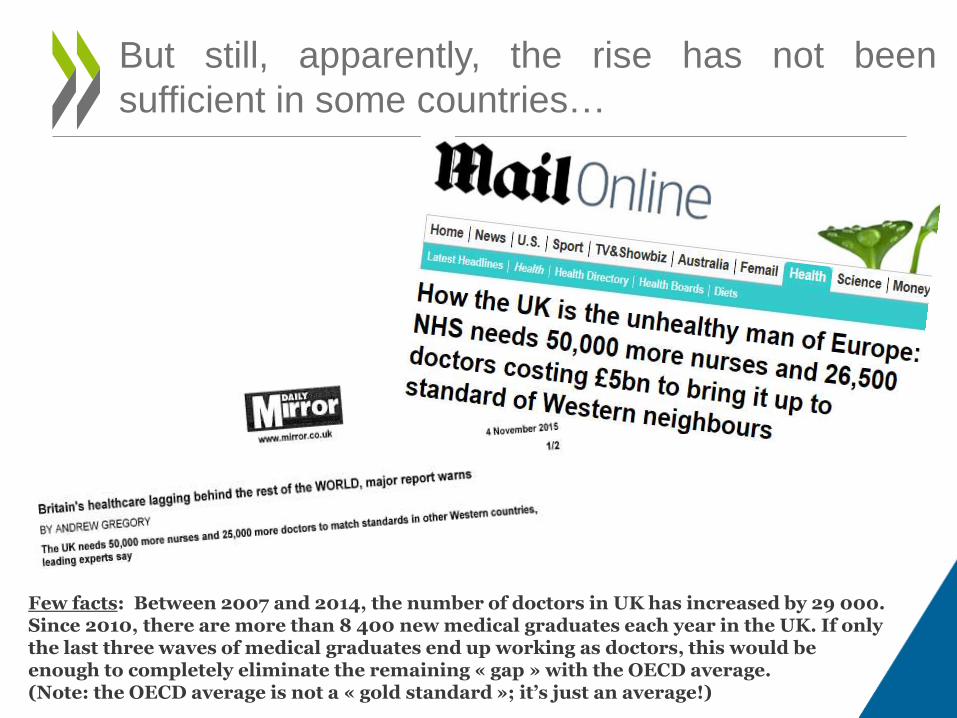
But still, apparently, the rise has not been
sufficient in some countries…
Few facts: Between 2007 and 2014, the number of doctors in UK has increased by 29 000. Since 2010, there are more than 8 400 new medical graduates each year in the UK. If only the last three waves of medical graduates end up working as doctors, this would be enough to completely eliminate the remaining « gap » with the OECD average. (Note: the OECD average is not a « gold standard »; it’s just an average!)
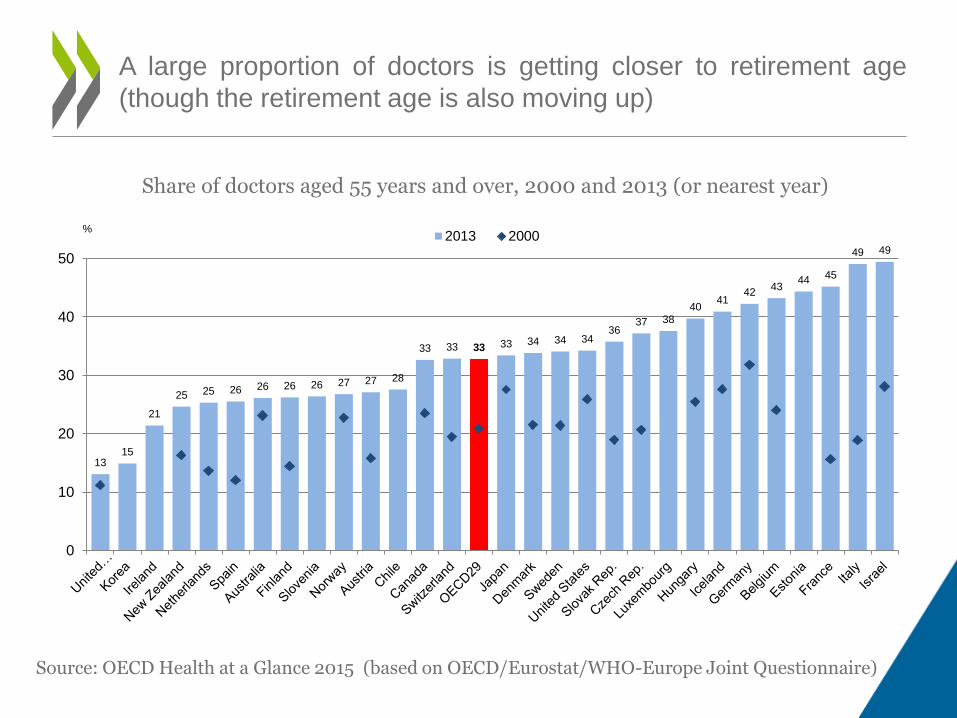
A large proportion of doctors is getting closer to retirement age
(though the retirement age is also moving up)
13 15
21
25 25 26 26 26 26 27 27 28
33 33 33 33 34 34 34 36
37 38 40
41 42
43 44 45
49 49
0
10
20
30
40
50
2013 2000%
Share of doctors aged 55 years and over, 2000 and 2013 (or nearest year)
Source: OECD Health at a Glance 2015 (based on OECD/Eurostat/WHO-Europe Joint Questionnaire)
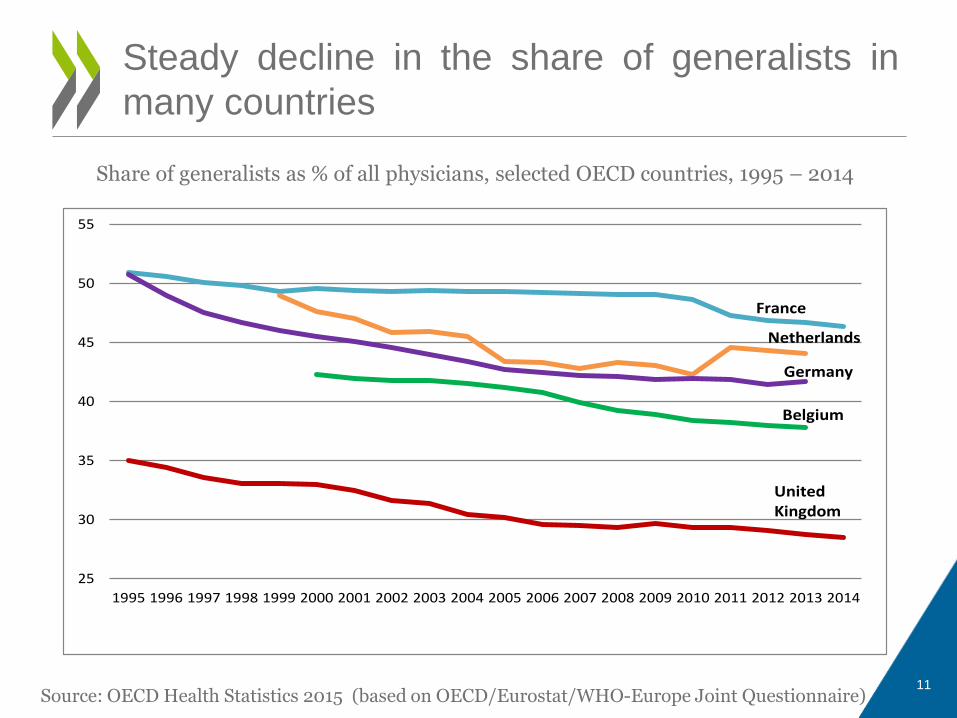
Steady decline in the share of generalists in
many countries
11 Source: OECD Health Statistics 2015 (based on OECD/Eurostat/WHO-Europe Joint Questionnaire)
25
30
35
40
45
50
55
1995 1996 1997 1998 1999 2000 2001 2002 2003 2004 2005 2006 2007 2008 2009 2010 2011 2012 2013 2014
France
Netherlands
Germany
Belgium
United Kingdom
Share of generalists as % of all physicians, selected OECD countries, 1995 – 2014
12
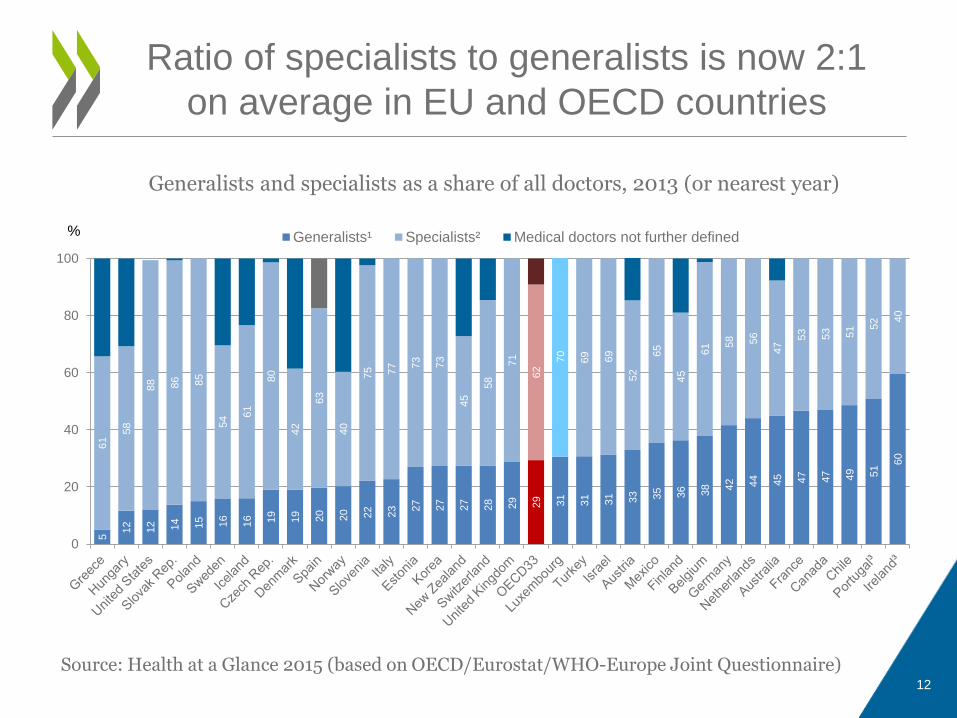
Ratio of specialists to generalists is now 2:1
on average in EU and OECD countries 5 1
2
12
14
15
16
16
19
19
20
20
22
23
27
27
27
28
29
29
31
31
31
33
35
36
38
42
44
45
47
47
49
51 6
0 6
1 5
8
88
86
85
54 61
80
42
63
40
75
77
73
73
45
58
71
62 7
0
69
69
52
65
45
61 58
56
47 5
3
53
51 52 40
0
20
40
60
80
100
Generalists¹ Specialists² Medical doctors not further defined%
Source: Health at a Glance 2015 (based on OECD/Eurostat/WHO-Europe Joint Questionnaire)
Generalists and specialists as a share of all doctors, 2013 (or nearest year)

The number of nurses has also increased in
nearly all EU and OECD countries
Source: OECD Health at a Glance 2015 (based on OECD/Eurostat/WHO-Europe Joint Questionnaire)
Practising nurses per 1 000 population, 2000 and 2013 (or nearest year)
17.4
16.7
16.3
15.5
14.1
13.0
12.4
12.1
11.9
11.5
11.2
11.1
10.5
10.0
9.5
9.5
9.4
9.1
8.3
8.2
8.0
7.9
6.4
6.2
6.1
6.1
5.8
5.6
5.3
5.2
5.1
4.9
3.6
2.6
1.8
0
2
4
6
8
10
12
14
16
18
20
2013 2000Per 1 000 population
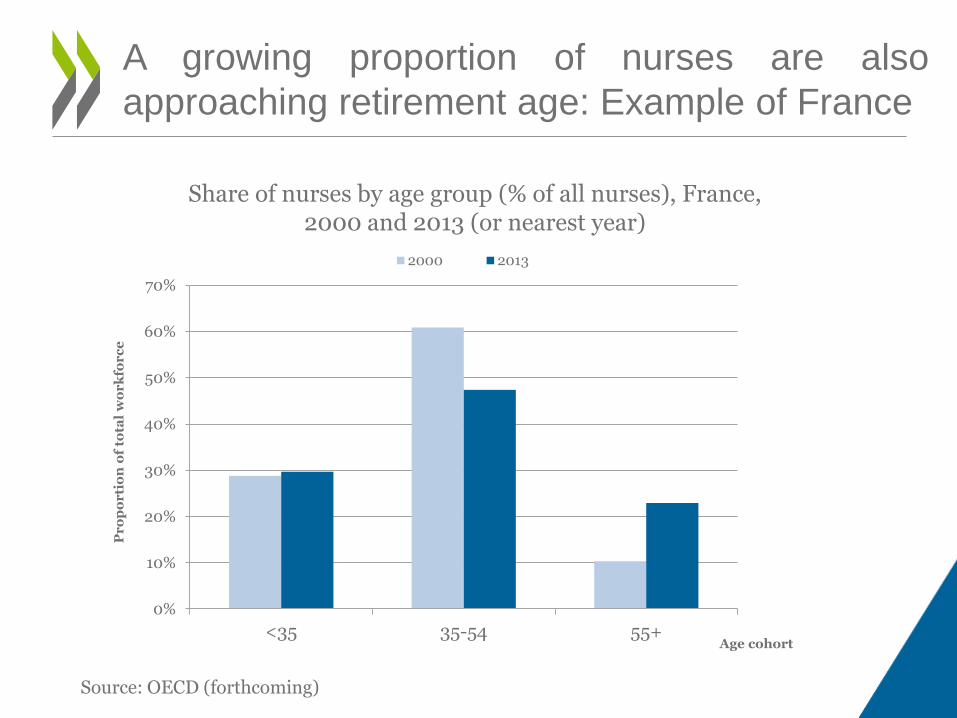
A growing proportion of nurses are also
approaching retirement age: Example of France
Source: OECD (forthcoming)
0%
10%
20%
30%
40%
50%
60%
70%
<35 35-54 55+
Pr
op
or
tio
n o
f to
tal
wo
rk
for
ce
Age cohort
2000 2013
Share of nurses by age group (% of all nurses), France, 2000 and 2013 (or nearest year)
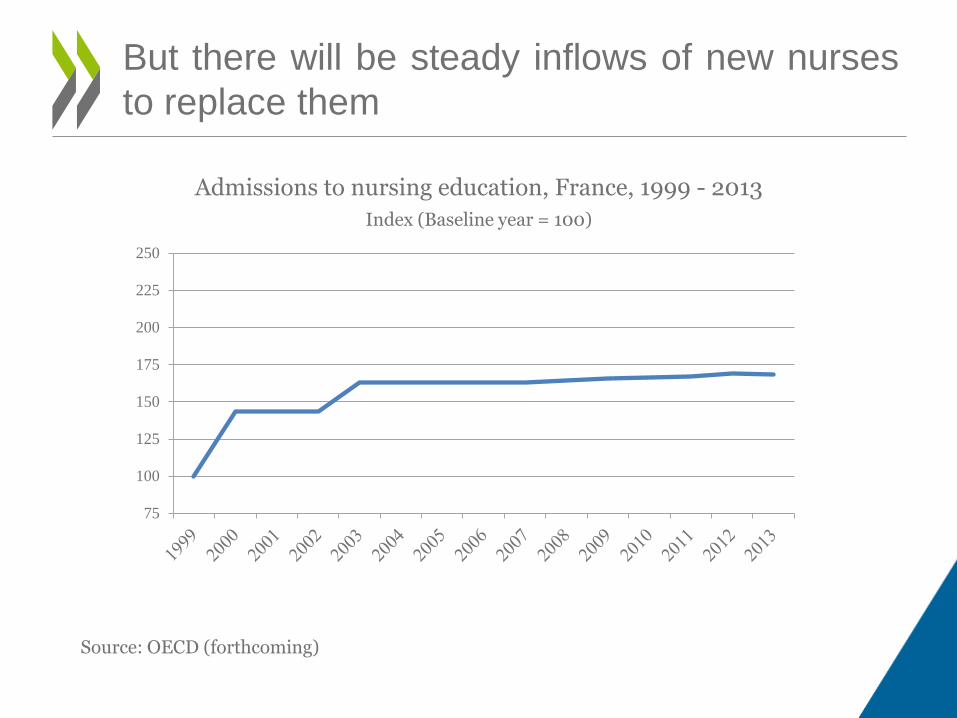
But there will be steady inflows of new nurses
to replace them
75
100
125
150
175
200
225
250
Source: OECD (forthcoming)
Admissions to nursing education, France, 1999 - 2013
Index (Baseline year = 100)

OECD PROJECT ON CHANGES IN EDUCATION AND TRAINING CAPACITY (TRENDS AND POLICIES)
16

Education policy is the most important policy
lever
Source: OECD

• Review recent changes in numerus clausus policies for admissions in medical and nursing education programmes in EU and OECD countries
• Recent changes also in composition of post-graduate training places in medicine (general medicine versus specialisation) and introduction/expansion of advanced training programmes for advanced nursing roles (e.g., nurse practitioners)
Objectives of the study

0
1000
2000
3000
4000
5000
6000
7000
8000
9000
10000
Numerus clausus policies in the past have
tended to go through cycles (ups and downs)
Evolution of the numerus clausus for medical education, France, 1971-2013
Source: ONDPS 2015

Number of OECD countries for which
admissions to medical education
….
Increased Remained Constant Decreased
21 10 0
Note: Refers to the period 2007 to 2012. Covers OECD countries in Europe and outside Europe.
Trends in admissions to medical education
Source: 2012 OECD Health Characteristics Survey

In some countries, admissions to medical education have
grown rapidly; in others, the growth has been more modest
Index (Baseline year = 100)
75
100
125
150
175
200
225
250
Canada, 2000 - 2012
75
100
125
150
175
200
225
250
Germany, 2000 - 2012
75
100
125
150
175
200
225
250
Sweden, 2000 - 2013
75
100
125
150
175
200
225
250
Poland, 2002 - 2013
Source: OECD (forthcoming)
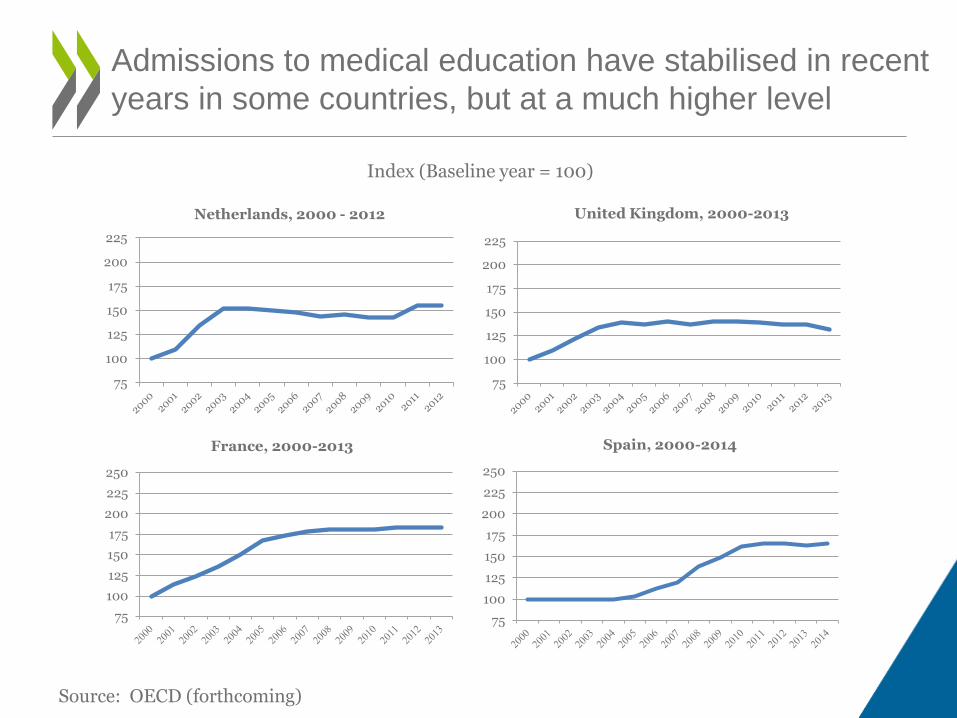
Admissions to medical education have stabilised in recent
years in some countries, but at a much higher level
75
100
125
150
175
200
225
Netherlands, 2000 - 2012
75
100
125
150
175
200
225
United Kingdom, 2000-2013
75
100
125
150
175
200
225
250
France, 2000-2013
75
100
125
150
175
200
225
250
Spain, 2000-2014
Index (Baseline year = 100)
Source: OECD (forthcoming)

0
500
1,000
1,500
2,000
2,500
3,000
3,500
4,000
4,500
Post-graduate trainee places, France, 2004-2013
General Medicine (available) Specialisations (available)
General Medicine (filled) Specialisations (filled)
Post-graduate training: Some countries making deliberate
efforts to increase training places in general medicine
Source: OECD (forthcoming)
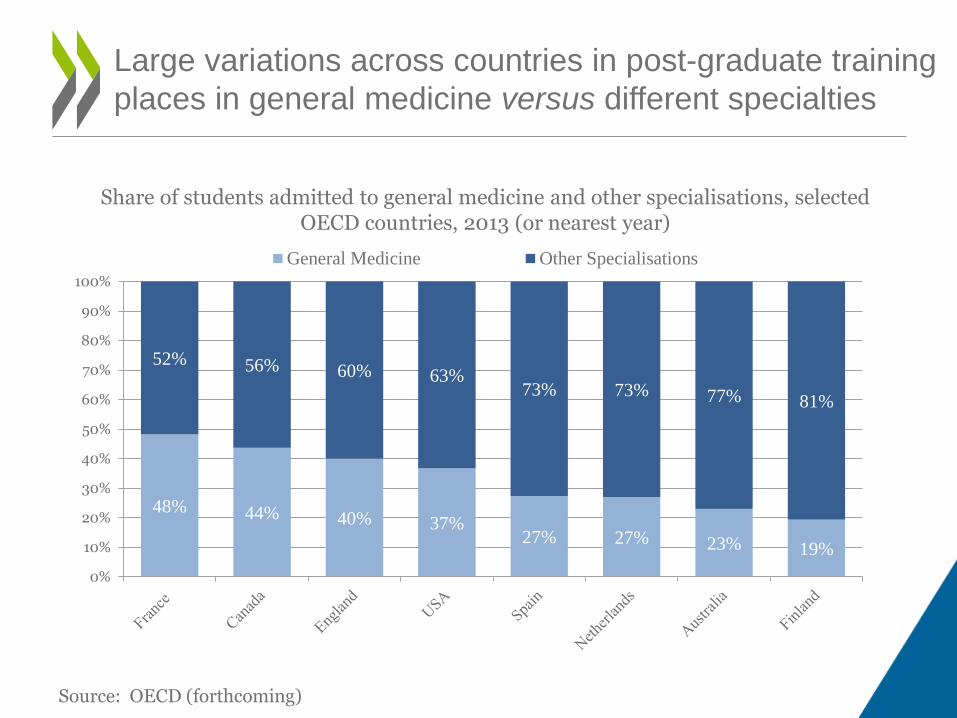
Large variations across countries in post-graduate training
places in general medicine versus different specialties
48% 44% 40% 37% 27% 27% 23% 19%
52% 56% 60% 63% 73% 73% 77% 81%
0%
10%
20%
30%
40%
50%
60%
70%
80%
90%
100%
General Medicine Other Specialisations
Source: OECD (forthcoming)
Share of students admitted to general medicine and other specialisations, selected OECD countries, 2013 (or nearest year)

Trends in admissions to nursing education
• Results from 2012 OECD Health Characteristics Survey.
Number of OECD countries for
which admissions to nursing
education ….
Increased Remained Constant
Decreased
20 9 2
Note: Refers to the period 2007 to 2012. Covers OECD countries in Europe and outside Europe.

In some countries, admissions to nursing
education have expanded greatly since 2000
Index (Baseline year = 100)
75
100
125
150
175
200
225
250
Australia, 2001-2013
75
100
125
150
175
200
225
250
Belgium, 2002-2012
75
100
125
150
175
200
225
250
Finland, 2000-2013
75
100
125
150
175
200
225
United States, 2001-2013
Source: OECD (forthcoming)
United States: From projected shortages of
nurses to projected surpluses
In 2004: US Department of Health and Human Services projected a shortage of almost one million registered nurses by 2020.
In 2014: US Department of Health and Human Services projected a surplus of 340 000 registered nurses by 2025 (mainly because annual training rates have doubled and retention rates have also increased).
[Note: 100 000 more nurse graduates per year x 10 years = 1 000 000 nurses]
Source: US Department of Health and Human Services (2014), The Future of the Nursing Workforce, National and State Level Projections 2012 -2025
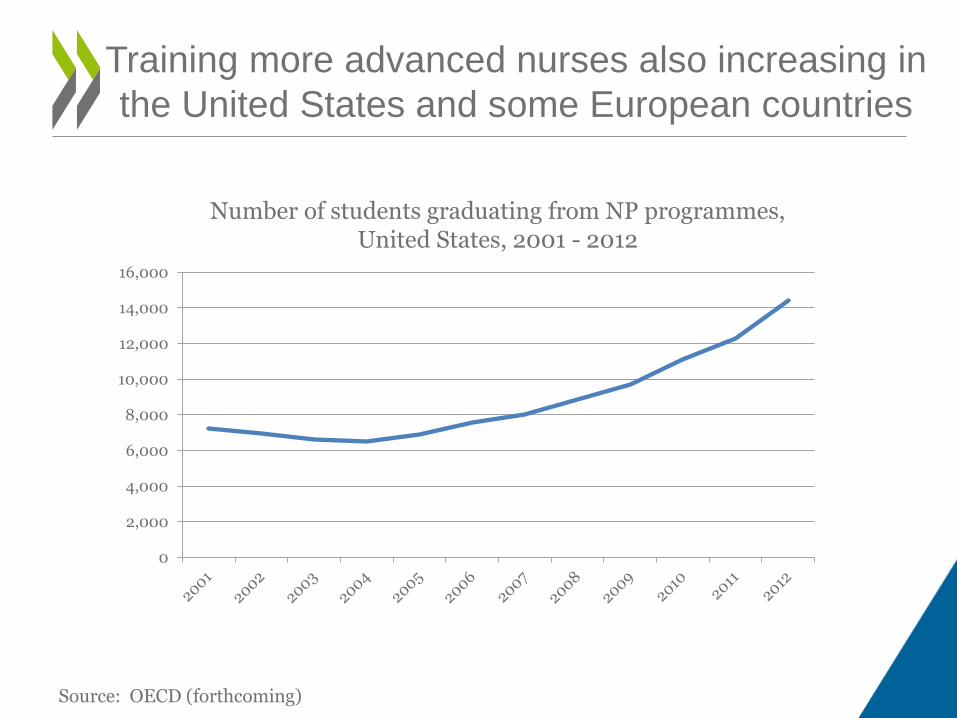
Training more advanced nurses also increasing in
the United States and some European countries
0
2,000
4,000
6,000
8,000
10,000
12,000
14,000
16,000
Source: OECD (forthcoming)
Number of students graduating from NP programmes, United States, 2001 - 2012

150
200
250
300
350
400
Number of students admitted to NP programmes,
Netherlands, 2005-2012
0
250
500
750
1,000
1,250
1,500
1,750
2,000
General Medicine (realization)
Other Specialisations (realization)
Places filled in medical post-graduate training, Netherlands,
2002-2012
Training more Nurse Practitioners to play a
bigger role in primary care: The Netherlands
Source: OECD (forthcoming)
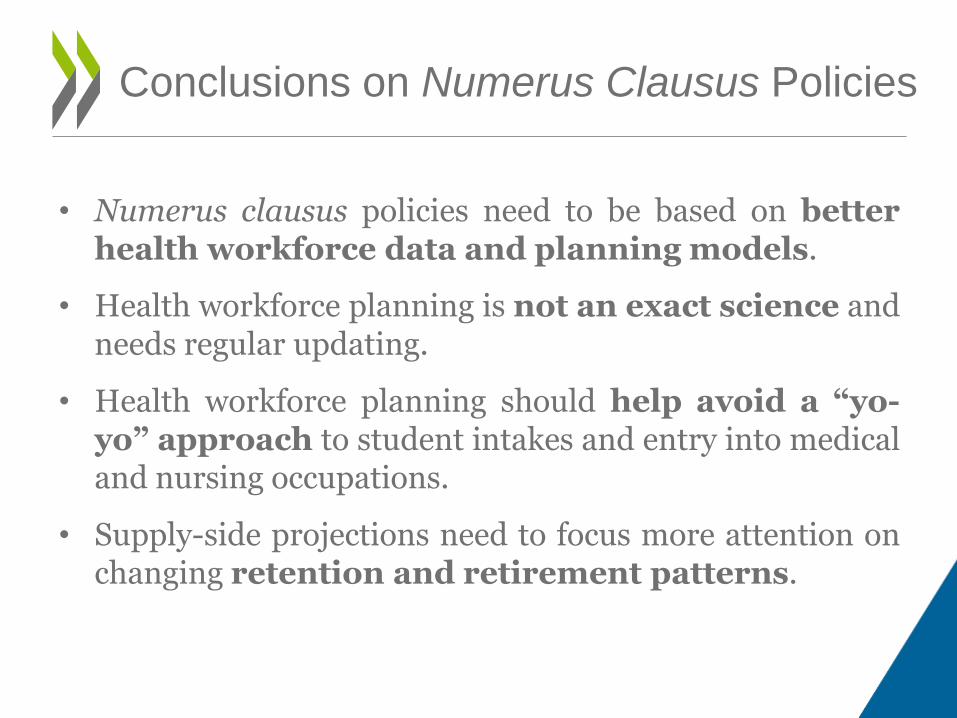
• Numerus clausus policies need to be based on better health workforce data and planning models.
• Health workforce planning is not an exact science and needs regular updating.
• Health workforce planning should help avoid a “yo-yo” approach to student intakes and entry into medical and nursing occupations.
• Supply-side projections need to focus more attention on changing retention and retirement patterns.
Conclusions on Numerus Clausus Policies

Synthesis report on changes in Numerus Clausus Policies:
• As part of broader publication on health workforce.
Country notes
• 3-5 page individual country notes describing in more detail changes in medical and nursing education and post-graduate training programmes (for all countries with sufficient information).
Coming out soon
Contacts [email protected]
Website www.oecd.org/health
Twitter @OECD_Social
Newsletter http://www.oecd.org/els/health-systems/oecd-health-update.htm
Thank you