Trends in Subjective Income Poverty Rates in the European ...
24
Vol.:(0123456789) The European Journal of Development Research https://doi.org/10.1057/s41287-021-00457-2 ORIGINAL ARTICLE Trends in Subjective Income Poverty Rates in the European Union Tomáš Želinský 1,2,3 · Martina Mysíková 1 · Thesia I. Garner 4 Accepted: 5 August 2021 © The Author(s) 2021 Abstract When developing anti-poverty policies, policymakers need accurate data on the prevalence of poverty. In this paper, we focus on subjective poverty, a concept which has been largely neglected in the literature, though it remains a conceptually appeal- ing way to define poverty. The primary goal of this study is to re-examine the con- cept of subjective poverty measurement and to estimate trends in subjective income poverty rates in the European Union. Our estimations are based on a Minimum Income Question using data from a representative survey, EU-SILC. We find robust empirical evidence of decreasing trends in subjective poverty in 16 of 28 EU coun- tries. We conjecture that trends in subjective poverty may reflect changes in societies which are not captured by official poverty indicators, and our results thus enrich the existing data on general poverty trends in the EU. Keywords Subjective poverty · Minimum income question · Intersection approach · EU-SILC · European Union Résumé Lors de l’élaboration des politiques de lutte contre la pauvreté, les décideurs ont besoin de données précises sur la prévalence de la pauvreté. Dans cet article, nous nous concentrons sur la pauvreté subjective, un concept qui a été largement négligé * Tomáš Želinský [email protected] Martina Mysíková [email protected] Thesia I. Garner [email protected] 1 Institute of Sociology, Czech Academy of Sciences, Jilská 1, 110 00 Prague, Czech Republic 2 Faculty of Economics, Technical University of Košice, Němcovej 32, Kosice, Slovakia 3 School of Education, Durham University, Leazes Road, Durham DH1 1TA, UK 4 U. S. Bureau of Labor Statistics, 2 Massachusetts Avenue NE, Washington, DC 20212-0001, USA
Transcript of Trends in Subjective Income Poverty Rates in the European ...
Vol.:(0123456789)
The European Journal of Development Researchhttps://doi.org/10.1057/s41287-021-00457-2
ORIGINAL ARTICLE
Trends in Subjective Income Poverty Rates in the European Union
Tomáš Želinský1,2,3 · Martina Mysíková1 · Thesia I. Garner4
Accepted: 5 August 2021 © The Author(s) 2021
AbstractWhen developing anti-poverty policies, policymakers need accurate data on the prevalence of poverty. In this paper, we focus on subjective poverty, a concept which has been largely neglected in the literature, though it remains a conceptually appeal-ing way to define poverty. The primary goal of this study is to re-examine the con-cept of subjective poverty measurement and to estimate trends in subjective income poverty rates in the European Union. Our estimations are based on a Minimum Income Question using data from a representative survey, EU-SILC. We find robust empirical evidence of decreasing trends in subjective poverty in 16 of 28 EU coun-tries. We conjecture that trends in subjective poverty may reflect changes in societies which are not captured by official poverty indicators, and our results thus enrich the existing data on general poverty trends in the EU.
Keywords Subjective poverty · Minimum income question · Intersection approach · EU-SILC · European Union
RésuméLors de l’élaboration des politiques de lutte contre la pauvreté, les décideurs ont besoin de données précises sur la prévalence de la pauvreté. Dans cet article, nous nous concentrons sur la pauvreté subjective, un concept qui a été largement négligé
* Tomáš Želinský [email protected]
Martina Mysíková [email protected]
Thesia I. Garner [email protected]
1 Institute of Sociology, Czech Academy of Sciences, Jilská 1, 110 00 Prague, Czech Republic2 Faculty of Economics, Technical University of Košice, Němcovej 32, Kosice, Slovakia3 School of Education, Durham University, Leazes Road, Durham DH1 1TA, UK4 U. S. Bureau of Labor Statistics, 2 Massachusetts Avenue NE, Washington, DC 20212-0001,
USA
T. Želinský et al.
dans la littérature, bien qu’intéressant pour définir la pauvreté. L’objectif principal de cette étude est de réexaminer le concept de mesure subjective de la pauvreté et d’estimer les tendances des taux de pauvreté monétaire subjective dans l’Union eu-ropéenne. Nos estimations sont basées sur une question relative au revenu minimum en utilisant les données d’une enquête représentative, EU-SILC. Nous trouvons des preuves empiriques solides que la pauvreté subjective a tendance à baisser dans 16 des 28 pays de l’UE. Nous supposons que les tendances de la pauvreté subjective peuvent refléter des changements sociétaux qui ne sont pas pris en compte par les indicateurs officiels sur la pauvreté. Ainsi, nos résultats viennent enrichir les données existantes sur les tendances générales de la pauvreté dans l’UE.
Introduction
Identifying patterns in the development of crucial socio-economic indicators is a challenging task, and the ways such developments are presented can influence poli-cies and public opinion. There have long been discussions among researchers and practitioners on different dimensions of the quality of life. As noted by Stiglitz et al. (2009, p. 15), “objective and subjective dimensions of well-being are both impor-tant”. Most empirical studies operationalise well-being using indicators of happi-ness or life satisfaction (see, e.g. Diener et al. 1999). The broad nature of overall life satisfaction/happiness reflects “people’s self-evaluation of their lives or feelings pertaining to their emotional state” (Wong et al. 2006, p. 409), while individual sat-isfaction domains relate to perceived satisfaction with different life aspects including health, financial situation, and jobs (van Praag et al. 2003, p. 30). In this work, we narrow the perspective to an economic dimension of subjective well-being—sub-jective perceptions of poverty—which is often neglected when social policies are developed.
Clearly, tracking the socio-economic progress of a society requires tracking developments in poverty levels. Different poverty indicators (see an excellent review by Ravallion 2016) have been utilised and communicated, though a few specific poverty indices are most frequently chosen. Different conceptualisations of poverty measurements can lead to different conclusions, which are sometimes contradictory. Numerous alternative poverty measures have been developed, some of which feature useful properties (see, e.g. Foster et al. 2010; Chakravarty and Silber 2008). Never-theless, the income poverty headcount ratio remains the most frequently communi-cated, primarily due to its simplicity and straightforwardness.
The Europe 2020 headline indicators, which aim to track trends in poverty and social exclusion in the European Union, include three indicators: at risk of pov-erty, severe material deprivation, and very low work intensity (and their aggregated version, which is the indicator at risk of poverty or social exclusion). A key target related to the “Inclusive growth” priority, as defined by the strategy: “[t]he num-ber of Europeans living below the national poverty lines should be reduced by 25%, lifting over 20 million people out of poverty” (European Commission 2010, p. 11), is based on a relative income poverty measure. However, the alternative specifica-tion of the target, framed as “promoting social inclusion, in particular through the

Trends in Subjective Income Poverty Rates in the European Union
reduction of poverty, by aiming to lift at least 20 million people out of the risk of poverty and exclusion” (European Council 2010, p. 12), is based on a multidimen-sional indicator of poverty. Eurostat has recently introduced “experimental” sta-tistics demonstrating links between household income, consumption, and wealth. However, even this new measure ignores the subjective dimensions of well-being.
One of the main concerns related to the subjective approach is its inherent “sub-jectivity”—the trustworthiness of respondents’ responses. This has also led to economists’ scepticism of subjective variables (Bertrand and Mullainathan 2001), which are sometimes considered unreliable or unrealistic (Lane 1991; Vogel 2002). Nevertheless, scepticism towards subjective data seems to be lessening (Deaton and Stone 2013). Overall, subjective approaches remain relatively uncommon within the concepts of welfare measurement, though they remain a conceptually appealing way to define poverty (Ravallion 2014). In line with recommendations by Stiglitz et al. (2009), we posit that examining trends in subjective income poverty provides a use-ful perspective in addition to measurements of trends in official poverty statistics. Combining objective and subjective dimensions can offer better overall insights into the well-being of citizens.
Although subjective measures of poverty gained some attention in the 1980s and 1990s (van Praag et al. 1982; Danziger et al. 1984; Colosanto et al. 1984; Hagenaars and de Vos 1988; Deleeck and van den Bosch 1992; Muffels et al. 1992), they have taken a backseat in more recent years. Today, subjective measures have again begun to attract the attention of international researchers (Bishop et al. 2014; Mysíková et al. 2019, 2021; Chan and Wong 2020; Wang et al. 2020). Nevertheless, compared to objective measures of poverty, subjective poverty is understudied in the European Union in official statistics and in academic research. This suggests that people’s per-ceptions of their economic well-being are relatively unconsidered in policy develop-ment. However, we argue that the perceptions of the poor are an essential compo-nent of the complex perspective of a country’s poverty profile, and ultimately are an essential element in the formation of social policies (Veenhoven 2002). We believe that subjective concepts are an important complement to the relative income poverty and material deprivation indicators currently used in the EU. This study contributes to the empirical literature on poverty trends in the EU by presenting recent findings on trends in subjective income poverty.
The EU is one of the most highly developed regions in the world, with an econ-omy accounting for approximately 17.8% of global GDP, according to 2019 World Bank data.1 Yet the EU is a union of heterogeneous countries with annual GDP per capita (PPP, current international dollars, 2019) ranging widely between 24,561 (Bulgaria) to 121,293 (Luxembourg). According to official 2019 statistics, the income poverty rate ranges between 10.1% (Czechia) and 24.5% (Romania); severe material deprivation rates between 1.3% (Luxembourg) and 20.9% (Bulgaria); and the aggregate indicator of at risk of poverty or social exclusion rate varies between 12.5% (Czechia) and 32.8% (Bulgaria).2
1 World Development Indicators databank.2 Eurostat database data.

T. Želinský et al.
The estimations performed in this study are based on an official micro-dataset of EU-SILC survey responses (European Union Statistics on Income and Living Con-ditions) provided for research purposes by Eurostat. The dataset contains a Mini-mum Income Question (MIQ), which is a typical way to operationalise “inherently subjective judgments people make about what constitutes a socially acceptable minimum standard of living in a particular society” (Ravallion 1992, p. 33). In the EU-SILC survey, the MIQ is framed as follows: “In your opinion, what is the very lowest net monthly income that your household would have to have in order to make ends meet, that is to pay its usual necessary expenses? Please answer in relation to the present circumstances of your household, and what you consider to be usual necessary expenses (to make ends meet)”.
To identify subjectively poor households, we utilise a traditional intersection approach (Goedhart et al. 1977) employing control variables (for example, see de Vos and Garner 1991; Garner and Short 2004). In addition to this approach based on estimating subjective poverty thresholds for different subpopulations, we use pre-dicted minimum incomes to calculate subjective poverty rates for the whole popula-tion. Comparing households’ predicted incomes to their actual incomes allows us to directly identify each household as either subjectively poor or non-poor. This ‘short-cut’ is particularly useful in empirical estimations that do not require explicit values of poverty lines for different subpopulations, yet include all control variables in the estimation.
The primary goal of this study is to re-examine the concept of subjective income poverty measurement and to estimate trends in subjective income poverty rates in the EU. We find that the lowest levels of subjective income poverty are reported in Northern Europe, while the highest occur in the East and South. We further identify decreasing trends in subjective poverty (from the perspective of the main three Fos-ter–Greer–Thorbecke (FGT) family of poverty metrics) levels in 16 out of 28 coun-tries, and find an increasing trend only in Luxembourg.
Estimating Subjective Income Poverty
Measurements of subjective poverty are based on an assumption that “individuals them-selves are the best judges of their own situation” (Flik and van Praag 1991, p. 313). The concept of estimating subjective income poverty lines was introduced to economics lit-erature in a seminal study by Goedhart et al. (1977). The original idea was based on the Income Evaluation Question (IEQ), which asks respondents to report what they con-sider to be bad/sufficient/good income, in their circumstances. These data were used to estimate the so-called individual welfare function of income (van Praag 1968). The Minimum Income Question, in which respondents report the amount of income they consider minimal, is a special case of the IEQ. The IEQ and MIQ have been adopted to estimate the Leyden poverty line and the subjective poverty line (Kapteyn et al. 1988), respectively; these are both money-metrics of subjective welfare. MIQ has also been used for non-model-based evaluations of subjective income poverty, where the “indi-vidual method” (Vrooman 2009) simply relates households’ actual income to the mini-mum income. Designating households with actual income lower than a certain multiple

Trends in Subjective Income Poverty Rates in the European Union
of the minimum income to be “poor” is rather arbitrary, and together with the relatively high variance of minimum income responses makes non-model-based measures less reliable.
Another approach to analyses of subjective income poverty is based on qualitative categories, including questions such as the economic ladder question (e.g.: “On which step—poorest people on the first step, rich people on the last—are you today?”), or the “Deleeck” attitude question (e.g.: “Can you make ends meet with the actual income of your household with great difficulty/some difficulty/difficulty/fairly easily/easily/very easily?”) (Ravallion 2014; Pradhan and Ravallion 2000; Flik and van Praag 1991).
An important limitation of the adoption of any particular subjective poverty anal-ysis is the availability of data. Since our aim is to estimate trends in subjective pov-erty in the European Union, we rely on available and comparable datasets, primarily the EU-SILC survey. This dataset contains the Minimum Income Question and the multi-level attitude “Deleeck” attitude question.
The Deleeck question was introduced by Professor Deleeck, who led research by the Centre for Social Policy (CSP) into poverty measures. The “CSP measure” is based on the subjective poverty line (SPL) approach and uses the MIQ, with the dif-ference that only a subsample of respondents who claimed “some difficulty” to make ends meet is applied to derive the SPL. Flik and van Praag (1991) criticise the CSP measure for its strong assumption that “the level of the poverty line must be fixed by people who are on the margin of poverty and consequently have first-hand knowl-edge of the situation” (p. 322), in line with the original Goedhart et al. (1977) claim that “we need all observations in order to find out which people’s opinion on mini-mum income we should honor” (p. 514). Some studies (e.g. Saunders et al. 1994) use the CSP sample-limited approach as a robustness check for SPL estimations.
Another way to utilise the Deleeck question is to simply and directly utilise the self-reported categories of difficulties of making ends meet. Deciding which catego-ries are assumed to be “poor” becomes a relatively arbitrary choice by a researcher. For instance, Mysíková et al. (2019) consider households reporting that they are in the worst category (great difficulty to make ends meet) as subjectively poor house-holds, in a study tracking changes in subjective perceptions of poverty in Czechia and Slovakia. This work also devotes a discussion to differences and overlaps with the responses to the MIQ. Želinský et al. (2020) further utilise the Deeleck ques-tion and the Youden index to estimate income subjective poverty lines in the EU. Responses to the question also often serve as a dependent variable in studies search-ing for determinants of difficulties to make ends meet (e.g. Cracolici et al. 2012). We use the MIQ and the associated intersection methodology as the central techniques in this paper.
Data and Methods
The Intersection Approach
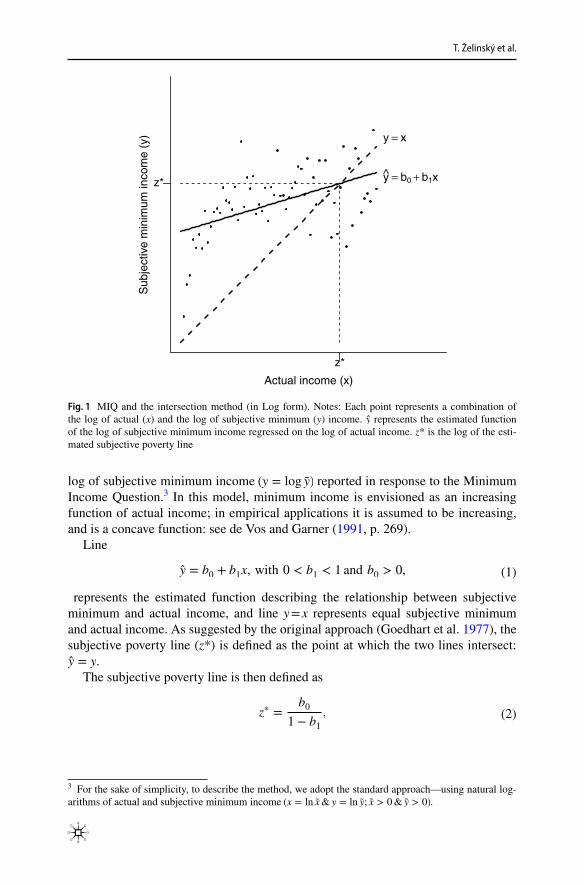
The logic behind the intersection approach is demonstrated in Fig. 1, in which each point [x; y] represents a combination of the log of actual income (x = log x) and the
T. Želinský et al.
log of subjective minimum income (y = log y) reported in response to the Minimum Income Question.3 In this model, minimum income is envisioned as an increasing function of actual income; in empirical applications it is assumed to be increasing, and is a concave function: see de Vos and Garner (1991, p. 269).
Line
represents the estimated function describing the relationship between subjective minimum and actual income, and line y = x represents equal subjective minimum and actual income. As suggested by the original approach (Goedhart et al. 1977), the subjective poverty line (z*) is defined as the point at which the two lines intersect: y = y.
The subjective poverty line is then defined as
(1)y = b0 + b1x, with 0 < b1 < 1 and b0 > 0,
(2)z∗ =b0
1 − b1,
Actual income (x)
Sub
ject
ive
min
imum
inco
me
(y)
z*
z*
y = x
y = b0 + b1x
Fig. 1 MIQ and the intersection method (in Log form). Notes: Each point represents a combination of the log of actual (x) and the log of subjective minimum (y) income. y represents the estimated function of the log of subjective minimum income regressed on the log of actual income. z* is the log of the esti-mated subjective poverty line
3 For the sake of simplicity, to describe the method, we adopt the standard approach—using natural log-arithms of actual and subjective minimum income (x = ln x& y = ln y; x > 0& y > 0).

Trends in Subjective Income Poverty Rates in the European Union
and a household i is identified as subjectively poor if the following inequality holds:
Employing control variables in Eq. (1) we obtain the following:
where vk, k = 1, …, K are control variables with associated estimated coefficients δk, k = 1, …, K. The estimated subjective poverty line is then estimated as
For instance, assuming a model with one (dichotomous) control variable (a household located in either an urban or rural area), we would obtain two different subjective poverty lines, as illustrated in Fig. 2, in which z∗
r and z∗
u are subjective
poverty lines for households located in rural (urban) areas.Employing control variables in Eq. (4) enables us to identify possible subjective
poverty lines for numerous household characteristics. The traditional approach pro-poses two ways to calculate subjective poverty thresholds (Garner and Short 2004),
(3)xi < z∗.
(4)y = b0 + b1x +
K∑
k=1
𝛿kvk, 0 < b1 < 1,
(5)z∗ =
b0 +K∑
k=1
�kvk
1 − b1.
Actual income (x)
Sub
ject
ive
min
imum
inco
me
(y)
zr*
zr*
zu*
zu* yr
yu
y = x
Fig. 2 Estimation of two alternative thresholds (in Log form)
T. Želinský et al.
also referred to as social subjective poverty lines (Ravallion 2016), to emphasise that they represent a poverty line for a whole society (or a subpopulation), not just for an individual. The first way identifies a specific threshold for each household and then finds the average (median) threshold using population weights. The second method calculates a set of thresholds differentiated by the variables defining subpopula-tions of interest, holding the values of control variables at their national averages. To identify social subjective poverty lines (SSPLs), we adopt the former approach, identifying an individual SPL for each household and then determining the medians of individual poverty lines across all households. We report SSPLs for different sub-populations over selected time periods.
Further, for 0 < b1 < 1 and b0 > 0 the Inequality (3) is equivalent to
It can easily be shown that, for 0 < b1 < 1 and b0 > 0, inequalities (3) and (6) are also equivalent for models employing a set of control variables. This is particularly useful in applications aimed at identifying the subjectively poor, as it is not neces-sary to explicitly express the subjective poverty threshold (or a set of thresholds for different subpopulations).
Ultimately, equation
can also be thought of as the minimum required income “imputed” to household i based on its actual characteristics (including income). Put differently, for the given set of characteristics of household i, Eq. (7) expresses the minimum income required, on average, by other households with the same set of characteristics.
Data and Variables
As noted, we adopt an approach that employs control variables (Eq. 7) as suggested, e.g. by De Vos and Garner (1991). The logic behind this approach is straightfor-ward—people’s perceptions of their minimum required household income are not solely based on their actual income, but also on the characteristics of their household.
The analyses in this study are based on subsamples of EU member states’ EU-SILC 2004–2019 household survey microdata (Cross UDB, 2020-09 version). Fol-lowing the Eurostat methodology, the resulting shares of subjectively poor house-holds are expressed in terms of individuals. Sample sizes vary between 3143 (Cyprus, 2009) and 24,305 (Greece, 2018) observations.
The left-hand side variables in Eq. (7) are the responses to the MIQ framed in the EU-SILC survey as follows: “In your opinion, what is the very lowest net monthly income that your household would have to have in order to make ends meet, that is to pay its usual necessary expenses? Please answer in relation to the present
(6)xi < yi.
(7)yi = b0 + b1xi +
K∑
k=1
𝛿kvki, 0 < b1 < 1

Trends in Subjective Income Poverty Rates in the European Union
circumstances of your household, and what you consider to be usual necessary expenses (to make ends meet)” [EU-SILC variable HS130].
In addition to household size, we control for numerous other household-level characteristics:
• Type of ownership of the dwelling categories include 1. outright owners, plus households with accommodation provided for free; 2. owners paying a mort-gage; 3. tenants paying either full market or reduced rent;
• Size of the flat/house measured by the number of habitable rooms per household;• Degree of urbanisation 1. densely populated area (cities); 2. intermediate area
(towns); 3. thinly populated area (rural);• Share of market income in total household income defined as the share of total
disposable household income before social transfers (before retirement and sur-vivor’s benefits) on total disposable household income.
Also, we control for individual-level characteristics, capturing the composition of adults aged 16 + in the household:
• share of adult females,• share of adults with tertiary education,• share of younger adults (aged 16–30),• migrant origin (a dummy variable indicating whether at least one adult house-
hold member was born in a different country than the country in which the sur-vey was conducted).
In addition to the main model specification with the share of market income in total household income variable, we also estimate alternative specifications with a share of currently working adults variable. Comparing the main results (subjec-tive poverty indices), we find that the estimates differ, on average, by approximately 1.4% for the poverty headcount index, 1.3% for the poverty gap index, and 0.1% for the poverty severity index, suggesting a relatively high level of robustness of the results.
As the data have been gathered over a relatively long time-span (2004–2019), certain variables have undergone modifications; this should be kept in mind. The type of ownership of dwelling [variable HH020/HH021: Tenure status] did not con-tain the category “owners paying a mortgage” before 2010. We therefore created a category defined as “owners paying interest repayments on a mortgage” [varia-ble HY100G/HY100N].4 The highest number of missing values in the dependent variable is in the UK (46% in 2017 and 37% in 2018). High numbers of missing
4 However, the variable HY100G/HY100N, together with a few other income components, was only mandatory from 2007. In cases where these values are missing (Austria, Greece, Spain, Italy, Luxem-bourg, Portugal: 2004–2006; Cyprus, Latvia: 2005–2006; France 2004), we use the original categories (excluding “owners paying mortgages”). Nevertheless, when we compare results based on models with tenure status distinguishing between owners repaying a mortgage or not, households identified as subjec-tively poor remain unchanged.
T. Želinský et al.
values also occur in the data for the Netherlands (17–30%) and Sweden (23–34%). Values are completely missing for the degree of urbanisation in certain countries and years (Germany: 2015–2019; Malta: 2007–2008; Netherlands: 2005–2019; Slo-venia: 2005–2019), while for Estonia and Latvia, only two categories are reported (densely/thinly populated areas).
Identification of Trends in the Subjective Poverty Rates
In addition to estimating the FGT measures (Foster et al. 1984) of subjective income poverty across EU member states, we aim to identify patterns in the developments of the indices over time. Although the time-span is relatively long (15–16 years in most cases), from the perspective of a rigorous time series analysis, this may be seen as somewhat short. We take this into consideration when interpreting the results of our trend analyses.
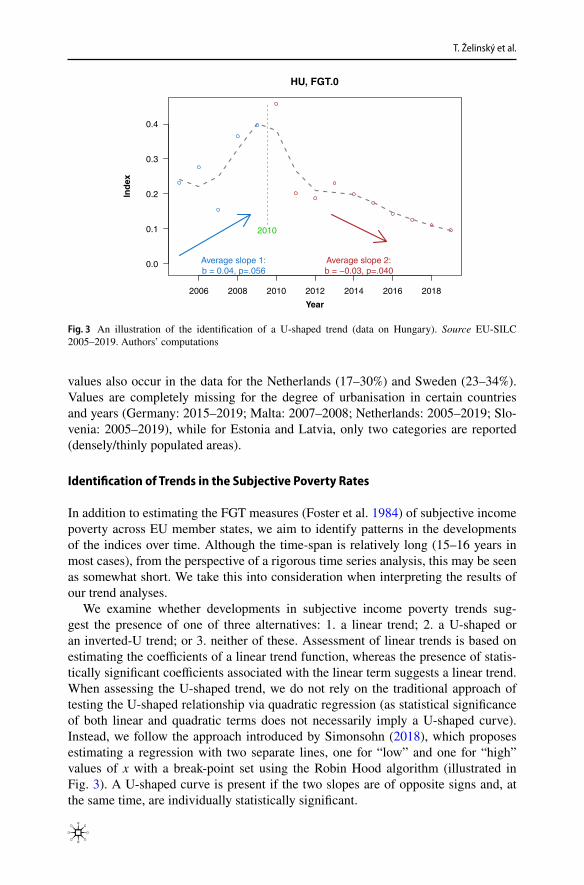
We examine whether developments in subjective income poverty trends sug-gest the presence of one of three alternatives: 1. a linear trend; 2. a U-shaped or an inverted-U trend; or 3. neither of these. Assessment of linear trends is based on estimating the coefficients of a linear trend function, whereas the presence of statis-tically significant coefficients associated with the linear term suggests a linear trend. When assessing the U-shaped trend, we do not rely on the traditional approach of testing the U-shaped relationship via quadratic regression (as statistical significance of both linear and quadratic terms does not necessarily imply a U-shaped curve). Instead, we follow the approach introduced by Simonsohn (2018), which proposes estimating a regression with two separate lines, one for “low” and one for “high” values of x with a break-point set using the Robin Hood algorithm (illustrated in Fig. 3). A U-shaped curve is present if the two slopes are of opposite signs and, at the same time, are individually statistically significant.
2006 2008 2010 2012 2014 2016 2018
0.0
0.1
0.2
0.3
0.4
HU, FGT.0
Year
Ind
ex
Average slope 1:b = 0.04, p=.056
Average slope 2:b = −0.03, p=.040
2010
Fig. 3 An illustration of the identification of a U-shaped trend (data on Hungary). Source EU-SILC 2005–2019. Authors’ computations

Trends in Subjective Income Poverty Rates in the European Union
Results
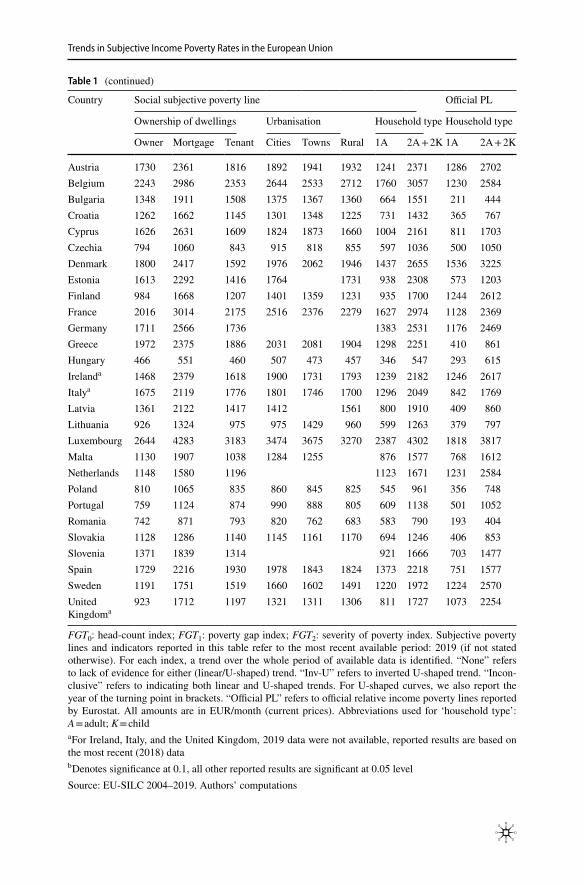
We present the main results in two sections: estimations of social subjective poverty lines and FGT-class poverty indices (reported in %), and trends in subjective pov-erty. We report the main results on trends in subjective poverty indicators over the whole period for which data were available, along with estimations of social subjec-tive poverty lines for the most recent period (2019) in Table 1. Detailed country profiles including estimates of subjective poverty indices and poverty lines over all periods are reported in the Supplementary Materials.
Social Subjective Poverty Lines
As outlined in the methodological section, our primary results are based on models with control variables. Adopting this approach, we estimate SSPLs for different sub-populations. Since our aim is not to conduct cross-country comparisons, although we comment on subjective poverty statistics in individual countries, we do not use the PPS EUR exchange rate; the estimations are reported in EUR. Results in Table 1 refer to the most recent available data (2019 in most cases, but 2018 for a small number of countries) and are reported in current prices.
The estimates of poverty lines for the years 2004 to 2019 reported in the Sup-plementary Materials are reported in constant 2015 euros (real terms), adjusted for inflation by adopting harmonised indices of consumer prices (HICP). A simi-lar approach is used by Eurostat, e.g. when reporting the at-risk-of-poverty rate anchored at a fixed moment in time (European Commission 2020). We report SSPLs for different types of households based on ownership status, degree of urbanisation, and household type (member structure).
The relative income poverty line for a single adult household is the information most often reported in other studies and official documents.5 We compare social subjective poverty lines to official relative income poverty lines for such households, and find that subjective poverty lines are on average 50% higher than the official ones. However, there is large variation in the data, with ratios of the subjective to official income poverty lines ranging from 0.75 (Finland and the UK) to above 3 (Greece, Romania, Bulgaria). In addition to SSPLs reported for single adult house-holds, we report SSPLs for households with two adults and two children as a proxy for a “typical” household with children, though it is difficult to unambiguously define a “typical household”. Again, comparing subjective to official income pov-erty lines results in ratios ranging from 0.65 (the Netherlands) to 3.5 (Bulgaria).
5 The relative income poverty approach considers equivalised income, which refers to individual equiva-lent income. Using the OECD-modified equivalence scale, an individual equivalent income corresponds to total household income only in single-adult households. Similarly, the official relative income poverty line is directly comparable to the total household income of singles, while the line for other household types can be derived as a multiple of the official line.

T. Želinský et al.
Table 1 Trends in subjective poverty indicators and selected 2019 results
Country Subjective poverty indices
Trend Index value
FGT0 FGT1 FGT2 T FGT0 FGT1 FGT2
Austria None None None 16 8.1 2.5 1.4Belgium None Decreasingb Decreasing 16 22.8 5.1 1.8Bulgaria Decreasing Decreasing Decreasing 13 84.3 41.6 24.8Croatia Inconclusive Inconclusive Inconclusive 10 50.4 16.9 8.1Cyprus Decreasing Decreasing Decreasing 15 17.5 3.3 1.0Czechia Decreasing Decreasing Decreasing 15 9.6 1.9 0.7Denmark None None Inv-Ub [2015] 16 4.5 1.2 0.5Estonia Decreasing Decreasing Decreasing 15 48.9 14.9 6.5Finland Decreasing Decreasing Decreasing 16 2.0 0.5 0.3France Decreasing Decreasing Decreasing 16 23.0 5.3 1.9Germany None None None 15 13.3 3.5 1.5Greece None None None 16 79.1 31.7 16.3Hungary Inconclusive None None 15 9.6 2.8 1.3Irelanda None Inv-Ub [2013] Inv-U [2013] 15 4.1 1.1 0.5Italya Decreasing Decreasing Decreasing 15 24.8 8.3 4.4Latvia Decreasing Decreasing Decreasing 15 61.2 22.5 11.3Lithuania Decreasing Decreasing Decreasing 15 38.3 12.9 6.3Luxembourg Increasing Increasing Increasing 16 19.6 5.5 2.6Malta Decreasing Decreasingb Decreasing 13 8.9 2.1 0.9Netherlands Decreasing Decreasingb None 15 3.9 1.4 0.8Poland Decreasing Decreasing Decreasing 15 18.9 5.1 2.2Portugal Decreasing Decreasing Decreasing 16 13.5 3.9 1.8Romania Decreasing Decreasing Decreasing 12 58.1 24.5 13.7Slovakia Decreasing Decreasing Decreasing 15 28.3 7.6 3.3Slovenia None None None 15 14.9 3.6 1.4Spain Decreasing Decreasing Decreasing 16 33.7 11.2 5.7Sweden Decreasing Decreasing Decreasing 16 8.0 2.5 1.4United
KingdomaNone None None 14 4.4 1.3 0.7
Trends in Subjective Income Poverty Rates in the European Union
Table 1 (continued)
Country Social subjective poverty line Official PL
Ownership of dwellings Urbanisation Household type Household type
Owner Mortgage Tenant Cities Towns Rural 1A 2A + 2K 1A 2A + 2K
Austria 1730 2361 1816 1892 1941 1932 1241 2371 1286 2702Belgium 2243 2986 2353 2644 2533 2712 1760 3057 1230 2584Bulgaria 1348 1911 1508 1375 1367 1360 664 1551 211 444Croatia 1262 1662 1145 1301 1348 1225 731 1432 365 767Cyprus 1626 2631 1609 1824 1873 1660 1004 2161 811 1703Czechia 794 1060 843 915 818 855 597 1036 500 1050Denmark 1800 2417 1592 1976 2062 1946 1437 2655 1536 3225Estonia 1613 2292 1416 1764 1731 938 2308 573 1203Finland 984 1668 1207 1401 1359 1231 935 1700 1244 2612France 2016 3014 2175 2516 2376 2279 1627 2974 1128 2369Germany 1711 2566 1736 1383 2531 1176 2469Greece 1972 2375 1886 2031 2081 1904 1298 2251 410 861Hungary 466 551 460 507 473 457 346 547 293 615Irelanda 1468 2379 1618 1900 1731 1793 1239 2182 1246 2617Italya 1675 2119 1776 1801 1746 1700 1296 2049 842 1769Latvia 1361 2122 1417 1412 1561 800 1910 409 860Lithuania 926 1324 975 975 1429 960 599 1263 379 797Luxembourg 2644 4283 3183 3474 3675 3270 2387 4302 1818 3817Malta 1130 1907 1038 1284 1255 876 1577 768 1612Netherlands 1148 1580 1196 1123 1671 1231 2584Poland 810 1065 835 860 845 825 545 961 356 748Portugal 759 1124 874 990 888 805 609 1138 501 1052Romania 742 871 793 820 762 683 583 790 193 404Slovakia 1128 1286 1140 1145 1161 1170 694 1246 406 853Slovenia 1371 1839 1314 921 1666 703 1477Spain 1729 2216 1930 1978 1843 1824 1373 2218 751 1577Sweden 1191 1751 1519 1660 1602 1491 1220 1972 1224 2570United Kingdoma
923 1712 1197 1321 1311 1306 811 1727 1073 2254
FGT0: head-count index; FGT1: poverty gap index; FGT2: severity of poverty index. Subjective poverty lines and indicators reported in this table refer to the most recent available period: 2019 (if not stated otherwise). For each index, a trend over the whole period of available data is identified. “None” refers to lack of evidence for either (linear/U-shaped) trend. “Inv-U” refers to inverted U-shaped trend. “Incon-clusive” refers to indicating both linear and U-shaped trends. For U-shaped curves, we also report the year of the turning point in brackets. “Official PL” refers to official relative income poverty lines reported by Eurostat. All amounts are in EUR/month (current prices). Abbreviations used for ‘household type’: A = adult; K = childa For Ireland, Italy, and the United Kingdom, 2019 data were not available, reported results are based on the most recent (2018) datab Denotes significance at 0.1, all other reported results are significant at 0.05 levelSource: EU-SILC 2004–2019. Authors’ computations

T. Želinský et al.
The 2019 results further suggest that the SSPL for households paying mortgages is, on average, approximately 40% higher than for households that own their home outright. The highest differences between the two types of households are reported in the United Kingdom and Finland (85% and 70%, respectively), and the lowest in Slovakia, Romania, and Hungary (between 14% and 18%). In general, the propor-tion is higher in Western EU countries and lower in Eastern EU countries. In most cases, SSPLs estimated for the city-type-of-dwelling are higher than those for rural areas (on average, by 6%), with the highest differences in Portugal and Romania (23% and 20%, respectively). In contrast, in Latvia, SSPLs in cities are, on average, 10% lower than those in rural areas. The results further suggest a clear pattern—larger household types are associated with higher SSPLs. The SSPL for a household of two adults and two children is, on average, 85% greater than the SSPL for one-person households. The SSPL for such households in Estonia and Latvia are almost 2.5-times the value for one-person households, while in Romania, the Netherlands, Italy, and Hungary, it is only 35% to 58% greater. A break-down of results appears in Table 1, and detailed subjective poverty country profiles are reported in Supplemen-tary Material.
Trends in Subjective Poverty
The 2019 results indicate that the lowest levels of subjective poverty are reported in Finland (FGT0 = 2.0%; FGT1 = 0.5%; FGT2 = 0.3%). Bulgaria and Greece have the highest levels of subjective poverty (FGT0 between 79% and 84%; FGT1 between 32% and 42%; FGT2 between 16% and 25%).
If the subjective poverty rate is considered to be an alternative indicator for the assessment of income poverty in the EU, a legitimate question would be whether subjective poverty rates in the EU have decreased or increased over time. To answer this question, we employ a simple trend analysis assessing linear and quadratic trends of headcount (FGT0), poverty gap (FGT1), and severity of poverty indices (FGT2). Our results suggest a decreasing trend in all three indices in 16 of 28 coun-tries; no common trend across all three indices was identified in five countries; and an increasing trend is present in one country.
The fastest average annual rate of decrease in the headcount index (3.6 p.p.) is reported in Slovakia (from 84.1% in 2005 to 28.3% in 2019), followed by Portu-gal (2.8 p.p.: from 46.5% in 2004 to 13.5% in 2019). Croatia also experienced sub-stantial decreases in the headcount index; however, the overall picture is somewhat ambiguous, as the results also suggest an inverted U-shaped curve with a break-point in 2013 (see Table S.2.HR in the Supplementary Materials for further details). Slo-vakia and Latvia have the fastest rates of decrease in the mean poverty gap (between 1.5 and 1.6 p.p.); the fastest declines in severity of poverty are reported in Latvia and Bulgaria (1.1 and 0.9 p.p.). Conversely, increasing trends in all three indices are observed only in Luxembourg, which experienced average yearly increases of 1.1, 0.3, and 0.2 p.p. The results do not clearly suggest a U-shaped or an inverted U-shaped relationship for all three indicators for any EU country. However, as noted above, results for Croatia are inconclusive, suggesting both decreasing and inverted

Trends in Subjective Income Poverty Rates in the European Union
U-shaped trends. As suggested by figures reported in the country profile for Croatia, the visual representation of the relationship suggests the presence of a break-point in 2013. However, it also suggests a decreasing trend, as the values of subjective poverty indicators have been declining continuously since 2014. However, because Croatia includes only ten observations, the results should be interpreted cautiously.
During the 2004 to 2019 period, numerous important events occurred in the Euro-pean Union, including adoption of the Euro currency (in Cyprus in 2008; Estonia in 2011; Latvia in 2014; Lithuania in 2015; Malta in 2008; Slovakia in 2009 and Slo-venia in 2007) and the economic consequences of the Great Recession (2008–2012). It would be interesting to assess the effects of these events on subjective poverty indices. However, frequent overlaps of these and other influential events in many countries make such analyses challenging. Nevertheless, we cautiously comment on significant deviations from the primary trends in selected EU countries in line with the recession period.
Austria has experienced stable subjective poverty trends, with deviant values in 2008 and 2010. Belgium’s subjective poverty indicators have been weakly decreas-ing with a slight deviation in 2008. On average, the general trend in subjective pov-erty in Cyprus has a decreasing nature, although a temporary sharp increase was reported in 2010 and 2011. A similar pattern can also be observed in Czechia—an overall decreasing trend with temporary increases in 2011 and 2012. Germa-ny’s rates decreased slightly between 2005 and 2009, followed by a weak increase between 2010 and 2014, not suggesting any consistent trend. Similar trends also occurred in Denmark, Ireland, and Estonia; there was significantly less prevalence of subjective poverty in Denmark (deviating 2009–2010) and Ireland (deviating from decreasing in 2010 but returning to further decreases after 2013), and consid-erably higher in Estonia with a sharp increase between 2010 and 2011.
Though the visual representation of subjective poverty indicators trends in Greece suggests a U-shaped curve with indices decreasing between 2004 and 2011 followed by growth until 2014, the trend reversed in 2015 and the values of indicators began to decline. Consequently, the trend did not suggest an unambiguous U-shaped rela-tionship. The pattern in Hungary’s subjective poverty can be considered somewhat unstable. From the perspective of the headcount index, a sharp decrease between 2006 and 2007 was followed by a severe increase in 2008 and 2010, then it dropped and continued to decrease. The poverty gap index has an overall decreasing trend (with deviations between 2008 and 2010), while the severity of poverty is rather sta-ble, again with deviations between 2008 and 2010. The decreasing trends in Lithu-ania, Latvia, and Malta were interrupted by a sudden increase in Lithuania in 2011; in Latvia in 2011–2013; and in Malta in 2010. The rapid decreases in the subjective poverty indices in Slovakia were interrupted by moderate increases between 2013 and 2015, and then returned to falling. Romanian data suggest decreasing trends in subjective poverty indices. However, when performing a trend analysis on Roma-nian data, we excluded the subjective poverty indicators for 2010. As suggested by the country profile for Romania, the estimated 2010 social subjective poverty line is clearly an outlier (212 EUR/month for a single-adult household in 2015 prices, which is approximately half of the values reported in earlier/later periods).

T. Želinský et al.
There is a question regarding to what extent the economic recession may have affected the levels of subjective poverty in the European Union. Trends in the pov-erty lines in the 2009–2012 period do not suggest any clear patterns. In some coun-tries, initially increasing trends in subjective poverty lines began to stagnate, in some countries they began to decrease, and in other countries they began to increase at faster rates. Further, numerous other potentially significant events occurred around the same period, such as adoption of the Euro-currency in some countries, which makes it difficult to cleanly separate the effects of the economic crisis on subjective poverty indicators. Consequently, investigation of the true effects of the crisis on subjective poverty levels, if any, would require rigorous econometric methods, and is beyond the scope of this paper.
Subjective Poverty as a Supplementary Measure to the Official Indicators
In 2010, the European Council adopted a Europe 2020 strategy with five key objec-tives, including lifting at least 20 million people out of the risk of poverty and social exclusion (European Council 2010). European institutions track the progress of the main aggregate indicator of at risk of poverty or social exclusion and its individual indicators: at risk of poverty; severe material deprivation; jobless households (or those with very low work intensity). Although we believe that the current official multidimensional poverty indicator has numerous drawbacks, in this study we do not aim to challenge or criticise it. The current multidimensional indicator was sug-gested by the Social Protection Committee (SPC 2010) to measure the overall num-ber of people who are at risk of poverty or excluded on the basis of the three dimen-sions of poverty and exclusion. The relative poverty concept, despite its numerous problematic aspects, has been adopted in the EU since the EU Council of Minis-ters in 1975 (Bradshaw and Mayhew 2011). When designing the multidimensional poverty indicator, several national delegations preferred an indicator based on two dimensions only (excluding joblessness), however, most of them ultimately accepted the addition of a low work intensity indicator as the third dimension. The role of this indicator is to better understand the links between poverty and labour market exclusion at the individual level. The severe material deprivation rate was meant to represent the concept of absolute poverty. The final aggregated indicator counts the share of individuals endangered in at least one dimension.
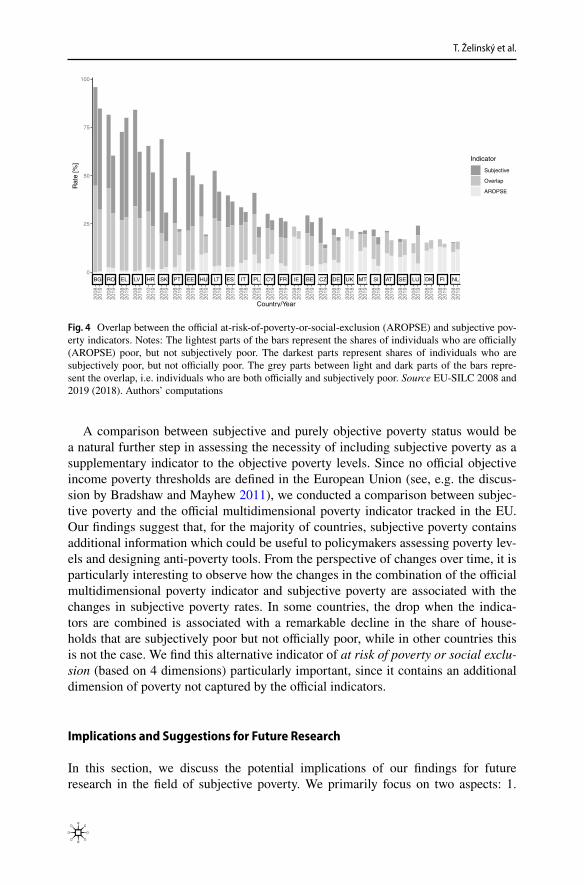
In Fig. 4, we provide a scenario of how the official poverty rates would change if we produced an indicator that includes a fourth dimension—subjective income pov-erty. A low increase in the value of the multidimensional indicator would suggest that subjective perceptions of poverty are already largely reflected in the three current dimensions, whereas a larger increase would suggest the opposite. Figure 4 depicts the addition of subjective poverty status to the current official indicator of multidi-mensional poverty in the EU. The lightest parts of the bars represent the shares of individuals who are officially poor, but not subjectively poor. The darkest parts rep-resent shares of individuals who are subjectively poor, but not officially poor. The grey parts between light and dark parts of the bars represent the overlap, i.e. individu-als who are both officially and subjectively poor. The figure suggests that the impact

Trends in Subjective Income Poverty Rates in the European Union
of adding subjective poverty to the current multidimensional indicator of poverty or social exclusion is rather low in Western and Northern EU countries, while it is typi-cally larger for Eastern and Southern EU countries. The results are also stable in time, except in Portugal, Hungary, Czechia, and Slovakia where the impact of subjective poverty declined considerably between 2008 and 2019. Conversely, though inclusion of subjective poverty had a strong effect on the multidimensional indicator of poverty in Luxembourg in 2019, it had almost no effect in 2008.
Discussion and Implications
To the best of our knowledge, this is the first study to explore trends in subjective poverty in the European Union. With the exception of a few countries, all three sub-jective poverty indices (headcount ratio, the poverty gap index, and the severity of poverty index) show consistent decreasing trends in subjective poverty. In this study, we do not aim to compare the differences in perceptions of subjective poverty across countries, since such comparisons would be questionable due to cultural differences.
In practical applications, relative income poverty lines are most commonly used. We compare the officially reported poverty lines to social subjective poverty lines, and show that there is large variation in the differences between the two lines. For the majority of countries, subjective poverty lines are higher than official relative income poverty lines. This finding is particularly important for policy implications, as it suggests that relying on relative income poverty lines may result in underesti-mating poverty levels, at least in terms of public perception.
Our results further suggest that social subjective poverty lines are considerably higher for households paying mortgages and tenants paying rent than for outright homeowners. Clearly, making mortgage or rent payments is a burden for the house-hold budget, hence such households require a higher minimum income. Similar conclusions have also been suggested by previous studies, which have found that mortgage and rental payments affect the financial satisfaction and well-being of households (Tharp et al. 2020; Gerlach-Kristen and Lyons 2018). This finding is particularly useful for designing and adjusting objective poverty measures consider-ing housing costs, and in considerations related to imputed rent.
Our results further suggest differences in SSPLs between urban and rural areas. Findings of empirical studies on the geographies of subjective well-being are incon-clusive (Dolan et al. 2008). Differences in expectations regarding the minimum income can be attributed to differences between area types, which can include dif-ferences in price levels between rural and urban areas (Janský and Kolcunová 2017); and differences in labour market opportunities (Shucksmith et al. 2009). As further argued by Shucksmith et al. (2009), richer EU countries experience lower levels of evidence of urban–rural differences than poorer ones. Our findings suggest no clear pattern in the differences in SSPLs between rural and urban areas between different parts of the EU. In accordance with Dolan et al. (2008), we argue that the phenom-enon is far too complex to make a clear distinction between different types of areas in terms of population size and density.
T. Želinský et al.
A comparison between subjective and purely objective poverty status would be a natural further step in assessing the necessity of including subjective poverty as a supplementary indicator to the objective poverty levels. Since no official objective income poverty thresholds are defined in the European Union (see, e.g. the discus-sion by Bradshaw and Mayhew 2011), we conducted a comparison between subjec-tive poverty and the official multidimensional poverty indicator tracked in the EU. Our findings suggest that, for the majority of countries, subjective poverty contains additional information which could be useful to policymakers assessing poverty lev-els and designing anti-poverty tools. From the perspective of changes over time, it is particularly interesting to observe how the changes in the combination of the official multidimensional poverty indicator and subjective poverty are associated with the changes in subjective poverty rates. In some countries, the drop when the indica-tors are combined is associated with a remarkable decline in the share of house-holds that are subjectively poor but not officially poor, while in other countries this is not the case. We find this alternative indicator of at risk of poverty or social exclu-sion (based on 4 dimensions) particularly important, since it contains an additional dimension of poverty not captured by the official indicators.
Implications and Suggestions for Future Research
In this section, we discuss the potential implications of our findings for future research in the field of subjective poverty. We primarily focus on two aspects: 1.
BG RO EL LV HR SK PT EE HU LT ES IT PL CY FR IE BE CZ DE UK MT SI AT SE LU DK FI NL
2008
2019
2008
2019
2008
2019
2008
2019
2010
2019
2008
2019
2008
2019
2008
2019
2008
2019
2008
2019
2008
2019
2008
2018
2008
2019
2008
2019
2008
2019
2008
2018
2008
2019
2008
2019
2008
2019
2008
2018
2008
2019
2008
2019
2008
2019
2008
2019
2008
2019
2008
2019
2008
2019
2008
2019
0
25
50
75
100
Country/Year
Rat
e [%
]
Indicator
Subjective
Overlap
AROPSE
Fig. 4 Overlap between the official at-risk-of-poverty-or-social-exclusion (AROPSE) and subjective pov-erty indicators. Notes: The lightest parts of the bars represent the shares of individuals who are officially (AROPSE) poor, but not subjectively poor. The darkest parts represent shares of individuals who are subjectively poor, but not officially poor. The grey parts between light and dark parts of the bars repre-sent the overlap, i.e. individuals who are both officially and subjectively poor. Source EU-SILC 2008 and 2019 (2018). Authors’ computations
Trends in Subjective Income Poverty Rates in the European Union
implications for estimation techniques; and 2. implications for the relationships between subjective and objective poverty.
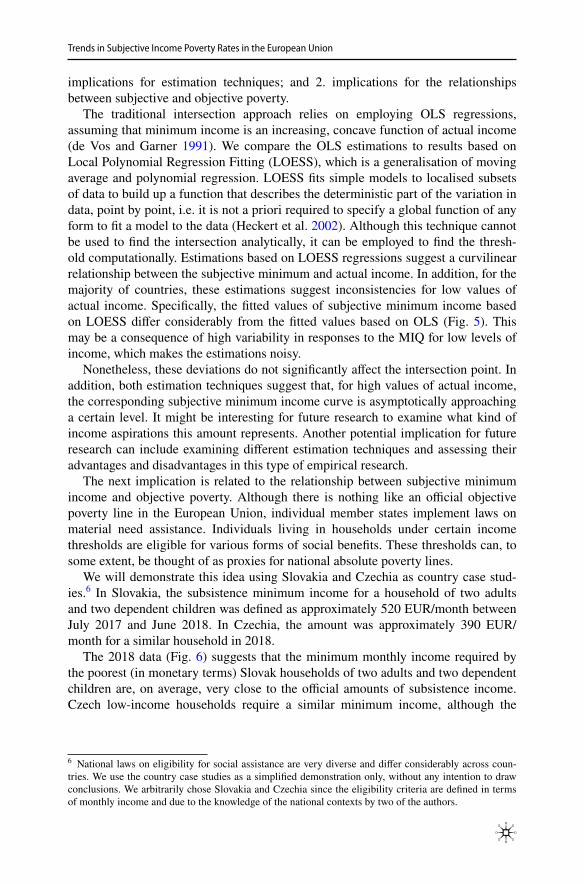
The traditional intersection approach relies on employing OLS regressions, assuming that minimum income is an increasing, concave function of actual income (de Vos and Garner 1991). We compare the OLS estimations to results based on Local Polynomial Regression Fitting (LOESS), which is a generalisation of moving average and polynomial regression. LOESS fits simple models to localised subsets of data to build up a function that describes the deterministic part of the variation in data, point by point, i.e. it is not a priori required to specify a global function of any form to fit a model to the data (Heckert et al. 2002). Although this technique cannot be used to find the intersection analytically, it can be employed to find the thresh-old computationally. Estimations based on LOESS regressions suggest a curvilinear relationship between the subjective minimum and actual income. In addition, for the majority of countries, these estimations suggest inconsistencies for low values of actual income. Specifically, the fitted values of subjective minimum income based on LOESS differ considerably from the fitted values based on OLS (Fig. 5). This may be a consequence of high variability in responses to the MIQ for low levels of income, which makes the estimations noisy.
Nonetheless, these deviations do not significantly affect the intersection point. In addition, both estimation techniques suggest that, for high values of actual income, the corresponding subjective minimum income curve is asymptotically approaching a certain level. It might be interesting for future research to examine what kind of income aspirations this amount represents. Another potential implication for future research can include examining different estimation techniques and assessing their advantages and disadvantages in this type of empirical research.
The next implication is related to the relationship between subjective minimum income and objective poverty. Although there is nothing like an official objective poverty line in the European Union, individual member states implement laws on material need assistance. Individuals living in households under certain income thresholds are eligible for various forms of social benefits. These thresholds can, to some extent, be thought of as proxies for national absolute poverty lines.
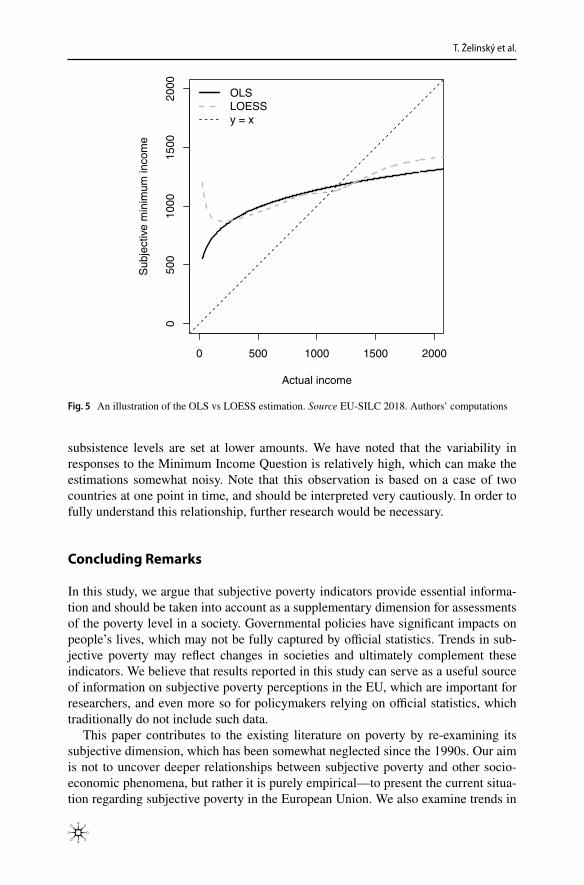
We will demonstrate this idea using Slovakia and Czechia as country case stud-ies.6 In Slovakia, the subsistence minimum income for a household of two adults and two dependent children was defined as approximately 520 EUR/month between July 2017 and June 2018. In Czechia, the amount was approximately 390 EUR/month for a similar household in 2018.
The 2018 data (Fig. 6) suggests that the minimum monthly income required by the poorest (in monetary terms) Slovak households of two adults and two dependent children are, on average, very close to the official amounts of subsistence income. Czech low-income households require a similar minimum income, although the
6 National laws on eligibility for social assistance are very diverse and differ considerably across coun-tries. We use the country case studies as a simplified demonstration only, without any intention to draw conclusions. We arbitrarily chose Slovakia and Czechia since the eligibility criteria are defined in terms of monthly income and due to the knowledge of the national contexts by two of the authors.
T. Želinský et al.
subsistence levels are set at lower amounts. We have noted that the variability in responses to the Minimum Income Question is relatively high, which can make the estimations somewhat noisy. Note that this observation is based on a case of two countries at one point in time, and should be interpreted very cautiously. In order to fully understand this relationship, further research would be necessary.
Concluding Remarks
In this study, we argue that subjective poverty indicators provide essential informa-tion and should be taken into account as a supplementary dimension for assessments of the poverty level in a society. Governmental policies have significant impacts on people’s lives, which may not be fully captured by official statistics. Trends in sub-jective poverty may reflect changes in societies and ultimately complement these indicators. We believe that results reported in this study can serve as a useful source of information on subjective poverty perceptions in the EU, which are important for researchers, and even more so for policymakers relying on official statistics, which traditionally do not include such data.
This paper contributes to the existing literature on poverty by re-examining its subjective dimension, which has been somewhat neglected since the 1990s. Our aim is not to uncover deeper relationships between subjective poverty and other socio-economic phenomena, but rather it is purely empirical—to present the current situa-tion regarding subjective poverty in the European Union. We also examine trends in
0 500 1000 1500 2000
050
010
0015
0020
00
Actual income
Sub
ject
ive
min
imum
inco
me
OLSLOESSy = x
Fig. 5 An illustration of the OLS vs LOESS estimation. Source EU-SILC 2018. Authors’ computations

Trends in Subjective Income Poverty Rates in the European Union
subjective poverty over the past 10–16 years. We believe that this study is primarily useful for social scientists focussing on quality-of-life issues, and for policymakers seeking data on different aspects of poverty.
Estimations in this paper are based on a standard methodology, and we are aware of drawbacks, including a high level of variation in the key variables. However, we believe that this study can contribute to re-opening more vibrant and intensive dis-cussions related to the study of subjective poverty. The approach used in this paper originated in the 1970s, and econometric methods have undergone considerable developments since then. Our next goal will be to conduct a comparative study to assess the robustness of trends in subjective poverty based on different (non-para-metric and semi-parametric) techniques.
We hope that this study may serve to inspire other social scientists interested in uncovering potential factors in changes in subjective poverty rates. These may include factors related to the adoption of the euro-currency, impacts of economic crises, and other potentially important events in the EU and its individual countries. Here, we have attempted to cautiously outline some of these events. Nonetheless, we believe that in order to comprehensively study relevant factors, implementation of rigorous econometric techniques allowing researchers to separate out various exter-nal factors is necessary. This is beyond the scope of this study.
Supplementary Information The online version contains supplementary material available at https:// doi. org/ 10. 1057/ s41287- 021- 00457-2.
Acknowledgements The work of Tomáš Želinský and Martina Mysíková was supported by the Czech Science Foundation under Grant no. 18-07036S “Methodology and reality of poverty: Czech Republic in the European context”. Tomáš Želinský further acknowledges support from the Slovak Scientific Grant Agency (grants VEGA 1/0453/19 and VEGA 2/0002/19). The EU-SILC datasets were made available on the basis of contract no. 247/2019-EU-SILC-HBS between the European Commission, Eurostat, and the Institute of Sociology of the Czech Academy of Sciences. We are further grateful to comments and
0 500 1500 2500 3500
050
015
0025
0035
00
Actual income
Subjective minimum incomeAbsolute poverty line
0 500 1500 2500 3500
050
015
0025
0035
00Actual income
Subjective minimum incomeAbsolute poverty line
Fig. 6 Subjective minimum income and absolute poverty line (left: Slovakia; right: Czechia; 2018). Source EU-SILC 2018. Authors’ computations

T. Želinský et al.
feedback provided by the participants of the United Nations Economic Commission for Europe (UNECE) Expert Meeting on Measuring Poverty and Inequality held in Geneva (5-6 December 2019). The respon-sibility for all conclusions drawn from the data lies entirely with the authors.
Disclaimer The views expressed in this study, including those related to statistical, methodological, tech-nical, and operational issues, are solely those of the authors. The authors accept responsibility for all errors.
Declarations
Conflict of interest The authors have no actual or potential conflict of interest including any financial, personal, or other relationships with other people or organisations within three years of beginning the submitted work that could inappropriately influence, or be perceived to influence, their work.
Open Access This article is licensed under a Creative Commons Attribution 4.0 International License, which permits use, sharing, adaptation, distribution and reproduction in any medium or format, as long as you give appropriate credit to the original author(s) and the source, provide a link to the Creative Com-mons licence, and indicate if changes were made. The images or other third party material in this article are included in the article’s Creative Commons licence, unless indicated otherwise in a credit line to the material. If material is not included in the article’s Creative Commons licence and your intended use is not permitted by statutory regulation or exceeds the permitted use, you will need to obtain permission directly from the copyright holder. To view a copy of this licence, visit http:// creat iveco mmons. org/ licen ses/ by/4. 0/.
References
Bertrand, M., and S. Mullainathan. 2001. Do people mean what they say? Implications for subjective sur-vey data. The American Economic Review (papers and Proceedings) 91 (2): 67–72.
Bishop, J.A., A. Grodner, H. Liu, and I. Ahamdanech-Zarco. 2014. Subjective poverty equivalence scales for Euro Zone countries. The Journal of Economic Inequality 12 (2): 265–278.
Bradshaw, J., and E. Mayhew. 2011. The measurement of extreme poverty in the European Union. Brus-sels: European Commission.
Chakravarty, S.R., and J. Silber. 2008. Measuring multidimensional poverty: The axiomatic approach. In Quantitative approaches to multidimensional poverty measurement, ed. N. Kakwani and J. Silber. London: Palgrave Macmillan.
Chan, S.M., and H. Wong. 2020. Impact of income, deprivation and social exclusion on subjective pov-erty: A structural equation model of multidimensional poverty in Hong Kong. Social Indicators Research 152 (3): 971–990.
Colosanto, D., A. Kapteyn, and J. van der Gaag. 1984. Two subjective definitions of poverty: Results from the Wisconsin Basic Needs Study. Journal of Human Resources 19 (1): 127–138.
Cracolici, M.F., F. Giambona, and M. Cuffaro. 2012. The determinants of subjective economic well-being: An analysis on Italian-Silc data. Applied Research in Quality of Life 7 (1): 17–47.
Danziger, S., J. van der Gaag, M.K. Taussig, and E. Smolensky. 1984. The direct measurement of welfare levels: How much does it cost to make ends meet? The Review of Economics and Statistics 66 (3): 500–505.
de Vos, K., and T.I. Garner. 1991. An evaluation of subjective poverty definitions: Comparing results from the U.S. and the Netherlands. Review of Income and Wealth 37 (3): 267–285.
Deaton, A., and A.A. Stone. 2013. Two happiness puzzles. The American Economic Review (papers and Proceedings) 103 (3): 591–597.
Deleeck, H., and K. van den Bosch. 1992. Poverty and adequacy of social security in Europe: A compara-tive analysis. Journal of European Social Policy 2 (2): 107–120.
Diener, E., E.M. Suh, R.E. Lucas, and H.L. Smith. 1999. Subjective well-being: Three decades of pro-gress. Psychological Bulletin 125 (2): 276–302.

Trends in Subjective Income Poverty Rates in the European Union
Dolan, P., T. Peasgood, and M. White. 2008. Do we really know what makes us happy? A review of the economic literature on the factors associated with subjective well-being. Journal of Economic Psy-chology 29 (1): 94–122.
European Commission. 2010. Communication from the Commission: Europe 2020. A strategy for smart, sustainable and inclusive growth. Brussels, European Commission. [COM(2010) 2020 final].
European Commission. 2020. Social situation monitor: Research findings. Brussels: European Commis-sion: Directorate-General for Employment, Social Affairs and Inclusion.
European Council. 2010. Cover note from general secretariat of the council to delegations: Conclusions. Brussels, European commission. [EUCO 13/10].
Flik, R.J., and B.M.S. van Praag. 1991. Subjective poverty line definitions. De Economist 139 (3): 311–330.
Foster, J., J. Greer, and E. Thorbecke. 1984. A class of decomposable poverty measures. Econometrica 52 (3): 761–766.
Foster, J., J. Greer, and E. Thorbecke. 2010. The Foster–Greer–Thorbecke (FGT) poverty measures: 25 years later. The Journal of Economic Inequality 8 (4): 491–524.
Garner, T.I., and K. Short. 2004. Economic well-being based on income, consumer expenditures and personal assessments of minimum needs. In Studies on economic well-being: Essays in the honor of John P. Formby, Vol. 12 of the Series Research on Economic Inequality, ed. J.A. Bishop and Y. Amiel, 319–361. Oxford: Elsevier Science.
Gerlach-Kristen, P., and S. Lyons. 2018. Determinants of mortgage arrears in Europe: Evidence from household microdata. International Journal of Housing Policy 18 (4): 545–567.
Goedhart, T., V. Halberstadr, A. Kapteyn, and B.M.S. van Praag. 1977. The poverty line: Concept and measurement. The Journal of Human Resources 12 (4): 503–520.
Heckert, N. A. et al. 2002. Handbook 151: NIST/SEMATECH e-Handbook of Statistical Methods. National Institute of Standards and Technology, U.S. Department of Commerce. https:// www. nist. gov/ publi catio ns/ handb ook- 151- nists emate ch-e- handb ook- stati stical- metho ds/. Accessed 17 Aug 2020.
Hagenaars, A., and K. de Vos. 1988. The definition and measurement of poverty. Journal of Human Resources 23 (2): 211–221.
Janský, P., and D. Kolcunová. 2017. Regional differences in price levels across the European Union and their implications for its regional policy. The Annals of Regional Science 58 (3): 641–660.
Kapteyn, A., P. Kooreman, and R. Willemse. 1988. Some methodological issues in the implementation of subjective poverty definitions. The Journal of Human Resources 23 (2): 222–242.
Lane, R.E. 1991. The market experience. Cambridge: Cambridge University Press.Muffels, R., J. Berghman, and H.-J. Dirven. 1992. A multi-method approach to monitor the evolution of
poverty. Journal of European Social Policy 2 (3): 193–213.Mysíková, M., T. Želinský, T.I. Garner, and J. Večerník. 2019. Subjective perceptions of poverty and
objective economic conditions: Czechia and Slovakia a quarter century after the dissolution of Czechoslovakia. Social Indicators Research 145 (2): 523–550.
Mysíková, M., T. Želinský, M. Jirková, and J. Večerník. 2021. Equivalence scale and income poverty: Two approaches how to estimate country-specific scale for the Czech Republic. Social Indicators Research 156 (1): 21–45.
Pradhan, M., and M. Ravallion. 2000. Measuring poverty using qualitative perceptions of consumption adequacy. The Review of Economics and Statistics 82 (3): 462–471.
Ravallion, M. 1992. Poverty comparisons: A guide to concepts and methods. LSMS Working Paper No. 88. Washington DC: The World Bank.
Ravallion, M. 2014. Poor, or just feeling poor? On using subjective data in measuring poverty. In Happi-ness and economic growth: Lessons from developing countries, ed. A. Clark and C. Senik. Oxford: Oxford University Press.
Ravallion, M. 2016. The economics of poverty: History, measurement, and policy. Oxford: Oxford Uni-versity Press.
Saunders, P., B. Halleröd, and G. Matheson. 1994. Making ends meet in Australia and Sweden: A com-parative analysis using Subjective Poverty Line methodology. Acta Sociologica 37 (1): 3–22.
SPC. 2010. Cover note from the Social Protection Committee to Permanent Representative Committee: Europe 2020 Strategy—SPC Contribution. Brussels: Council of the European Union.
Shucksmith, M., S. Cameron, T. Merridew, and F. Pichler. 2009. Urban-rural differences in quality of life across the European Union. Regional Studies 43 (10): 1275–1289.

T. Želinský et al.
Simonsohn, U. 2018. Two lines: A valid alternative to the invalid testing of U-shaped relationships with quadratic regressions. Advances in Methods and Practices in Psychological Science 1 (4): 538–555.
Stiglitz, J. E., A. Sen, and J.-P. Fitoussi. 2009. Report by the commission on the measurement of eco-nomic performance and social progress.
Tharp, D.T., et al. 2020. Financial satisfaction and homeownership. Journal of Family and Economic Issues 41 (2): 255–280.
van Praag, B.M.S. 1968. Individual welfare functions and consumer behaviour. Amsterdam: North Hol-land Publishing Co.
van Praag, B.M.S., P. Frijters, and A. Ferrer-i-Carbonell. 2003. The anatomy of subjective well-being. Journal of Economic Behavior & Organization 51 (1): 29–49.
van Praag, B.M.S., A.J. Hagenaars, and H. van Weerden. 1982. Poverty in Europe. Review of Income and Wealth 28 (3): 345–359.
Veenhoven, R. 2002. Why social policy needs subjective indicators. Social Indicators Research 58 (1–3): 33–46.
Vogel, J. 2002. Strategies and traditions in Swedish social reporting: A 30-year experience. Social Indica-tors Research 58 (1–3): 89–112.
Vrooman, C.J. 2009. Rules of relief; institutions of social security, and their impact. The Hague: The Netherlands Institute of Social Research.
Wang, H., Q. Zhao, Y. Bai, L. Zhang, and X. Yu. 2020. Poverty and subjective poverty in Rural China. Social Indicators Research 150 (1): 219–242.
Wong, C.K., K.Y. Wong, and B.H. Mok. 2006. Subjective well-being, societal condition and social pol-icy—the case study of a rich Chinese society. Social Indicators Research 78 (3): 405–428.
Želinský, T., J.W.J. Ng, and M. Mysíková. 2020. Estimating subjective poverty lines with discrete infor-mation. Economics Letters 196: 109545.
Publisher’s Note Springer Nature remains neutral with regard to jurisdictional claims in published maps and institutional affiliations.