Trends in Spending by the Department of Defense for Operation … · 2019-12-11 · Trends in...
34
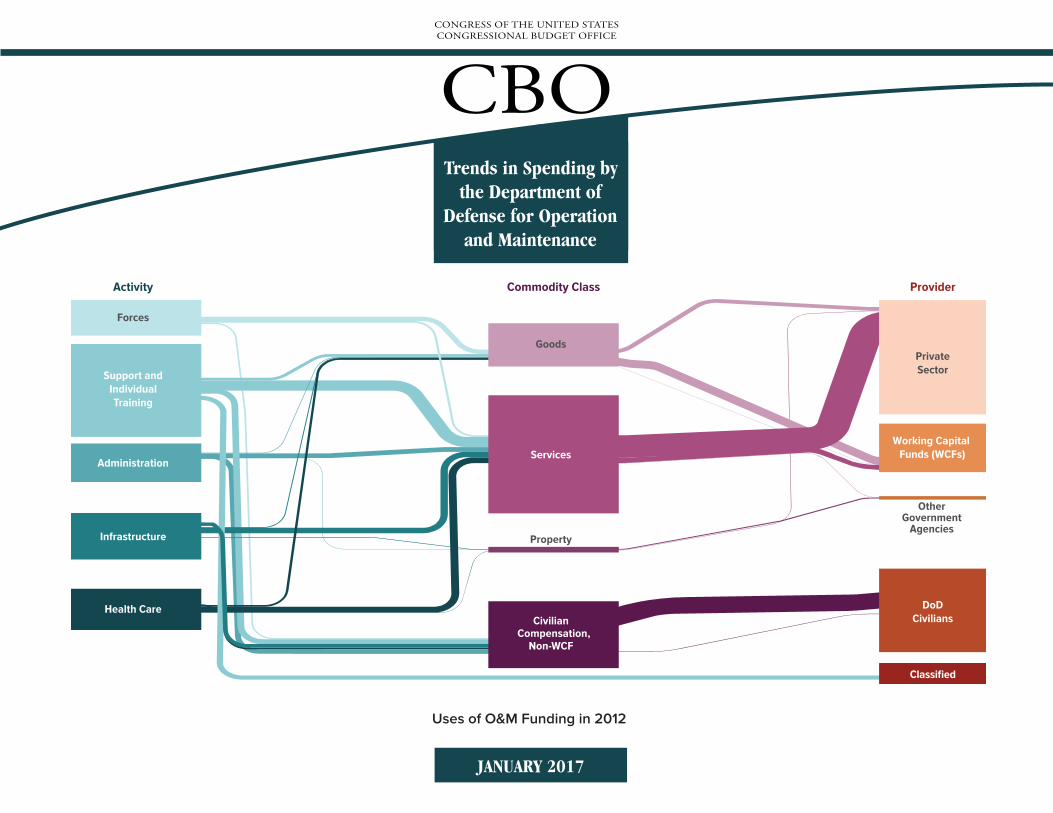
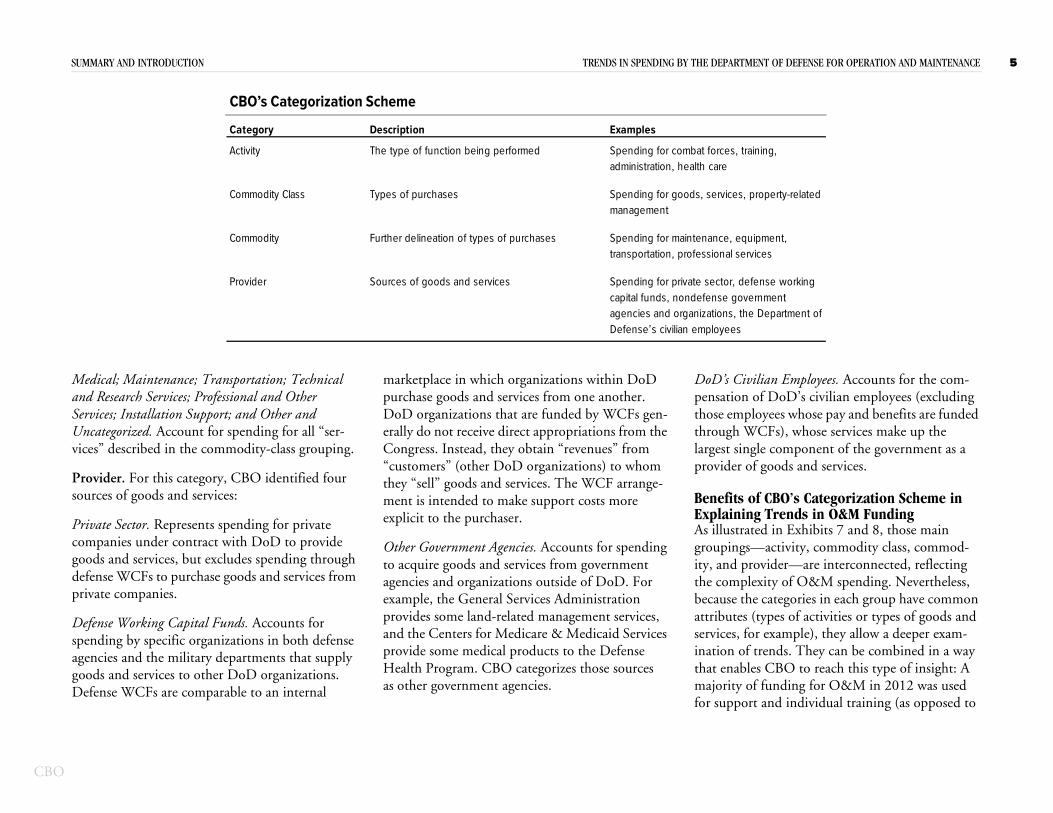
Health Care DoD Civilians Other Government Agencies Private Sector Property Classified Goods Infrastructure Administration Support and Individual Training Forces Working Capital Funds (WCFs) Services Civilian Compensation, Non-WCF Activity Commodity Class Provider Uses of O&M Funding in 2012 CONGRESS OF THE UNITED STATES CONGRESSIONAL BUDGET OFFICE CBO Trends in Spending by the Department of Defense for Operation and Maintenance JANUARY 2017
Transcript of Trends in Spending by the Department of Defense for Operation … · 2019-12-11 · Trends in...
Health Care DoDCivilians
OtherGovernment
Agencies
PrivateSector
Property
Classified
Goods
Infrastructure
Administration
Support andIndividualTraining
Forces
Working Capital Funds (WCFs)Services
CivilianCompensation,
Non-WCF
Activity Commodity Class Provider
Uses of O&M Funding in 2012
CONGRESS OF THE UNITED STATESCONGRESSIONAL BUDGET OFFICE
CBOTrends in Spending by
the Department of Defense for Operation
and Maintenance
JANUARY 2017
CBO
scal years, which run from October 1 to
ding.
ffice’s website.
www.cbo.gov/publication/52156
Notes
Unless otherwise indicated, the years referred to in this report are federal fiSeptember 30 and are designated by the calendar year in which they end.
Numbers in the text and exhibits may not add up to totals because of roun
Additional data are posted with this report on the Congressional Budget O
CBO
Summary and Introduction 1
How Much of DoD’s F 1
What Are the Trends in 2
Which Activities Have E 2
CBO’s Approach to Analyzin 3
CBO’s Categorization S 4
Benefits of CBO’s Cate 5
How This Report Is Organiz 6
Trends in Spending for Ope 7
Exhibits 8–13
Funding for Operation and 14
Exhibits 15–18
Growth in Spending for Ope 19
Exhibits 20–23
Growth in Spending for O&M 24
Exhibits 25–28
About This Document 29
Contents
unding Is for O&M?
O&M Funding?
xperienced Significant Growth in O&M Funding?
g the Growth in O&M Funding
cheme
gorization Scheme in Explaining Trends in O&M Funding
ed
ration and Maintenance Between 1980 and 2015
Maintenance by Category of Spending
ration and Maintenance Between 2000 and 2012, by Category
From 2000 to 2012 in Categories That Are Difficult to Track
CBO
Exhibit Page
1. DoD’s Base Budget 8
2. DoD’s Appropriatio 9
3. DoD’s Total Fundin 10
4. Funding for Operati ty Service Members, 1980 to 2015 11
5. Funding for Operati 1980 to 2015 12
6. Operation and Main Base Budget, 1980 to 2015 13
7. Purchases Funded T by Activity, Commodity Class, a 15
8. Purchases Funded T by Commodity Class, Commodity, and Pr 16
9. The Amount of Goo vider or Source 17
10. Flows Within DoD’ 18
11. Growth in Funding s of Inflation 20
12. Share of Growth in ory and DoD Component 21
13. Growth in Base-Bud y 22
by Typ
n Acco
g for O
on and
on and
tenanc
hroughnd Pro
hroughovider
ds and
s Work
for Op
Base-Bu
get Fun
e of A
unts
pera
Mai
Mai
e Fun
DoDvider
DoD
Serv
ing C
eratio
dget
ding
ppro
as a P
tion
ntena
ntena
ding
’s B
’s B
ices P
apita
n an
Fun
for O
priation
ercentag
and Mai
nce in D
nce in th
for Def
ase-Budg
ase-Budg
urchased
l Funds
d Maint
ding for
peratio
Li
, 198
e of I
ntena
oD’s
e Se
ensew
et Ap
et Ap
Wit
enanc
Oper
n and
st o
0 to 201
ts Base B
nce, by
Base Bu
rvices’ B
ide Org
propria
propria
h Opera
e Betwe
ation an
Mainte
f Ex
5
udget, 1
Military
dget in
ase Budg
anization
tion for
tion for O
tion and
en 2000
d Maint
nance F
hib
980 to
Service,
Relation
ets per A
s, Progr
Operatio
peratio
Mainte
and 201
enance F
rom 200
its
2015
1980
to th
ctive
ams,
n an
n an
nance
2, Af
rom
0 to
to 2
e Nu
-Dut
and
d Ma
d Ma
Fun
ter R
2000
2012
015
mber
y Ser
Activ
inten
inten
ds in
emov
to 2
, by T
of A
vice M
ities in
ance
ance
2012
ing th
012, b
ype o
ctive-Du
ember,
DoD’s
in 2012,
in 2012,
, by Pro
e Effect
y Categ
f Activit
CBO
LIST OF EXHIBITS III
Exhib Page
14 2000 to 2012 23
15 ose 25
16 egory 26
17 From 2000 to 2012, 27
18 nce From 2000 to 2012 28
it
. G
. PoT
. G
. Gby
. G
rowth in
rtions ohat Are
rowth in
rowth in Comm
rowth in
Defe
f BasNot E
Base
the Nodity
Base
nsewide
e-Budgeasily Tr
-Budget
ot-Eas
-Budget
Organizations’ Base-Budget Funding for Operation and Maintenance From
t Funding for Operation and Maintenance That Are Well Understood and Thacked
Funding for Operation and Maintenance From 2000 to 2012, by Major Cat
ily-Tracked Portion of Base-Budget Funding for Operation and Maintenance
Operation and Maintenance Funding for Equipment and Property Maintena
CBO
ds f Defense
Summary and IThe Department of ’s) buconsists of appropri llowinposes: compensatin nnel; ding and purchasing ing bafacilities, and housi ing daoperations. The larg priatiogory in DoD’s base peratiomaintenance (O&M ch funto-day operations ra lth carequipment mainten
Over the past few d for Oincreased substantia for a g
ices; professional and other services; and pur-es of equipment not part of weapon systems.
Much of DoD’s Funding Is for O&M?015, about $200 billion (40 percent) of DoD’s budget of $500 billion was designated for ation and maintenance.2 Funding in the base get for each of the other major categories was h smaller—military personnel (27 percent); urement (19 percent); research, development, and evaluation, or RDT&E (13 percent); mil- construction (1 percent); and family housing
1. DoD’s base budget ent’s peaactivities; it does no ng for ocontingency operati rent OpFreedom’s Sentinel OperatInherent Resolve in less statwise, references to d his repoto DoD’s base budg ng for ocontingency operati
nless otherwise noted, all budget amounts in this ocument refer to funding in the respective fiscal years nd are expressed in fiscal year 2015 dollars of total bligational authority (TOA). DoD uses TOA to measure he funding available for its programs each year. TOA in a articular year differs in several ways from the budget uthority (the authority to incur financial obligations) rovided in appropriation acts for that year; most notably,
t incorporates unexpired budget authority from prior ears (which increases TOA in the current year). Even so, OA varies little from discretionary budget authority.
Tren
ntroduction Defense’s (DoDations for the fog military perso weapons; buildng; and supportest single appro
budget is the o) account, whi
nging from heaance.1
ecades, fundinglly, accounting
funds the departmt include the fundions such as the curin Afghanistan and Iraq and Syria. Unefense funding in tet, excluding fundions.
systems, and property; technical and research T
evelop-ses, y-to-day n cate-n and ds day-e to
&M has rowing
Members of Congress and the defense community at large have expressed concerns about this portion of DoD’s budget. However, efforts to identify the activities that have contributed significantly to the growth in spending are complicated by the diverse nature of the goods and services purchased with O&M funds and limitations associated with available data. Nevertheless, the Congressional Budget Office’s analysis indicates that increased funding for large and familiar categories, such as the military health care system, civilian pay, and fuel, accounts for about 60 percent of the long-term growth in O&M funding; varied smaller and lesser-known activities, such as contracted services and the operations of small DoD agencies, account for the remaining 40 percent. Of those varied and lesser-known activities, funding increased signifi-cantly for the maintenance of equipment, weapon
HowIn 2baseoperbudmucproctest,itary
cetime verseas eration ion ed other-rt pertain verseas
2. Udaotpapiy
in Spending by the Department ofor Operation and Maintenance
dget g pur-
share of DoD’s budget. That growth has occurred even as the number of active-duty military person-nel has remained flat or declined. Consequently,
servchas
CBO
SUM RTMENT OF DEFENSE FOR OPERATION AND MAINTENANCE 2
(0buO&(O($5ComototforDo
Fupunuanorfuncivranraning
e Health Program, the Office of the ry of Defense, the Joint Chiefs of Staff, Operations Command, and other organiza-at support the services.) The increase in
funding across DoD has occurred at the ime that the number of military personnel er stayed relatively flat or fallen. As a result,
spending for each active-duty service er has risen even faster, on average, than the budget; such spending accelerated after In general, growing O&M spending means wer resources are available for other defense particularly in periods of fiscal constraint.
Activities Have Experienced Significant h in O&M Funding?nalysis, CBO was able to identify programs tivities that have experienced significant es in O&M funding; but in many cases, the was not able to explain the reasons for that with the data DoD routinely provides the
ess. More detailed information about spe-ograms would be required for such analysis.
g for O&M in DoD’s base budget increased ut $64 billion between 2000 and 2012.6 detailed analysis of data for those two years, etermined that about 60 percent of that could be explained by changes in three
ategories—medical care for service mem-ilitary retirees, and their families; civilian
nsation; and fuel:
3.
4.ding for O&M between 2000 and 2012 is expressed scal year 2012 dollars using the gross domestic prod-price deflator.
ment, weapon systems, and buildings are funded from the accounts for RDT&E, procurement, and military construction or family housing, respectively.
5. Inflation adjustments in CBO’s analysis were performed using the gross domestic product price deflator.
in fiuct
ds to pay the salaries and benefits of most of its ilian employees and to purchase goods that ge from jet fuel to paper clips and services that ge from information technology to housekeep-.4 That diversity makes it difficult to determine
1980 and 2015. To identify the activities responsi-ble for most of that growth, CBO conducted a more detailed analysis of the growth in funding that occurred between 2000 and 2012—two years for which data with sufficient detail were available.
In real terms (that is, with adjustments to remove the effects of inflation), O&M funding has grown fairly steadily since 1980 and, over that time, taken up an increasing share of DoD’s base budget.5 O&M funding in each of the service branches (including both the active-duty component and reserves) has also increased in the past several years; O&M funding in defensewide organizations has increased at an even faster pace. (Defensewide organizations include various defense agencies and smaller independent organizations, the
In its aand acincreasagencygrowthCongrcific pr
Fundinby aboFrom aCBO dgrowthlarge cbers, mcompe
The military personnel appropriation provides for the pay and allowances of service members and the funds DoD sets aside for their retirement. The procurement appropri-ation pays for the purchase of major weapon systems such as aircraft and combat vehicles and the weapons that they carry. The RDT&E appropriation funds various research activities aimed at creating new technologies and applying them to defense programs. The military construction and family housing appropriations provide for the construc-tion of buildings and facilities and for housing units for service members.
Other goods and services such as technology develop-6. Fun
MARY AND INTRODUCTION TRENDS IN SPENDING BY THE DEPA
.2 percent).3 Although not part of DoD’s base dget (and thus not the focus of this report),
M funding for overseas contingency operations CO) also accounted for a significant share 1 billion, or 80 percent) of the $64 billion the ngress appropriated to DoD for OCO in 2015, stly for the wars in Iraq and Afghanistan. In al, funding for O&M (in the base budget and OCO) accounted for about 50 percent of D’s appropriations in 2015.
nding for operation and maintenance is used to rchase a wide range of goods and services—mbering in the thousands—and those goods d services are often acquired in small quantities at relatively small unit cost. DoD uses O&M
why spending is rising and to formulate approaches to slow that growth. In contrast, growth in funding for larger programs, such as those pertaining to major weapon systems or military pay, is more easily understood. For instance, DoD’s appropria-tion for procurement funds fewer than 100 major programs (as well as several hundred smaller pro-grams), each of which has separate accounting and reporting procedures; consequently, problems with cost growth in each of those programs are easier to identify.
What Are the Trends in O&M Funding?To provide context for the scale of growth in O&M funding, CBO examined trends in that appropriation for DoD’s base budget between
DefensSecretaSpecialtions thO&Msame thas eithO&MmembO&M1991. that feneeds,
WhichGrowt
CBO
SUM RTMENT OF DEFENSE FOR OPERATION AND MAINTENANCE 3
B
B
B
HeincCoof bytarcivincbypa
dities), and providers of the goods and s.
, CBO calculated the growth in funding for during that period and apportioned that into the relevant categories. The exhibits llow provide more details on how much of wth in funding is attributable to each y.
om the O&M budget justification books h service provided a starting point for devel-the CBO-defined categories.8 In those the services report their O&M spending common set of four budget activities (BAs): ing Forces (BA-01); Mobilization (BA-02); g and Recruiting (BA-03); and Administra-d Service-wide Activities (BA-04). Each activity is further subdivided into subactiv-ups (SAGs). For example, the Training and ting budget activity contains a SAG for t training” and SAGs for other training- activities and recruiting activities. For each he services report the particular goods and s purchased using four-digit “object class”
alysis conducted in this report was possible cause the Office of the Secretary of Defense
e services provided CBO with data that are tinely available in the department’s regular
7.
get justification books are detailed materials itted to the Congress annually that provide
itional information to support the President’s get. They can be obtained from DoD’s website at ://go.usa.gov/x927r.
funds (including a further breakdown of specific and Growth in DoD’s Budget From 2000 to 2014 (November 2014), www.cbo.gov/publication/49764.
budhttp
ngress in the early 2000s and the increased use health care services, which has been encouraged the relatively low out-of-pocket costs that mili-y retirees and their families incur. Spending for ilian compensation grew largely because of reases in both the number of civilians employed DoD and the cost per civilian (brought about in rt by legislated pay raises).7 Finally, spending for
erty; technical and research services; professional and other services; and purchases of equipment. However, CBO could not assess the causes of that growth in more detail because sufficient data were not available.
CBO’s Approach to Analyzing the Growth in O&M FundingConducting the more detailed analysis of the growth in funding for O&M that occurred between 2000 and 2012 involved two main steps.
First, using the budget data that DoD provides to the Congress with its annual budget request, CBO grouped the data elements into broad categories to help identify trends. The categories CBO defined focus on activities performed or functions pro-vided, goods and services purchased with O&M
Trainintion anbudgetity groRecrui“recruirelatedSAG, tservicecodes.
The anonly beand thnot rou
For more information on the changes in benefits and the associated costs of providing health care to military personnel and their families, see Congressional Budget Office, Approaches to Reducing Federal Spending on Military Health Care (January 2014), www.cbo.gov/ publication/44993.
The growth in civilian compensation is discussed in Congressional Budget Office, Long-Term Implications of the 2017 Future Years Defense Program (forthcoming),
8. Budsubmadd
MARY AND INTRODUCTION TRENDS IN SPENDING BY THE DEPA
O&M spending for health care for military personnel and their families increased by about $15 billion (from $16 billion to $31 billion), representing roughly 25 percent of the increase in the O&M budget.
Spending for civilian compensation (excluding compensation for civilians who provide health care) increased by $17 billion (from $31 billion to $48 billion).
Spending for fuel increased by $5 billion (from $3 billion to $8 billion).
alth care spending rose for several reasons, luding expanded benefits authorized by the
fuel increased because of the substantial increase in fuel prices during the period.
By contrast, the causes of the remaining 40 percent (or about $25 billion) of the growth in O&M funding during the same period are not well under-stood. To help shed some light on the reasons for growth in those less-understood categories, CBO categorized O&M data for 2000 and 2012 in sev-eral different ways to identify some of the other sources of growth in O&M funding. CBO’s analy-sis indicates that those other areas that experienced significant growth are not directly associated with combat forces and include administrative and infrastructure-related activities, such as the mainte-nance of equipment, weapon systems, and prop-
commoservice
SecondO&Mgrowththat fothe grocategor
Data frfor eacoping books,using aOperat
CBO
SUM RTMENT OF DEFENSE FOR OPERATION AND MAINTENANCE 4
andaanfrocauwiCoallin rep
CBTouscoO&peityCB
Acanfunsu
FomideeacArunth
n Compensation. Includes spending for the d benefits of DoD’s civilian employees compensation is funded through the O&M riation (except for those employees whose d benefits are funded through defense work-ital funds, or WCFs). About 75 percent ’s civilian employees are paid directly
&M funding, and another 15 percent are rough the defense WCFs (discussed .11
Includes spending for goods and services ed overseas or from intragovernmental , items that DoD categorizes as “other pur- in its budget data. It also includes spending cellaneous items such as insurance claims emnities and postal services. Because of the ly small amount and miscellaneous nature ding in this category, some exhibits omit it.
odity. An extension of the “commodity-ategory, this grouping further breaks down ng for goods and services into nine smaller ies:
ent; and Supplies and Materials. Account for nding for almost all of the “goods” in the dity-class grouping.
9.
use the purpose of civilian compensation is to obtain labor services of DoD’s civilian employees, it arguably d be grouped with the “services” commodity class. could not use such a grouping because the budget
fication documents provided by the military services ivilian compensation separately and distinctly from hased services. However, CBO was able to allocate ian compensation into the various categories of ivity.”
which is funded from the military personnel appropria-tion rather than the O&M appropriation.
Squadrons, which transport personnel and equipment using large transport aircraft.
civil“act
rspectives: activity, commodity class, commod-, and provider. (The table below summarizes O’s categorization scheme.)
tivity. For the purposes of CBO’s analysis, “activity” is defined in terms of the type of ction being performed. CBO defined five
ch categories:
rces. Includes spending for units whose primary ssion is to directly engage in offensive and fensive combat operations.9 Such units include h service branch’s major combat units (the
my’s infantry brigades, for example) and those its that support them with combat arms (such as e Army’s artillery and air defense brigades).10
Commodity Class. This grouping categorizes the types of goods and services funded through DoD’s O&M appropriation. It includes five categories:
Goods.Represents purchases of physical products such as fuel and equipment.
Services. Includes spending for transportation, technical support, research, and other services.
Property. Includes spending related to facilities, such as rental payments to government agencies (for instance, the General Services Administration) and private landlords.
and indrelativeof spen
Commclass” cspendicategor
Equipmthe specommo
As is the case with all of the categories, the amounts exclude the pay for the service members in those units,
10. This category also includes the Air Force’s Airlift
11. Becathe coulCBOjustilist cpurc
MARY AND INTRODUCTION TRENDS IN SPENDING BY THE DEPA
nual reports to the Congress. However, those ta still had limitations, including many vague d large “other” categories that prevented CBO m answering important questions about the ses of growth in O&M spending. A database
thout those limitations that was provided to the ngress with DoD’s budget each year would
ow such analysis to be undertaken routinely and more detail than CBO was able to do for this ort.
O’s Categorization Scheme analyze growth between 2000 and 2012, CBO
ed the SAGs and their associated object class des to sort costs into four main groups that allow
M spending to be examined from different
Support and Individual Training. Includes spending for units that provide specialized functional support (such as military intelligence) to combat forces as well as for units that provide general sup-port (such as equipment maintenance and logis-tics). The category also includes spending for service members’ individual training.
Administration. Encompasses spending for admin-istration, management, information technology, office communications, and similar functions.
Infrastructure. Includes spending for operating and maintaining bases and facilities.
Health Care. Encompasses spending for activities of the Defense Health Program.
Civiliapay anwhose approppay aning capof DoDwith Opaid thbelow)
Other.obtainsourceschases”for mis
CBO
SUM RTMENT OF DEFENSE FOR OPERATION AND MAINTENANCE 5
ManSerUnvic
Prsou
Prcogodepr
DespaggoDe
Civilian Employees. Accounts for the com-ion of DoD’s civilian employees (excluding mployees whose pay and benefits are funded h WCFs), whose services make up the single component of the government as a er of goods and services.
ts of CBO’s Categorization Scheme in ning Trends in O&M Fundingtrated in Exhibits 7 and 8, those main
ngs—activity, commodity class, commod- provider—are interconnected, reflecting plexity of O&M spending. Nevertheless,
e the categories in each group have common tes (types of activities or types of goods and s, for example), they allow a deeper exam- of trends. They can be combined in a way ables CBO to reach this type of insight: A ty of funding for O&M in 2012 was used port and individual training (as opposed to
s, training,
es, property-related
equipment, l services
, defense working government , the Department of
es
MARY AND INTRODUCTION
CBO’s Categorization Sch
edical; Maintenance; Transportation; Technical d Research Services; Professional and Other vices; Installation Support; and Other and categorized. Account for spending for all “ser-es” described in the commodity-class grouping.
ovider. For this category, CBO identified four rces of goods and services:
ivate Sector. Represents spending for private mpanies under contract with DoD to provide ods and services, but excludes spending through fense WCFs to purchase goods and services from ivate companies.
fense Working Capital Funds. Accounts for ending by specific organizations in both defense encies and the military departments that supply ods and services to other DoD organizations. fense WCFs are comparable to an internal
mpDeC“tme
OtaepapHa
Category Des
Activity The
Commodity Class Typ
Commodity Fur
Provider Sou
s other government agencies. majorifor sup
arketplace in which organizations within DoD urchase goods and services from one another. oD organizations that are funded by WCFs gen-
rally do not receive direct appropriations from the ongress. Instead, they obtain “revenues” from
customers” (other DoD organizations) to whom hey “sell” goods and services. The WCF arrange-ent is intended to make support costs more
xplicit to the purchaser.
ther Government Agencies. Accounts for spending o acquire goods and services from government gencies and organizations outside of DoD. For xample, the General Services Administration rovides some land-related management services, nd the Centers for Medicare & Medicaid Services rovide some medical products to the Defense ealth Program. CBO categorizes those sources
DoD’s pensatthose ethrouglargest provid
BenefiExplaiAs illusgroupiity, andthe combecausattribuserviceinationthat en
TRENDS IN SPENDING BY THE DEPA
eme
cription Examples
type of function being performed Spending for combat forceadministration, health care
es of purchases Spending for goods, servicmanagement
ther delineation of types of purchases Spending for maintenance,transportation, professiona
rces of goods and services Spending for private sectorcapital funds, nondefense agencies and organizationsDefense’s civilian employe
CBO
SUM TRENDS IN SPENDING BY THE DEPARTMENT OF DEFENSE FOR OPERATION AND MAINTENANCE 6
fun its), mu es pr
HoEx ding for the gro nd co ion cat hose coele my,
Air Force, Navy, and Marine Corps—and defense-wide agencies and programs. (The latter are some-times treated within this report as a single entity that is parallel with the four service branches.) This section also considers O&M costs per active-duty service member during the same period.
Exhibits 7 through 9 present O&M funding in 2012 in terms of the categories CBO defined to group the diverse activities, goods, and services for which such funding is used. Exhibit 10 examines flows of funding through DoD’s working capital funds.
Exhibits 11 through 14 examine the growth in O&M funding for all of DoD and its components between 2000 and 2012 using the CBO-defined categories.
Exhibits 15 through 18 analyze the growth in O&M funding for all of DoD in greater detail, breaking down that growth into the portion that might be deemed “well understood” and the portion that is relatively “less understood” or “not easily tracked.”
MARY AND INTRODUCTION
ctions directly related to major combat unch of which was carried out through servic
ovided by the private sector.
w This Report Is Organizedhibits 1 through 6 provide details about fun O&M in DoD’s base budget, examining wth in funding between 1980 and 2015 a
mparing it with growth in other appropriategories and among DoD’s components. Tmponents include the active and reserve ments of the four service branches—the Ar
CBO
nds in Spending for Operation and intenance Between 1980 and 2015
TreMa
CBO
TRE THE DEPARTMENT OF DEFENSE FOR OPERATION AND MAINTENANCE 8
Exh
DoBill
Sou
Do nt Op
RD
a.
20150
100
200
300
400
500
600
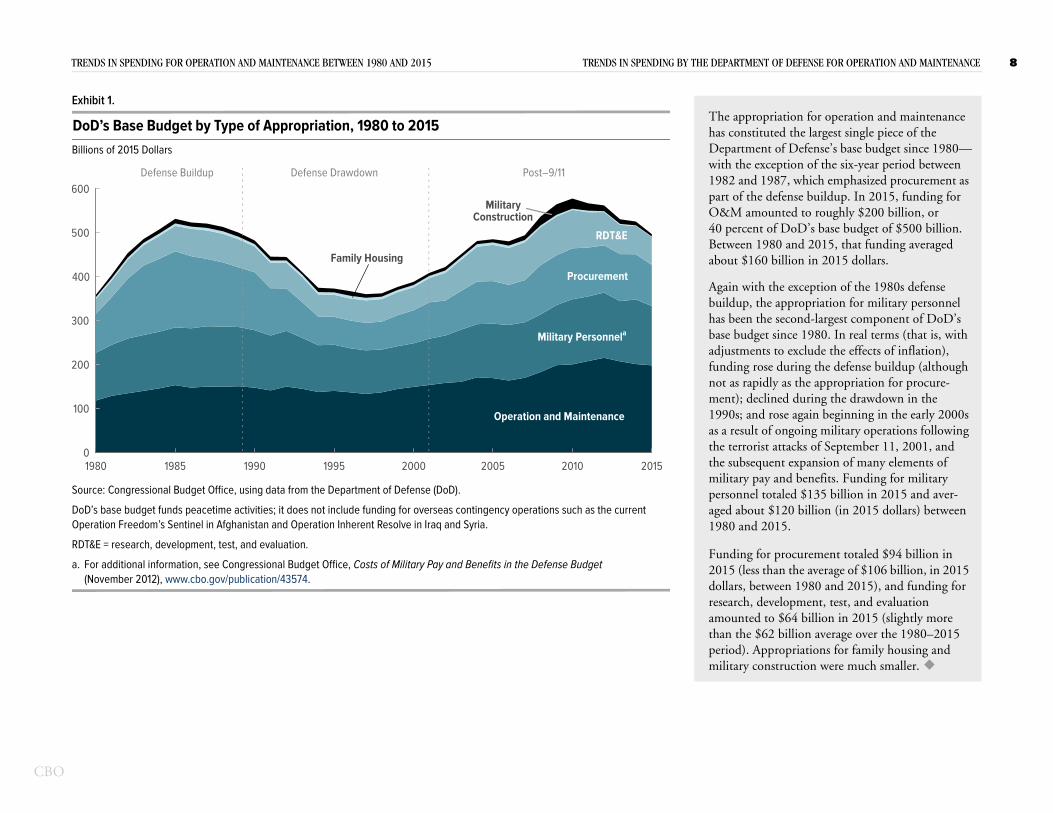
The appropriation for operation and maintenance has constituted the largest single piece of the Department of Defense’s base budget since 1980—with the exception of the six-year period between 1982 and 1987, which emphasized procurement as part of the defense buildup. In 2015, funding for O&M amounted to roughly $200 billion, or 40 percent of DoD’s base budget of $500 billion. Between 1980 and 2015, that funding averaged about $160 billion in 2015 dollars.
Again with the exception of the 1980s defense buildup, the appropriation for military personnel has been the second-largest component of DoD’s base budget since 1980. In real terms (that is, with adjustments to exclude the effects of inflation), funding rose during the defense buildup (although not as rapidly as the appropriation for procure-ment); declined during the drawdown in the 1990s; and rose again beginning in the early 2000s as a result of ongoing military operations following the terrorist attacks of September 11, 2001, and the subsequent expansion of many elements of military pay and benefits. Funding for military personnel totaled $135 billion in 2015 and aver-aged about $120 billion (in 2015 dollars) between 1980 and 2015.
Funding for procurement totaled $94 billion in 2015 (less than the average of $106 billion, in 2015 dollars, between 1980 and 2015), and funding for research, development, test, and evaluation amounted to $64 billion in 2015 (slightly more than the $62 billion average over the 1980–2015 period). Appropriations for family housing and military construction were much smaller.
rce: Congressional Budget Office, using data from the Department of Defense (DoD).
D’s base budget funds peacetime activities; it does not include funding for overseas contingency operations such as the curreeration Freedom’s Sentinel in Afghanistan and Operation Inherent Resolve in Iraq and Syria.
T&E = research, development, test, and evaluation.
For additional information, see Congressional Budget Office, Costs of Military Pay and Benefits in the Defense Budget (November 2012), www.cbo.gov/publication/43574.
1980 1985 1990 1995 2000 2005 2010
Operation and Maintenance
NDS IN SPENDING FOR OPERATION AND MAINTENANCE BETWEEN 1980 AND 2015 TRENDS IN SPENDING BY
ibit 1.
D’s Base Budget by Type of Appropriation, 1980 to 2015ions of 2015 Dollars
Military Personnela
Procurement
RDT&E
Family Housing
MilitaryConstruction
Defense Buildup Defense Drawdown Post–9/11
CBO
TRE 2015 TRENDS IN SPENDING BY THE DEPARTMENT OF DEFENSE FOR OPERATION AND MAINTENANCE 9
Exh
Do ase Budget, 1980 to 2015Per
Sou
Do he current Op
RD
1 20150
10
20
30
40
Operation andMaintenance
Military Personnel
Procurement
RDT&E
MilitaryConstruction
Post–9/11
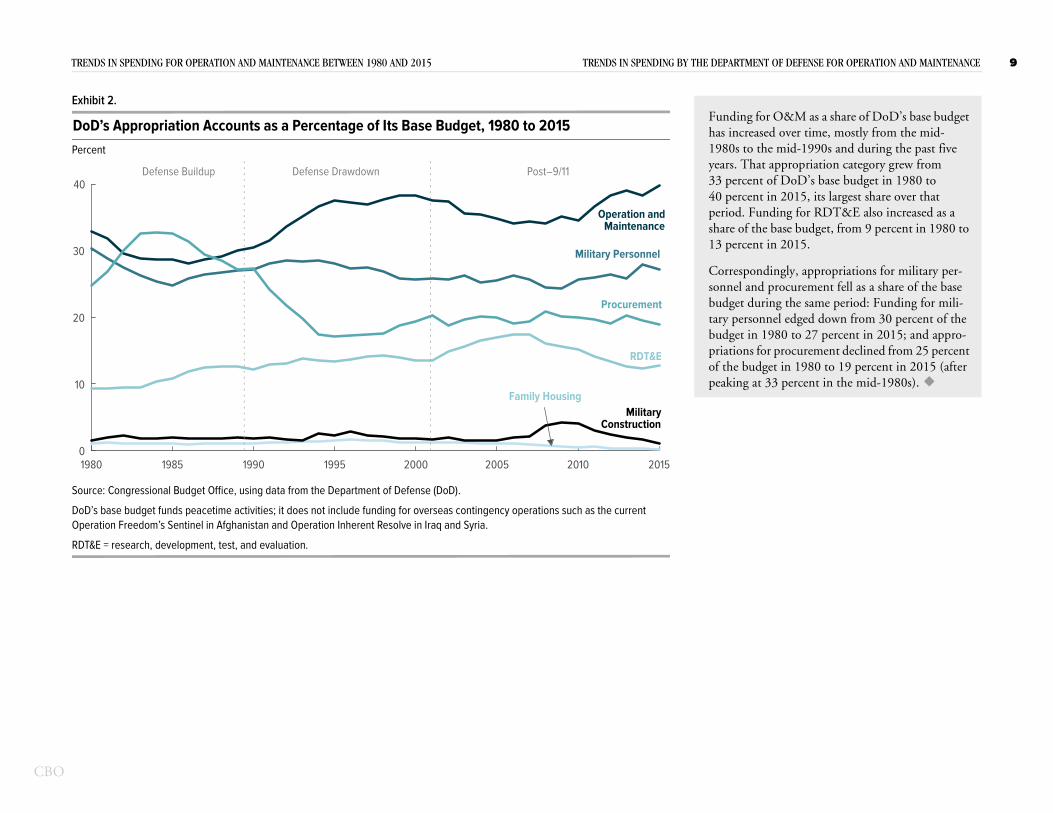
Funding for O&M as a share of DoD’s base budget has increased over time, mostly from the mid-1980s to the mid-1990s and during the past five years. That appropriation category grew from 33 percent of DoD’s base budget in 1980 to 40 percent in 2015, its largest share over that period. Funding for RDT&E also increased as a share of the base budget, from 9 percent in 1980 to 13 percent in 2015.
Correspondingly, appropriations for military per-sonnel and procurement fell as a share of the base budget during the same period: Funding for mili-tary personnel edged down from 30 percent of the budget in 1980 to 27 percent in 2015; and appro-priations for procurement declined from 25 percent of the budget in 1980 to 19 percent in 2015 (after peaking at 33 percent in the mid-1980s).
rce: Congressional Budget Office, using data from the Department of Defense (DoD).
D’s base budget funds peacetime activities; it does not include funding for overseas contingency operations such as teration Freedom’s Sentinel in Afghanistan and Operation Inherent Resolve in Iraq and Syria.
T&E = research, development, test, and evaluation.
980 1985 1990 1995 2000 2005 2010
Family Housing
NDS IN SPENDING FOR OPERATION AND MAINTENANCE BETWEEN 1980 AND
ibit 2.
D’s Appropriation Accounts as a Percentage of Its Bcent
Defense Buildup Defense Drawdown
CBO
TRE ENT OF DEFENSE FOR OPERATION AND MAINTENANCE 10
Exh
DoBill
Sou
DoOp
“ToSupfor
Detheser
a.
5
10
15
20
25
30
35
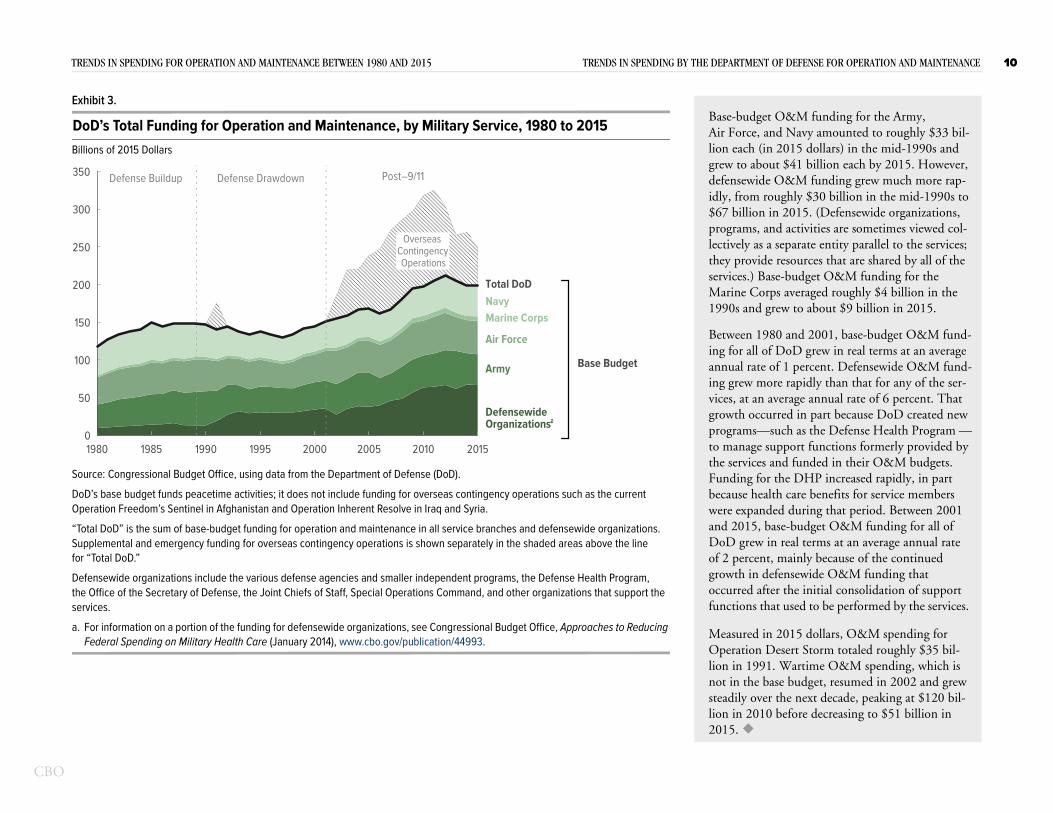
get O&M funding for the Army, e, and Navy amounted to roughly $33 bil- (in 2015 dollars) in the mid-1990s and
about $41 billion each by 2015. However, ide O&M funding grew much more rap- roughly $30 billion in the mid-1990s to
on in 2015. (Defensewide organizations, s, and activities are sometimes viewed col-as a separate entity parallel to the services; vide resources that are shared by all of the Base-budget O&M funding for the orps averaged roughly $4 billion in the
d grew to about $9 billion in 2015.
1980 and 2001, base-budget O&M fund-ll of DoD grew in real terms at an average ate of 1 percent. Defensewide O&M fund-
ing grew more rapidly than that for any of the ser-vices, at an average annual rate of 6 percent. That growth occurred in part because DoD created new programs—such as the Defense Health Program —to manage support functions formerly provided by the services and funded in their O&M budgets. Funding for the DHP increased rapidly, in part because health care benefits for service members were expanded during that period. Between 2001 and 2015, base-budget O&M funding for all of DoD grew in real terms at an average annual rate of 2 percent, mainly because of the continued growth in defensewide O&M funding that occurred after the initial consolidation of support functions that used to be performed by the services.
Measured in 2015 dollars, O&M spending for Operation Desert Storm totaled roughly $35 bil-lion in 1991. Wartime O&M spending, which is not in the base budget, resumed in 2002 and grew steadily over the next decade, peaking at $120 bil-lion in 2010 before decreasing to $51 billion in 2015.
rce: Congressional Budget Office, using data from the Department of Defense (DoD).
D’s base budget funds peacetime activities; it does not include funding for overseas contingency operations such as the current eration Freedom’s Sentinel in Afghanistan and Operation Inherent Resolve in Iraq and Syria.
tal DoD” is the sum of base-budget funding for operation and maintenance in all service branches and defensewide organizations. plemental and emergency funding for overseas contingency operations is shown separately in the shaded areas above the line
“Total DoD.”
fensewide organizations include the various defense agencies and smaller independent programs, the Defense Health Program, Office of the Secretary of Defense, the Joint Chiefs of Staff, Special Operations Command, and other organizations that support the vices.
For information on a portion of the funding for defensewide organizations, see Congressional Budget Office, Approaches to Reducing Federal Spending on Military Health Care (January 2014), www.cbo.gov/publication/44993.
Army
DefensewideOrganizations
1980 1985 1990 1995 2000 2005 2010 20150
0
a
NDS IN SPENDING FOR OPERATION AND MAINTENANCE BETWEEN 1980 AND 2015 TRENDS IN SPENDING BY THE DEPARTM
ibit 3.
D’s Total Funding for Operation and Maintenance, by Military Service, 1980 to 2015ions of 2015 Dollars
NavyMarine Corps
Air Force
Total DoD
Defense Buildup Defense Drawdown
0
0
0
0
0
0
OverseasContingency Operations
Post–9/11
Base Budget
Base-budAir Forclion eachgrew to defensewidly, from$67 billiprogramlectively they proservices.)Marine C1990s an
Betweening for aannual r
CBO
TRE PARTMENT OF DEFENSE FOR OPERATION AND MAINTENANCE 11
Exh
FuNu
Sou
DoOp
O&
a.
5
10
15
20
250
4
8
12
16
Tho
Bill
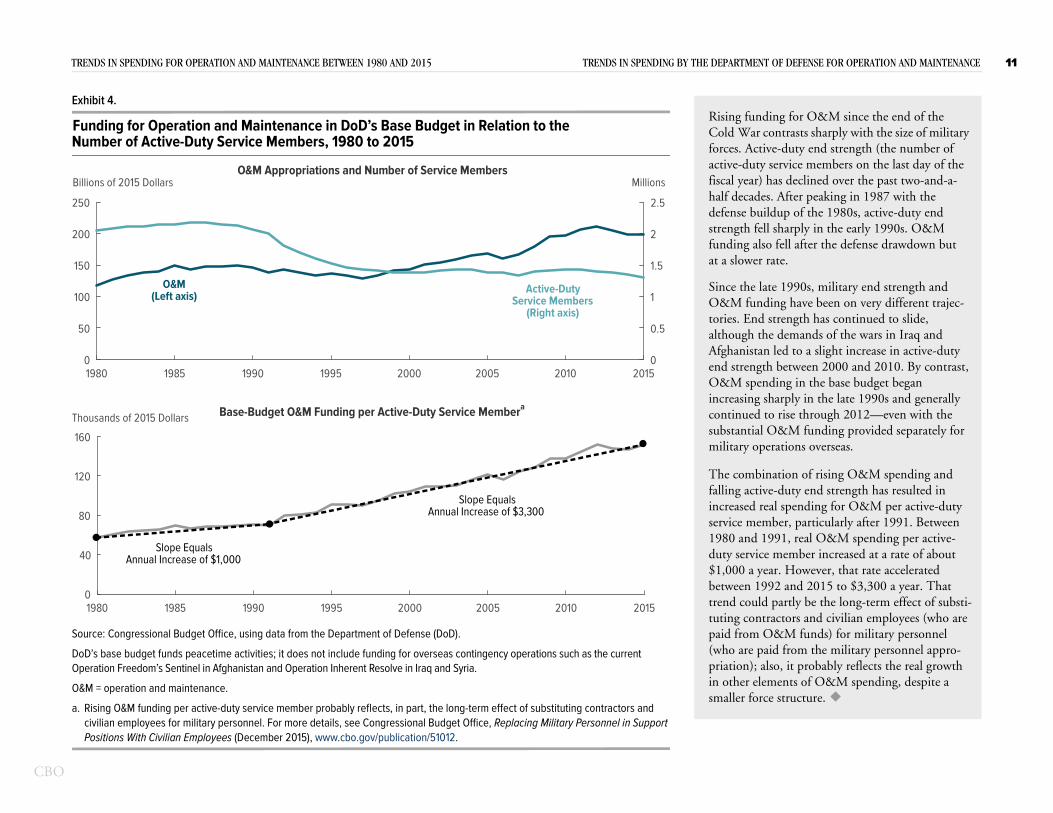
sing funding for O&M since the end of the ld War contrasts sharply with the size of military
rces. Active-duty end strength (the number of tive-duty service members on the last day of the cal year) has declined over the past two-and-a-lf decades. After peaking in 1987 with the fense buildup of the 1980s, active-duty end ength fell sharply in the early 1990s. O&M nding also fell after the defense drawdown but a slower rate.
nce the late 1990s, military end strength and &M funding have been on very different trajec-ries. End strength has continued to slide, hough the demands of the wars in Iraq and ghanistan led to a slight increase in active-duty d strength between 2000 and 2010. By contrast,
ding in the base budget began arply in the late 1990s and generally rise through 2012—even with the &M funding provided separately for
rations overseas.
ation of rising O&M spending and -duty end strength has resulted in l spending for O&M per active-duty ber, particularly after 1991. Between 91, real O&M spending per active-
member increased at a rate of about r. However, that rate accelerated 2 and 2015 to $3,300 a year. That partly be the long-term effect of substi-actors and civilian employees (who are &M funds) for military personnel
id from the military personnel appro-so, it probably reflects the real growth
ents of O&M spending, despite a structure.
rce: Congressional Budget Office, using data from the Department of Defense (DoD).
D’s base budget funds peacetime activities; it does not include funding for overseas contingency operations such as the current eration Freedom’s Sentinel in Afghanistan and Operation Inherent Resolve in Iraq and Syria.
M = operation and maintenance.
Rising O&M funding per active-duty service member probably reflects, in part, the long-term effect of substituting contractors and civilian employees for military personnel. For more details, see Congressional Budget Office, Replacing Military Personnel in Support Positions With Civilian Employees (December 2015), www.cbo.gov/publication/51012.
1980 1985 1990 1995 2000 2005 2010 2015
1980 1985 1990 1995 2000 2005 2010 20150
0
0
0
0
Base-Budget O&M Funding per Active-Duty Service Membera
Slope EqualsAnnual Increase of $1,000
Slope EqualsAnnual Increase of $3,300
usands of 2015 Dollars
O&M spenincreasing shcontinued tosubstantial Omilitary ope
The combinfalling activeincreased reaservice mem1980 and 19duty service$1,000 a yeabetween 199trend could tuting contrpaid from O(who are papriation); alin other elemsmaller force
NDS IN SPENDING FOR OPERATION AND MAINTENANCE BETWEEN 1980 AND 2015 TRENDS IN SPENDING BY THE DE
ibit 4.
nding for Operation and Maintenance in DoD’s Base Budget in Relation to the mber of Active-Duty Service Members, 1980 to 2015
0
0
0
0
0
0
0.5
1
1.5
2
2.5
O&M(Left axis) Active-Duty
Service Members(Right axis)
O&M Appropriations and Number of Service Membersions of 2015 Dollars Millions
RiCofoacfishadestrfuat
SiOtoaltAfen
CBO
TRE TRENDS IN SPENDING BY THE DEPARTMENT OF DEFENSE FOR OPERATION AND MAINTENANCE 12
Exh
Fu AcTho
Sou
Thecur
O&
a.
b.
c.
10
25
50
75
100
125
150
Air Force
Navy and Marine Corpsa
Armyb
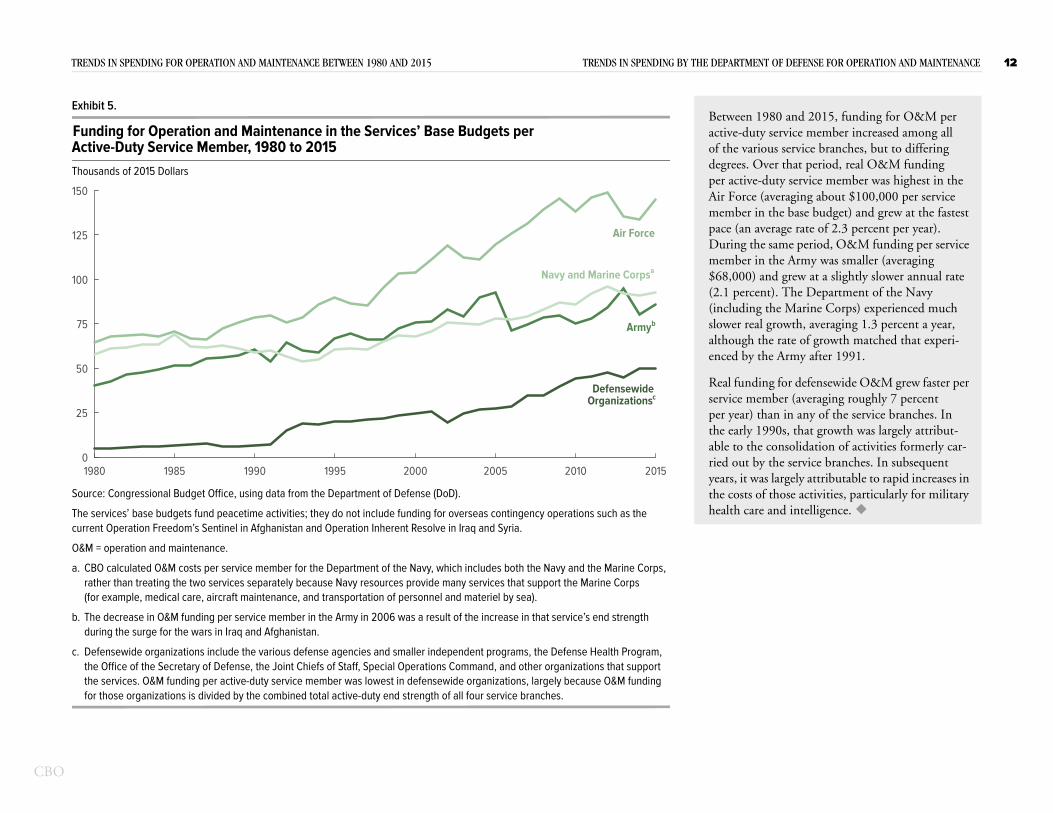
Between 1980 and 2015, funding for O&M per active-duty service member increased among all of the various service branches, but to differing degrees. Over that period, real O&M funding per active-duty service member was highest in the Air Force (averaging about $100,000 per service member in the base budget) and grew at the fastest pace (an average rate of 2.3 percent per year). During the same period, O&M funding per service member in the Army was smaller (averaging $68,000) and grew at a slightly slower annual rate (2.1 percent). The Department of the Navy (including the Marine Corps) experienced much slower real growth, averaging 1.3 percent a year, although the rate of growth matched that experi-enced by the Army after 1991.
g for defensewide O&M grew faster per ber (averaging roughly 7 percent
an in any of the service branches. In 90s, that growth was largely attribut-consolidation of activities formerly car- the service branches. In subsequent s largely attributable to rapid increases in those activities, particularly for military and intelligence.
rce: Congressional Budget Office, using data from the Department of Defense (DoD).
services’ base budgets fund peacetime activities; they do not include funding for overseas contingency operations such as the rent Operation Freedom’s Sentinel in Afghanistan and Operation Inherent Resolve in Iraq and Syria.
M = operation and maintenance.
CBO calculated O&M costs per service member for the Department of the Navy, which includes both the Navy and the Marine Corps, rather than treating the two services separately because Navy resources provide many services that support the Marine Corps (for example, medical care, aircraft maintenance, and transportation of personnel and materiel by sea).
The decrease in O&M funding per service member in the Army in 2006 was a result of the increase in that service’s end strength during the surge for the wars in Iraq and Afghanistan.
Defensewide organizations include the various defense agencies and smaller independent programs, the Defense Health Program, the Office of the Secretary of Defense, the Joint Chiefs of Staff, Special Operations Command, and other organizations that support the services. O&M funding per active-duty service member was lowest in defensewide organizations, largely because O&M funding for those organizations is divided by the combined total active-duty end strength of all four service branches.
980 1985 1990 1995 2000 2005 2010 2015
DefensewideOrganizationsc
Real fundinservice memper year) ththe early 19able to the ried out byyears, it wathe costs ofhealth care
NDS IN SPENDING FOR OPERATION AND MAINTENANCE BETWEEN 1980 AND 2015
ibit 5.
nding for Operation and Maintenance in the Services’ Base Budgets pertive-Duty Service Member, 1980 to 2015usands of 2015 Dollars
CBO
TRE E DEPARTMENT OF DEFENSE FOR OPERATION AND MAINTENANCE 13
Exh
OpAcBill
Sou
DoOp
a.
b.
190
20
40
60
80
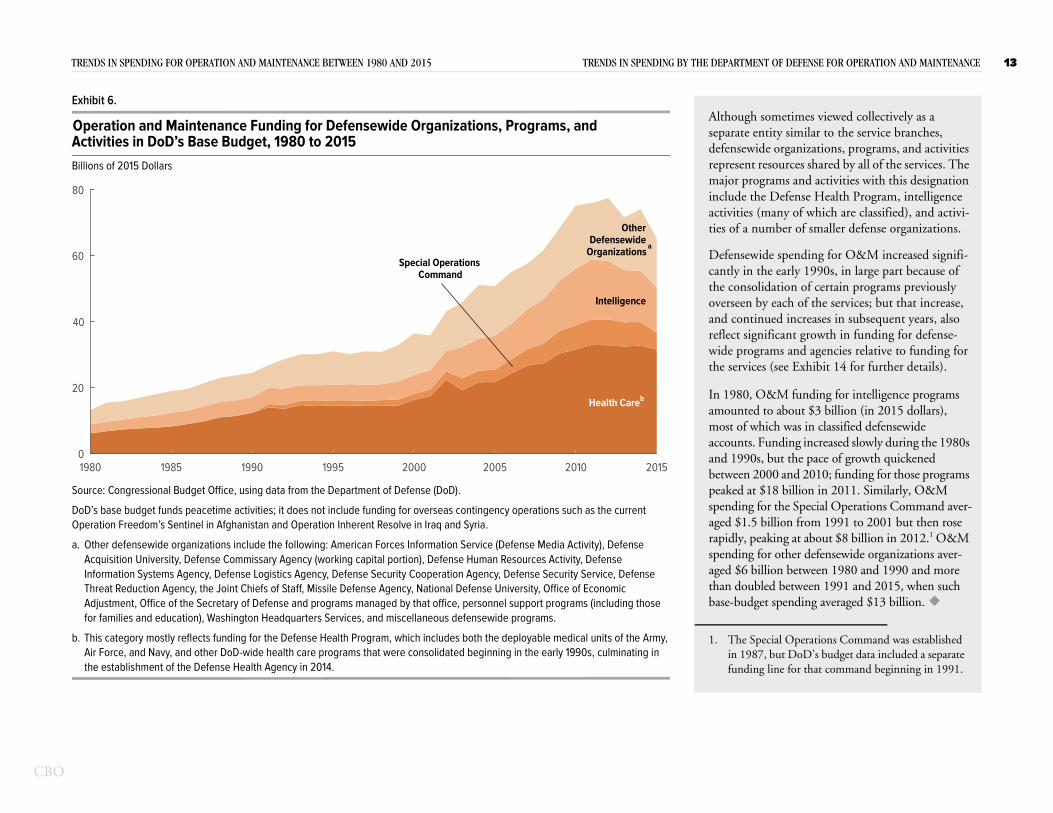
Although sometimes viewed collectively as a separate entity similar to the service branches, defensewide organizations, programs, and activities represent resources shared by all of the services. The major programs and activities with this designation include the Defense Health Program, intelligence activities (many of which are classified), and activi-ties of a number of smaller defense organizations.
Defensewide spending for O&M increased signifi-cantly in the early 1990s, in large part because of the consolidation of certain programs previously overseen by each of the services; but that increase, and continued increases in subsequent years, also reflect significant growth in funding for defense-wide programs and agencies relative to funding for the services (see Exhibit 14 for further details).
80, O&M funding for intelligence programs nted to about $3 billion (in 2015 dollars), of which was in classified defensewide nts. Funding increased slowly during the 1980s 990s, but the pace of growth quickened en 2000 and 2010; funding for those programs d at $18 billion in 2011. Similarly, O&M ing for the Special Operations Command aver-
$1.5 billion from 1991 to 2001 but then rose ly, peaking at about $8 billion in 2012.1 O&M ing for other defensewide organizations aver-
$6 billion between 1980 and 1990 and more doubled between 1991 and 2015, when such udget spending averaged $13 billion.
he Special Operations Command was established 1987, but DoD’s budget data included a separate nding line for that command beginning in 1991.
rce: Congressional Budget Office, using data from the Department of Defense (DoD).
D’s base budget funds peacetime activities; it does not include funding for overseas contingency operations such as the current eration Freedom’s Sentinel in Afghanistan and Operation Inherent Resolve in Iraq and Syria.
Other defensewide organizations include the following: American Forces Information Service (Defense Media Activity), Defense Acquisition University, Defense Commissary Agency (working capital portion), Defense Human Resources Activity, Defense Information Systems Agency, Defense Logistics Agency, Defense Security Cooperation Agency, Defense Security Service, Defense Threat Reduction Agency, the Joint Chiefs of Staff, Missile Defense Agency, National Defense University, Office of Economic Adjustment, Office of the Secretary of Defense and programs managed by that office, personnel support programs (including those for families and education), Washington Headquarters Services, and miscellaneous defensewide programs.
This category mostly reflects funding for the Defense Health Program, which includes both the deployable medical units of the Army, Air Force, and Navy, and other DoD-wide health care programs that were consolidated beginning in the early 1990s, culminating in the establishment of the Defense Health Agency in 2014.
80 1985 1990 1995 2000 2005 2010 2015
Health Careb In 19amoumost accouand 1betwepeakespendaged rapidspendaged than base-b
1. Tinfu
NDS IN SPENDING FOR OPERATION AND MAINTENANCE BETWEEN 1980 AND 2015 TRENDS IN SPENDING BY TH
ibit 6.
eration and Maintenance Funding for Defensewide Organizations, Programs, and tivities in DoD’s Base Budget, 1980 to 2015ions of 2015 Dollars
Special OperationsCommand
OtherDefensewide
Organizations
Intelligence
a
CBO
ing for Operation and Maintenance by Category of Spending
Fund
CBO
FUN ENT OF DEFENSE FOR OPERATION AND MAINTENANCE 15
Exh
Pu20Bill
Sou
DoDSen
Defanogoo
a.
b.
In
To
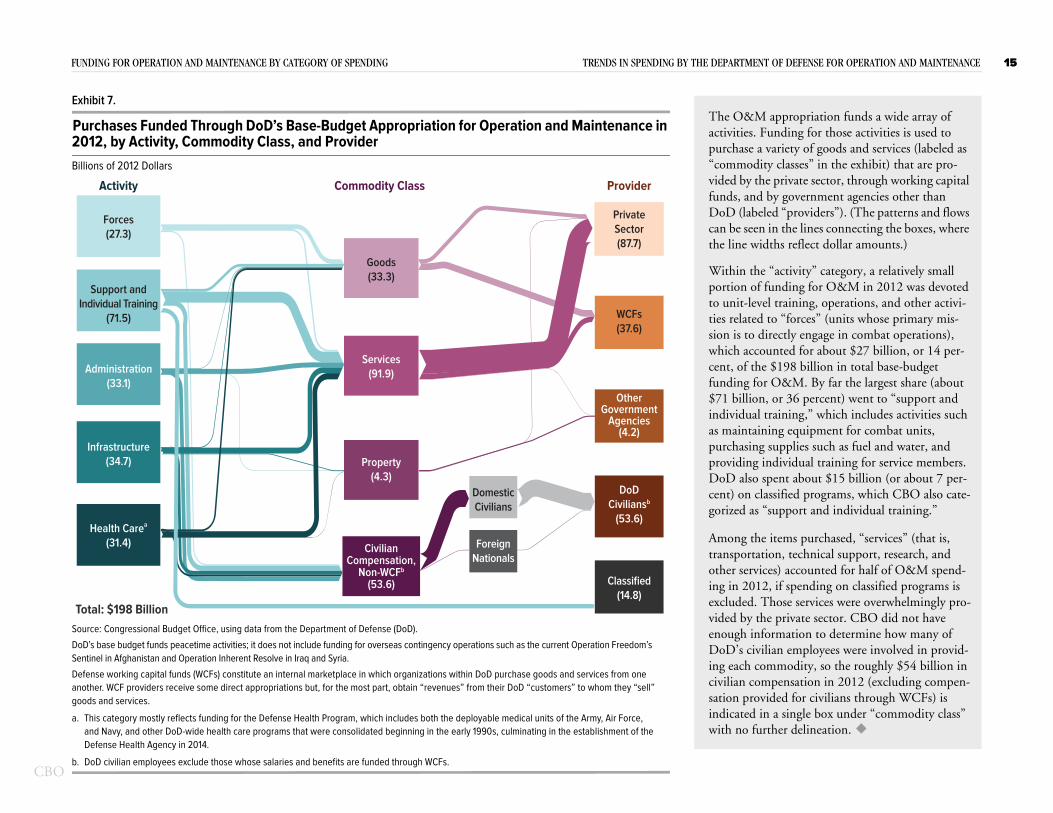
M appropriation funds a wide array of . Funding for those activities is used to a variety of goods and services (labeled as dity classes” in the exhibit) that are pro- the private sector, through working capital d by government agencies other than
beled “providers”). (The patterns and flows en in the lines connecting the boxes, where widths reflect dollar amounts.)
he “activity” category, a relatively small of funding for O&M in 2012 was devoted evel training, operations, and other activi-ed to “forces” (units whose primary mis- directly engage in combat operations), counted for about $27 billion, or 14 per-
the $198 billion in total base-budget . By far the largest share (about
6 percent) went to “support and g,” which includes activities such uipment for combat units, ies such as fuel and water, and ual training for service members. bout $15 billion (or about 7 per-
d programs, which CBO also cate-rt and individual training.”
s purchased, “services” (that is, chnical support, research, and counted for half of O&M spend-ending on classified programs is services were overwhelmingly pro-ate sector. CBO did not have ion to determine how many of
ployees were involved in provid-dity, so the roughly $54 billion in ation in 2012 (excluding compen-or civilians through WCFs) is gle box under “commodity class” elineation.
rce: Congressional Budget Office, using data from the Department of Defense (DoD).
’s base budget funds peacetime activities; it does not include funding for overseas contingency operations such as the current Operation Freedom’s tinel in Afghanistan and Operation Inherent Resolve in Iraq and Syria.
ense working capital funds (WCFs) constitute an internal marketplace in which organizations within DoD purchase goods and services from one ther. WCF providers receive some direct appropriations but, for the most part, obtain “revenues” from their DoD “customers” to whom they “sell” ds and services.
This category mostly reflects funding for the Defense Health Program, which includes both the deployable medical units of the Army, Air Force, and Navy, and other DoD-wide health care programs that were consolidated beginning in the early 1990s, culminating in the establishment of the Defense Health Agency in 2014.
DoD civilian employees exclude those whose salaries and benefits are funded through WCFs.
Health Carea
(31.4) CivilianCompensation,
Non-WCFb
(53.6)
DoD
Civiliansb
(53.6)
OtherGovernment
Agencies(4.2)
Property
(4.3)
Classified
(14.8)
Foreign
Nationals
Domestic
Civilians
(91.9)
Infrastructure
(34.7)
Administration
(33.1)
tal: $198 Billion
funding for O&M$71 billion, or 3individual traininas maintaining eqpurchasing supplproviding individDoD also spent acent) on classifiegorized as “suppo
Among the itemtransportation, teother services) acing in 2012, if spexcluded. Those vided by the privenough informatDoD’s civilian eming each commocivilian compenssation provided findicated in a sinwith no further d
DING FOR OPERATION AND MAINTENANCE BY CATEGORY OF SPENDING TRENDS IN SPENDING BY THE DEPARTM
ibit 7.
rchases Funded Through DoD’s Base-Budget Appropriation for Operation and Maintenance in 12, by Activity, Commodity Class, and Provider
ions of 2012 Dollars
Activity Commodity Class Provider
Private
Sector
(87.7)
Services
Goods
(33.3)Support and
dividual Training
(71.5)
Forces
(27.3)
WCFs
(37.6)
The O&activitiespurchase“commovided byfunds, anDoD (lacan be sethe line
Within tportion to unit-lties relatsion is towhich accent, of
CBO
FUN TRENDS IN SPENDING BY THE DEPARTMENT OF DEFENSE FOR OPERATION AND MAINTENANCE 16
Exh
Pu d Maintenance in 20Bill
SouDoDSenDefanogooFor
Provider
PrivateSector(87.7)
C
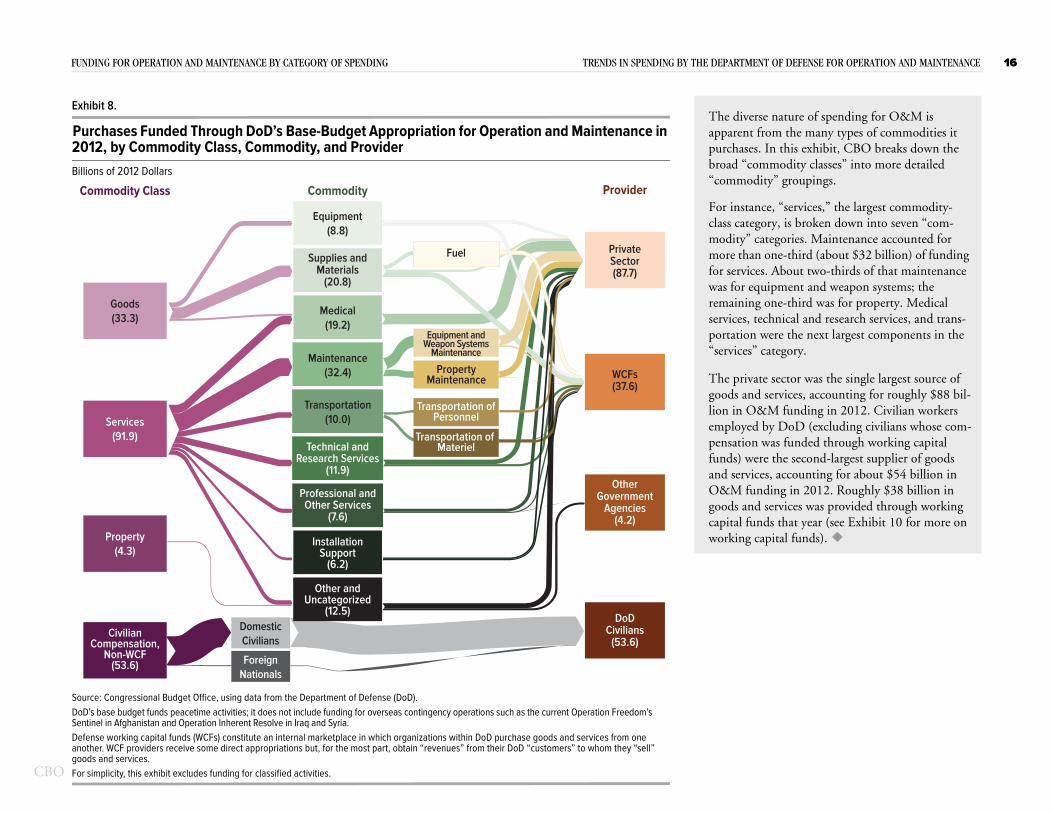
The diverse nature of spending for O&M is apparent from the many types of commodities it purchases. In this exhibit, CBO breaks down the broad “commodity classes” into more detailed “commodity” groupings.
For instance, “services,” the largest commodity-class category, is broken down into seven “com-modity” categories. Maintenance accounted for more than one-third (about $32 billion) of funding for services. About two-thirds of that maintenance was for equipment and weapon systems; the remaining one-third was for property. Medical services, technical and research services, and trans-portation were the next largest components in the “services” category.
was the single largest source of accounting for roughly $88 bil-ing in 2012. Civilian workers (excluding civilians whose com-ed through working capital ond-largest supplier of goods nting for about $54 billion in 012. Roughly $38 billion in
was provided through working ear (see Exhibit 10 for more on ds).
rce: Congressional Budget Office, using data from the Department of Defense (DoD).’s base budget funds peacetime activities; it does not include funding for overseas contingency operations such as the current Operation Freedom’s tinel in Afghanistan and Operation Inherent Resolve in Iraq and Syria.ense working capital funds (WCFs) constitute an internal marketplace in which organizations within DoD purchase goods and services from one ther. WCF providers receive some direct appropriations but, for the most part, obtain “revenues” from their DoD “customers” to whom they “sell” ds and services. simplicity, this exhibit excludes funding for classified activities.
CivilianCompensation,
Non-WCF(53.6)
DoDCivilians
(53.6)
OtherGovernment
Agencies(4.2)
Property
(4.3)
Other andUncategorized
(12.5)
InstallationSupport
(6.2)
Transportation of Materiel
Transportation ofPersonnel
PropertyMaintenance
Professional andOther Services
(7.6)
Technical andResearch Services
(11.9)
Transportation
(10.0)
(32.4)
Foreign
Nationals
Domestic
Civilians
Services
(91.9)
WCFs(37.6)
The private sector goods and services,lion in O&M fundemployed by DoDpensation was fundfunds) were the secand services, accouO&M funding in 2goods and services capital funds that yworking capital fun
DING FOR OPERATION AND MAINTENANCE BY CATEGORY OF SPENDING
ibit 8.
rchases Funded Through DoD’s Base-Budget Appropriation for Operation an12, by Commodity Class, Commodity, and Provider
ions of 2012 Dollars
Commodity
Maintenance
Medical
(19.2)
Supplies andMaterials
(20.8)
Equipment
(8.8)
Fuel
Goods
(33.3)
Equipment andWeapon Systems
Maintenance
ommodity Class
CBO
FUN ING BY THE DEPARTMENT OF DEFENSE FOR OPERATION AND MAINTENANCE 17
Exh
ThFuBill
Sou
DeserDo
Thiapp
0
10
20
30
40
50
60
70
80
90
100
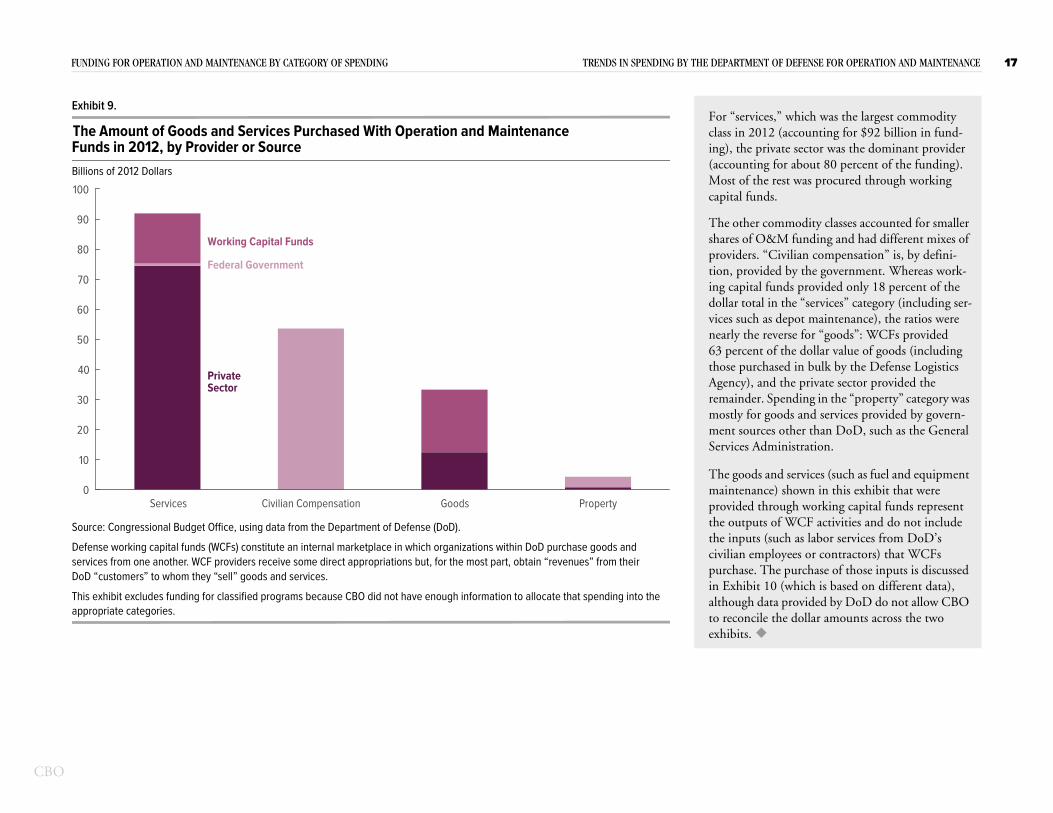
For “services,” which was the largest commodity class in 2012 (accounting for $92 billion in fund-ing), the private sector was the dominant provider (accounting for about 80 percent of the funding). Most of the rest was procured through working capital funds.
The other commodity classes accounted for smaller shares of O&M funding and had different mixes of providers. “Civilian compensation” is, by defini-tion, provided by the government. Whereas work-ing capital funds provided only 18 percent of the dollar total in the “services” category (including ser-vices such as depot maintenance), the ratios were nearly the reverse for “goods”: WCFs provided 63 percent of the dollar value of goods (including those purchased in bulk by the Defense Logistics Agency), and the private sector provided the remainder. Spending in the “property” category was mostly for goods and services provided by govern-ment sources other than DoD, such as the General Services Administration.
The goods and services (such as fuel and equipment maintenance) shown in this exhibit that were provided through working capital funds represent the outputs of WCF activities and do not include the inputs (such as labor services from DoD’s civilian employees or contractors) that WCFs purchase. The purchase of those inputs is discussed in Exhibit 10 (which is based on different data), although data provided by DoD do not allow CBO to reconcile the dollar amounts across the two exhibits.
rce: Congressional Budget Office, using data from the Department of Defense (DoD).
fense working capital funds (WCFs) constitute an internal marketplace in which organizations within DoD purchase goods and vices from one another. WCF providers receive some direct appropriations but, for the most part, obtain “revenues” from their D “customers” to whom they “sell” goods and services.
s exhibit excludes funding for classified programs because CBO did not have enough information to allocate that spending into the ropriate categories.
Services Civilian Compensation Goods Property
PrivateSector
DING FOR OPERATION AND MAINTENANCE BY CATEGORY OF SPENDING TRENDS IN SPEND
ibit 9.
e Amount of Goods and Services Purchased With Operation and Maintenance nds in 2012, by Provider or Sourceions of 2012 Dollars
Working Capital Funds
Federal Government
CBO
FUN EPARTMENT OF DEFENSE FOR OPERATION AND MAINTENANCE 18
Exh
FlBill
Sou
Forby
Do
a.
b.
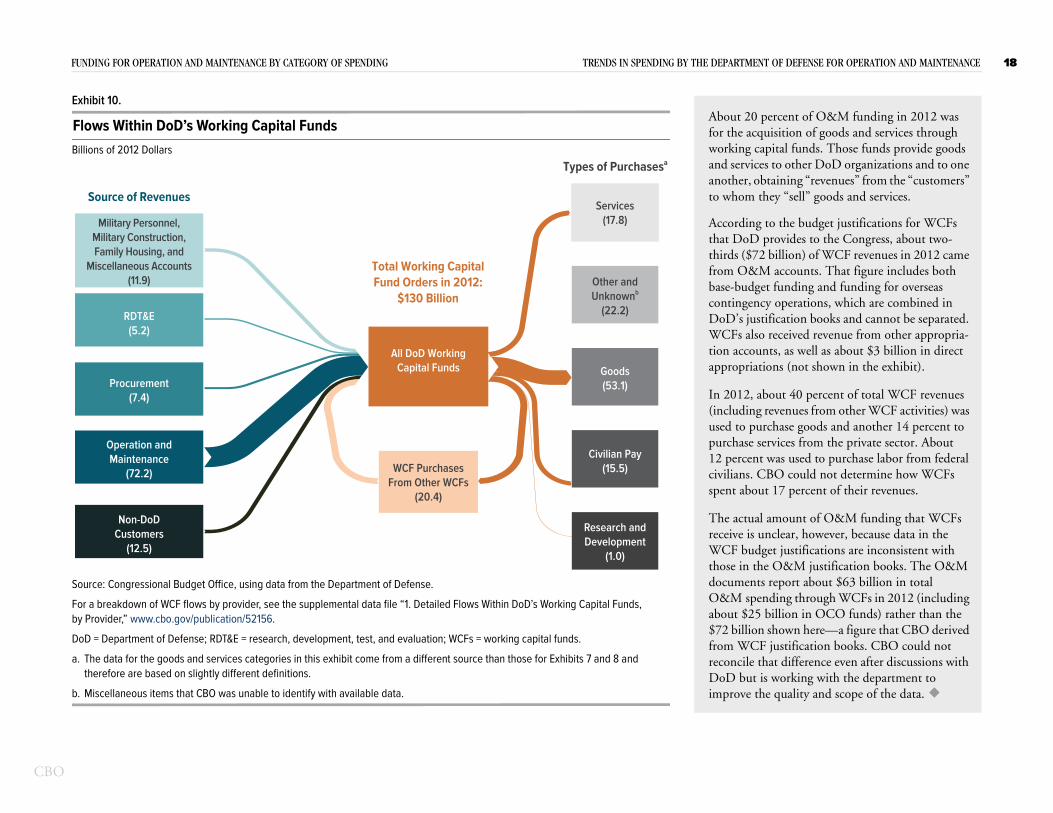
bout 20 percent of O&M funding in 2012 was r the acquisition of goods and services through orking capital funds. Those funds provide goods d services to other DoD organizations and to one other, obtaining “revenues” from the “customers” whom they “sell” goods and services.
ccording to the budget justifications for WCFs at DoD provides to the Congress, about two-irds ($72 billion) of WCF revenues in 2012 came om O&M accounts. That figure includes both ase-budget funding and funding for overseas ntingency operations, which are combined in oD’s justification books and cannot be separated. CFs also received revenue from other appropria-
on accounts, as well as about $3 billion in direct propriations (not shown in the exhibit).
bout 40 percent of total WCF revenues revenues from other WCF activities) was rchase goods and another 14 percent to ervices from the private sector. About was used to purchase labor from federal BO could not determine how WCFs t 17 percent of their revenues.
amount of O&M funding that WCFs nclear, however, because data in the get justifications are inconsistent with e O&M justification books. The O&M s report about $63 billion in total nding through WCFs in 2012 (including billion in OCO funds) rather than the shown here—a figure that CBO derived justification books. CBO could not
hat difference even after discussions with s working with the department to e quality and scope of the data.
rce: Congressional Budget Office, using data from the Department of Defense.
a breakdown of WCF flows by provider, see the supplemental data file “1. Detailed Flows Within DoD’s Working Capital Funds, Provider,” www.cbo.gov/publication/52156.
D = Department of Defense; RDT&E = research, development, test, and evaluation; WCFs = working capital funds.
The data for the goods and services categories in this exhibit come from a different source than those for Exhibits 7 and 8 and therefore are based on slightly different definitions.
Miscellaneous items that CBO was unable to identify with available data.
Non-DoD
Customers
(12.5)
Procurement
(7.4)
Operation and
Maintenance
(72.2)
Goods
(53.1)
Civilian Pay
(15.5)
Research and
Development
(1.0)
Capital Funds
WCF Purchases
From Other WCFs
(20.4)
In 2012, a(includingused to pupurchase s12 percentcivilians. Cspent abou
The actualreceive is uWCF budthose in thdocumentO&M speabout $25$72 billionfrom WCFreconcile tDoD but iimprove th
DING FOR OPERATION AND MAINTENANCE BY CATEGORY OF SPENDING TRENDS IN SPENDING BY THE D
ibit 10.
ows Within DoD’s Working Capital Fundsions of 2012 Dollars
Source of Revenues
Total Working Capital Fund Orders in 2012:
$130 Billion
Military Personnel,
Military Construction,
Family Housing, and
Miscellaneous Accounts
(11.9)
RDT&E
(5.2)
Services
(17.8)
All DoD Working
Other and
Unknownb
(22.2)
Types of Purchasesa
Afowananto
AththfrbcoDWtiap
CBO
Gro Spending for Operation and Maintenance tween 2000 and 2012, by Category
wth inBe
CBO
GRO AND 2012, BY CATEGORY TRENDS IN SPENDING BY THE DEPARTMENT OF DEFENSE FOR OPERATION AND MAINTENANCE 20
Exh
Gr Between 2000 and 2012, AfBill
Sou
CB time activities. Ho rations (such as the n this exhibit.
5
10
15
20
25
30
197.9
89.9
Base Budget
OverseasContingencyOperations
n (47%)se-Budgeting
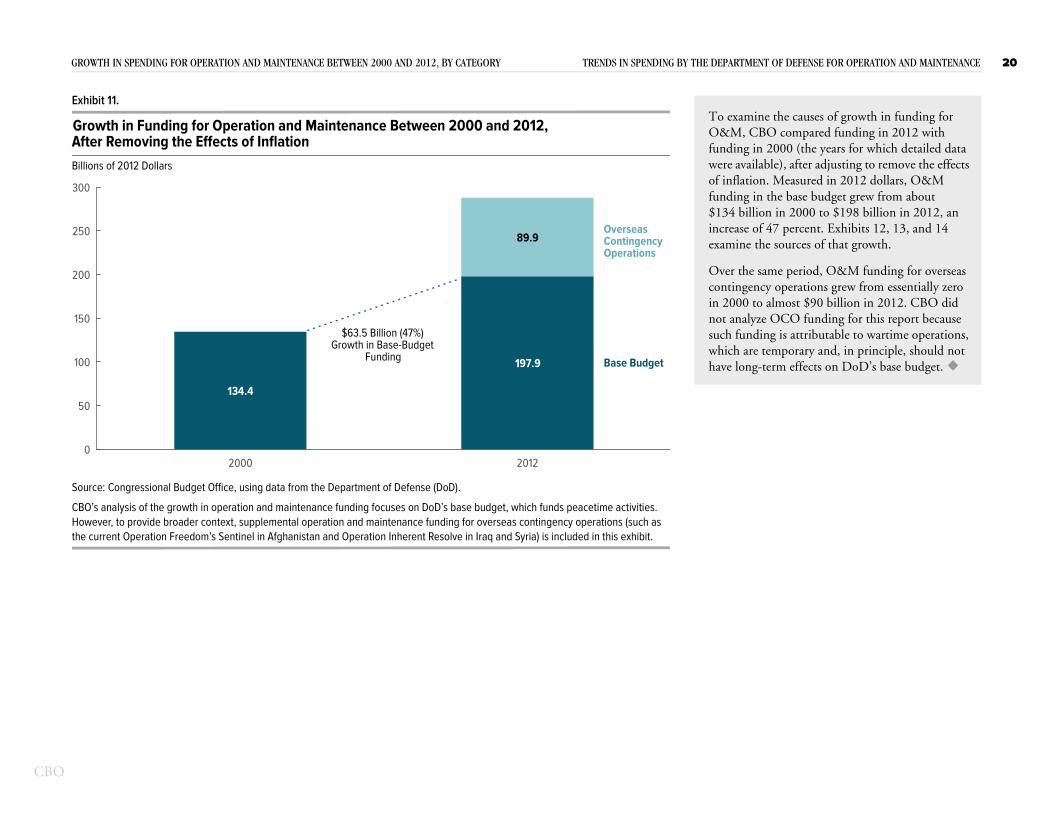
To examine the causes of growth in funding for O&M, CBO compared funding in 2012 with funding in 2000 (the years for which detailed data were available), after adjusting to remove the effects of inflation. Measured in 2012 dollars, O&M funding in the base budget grew from about $134 billion in 2000 to $198 billion in 2012, an increase of 47 percent. Exhibits 12, 13, and 14 examine the sources of that growth.
Over the same period, O&M funding for overseas contingency operations grew from essentially zero in 2000 to almost $90 billion in 2012. CBO did not analyze OCO funding for this report because such funding is attributable to wartime operations, which are temporary and, in principle, should not have long-term effects on DoD’s base budget.
rce: Congressional Budget Office, using data from the Department of Defense (DoD).
O’s analysis of the growth in operation and maintenance funding focuses on DoD’s base budget, which funds peacewever, to provide broader context, supplemental operation and maintenance funding for overseas contingency ope current Operation Freedom’s Sentinel in Afghanistan and Operation Inherent Resolve in Iraq and Syria) is included i
2000 20120
0134.4
WTH IN SPENDING FOR OPERATION AND MAINTENANCE BETWEEN 2000
ibit 11.
owth in Funding for Operation and Maintenance ter Removing the Effects of Inflationions of 2012 Dollars
0
0
0
0
0
$63.5 BillioGrowth in Ba
Fund
CBO
GRO ARTMENT OF DEFENSE FOR OPERATION AND MAINTENANCE 21
Exh
ShbyPer
Sou
DoOp
a.
b.
c.
d.
0
20
40
60
80
100
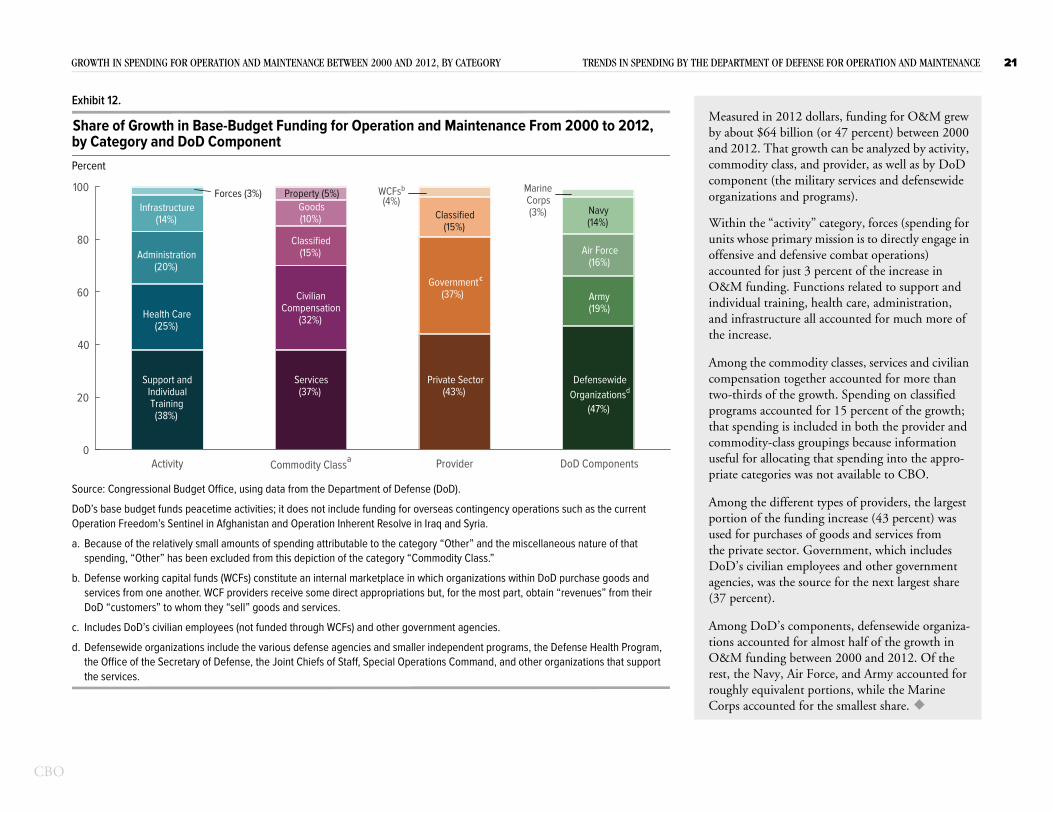
sured in 2012 dollars, funding for O&M grew bout $64 billion (or 47 percent) between 2000 2012. That growth can be analyzed by activity, modity class, and provider, as well as by DoD ponent (the military services and defensewide nizations and programs).
hin the “activity” category, forces (spending for s whose primary mission is to directly engage in nsive and defensive combat operations) unted for just 3 percent of the increase in M funding. Functions related to support and vidual training, health care, administration, infrastructure all accounted for much more of increase.
ong the commodity classes, services and civilian sation together accounted for more than
rds of the growth. Spending on classified s accounted for 15 percent of the growth;
nding is included in both the provider and dity-class groupings because information or allocating that spending into the appro-ategories was not available to CBO.
the different types of providers, the largest of the funding increase (43 percent) was r purchases of goods and services from ate sector. Government, which includes civilian employees and other government s, was the source for the next largest share cent).
DoD’s components, defensewide organiza-counted for almost half of the growth in funding between 2000 and 2012. Of the e Navy, Air Force, and Army accounted for equivalent portions, while the Marine ccounted for the smallest share.
rce: Congressional Budget Office, using data from the Department of Defense (DoD).
D’s base budget funds peacetime activities; it does not include funding for overseas contingency operations such as the current eration Freedom’s Sentinel in Afghanistan and Operation Inherent Resolve in Iraq and Syria.
Because of the relatively small amounts of spending attributable to the category “Other” and the miscellaneous nature of that spending, “Other” has been excluded from this depiction of the category “Commodity Class.”
Defense working capital funds (WCFs) constitute an internal marketplace in which organizations within DoD purchase goods and services from one another. WCF providers receive some direct appropriations but, for the most part, obtain “revenues” from their DoD “customers” to whom they “sell” goods and services.
Includes DoD’s civilian employees (not funded through WCFs) and other government agencies.
Defensewide organizations include the various defense agencies and smaller independent programs, the Defense Health Program, the Office of the Secretary of Defense, the Joint Chiefs of Staff, Special Operations Command, and other organizations that support the services.
Activity Commodity Classa Provider DoD Components
Support andIndividualTraining(38%)
Services(37%)
Private Sector(43%)
DefensewideOrganizationsd
(47%)
compentwo-thiprogramthat specommouseful fpriate c
Amongportionused fothe privDoD’s agencie(37 per
Amongtions acO&M rest, throughlyCorps a
WTH IN SPENDING FOR OPERATION AND MAINTENANCE BETWEEN 2000 AND 2012, BY CATEGORY TRENDS IN SPENDING BY THE DEP
ibit 12.
are of Growth in Base-Budget Funding for Operation and Maintenance From 2000 to 2012, Category and DoD Componentcent
Health Care(25%)
Administration(20%)
Infrastructure(14%)
Forces (3%)
CivilianCompensation
(32%)
Classified(15%)
Goods(10%)
Property (5%)
Government(37%)
WCFsb
(4%)Classified
(15%)
Army(19%)
Air Force(16%)
Navy(14%)
MarineCorps(3%)
c
Meaby aandcomcomorga
WitunitoffeaccoO&indiandthe
Am
CBO
GRO ENDING BY THE DEPARTMENT OF DEFENSE FOR OPERATION AND MAINTENANCE 22
Exh
GrTyBill
Sou
DoOp
a.
b.
-4
0
4
8
12
16
20
24
28
32
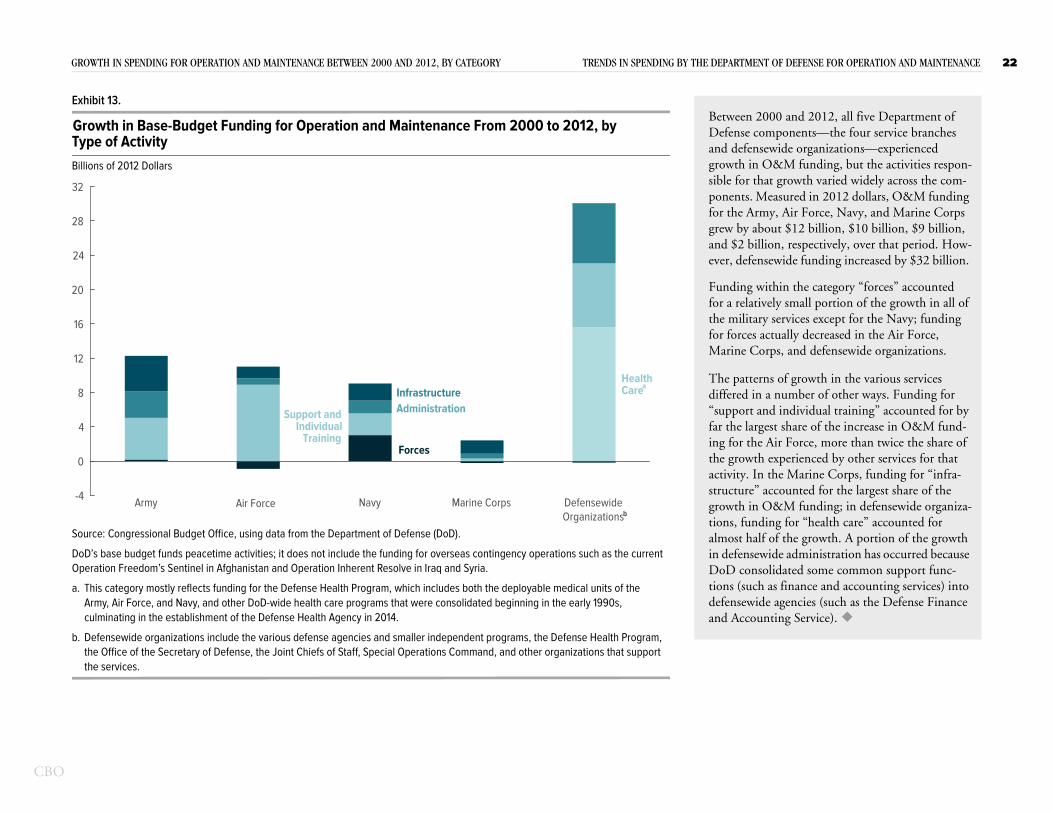
Between 2000 and 2012, all five Department of Defense components—the four service branches and defensewide organizations—experienced growth in O&M funding, but the activities respon-sible for that growth varied widely across the com-ponents. Measured in 2012 dollars, O&M funding for the Army, Air Force, Navy, and Marine Corps grew by about $12 billion, $10 billion, $9 billion, and $2 billion, respectively, over that period. How-ever, defensewide funding increased by $32 billion.
Funding within the category “forces” accounted for a relatively small portion of the growth in all of the military services except for the Navy; funding for forces actually decreased in the Air Force, Marine Corps, and defensewide organizations.
atterns of growth in the various services ed in a number of other ways. Funding for ort and individual training” accounted for by e largest share of the increase in O&M fund-r the Air Force, more than twice the share of owth experienced by other services for that ty. In the Marine Corps, funding for “infra-ure” accounted for the largest share of the h in O&M funding; in defensewide organiza- funding for “health care” accounted for t half of the growth. A portion of the growth ensewide administration has occurred because consolidated some common support func-(such as finance and accounting services) into sewide agencies (such as the Defense Finance ccounting Service).
rce: Congressional Budget Office, using data from the Department of Defense (DoD).
D’s base budget funds peacetime activities; it does not include the funding for overseas contingency operations such as the current eration Freedom’s Sentinel in Afghanistan and Operation Inherent Resolve in Iraq and Syria.
This category mostly reflects funding for the Defense Health Program, which includes both the deployable medical units of the Army, Air Force, and Navy, and other DoD-wide health care programs that were consolidated beginning in the early 1990s, culminating in the establishment of the Defense Health Agency in 2014.
Defensewide organizations include the various defense agencies and smaller independent programs, the Defense Health Program, the Office of the Secretary of Defense, the Joint Chiefs of Staff, Special Operations Command, and other organizations that support the services.
Army Air Force Navy Marine Corps DefensewideOrganizations
Administration
Forces
Support andIndividual
Training
HealthCareInfrastructure
b
aThe pdiffer“suppfar thing fothe gractivistructgrowttions,almosin defDoDtions defenand A
WTH IN SPENDING FOR OPERATION AND MAINTENANCE BETWEEN 2000 AND 2012, BY CATEGORY TRENDS IN SP
ibit 13.
owth in Base-Budget Funding for Operation and Maintenance From 2000 to 2012, by pe of Activityions of 2012 Dollars
CBO
GRO OF DEFENSE FOR OPERATION AND MAINTENANCE 23
Exh
GrFrCha
Sou
DoDFre
DefAcqDefDefOff(inc
O&
a.
-5
0
5
10
15
20
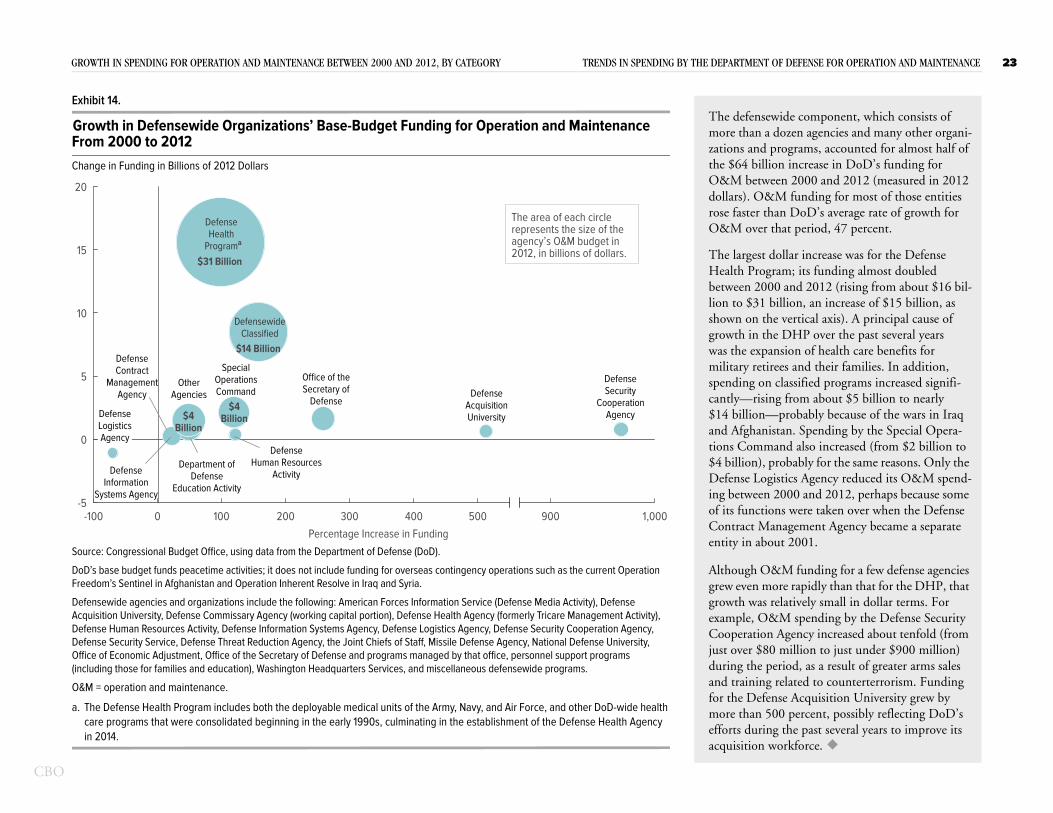
wide component, which consists of dozen agencies and many other organi- programs, accounted for almost half of ion increase in DoD’s funding for een 2000 and 2012 (measured in 2012 M funding for most of those entities
han DoD’s average rate of growth for that period, 47 percent.
dollar increase was for the Defense ram; its funding almost doubled
00 and 2012 (rising from about $16 bil-billion, an increase of $15 billion, as he vertical axis). A principal cause of he DHP over the past several years ansion of health care benefits for rees and their families. In addition,
sified programs increased signifi-om about $5 billion to nearly bably because of the wars in Iraq
. Spending by the Special Opera- also increased (from $2 billion to ably for the same reasons. Only the s Agency reduced its O&M spend-0 and 2012, perhaps because some ere taken over when the Defense
ement Agency became a separate 001.
funding for a few defense agencies apidly than that for the DHP, that ively small in dollar terms. For spending by the Defense Security ncy increased about tenfold (from llion to just under $900 million) d, as a result of greater arms sales ted to counterterrorism. Funding cquisition University grew by
ercent, possibly reflecting DoD’s e past several years to improve its force.
rce: Congressional Budget Office, using data from the Department of Defense (DoD).
’s base budget funds peacetime activities; it does not include funding for overseas contingency operations such as the current Operation edom’s Sentinel in Afghanistan and Operation Inherent Resolve in Iraq and Syria.
ensewide agencies and organizations include the following: American Forces Information Service (Defense Media Activity), Defense uisition University, Defense Commissary Agency (working capital portion), Defense Health Agency (formerly Tricare Management Activity), ense Human Resources Activity, Defense Information Systems Agency, Defense Logistics Agency, Defense Security Cooperation Agency, ense Security Service, Defense Threat Reduction Agency, the Joint Chiefs of Staff, Missile Defense Agency, National Defense University, ice of Economic Adjustment, Office of the Secretary of Defense and programs managed by that office, personnel support programs luding those for families and education), Washington Headquarters Services, and miscellaneous defensewide programs.
M = operation and maintenance.
The Defense Health Program includes both the deployable medical units of the Army, Navy, and Air Force, and other DoD-wide health care programs that were consolidated beginning in the early 1990s, culminating in the establishment of the Defense Health Agency in 2014.
-100 0 100 200 300 400 500 900 1,000Percentage Increase in Funding
Office of theSecretary of
Defense
OperationsCommand
Department ofDefense
Education Activity
DefenseAcquisitionUniversityDefense
LogisticsAgency
DefenseInformation
Systems Agency
ContractManagement
Agency
DefenseHuman Resources
Activity
OtherAgencies
DefenseSecurity
CooperationAgency
$4Billion$4
Billion
spending on clascantly—rising fr$14 billion—proand Afghanistantions Command$4 billion), probDefense Logisticing between 200of its functions wContract Managentity in about 2
Although O&Mgrew even more rgrowth was relatexample, O&M Cooperation Agejust over $80 miduring the perioand training relafor the Defense Amore than 500 pefforts during thacquisition work
WTH IN SPENDING FOR OPERATION AND MAINTENANCE BETWEEN 2000 AND 2012, BY CATEGORY TRENDS IN SPENDING BY THE DEPARTMENT
ibit 14.
owth in Defensewide Organizations’ Base-Budget Funding for Operation and Maintenance om 2000 to 2012nge in Funding in Billions of 2012 Dollars
Special
DefensewideClassified
DefenseHealth
Program
DefenseContract
AuditAgencyDefense
$31 Billion
$14 Billion
a
The area of each circlerepresents the size of theagency’s O&M budget in2012, in billions of dollars.
The defensemore than azations andthe $64 billO&M betwdollars). O&rose faster tO&M over
The largest Health Progbetween 20lion to $31 shown on tgrowth in twas the expmilitary reti
CBO
G n Spending for O&M From 2000 to 2012 ategories That Are Difficult to Track
rowth iin C
CBO
GRO K TRENDS IN SPENDING BY THE DEPARTMENT OF DEFENSE FOR OPERATION AND MAINTENANCE 25
Exh
Po t Are Well Understood and ThBill
Sou
DoOp
TheheaAgeOff
DeserDo
O&
DHP CivilianCompensation
($6 Billion)
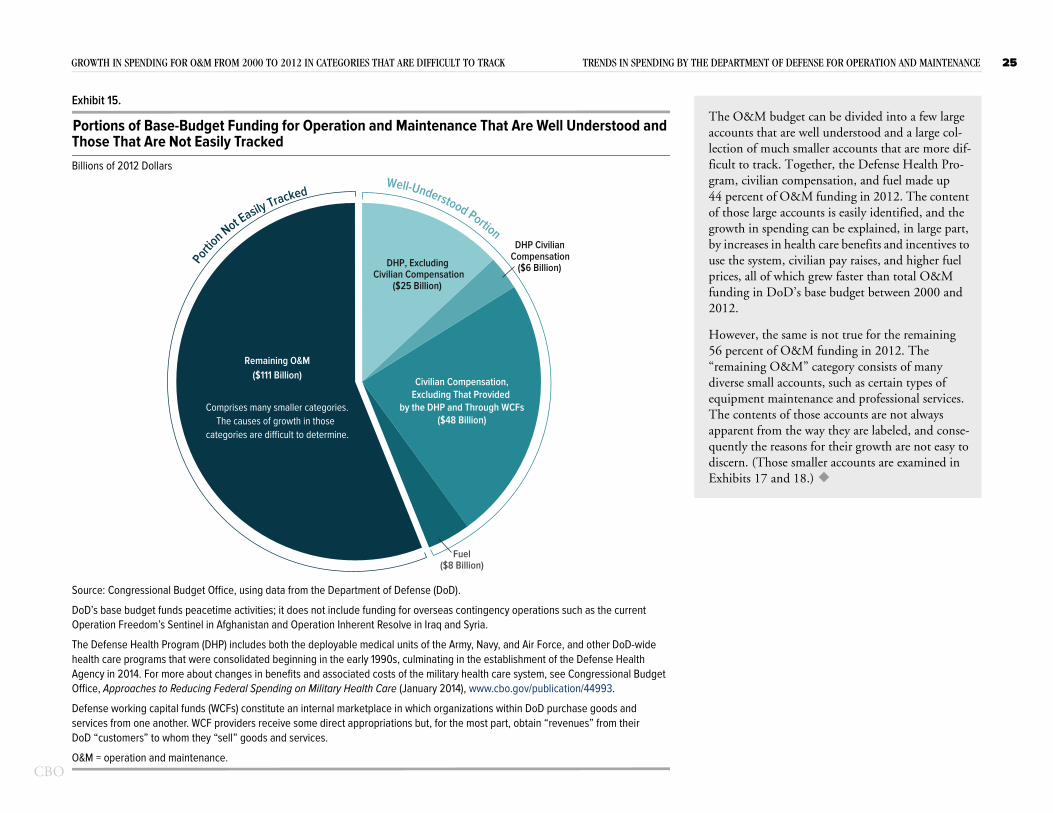
The O&M budget can be divided into a few large accounts that are well understood and a large col-lection of much smaller accounts that are more dif-ficult to track. Together, the Defense Health Pro-gram, civilian compensation, and fuel made up 44 percent of O&M funding in 2012. The content of those large accounts is easily identified, and the growth in spending can be explained, in large part, by increases in health care benefits and incentives to use the system, civilian pay raises, and higher fuel prices, all of which grew faster than total O&M funding in DoD’s base budget between 2000 and 2012.
However, the same is not true for the remaining 56 percent of O&M funding in 2012. The “remaining O&M” category consists of many
ts, such as certain types of nce and professional services. e accounts are not always ay they are labeled, and conse-or their growth are not easy to ler accounts are examined in
rce: Congressional Budget Office, using data from the Department of Defense (DoD).
D’s base budget funds peacetime activities; it does not include funding for overseas contingency operations such as the current eration Freedom’s Sentinel in Afghanistan and Operation Inherent Resolve in Iraq and Syria.
Defense Health Program (DHP) includes both the deployable medical units of the Army, Navy, and Air Force, and other DoD-wide lth care programs that were consolidated beginning in the early 1990s, culminating in the establishment of the Defense Health ncy in 2014. For more about changes in benefits and associated costs of the military health care system, see Congressional Budget
ice, Approaches to Reducing Federal Spending on Military Health Care (January 2014), www.cbo.gov/publication/44993.
fense working capital funds (WCFs) constitute an internal marketplace in which organizations within DoD purchase goods and vices from one another. WCF providers receive some direct appropriations but, for the most part, obtain “revenues” from their D “customers” to whom they “sell” goods and services.
M = operation and maintenance.
Civilian Compensation,
Excluding That Provided
by the DHP and Through WCFs
($48 Billion)
Fuel($8 Billion)
($111 Billion)
Comprises many smaller categories.The causes of growth in those
categories are difficult to determine.
diverse small accounequipment maintenaThe contents of thosapparent from the wquently the reasons fdiscern. (Those smalExhibits 17 and 18.)
WTH IN SPENDING FOR O&M FROM 2000 TO 2012 IN CATEGORIES THAT ARE DIFFICULT TO TRAC
ibit 15.
rtions of Base-Budget Funding for Operation and Maintenance Thaose That Are Not Easily Trackedions of 2012 Dollars
DHP, ExcludingCivilian Compensation
($25 Billion)
Remaining O&M
Porti
on Not E
asily TrackedWell-Understood Portion
CBO
GRO DEPARTMENT OF DEFENSE FOR OPERATION AND MAINTENANCE 26
Exh
GrbyCha
Sou
DoOp
TheheaAge
DeserDo
O&
a.
0
5
10
15
20
25
30
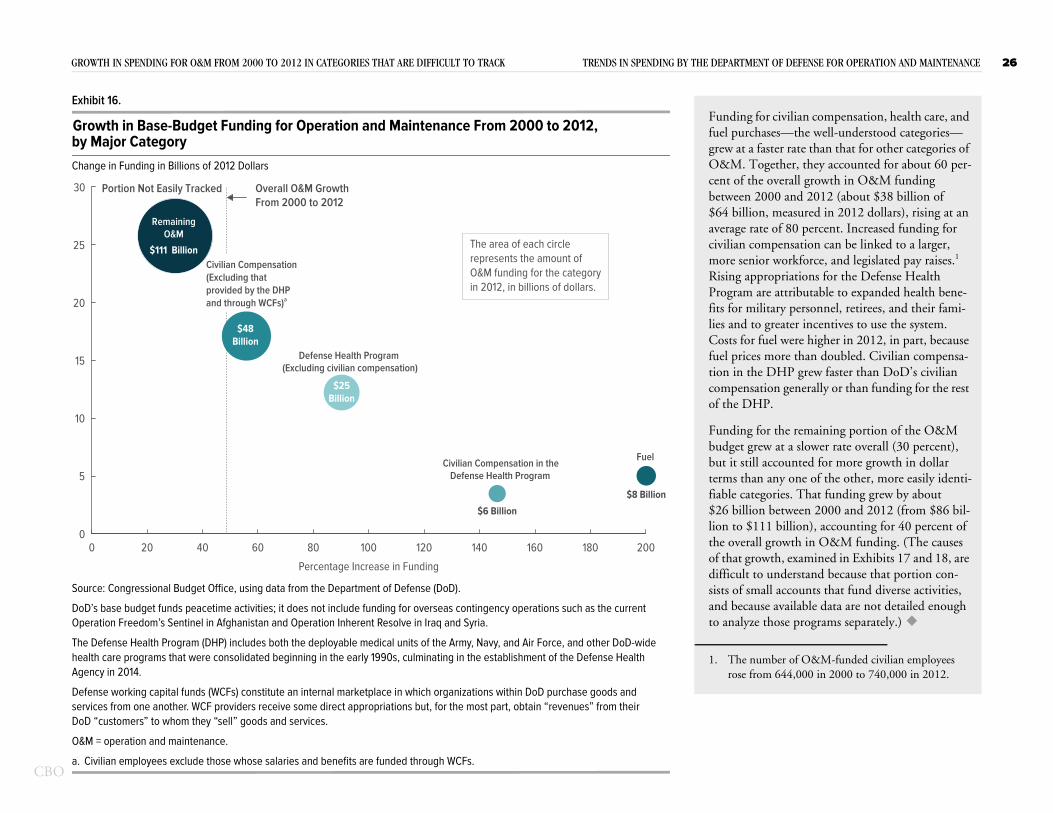
Funding for civilian compensation, health care, and fuel purchases—the well-understood categories—grew at a faster rate than that for other categories of O&M. Together, they accounted for about 60 per-cent of the overall growth in O&M funding between 2000 and 2012 (about $38 billion of $64 billion, measured in 2012 dollars), rising at an average rate of 80 percent. Increased funding for civilian compensation can be linked to a larger, more senior workforce, and legislated pay raises.1 Rising appropriations for the Defense Health Program are attributable to expanded health bene-fits for military personnel, retirees, and their fami-lies and to greater incentives to use the system. Costs for fuel were higher in 2012, in part, because fuel prices more than doubled. Civilian compensa-
grew faster than DoD’s civilian nerally or than funding for the rest
remaining portion of the O&M slower rate overall (30 percent), ted for more growth in dollar ne of the other, more easily identi- That funding grew by about een 2000 and 2012 (from $86 bil-on), accounting for 40 percent of h in O&M funding. (The causes amined in Exhibits 17 and 18, are stand because that portion con-unts that fund diverse activities,
lable data are not detailed enough programs separately.)
f O&M-funded civilian employees ,000 in 2000 to 740,000 in 2012.
rce: Congressional Budget Office, using data from the Department of Defense (DoD).
D’s base budget funds peacetime activities; it does not include funding for overseas contingency operations such as the current eration Freedom’s Sentinel in Afghanistan and Operation Inherent Resolve in Iraq and Syria.
Defense Health Program (DHP) includes both the deployable medical units of the Army, Navy, and Air Force, and other DoD-wide lth care programs that were consolidated beginning in the early 1990s, culminating in the establishment of the Defense Health ncy in 2014.
fense working capital funds (WCFs) constitute an internal marketplace in which organizations within DoD purchase goods and vices from one another. WCF providers receive some direct appropriations but, for the most part, obtain “revenues” from their D “customers” to whom they “sell” goods and services.
M = operation and maintenance.
Civilian employees exclude those whose salaries and benefits are funded through WCFs.
0 20 40 60 80 100 120 140 160 180 200
Percentage Increase in Funding
(Excluding civilian compensation)
FuelCivilian Compensation in the
Defense Health Program
$8 Billion
$25Billion
$6 Billion
tion in the DHPcompensation geof the DHP.
Funding for the budget grew at abut it still accounterms than any ofiable categories.$26 billion betwlion to $111 billithe overall growtof that growth, exdifficult to undersists of small accoand because avaito analyze those
1. The number orose from 644
WTH IN SPENDING FOR O&M FROM 2000 TO 2012 IN CATEGORIES THAT ARE DIFFICULT TO TRACK TRENDS IN SPENDING BY THE
ibit 16.
owth in Base-Budget Funding for Operation and Maintenance From 2000 to 2012, Major Categorynge in Funding in Billions of 2012 Dollars
Defense Health Program
RemainingO&M
Overall O&M GrowthFrom 2000 to 2012
Portion Not Easily Tracked
$48Billion
$111 Billion The area of each circle represents the amount of O&M funding for the category in 2012, in billions of dollars.
Civilian Compensation
(Excluding that
provided by the DHP
and through WCFs)a
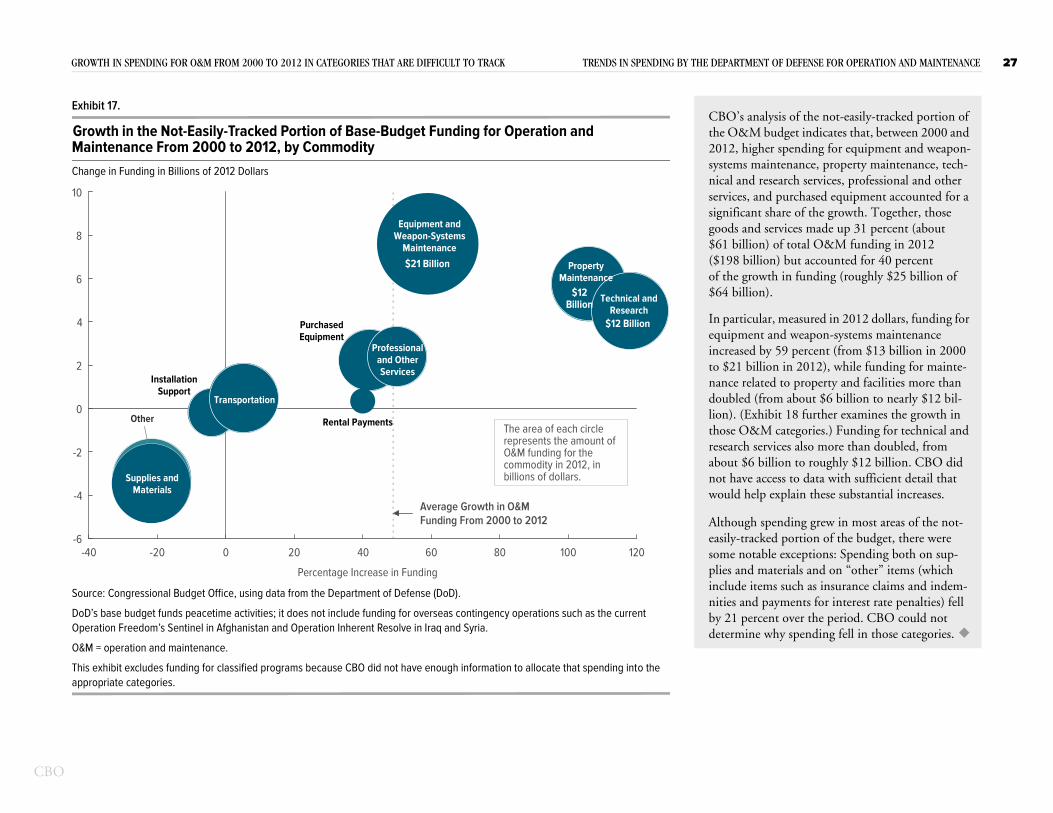
CBO
GRO ING BY THE DEPARTMENT OF DEFENSE FOR OPERATION AND MAINTENANCE 27
Exh
GrMaCha
Sou
DoOp
O&
Thiapp
-6
-4
-2
0
2
4
6
8
10
-
CBO’s analysis of the not-easily-tracked portion of the O&M budget indicates that, between 2000 and 2012, higher spending for equipment and weapon-systems maintenance, property maintenance, tech-nical and research services, professional and other services, and purchased equipment accounted for a significant share of the growth. Together, those goods and services made up 31 percent (about $61 billion) of total O&M funding in 2012 ($198 billion) but accounted for 40 percent of the growth in funding (roughly $25 billion of $64 billion).
In particular, measured in 2012 dollars, funding for equipment and weapon-systems maintenance increased by 59 percent (from $13 billion in 2000 to $21 billion in 2012), while funding for mainte-
related to property and facilities more than ed (from about $6 billion to nearly $12 bil-(Exhibit 18 further examines the growth in O&M categories.) Funding for technical and h services also more than doubled, from $6 billion to roughly $12 billion. CBO did ve access to data with sufficient detail that help explain these substantial increases.
gh spending grew in most areas of the not-tracked portion of the budget, there were notable exceptions: Spending both on sup-nd materials and on “other” items (which e items such as insurance claims and indem-and payments for interest rate penalties) fell percent over the period. CBO could not ine why spending fell in those categories.
rce: Congressional Budget Office, using data from the Department of Defense (DoD).
D’s base budget funds peacetime activities; it does not include funding for overseas contingency operations such as the current eration Freedom’s Sentinel in Afghanistan and Operation Inherent Resolve in Iraq and Syria.
M = operation and maintenance.
s exhibit excludes funding for classified programs because CBO did not have enough information to allocate that spending into the ropriate categories.
40 -20 0 20 40 60 80 100 120
Percentage Increase in Funding
InstallationSupport
Other
Services
Rental Payments
Supplies andMaterials
Transportation
Average Growth in O&MFunding From 2000 to 2012
The area of each circlerepresents the amount ofO&M funding for thecommodity in 2012, inbillions of dollars.
nancedoubllion). those researcabout not hawould
Althoueasily-some plies aincludnities by 21 determ
WTH IN SPENDING FOR O&M FROM 2000 TO 2012 IN CATEGORIES THAT ARE DIFFICULT TO TRACK TRENDS IN SPEND
ibit 17.
owth in the Not-Easily-Tracked Portion of Base-Budget Funding for Operation and intenance From 2000 to 2012, by Commoditynge in Funding in Billions of 2012 Dollars
PurchasedEquipment
Equipment andWeapon-Systems
Maintenance
PropertyMaintenance
Professionaland Other
Technical andResearch
$21 Billion
$12 Billion
$12Billion
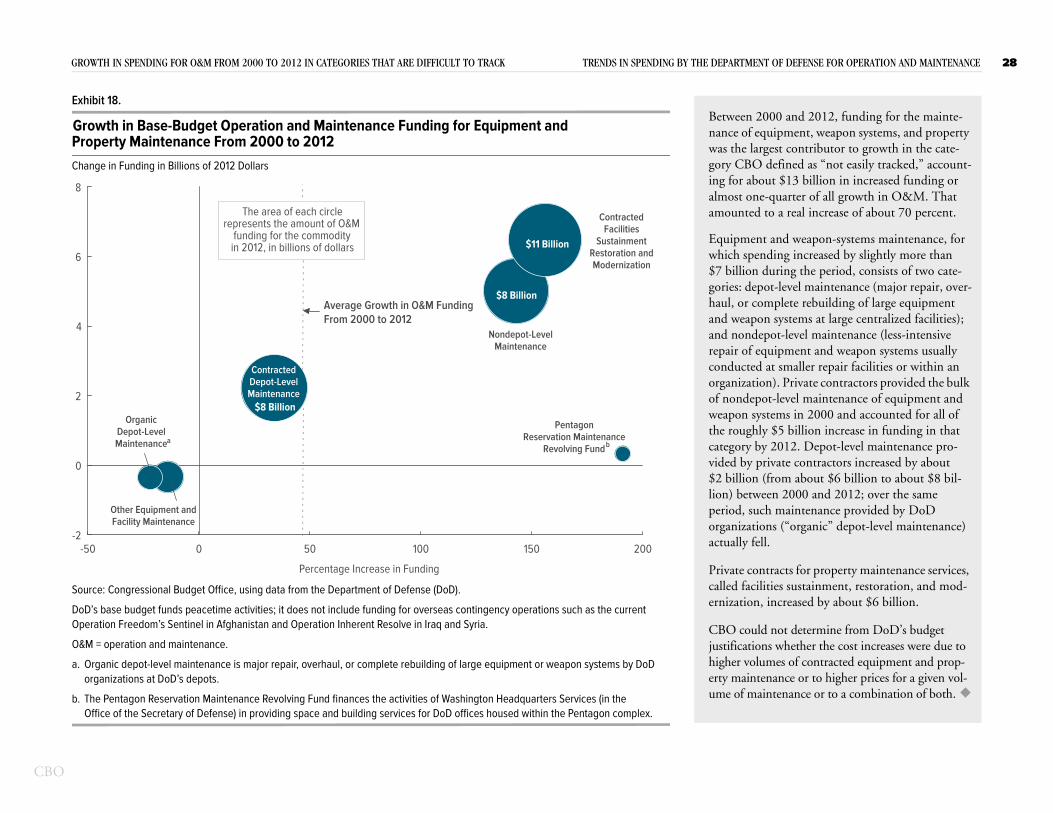
CBO
GRO EPARTMENT OF DEFENSE FOR OPERATION AND MAINTENANCE 28
Exh
GrPrCha
Sou
DoOp
O&
a.
b.
-2
0
2
4
6
8
-5
etween 2000 and 2012, funding for the mainte-ance of equipment, weapon systems, and property as the largest contributor to growth in the cate-ory CBO defined as “not easily tracked,” account-g for about $13 billion in increased funding or most one-quarter of all growth in O&M. That
ounted to a real increase of about 70 percent.
quipment and weapon-systems maintenance, for hich spending increased by slightly more than 7 billion during the period, consists of two cate-ories: depot-level maintenance (major repair, over-aul, or complete rebuilding of large equipment d weapon systems at large centralized facilities); d nondepot-level maintenance (less-intensive pair of equipment and weapon systems usually nducted at smaller repair facilities or within an
Private contractors provided the bulk vel maintenance of equipment and s in 2000 and accounted for all of billion increase in funding in that 12. Depot-level maintenance pro-te contractors increased by about m about $6 billion to about $8 bil-2000 and 2012; over the same aintenance provided by DoD “organic” depot-level maintenance)
ts for property maintenance services, sustainment, restoration, and mod-reased by about $6 billion.
t determine from DoD’s budget hether the cost increases were due to s of contracted equipment and prop-ce or to higher prices for a given vol-nance or to a combination of both.
rce: Congressional Budget Office, using data from the Department of Defense (DoD).
D’s base budget funds peacetime activities; it does not include funding for overseas contingency operations such as the current eration Freedom’s Sentinel in Afghanistan and Operation Inherent Resolve in Iraq and Syria.
M = operation and maintenance.
Organic depot-level maintenance is major repair, overhaul, or complete rebuilding of large equipment or weapon systems by DoD organizations at DoD’s depots.
The Pentagon Reservation Maintenance Revolving Fund finances the activities of Washington Headquarters Services (in the Office of the Secretary of Defense) in providing space and building services for DoD offices housed within the Pentagon complex.
0 0 50 100 150 200
Percentage Increase in Funding
OrganicDepot-LevelMaintenance
ContractedDepot-LevelMaintenance
PentagonReservation Maintenance
Revolving Fund
Other Equipment andFacility Maintenance
$8 Billion
ab
organization). of nondepot-leweapon systemthe roughly $5category by 20vided by priva$2 billion (frolion) between period, such morganizations (actually fell.
Private contraccalled facilitiesernization, inc
CBO could nojustifications whigher volumeerty maintenanume of mainte
WTH IN SPENDING FOR O&M FROM 2000 TO 2012 IN CATEGORIES THAT ARE DIFFICULT TO TRACK TRENDS IN SPENDING BY THE D
ibit 18.
owth in Base-Budget Operation and Maintenance Funding for Equipment and operty Maintenance From 2000 to 2012nge in Funding in Billions of 2012 Dollars
Nondepot-LevelMaintenance
ContractedFacilities
SustainmentRestoration andModernization
$8 Billion
$11 Billion
Average Growth in O&M FundingFrom 2000 to 2012
The area of each circlerepresents the amount of O&M
funding for the commodityin 2012, in billions of dollars
Bnwginalam
Ew$ghananreco
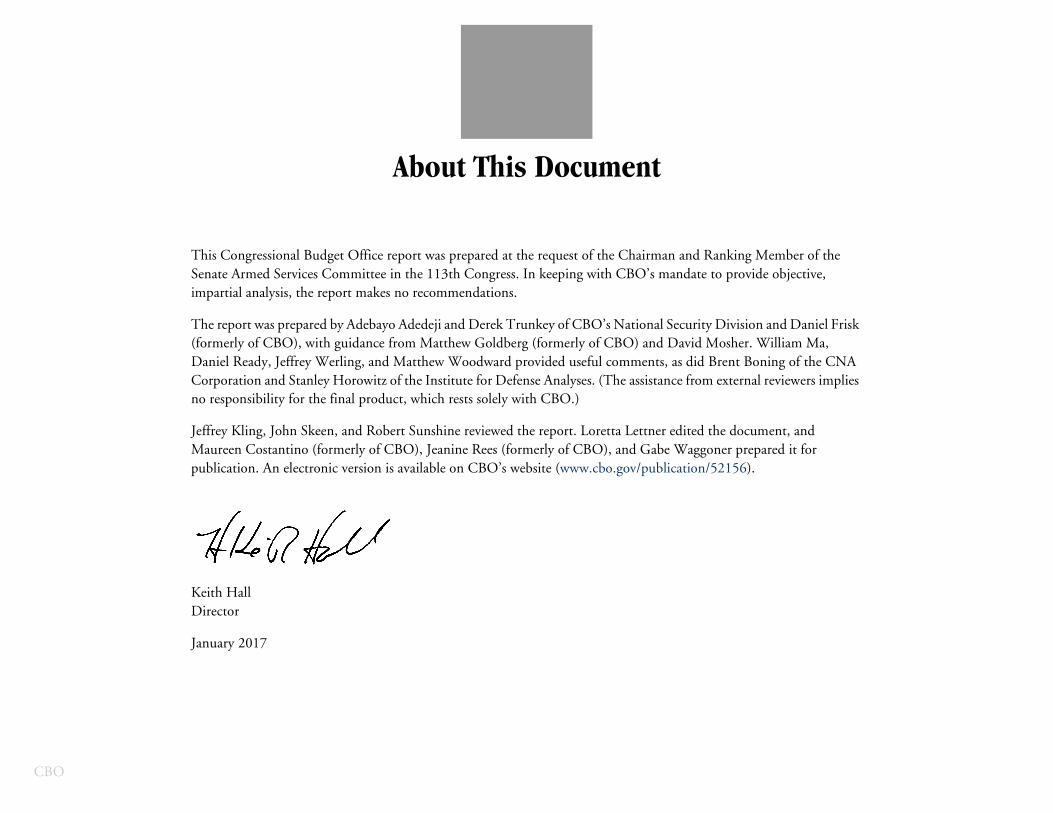
CBO
About This Document
ber of the jective,
Daniel Frisk iam Ma, of the CNA
iewers implies
t, and it for
This Congressional Budget Office report was prepared at the request of the Chairman and Ranking MemSenate Armed Services Committee in the 113th Congress. In keeping with CBO’s mandate to provide obimpartial analysis, the report makes no recommendations.
The report was prepared by Adebayo Adedeji and Derek Trunkey of CBO’s National Security Division and(formerly of CBO), with guidance from Matthew Goldberg (formerly of CBO) and David Mosher. WillDaniel Ready, Jeffrey Werling, and Matthew Woodward provided useful comments, as did Brent BoningCorporation and Stanley Horowitz of the Institute for Defense Analyses. (The assistance from external revno responsibility for the final product, which rests solely with CBO.)
Jeffrey Kling, John Skeen, and Robert Sunshine reviewed the report. Loretta Lettner edited the documenMaureen Costantino (formerly of CBO), Jeanine Rees (formerly of CBO), and Gabe Waggoner preparedpublication. An electronic version is available on CBO’s website (www.cbo.gov/publication/52156).
Keith Hall Director
January 2017