TRENDS IN ORGANIC MATTER AND FUNCTIONAL GROUPS...
25
TRENDS IN ORGANIC MATTER AND FUNCTIONAL GROUPS USING FTIR AND FTIR MEASUREMENTS AROUND THE GLOBE Ann M. Dillner, Alexandra (Ali) Boris Air Quality Research Center University of California, Davis IMPROVE Steering Committee Point Reyes National Park, CA October 22, 2019 1
Transcript of TRENDS IN ORGANIC MATTER AND FUNCTIONAL GROUPS...

TRENDS IN ORGANIC MATTER AND FUNCTIONAL GROUPS USING FTIRAND FTIR MEASUREMENTS AROUND THE GLOBE
Ann M. Dillner, Alexandra (Ali) BorisAir Quality Research CenterUniversity of California, Davis
IMPROVE Steering CommitteePoint Reyes National Park, CA
October 22, 20191
2
Acknowledgements• Funding for this project:
• EPA and IMPROVE (NPS Cooperative Agreement P11AC91045)
• EPRI (Agreement 10003745 and 10005355)
• Swiss Polytechnic University-Lausanne (EPFL)
• Collaborators, post-docs and graduate students (and many undergraduate students):
• CSN, FRM, IMPROVE, SEARCH programs and site/state personnel
• Joann Rice, Mike Hays, Emily Li, EPA
• Bret Schichtel and Scott Copeland, IMPROVE
• Stephanie Shaw and Eric Edgerton, EPRI/ARA
• Randall Martin and the SPARTAN personnel, SPARTAN and Washington University
• Dave Diner and MAIA team members, MAIA and JPL
• Satoshi Takahama• Andy Weakley• Bruno Debus• Alexandra Boris• Mohammed Kamruzzaman• Jenny Hand
• Charlotte Burki• Travis Ruthenburg• Matteo Reggente• Brian Trout• Adele Kuzmiakova• Amir Yazdani
• Katie George• Charity Coury• Kelsey Seibert• Sean Raffuse• Tony Wexler
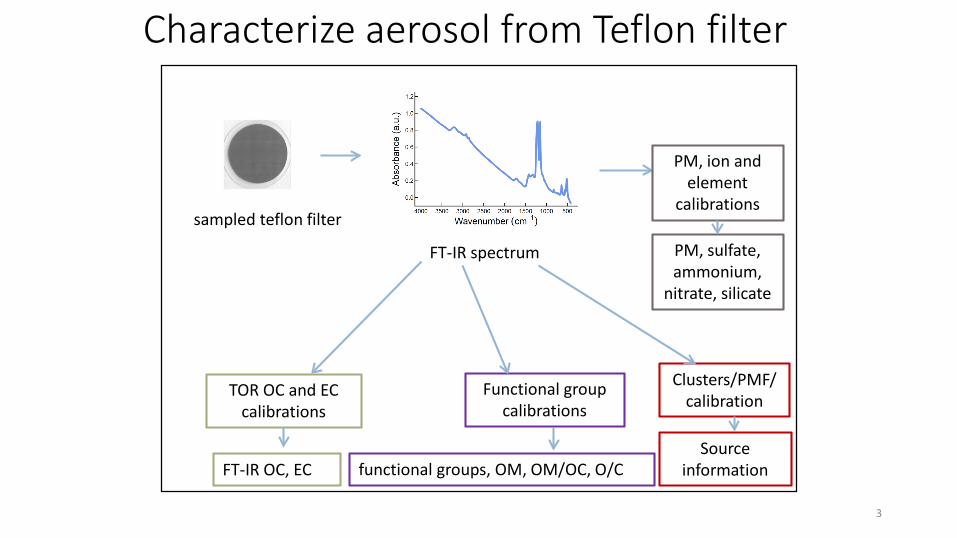
sampled teflon filter
FT-IR spectrum
TOR OC and ECcalibrations
FT-IR OC, EC
Functional group calibrations
functional groups, OM, OM/OC, O/CSource
information
Clusters/PMF/calibration
Characterize aerosol from Teflon filter
3
PM, ion and element
calibrations
PM, sulfate, ammonium,
nitrate, silicate

Motivation for measuring functional groups• Organic matter/mass (OM) is composed of
• Carbon• Oxygen• Hydrogen• Sometimes sulfur and nitrogen or other elements
• OM is used to calculate reconstructed mass and bext for RHR• IMPROVE and CSN estimate OM by
• Measure OC (C) using TOR• Multiply by an OM/OC value (1.8 in IMPROVE, typically 1.4 for urban)
• Measurements and models have shown that OM/OC varies by region, season, sample
• FTIR measures functional groups • added to estimate OM for each sample, OM = CH + COOH + COO+ + naCO + COH• Provide new, atmospherically relevant compositional data
4

Functional group and OM measurements• SEARCH network (EPRI funded)
• GA: Atlanta (JST; urban), Yorkville (YRK; rural)
• AL: Birmingham (BHM; urban), Centreville (CTR; rural)
• Functional group method• Discussed at last years Steering Committee meeting
• Samples from 2009-2016
• Boris et al., AMT, 2019
• Trends in organic matter, OM/OC and composition• Focus of today’s talk
• Presented at AAAR last week, AGU in December, paper forthcoming
5
Boris et al., AMT, 2019
Similar methodology can be used for IMPROVE and CSN
O
HO
O
OH
H H
H
H H
H HH
H H
H H
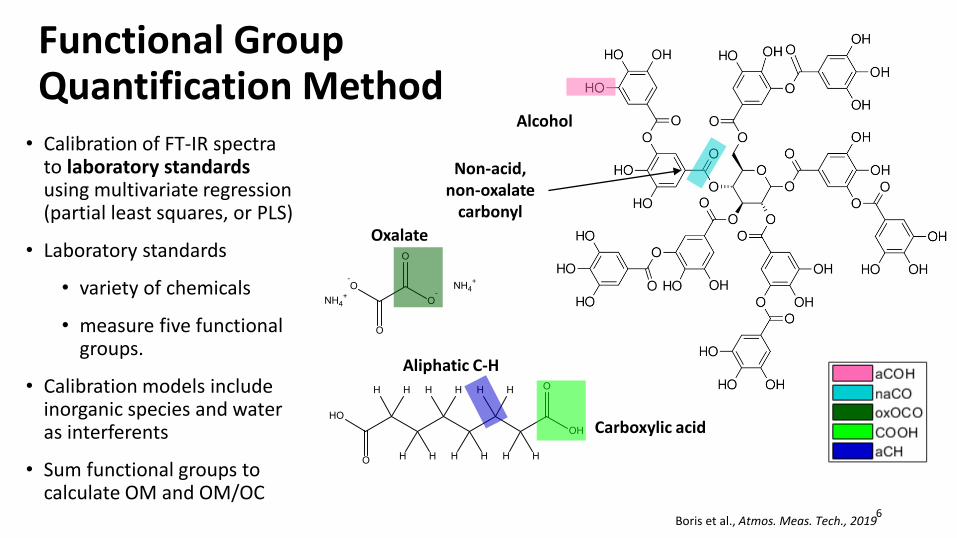
Functional Group Quantification Method
NH4+
NH4+
O
-O
O
O-
Oxalate
Aliphatic C-H
Carboxylic acid
Non-acid, non-oxalate
carbonyl
Alcohol
6
• Calibration of FT-IR spectra to laboratory standards using multivariate regression (partial least squares, or PLS)
• Laboratory standards
• variety of chemicals
• measure five functional groups.
• Calibration models include inorganic species and water as interferents
• Sum functional groups to calculate OM and OM/OC
Boris et al., Atmos. Meas. Tech., 2019
Questions
Having measured OM concentration and functional group composition in the Southeastern U.S. for an 8 year period:
• How did OM and functional groups change from 2009 to 2016?
• How do OM and functional groups vary by month?
7

OM trends from 2009 to 2016
• OM is slightly higher at urban sites
• Overall decrease in OM concentrations 2012 onward
• -0.052±0.007 μg m-3 yr-1
(Boris et al., in prep)• ~-0.14 μg m-3 yr-1 OA
(Marais et al., 2017 Environ. Res. Lett.)
• Related trends:• Parallel declines in
PM2.5, TOR OC, sulfate and nitrate concentrations
8
JST YRK BHM CTRAtlanta, GA(urban)
Yorkville, GA(rural)
Birmingham, AL(urban)
Centreville, AL(rural)
9
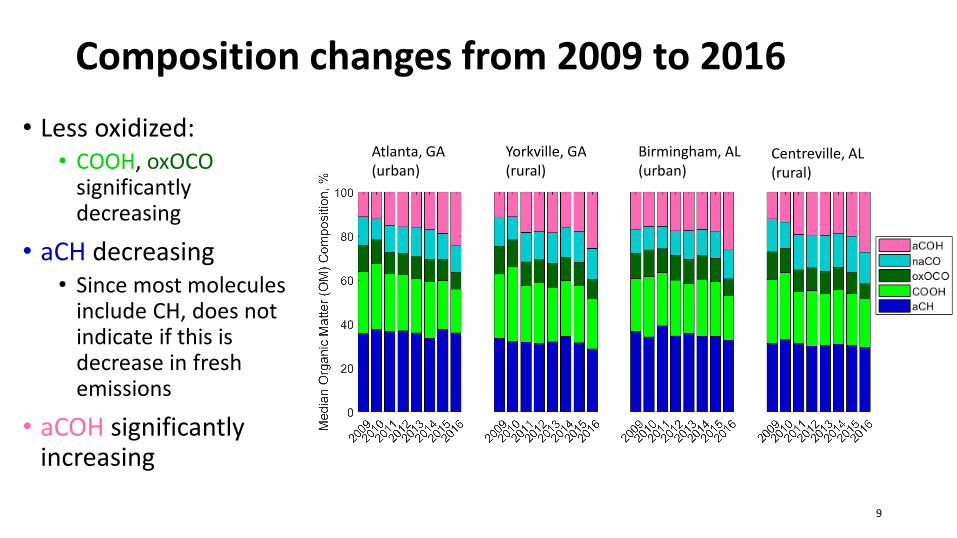
Atlanta, GA(urban)
Yorkville, GA(rural)
Birmingham, AL(urban)
Centreville, AL(rural)
• Less oxidized:• COOH, oxOCO
significantly decreasing
• aCH decreasing• Since most molecules
include CH, does not indicate if this is decrease in fresh emissions
• aCOH significantly increasing
Composition changes from 2009 to 2016

OM and composition changes by season
• Wintertime OMconcentrations are lower than in summer in SE
• Summertime functional group composition more oxygenated (COOH) than in winter
• Consistent with biogenic emissions, photochemistry in the summer
10

• Disappearance of 2009-2012 early (June) summer peak
• Corroborates decreasing isoprene aqSOA production hypothesis? (e.g., Marais et al., 2017, Environ. Res. Lett.)
• Remaining 2013-2016 late summer (Aug) “peak”
• Due to drought-driven O3? (Zhang & Wang 2016, PNAS)
11
Changes in summer OM over time

12
• OM/OC currently assumed to be one value for all samples in IMPROVE
• OM/OC vary in time and space• Summer purple• Winter in green
• Summer higher than winter• Rural ( ) higher than urban ( ) in
both seasons• No significant trend over all years
(functional group contributions)• Increase in summer OM/OC
OM/OC variations by season over time
Conclusions for Functional Groups by FTIR• Functional group data useful for observing trends in
• OM: • Annual concentrations decreased at all sites• Summer higher than winter, changes in summer peaks in recent years
• Composition of organics:• Annually, contributions of aCOH increased, while oxOCO, COOH, and aCH
decreased• Seasonally, COOH higher in summer, aCH higher in winter
• Functional group data useful for understanding atmospheric oxidation and processes
• OM/OC higher in summer than in winter and in rural than in urban sites• High summertime OM concentration events likely due to biogenic
emissions/processing13
13
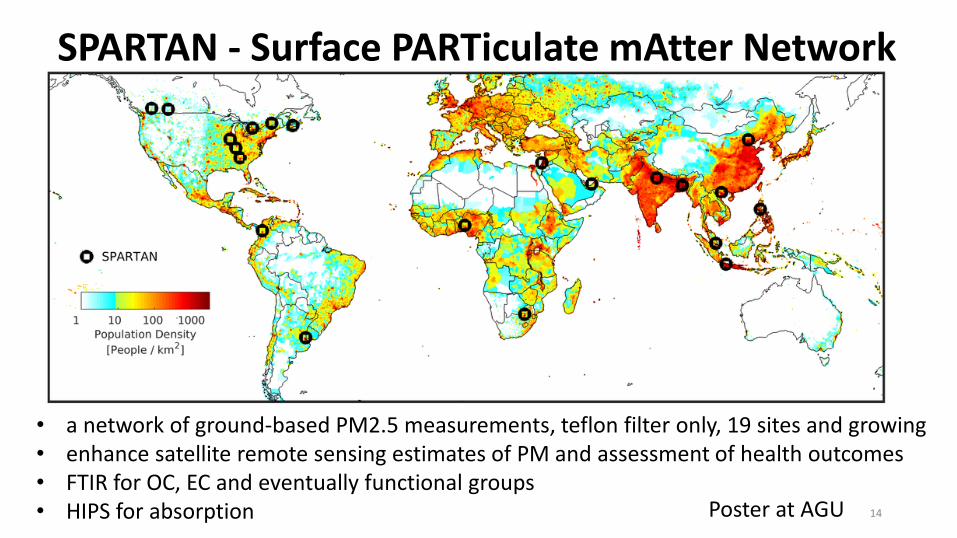
SPARTAN - Surface PARTiculate mAtter Network
14
• a network of ground-based PM2.5 measurements, teflon filter only, 19 sites and growing• enhance satellite remote sensing estimates of PM and assessment of health outcomes• FTIR for OC, EC and eventually functional groups • HIPS for absorption Poster at AGU

FT-IR spectra of SPARTAN samples
15
C-HC-OH N-H
C=O
Rice field burning
-0.01
0.00
0.01
0.02
0.03
0.04
0.05
0.06
150020002500300035004000
Rehovot, IsraelAugust, 2018 – June 2019
Urban, reacted sea salt, sand/dust-0.01
0.00
0.01
0.02
0.03
0.04
0.05
0.06
0.07
150020002500300035004000
Hanoi, VietnamAugust, 2018 - June 2019

SPARTAN sites – recent additions
16
Very high mass, ammonium from ammonium sulfate, small CH and C=O
Low mass, Si-O peaks, aOH, NH4, CH and C=O
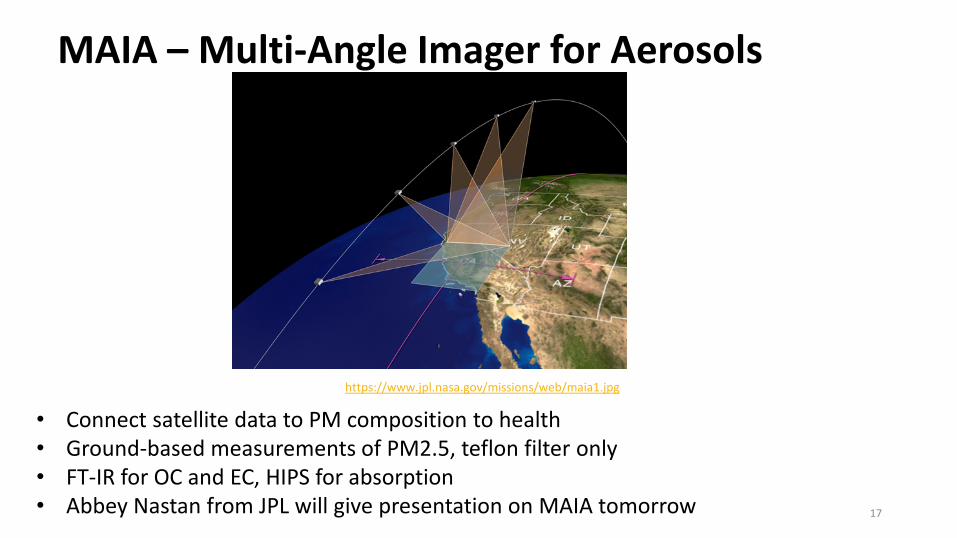
MAIA – Multi-Angle Imager for Aerosols
17
https://www.jpl.nasa.gov/missions/web/maia1.jpg
• Connect satellite data to PM composition to health• Ground-based measurements of PM2.5, teflon filter only• FT-IR for OC and EC, HIPS for absorption• Abbey Nastan from JPL will give presentation on MAIA tomorrow
18
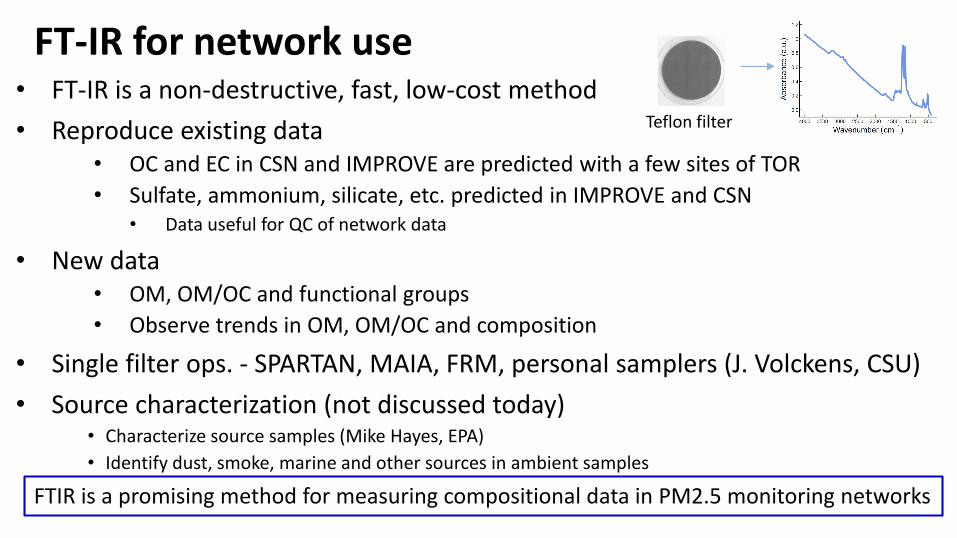
FT-IR for network use• FT-IR is a non-destructive, fast, low-cost method• Reproduce existing data
• OC and EC in CSN and IMPROVE are predicted with a few sites of TOR• Sulfate, ammonium, silicate, etc. predicted in IMPROVE and CSN
• Data useful for QC of network data
• New data• OM, OM/OC and functional groups • Observe trends in OM, OM/OC and composition
• Single filter ops. - SPARTAN, MAIA, FRM, personal samplers (J. Volckens, CSU)• Source characterization (not discussed today)
• Characterize source samples (Mike Hayes, EPA)• Identify dust, smoke, marine and other sources in ambient samples
FTIR is a promising method for measuring compositional data in PM2.5 monitoring networks
Teflon filter
19
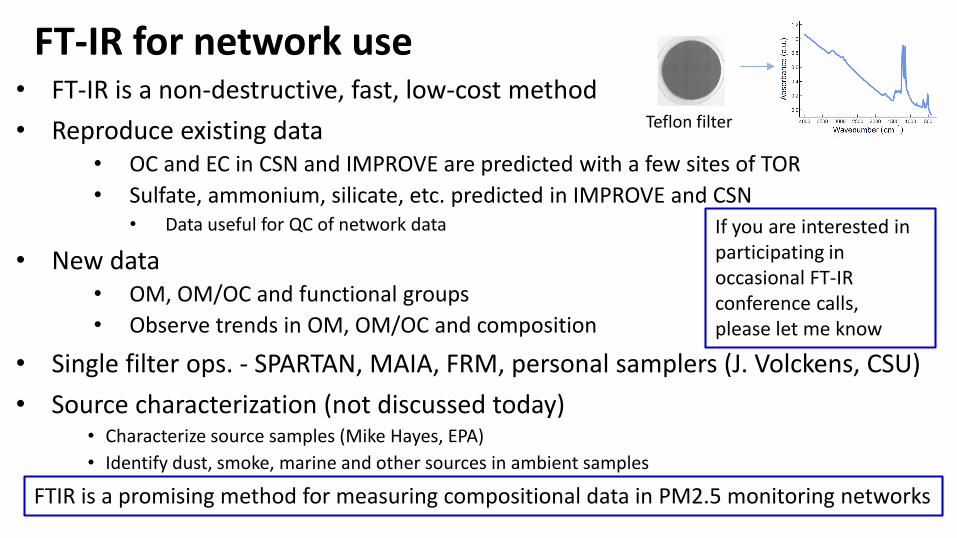
FT-IR for network use• FT-IR is a non-destructive, fast, low-cost method• Reproduce existing data
• OC and EC in CSN and IMPROVE are predicted with a few sites of TOR• Sulfate, ammonium, silicate, etc. predicted in IMPROVE and CSN
• Data useful for QC of network data
• New data• OM, OM/OC and functional groups • Observe trends in OM, OM/OC and composition
• Single filter ops. - SPARTAN, MAIA, FRM, personal samplers (J. Volckens, CSU)• Source characterization (not discussed today)
• Characterize source samples (Mike Hayes, EPA)• Identify dust, smoke, marine and other sources in ambient samples
FTIR is a promising method for measuring compositional data in PM2.5 monitoring networks
Teflon filter
If you are interested in participating in occasional FT-IR conference calls,please let me know

FTIR Publicationso OC and EC – IMPROVE, CSN and FRM methods
o Predicting TOR OC for IMPROVE, Dillner and Takahama, Atmos. Meas. Tech., 8, 1097-1109, https://doi.org/10.5194/amt-8-1097-2015, 2015a.
o Predicting TOR EC for IMPROVE, Dillner and Takahama, Atmos. Meas. Tech., 8, 4013-4023, https://doi.org/10.5194/amt-8-4013-2015, 2015b.
o Predicting OC and EC for IMPROVE at different sites/years, Atmos. Meas. Tech., 9, 441-454, https://doi.org/10.5194/amt-9-441-2016, 2016.
o Predicting TOR OC for CSN, Weakley, Takahama and Dillner, Aerosol Science and Technology, 50, 1096-1114, https://doi.org/10.1080/02786826.2016.1217389, 2016.
o Predicting TOR EC for CSN, Weakley, Takahama, Wexler, Dillner, Aerosol Science and Technology, https://doi.org/10.1080/02786826.2018.1439571, 2018.
o Predicting TOR OC and EC for FRM from CSN calibrations, Weakley, et al. Aerosol Science and Technology, https://doi.org/10.1080/02786826.2018.1504161, 2018.
o Multiple FT-IR Instruments: Effect on Multivariate Calibration Performance, Debus et al., Applied Spectroscopy, https://doi.org/10.1177/0003702818804574, 2018.
o Review of statistical calibration strategies for FT-IR in IMPROVE and CSN, Takahama et al., Atmos. Meas. Tech., 12, 525-567, https://doi.org/10.5194/amt-12-525-2019, 2019.
o OC and EC - applicationo Impact of the 2016 Fort McMurray Horse River Wildfire on PM in Alberta, Canada, Landis et al., Science of the Total
Environment, vol. 618, 1665-1676, https://doi.org/10.1016/j.scitotenv.2017.10.008, 2018.
20
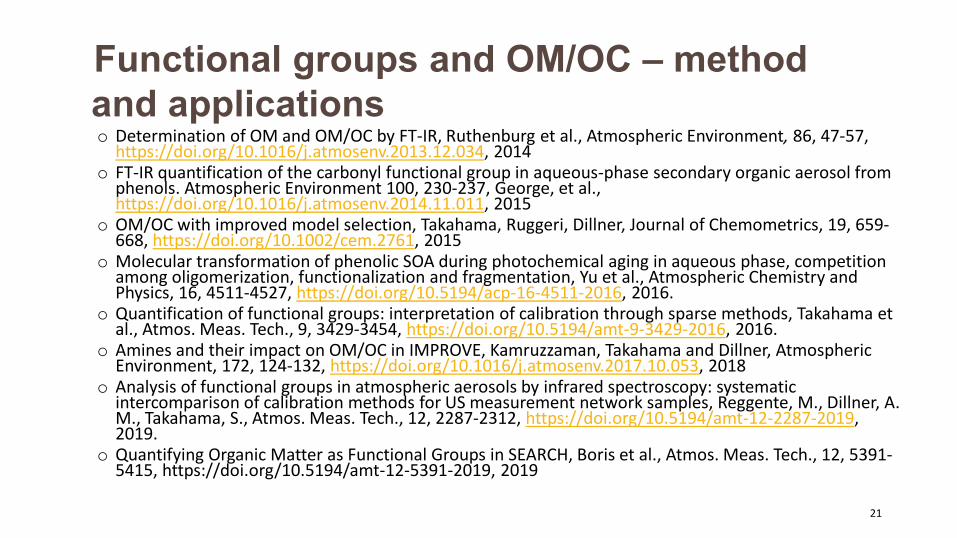
Functional groups and OM/OC – method and applicationso Determination of OM and OM/OC by FT-IR, Ruthenburg et al., Atmospheric Environment, 86, 47-57,
https://doi.org/10.1016/j.atmosenv.2013.12.034, 2014o FT-IR quantification of the carbonyl functional group in aqueous-phase secondary organic aerosol from
phenols. Atmospheric Environment 100, 230-237, George, et al., https://doi.org/10.1016/j.atmosenv.2014.11.011, 2015
o OM/OC with improved model selection, Takahama, Ruggeri, Dillner, Journal of Chemometrics, 19, 659-668, https://doi.org/10.1002/cem.2761, 2015
o Molecular transformation of phenolic SOA during photochemical aging in aqueous phase, competition among oligomerization, functionalization and fragmentation, Yu et al., Atmospheric Chemistry and Physics, 16, 4511-4527, https://doi.org/10.5194/acp-16-4511-2016, 2016.
o Quantification of functional groups: interpretation of calibration through sparse methods, Takahama et al., Atmos. Meas. Tech., 9, 3429-3454, https://doi.org/10.5194/amt-9-3429-2016, 2016.
o Amines and their impact on OM/OC in IMPROVE, Kamruzzaman, Takahama and Dillner, Atmospheric Environment, 172, 124-132, https://doi.org/10.1016/j.atmosenv.2017.10.053, 2018
o Analysis of functional groups in atmospheric aerosols by infrared spectroscopy: systematic intercomparison of calibration methods for US measurement network samples, Reggente, M., Dillner, A. M., Takahama, S., Atmos. Meas. Tech., 12, 2287-2312, https://doi.org/10.5194/amt-12-2287-2019, 2019.
o Quantifying Organic Matter as Functional Groups in SEARCH, Boris et al., Atmos. Meas. Tech., 12, 5391-5415, https://doi.org/10.5194/amt-12-5391-2019, 2019
21
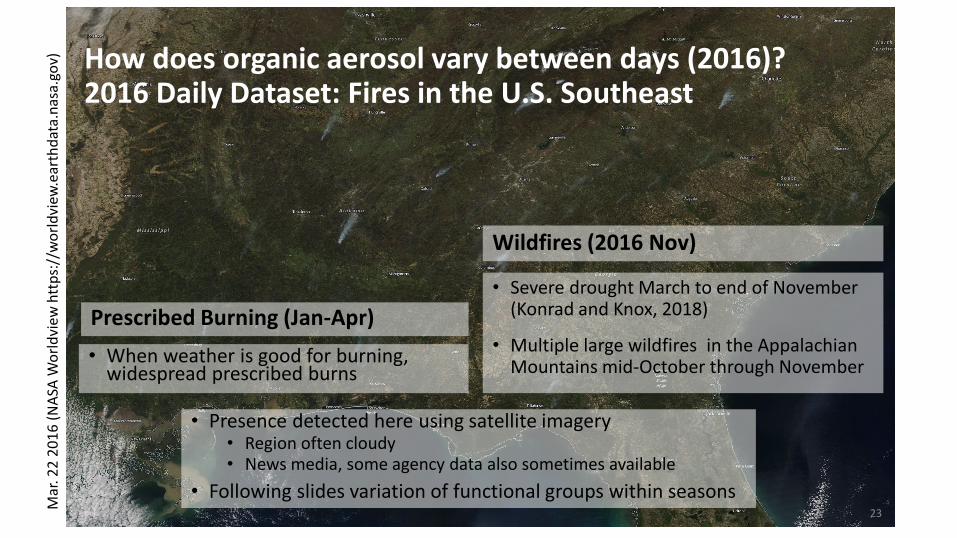
How does organic aerosol vary between days (2016)?2016 Daily Dataset: Fires in the U.S. Southeast
Prescribed Burning (Jan-Apr)• When weather is good for burning,
widespread prescribed burns
Wildfires (2016 Nov)
• Severe drought March to end of November (Konrad and Knox, 2018)
• Multiple large wildfires in the Appalachian Mountains mid-October through November
23Mar
. 22
2016
(NAS
A W
orld
view
htt
ps:/
/wor
ldvi
ew.e
arth
data
.nas
a.go
v)
• Presence detected here using satellite imagery • Region often cloudy • News media, some agency data also sometimes available
• Following slides variation of functional groups within seasons

24
2016 Daily Data: Spring Prescribed Fire Season (Jan-Apr)
• Fire indicated by orange stars, precipitation indicated by blue stars
• Peaks in OM conc. often correspond to fires
• cannot yet detect fires from non-fires by spectra/functional group data in this data set
• Days with low OM conc. often correspond to rain
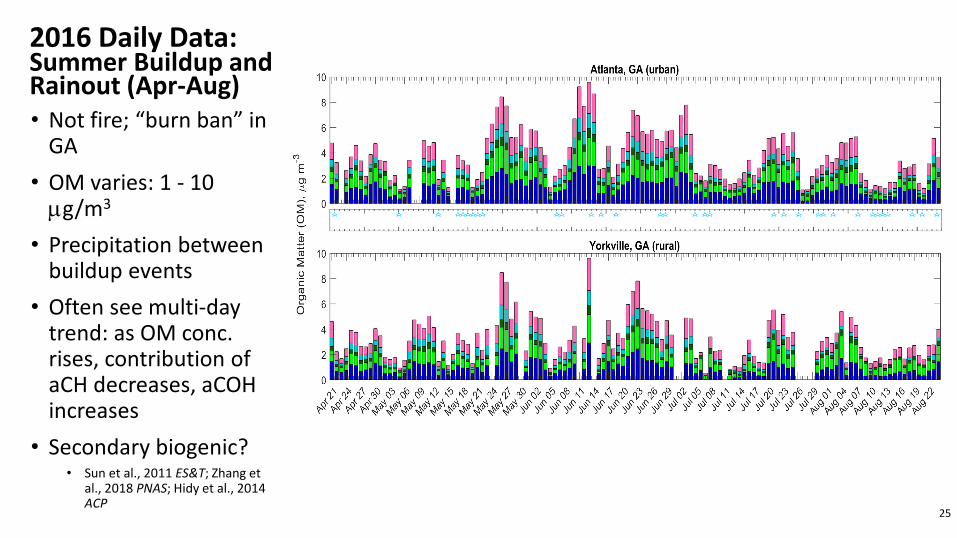
• Not fire; “burn ban” in GA
• OM varies: 1 - 10 µg/m3
• Precipitation between buildup events
• Often see multi-day trend: as OM conc. rises, contribution of aCH decreases, aCOHincreases
• Secondary biogenic? • Sun et al., 2011 ES&T; Zhang et
al., 2018 PNAS; Hidy et al., 2014 ACP
25
2016 Daily Data: Summer Buildup and Rainout (Apr-Aug)

26
2016 Daily Data: Winter Wildfires
• Wildfires, heavy smoke in Nov. indicated by high OM concentrations
• Seasonally high contribution of aCH
• Residential burning? e.g., Chen et al., 2012, JGR