Trends in Oil Spills from Tanker Ships 1995-2004 · Spills greater than 7 tonnes tend to be much...
14
Trends in Oil Spills from Tanker Ships 1995-2004 Keisha Huijer International Tanker Owners Pollution Federation (ITOPF) London, United Kingdom [email protected] Abstract The number of oil spills from tanker ships has decreased significantly over the last 30 years. In fact the average number of spills per annum in the 1970s was approximately 3 times that for the 80’s and 90’s and more than 6 times the number so far for this decade. This is despite a steady increase in seaborne oil trade since 1985. This paper examines trends in tanker oil spills worldwide over the 10 year period from 1995 to 2004 and analyses potential influences on spill volumes and frequencies for incidents of 3 different spill size classes. Factors that are used to identify trends include: • Causes i.e. the primary operation or accidental event in progress at the time of the incident • Location in terms of the countries where spills frequently occur • Oil type (crude, bunkers, fuel cargo, white products) • Shipping Legislations It is difficult to identify any one factor which contributes to the decline in overall volume and frequency of spills, rather it is considered to be the result of a range of initiatives taken by governments and the shipping industry. 1 Introduction Since 1974, ITOPF has maintained a database of oil spills from tankers, combined carriers and barges, which includes all reported accidental spillages except those resulting from acts of war. The database contains information on the vessel, amount and type of oil spilt, cause and location. For historical reasons and convenience during statistical analysis, spills are broadly categorised by size (<7 tonnes, 7-700 tonnes and >700 tonnes, equivalent to <50 bbl, 50 – 5,000 bbl and > 5,000 bbl) although the actual amount spilt is also recorded. Information is now held on nearly 10,000 incidents in the 30 year period 1974 - 2004. The amount of oil spilt in an incident represents all the oil lost to the environment, including that which is burnt or remains in a sunken vessel. Information is gathered from published sources, such as the shipping press and other specialist publications, and from vessel owners and their insurers. It also includes data gathered during ITOPF attendance on site at spills, which total more than 500 incidents in the last 25 years, about half of which were tankers. The majority of reported spills have been from small operational spillages of <7 tonnes. Complete reporting of this category is difficult to achieve and relatively little statistical reliance is placed on the data. Spills greater than 7 tonnes tend to be much better reported and are therefore more reliable for statistical analysis.
Transcript of Trends in Oil Spills from Tanker Ships 1995-2004 · Spills greater than 7 tonnes tend to be much...

Trends in Oil Spills from Tanker Ships 1995-2004 Keisha Huijer
International Tanker Owners Pollution Federation (ITOPF) London, United Kingdom [email protected]
Abstract
The number of oil spills from tanker ships has decreased significantly over the last 30 years. In fact the average number of spills per annum in the 1970s was approximately 3 times that for the 80’s and 90’s and more than 6 times the number so far for this decade. This is despite a steady increase in seaborne oil trade since 1985. This paper examines trends in tanker oil spills worldwide over the 10 year period from 1995 to 2004 and analyses potential influences on spill volumes and frequencies for incidents of 3 different spill size classes. Factors that are used to identify trends include: • Causes i.e. the primary operation or accidental event in progress at the time of the
incident • Location in terms of the countries where spills frequently occur • Oil type (crude, bunkers, fuel cargo, white products) • Shipping Legislations
It is difficult to identify any one factor which contributes to the decline in overall volume and frequency of spills, rather it is considered to be the result of a range of initiatives taken by governments and the shipping industry. 1 Introduction
Since 1974, ITOPF has maintained a database of oil spills from tankers, combined carriers and barges, which includes all reported accidental spillages except those resulting from acts of war.
The database contains information on the vessel, amount and type of oil spilt, cause and location. For historical reasons and convenience during statistical analysis, spills are broadly categorised by size (<7 tonnes, 7-700 tonnes and >700 tonnes, equivalent to <50 bbl, 50 – 5,000 bbl and > 5,000 bbl) although the actual amount spilt is also recorded. Information is now held on nearly 10,000 incidents in the 30 year period 1974 - 2004. The amount of oil spilt in an incident represents all the oil lost to the environment, including that which is burnt or remains in a sunken vessel.
Information is gathered from published sources, such as the shipping press and other specialist publications, and from vessel owners and their insurers. It also includes data gathered during ITOPF attendance on site at spills, which total more than 500 incidents in the last 25 years, about half of which were tankers. The majority of reported spills have been from small operational spillages of <7 tonnes. Complete reporting of this category is difficult to achieve and relatively little statistical reliance is placed on the data. Spills greater than 7 tonnes tend to be much better reported and are therefore more reliable for statistical analysis.
The aim of this paper is to examine the trends in oil spills from tanker ships over the last ten years from 1995 to 2004, which are then compared to earlier periods (1975 – 1984 and 1985 – 1994), to try to identify the factors which may have contributed to any trends.
2 Trends in Spill Frequency
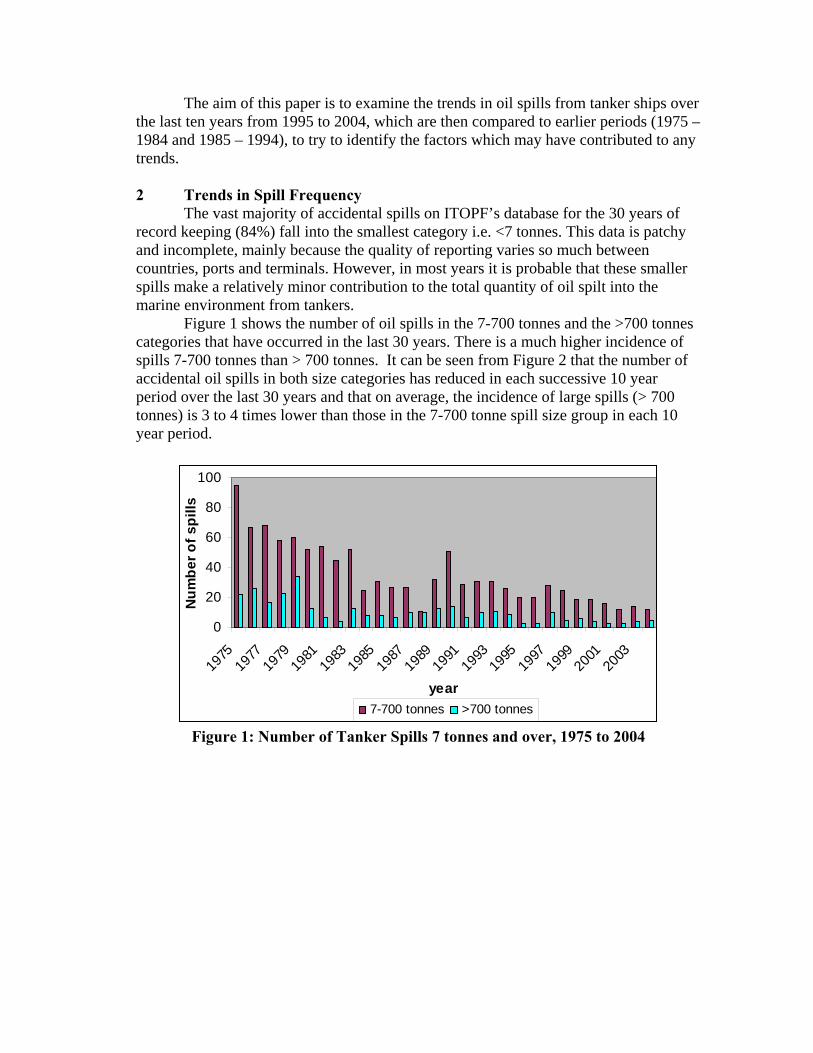
The vast majority of accidental spills on ITOPF’s database for the 30 years of record keeping (84%) fall into the smallest category i.e. <7 tonnes. This data is patchy and incomplete, mainly because the quality of reporting varies so much between countries, ports and terminals. However, in most years it is probable that these smaller spills make a relatively minor contribution to the total quantity of oil spilt into the marine environment from tankers.
Figure 1 shows the number of oil spills in the 7-700 tonnes and the >700 tonnes categories that have occurred in the last 30 years. There is a much higher incidence of spills 7-700 tonnes than > 700 tonnes. It can be seen from Figure 2 that the number of accidental oil spills in both size categories has reduced in each successive 10 year period over the last 30 years and that on average, the incidence of large spills (> 700 tonnes) is 3 to 4 times lower than those in the 7-700 tonne spill size group in each 10 year period.
0
20
40
60
80
100
1975
1977
1979
1981
1983
1985
1987
1989
1991
1993
1995
1997
1999
2001
2003
year
Num
ber o
f spi
lls
7-700 tonnes >700 tonnes
Figure 1: Number of Tanker Spills 7 tonnes and over, 1975 to 2004

0
10
20
30
40
50
60
70
1975 1985 1995Year
Avg
No
of S
pills
10 yr avg fpr spills 7-700 tonnes 10 yr avg >700 tonnes
Figure 2: Ten-year Averages for Number of Tanker Spills for Size groups 7-700 tonnes and >700 tonnes
The 5-year averages in Table 1 and the graph in Figure 3 shows that this step-
down reduction trend is continuing, with 35 % less spills of 7 tonnes and above occurring in the last 5 years than in the previous 5 years. The same percentage reduction was also observed for spills in the last 10 years compared with the previous 10-year period (232 down from 395). Furthermore the number of major incidents (> 700 tonnes) occurring in the past 10 years was only 45 % of those in the previous 10 years. Table 1: No of Tanker Spills 7 tonnes and over, 1995 to 2004
No of spills 7-700 t No of Spills >700 t Total spills ≥ 7 t 5 yr average for spills ≥ 7t
1995 20 3 23 1996 20 3 23 1997 28 10 38 27.8 1998 25 5 30 1999 19 6 25 2000 19 4 23 2001 16 3 19 2002 12 3 15 18.4 2003 14 4 18 2004 12 5 17

05
101520253035404550
1995 1996 1997 1998 1999 2000 2001 2002 2003 2004
No o
f Spi
lls
YrTotal no of spills 7 t and over 5 yr avg
18.4 per year
27.8 per year
Figure 3: Number of Tanker Oil Spills, 1995-2004
3 Trends in Spill Volume
As more reliable data on spills of 7 tonnes and above is held, the cumulative amounts of oil spilt during these incidents have been used to give a series of annual estimates of the total quantity spilt.
Figure 4 shows the amount of oil spilt in incidents where spillage was greater than or equal to 7 tonnes over the last 30 years. It is notable that a few very large spills are responsible for a high percentage of the total oil spilt. For example, in the ten-year period 1985-1994 there were 395 spills over 7 tonnes, totalling 1,430,000 tonnes, but 990,000 tonnes (70%) were spilt in just 10 incidents (approximately 2.5%). Figure 5 also demonstrates how the annual spill volume can be distorted by the volume spilt from these larger spills. Most recently for instance, in 2002, there were 15 spills of 7 tonnes or more but the amount spilt from the PRESTIGE (63,000 tonnes) accounted for approximately 94% of the total amount of oil spilt from tanker ships in that year. Other illustrations are found in 1979 (ATLANTIC EMPRESS - 287,000 tonnes), 1983 (CASTILLO DE BELLVER - 252,000 tonnes), 1988 (ODYSSEY, 132,000 tonnes) and 1991 (ABT SUMMER - 260,000 tonnes).

-
50
100
150
200
250
300
350
400
450
500
550
600
650
1975 1977 1979 1981 1983 1985 1987 1989 1991 1993 1995 1997 1999 2001 2003
(000
's of
tonn
es)
Atlantic Empress287,000 tonnes
Castillio de Bellver252,000 tonnes
ABT Summer 260,000 tonnes
Exxon Valdez37,000 tonnes
Khark V80,000 tonnes
Erika 20,000 tonnes
Prestige63,000 tonnes
Odyssey 132,000 tonnes
Figure 4: Amount of Oil Spilt from Tanker Ships, 1975-2004
An examination of average annual spill volumes in the period 1995-2004 (Table
2) showed that the volume spilt in the latter half of the 1990s was almost 3 times the volume for the last 5 years. Also, the total amount spilt in the last 10 years was one fifth of the amount spilt in the previous 10 years.
Table 2: Volume of Oil Spilt from Tankers per year, 1995 – 2004 and 1985-1994
Year Volume (tonnes)
5 yr Average
Year Volume (tonnes)
1995 12,000 1985 85,000 1996 80,000 1986 19,000 1997 72,000 41,600 1987 30,000 1998 13,000 1988 190,000 1999 31,000 1989 174,000 2000 14,000 1990 61,000 2001 8,000 1991 430,000 2002 67,000 15,800 1992 172,000 2003 42,000 1993 139,000 2004 15,000 1994 130,000
287,000 1,430,000

4 Spill Incidents by Country The 232 tanker incidents resulting in spills of 7 tonnes or more in the last 10
years were distributed over 60 countries. The USA experienced the highest reported frequency, with 24 % (55 incidents)
of the total number for that period. This relatively high frequency could possibly be attributed in part to the fact that the USA are large importers of oil, which results in heavy shipping traffic and hence a greater risk of accidental spillage and also due to reliable reporting of spill incidents . It is worth noting that this figure is only half the number of spill incidents of 7 tonnes or more for the preceding 10 year period, 1985 to 1994.
South Korea experienced the second highest frequency, with 15 spills in the last 10 years, representing 6.4% of the total. Large spills in South Korea during the 90s were due mainly to groundings and collisions in the coastal zone during poor weather conditions. In recent years, the South Korean government made changes to their legislation to move large vessels further offshore and away from congested shipping lanes in coastal archipelagos. This appears to have contributed to a significant reduction in accidents.
The highest volume of oil spilt from tankers in any one year between 1995-2004 was experienced by the UK, almost entirely due to the SEA EMPRESS spill (72,360 tonnes) while the second highest was Spain, the majority of which was due to the PRESTIGE (63,000 tonnes).
As there have been few spills per country for each year during the last 10 years, it is not possible to run a detailed statistical analysis of the number of spills by country for the period. Consequently, trends in countries were analysed by decades, and those which experienced more than 25 spills over the last 30 years are presented in Table 3. It can be seen from the charts in Figure 5 that the highest number of spills were recorded primarily in either the 70s or 80s for most of the countries with the exception of South Korea which recorded the highest frequency in the 90s. In eight out of ten countries there was a significant decline in the number of spills from the 1990s to the present, compared with the 1970s.
Table 3: Number of Tanker Oil Spills by Countries per Decade
No of Spills COUNTRIES 1970s 1980s 1990s 2000s Total Brazil 7 9 7 6 29 Canada 12 18 6 0 36 Germany 9 9 5 3 26 Japan 39 29 14 4 86 Netherlands 20 15 6 0 41 Singapore 12 4 5 7 28 South Korea 1 10 19 4 34 Sweden 19 9 5 0 33 UK 34 27 16 2 79

USA 142 147 90 3 382
Figure 5: Number of Spills by Country per Decade for Countries with more than 25 Spills
Using Europe as an example, the higher incidence of spills in the countries
stated in Table 3 can possibly be explained by looking at the tanker route data for the region (Figure 6). This shows that large quantities of oil are transported around the Atlantic Coasts and through the English Channel to Northern Europe. Increasing oil exports from Russia through their ports of Murmansk, Primorsk and Novorssiysk have resulted in large quantities also being transported southward and westward along this route. Coupled with other factors such as poor weather, congestion or difficult navigation through narrow passages, the risk of spillage in these areas has been heightened.
0
50
100
150
200
250
USAJa
pan
UK
Netherlan
ds
Canada
South
Korea
German
yBraz
il
Sweden
No o
f tan
ker s
pills
75 to 84 85 to 94 95 to 04

Figure 6: Map of Tanker Shipping Routes in Europe, 2001 (LMIU, 2001)
5 Type of Oil Spilt, 1995 - 2004 The type of oil spilt has been sub-divided into bunkers, crude, fuel cargo, white
product and others. White products refer mainly to gas oils and diesel which are not persistent oils. Given that a substantially greater volume of crude oil is transported by sea than white products or bunker fuel, not surprisingly, there have been relatively higher occurrences and volumes of crude oil spillages worldwide (Table 4).
Table 4: Type of Oil Spilt from Tanker Ships by Size of Spill, 1995 – 2004
% Number of Spills % Amount Spilt Oil Type < 7 t 7-700 t >700 t < 7 t 7-700 t >700 t Bunker 8 13 2 5 9 0.2 Crude 30 24 39 43 20 45 Fuel (Cargo) 18 38 39 22 52 47 White product 10 18 17 10 15 7 Others 6 3 2 8 3 0 Unknown 28 4 0 11 1 0
Historically, there has been a higher frequency of crude oil spills than any other
oil type for all spill size groups. However, in recent years, a shift in the balance is becoming apparent, as relatively higher incidences of fuel cargo spills are being observed as seen in Figure 7. This trend is likely to continue with increasing exports of fuel cargo out of Northern Europe.
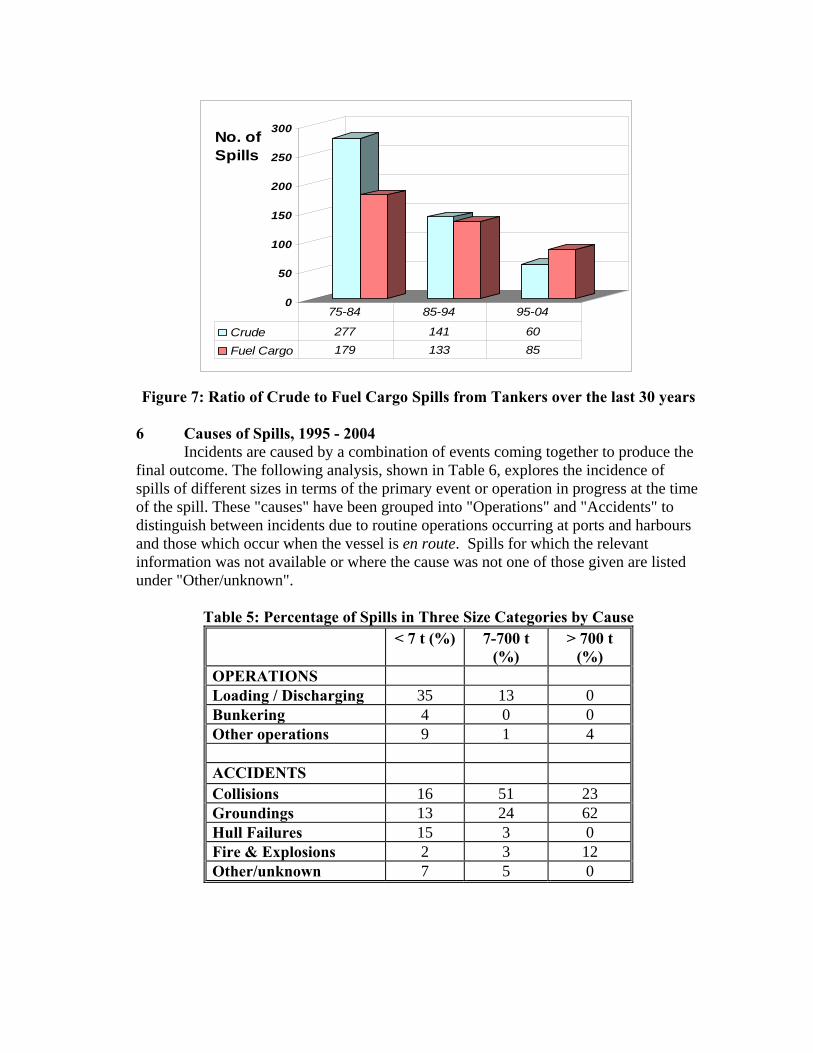
Figure 7: Ratio of Crude to Fuel Cargo Spills from Tankers over the last 30 years 6 Causes of Spills, 1995 - 2004 Incidents are caused by a combination of events coming together to produce the final outcome. The following analysis, shown in Table 6, explores the incidence of spills of different sizes in terms of the primary event or operation in progress at the time of the spill. These "causes" have been grouped into "Operations" and "Accidents" to distinguish between incidents due to routine operations occurring at ports and harbours and those which occur when the vessel is en route. Spills for which the relevant information was not available or where the cause was not one of those given are listed under "Other/unknown".
Table 5: Percentage of Spills in Three Size Categories by Cause < 7 t (%) 7-700 t
(%) > 700 t
(%) OPERATIONS Loading / Discharging 35 13 0 Bunkering 4 0 0 Other operations 9 1 4 ACCIDENTS Collisions 16 51 23 Groundings 13 24 62 Hull Failures 15 3 0 Fire & Explosions 2 3 12 Other/unknown 7 5 0
0
50
100
150
200
250
300No. of Spills
Crude 277 141 60
Fuel Cargo 179 133 85
75-84 85-94 95-04

The main causes of spills in the < 7 tonnes category (Figure 8) were operational, with 34% occurring during loading/discharging. Accidents were the major cause in the 7-700 tonne group (Figure 9), with collisions and groundings resulting in 51% and 24% of spills respectively. Groundings accounted for 62% of spills >700 tonnes (Figure 10) while operational factors played a minor role (4%).
This pattern is consistent with causes on ITOPF’s database since record collection began with the main causes of spillages of < 7 tonnes being primarily operational and the larger spills mainly due to accidents. However, there has been a shift in balance in the ratios of collisions to groundings over the last 30 years compared to the last 10 years for these larger incidents, but no discernible trend was observed.
A comparison of spill frequency in oil exporting and importing countries in an earlier ITOPF study (ITOPF, 1996) revealed that the major importing countries experienced a higher number of spills than exporting countries. This held true for major accidents as well as smaller spills, which are typically operational, indicating that there is a greater risk of spillage during cargo discharge than cargo loading. Many factors may contribute to this result, including greater number of oil terminals and other facilities and more significant coastal oil movements in oil importing countries compared with exporting countries.
The results of this analysis may also be viewed as justification for the compensation system under the IMO’s International Oil Pollution Compensation Fund Convention (1992 Fund), in which entities in member states that receive crude oil and heavy fuel oil by sea contribute to the payment of compensation for spill clean-up costs when amounts exceed shipowner’s liability limits under *CLC 92.
Groundings13%
Collisions16%
Other operations9%
Bunkering4%
Loading / Discharging
34%Hull Failures15%
Other/unknown7%Fire & Explosions
2%
Loading / Discharging Bunkering Other operations CollisionsGroundings Hull Failures Fire & Explosions Other/unknow n
Figure 8: Causes of Tanker Spills < 7 tonnes, 1995-2004
* The International Convention on Civil Liability for Oil Pollution Damage (CLC) – designed to ensure that adequate compensation is available to persons who suffer from oil pollution by placing the liability on the owner of the spilling ship (IMO, 1990). Liability to the tanker owners under the most updated version (CLC 92) ranges from 4.5 million Special Drawing Rights (SDR) – approximately US$ 6.7 million to 90 million SDR – approximately $US 135 million – depending on the size of the tanker.

Loading / Discharging
13%
Other operations1%
Fire & Explosions3%
Other/unknow n5%
Hull Failures3%
Groundings24%
Collisions51%
Loading / Discharging Bunkering Other operationsCollisions Groundings Hull FailuresFire & Explosions Other/unknown
Figure 9: Causes of Tanker Spills 7-700 tonnes, 1995-2004
Collisions23%
Other operations4%
Groundings62%
Fire & Explosions12%
Other operations Collisions Groundings Hull Failures Fire & Explosions
Figure 10: Causes of Tanker Spills > 700 tonnes, 1995-2004 7 Reasons for the Trends
The above analyses show that there is a continuing trend towards a decrease in the number and size of spills in incidents from tanker ships. This is despite a steady increase in seaborne oil trade since the mid 80s (See Figure 11).

0
2000
4000
6000
8000
10000
12000
1975 1977 1979 1981 1983 1985 1987 1989 1991 1993 1995 1997 1999 2001 2003
Year
Billion tonne-miles
0
20
40
60
80
100
120
140
No of spills > 7 tonnes
Seaborne Oil Trade (Billion Tonne-Miles) [Source: Fearnresearch, 2005] No. of spills > 7 tonnes Figure 11: Comparison between the Number of Tanker Spills (7 tonnes and over)
and Seaborne Oil Trade from 1975-2004 These trends can largely be attributed to reduced accident rates due to preventative measures taken by the maritime section of the United Nations – the International Maritime Organisation (IMO) – and national legislations and increased concerns over escalating financial liabilities. Some notable influences towards the observed reduction in the number of spills are believed to be as follows:
1. International Convention for the Prevention of Pollution from Ships, 1973, as modified by the Protocol of 1978 (MARPOL 73/78). The MARPOL Convention, adopted by the IMO is the main international Convention covering prevention of pollution to the marine environment by ships from operational or accidental causes. It is a combination of two treaties adopted in 1973 and 1978 respectively and updated by amendments through the years. The 1978 Protocol entered into force in 1983, but some of its requirements were implemented by shipping operators prior to this. In 1980, according to the National Academy of Sciences of the United States, approximately 1.5 million tonnes of oil entered the marine environment, 1.1 million of which resulted from tanker operations and accidents (IMO, 1990). By 1989, pollution from ships had been reduced to 158,000 tonnes, of which tankers contributed 50,000. MARPOL 73/78 has been credited by many to be responsible for reduction in the number of tanker incidents from the ‘70s to ‘80s (IMO, 1990).

2. Oil Pollution Act 1990 (OPA 90) was established in the USA primarily in response to the 1989 EXXON VALDEZ spill in Prince William Sound, Alaska. As a result, the United States has strict regulations for tanker ships operating in its waters, and the spiller can potentially face unlimited liability for costs related to clean-up, penalties and damage (Etkin, 2001). Improved safety standards, contingency planning, exercise programs and other measures have contributed to the downward trend in numbers and volumes of spills.
3. International Convention for the Safety of Life at Sea, 1974 (SOLAS 1974) also introduced by the IMO was amended to incorporate Chapter IX aimed at making ships safer and seas cleaner. This is called the International Management Code for the Safety of Ships and for Pollution Prevention (The ISM Code) and was implemented in July 1998. It was formulated in response to a number of high profile shipping accidents during the late 80s and early 90s. Reports into many of these incidents cited human error as the main factor. The ISM Code is a brief set of guidelines describing actions that shipowners should undertake in order to implement a safety management system both onboard their ships and in their organizations ashore. It stipulates that the vessel and the operator both have to be approved and certified by the flag state as proof of compliance (Anderson, 2003).
Below Figure 12 shows the 10 year averages for tanker spills in relation to the years in which the above-mentioned instruments came into force.
Figure 12: Ten-year Averages for the Number of Tanker Spills in Relation to the
Introduction of Shipping Regulations
8 Conclusion Today, there are approximately 8,000 tankers transporting crude oil and oil
products around the world, most of which, operate without incident. However, major

spillages due to tanker accidents, though infrequent, have had profound consequences on the image of the tanker industry.
International laws and conventions formulated in response to these incidents and subsequent acceptance by signatory countries, as well as OPA 90 in the USA, have put obligations on Governments to implement regulations into their national law, and shipowners to comply. These measures have been effective as preventive instruments in the reduction of oil pollution at sea on a global level.
Results of investigations into the causes of spills continue to inform the international process to further prevent and reduce marine oil pollution due to tankers. It would be interesting to monitor in future years the effects of other recent initiatives taken by the IMO to address concerns related to the safe transport of oil.
9 References Anderson, P., Cracking the Code, The Nautical Institute, UK, 2003. Etkin, D.S., Analysis of Oil Spill Trends in the US and Worldwide, in Proceedings of the International Oil Spill Conference, pp. 1291-1300, 2001. Fearnresearch, Fearnleys Review 2004, Fearnresearch, Norway, 2005. IMO, Cleaner Oceans: The Role of the IMO in the 1990s, World Maritime Day, IMO, pp. 6, 12, 1990. ITOPF, Importers or Exporters – Who Should Fit the Bill? in Ocean Orbit, ITOPF Ltd, p. 7, June, 1996. ITOPF, ITOPF Handbook 2004/2005, p. 28, 2004. LMIU, LMIU Shipping Data, Lloyd’s Marine Intelligence Unit, 2001.