Trends in Natural Gas Markets 2006 Bradford G. Leach Senior Director, Electricity and Natural Gas...
55
Trends in Natural Gas Markets 2006 Bradford G. Leach Senior Director, Electricity and Natural Gas Research NYMEX 2006 Annual Meeting Illinois Municipal Gas Agency April 19, 2006 Springfield, IL
-
Upload
payton-sopp -
Category
Documents
-
view
218 -
download
0
Transcript of Trends in Natural Gas Markets 2006 Bradford G. Leach Senior Director, Electricity and Natural Gas...
Trends in Natural Gas Markets 2006
Bradford G. LeachSenior Director, Electricity and Natural Gas
ResearchNYMEX
2006 Annual MeetingIllinois Municipal Gas Agency
April 19, 2006Springfield, IL
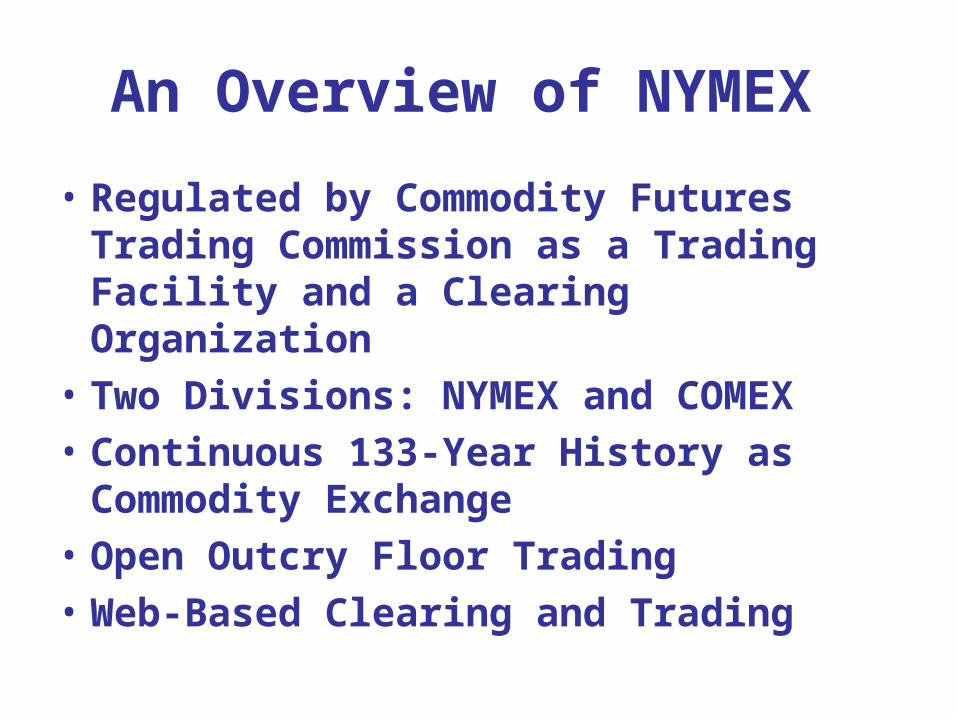
An Overview of NYMEX
• Regulated by Commodity Futures Trading Commission as a Trading Facility and a Clearing Organization
• Two Divisions: NYMEX and COMEX
• Continuous 133-Year History as Commodity Exchange
• Open Outcry Floor Trading
• Web-Based Clearing and Trading
Economic Function of Regulated Commodity Futures Exchange
• Hedging Function– Price risk is competitively shifted between parties
with opposing risk profiles or tolerance for risk
• Price Discovery– Prices are determined :
• In an open, competitive and transparent manner• By market participants• And disseminated throughout the world instantaneously
through market data vendors
NYMEX Regulatory Protections
• NYMEX CFTC Regulation
• Compliance Department
• Market Surveillance
• Trade Surveillance
• Financial Surveillance
NYMEX MARKET SURVEILLANCE
• Staff Conducts Daily Surveillance of NYMEX Market Activity and Analyzes Trading Activity and Fundamental Factors in Underlying Cash Markets
• Futures Review is Based Upon Large Trader Reporter Data and Exchange Audit Trail
• Staff also Enforces Exchange Position Limit and Position Accountability Levels
NYMEX Clearinghouse and Financial Protections
• Currently 40 Clearing Members• Clearing Member Financial Requirements
– $5 Million Minimum Net Working Capital• Currently $14 Billion on Deposit in Margin Funds• Rated AA+ by S&P• Clearing Member Guaranty Fund of Over $140 Million• $100 Million Default Insurance• Margin Requirements
– Original– Variation
• NYMEX Emergency Procedures
Emergency Procedures
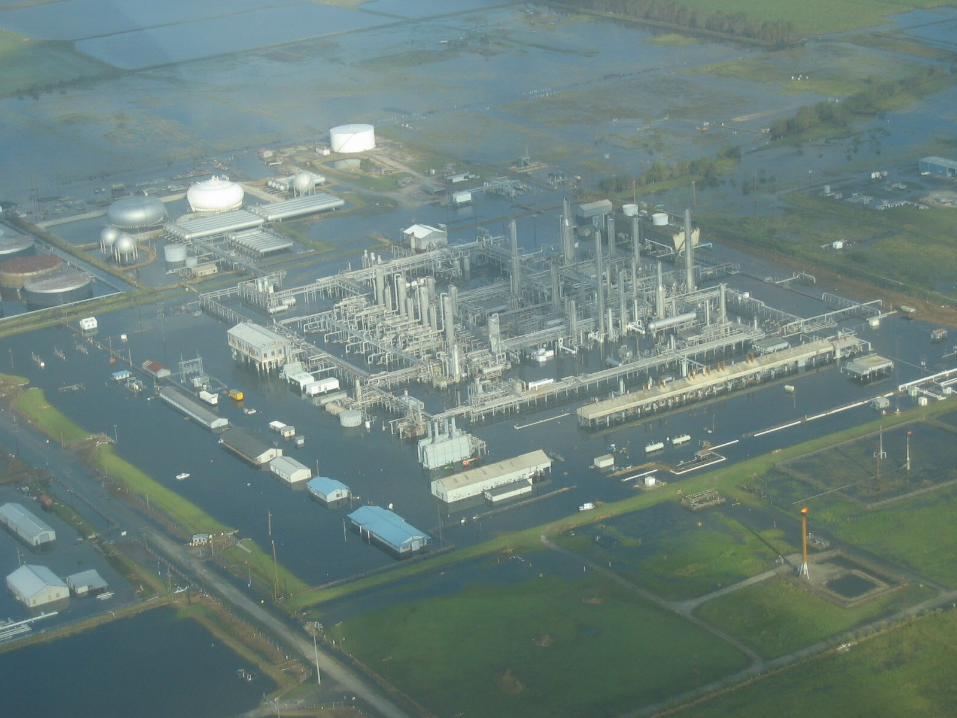
• Delivery Committee Operation• Hurricanes Andrew, Katrina, Rita• Resolution of Financial Difficulties with
Clearing Firms• Rapid Adjustment to Volatile Market
Conditions – Persian Gulf, NG Volatility, Increase in Oil
Prices • Business as Usual
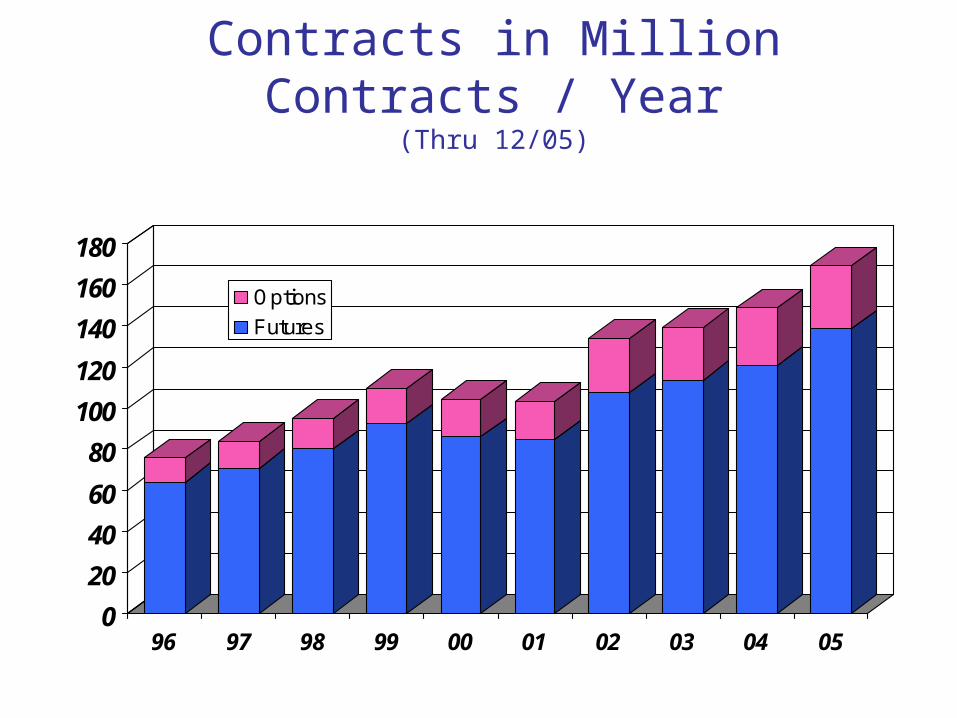
Total Volume of NYMEX Cleared Contracts in Million Contracts / Year
(Thru 12/05)
0
20
40
60
80
100
120
140
160
180
96 97 98 99 00 01 02 03 04 05
Options
Futures
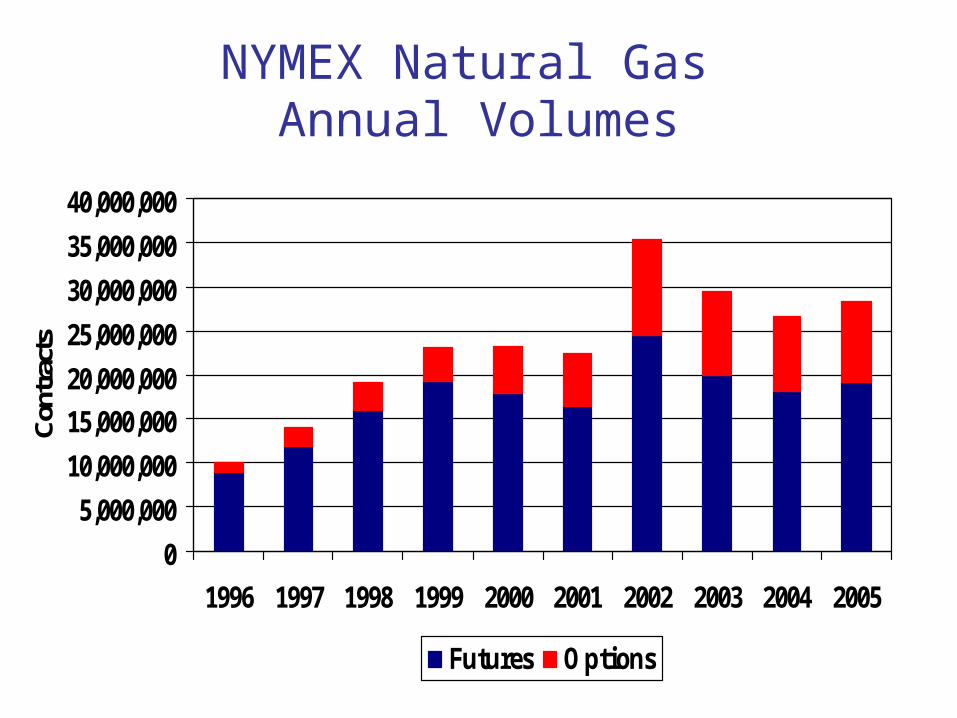
NYMEX Natural Gas Annual Volumes
0
5,000,000
10,000,000
15,000,00020,000,000
25,000,000
30,000,000
35,000,000
40,000,000
1996 1997 1998 1999 2000 2001 2002 2003 2004 2005
Cont
ract
s
Futures OptionsThru 10/05
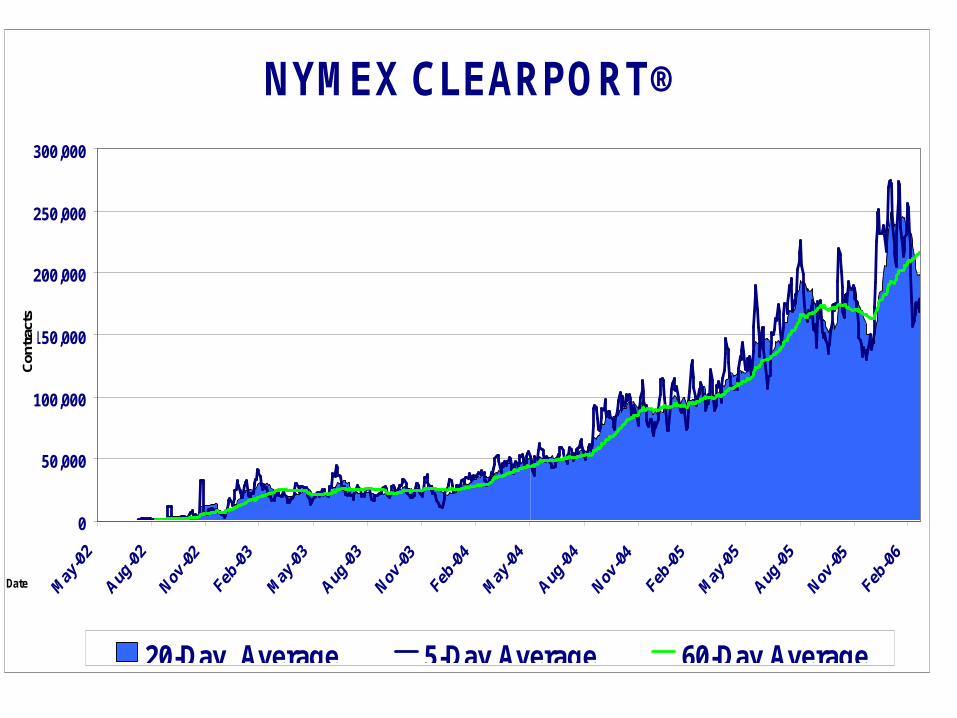
NYMEX CLEARPORT®
0
50,000
100,000
150,000
200,000
250,000
300,000
Date
Con
trac
ts
20-Day Average 5-Day Average 60-Day Average
0.000
2.000
4.000
6.000
8.000
10.000
12.000
14.000
16.000
4/3
/1990
6/3
/1991
8/3
/1992
10/3
/1993
12/3
/1994
2/3
/1996
4/3
/1997
6/3
/1998
8/3
/1999
10/3
/2000
12/3
/2001
2/3
/2003
4/3
/2004
6/3
/2005
$/M
MB
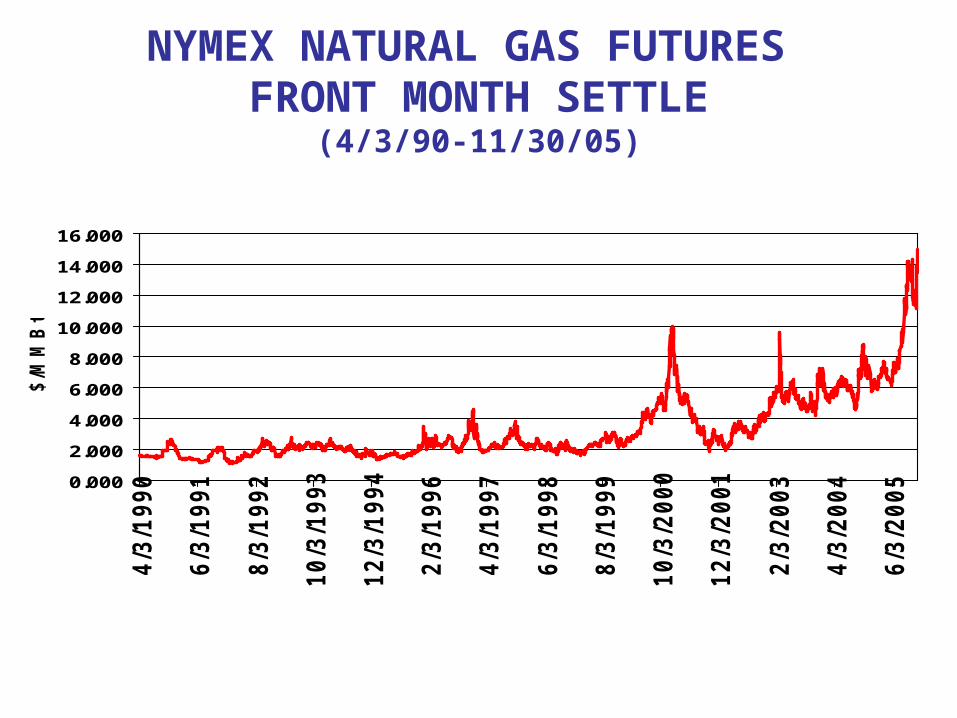
tuNYMEX NATURAL GAS FUTURES
FRONT MONTH SETTLE(4/3/90-11/30/05)
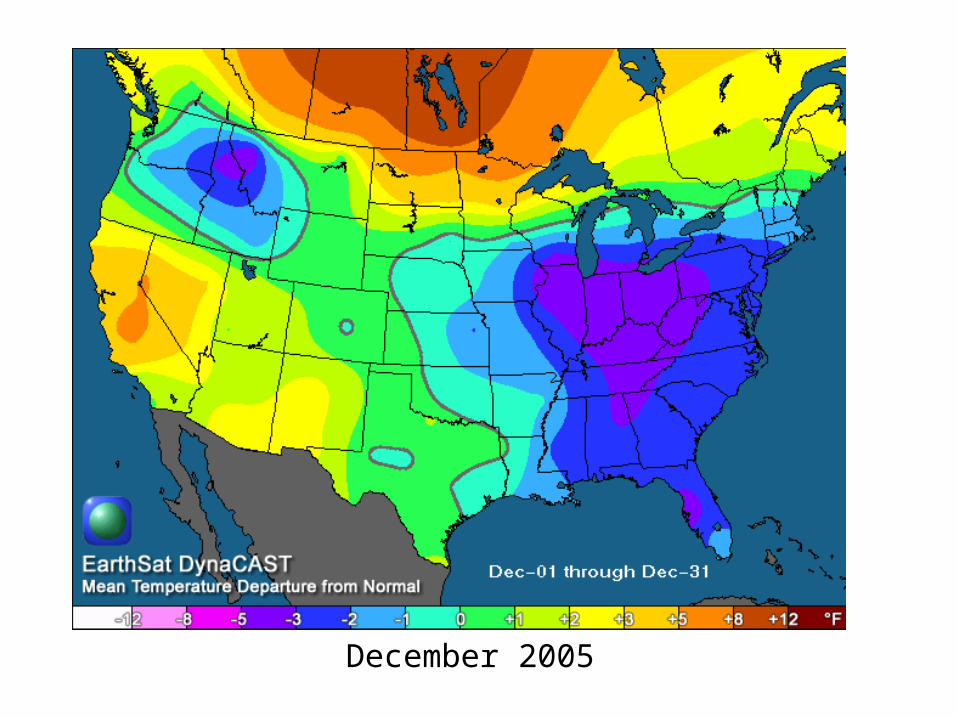
December 2005
0.0002.0004.0006.0008.000
10.00012.00014.00016.00018.000
4/1/
2005
5/1/
2005
6/1/
2005
7/1/
2005
8/1/
2005
9/1/
2005
10/1
/200
5
11/1
/200
5
12/1
/200
5
1/1/
2006
2/1/
2006
3/1/
2006
4/1/
2006
$/M
MB
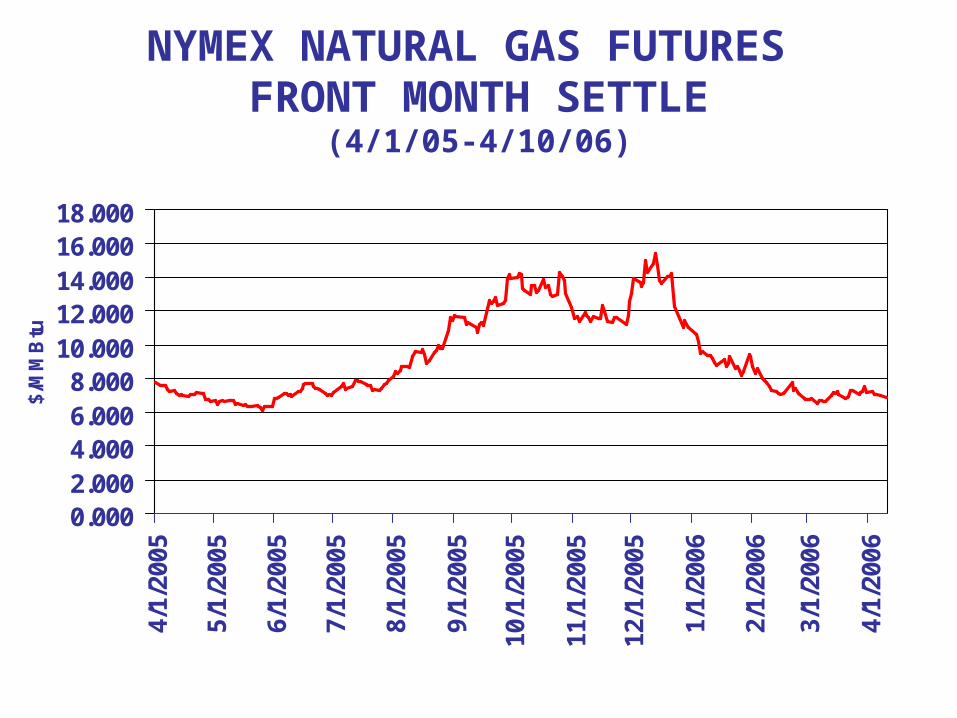
tuNYMEX NATURAL GAS FUTURES
FRONT MONTH SETTLE(4/1/05-4/10/06)
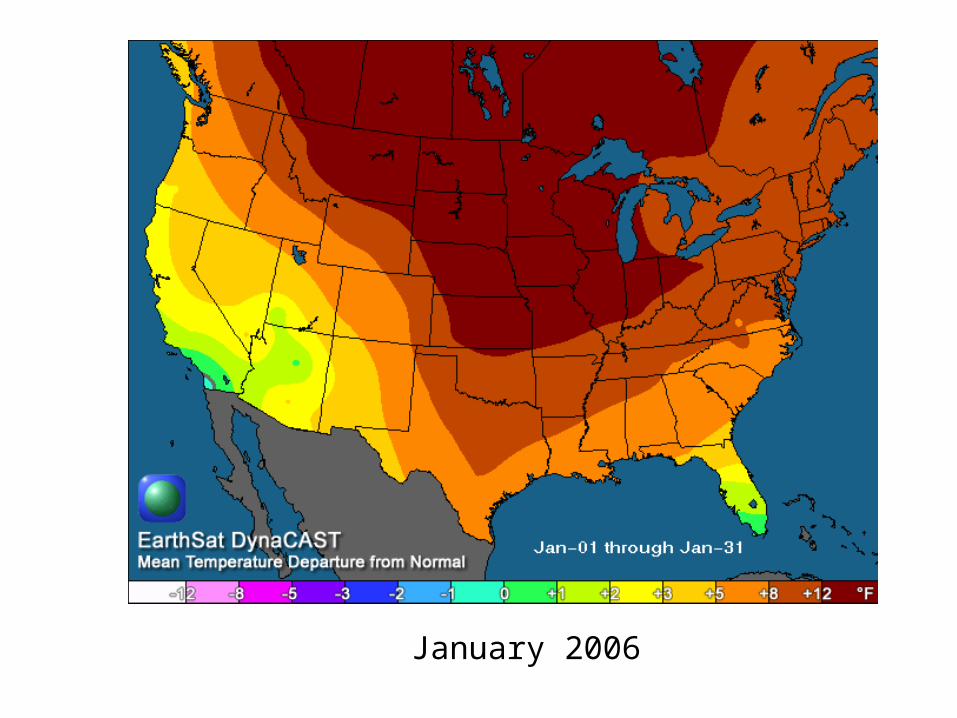
January 2006
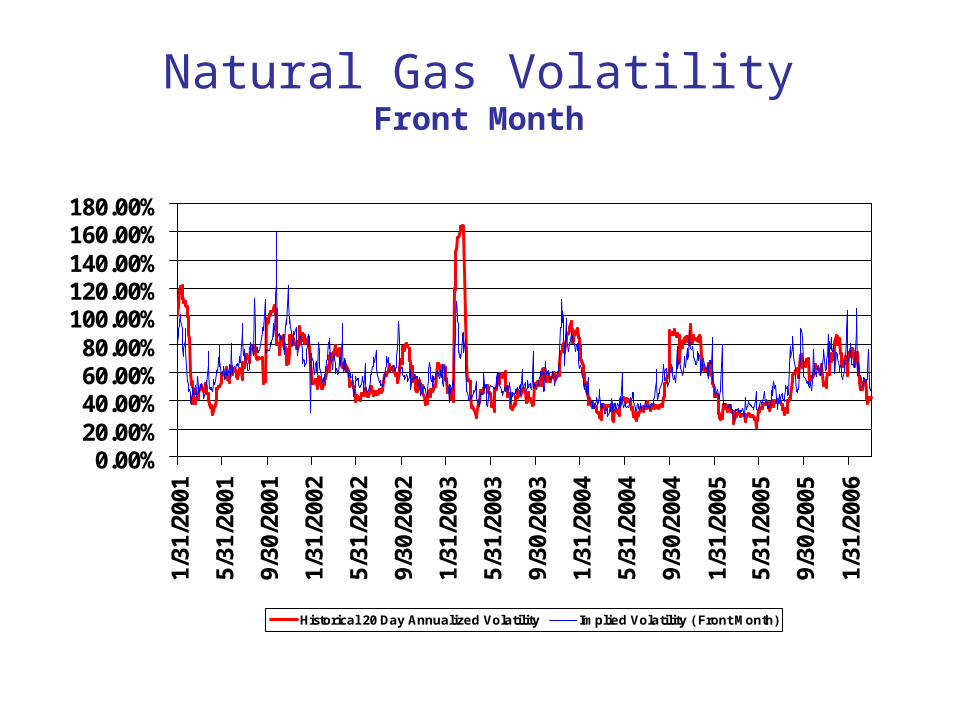
Natural Gas VolatilityFront Month
0.00%20.00%40.00%60.00%80.00%
100.00%120.00%140.00%160.00%180.00%
1/31
/200
1
5/31
/200
1
9/30
/200
1
1/31
/200
2
5/31
/200
2
9/30
/200
2
1/31
/200
3
5/31
/200
3
9/30
/200
3
1/31
/200
4
5/31
/200
4
9/30
/200
4
1/31
/200
5
5/31
/200
5
9/30
/200
5
1/31
/200
6
Historical 20 Day Annualized Volatility Implied Volatility ( Front Month)
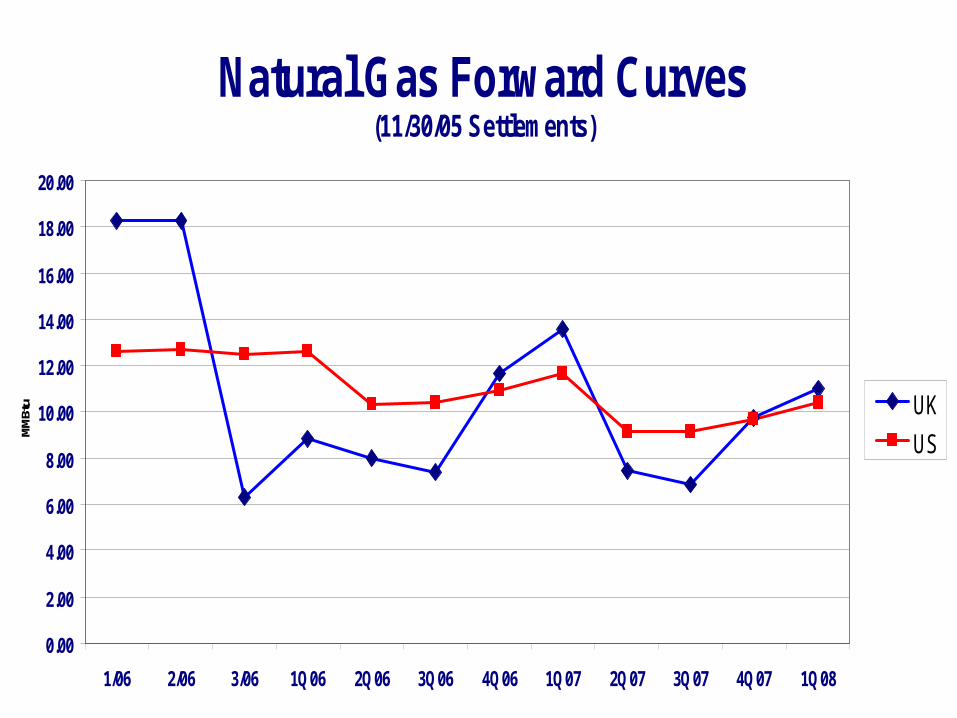
Natural Gas Forward Curves(11/30/05 Settlements)
0.00
2.00
4.00
6.00
8.00
10.00
12.00
14.00
16.00
18.00
20.00
1/06 2/06 3/06 1Q06 2Q06 3Q06 4Q06 1Q07 2Q07 3Q07 4Q07 1Q08
MM
Btu UK
US
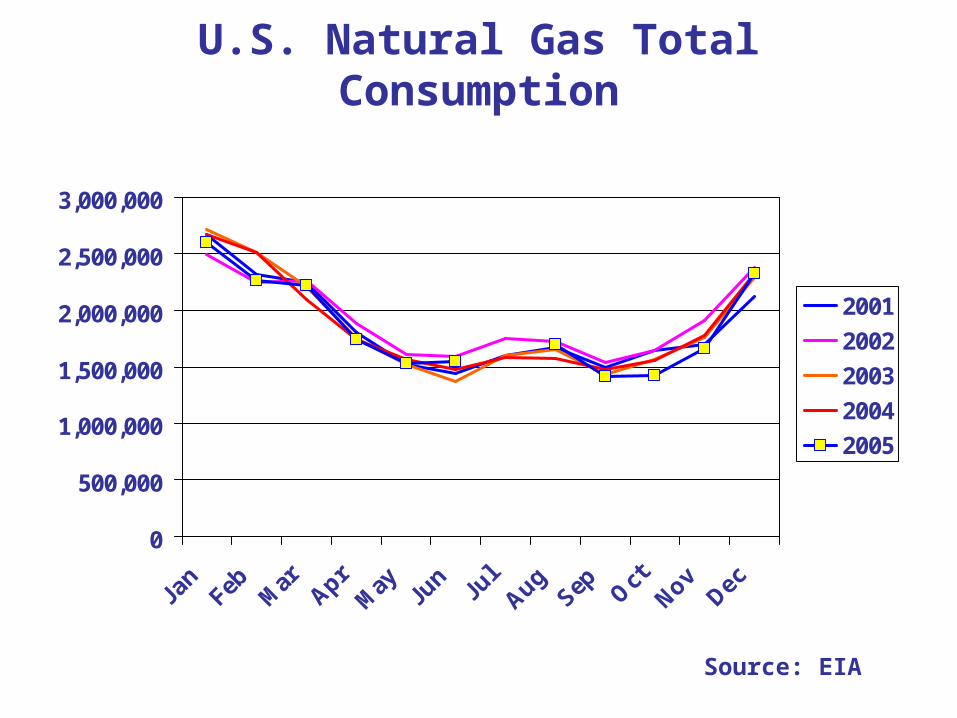
U.S. Natural Gas Total Consumption
0
500,000
1,000,000
1,500,000
2,000,000
2,500,000
3,000,000
Jan
Feb Mar Apr
May Ju
nJu
lAug
Sep Oct
NovDec
2001
2002
2003
2004
2005
Source: EIA
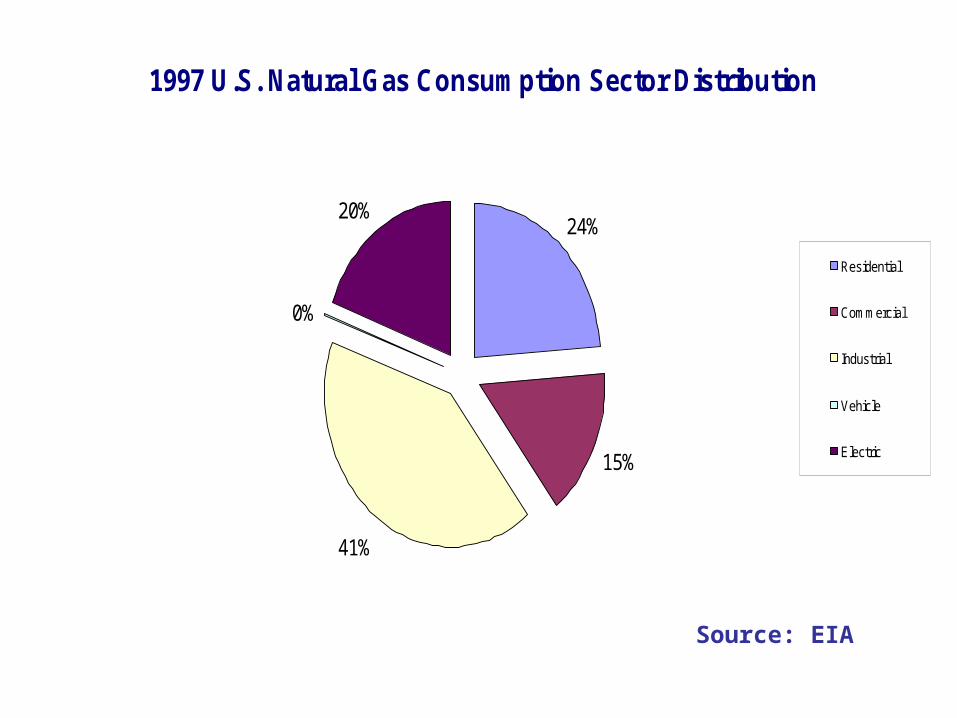
1997 U.S. Natural Gas Consumption Sector Distribution
24%
15%
41%
0%
20%
Residential
Commercial
Industrial
Vehicle
Electric
Source: EIA
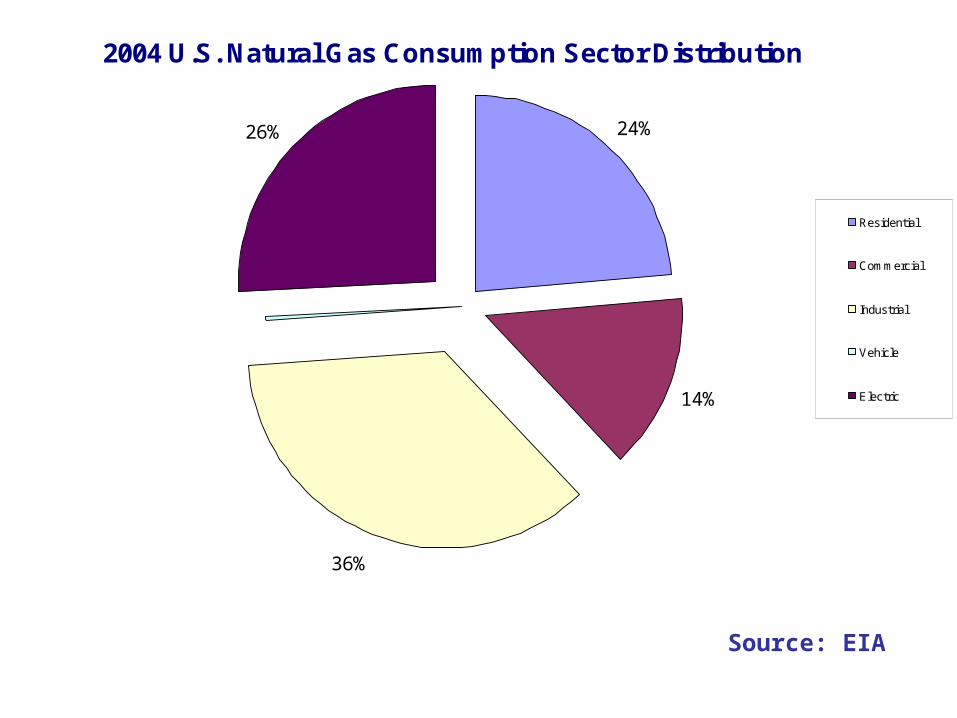
2004 U.S. Natural Gas Consumption Sector Distribution
14%
24%26%
36%
Residential
Commercial
Industrial
Vehicle
Electric
Source: EIA
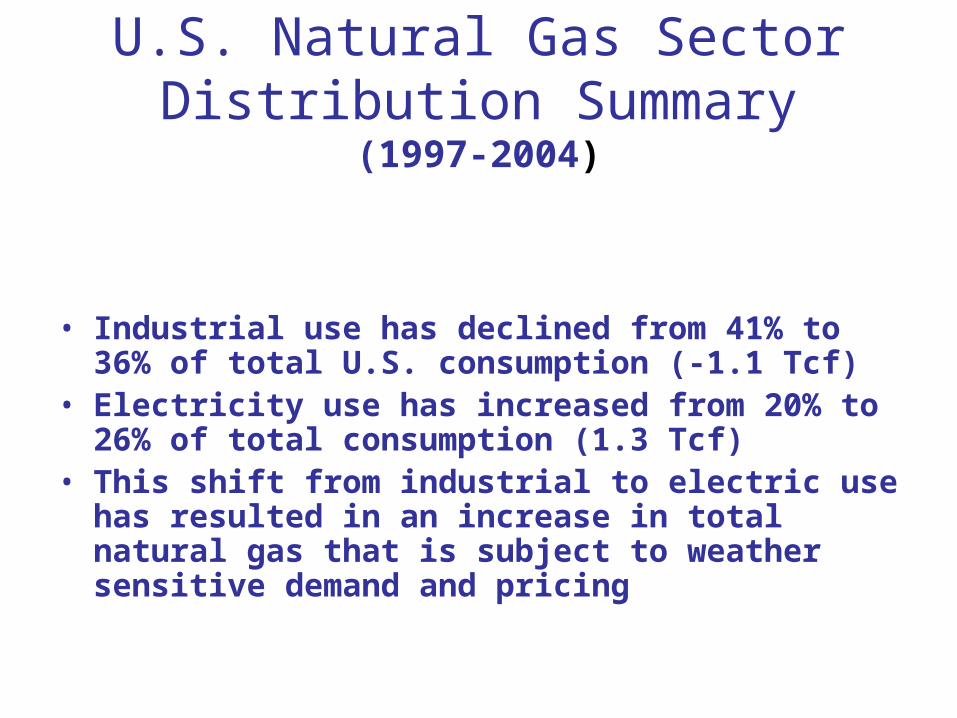
U.S. Natural Gas Sector Distribution Summary
(1997-2004)
• Industrial use has declined from 41% to 36% of total U.S. consumption (-1.1 Tcf)
• Electricity use has increased from 20% to 26% of total consumption (1.3 Tcf)
• This shift from industrial to electric use has resulted in an increase in total natural gas that is subject to weather sensitive demand and pricing
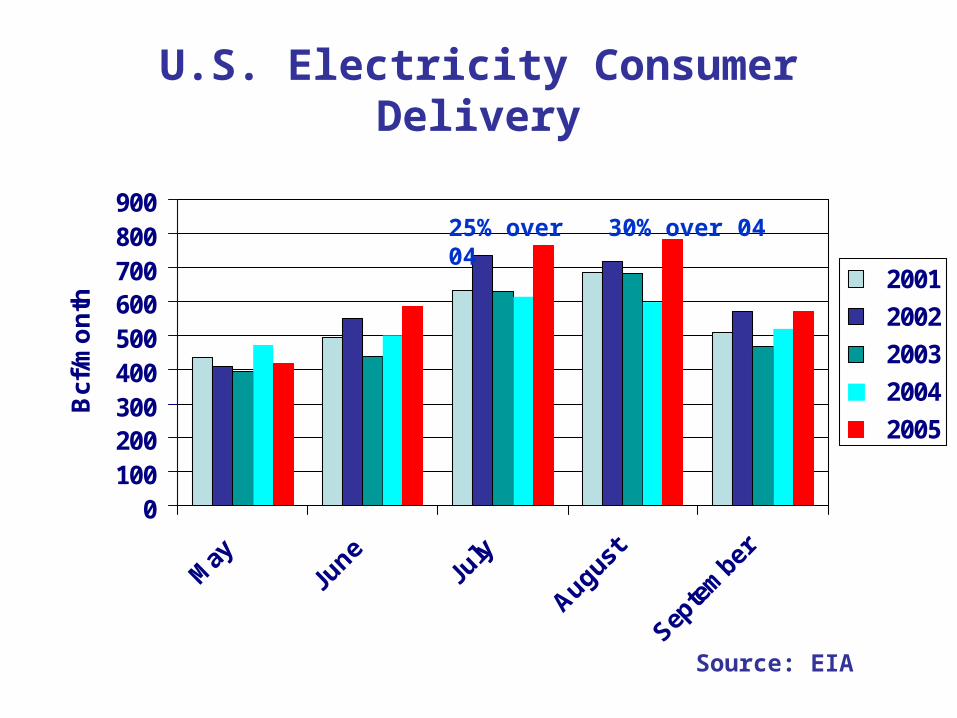
U.S. Electricity Consumer Delivery
0100200300400500600700800900
Bcf
/mo
nth
2001
2002
2003
2004
2005
Source: EIA
30% over 0425% over 04
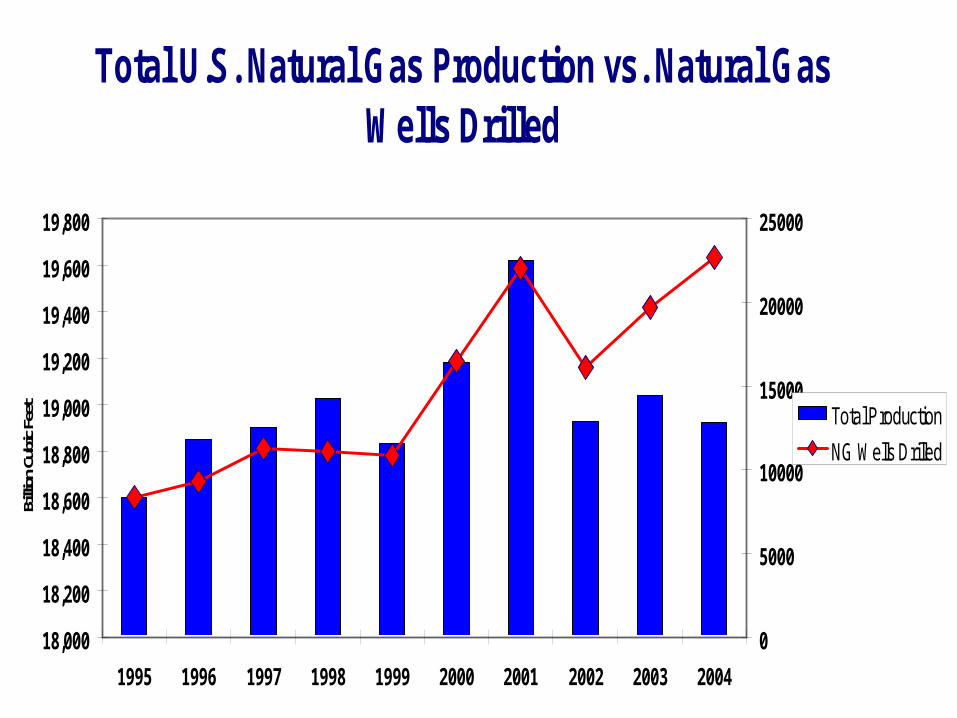
Total U.S. Natural Gas Production vs. Natural Gas Wells Drilled
18,000
18,200
18,400
18,600
18,800
19,000
19,200
19,400
19,600
19,800
1995 1996 1997 1998 1999 2000 2001 2002 2003 2004
Billi
on C
ubic
Feet
0
5000
10000
15000
20000
25000
Total Production
NG Wells Drilled
Source: Energy Information Administration
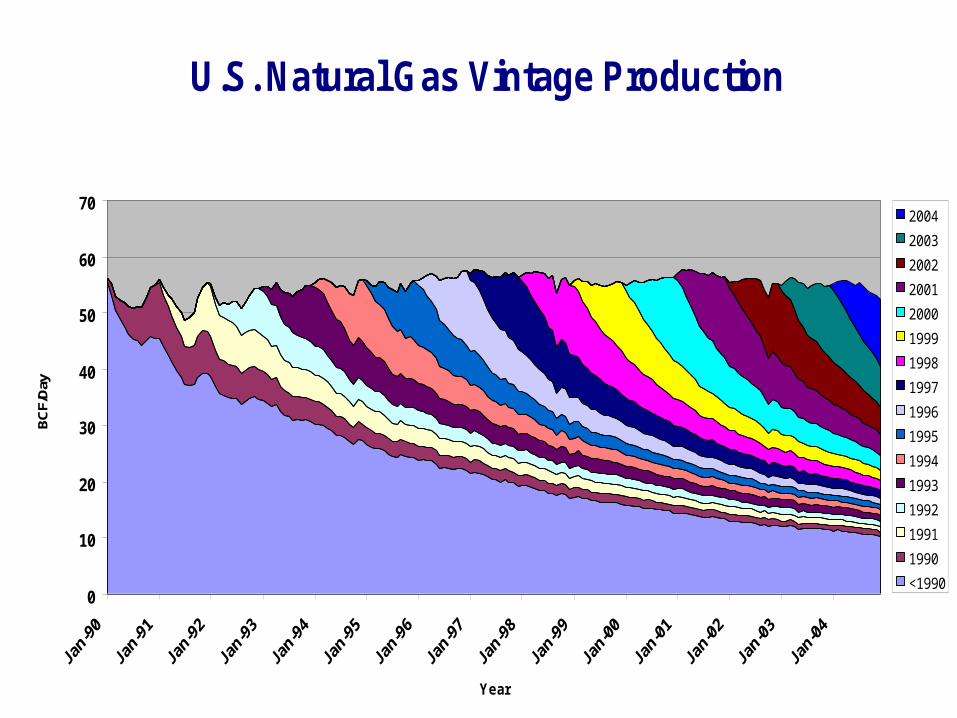
U.S. Natural Gas Vintage Production
0
10
20
30
40
50
60
70
Year
BC
F/D
ay
2004
2003
2002
2001
2000
1999
1998
1997
1996
1995
1994
1993
1992
1991
1990
<1990
Source: IHS Energy
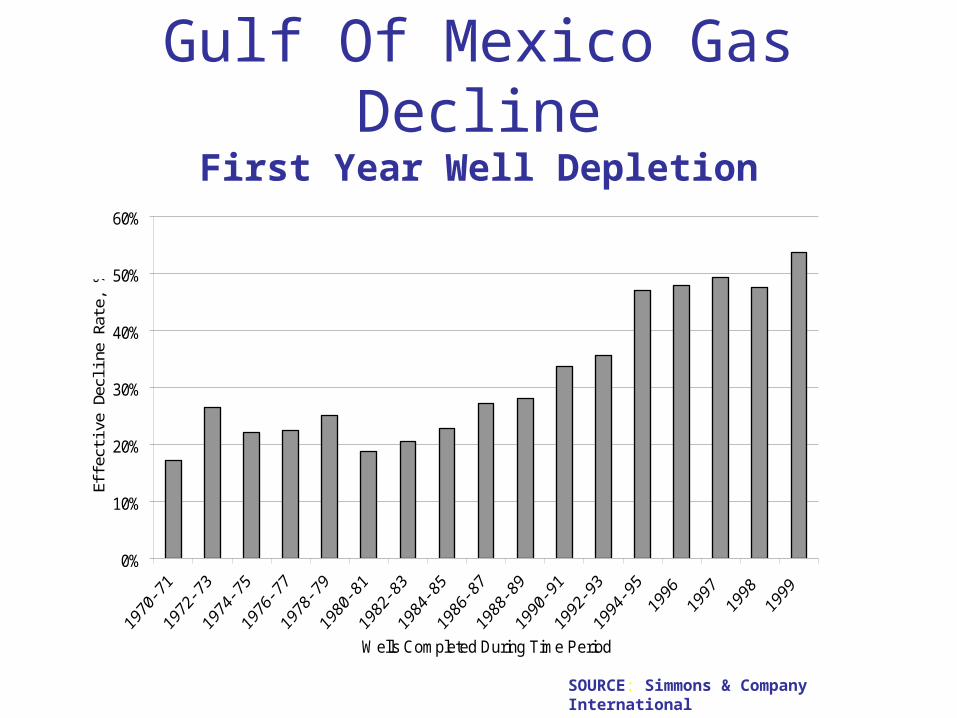
Gulf Of Mexico Gas DeclineFirst Year Well Depletion
0%
10%
20%
30%
40%
50%
60%
Wells Completed During Time Period
Effe
ctiv
e D
eclin
e R
ate,
%/y
r
SOURCE: Simmons & Company International
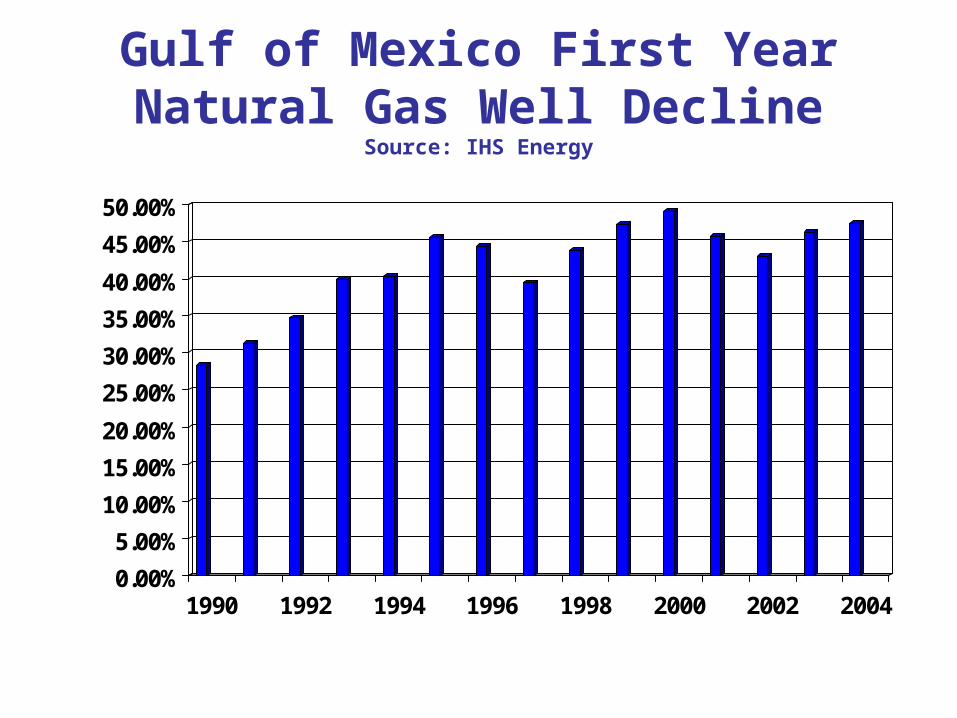
Gulf of Mexico First Year Natural Gas Well Decline
Source: IHS Energy
0.00%
5.00%
10.00%
15.00%
20.00%
25.00%
30.00%
35.00%
40.00%
45.00%
50.00%
1990 1992 1994 1996 1998 2000 2002 2004
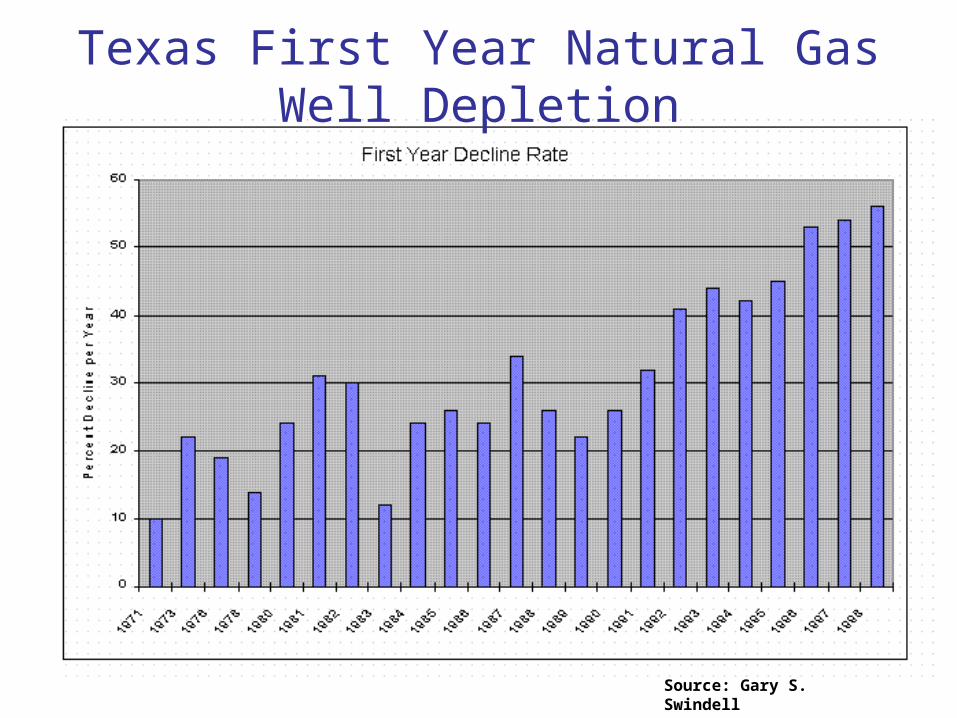
Texas First Year Natural Gas Well Depletion
Source: Gary S. Swindell
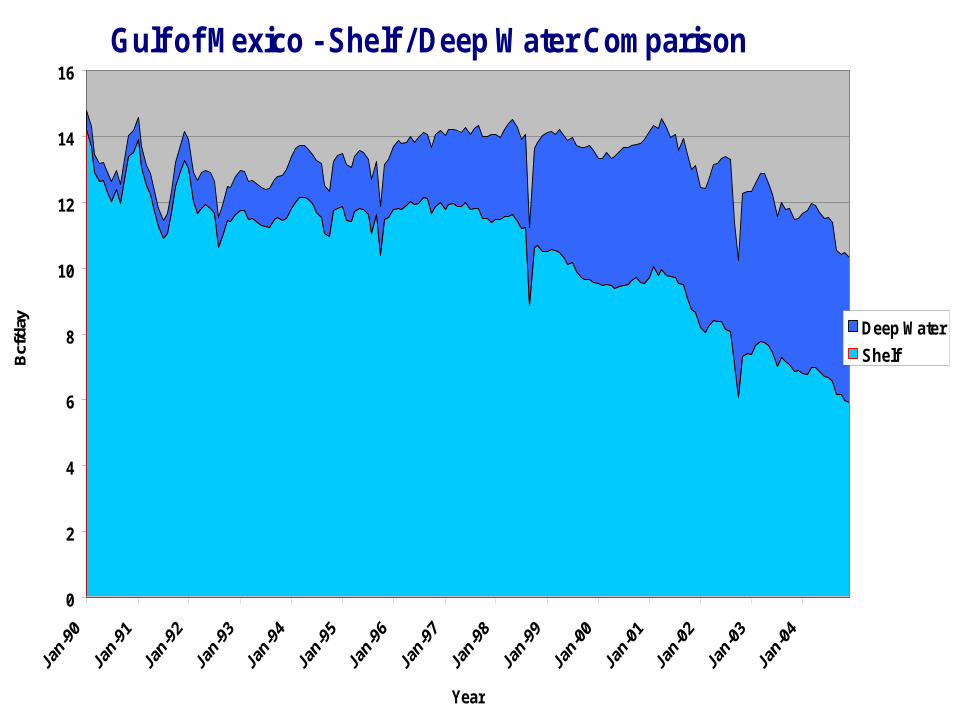
Gulf of Mexico - Shelf / Deep Water Comparison
0
2
4
6
8
10
12
14
16
Year
Bcf
/day Deep Water
Shelf
Source: IHS Energy
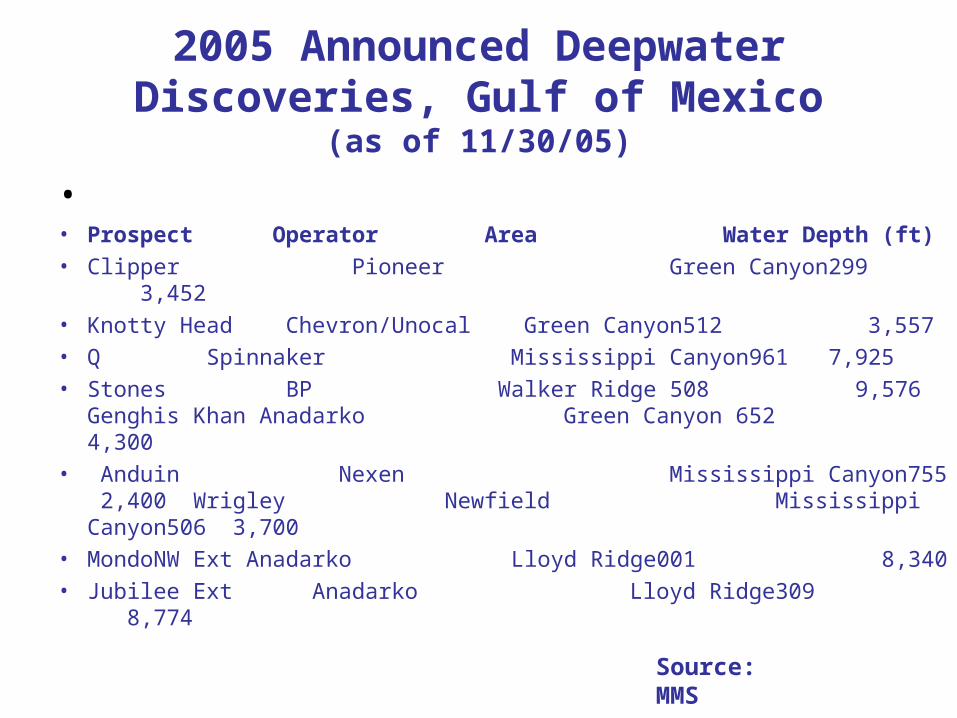
2005 Announced Deepwater Discoveries, Gulf of Mexico
(as of 11/30/05)
• • Prospect Operator Area Water Depth
(ft) • Clipper Pioneer Green Canyon299 3,452• Knotty Head Chevron/Unocal Green Canyon512 3,557• Q Spinnaker Mississippi Canyon961 7,925 • Stones BP Walker Ridge 508 9,576 Genghis
Khan Anadarko Green Canyon 652 4,300• Anduin Nexen Mississippi Canyon755 2,400
Wrigley Newfield Mississippi Canyon506 3,700• MondoNW Ext Anadarko Lloyd Ridge001 8,340• Jubilee Ext Anadarko Lloyd Ridge309 8,774
Source: MMS
Source: EIA
Source: EIA
Source: EIA
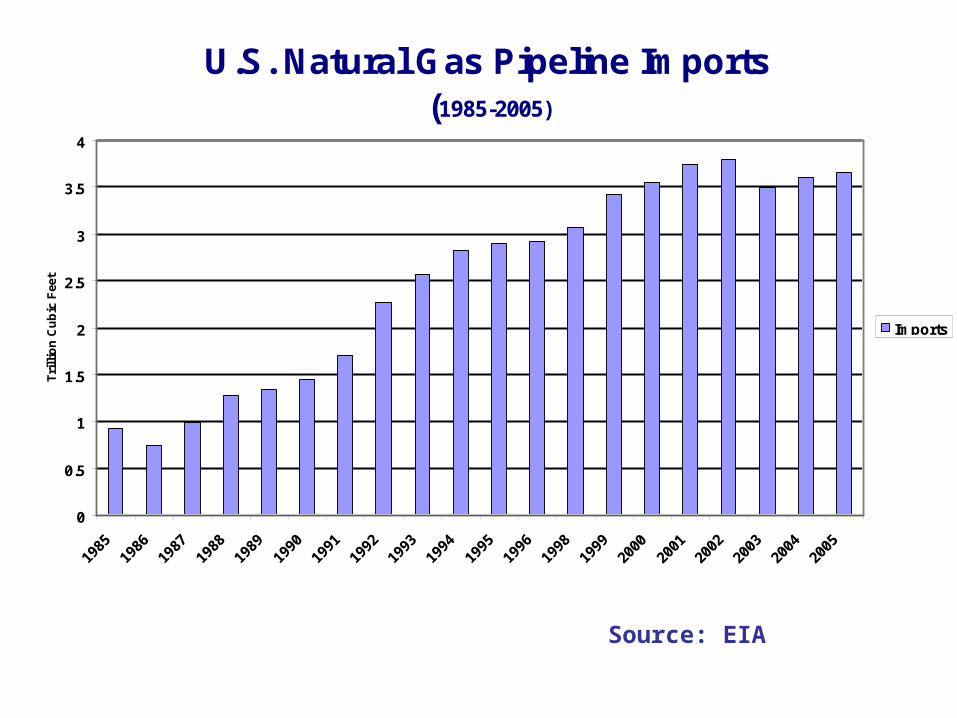
U.S. Natural Gas Pipeline Imports(1985-2005)
0
0.5
1
1.5
2
2.5
3
3.5
4
1985
1986
1987
1988
1989
1990
1991
1992
1993
1994
1995
1996
1998
1999
2000
2001
2002
2003
2004
2005
Tri
llio
n C
ub
ic F
eet
Imports
Source: EIA
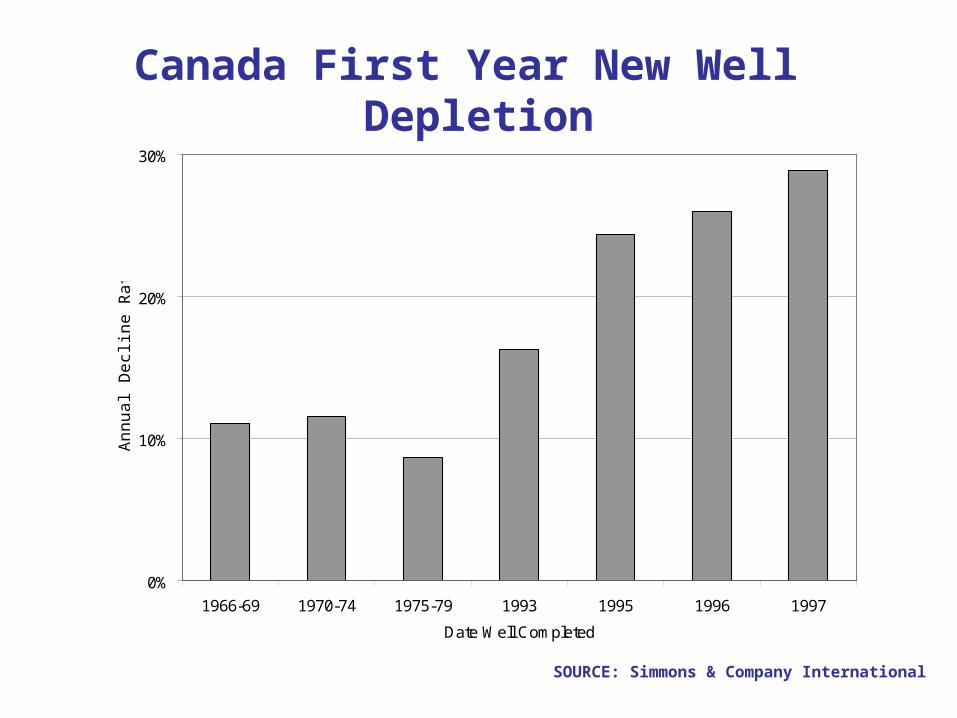
Canada First Year New Well Depletion
0%
10%
20%
30%
1966-69 1970-74 1975-79 1993 1995 1996 1997
Date Well Completed
An
nu
al D
ecl
ine
Ra
te,
%
SOURCE: Simmons & Company International
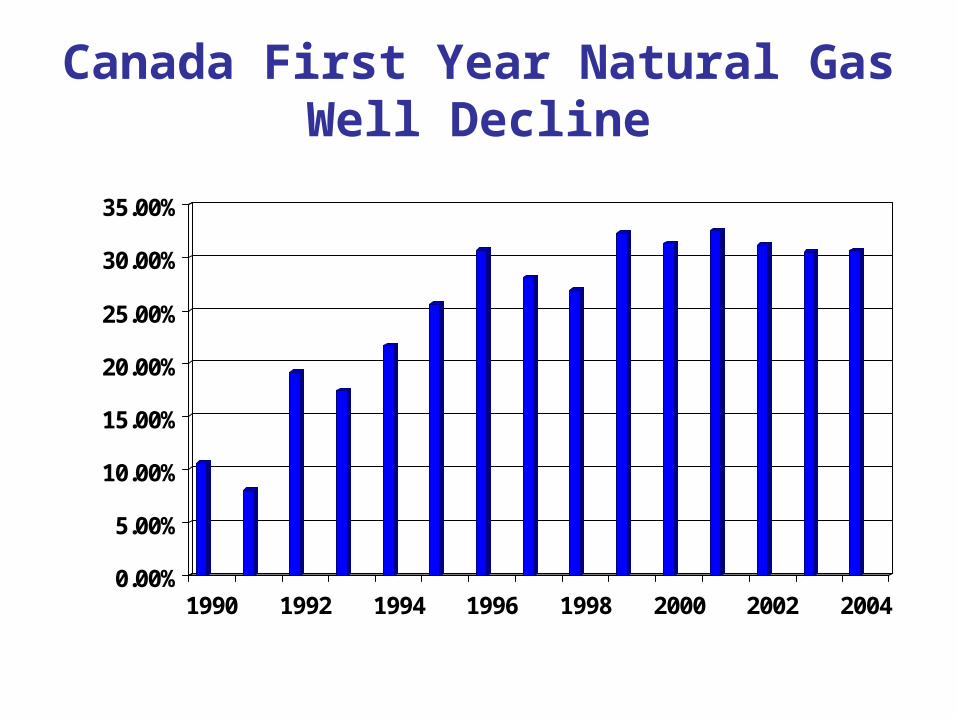
Canada First Year Natural Gas Well Decline
0.00%
5.00%
10.00%
15.00%
20.00%
25.00%
30.00%
35.00%
1990 1992 1994 1996 1998 2000 2002 2004
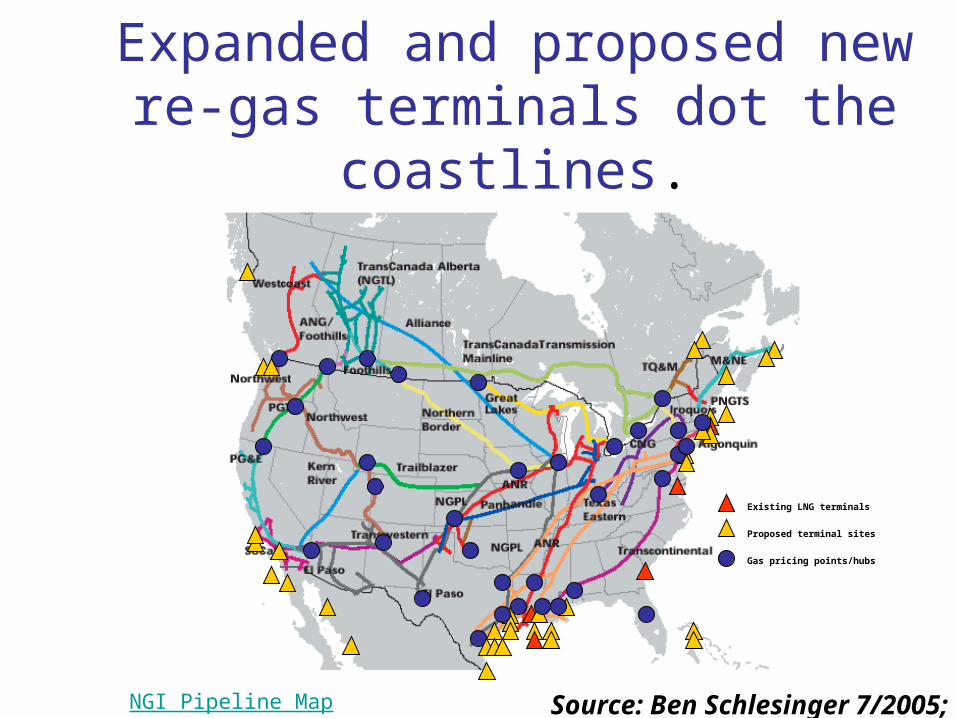
Expanded and proposed new re-gas terminals dot the coastlines.
Existing LNG terminals
Proposed terminal sites
Gas pricing points/hubs
Source: Ben Schlesinger 7/2005; illustrative.NGI Pipeline Map
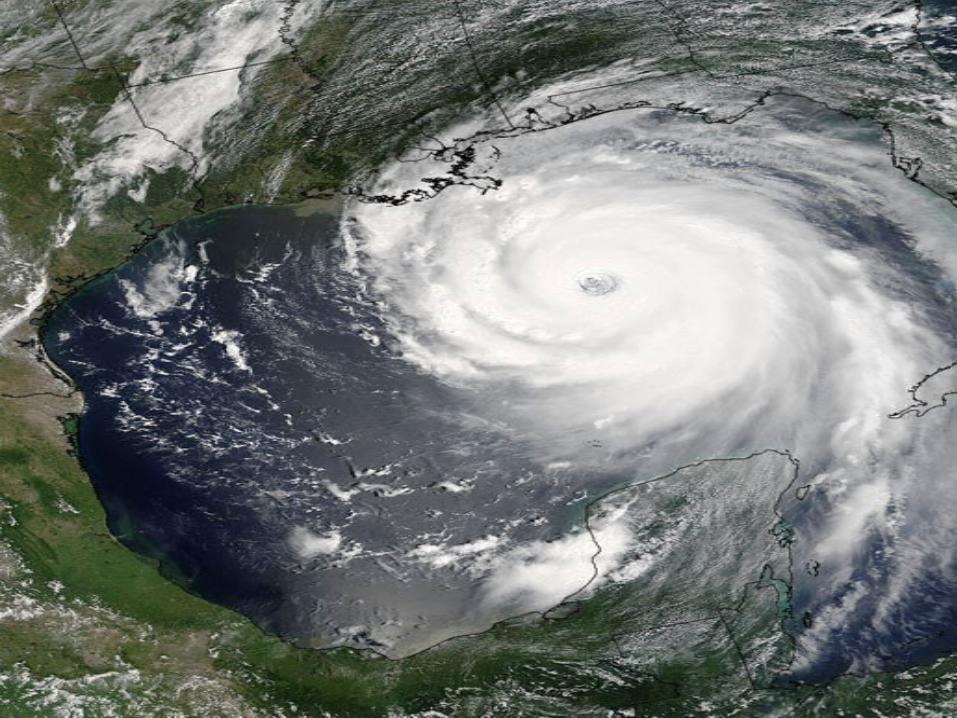
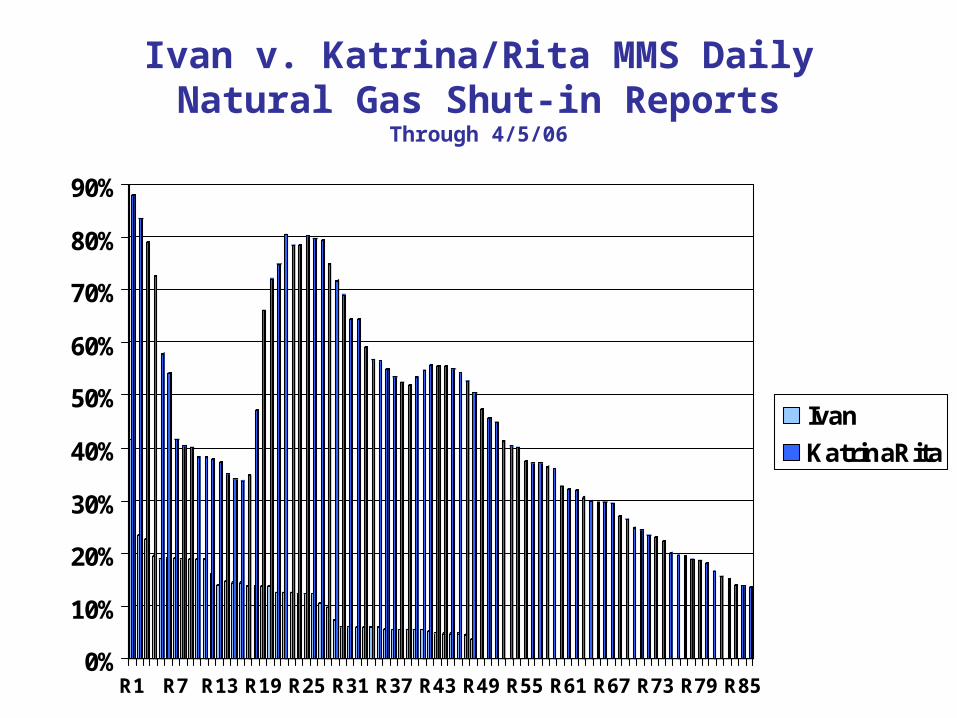
Ivan v. Katrina/Rita MMS Daily Natural Gas Shut-in Reports
Through 4/5/06
0%
10%
20%
30%
40%
50%
60%
70%
80%
90%
R1 R7 R13 R19 R25 R31 R37 R43 R49 R55 R61 R67 R73 R79 R85
Ivan
KatrinaRita
R1 is report following hurricane landfall
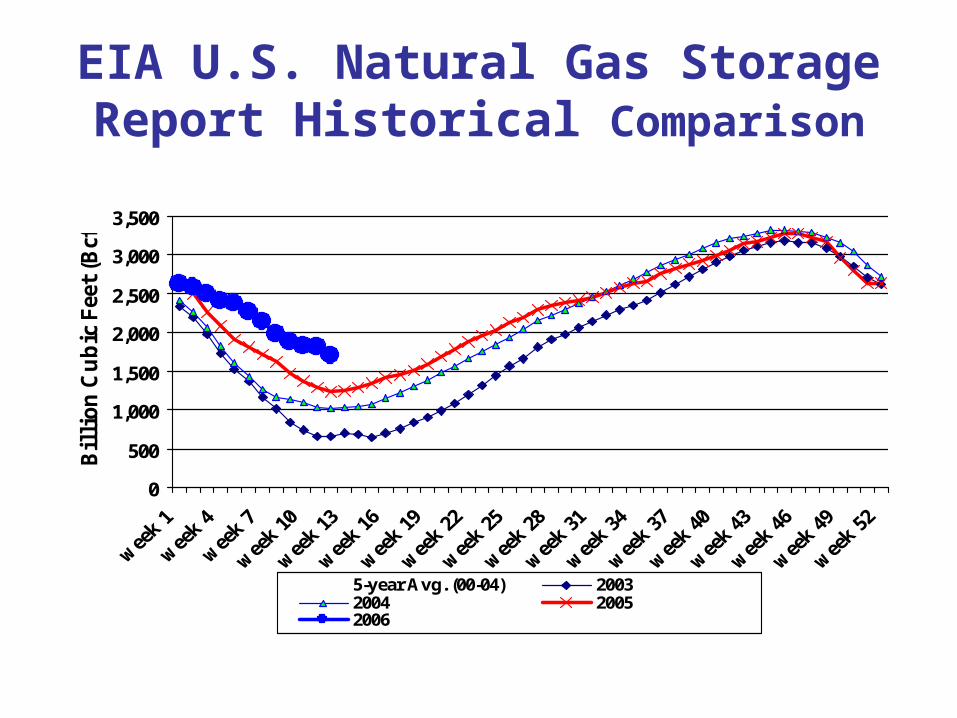
EIA U.S. Natural Gas Storage Report Historical Comparison
0
500
1,000
1,500
2,000
2,500
3,000
3,500
Bil
lion C
ubic
Fee
t (B
cf)
5-year Avg. (00-04) 20032004 20052006
37% above 2005 62% over the 5-Year Average
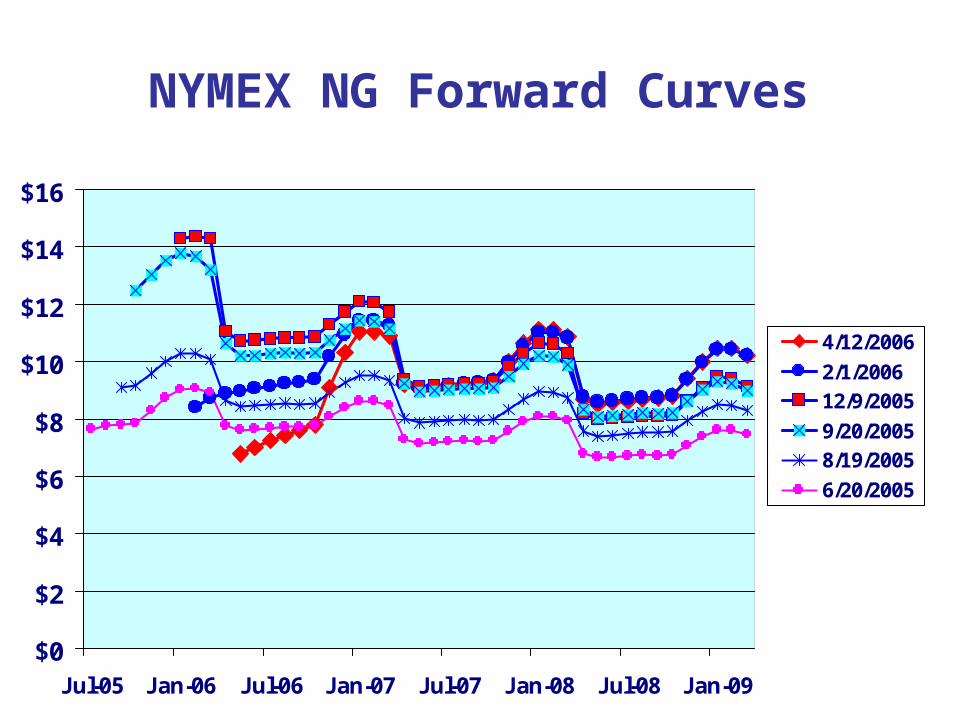
NYMEX NG Forward Curves
$0
$2
$4
$6
$8
$10
$12
$14
$16
Jul-05 Jan-06 Jul-06 Jan-07 Jul-07 Jan-08 Jul-08 Jan-09
4/12/2006
2/1/2006
12/9/2005
9/20/2005
8/19/2005
6/20/2005
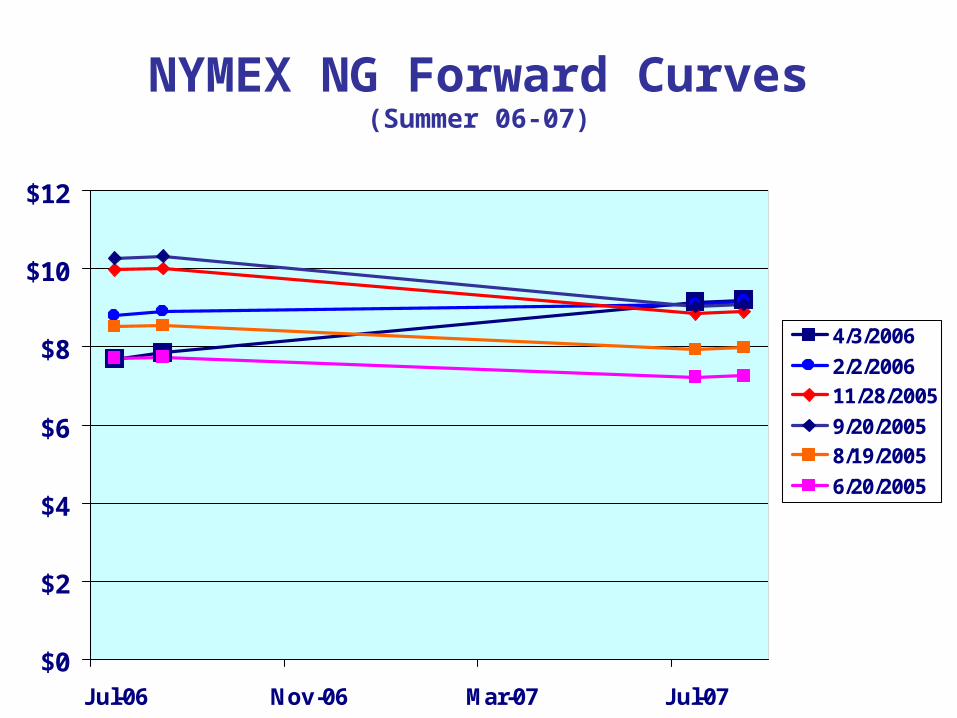
NYMEX NG Forward Curves(Summer 06-07)
$0
$2
$4
$6
$8
$10
$12
Jul-06 Nov-06 Mar-07 Jul-07
4/3/2006
2/2/2006
11/28/2005
9/20/2005
8/19/2005
6/20/2005
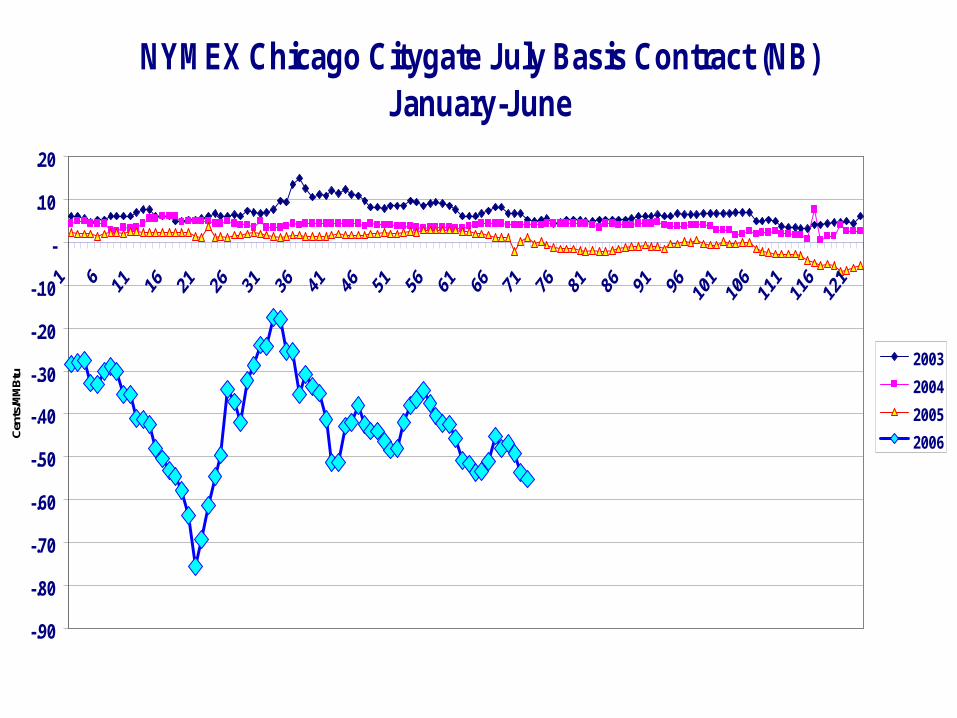
NYMEX Chicago Citygate July Basis Contract (NB) January-June
-.90
-.80
-.70
-.60
-.50
-.40
-.30
-.20
-.10
-
.10
.20
Cent
s/M
MB
tu
2003
2004
2005
2006
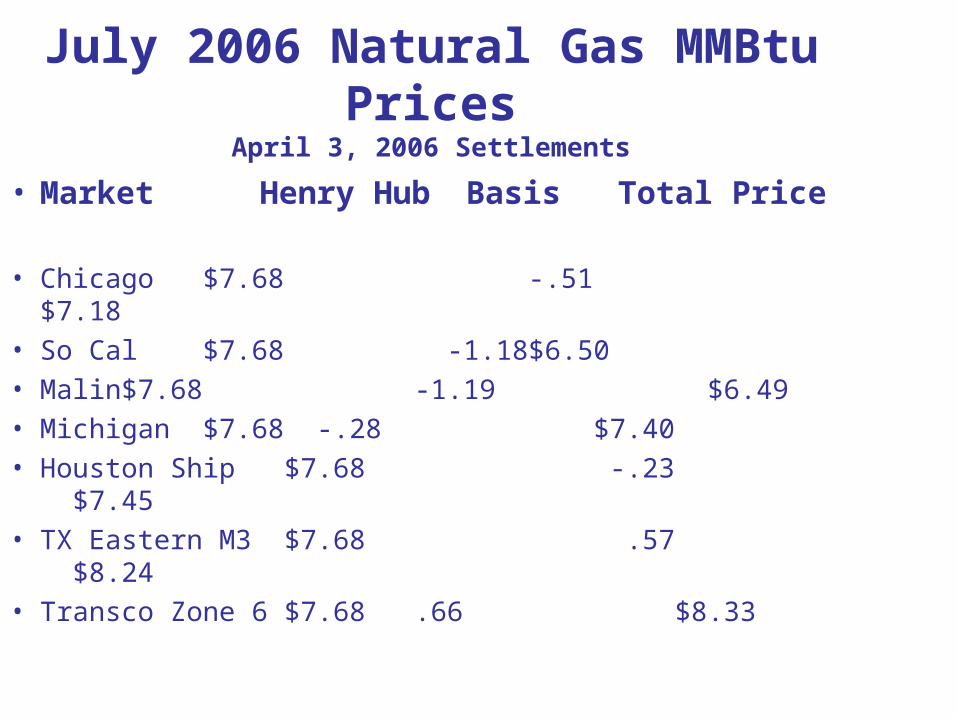
July 2006 Natural Gas MMBtu PricesApril 3, 2006 Settlements
• Market Henry Hub Basis Total Price
• Chicago $7.68 -.51 $7.18• So Cal $7.68 -1.18 $6.50• Malin $7.68 -1.19 $6.49• Michigan $7.68 -.28 $7.40• Houston Ship$7.68 -.23 $7.45• TX Eastern M3 $7.68 .57 $8.24• Transco Zone 6 $7.68 .66 $8.33
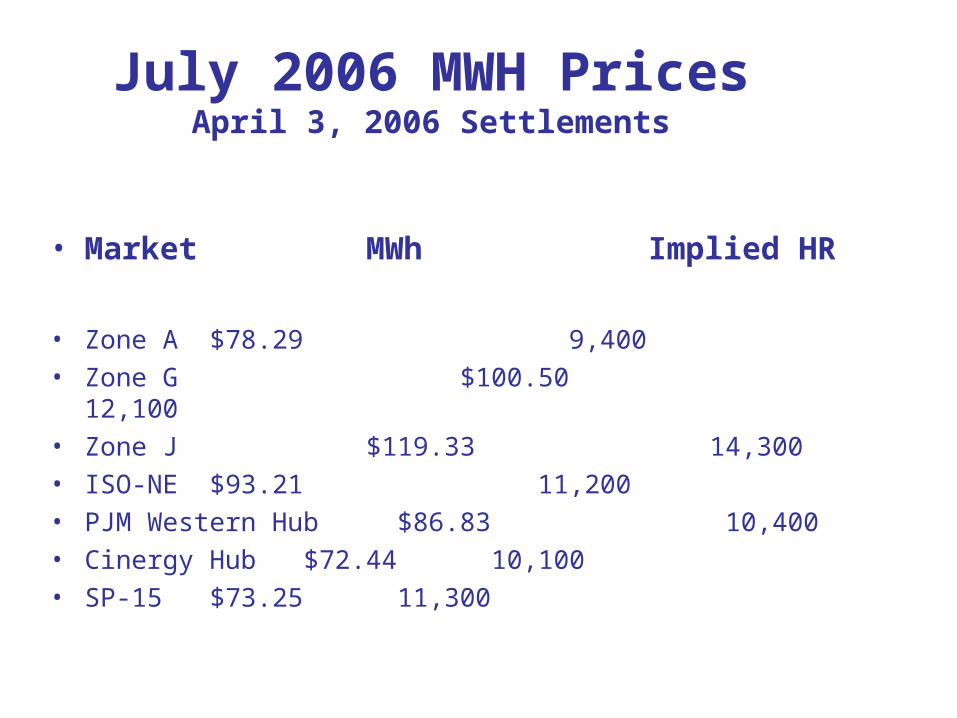
July 2006 MWH PricesApril 3, 2006 Settlements
• Market MWh Implied HR
• Zone A $78.29 9,400 • Zone G $100.50 12,100• Zone J $119.33 14,300• ISO-NE $93.21 11,200• PJM Western Hub $86.83 10,400• Cinergy Hub $72.44 10,100• SP-15 $73.25 11,300
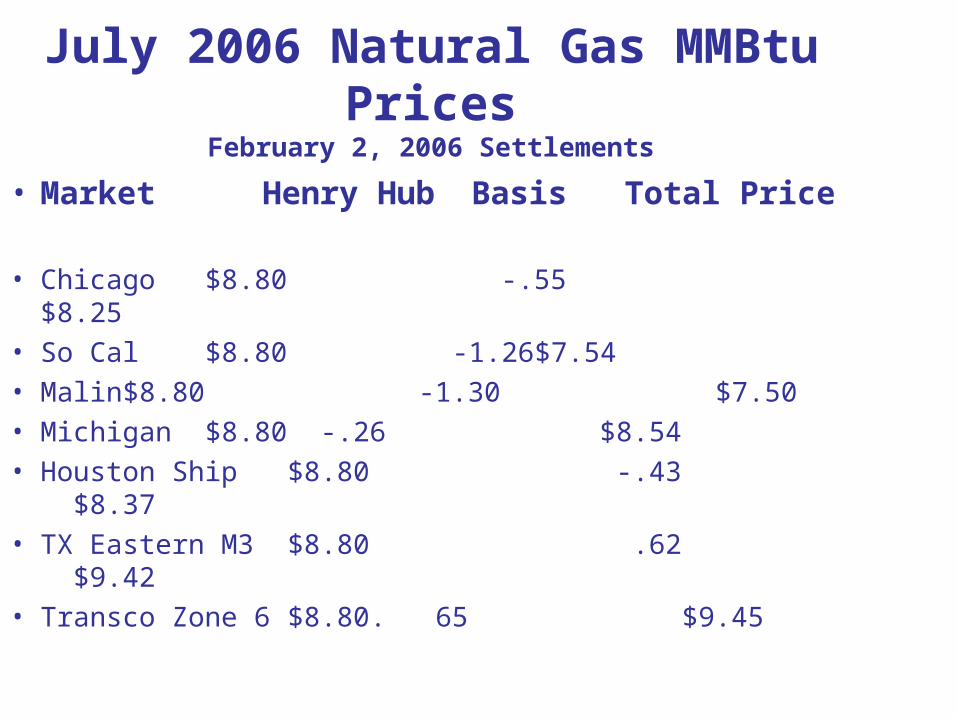
July 2006 Natural Gas MMBtu PricesFebruary 2, 2006 Settlements
• Market Henry Hub Basis Total Price
• Chicago $8.80 -.55 $8.25• So Cal $8.80 -1.26 $7.54• Malin $8.80 -1.30 $7.50• Michigan $8.80 -.26 $8.54• Houston Ship$8.80 -.43 $8.37• TX Eastern M3 $8.80 .62 $9.42• Transco Zone 6 $8.80 . 65 $9.45
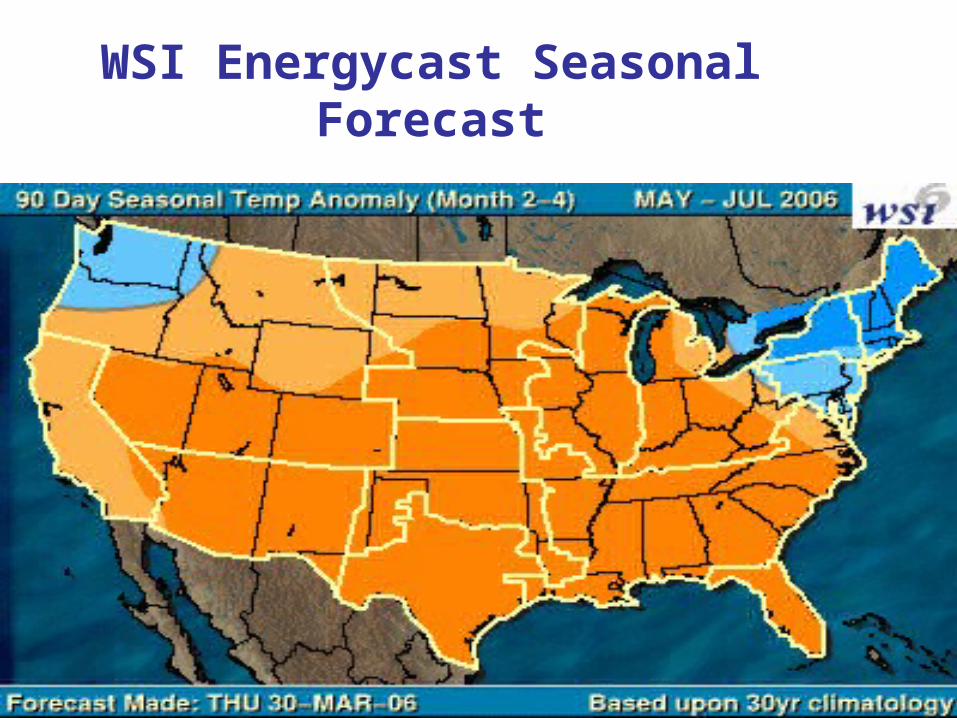
WSI Energycast Seasonal Forecast
DISCLAIMER
The New York Mercantile Exchange, Inc., (the “Exchange”) is making this information available for informational purposes only. The Exchange has attempted, wherever possible, to make statements in good faith based upon current information and expectations by using words such as "anticipate," "believes," "expects" and words and terms of similar substance. Any forward-looking statements made by, or on behalf of the Exchange, involve a number of risks, trends, and uncertainties and other factors that may cause actual results to differ materially. As such, readers are cautioned not to place undue reliance on the information contained herein, which only speaks as of the date of the issuance of this information.