Trends in Food, Beverage & Consumer Insights in China … · Trends in Food, Beverage & Consumer...
43
Alick Zhou CEO, Ipsos China Trends in Food, Beverage & Consumer Insights in China 2016
Transcript of Trends in Food, Beverage & Consumer Insights in China … · Trends in Food, Beverage & Consumer...
Alick Zhou
CEO, Ipsos China
Trends in Food, Beverage & Consumer Insights in China 2016

2
2016,
Top 10 Trends

3
Food Safety
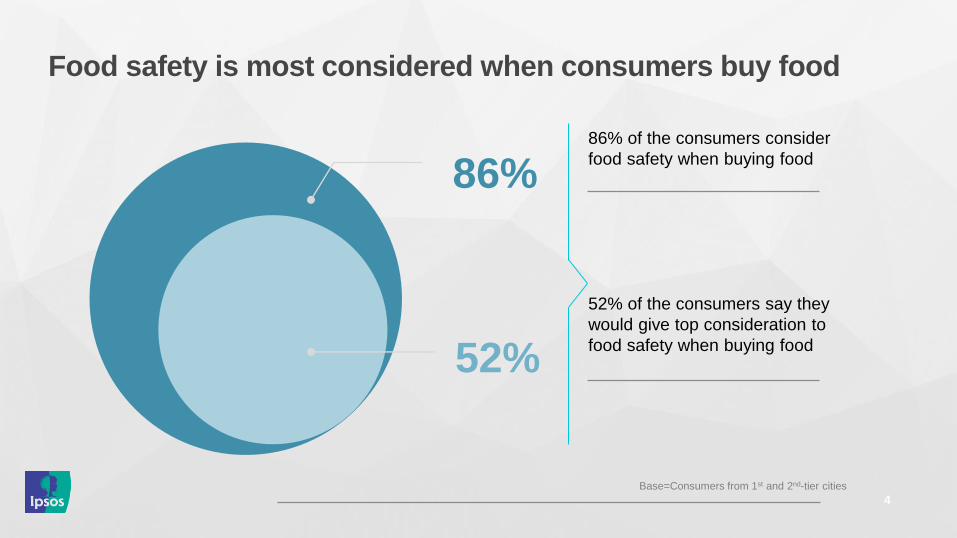
Food safety is most considered when consumers buy food
4
86% of the consumers consider
food safety when buying food
52% of the consumers say they
would give top consideration to
food safety when buying food
86%
52%
Base=Consumers from 1st and 2nd-tier cities
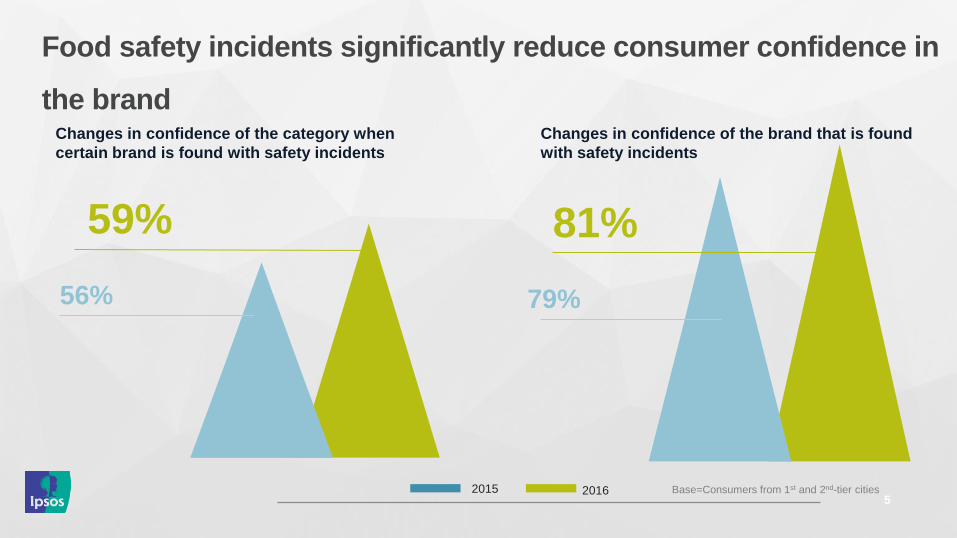
Food safety incidents significantly reduce consumer confidence in
the brand
5
Changes in confidence of the category when
certain brand is found with safety incidents
59%
56%
Base=Consumers from 1st and 2nd-tier cities 2015 2016
Changes in confidence of the brand that is found
with safety incidents
81%
79%
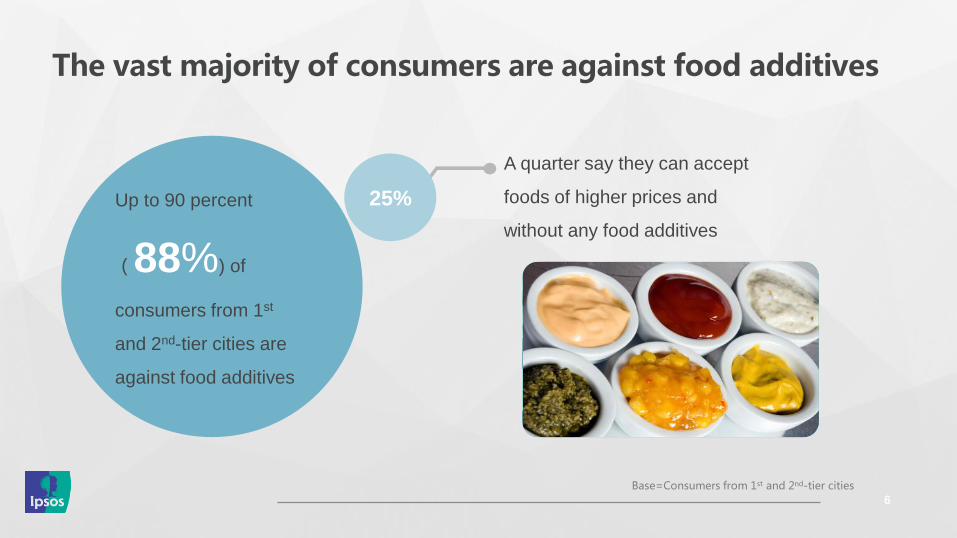
The vast majority of consumers are against food additives
6
Up to 90 percent
(88%) of
consumers from 1st
and 2nd-tier cities are
against food additives
25%
A quarter say they can accept
foods of higher prices and
without any food additives
Base=Consumers from 1st and 2nd-tier cities
7
Food Health
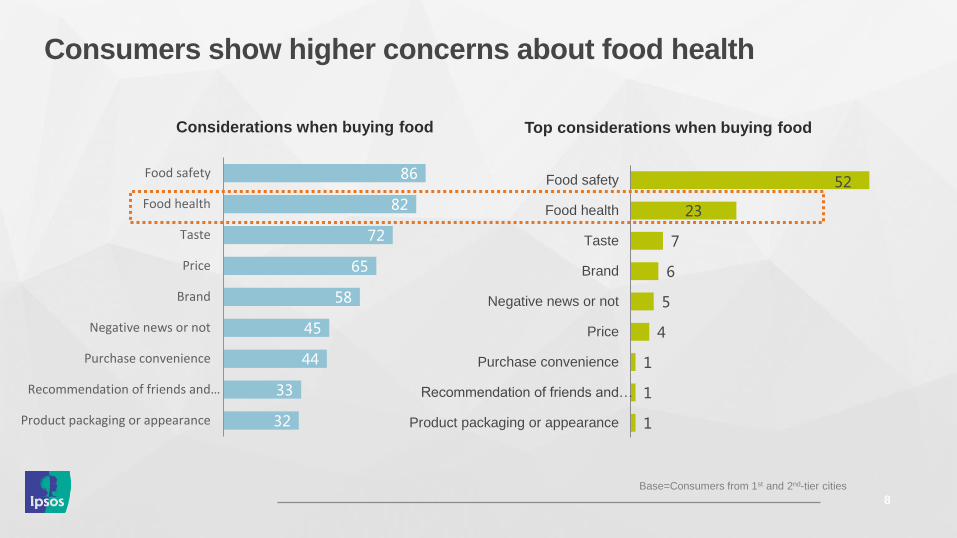
Consumers show higher concerns about food health
8
32
33
44
45
58
65
72
82
86
Product packaging or appearance
Recommendation of friends and…
Purchase convenience
Negative news or not
Brand
Price
Taste
Food health
Food safety
Considerations when buying food
1
1
1
4
5
6
7
23
52
Product packaging or appearance
Recommendation of friends and…
Purchase convenience
Price
Negative news or not
Brand
Taste
Food health
Food safety
Top considerations when buying food
Base=Consumers from 1st and 2nd-tier cities
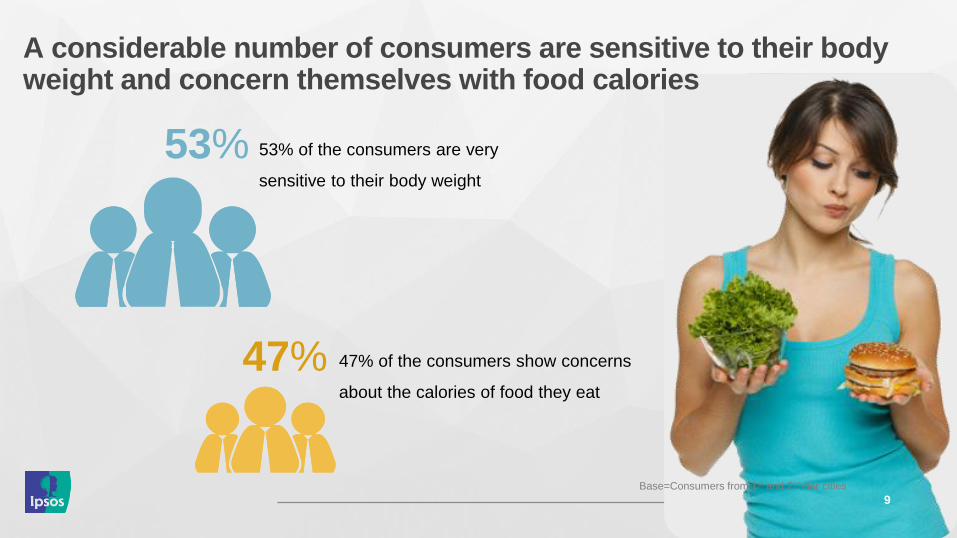
A considerable number of consumers are sensitive to their body weight and concern themselves with food calories
9
53%
47%
53% of the consumers are very
sensitive to their body weight
47% of the consumers show concerns
about the calories of food they eat
Base=Consumers from 1st and 2nd-tier cities
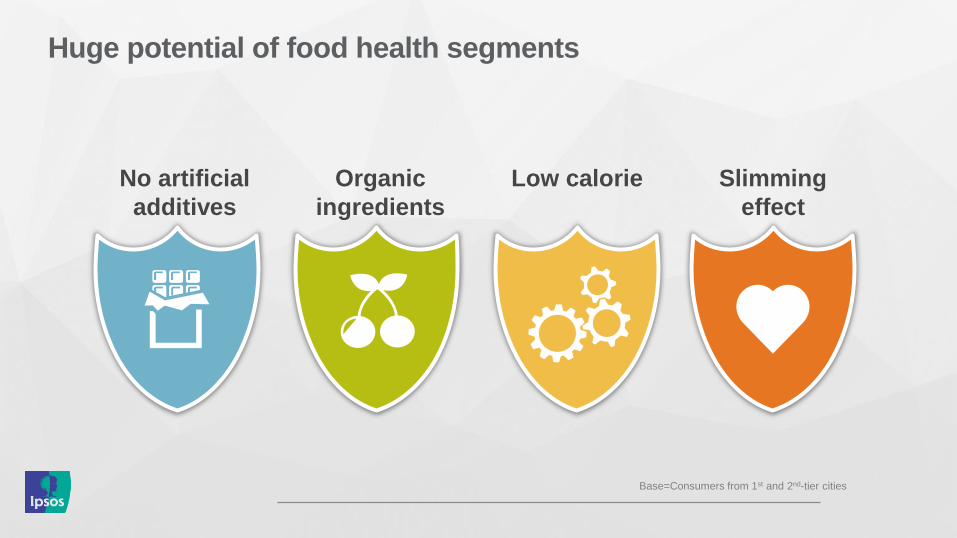
Huge potential of food health segments
No artificial
additives
Low calorie Organic
ingredients
Slimming
effect
Base=Consumers from 1st and 2nd-tier cities

11
Green/Organic Food
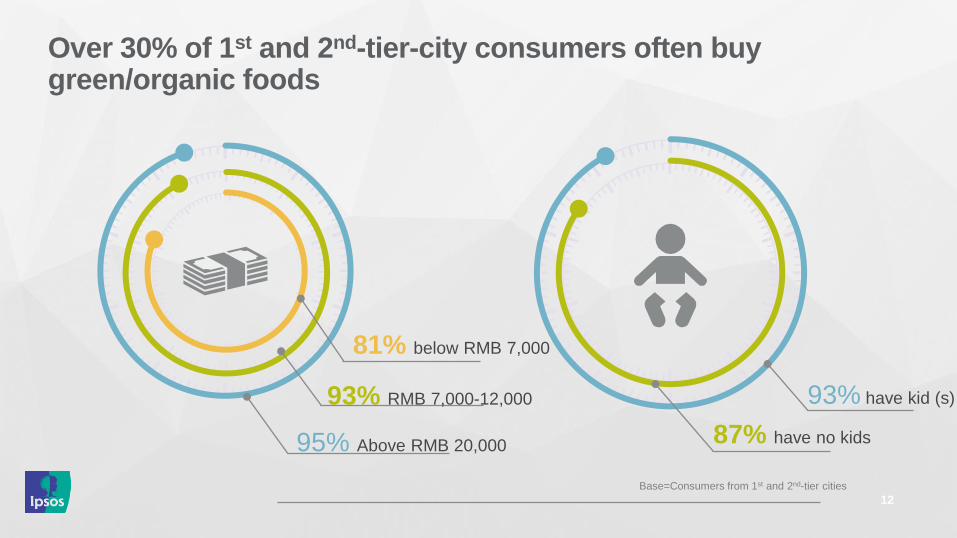
Over 30% of 1st and 2nd-tier-city consumers often buy green/organic foods
12
81% below RMB 7,000
93% have kid (s)
87% have no kids 95% Above RMB 20,000
93% RMB 7,000-12,000
Base=Consumers from 1st and 2nd-tier cities
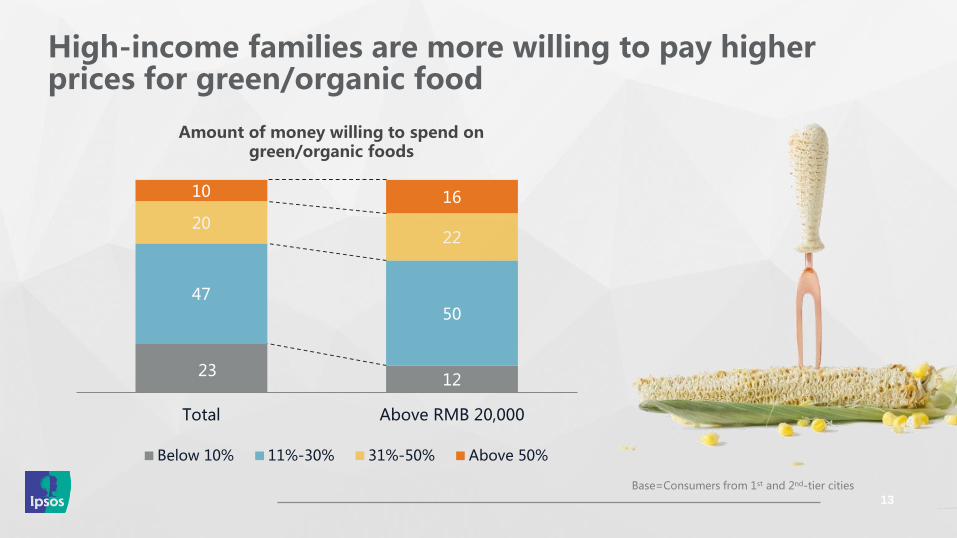
High-income families are more willing to pay higher prices for green/organic food
13
Base=Consumers from 1st and 2nd-tier cities
23 12
47 50
20 22
10 16
Total Above RMB 20,000
Below 10% 11%-30% 31%-50% Above 50%
Amount of money willing to spend on green/organic foods
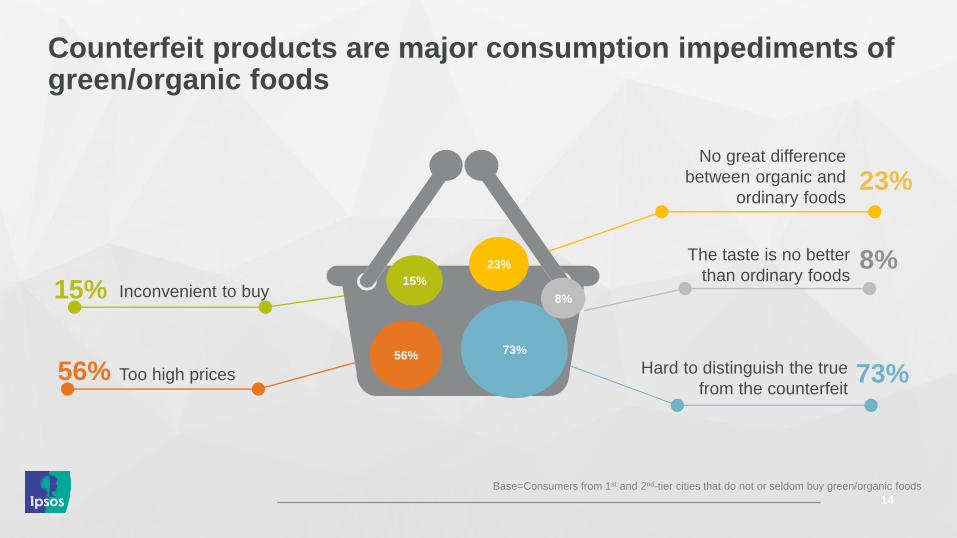
Counterfeit products are major consumption impediments of green/organic foods
14
Hard to distinguish the true
from the counterfeit Too high prices 56% 73%
73% 56%
15%
8%
23%
Inconvenient to buy 15%
The taste is no better
than ordinary foods 8%
No great difference
between organic and
ordinary foods 23%
Base=Consumers from 1st and 2nd-tier cities that do not or seldom buy green/organic foods

15
Package
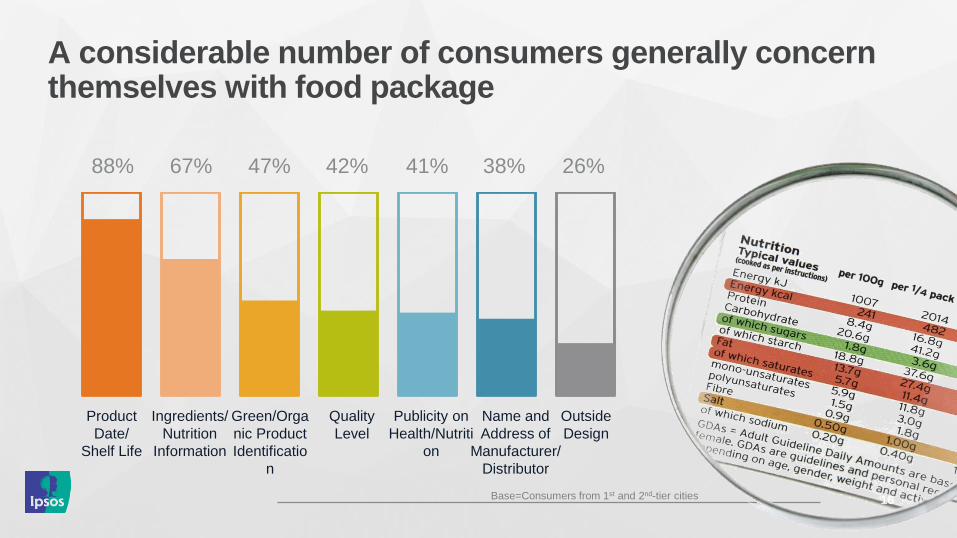
A considerable number of consumers generally concern themselves with food package
16
88% 67% 47% 42% 41% 38% 26%
Product
Date/
Shelf Life
Ingredients/
Nutrition
Information
Green/Orga
nic Product
Identificatio
n
Quality
Level
Publicity on
Health/Nutriti
on
Name and
Address of
Manufacturer/
Distributor
Outside
Design
Base=Consumers from 1st and 2nd-tier cities
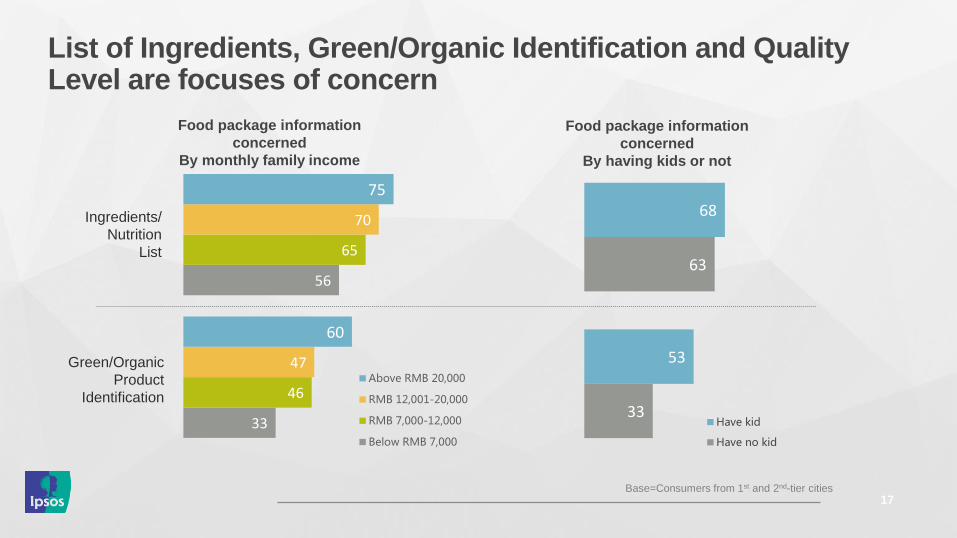
List of Ingredients, Green/Organic Identification and Quality Level are focuses of concern
17
33
56
46
65
47
70
60
75
Above RMB 20,000
RMB 12,001-20,000
RMB 7,000-12,000
Below RMB 7,000
33
63
53
68
Have kid
Have no kid
Food package information
concerned
By monthly family income
Food package information
concerned
By having kids or not
Ingredients/
Nutrition
List
Green/Organic
Product
Identification
Base=Consumers from 1st and 2nd-tier cities
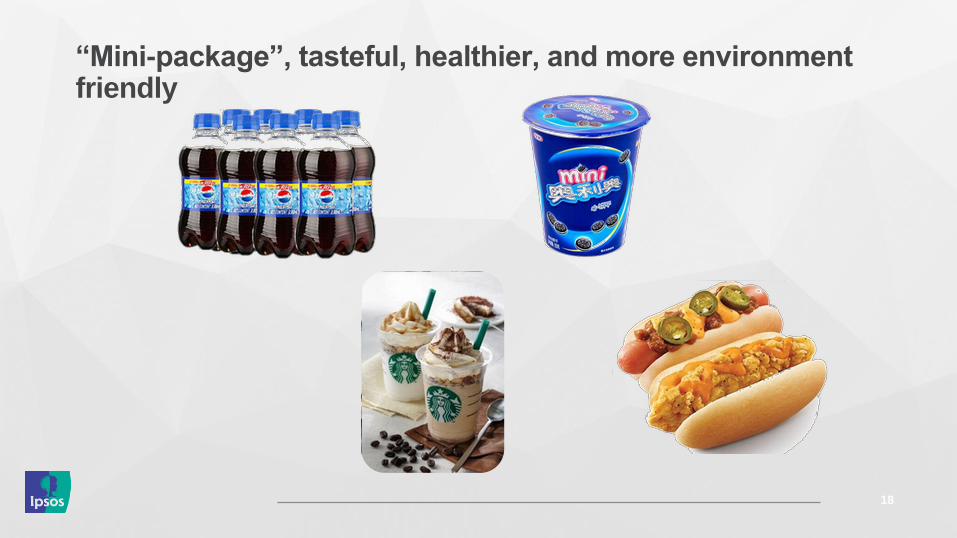
“Mini-package”, tasteful, healthier, and more environment friendly
18
19
Globalisation
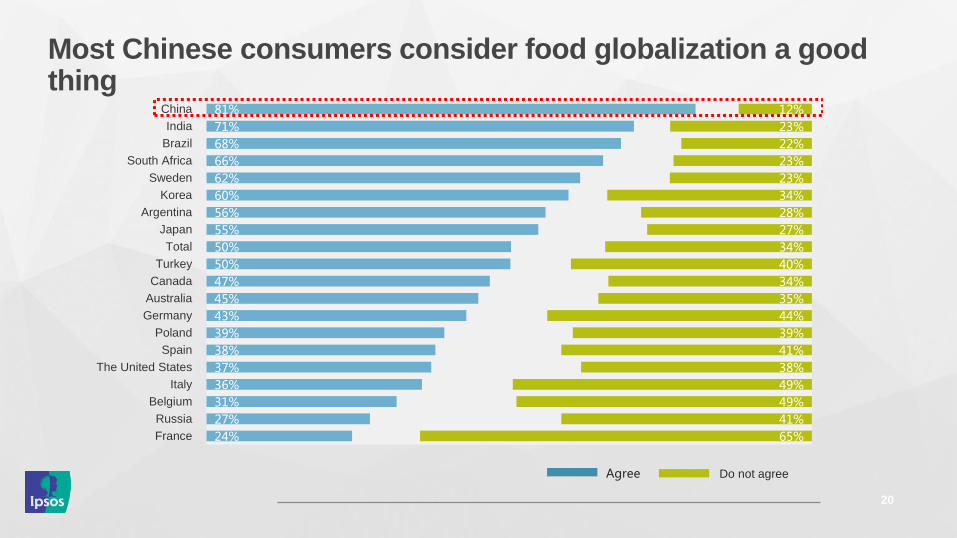
81%
71%
68%
66%
62%
60%
56%
55%
50%
50%
47%
45%
43%
39%
38%
37%
36%
31%
27%
24%
12%
23%
22%
23%
23%
34%
28%
27%
34%
40%
34%
35%
44%
39%
41%
38%
49%
49%
41%
65%
China
India
Brazil
South Africa
Sweden
Korea
Argentina
Japan
Total
Turkey
Canada
Australia
Germany
Poland
Spain
The United States
Italy
Belgium
Russia
France
Agree
Most Chinese consumers consider food globalization a good thing
20
Do not agree
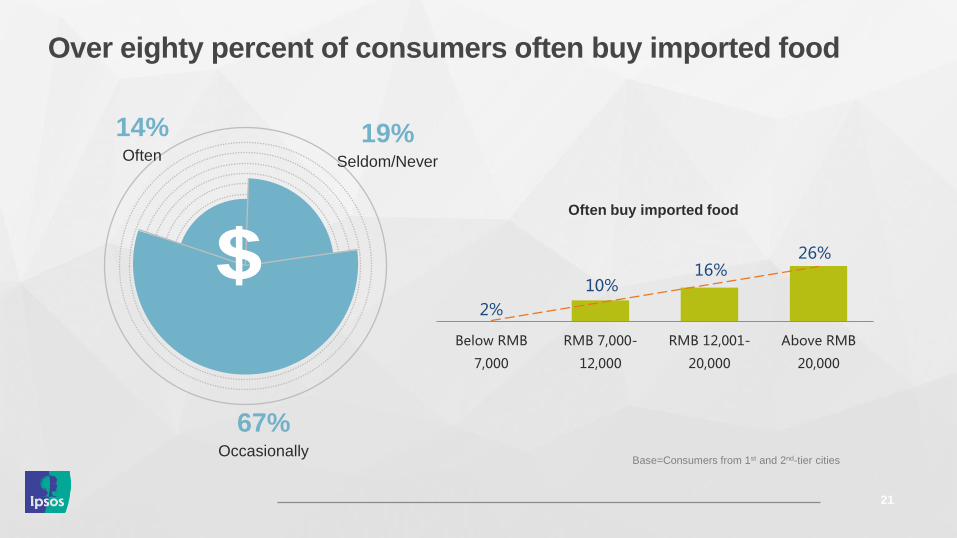
Over eighty percent of consumers often buy imported food
21
2%
10% 16%
26%
Below RMB
7,000
RMB 7,000-
12,000
RMB 12,001-
20,000
Above RMB
20,000
Often buy imported food
Base=Consumers from 1st and 2nd-tier cities
67% Occasionally
14% Often
19% Seldom/Never
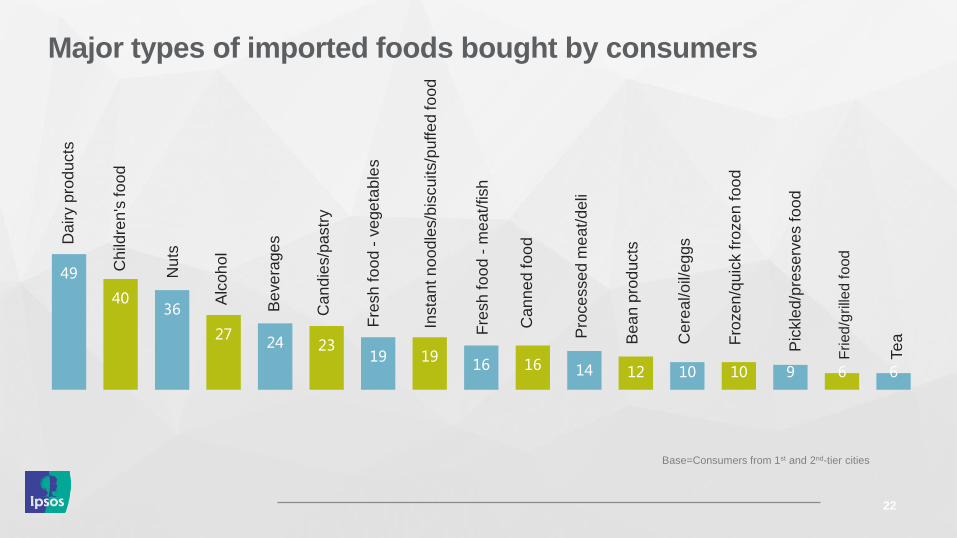
49
40 36
27 24 23
19 19 16 16 14 12 10 10 9 6 6
Pic
kle
d/p
reserv
es fo
od
Fried
/grille
d f
ood
Te
a
Major types of imported foods bought by consumers
22
Alc
oh
ol D
airy p
rod
ucts
Nu
ts
Be
ve
rage
s
Fro
ze
n/q
uic
k f
roze
n fo
od
Can
ne
d fo
od
Be
an
pro
du
cts
Fre
sh
fo
od
- m
ea
t/fish
Child
ren
's fo
od
Pro
ce
sse
d m
ea
t/d
eli
Insta
nt n
oo
dle
s/b
iscuits/p
uffe
d fo
od
Can
die
s/p
astr
y
Fre
sh
fo
od
- v
ege
tab
les
Cere
al/o
il/eggs
Base=Consumers from 1st and 2nd-tier cities
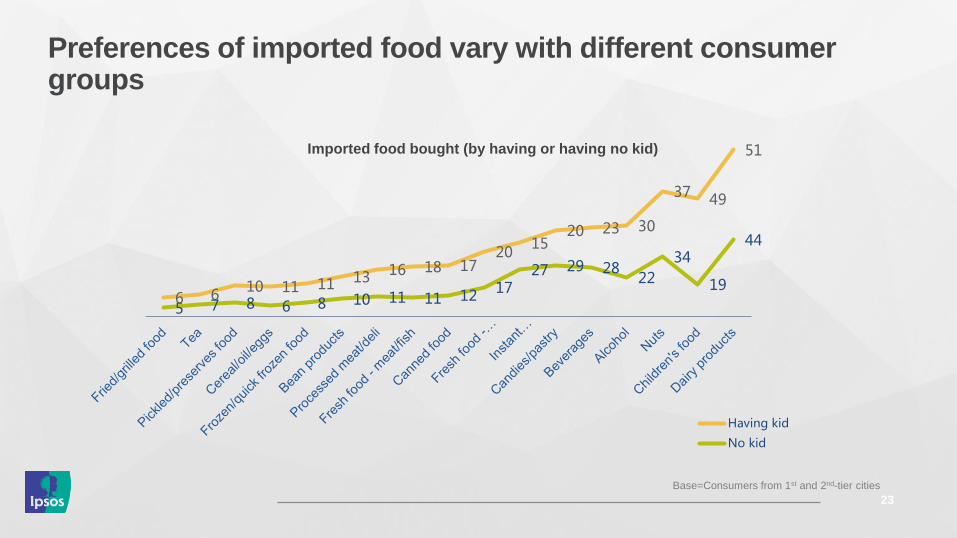
Preferences of imported food vary with different consumer groups
23
5 7 8 6 8 10 11 11 12 17
27 29 28 22
34
19
44
6 6 10 11 11 13 16 18 17
20 15
20 23 30
37 49
51
Having kid
No kid
Imported food bought (by having or having no kid)
Base=Consumers from 1st and 2nd-tier cities
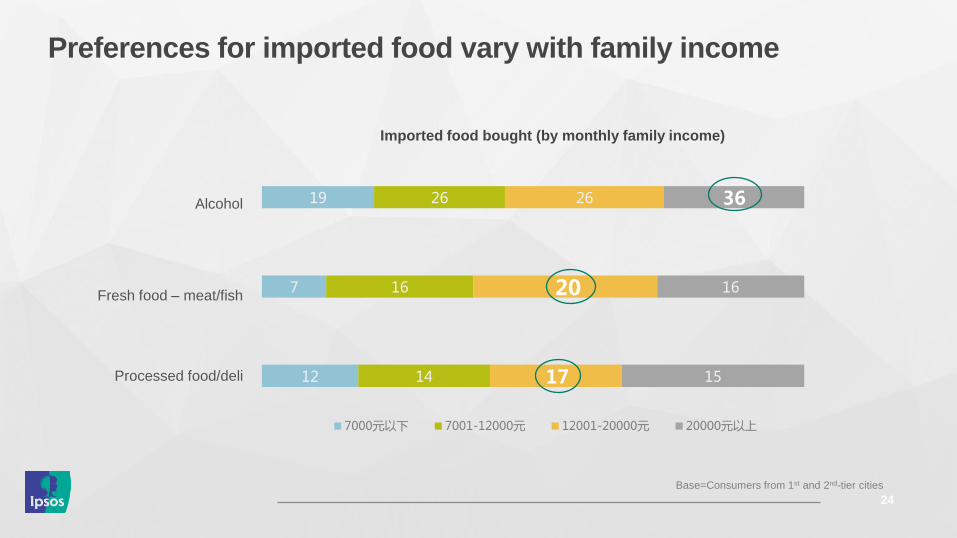
Preferences for imported food vary with family income
24
Imported food bought (by monthly family income)
12
7
19
14
16
26
17
20
26
15
16
36
7000元以下 7001-12000元 12001-20000元 20000元以上
Alcohol
Fresh food – meat/fish
Processed food/deli
Base=Consumers from 1st and 2nd-tier cities
25
Innovation
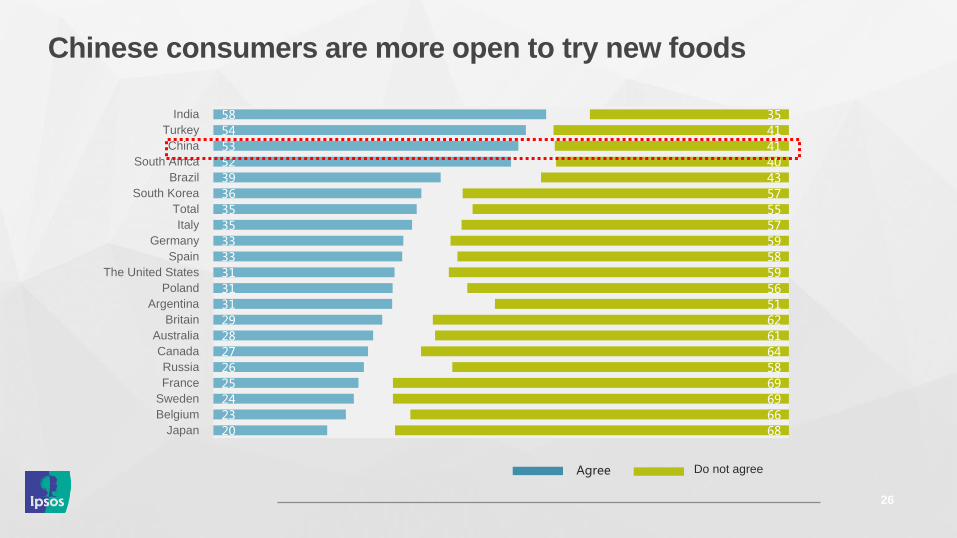
Chinese consumers are more open to try new foods
26
58 54 53 52 39 36 35 35 33 33 31 31 31 29 28 27 26 25 24 23 20
35 41 41 40 43 57 55 57 59 58 59 56 51 62 61 64 58 69 69 66 68
India
Turkey
China
South Africa
Brazil
South Korea
Total
Italy
Germany
Spain
The United States
Poland
Argentina
Britain
Australia
Canada
Russia
France
Sweden
Belgium
Japan
Agree Do not agree
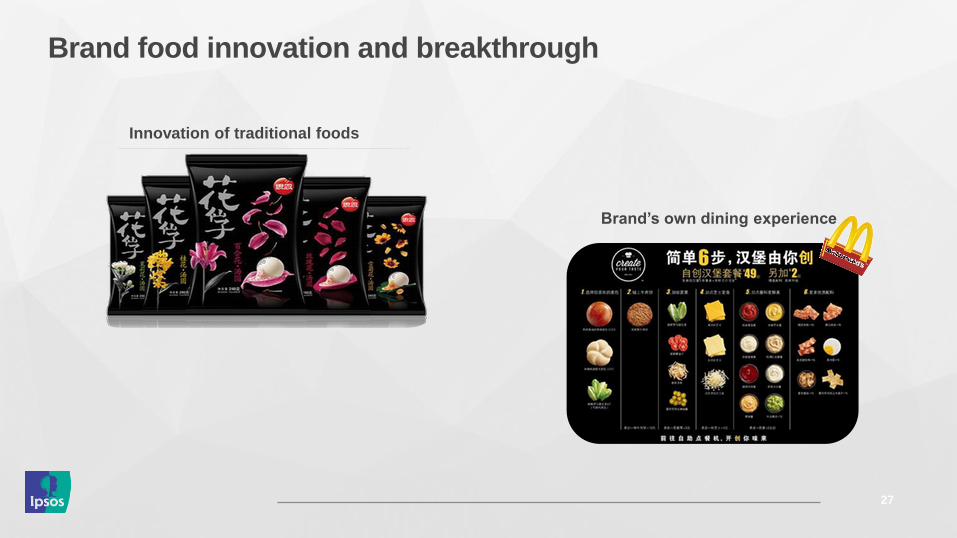
Brand food innovation and breakthrough
27
Innovation of traditional foods
Brand’s own dining experience

28
New Channel
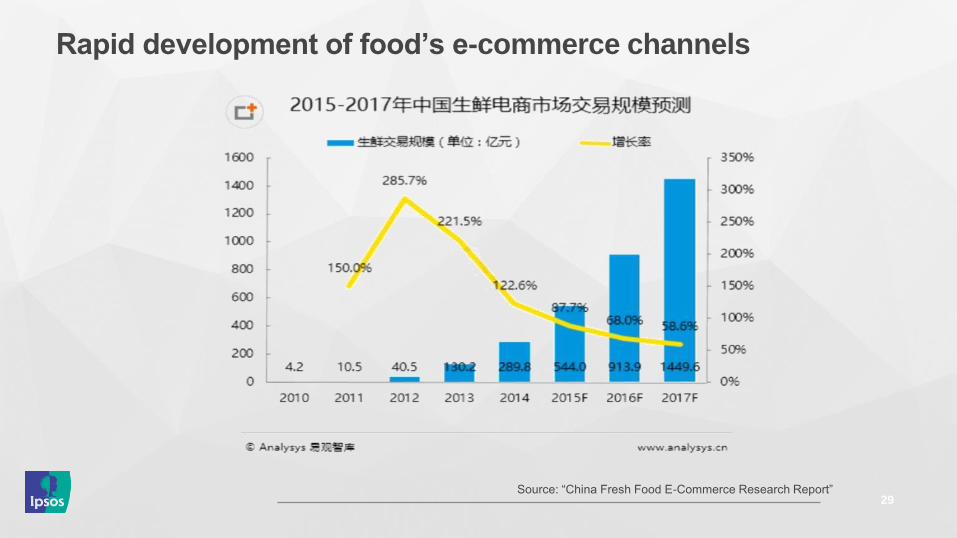
29 Source: “China Fresh Food E-Commerce Research Report”
Rapid development of food’s e-commerce channels
30
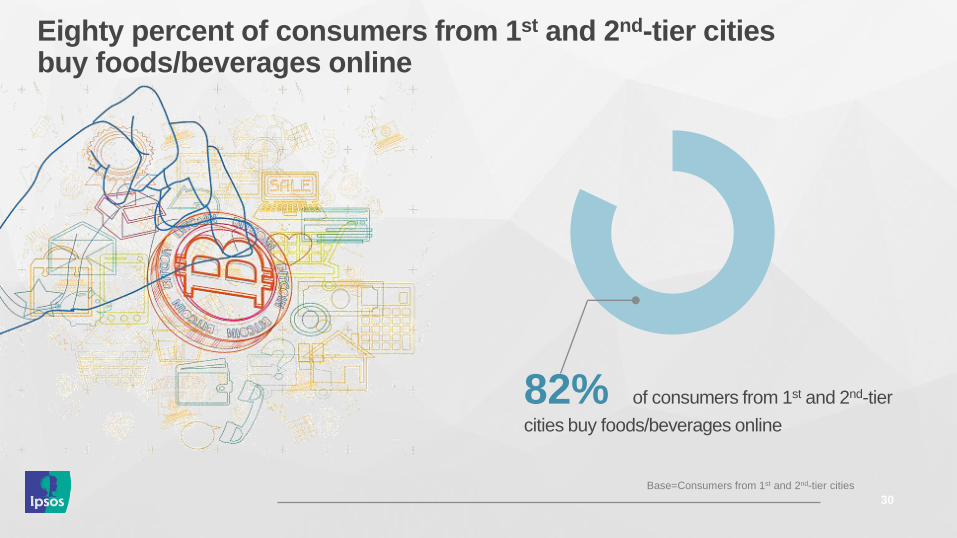
82% of consumers from 1st and 2nd-tier
cities buy foods/beverages online
Eighty percent of consumers from 1st and 2nd-tier cities buy foods/beverages online
Base=Consumers from 1st and 2nd-tier cities
31
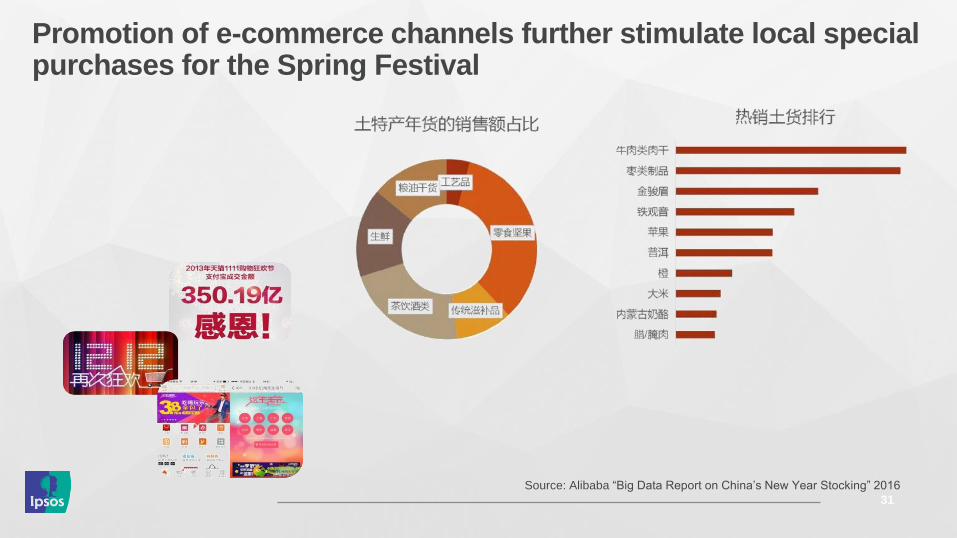
Source: Alibaba “Big Data Report on China’s New Year Stocking” 2016
Promotion of e-commerce channels further stimulate local special purchases for the Spring Festival

32
Energy Supplement
33
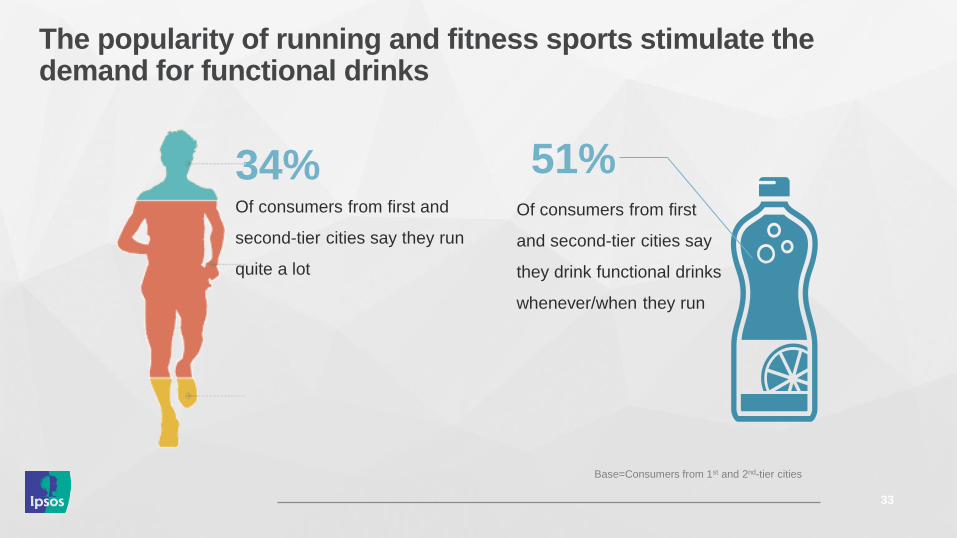
34% Of consumers from first and
second-tier cities say they run
quite a lot
51%
Base=Consumers from 1st and 2nd-tier cities
The popularity of running and fitness sports stimulate the demand for functional drinks
Of consumers from first
and second-tier cities say
they drink functional drinks
whenever/when they run
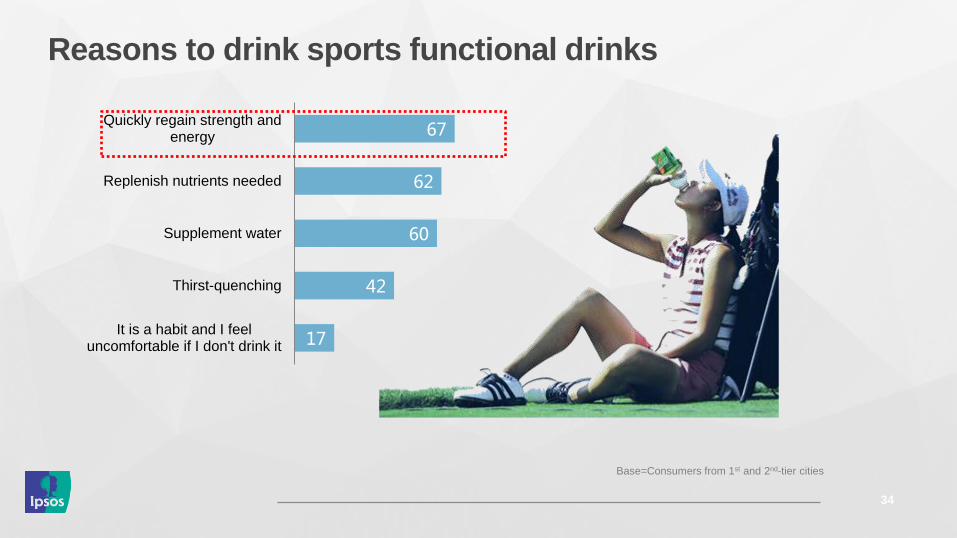
Reasons to drink sports functional drinks
34
17
42
60
62
67
It is a habit and I feeluncomfortable if I don't drink it
Thirst-quenching
Supplement water
Replenish nutrients needed
Quickly regain strength andenergy
Base=Consumers from 1st and 2nd-tier cities
35
Snacking
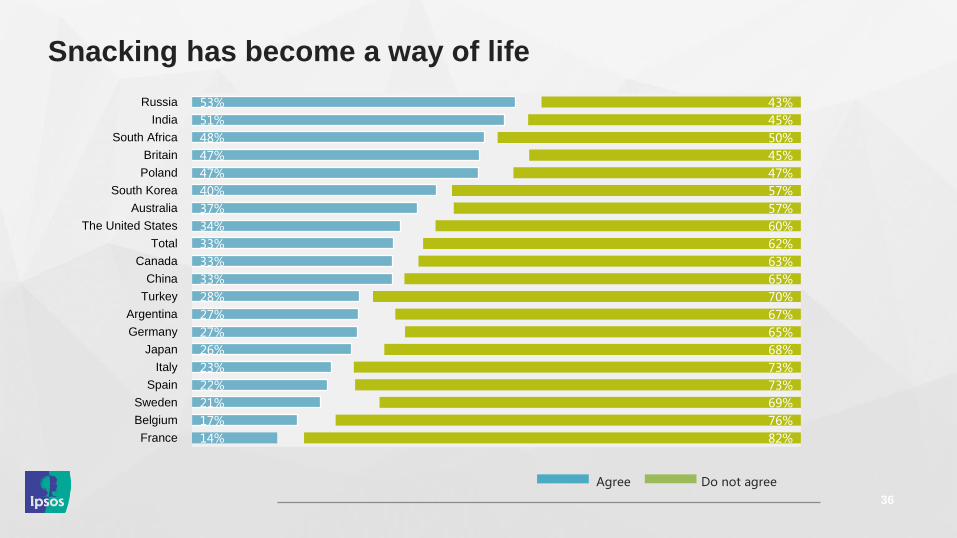
Snacking has become a way of life
53%
51%
48%
47%
47%
40%
37%
34%
33%
33%
33%
28%
27%
27%
26%
23%
22%
21%
17%
14%
43%
45%
50%
45%
47%
57%
57%
60%
62%
63%
65%
70%
67%
65%
68%
73%
73%
69%
76%
82%
Russia
India
South Africa
Britain
Poland
South Korea
Australia
The United States
Total
Canada
China
Turkey
Argentina
Germany
Japan
Italy
Spain
Sweden
Belgium
France
Do not agree Agree
36
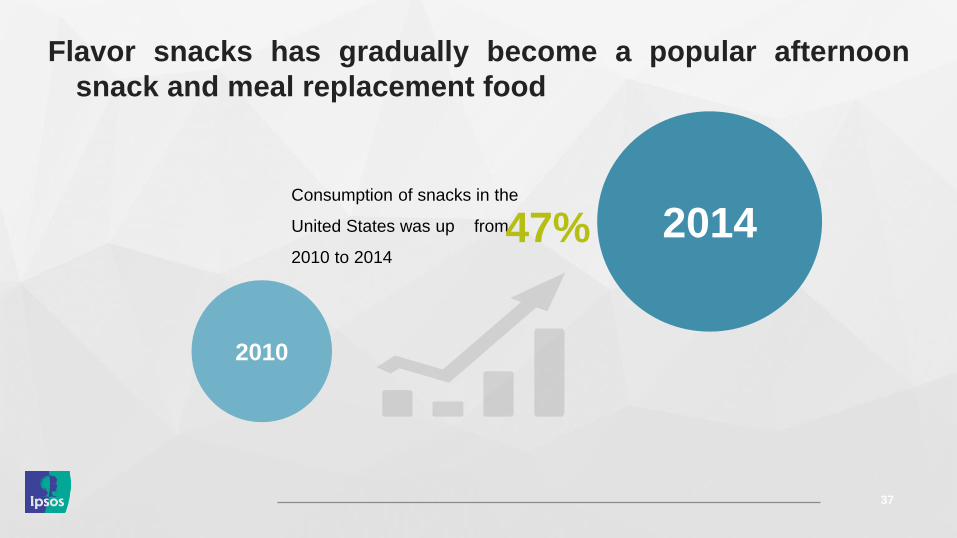
2014
Flavor snacks has gradually become a popular afternoon
snack and meal replacement food
37
Consumption of snacks in the
United States was up from
2010 to 2014
2010
47%

38
Customisation
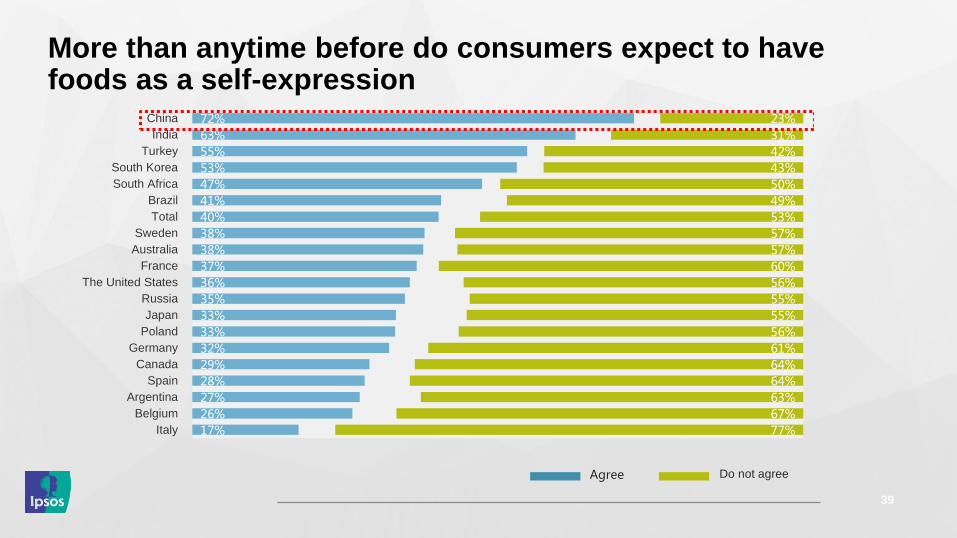
72%
63%
55%
53%
47%
41%
40%
38%
38%
37%
36%
35%
33%
33%
32%
29%
28%
27%
26%
17%
23%
31%
42%
43%
50%
49%
53%
57%
57%
60%
56%
55%
55%
56%
61%
64%
64%
63%
67%
77%
China
India
Turkey
South Korea
South Africa
Brazil
Total
Sweden
Australia
France
The United States
Russia
Japan
Poland
Germany
Canada
Spain
Argentina
Belgium
Italy
Agree
More than anytime before do consumers expect to have foods as a self-expression
39
Do not agree
40
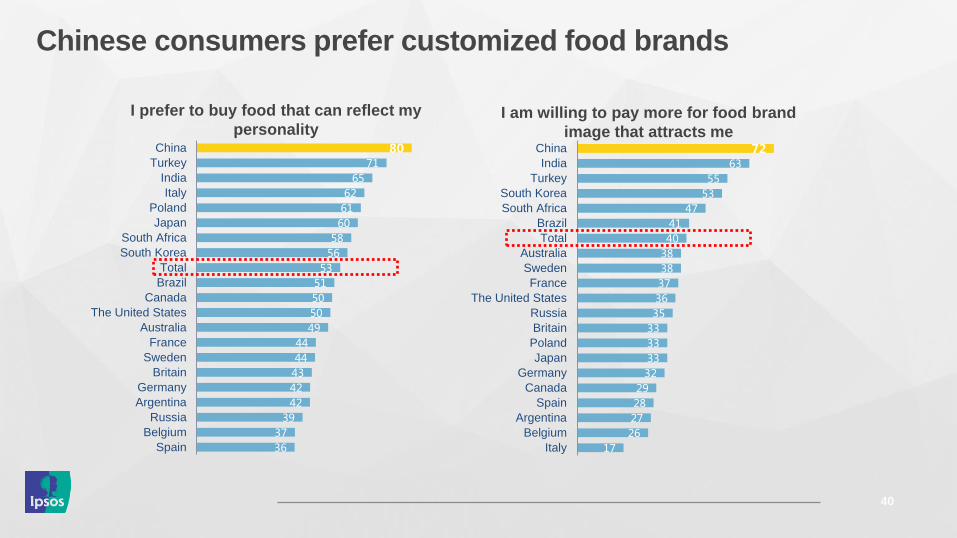
36
37
39
42
42
43
44
44
49
50
50
51
53
56
58
60
61
62
65
71
80
Spain
Belgium
Russia
Argentina
Germany
Britain
Sweden
France
Australia
The United States
Canada
Brazil
Total
South Korea
South Africa
Japan
Poland
Italy
India
Turkey
China
I prefer to buy food that can reflect my
personality
17
26
27
28
29
32
33
33
33
35
36
37
38
38
40
41
47
53
55
63
72
Italy
Belgium
Argentina
Spain
Canada
Germany
Japan
Poland
Britain
Russia
The United States
France
Sweden
Australia
Total
Brazil
South Africa
South Korea
Turkey
India
China
I am willing to pay more for food brand
image that attracts me
Chinese consumers prefer customized food brands
41
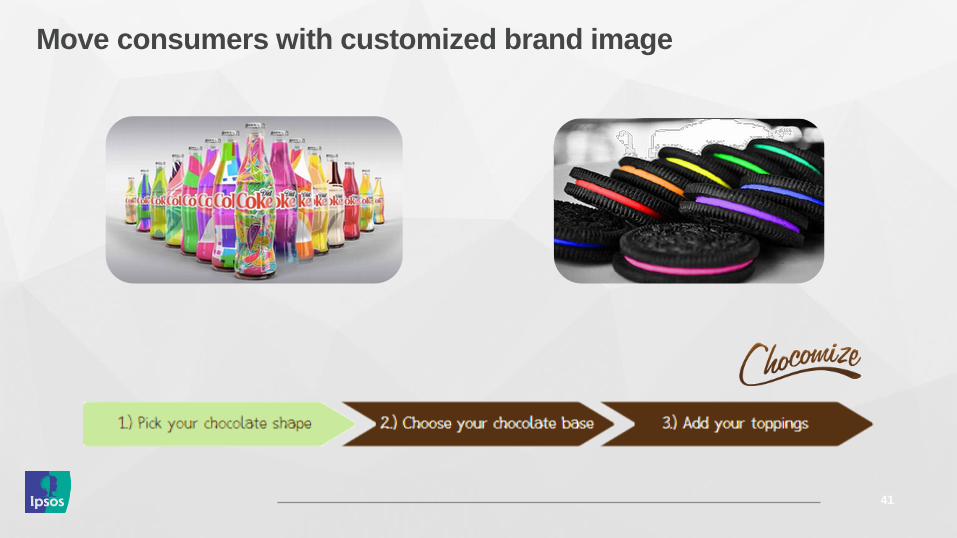
Move consumers with customized brand image
42
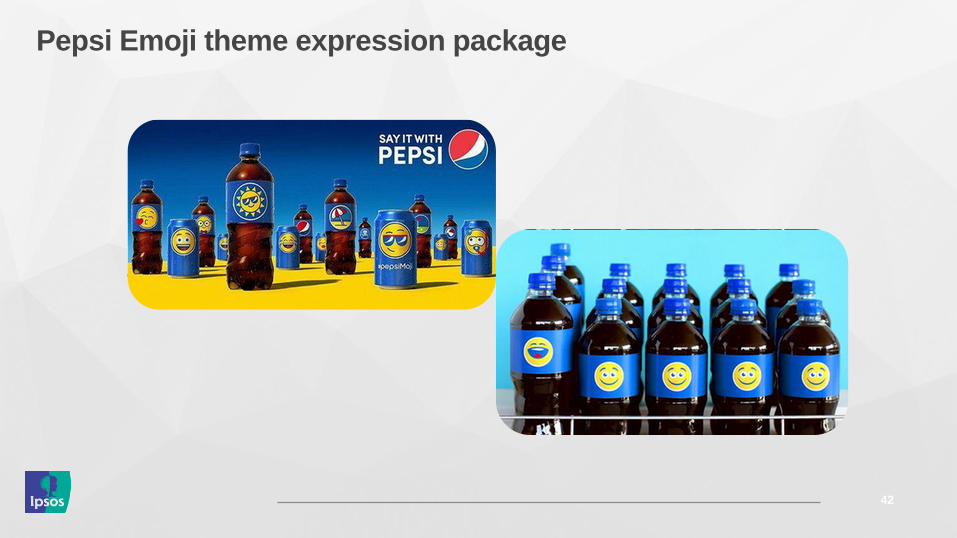
Pepsi Emoji theme expression package

THANK
YOU!
Add Ipsos official WeChat to your watchlist for more information!