
Trends in Educational Equity of Girls & Women: 2004 · Catherine Freeman. Background Trends in...
29
U.S. Department of Education Institute of Education Sciences National Center for Education Statistics Trends in Educational Equity of Girls & Women: 2004 Trends in Educational Equity of Girls & Trends in Educational Equity of Girls & Women: 2004 Women: 2004 Catherine Freeman Catherine Freeman
Transcript of Trends in Educational Equity of Girls & Women: 2004 · Catherine Freeman. Background Trends in...
U.S. Department of Education
Institute of Education Sciences
National Center for Education Statistics
Trends in Educational Equity of Girls & Women: 2004
Trends in Educational Equity of Girls & Trends in Educational Equity of Girls & Women: 2004Women: 2004
Catherine FreemanCatherine Freeman
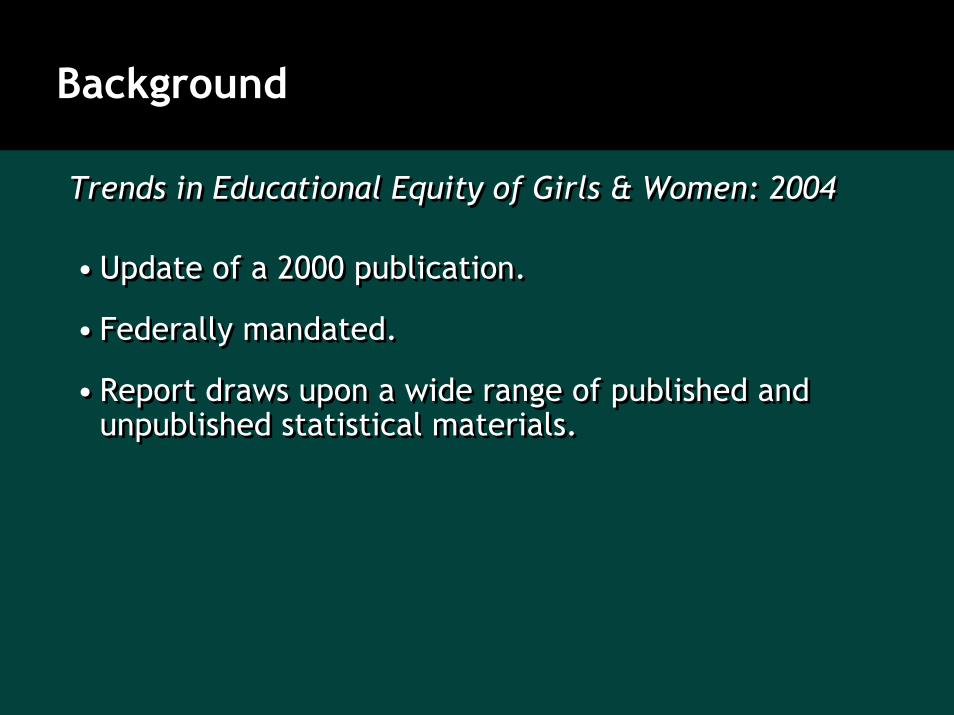
Background
Trends in Educational Equity of Girls & Women: 2004Trends in Educational Equity of Girls & Women: 2004
• Update of a 2000 publication.
• Federally mandated.
• Report draws upon a wide range of published and unpublished statistical materials.
• Update of a 2000 publication.
• Federally mandated.
• Report draws upon a wide range of published and unpublished statistical materials.
Overview
• In elementary and secondary school and in college, females are now doing as well as or better than males on many indicators of achievement and educational attainment.
• Women are still underrepresented in some fields of study, as well as more generally in doctoral and first-professional degree programs, although they have made substantial gains in the past 30 years.
• These differences may have labor market consequences.
Preprimary and Early Elementary Education
Males and females start school on a similar footing. In certain other areas, females appear to start school ahead.
• Similarities:
– Enrollment in preprimary and kindergarten education (Males: 63 percent, Females: 64 percent).
– General knowledge assessments in kindergarten and first grade.
– Overall reading assessment.– Overall mathematics performance in kindergarten and
first grade.
Preprimary and Early Elementary Education
•Differences:
– More females were read to three or more times in the past week (Males: 82 percent, Females: 86 percent).
– A higher percentages of females (80 percent) than males (73 percent) could recognize words by sight in the spring of first grade. Males and females had similar levels of sight word recognition in third grade.
– Males scored higher on third grade mathematics assessment (Males: 87 points, Females: 83 points).
Elementary and Secondary Education
Progress Through School
• Females are less likely than males to repeat a grade and to dropout.
• Males and females who have a child in high school are more likely to drop out of high school and less likely to receive a bachelor’s degree.
• On a variety of measures, males seem to be more likely than females to experience serious problems at school and to engage in risky behaviors.
• Female students appear to be less likely than male students to engage in certain behaviors, such as drug use and violence that may put themselves and others at risk.
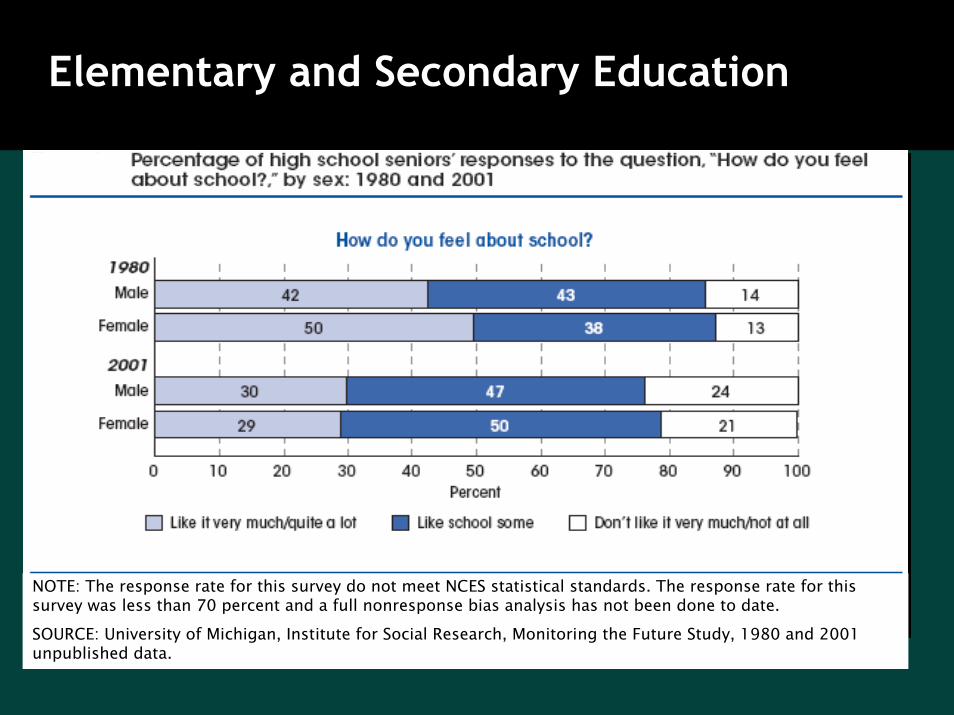
• High school seniors’ attitudes toward school have become increasingly negative, particularly among females.
Progress Through School
• Females are less likely than males to repeat a grade and to dropout.
• Males and females who have a child in high school are more likely to drop out of high school and less likely to receive a bachelor’s degree.
• On a variety of measures, males seem to be more likely than females to experience serious problems at school and to engage in risky behaviors.
• Female students appear to be less likely than male students to engage in certain behaviors, such as drug use and violence that may put themselves and others at risk.
• High school seniors’ attitudes toward school have become increasingly negative, particularly among females.
Elementary and Secondary Education
NOTE: The response rate for this survey do not meet NCES statistical standards. The response rate for this survey was less than 70 percent and a full nonresponse bias analysis has not been done to date.
SOURCE: University of Michigan, Institute for Social Research, Monitoring the Future Study, 1980 and 2001 unpublished data.
Elementary and Secondary Education
Academic Performance
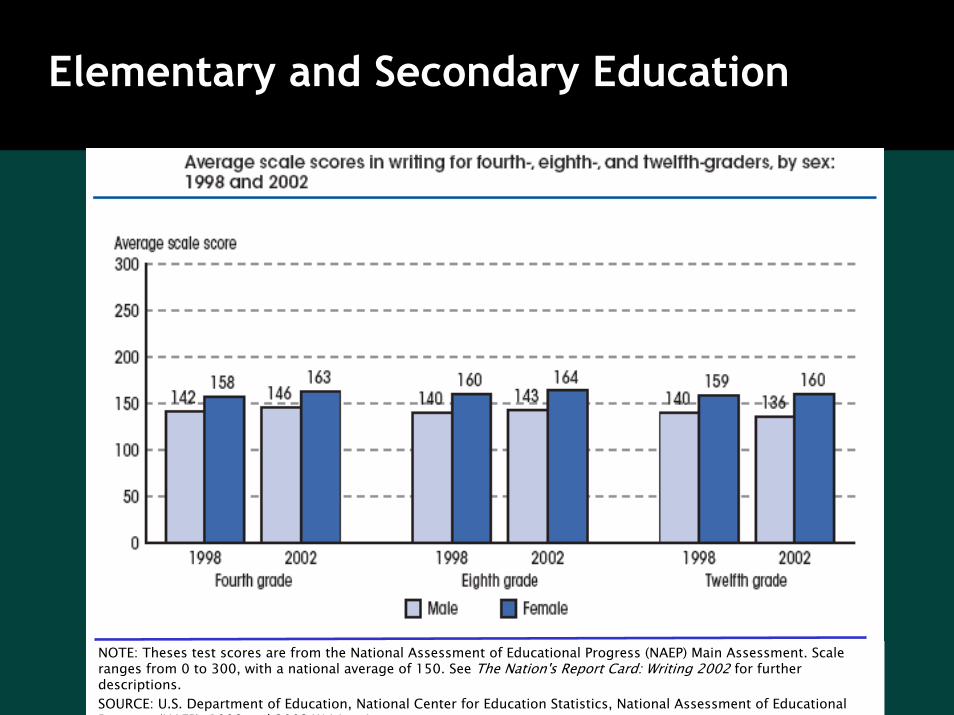
• Females have consistently outperformed males in reading and writing.
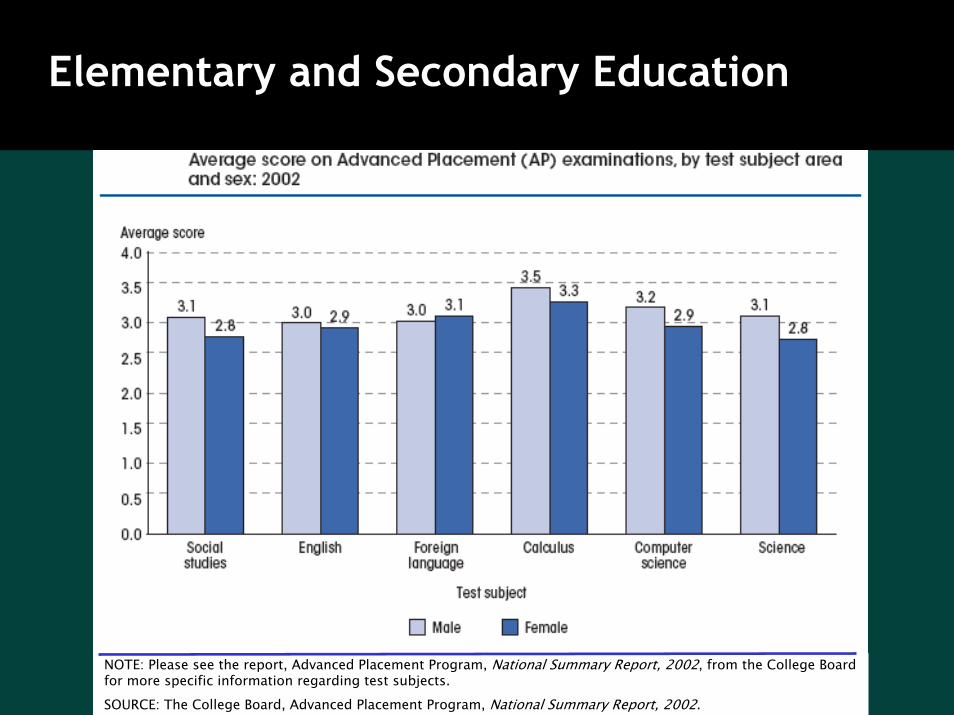
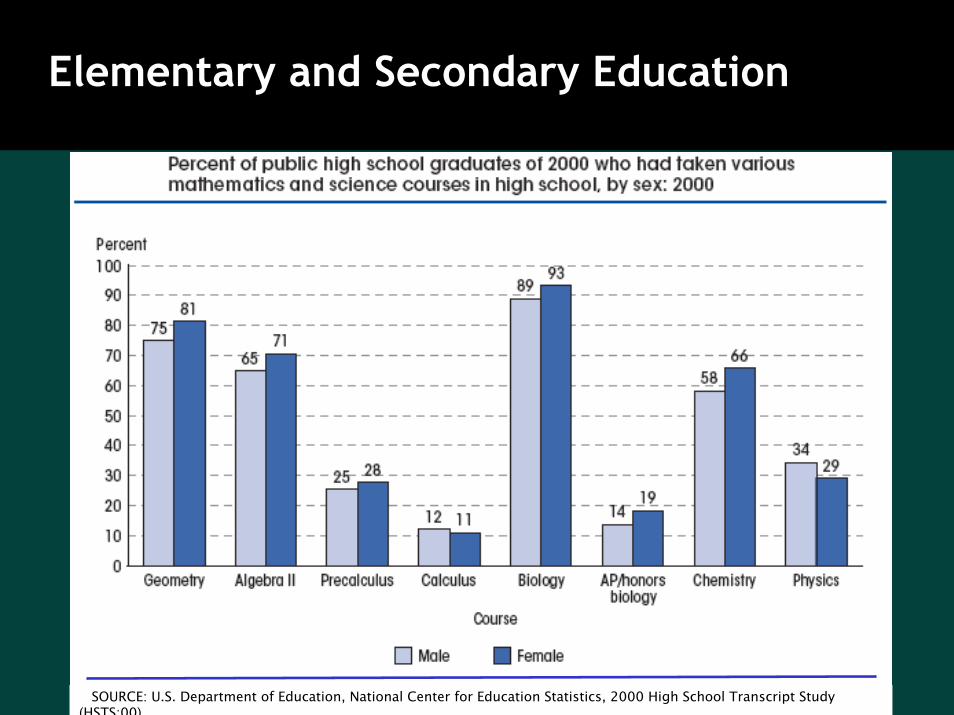
• There are some gender differences favoring male students in mathematics and science.
Academic Performance
• Females have consistently outperformed males in reading and writing.
• There are some gender differences favoring male students in mathematics and science.

Elementary and Secondary Education
NOTE: Theses test scores are from the National Assessment of Educational Progress (NAEP). Accommodations were not permitted for the 1992 assessment. Scale ranges from 0 to 500. For a discussion of the reading scale score definitions, please see http://nces.ed.gov/nationsreportcard/reading/sclae/asp.
SOURCE: U.S. Department of Education, National Center for Education Statistics, National Assessment of Educational Progress (NAEP), 1992, 2002, and 2003 Reading Assessments.
Elementary and Secondary Education
NOTE: Theses test scores are from the National Assessment of Educational Progress (NAEP) Main Assessment. Scale ranges from 0 to 300, with a national average of 150. See The Nation's Report Card: Writing 2002 for further descriptions.SOURCE: U.S. Department of Education, National Center for Education Statistics, National Assessment of Educational P (NAEP) 1998 d 2002 W iti A t
Elementary and Secondary Education
NOTE: Please see the report, Advanced Placement Program, National Summary Report, 2002, from the College Board for more specific information regarding test subjects.
SOURCE: The College Board, Advanced Placement Program, National Summary Report, 2002.

Elementary and Secondary Education
NOTE: Theses test scores are from the National Assessment of Educational Progress (NAEP) Main Assessment. Scale ranges from 0 to 500. For both the 1990 and 1992 assessments, accommodations were not permitted. For a discussion of the mathematics scale score definitions, please see http://nces.ed.gov/nationsreportcard/mathematics/scale/asp.SOURCE: U.S. Department of Education, National Center for Education Statistics, National Assessment of
Elementary and Secondary Education
SOURCE: U.S. Department of Education, National Center for Education Statistics, 2000 High School Transcript Study (HSTS:00).
Elementary and Secondary Education
Extracurricular Activities
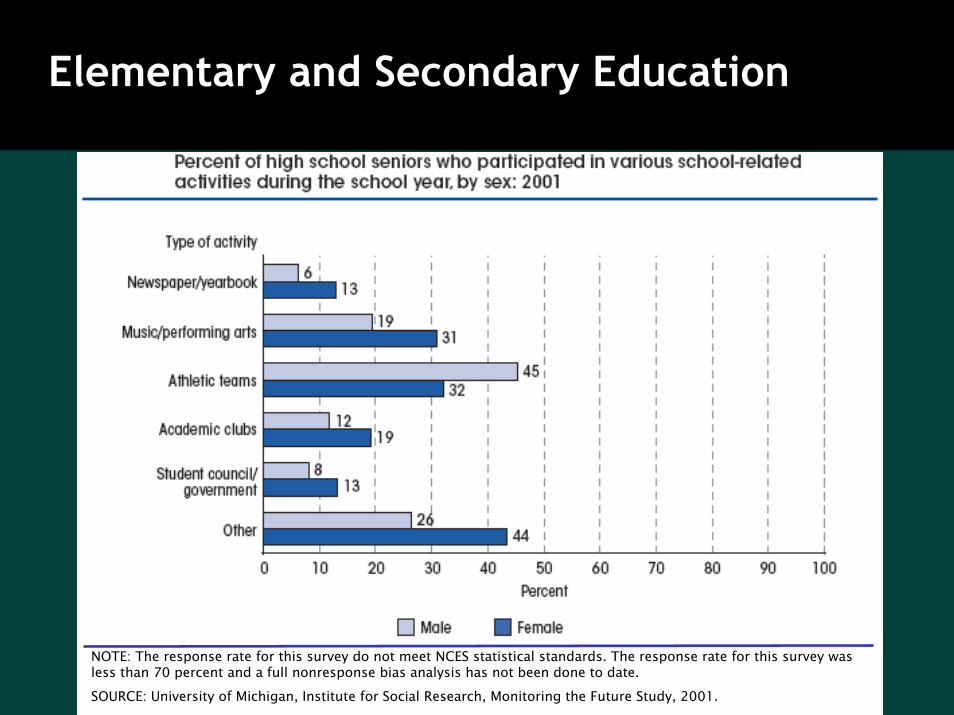
• Females are more likely than males to participate in various afterschool activities, except for athletics.
Extracurricular Activities
• Females are more likely than males to participate in various afterschool activities, except for athletics.
Elementary and Secondary Education
NOTE: The response rate for this survey do not meet NCES statistical standards. The response rate for this survey was less than 70 percent and a full nonresponse bias analysis has not been done to date.
SOURCE: University of Michigan, Institute for Social Research, Monitoring the Future Study, 2001.
Postsecondary Education
Persistence and Attainment
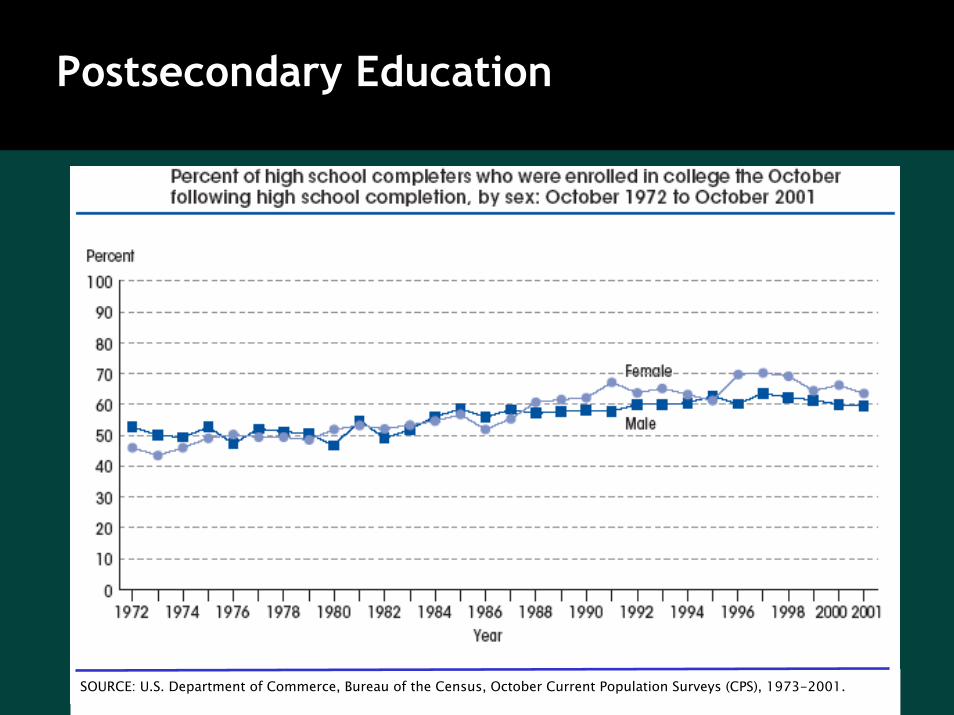
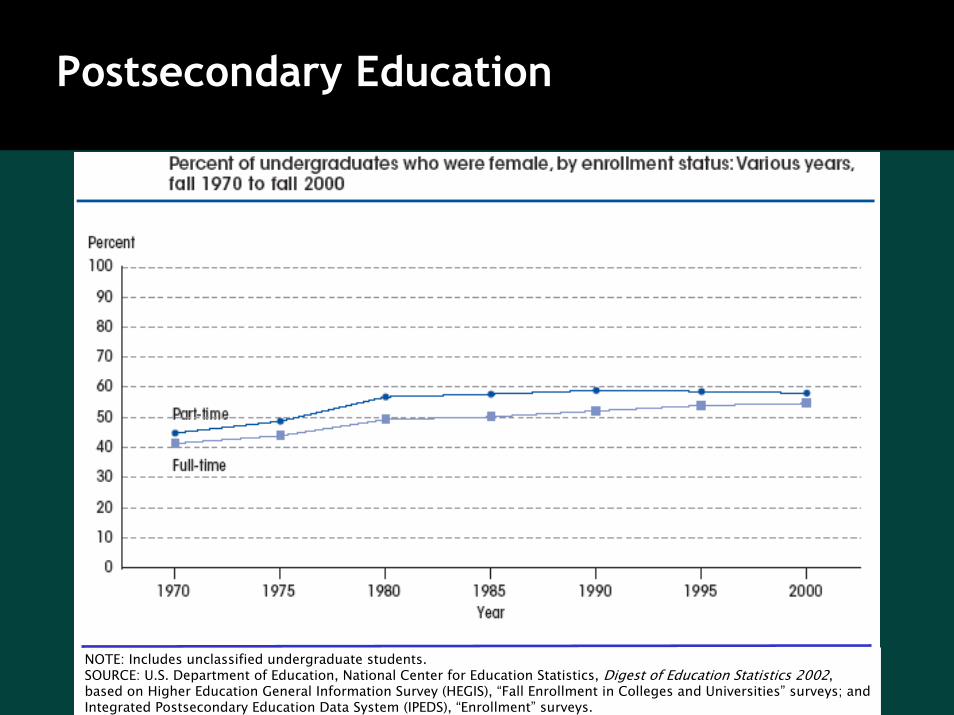
• Over the past two decades, the rates at which women have enrolled in undergraduate education and attained college degrees increased faster than those of men (NCES 2005-169).
– Part of this increase may be related to an increase in the percentage of traditional students who were women.
– Women are still overrepresented among nontraditional students such as adult students with families, students in the lowest income level, and students age 40 or older. (page 13)
Persistence and Attainment
• Over the past two decades, the rates at which women have enrolled in undergraduate education and attained college degrees increased faster than those of men (NCES 2005-169).
– Part of this increase may be related to an increase in the percentage of traditional students who were women.
– Women are still overrepresented among nontraditional students such as adult students with families, students in the lowest income level, and students age 40 or older. (page 13)
Postsecondary Education
SOURCE: U.S. Department of Commerce, Bureau of the Census, October Current Population Surveys (CPS), 1973-2001.SOURCE: U.S. Department of Commerce, Bureau of the Census, October Current Population Surveys (CPS), 1973-2001.
Postsecondary Education
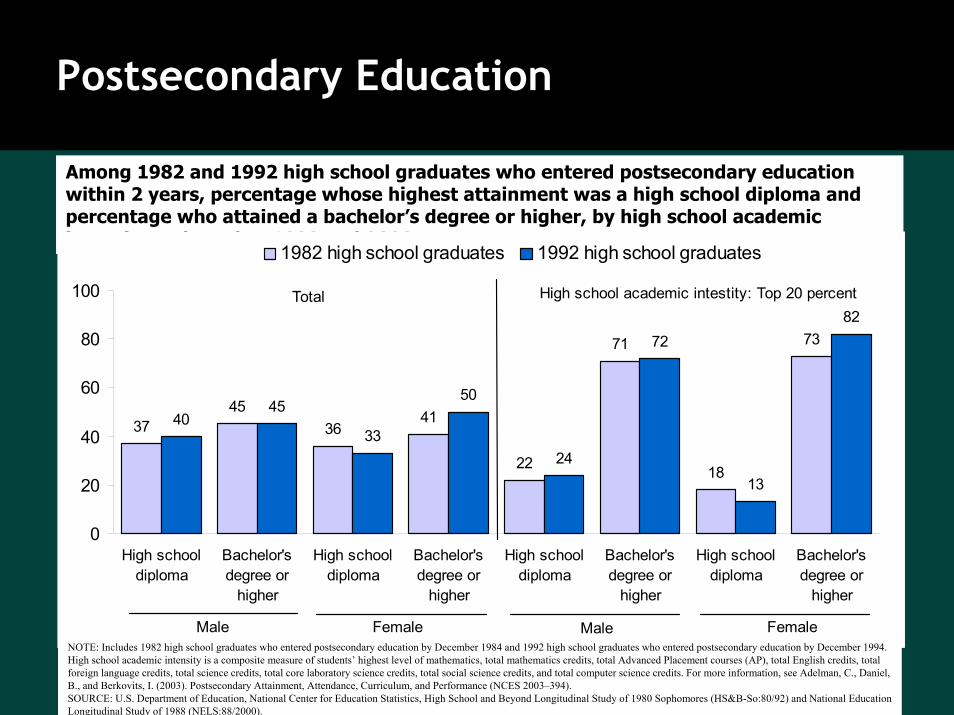
Among 1982 and 1992 high school graduates who entered postsecondary education within 2 years, percentage whose highest attainment was a high school diploma and percentage who attained a bachelor’s degree or higher, by high school academic intensity and gender: 1992 and 2000
3745
3641
22
71
18
73
4045
33
50
24
72
13
82
0
20
40
60
80
100
High schooldiploma
Bachelor'sdegree or
higher
High schooldiploma
Bachelor'sdegree or
higher
High schooldiploma
Bachelor'sdegree or
higher
High schooldiploma
Bachelor'sdegree or
higher
1982 high school graduates 1992 high school graduates
Total High school academic intestity: Top 20 percent
Male Female FemaleMaleNOTE: Includes 1982 high school graduates who entered postsecondary education by December 1984 and 1992 high school graduates who entered postsecondary education by December 1994. High school academic intensity is a composite measure of students’ highest level of mathematics, total mathematics credits, total Advanced Placement courses (AP), total English credits, total foreign language credits, total science credits, total core laboratory science credits, total social science credits, and total computer science credits. For more information, see Adelman, C., Daniel, B., and Berkovits, I. (2003). Postsecondary Attainment, Attendance, Curriculum, and Performance (NCES 2003–394). SOURCE: U.S. Department of Education, National Center for Education Statistics, High School and Beyond Longitudinal Study of 1980 Sophomores (HS&B-So:80/92) and National Education Longitudinal Study of 1988 (NELS:88/2000).
Postsecondary Education
NOTE: Includes unclassified undergraduate students.SOURCE: U.S. Department of Education, National Center for Education Statistics, Digest of Education Statistics 2002, based on Higher Education General Information Survey (HEGIS), “Fall Enrollment in Colleges and Universities” surveys; and Integrated Postsecondary Education Data System (IPEDS), “Enrollment” surveys.
Postsecondary Education
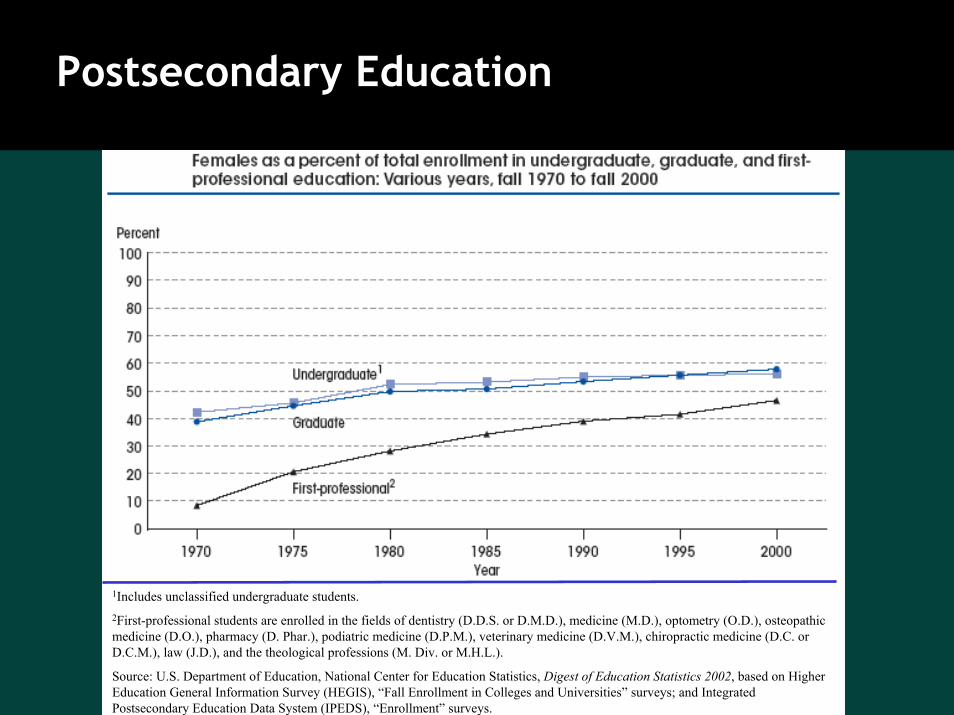
1Includes unclassified undergraduate students.2First-professional students are enrolled in the fields of dentistry (D.D.S. or D.M.D.), medicine (M.D.), optometry (O.D.), osteopathicmedicine (D.O.), pharmacy (D. Phar.), podiatric medicine (D.P.M.), veterinary medicine (D.V.M.), chiropractic medicine (D.C. or D.C.M.), law (J.D.), and the theological professions (M. Div. or M.H.L.).
Source: U.S. Department of Education, National Center for Education Statistics, Digest of Education Statistics 2002, based on Higher Education General Information Survey (HEGIS), “Fall Enrollment in Colleges and Universities” surveys; and Integrated Postsecondary Education Data System (IPEDS), “Enrollment” surveys.
Postsecondary Education
Persistence and Attainment
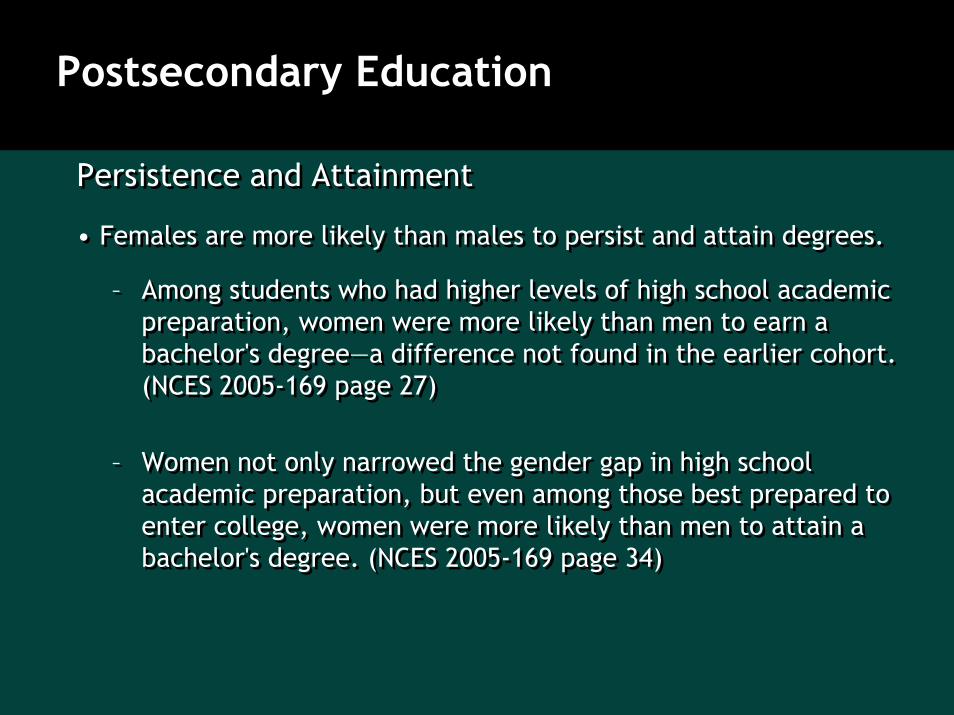
• Females are more likely than males to persist and attain degrees.
– Among students who had higher levels of high school academic preparation, women were more likely than men to earn a bachelor's degree—a difference not found in the earlier cohort. (NCES 2005-169 page 27)
– Women not only narrowed the gender gap in high school academic preparation, but even among those best prepared to enter college, women were more likely than men to attain a bachelor's degree. (NCES 2005-169 page 34)
Persistence and Attainment
• Females are more likely than males to persist and attain degrees.
– Among students who had higher levels of high school academic preparation, women were more likely than men to earn a bachelor's degree—a difference not found in the earlier cohort. (NCES 2005-169 page 27)
– Women not only narrowed the gender gap in high school academic preparation, but even among those best prepared to enter college, women were more likely than men to attain a bachelor's degree. (NCES 2005-169 page 34)
Postsecondary Education
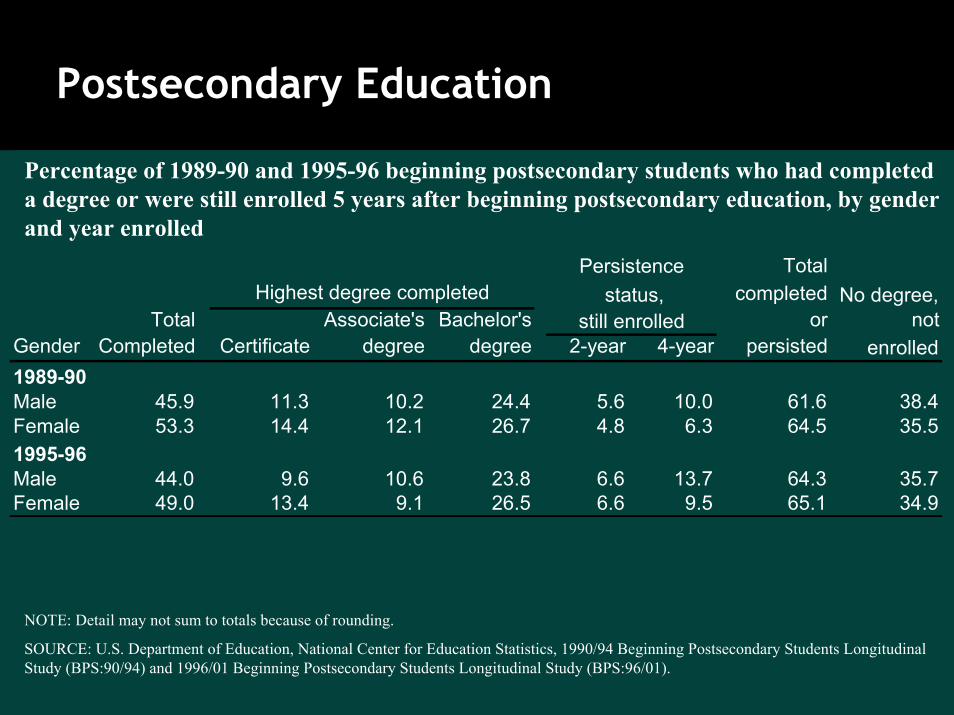
Percentage of 1989-90 and 1995-96 beginning postsecondary students who had completed a degree or were still enrolled 5 years after beginning postsecondary education, by gender and year enrolled
Total completed No degree,
Total Associate's Bachelor's or not Gender Completed Certificate degree degree 2-year 4-year persisted enrolled1989-90Male 45.9 11.3 10.2 24.4 5.6 10.0 61.6 38.4Female 53.3 14.4 12.1 26.7 4.8 6.3 64.5 35.51995-96Male 44.0 9.6 10.6 23.8 6.6 13.7 64.3 35.7Female 49.0 13.4 9.1 26.5 6.6 9.5 65.1 34.9
still enrolled status,Highest degree completed
Persistence
NOTE: Detail may not sum to totals because of rounding.
SOURCE: U.S. Department of Education, National Center for Education Statistics, 1990/94 Beginning Postsecondary Students Longitudinal Study (BPS:90/94) and 1996/01 Beginning Postsecondary Students Longitudinal Study (BPS:96/01).
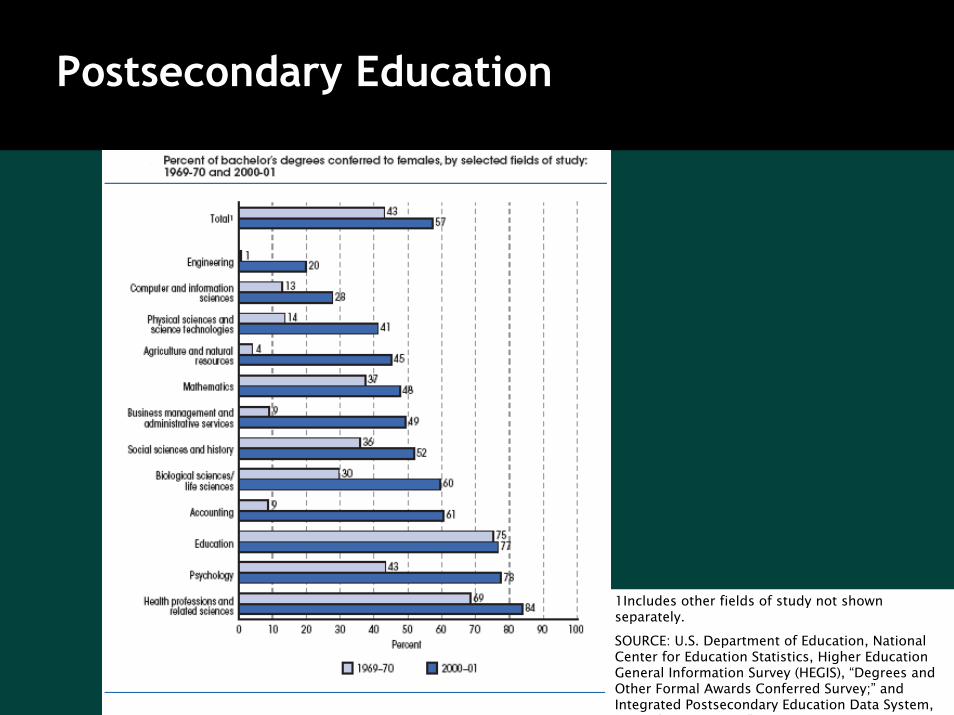
Postsecondary Education
1Includes other fields of study not shown separately.
SOURCE: U.S. Department of Education, National Center for Education Statistics, Higher Education General Information Survey (HEGIS), “Degrees and Other Formal Awards Conferred Survey;” and Integrated Postsecondary Education Data System, “C l ti S ” (IPEDS C 01) 2000 01
Outcomes
• Employment rates for females have increased across all levels ofeducational attainment since the 1970s.
• Females ages 25-64 have lower labor force participation rates than males, regardless of education, but participation increases witheducation.
• Females are more likely than males to participate in adult education.
Outcomes
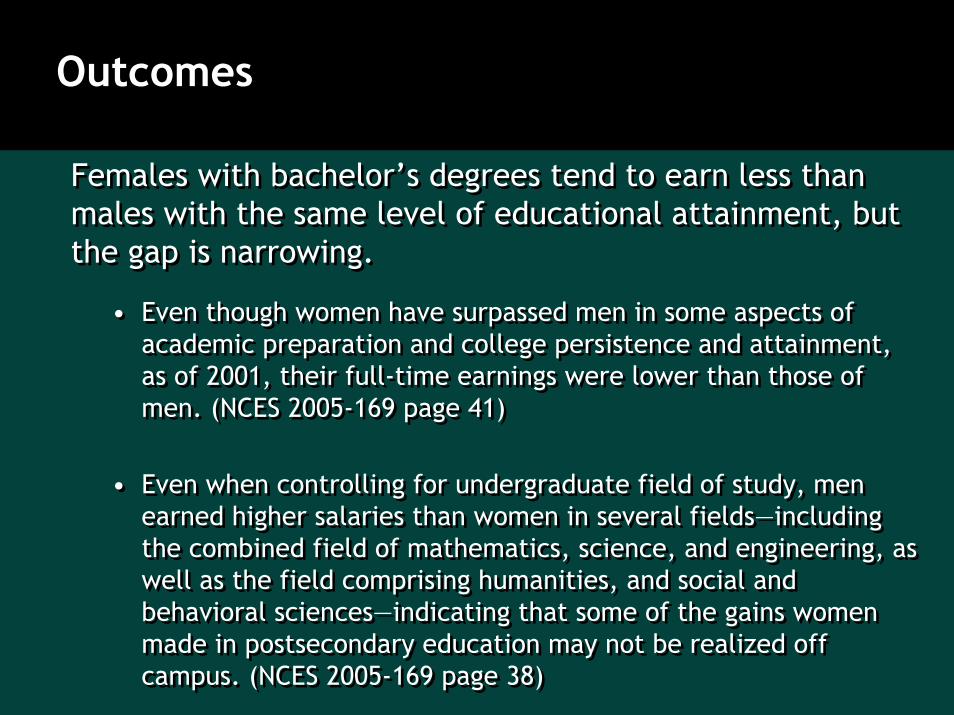
Females with bachelor’s degrees tend to earn less than males with the same level of educational attainment, but the gap is narrowing.
• Even though women have surpassed men in some aspects of academic preparation and college persistence and attainment, as of 2001, their full-time earnings were lower than those of men. (NCES 2005-169 page 41)
• Even when controlling for undergraduate field of study, men earned higher salaries than women in several fields—including the combined field of mathematics, science, and engineering, as well as the field comprising humanities, and social and behavioral sciences—indicating that some of the gains women made in postsecondary education may not be realized off campus. (NCES 2005-169 page 38)
Outcomes
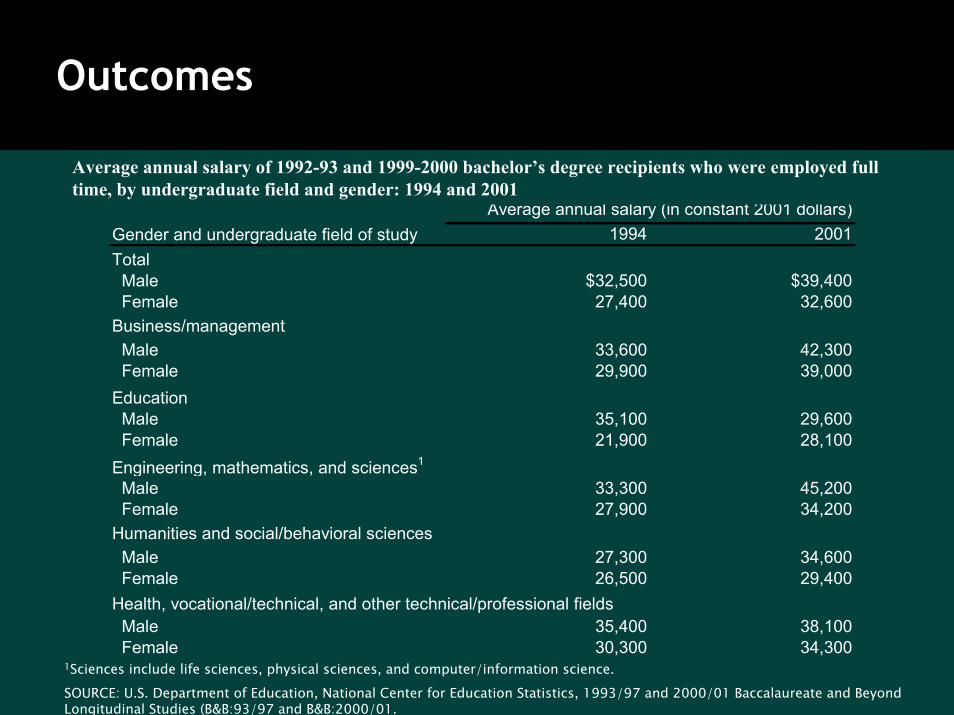
Gender and undergraduate field of study 1994 2001Total Male $32,500 $39,400 Female 27,400 32,600Business/management Male 33,600 42,300 Female 29,900 39,000Education Male 35,100 29,600 Female 21,900 28,100Engineering, mathematics, and sciences1
Male 33,300 45,200 Female 27,900 34,200Humanities and social/behavioral sciences Male 27,300 34,600 Female 26,500 29,400Health, vocational/technical, and other technical/professional fields Male 35,400 38,100 Female 30,300 34,300
Average annual salary (in constant 2001 dollars)
Average annual salary of 1992-93 and 1999-2000 bachelor’s degree recipients who were employed full time, by undergraduate field and gender: 1994 and 2001
1Sciences include life sciences, physical sciences, and computer/information science.
SOURCE: U.S. Department of Education, National Center for Education Statistics, 1993/97 and 2000/01 Baccalaureate and Beyond Longitudinal Studies (B&B:93/97 and B&B:2000/01.
Conclusions
• Various indicators have been presented here to examine the extent to which males and females have access to similar educational opportunities, take advantage of those opportunities, and have similar educational outcomes.
• By most of these measures, females are doing at least as well as males.
• Various indicators have been presented here to examine the extent to which males and females have access to similar educational opportunities, take advantage of those opportunities, and have similar educational outcomes.
• By most of these measures, females are doing at least as well as males.
Resources
Freeman, C.E. (2004). Trends in Educational Equity of Girls & Women: 2004 (NCES 2005-016). U.S. Department of Education, National Center for Education Statistics. Washington, DC: U.S. Government Printing Office.
Peter, K., and Horn, L. (2005). Gender Differences in Participation and Completion of Undergraduate Education and How They Have Changed Over Time (NCES 2005–169). U.S. Department of Education, National Center for Education Statistics. Washington, DC: U.S. Government Printing Office.