Trends in Educational Attainment of Youth in Toronto: A Comparison of Neighbourhood
21
Trends in Educational Attainment of Youth in Toronto: A Comparison of Neighbourhoods Phillip Meng, PhD Post-Doctoral Fellow School of Social Work, York University and Alex Lovell, PhD (c) Queen’s University
-
Upload
act-for-youth -
Category
Documents
-
view
217 -
download
0
description
A presentation on research findings concerning educational attainment in various Toronto neighbourhoods, given at the United Way Community of Practice on Youth Educational Attainment Partnerships Learning Circle at Black Creek Pioneer Village on Friday, June 15, 2012.
Transcript of Trends in Educational Attainment of Youth in Toronto: A Comparison of Neighbourhood

Trends in Educational Attainment of Youth in Toronto:
A Comparison of Neighbourhoods Phillip Meng, PhD
Post-Doctoral Fellow School of Social Work, York University
and
Alex Lovell, PhD (c) Queen’s University

Outline
• Research Context – Toronto’s Priority Neighbourhoods
• Research Methods – Customized Census Data
• Findings • Implications of Findings • Comments and Questions

Research Context:
13 Priority Neighbourhoods in Toronto:

Research Framework
Education Income
Immigration status Visible minority
Occupation Employment
Mobility Mode of transportation
to work
Language
Spatial analysis: Explore the differences in different neighbourhoods
Temporal analysis: Explore the differences in different years
Ethnic origins
Unpaid housework
causes and/or results
causes and/or results
Household structure
Gender
Methods
• Customized Statistics Canada Data – Three Census Years: 1996, 2001 & 2006 – Three youth groups: 15-19, 20-24, 25-29 – Data is at the Census Tract (CT) level for Toronto. – Variables include:
• Age, Sex, Marriage status, Language, Mobility, Immigration status, Aboriginal info, Employment, Occupation, Place of work, Mode of transportation to work, Unpaid housework, Education, Visible minority, Household structure, Ethnic origins, Income

Quantitative Methods: Research Questions
• For each youth group (15-19, 20-24, 25-29), we are
exploring income and education differences in different neighbourhoods in Toronto (spatial patterns) particularly the situation within the PN13 – We are exploring how different socio-demographic
variables are associated with these differences

Quantitative Methods:
Other Possible Questions • Other possible questions: Who are NEETers?
– We will develop a profile of youth who are NEET (not engaged in education, employment and training) especially youth from PN13s so we can develop policy and practice options that support them to continue with their learning and training.
– Spending time NEET is a major predictor of later unemployment, low income, depression and poor mental health (HRSDC).
– What factors are associated with NEETers disengagement from education or work?
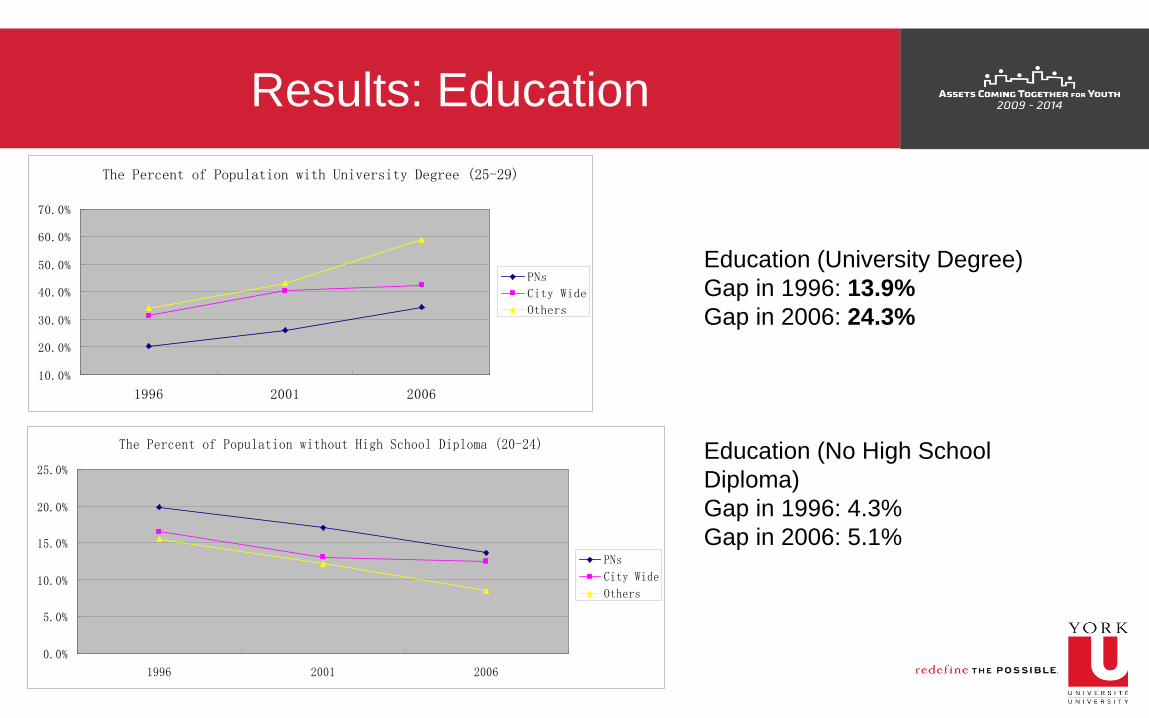
Results: Education
The Percent of Population without High School Diploma (20-24)
0.0%
5.0%
10.0%
15.0%
20.0%
25.0%
1996 2001 2006
PNs
City Wide
Others
The Percent of Population with University Degree (25-29)
10.0%
20.0%
30.0%
40.0%
50.0%
60.0%
70.0%
1996 2001 2006
PNs
City Wide
Others
Education (University Degree) Gap in 1996: 13.9% Gap in 2006: 24.3%
Education (No High School Diploma) Gap in 1996: 4.3% Gap in 2006: 5.1%
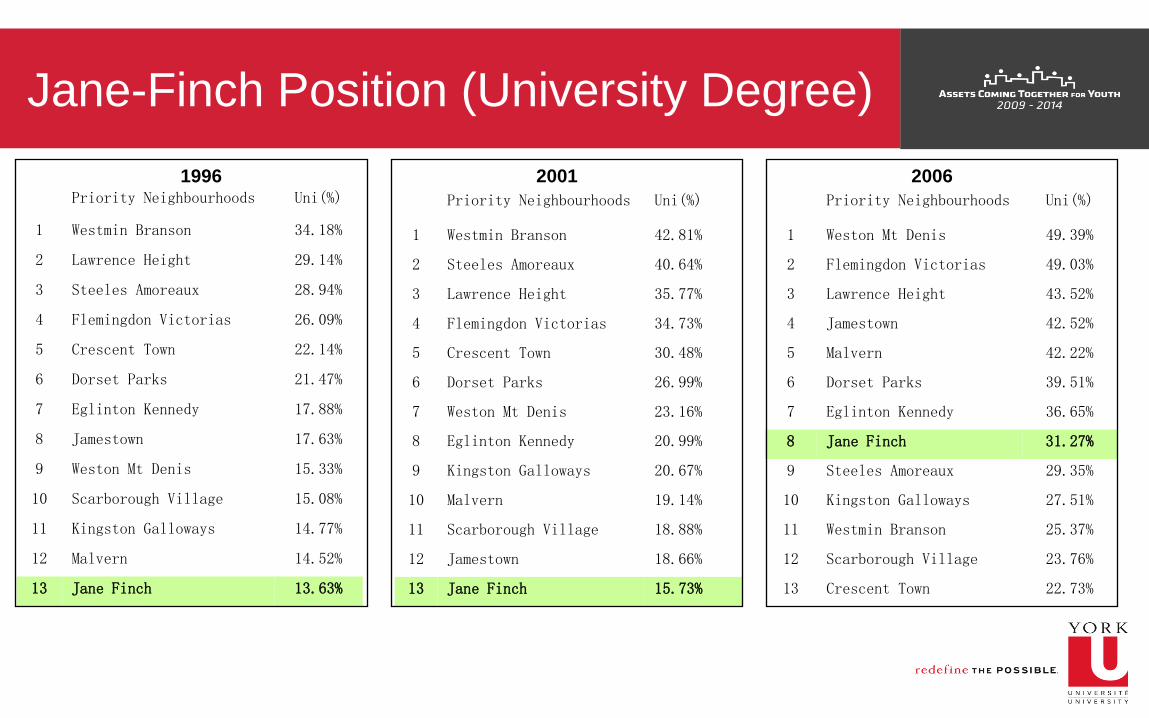
Jane-Finch Position (University Degree)
Priority Neighbourhoods Uni(%)
1 Westmin Branson 34.18%
2 Lawrence Height 29.14%
3 Steeles Amoreaux 28.94%
4 Flemingdon Victorias 26.09%
5 Crescent Town 22.14%
6 Dorset Parks 21.47%
7 Eglinton Kennedy 17.88%
8 Jamestown 17.63%
9 Weston Mt Denis 15.33%
10 Scarborough Village 15.08%
11 Kingston Galloways 14.77%
12 Malvern 14.52%
13 Jane Finch 13.63%
Priority Neighbourhoods Uni(%)
1 Westmin Branson 42.81%
2 Steeles Amoreaux 40.64%
3 Lawrence Height 35.77%
4 Flemingdon Victorias 34.73%
5 Crescent Town 30.48%
6 Dorset Parks 26.99%
7 Weston Mt Denis 23.16%
8 Eglinton Kennedy 20.99%
9 Kingston Galloways 20.67%
10 Malvern 19.14%
11 Scarborough Village 18.88%
12 Jamestown 18.66%
13 Jane Finch 15.73%
Priority Neighbourhoods Uni(%)
1 Weston Mt Denis 49.39%
2 Flemingdon Victorias 49.03%
3 Lawrence Height 43.52%
4 Jamestown 42.52%
5 Malvern 42.22%
6 Dorset Parks 39.51%
7 Eglinton Kennedy 36.65%
8 Jane Finch 31.27%
9 Steeles Amoreaux 29.35%
10 Kingston Galloways 27.51%
11 Westmin Branson 25.37%
12 Scarborough Village 23.76%
13 Crescent Town 22.73%
1996 2001 2006

Jane-Finch’s Position (No High School Diploma)
Priority Neighbourhoods No Hi(%)
1 Steeles Amoreaux 12.13%
2 Westmin Branson 12.54%
3 Flemingdon Victorias 16.67%
4 Lawrence Height 16.80%
5 Dorset Parks 18.73%
6 Jamestown 20.00%
7 Eglinton Kennedy 21.04%
8 Malvern 21.56%
9 Scarborough Village 21.99%
10 Kingston Galloways 22.65%
11 Weston Mt Denis 24.56%
12 Jane Finch 25.77%
13 Crescent Town 26.29%
Priority Neighbourhoods No Hi(%)
1 Malvern 9.46%
2 Westmin Branson 10.42%
3 Steeles Amoreaux 12.08%
4 Lawrence Height 13.37%
5 Dorset Parks 14.39%
6 Flemingdon Victorias 14.52%
7 Kingston Galloways 16.71%
8 Crescent Town 17.55%
9 Eglinton Kennedy 19.17%
10 Weston Mt Denis 22.00%
11 Jamestown 22.53%
12 Scarborough Village 23.07%
13 Jane Finch 23.82%
Priority Neighbourhoods No Hi(%)
1 Lawrence Height 8.25%
2 Weston Mt Denis 8.48%
3 Flemingdon Victorias 10.49%
4 Eglinton Kennedy 10.59%
5 Malvern 12.16%
6 Jane Finch 13.17%
7 Steeles Amoreaux 13.75%
8 Crescent Town 13.98%
9 Scarborough Village 15.85%
10 Dorset Parks 16.27%
11 Kingston Galloways 16.82%
12 Jamestown 18.18%
13 Westmin Branson 19.84%
1996 2001 2006

Results: The Percent of Visible Minority in the Population
The Percent of Visible Minority in the Popuation (15-19)
40.0%
45.0%
50.0%
55.0%
60.0%
65.0%
70.0%
75.0%
80.0%
1996 2001 2006
PNs
City
Others
The Percent of Visible Minority in the Population (20-24)
30.0%
35.0%
40.0%
45.0%
50.0%
55.0%
60.0%
65.0%
70.0%
75.0%
1996 2001 2006
PNs
City
Others
The Percent of Visible Minority in the Population (25-29)
30.0%
35.0%
40.0%
45.0%
50.0%
55.0%
60.0%
65.0%
70.0%
75.0%
1996 2001 2006
PNs
City
Others
Visible Minority (15-19): Gap in 1996: 17.4% Gap in 2006: 23.8% Visible Minority (20-24): Gap in 1996: 17.0% Gap in 2006: 21.7% Visible Minority (25-29): Gap in 1996: 22.1% Gap in 2006: 26.1%

Jane-Finch’s Position (15-19)
Priority Neighbourhoods VisMin(%)
1 Malvern 73.90%
2 Crescent Town 72.66%
3 Flemingdon Victorias 70.18%
4 Steeles Amoreaux 67.97%
5 Jamestown 67.29%
6 Jane Finch 64.04%
7 Scarborough Village 63.32%
8 Dorset Parks 58.49%
9 Eglinton Kennedy 50.84%
10 Weston Mt Denis 47.81%
11 Lawrence Height 44.39%
12 Kingston Galloways 43.17%
13 Westmin Branson 30.03%
Priority Neighbourhoods VisMin(%)
1 Jamestown 82.04%
2 Malvern 81.47%
3 Steeles Amoreaux 79.33%
4 Jane Finch 75.15%
5 Flemingdon Victorias 74.91%
6 Eglinton Kennedy 69.79%
7 Scarborough Village 67.60%
8 Dorset Parks 64.80%
9 Kingston Galloways 61.54%
10 Crescent Town 56.22%
11 Weston Mt Denis 55.01%
12 Lawrence Height 40.57%
13 Westmin Branson 22.22%
Priority Neighbourhoods VisMin(%)
1 Jamestown 90.25%
2 Malvern 87.54%
3 Steeles Amoreaux 86.35%
4 Jane Finch 81.74%
5 Dorset Parks 81.65%
6 Flemingdon Victorias 79.06%
7 Eglinton Kennedy 75.87%
8 Kingston Galloways 69.54%
9 Scarborough Village 69.27%
10 Crescent Town 60.48%
11 Weston Mt Denis 55.18%
12 Lawrence Height 48.06%
13 Westmin Branson 36.22%
1996 2001 2006

Jane-Finch’s Position (20-24)
Priority Neighbourhoods VisMin(%)
1 Malvern 69.72%
2 Jamestown 66.77%
3 Steeles Amoreaux 64.61%
4 Crescent Town 61.14%
5 Flemingdon Victorias 60.72%
6 Jane Finch 56.71%
7 Dorset Parks 54.68%
8 Scarborough Village 53.12%
9 Kingston Galloways 52.34%
10 Eglinton Kennedy 45.24%
11 Weston Mt Denis 44.90%
12 Lawrence Height 33.68%
13 Westmin Branson 28.92%
Priority Neighbourhoods VisMin(%)
1 Malvern 72.86%
2 Flemingdon Victorias 67.16%
3 Steeles Amoreaux 66.99%
4 Scarborough Village 66.23%
5 Jamestown 66.22%
6 Jane Finch 59.98%
7 Dorset Parks 58.89%
8 Eglinton Kennedy 57.93%
9 Kingston Galloways 57.03%
10 Weston Mt Denis 49.76%
11 Crescent Town 47.41%
12 Lawrence Height 35.31%
13 Westmin Branson 24.92%
Priority Neighbourhoods VisMin(%)
1 Jamestown 87.22%
2 Malvern 87.21%
3 Steeles Amoreaux 83.59%
4 Dorset Parks 78.04%
5 Jane Finch 77.70%
6 Flemingdon Victorias 73.88%
7 Kingston Galloways 70.41%
8 Eglinton Kennedy 70.00%
9 Scarborough Village 67.27%
10 Crescent Town 60.50%
11 Weston Mt Denis 52.90%
12 Lawrence Height 45.33%
13 Westmin Branson 35.34%
1996 2001 2006

Jane-Finch’s Position (25-29)
Priority Neighbourhoods VisMin(%)
1 Malvern 75.60%
2 Steeles Amoreaux 69.54%
3 Jamestown 67.88%
4 Flemingdon Victorias 58.63%
5 Jane Finch 58.45%
6 Scarborough Village 57.31%
7 Crescent Town 57.20%
8 Dorset Parks 56.31%
9 Eglinton Kennedy 52.17%
10 Kingston Galloways 51.16%
11 Weston Mt Denis 44.92%
12 Lawrence Height 37.71%
13 Westmin Branson 31.31%
Priority Neighbourhoods VisMin(%)
1 Malvern 83.23%
2 Jamestown 78.40%
3 Steeles Amoreaux 73.11%
4 Scarborough Village 68.18%
5 Jane Finch 66.10%
6 Dorset Parks 65.65%
7 Flemingdon Victorias 65.18%
8 Crescent Town 61.14%
9 Eglinton Kennedy 59.90%
10 Kingston Galloways 58.77%
11 Weston Mt Denis 49.74%
12 Lawrence Height 35.75%
13 Westmin Branson 27.97%
Priority Neighbourhoods VisMin(%)
1 Jamestown 89.19%
2 Malvern 87.05%
3 Steeles Amoreaux 81.92%
4 Dorset Parks 76.39%
5 Jane Finch 74.26%
6 Scarborough Village 72.11%
7 Crescent Town 70.85%
8 Flemingdon Victorias 67.42%
9 Eglinton Kennedy 66.06%
10 Kingston Galloways 65.97%
11 Weston Mt Denis 58.56%
12 Lawrence Height 41.34%
13 Westmin Branson 39.35%
1996 2001 2006

Results: Average Income Average Income (15-19)
40004200440046004800500052005400560058006000
1996 2001 2006
PNs
City
Others
Average Income (20-24)
8000
9000
10000
11000
12000
13000
14000
15000
1996 2001 2006
PNs
City
Others
Average Income
15000
17000
19000
21000
23000
25000
27000
29000
31000
1996 2001 2006
PNs
City
Others
Average Income (15-19): Gap in 1996: 321 Gap in 2006: 595 Average Income (20-24): Gap in 1996: 818 Gap in 2006: 1888 Average Income (25-29): Gap in 1996: 3396 Gap in 2006: 6577

Results: Unemployment Rate
Unemployment Rate (15-19)
10.0%12.0%14.0%16.0%18.0%20.0%22.0%24.0%26.0%28.0%30.0%
1996 2001 2006
PNs
City
Others
Unemployment Rate (20-24)
10.0%
12.0%
14.0%
16.0%
18.0%
20.0%
22.0%
1996 2001 2006
PNs
City
Others
Unemployment Rate (25-29)
6.0%
7.0%
8.0%
9.0%
10.0%
11.0%
12.0%
13.0%
14.0%
15.0%
1996 2001 2006
PNs
City
Others
Unemployment rate (15-19): Gap in 1996: 7.2% Gap in 2006: 3.3% Unemployment rate (20-24): Gap in 1996: 2.7% Gap in 2006: 0.3% Unemployment rate (25-29): Gap in 1996: 4.0% Gap in 2006: 2.6%
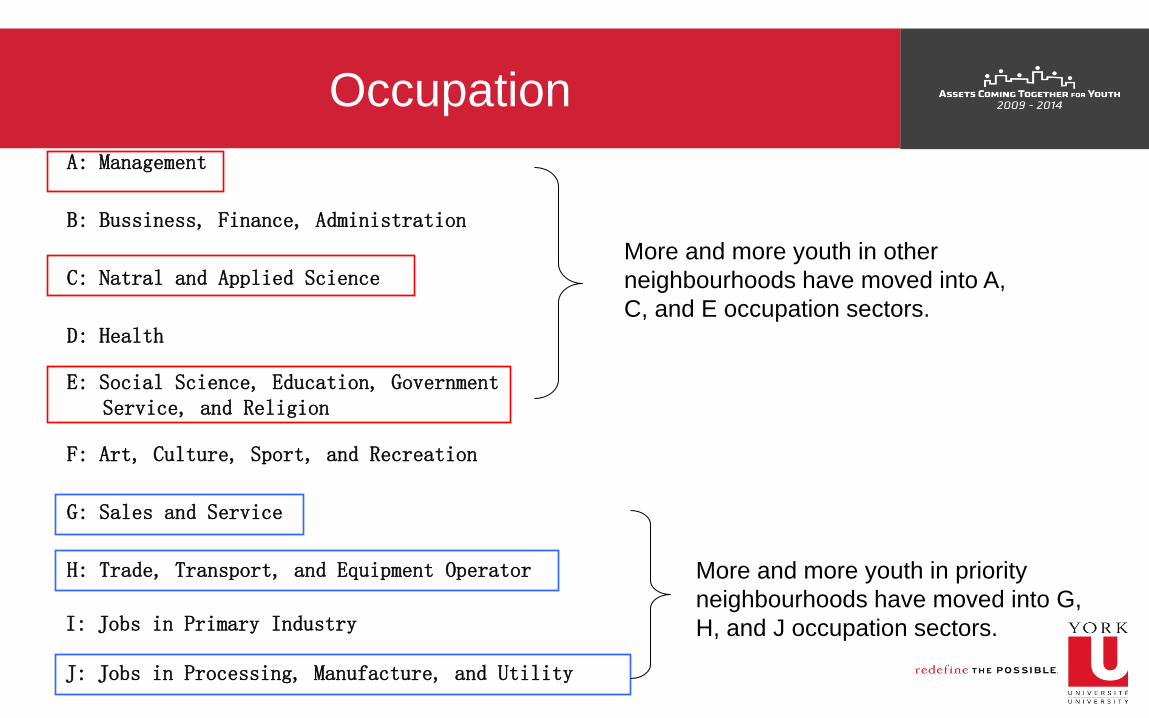
Occupation A: Management
B: Bussiness, Finance, Administration
C: Natral and Applied Science
D: Health
E: Social Science, Education, Government Service, and Religion
F: Art, Culture, Sport, and Recreation
G: Sales and Service
H: Trade, Transport, and Equipment Operator
I: Jobs in Primary Industry
J: Jobs in Processing, Manufacture, and Utility
More and more youth in priority neighbourhoods have moved into G, H, and J occupation sectors.
More and more youth in other neighbourhoods have moved into A, C, and E occupation sectors.

Summary of indings
• The education related socioeconomic outcomes of youth are significantly lower within 13 priority neigbhourhoods.
• The socioeconomic outcomes are improving in the 13 priority neigbhourhoods and other neigbhourhoods during 1996 and 2006 but to a different extent
• Except for youth unemployment rate, the gap between other socio-economic variables got wider between the 13 priority neighbourhoods and other neigbhourhoods in the last 10 years. – The education related socioeconomic outcomes of youth in Jane-
Finch have improved but are still below the average for priority neighbourhoods.
Implication of Findings
• Youth income is significantly associated with – Youth education level – Youth ethnic and immigrant background
• Youth income has no significant relationship with – Youth unemployment rate
• School-based work experience programs are necessary in order to help develop longer-term career directions and increase youth employability. – These programs should operate in full awareness of the reality
and life of youth and their communities.

Context from Qualitative Findings: Education and Networks Matter….
• Youth that have left high school felt that education matters: Top on the list of what youth consider an avenue to success was education. – Youth described the multi-dimensional importance of education
that goes beyond the economic benefits. – Majority of youth cited education as necessary for success
• Most youth discussed the importance of networks, volunteering, and relationship building to obtain a job. – Creating networks are important for residents within the Jane and
Finch community as a way to overcome the stigma attached to the community placed on them by outsiders.

QUESTIONS?