Trends in Disasters - Humane Society · PDF fileTrends in Disasters ... 5 Earthquake 2...
14
4/3/11 1 Caribbean Animal Welfare Conference San Juan Puerto Rico 4 April 2011 Iceland Volcano, April 2010 Trends in Disasters International Fund for Animal Welfare Emergency Relief Manager – Disasters Dick Green, Ed.D. “Dramatic Increase in Disasters” • Population growth • Urbanization • Environmental fragility • Move toward coastal areas • Global climate change 10 Tropical storms 5 Earthquake 2 Landslides 2 Tsunami 4 Volcanoes 8 Floods 6 Fires Zun Dao, 2008
Transcript of Trends in Disasters - Humane Society · PDF fileTrends in Disasters ... 5 Earthquake 2...
4/3/11
1
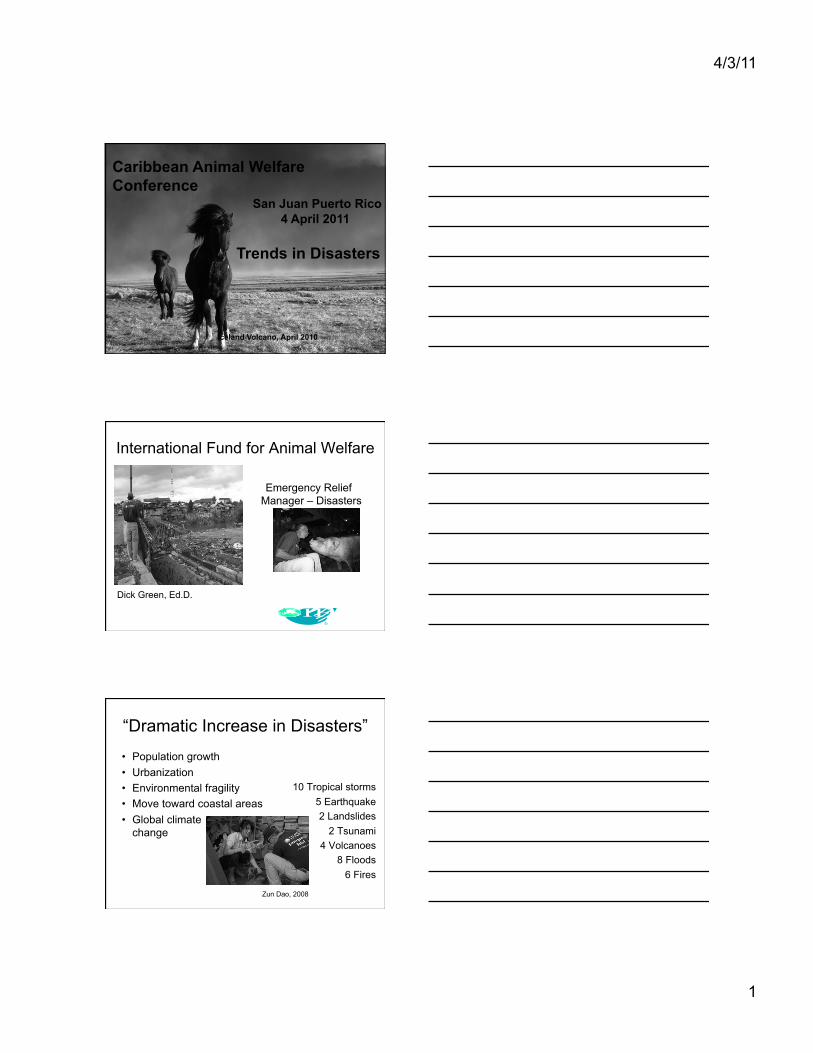
Caribbean Animal Welfare Conference
San Juan Puerto Rico 4 April 2011
Iceland Volcano, April 2010
Trends in Disasters
International Fund for Animal Welfare
Emergency Relief Manager – Disasters
Dick Green, Ed.D.
“Dramatic Increase in Disasters”
• Population growth • Urbanization • Environmental fragility • Move toward coastal areas • Global climate
change
10 Tropical storms 5 Earthquake 2 Landslides
2 Tsunami 4 Volcanoes
8 Floods 6 Fires
Zun Dao, 2008

4/3/11
2
Number of people affected by disasters quadrupled from 1975–84 to 1996–2005
Top Ten Countries Since 2000
1. China 6.46% 2. USA 5.55% 3. India 4.19% 4. Indonesia 3.31% 5. Philippines 2.33% 6. Russia 2.30% 7. Afghanistan 2.11% 8. Bangladesh 1.98% 9. Viet Nam 1.83% 10. Pakistan, Australia, 1.58%
Zaire
¼ of all disasters
• .

4/3/11
3
1976 - China earthquake
1983 - Africa Drought
1991 - Bangladesh cyclone
1981 - Mozambique drought
2005 - Pakistan earthquake
2004 – Asia tsunami
2008 – China/ Myanmar
2010 Haiti
Number of People Killed by Natural Disasters: 1975-2010
Num
ber o
f peo
ple
repo
rted
kille
d
Num
ber o
f peo
ple
repo
rted
affe
cted
Natural disaster summary 1975 - 2008
Most Prevalent Types of Disasters Since 2000
1. Floods 37.30% 2. Windstorms 22.09% 3. Epidemic 14.56% 4. Earthquake 6.55% 5. Extreme Temperatures 4.95% 6. Drought 4.47% 7. Slides 4.32% 8. Wildfires 3.40% 9. Volcano 1.32% 10. Wave/surge 0.54%
Nearly 60%
4/3/11
4
Wind Storms
Floods
Windstorms
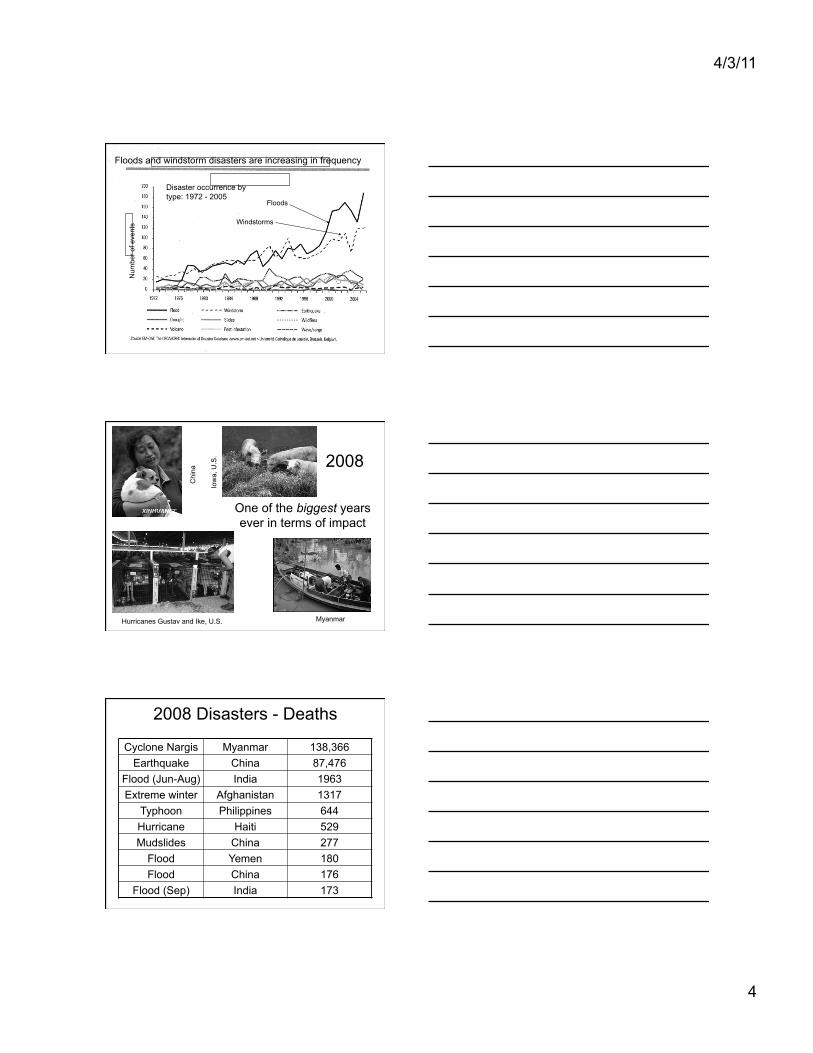
Floods and windstorm disasters are increasing in frequency
Disaster occurrence by type: 1972 - 2005
Num
ber o
f eve
nts
2008
One of the biggest years ever in terms of impact
Chi
na
Iow
a, U
.S.
Myanmar Hurricanes Gustav and Ike, U.S.
2008 Disasters - Deaths
Cyclone Nargis Myanmar 138,366 Earthquake China 87,476
Flood (Jun-Aug) India 1963 Extreme winter Afghanistan 1317
Typhoon Philippines 644 Hurricane Haiti 529 Mudslides China 277
Flood Yemen 180 Flood China 176
Flood (Sep) India 173

4/3/11
5
2008 Economic Impact Billions USD
1. China Earthquake 85 2. Hurricane Ike – US 30 3. China extreme winter 21 4. Midwest floods – US 10 5. Gustav – US 7 6. Nargis – Myanmar 4 7. Gustav – Cuba 3 8. Wildfires – US 2 9. China flood 2 10. Tornadoes – US 2
China 65% U.S. 31%
2009 • Relatively good year for
developing countries • 860 disasters, 110 more than
2008 (15%) – 4th highest in the last 30 years
• 92% weather-related – 82% in 2008
• 42% storms, 38% were floods • Economic losses totaled ~
$50B lowest since 2001 – “…losses due to severe weather
in areas with a high prevalence of insurance.”
29% North America
34% Asia
111 countries with Declared Natural Disasters (2009)
18 countries accounted for: – 79.0% deaths – 95.1% victims – 86.7% economic
damages

4/3/11
6
2010: The Year of the Volcano (and earthquake and hurricane and…)
RSPCA – April 2010
More volcanoes, earthquakes and tsunamis?
2010
Deadliest year in last two decades – 373 natural disasters killed over 296,800
people, affecting nearly 208 million others and costing nearly US$110 billion1 • 12 January earthquake in Haiti, 222,500 people • Russian heat wave - 56,000 people
1 Centre for Research on the Epidemiology of Disasters (CRED).
4/3/11
7
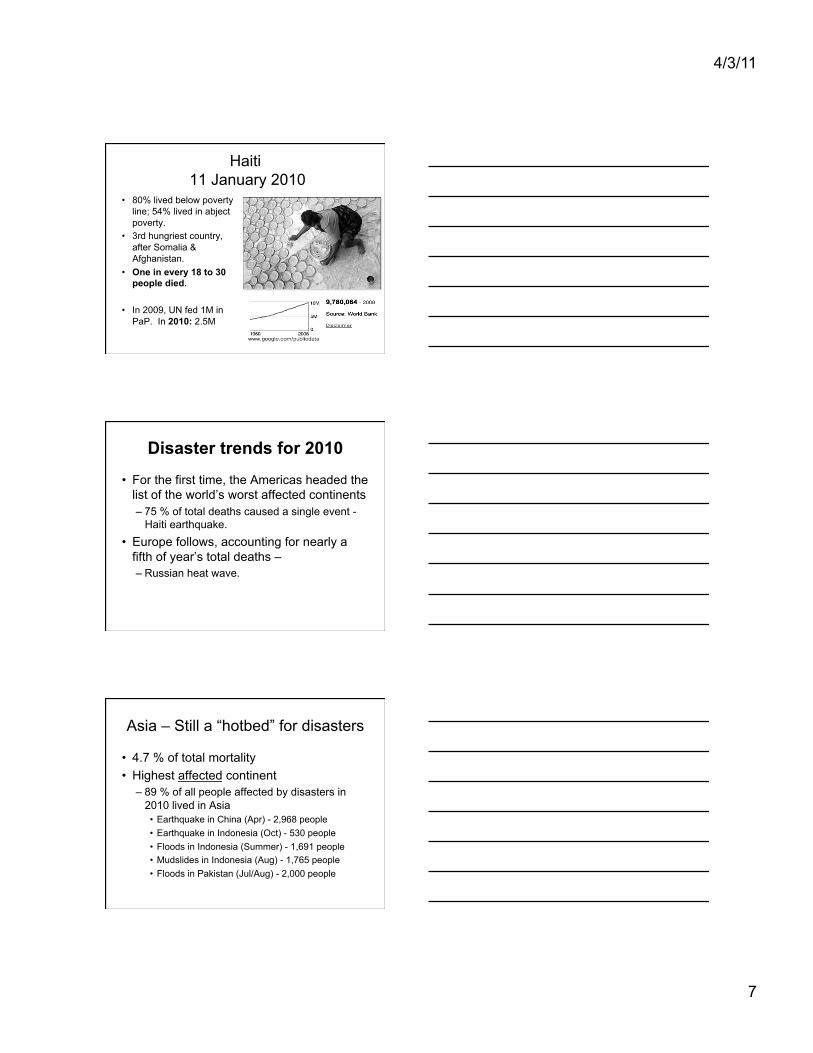
Haiti 11 January 2010
• 80% lived below poverty line; 54% lived in abject poverty.
• 3rd hungriest country, after Somalia & Afghanistan.
• One in every 18 to 30 people died.
• In 2009, UN fed 1M in PaP. In 2010: 2.5M
Disaster trends for 2010
• For the first time, the Americas headed the list of the world’s worst affected continents – 75 % of total deaths caused a single event -
Haiti earthquake. • Europe follows, accounting for nearly a
fifth of year’s total deaths – – Russian heat wave.
Asia – Still a “hotbed” for disasters
• 4.7 % of total mortality • Highest affected continent
– 89 % of all people affected by disasters in 2010 lived in Asia • Earthquake in China (Apr) - 2,968 people • Earthquake in Indonesia (Oct) - 530 people • Floods in Indonesia (Summer) - 1,691 people • Mudslides in Indonesia (Aug) - 1,765 people • Floods in Pakistan (Jul/Aug) - 2,000 people

4/3/11
8
2011: Look out!
• Brazil Floods • North American blizzard • Christchurch earthquake • Australia
– Queensland floods – Cyclone Yasi
• Middle East • Japan earthquake and tsunami
2011 Hurricane Season
• We foresee an above-average Atlantic basin tropical cyclone season in 2011 and anticipate an above-average probability of U.S. and Caribbean major hurricane landfall.

4/3/11
9
PROBABILITIES FOR AT LEAST 1 CAT 3-5 HURRICANE MAKING LANDFALL ON:
• Entire U.S. coastline - 73% (average for last century is 52%)
• U.S. East Coast Including Peninsula Florida - 49% (average for last century is 31%)
• Gulf Coast from the Florida Panhandle westward to Brownsville - 48% (average for last century is 30%)
• TRACKING INTO THE CARIBBEAN - 62% (average for last century is 42%)
Japan Earthquake/Tsunami 11 Mar 2011

4/3/11
10
4/3/11
11
Anomaly or Trend? • “These figures are bad, but could be seen as benign in
years to come.”
– Unless we act now, we will see more and more disasters due to unplanned urbanization and environmental degradation.
– Weather-related disasters are sure to rise in the future, due to factors that include climate change. 2
– Moderate to strong La Niña conditions well-established in the equatorial Pacific Ocean - likely to continue at least until the first quarter of 20113
2 M. Wahlström, Rep of UN Secretary General for Disaster Risk Reduction 3 World Meteorological Organization
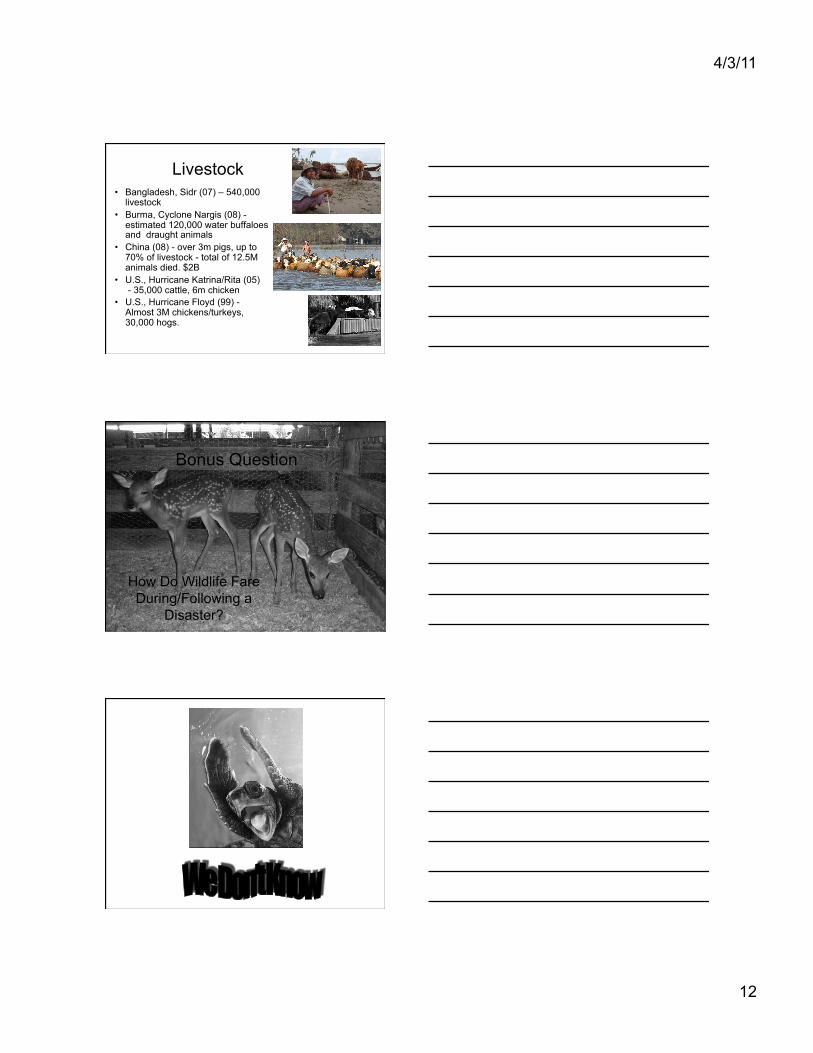
Good People Data
• What do we know about impact of disasters on animals?
Texas, 2006
4/3/11
12
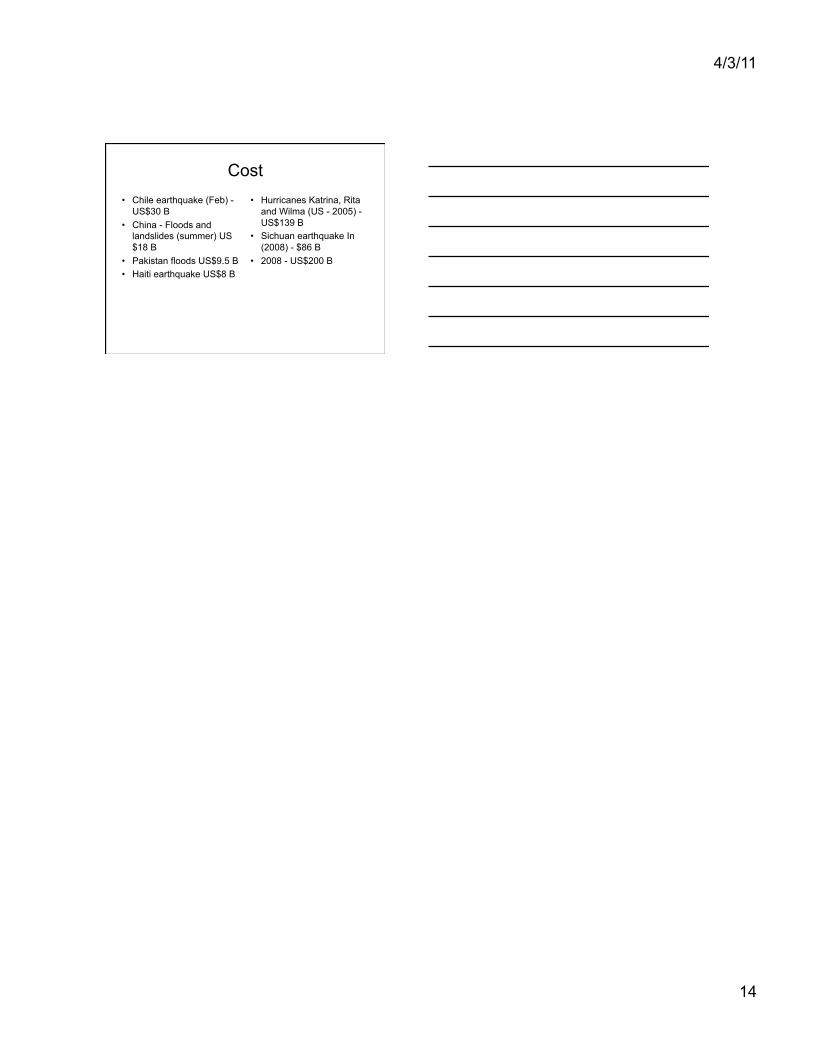
Livestock • Bangladesh, Sidr (07) – 540,000
livestock • Burma, Cyclone Nargis (08) -
estimated 120,000 water buffaloes and draught animals
• China (08) - over 3m pigs, up to 70% of livestock - total of 12.5M animals died. $2B
• U.S., Hurricane Katrina/Rita (05) - 35,000 cattle, 6m chicken
• U.S., Hurricane Floyd (99) - Almost 3M chickens/turkeys, 30,000 hogs.
Bonus Question
How Do Wildlife Fare During/Following a
Disaster?

4/3/11
13
Wildlife • Census Data is unreliable in many areas • Carcass counting/identification is difficult
Earthquakes Volcanoes Windstorms Drought Floods Fires
Australia fires, 2008
What We Do Know • There are “hot spots” in the world • Disasters are occurring more frequently and with
greater impact • Floods, windstorms, and likely fires are occurring
even more frequently than other types • Disaster preparedness and risk reduction is a
much better investment than response • Collaborative/Coalition approach to disaster
response is much more effective in terms of resource management and animals “saved”
Thank You!
4/3/11
14
Cost • Chile earthquake (Feb) -
US$30 B • China - Floods and
landslides (summer) US$18 B
• Pakistan floods US$9.5 B • Haiti earthquake US$8 B
• Hurricanes Katrina, Rita and Wilma (US - 2005) -US$139 B
• Sichuan earthquake In (2008) - $86 B
• 2008 - US$200 B


![Cyclone Sidr Response Program Completion Report (November ... · Cyclone Sidr Response Program Completion Report (November 2007 to May 2010 ... [16 August 2010, Dhaka, Bangladesh]](https://static.fdocuments.in/doc/165x107/5ea5356967248655ff5bd938/cyclone-sidr-response-program-completion-report-november-cyclone-sidr-response.jpg)