Trends in Common Raven Populations in the Mojave and ... of Subregion—To test if subregions...
36
Trends in Common Raven Populations in the Mojave and Sonoran Deserts: 1968-2004 By William I. Boarman Conservation Science Research & Consulting 2522 Ledgeview Place Spring Valley, CA 91977 [email protected] and William B. Kristan, III Department of Biological Sciences California State University, San Marcos San Marcos, CA [email protected] Draft Report to U.S. Fish and Wildlife Service Ventura, CA 93003 Contract No: 814405M055 June 12, 2006
Transcript of Trends in Common Raven Populations in the Mojave and ... of Subregion—To test if subregions...

Trends in Common Raven Populations in the
Mojave and Sonoran Deserts:
1968-2004
By
William I. Boarman
Conservation Science Research & Consulting
2522 Ledgeview Place
Spring Valley, CA 91977
and
William B. Kristan, III
Department of Biological Sciences
California State University, San Marcos
San Marcos, CA
Draft Report to
U.S. Fish and Wildlife Service
Ventura, CA 93003
Contract No: 814405M055
June 12, 2006

Raven Trends CSRC 2
2
Executive Summary.—Predation by common ravens (Corvus corax) on juvenile desert
tortoises (Gopherus agassizii), a threatened species in the deserts of the southwest United
States, is one factor preventing the recovery of tortoise populations. The U.S. Fish and
Wildlife Service (USFWS) and other agencies are embarking on efforts to reduce the
effects of ravens on tortoise populations. To better understand raven population
dynamics and the current level of threat ravens pose to tortoise populations, it is
important characterize recent population trends in raven populations within tortoise
range. Since 1968, the Breeding Bird Survey, managed by the USFWS and U.S.
Geological Survey (USGS), have been collecting data on bird abundance throughout the
United States, including in the deserts of the southwest. We performed an extensive
analysis of those data to determine identify spatial and temporal variation in raven
populations in the Mojave and Sonoran Deserts. We divided the deserts into four
subregios: West Mojave, East Mojave, Colorado, and Sonoran Deserts and evaluated for
trends among and within the subregions as well as evaluating more small -scale variation
within subregions.
Subregions varied in raven abundance, dispersion, and population growth rates. Ravens
were in the greatest abundance in the West Mojave Desert and were most widely
dispersed throughout the area. The Sonoran and Colorado Deserts had the lowest
numbers and the birds were more narrowly distributed. East Mojave raven numbers and
distribution were intermediate but still relatively low. The West Mojave raven
population has been increasing, perhaps at rates as high as 6% per year (795% over 37
years). The growth rate of the Sonoran Desert raven population is probably higher
(1377%), but their overall abundance is much lower and they are not spreading nearly as
much into the desert. Even within subregions, there is considerable variation. All of
these differences likely reflect spatial variation in anthropogenic resources, to which
ravens are tightly linked, and recent historical differences in colonization and distribution
of ravens. Inconsistencies in coverage of BBS methods, particularly year-to-year
coverage of routes, and high annual variation in raven abundance and number of stops
with ravens make it difficult to track raven trends below the regional level using BBS
data. These results suggest that management priorities could vary among subregions.
The high numbers coupled with high dispersion of ravens in the West Mojave supports
aggressive management at the local and regional scales. Whereas, areas with lower
levels of dispersion (e.g., Sonoran and East Mojave Deserts) could probably benefit most
by local-level management targeted at birds known to be preying on tortoises or areas
where such predation might be particularly critical to tortoise recovery, and reducing
raven use of specific human development sites. We recommend that long-term
monitoring of raven populations associated with raven management programs not rely
solely on BBS data. Rather, a combination of more frequent targeted surveys, nest use
surveys, and indices of predation pressure would yield more reliable and useful results.
Research comparing raven population dynamics in different subregions of the desert
could yield important insights into how human activities facilitate the spread and growth
of raven populations.

Raven Trends CSRC 3
3
INTRODUCTION
The management of native predator species is fast becoming a more common tool
for aiding the recovery of threatened and endangered animal populations. Subsidized
predator populations, those that subsist and sometimes increase due to resource subsidies
provided by humans (Soule et al. 1988), are an especially common cause for such
actions. Resource managers need to know recent trends in subsidized predator
population levels to determine the level of threat posed by the population, to identify
appropriate management actions, and to monitor for the effects of predator management.
In the western United States, common ravens (Corvus corax) are one such
subsidized predator that subsists on human effluence while also preying on threatened
desert tortoises (Gopherus agassizii; Boarman 2003). In the Mojave Desert, they feed on
refuse, drink irrigation water, nest on power towers, and roost in shade structures. Their
use of human resource subsidies increases fledgling success and juvenile survivorship
(Kristan et al. 2003, Webb et al. 2004). Hyperpredation and spillover predation are two
processes by which predator populations, sustained by abundant food, prey on rare
species. The elevated predator numbers, facilitated by human-provided subsidies, place
increased predation pressure on desert tortoise populations near and away from human
habitations (Kristan and Boarman 2003).
Raven population reduction is now the focus of management efforts to reduce
their effects on desert tortoises and other threatened and endangered prey populations
(Boarman 2003, U.S. Fish and Wildlife Service [USFWS] in prep.). Current efforts in
California are focused on reducing the availability of human subsidized resources to help
reduce the number of ravens that survive each year, thereby lowering the number of
ravens that may prey on desert tortoises. These actions are predicated on the notion that
raven population increases in recent years (Boarman and Berry 1995, Boarman 2003)
have led to increased predation pressure on desert tortoises. A portion of the proposed
management efforts includes the lethal removal of birds known to prey on tortoises. The
USFWS requires that lethal removals not threaten the persistence of raven populations.
Regional raven populations have not been evaluated since 1995. At that time
Boarman and Berry (1995) demonstrated that raven abundance increased in the Mojave
and Colorado Deserts by over 1000% between 1968 and 1992. We report herein on an
updated analysis of Breeding Bird Survey (BBS) data to provide the information
necessary to complete plans and monitor the effectiveness of a proposed management
program to reduce raven predation on desert tortoises in the Mojav e and Colorado deserts
of California. We report on a new and more in-depth analysis of 37 years of BBS data
(1968-2004). We investigated how average raven numbers, distribution (measured by
number of stops on which ravens were found), and annual trends in those numbers
differed by subregions of the desert tortoise’s range, and whether trends within
subregions varied fundamentally at the local, route level.

Raven Trends CSRC 4
4
METHODS
The BBS, originally started by the USFWS but now managed by U.S. Geological
Survey, consists of approximately 2900 transects throughout the United States and
Canada (http://www.mbr-pwrc.usgs.gov/bbs/genintro.html). Surveyed once each spring
(if possible) by well qualified volunteers, each route follows a road 24.5 miles long.
Stops are made every 0.5 mile where three-minute point counts are taken of all bird
species seen or heard within 0.25 mile of the stop.
The BBS groups their routes into 99 physiographic strata, which represent a
combination of physiographic and vegetation characteristics of the area (Robbins et al.
1986). We used all routes for the Mojave and Sonoran Desert strata as identified by the
BBS (Fig. 1). We were interested in a finer-scale subregional grouping, specifically West
Mojave, East Mojave, Colorado, and Sonoran Deserts, but BBS did not make these
distinctions. We coded the data by subregion as follows. All Sonoran Desert routes were
coded as Colorado Desert if they were in California and Sonoran Desert if they were in
Arizona (Table 1, Fig. 1, Appendix A). In the Mojave Desert, we used a map of desert
tortoise recovery units to identify whether a route occurred in West or East Mojave
(Tracy et al. 2004). Because of the relatively small number of routes, we did not partition
East Mojave into smaller subunits (e.g., northeast Mojave, etc.).
Statistical Analyses.— For overall annual trends, we used two methods: the
route-regression models, developed by the BBS office (http://www.mbr-
pwrc.usgs.gov/bbs/trendin.html), and linear regression (which we will refer to as “linear
models” hereafter). Route regression is a method specifically developed for BBS data
analysis and is considered the technique most appropriate for the data. However, it is
generally applied to large regions and requires a greater number of routes than were
available for it to be applied rigorously to a sub-regional analysis. In contrast, linear
models (such as regression, ANOVA, and ANCOVA) are simpler, but do not explicitly
account for all of the complexities of BBS data, including the complication of spatial and
temporal autocorrelation. To determine the relative contributions of individual routes,
regions, and subregions to raven population patterns, we generated a series of ANOVA
and ANCOVA models using total number of ravens per route and total num ber of stops
with ravens per route as the dependent variables. Given that neither approach could be
applied without qualification to this data set, we employed both techniques, but consider
the results to be valuable primarily as a guide to additional, more intensive study.
For all linear models we set alpha at 0.05, but used extreme caution when
interpreting the results because of low homoscedasticity. Transformations did not
improve the situation, so we present here the results from non-transformed data to make
the interpretation more straightforward. We therefore refer to all results as trends, even
when the probability level was below alpha.
Effect of Subregion—To test if subregions differed in overall raven numbers
counted on surveys, we conducted one-way ANOVAs on the mean number of ravens
counted per route and the mean number of stops per route on which ravens were
Raven Trends CSRC 5
5
observed, with routes categorized by subregion (West Mojave, East Mojave, Sonoran,
and Colorado deserts).
We summarized the differences among subregions by classifying routes as having
either "high" or "low" numbers of ravens and numbers of stops with raven detections. As
a cutoff, we chose the number that most closely divided the routes into equal groups,
which for number of stops was � �� ��� ��� ���� �� �� ��� ��� � �� ��� ���������� ��
routes in each subregion that had a "high" number of stops with raven detections and total
ravens detected was then tabulated.
Effect of Year (Annual Population Trends).—We tested for region-wide
population trends using two methods. The route-regression models, developed by the
BBS office, were generated for various year spans beginning with 1968 (18, 12, 9, 7, 6, 5,
4, 3, and 2). The BBS office (http://www.mbr-pwrc.usgs.gov/bbs/trendin.html)
recommends a minimum of 14 data points (i.e., routes) to obtain a statistically significant
result. Unfortunately, this was rarely obtained for the Mojave and Sonoran desert strata
separately. Therefore, with one exception, we were forced to consider the results from
analyses consisting of a suboptimal sample size, so the results are tenuous. We also
conducted a linear regression to test for the effect of year on relative abundance
estimates.
Effect of Route.— Human-subsidized resources are thought to influence raven
population increases; human developments are patchily distributed throughout the desert
southwest. Ravens may also decrease locally if the availability of these subsidies
decreases due to land use changes. We expect that new populations of rave ns will be
established by spreading out from already established areas. Consequently, as ravens
expand through the desert, we expect that proximity to and distribution of human-
subsidized resources that benefit ravens will influence their abundances in a site-specific
way, and raven abundance among routes are expected to vary substantially within a
subregion. The relative strength of variation among subregions compared to among
routes within subregions, can shed light on whether raven population management can be
effective at the subregion level or it should only be implemented at the regional level. To
determine at what scale the greatest amount of variation occured, we considered routes
separately and nested routes within subregions in an ANOVA to measure the relative
variation in raven numbers among routes within subregions, and among subregions.
Combined Effects.—We tested whether considering each route individually
explained the data better than the one that treated routes within subregions collectively.
We also allowed the regression line for counts at each route over time to have a different
slope by allowing year and route to interact, but removed subregion from the model.
This model therefore allowed every route to have a different change over time, which
would be necessary if routes within subregions did not exhibit similar patterns of change.
Routes with fewer than 5 years of surveys were removed for this analysis to reduce the
chances of spurious results from small numbers of observations.
Models that allowed change in raven numbers to differ between subregions could
represent a case in which the same rate of change in raven numbers occurred among

Raven Trends CSRC 6
6
subregions but with different overall abundances (subregion and year without an
interaction), or a case in which different rates of change occurred for each subregion
(region, year, and the interaction between them). However, these models did not account
for the smaller-scaled, site-specific variability among routes. For example, if ravens have
been colonizing different areas over time, then the process of colonization and population
growth may have different starting dates for each route. Including route as a factor in the
model would represent this process by allowing a series of parallel lines (one for each
route) with different intercepts to be fit to the data. To test for this, we analyzed a model
that took route-level variation into account by including year, subregion, and route nested
within subregion.
Finally to better understand patterns within subregions, we split the data into
different subregions, and examined differences among routes under the assumption that
they all exhibited the same rates of change, but with different starting dates (that is, we
included year and route with no interaction). Although subsetting the data has the
disadvantage of reducing the sample size, the model structure is simplified, and easier to
interpret.
RESULTS
Effect of Subregion.—We conducted a one-way ANOVA of total ravens per
route by subregion (West Mojave, East Mojave, Sonoran Desert, Colorado Desert) (Table
2). Routes in the West Mojave on average had more than twice the number of ravens
than the next closest subregion (East Mojave), and nearly three times as many as Sonoran
Desert over the 37-year study period. Similarly, ravens were observed at twice as many
stops within routes in the West Mojave than the East Mojave, and nearly three times as
many stops in the West Mojave than in the Sonoran and Colorado Deserts.
When we classified routes as having either "high" or "low" numbers of ravens, or
numbers of stops with raven detections, a similar pattern emerged (Table 3). More routes
had high numbers of ravens in the West Mojave followed by the East Mojave, Sonoran,
and Colorado. Similarly, more stops on routes with ravens were found in the West
Mojave than East Mojave, fewer still in the Sonoran, with the lowest level of distribution
being in the Colorado Desert.
Effect of Year (Annual Population Trends).—The route-regression method
yielded few significant results (although the sample sizes were almost always too low; n
= 7-10). In the Mojave and Sonoran Deserts combined, there was a significant increase
in relative raven abundance of 1.9% per year (p = 0.0003, n = 56) over the 37-year
period, which is equivalent to a 21% increase over 10 years, and 100% increase over the
37 years. In the Mojave, there tended to be an increase of 14-42% per year in the late
1970s followed by a decrease of 13-18% per year somewhere between 1999 and 2004
(probably between 2001 and 2002), but the sample sizes were too low to yield any
certainty (n = 6-10), and the routes often varied from year to year. The routes containing
fewer ravens were generally recorded more in later years (Table 1, Appendix B, C).

Raven Trends CSRC 7
7
The linear regression method revealed a small, negative change in total ravens
over time (Table 4). The tiny R2 (<0.01) suggests that, although statistically significant,
the pattern is very slight. The number of stops with ravens did not significantly change
over time (F1, 480 = 0.63, p = 0.426).
Effect of Route.--Subregions had a much larger F-value than did routes within a
subregion, indicating that although there was significant variation in number of ravens
among routes within a subregion, large differences among subregions were also present
(Table 5a, Fig. 1). The West Mojave had a greater abundance of ravens overall, although
not all routes had large raven numbers (Appendix B). Similarly, the West Mojave has
more stops with ravens than the other subregions, even when variability among routes is
addressed (Table 5b, Fig. 2, Appendix C).
Combined Effects.— The model consisting of route, year, and their interaction
was significant for all three effects (Table 6). The site-specificity of changes in raven
abundance can be seen by the wide range in slopes among routes (Appendix B), from a 2
raven per year increase for Lenwood to a 0.74 raven per year decrease for Tecopa. The
total number of ravens increased significantly in the entire study area over time, by 0.4
ravens per year, which was an increase of approximately 4.3% per year, or 375% over 37
years (Table 7). When variability in the timing of increases is accounted for by including
route in the model (nested within subregion), the differential in predicted number of
ravens in the West Mojave becomes even greater than the East Mojave. A similar pattern
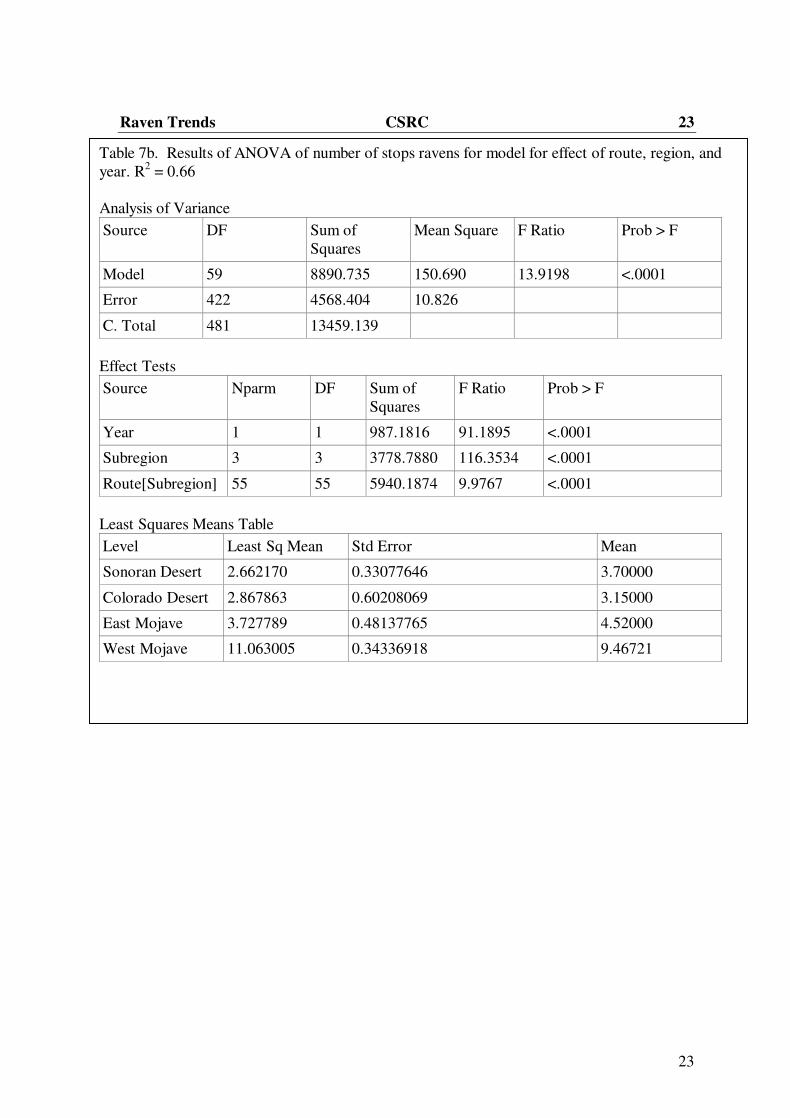
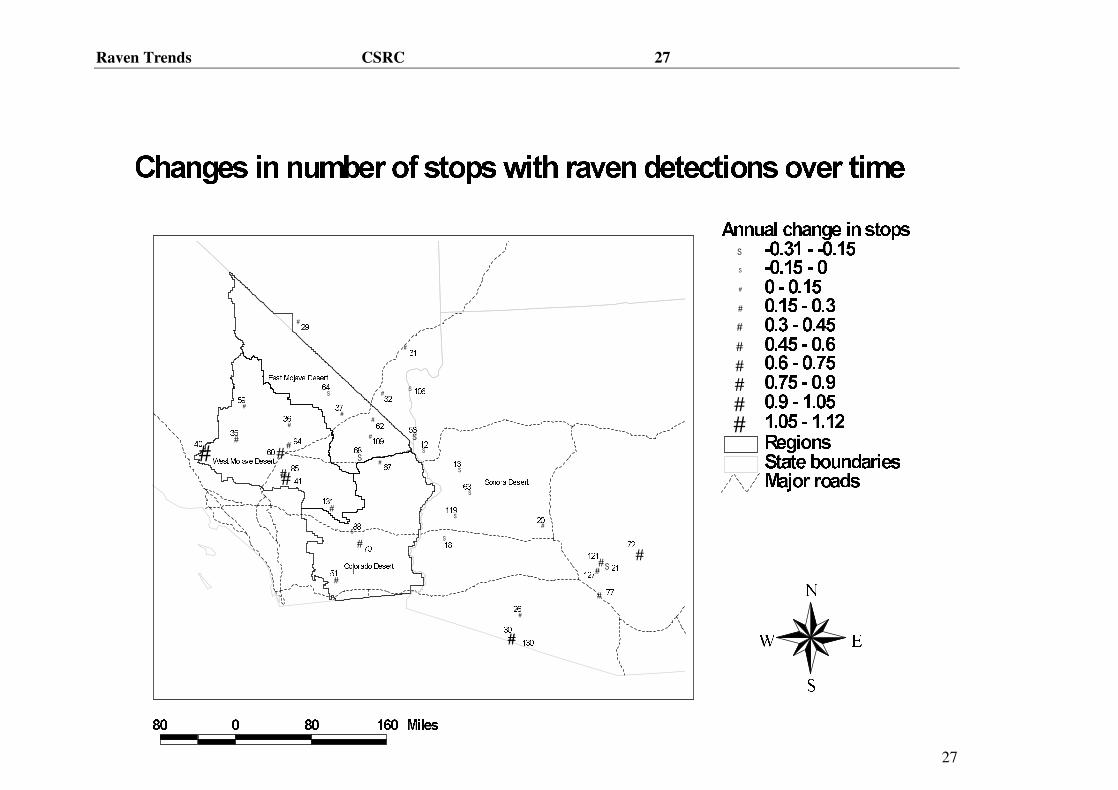
was seen in the number of stops with ravens. There was a significant increase in raven
numbers over time, at a rate of 0.2 more stops per year, or approximately 3.8% per year,
or 297% over 37 years. Although the model that allowed each route to have a different
slope had the greatest R2 (0.66, Table 6), the large R
2 of this model (0.55) was also high,
indicating that substantial similarities in patterns of increase among routes within
subregions. In a separate model, there was no significant change over time in total
number of ravens (effect test for year: t = 0.14, p = 0.88) or number of stops with ravens
(effect test for year: t = 1.91, p = 0.057) when only subregion is taken into account. None
of the interactions was significant.
When analyzing the effects of year and route within each subregion separately, all models
were significant (p< 0.05) with the exception of number of ravens in the Colorado Desert
(p > 0.10). West Mojave showed the most rapid absolute increases in ravens and number
of stops, the other subregions showed less increases in raven numbers (Table 8). The
West Mojave also showed a high increase in number of stops with ravens, which was
intermediate in the East Mojave and Colorado Deserts and negligible in the Sonoran
Deserts.
DISCUSSION
Differences in rates and timings of spread of ravens among subregions, and
among routes within subregions, can both help identify areas that have the greatest raven
populations, and can help identify potential natural limiting factors for raven population

Raven Trends CSRC 8
8
growth. Breeding bird survey data were used for this analysis simply because they are the
only data available that provide the needed information to address these questions.
However, caution must be used when interpreting the results of BBS data, as there are
many known sources of uncontrolled variation within the data set. For example, there is
high variation among years along each route, and considerable inconsistency among
years in which transects are surveyed. Also, observer bias is frequently a significant
factor, and most BBS analyses go to great lengths to control for observer bias. Not only
is there variation among individuals in their ability to see (or hear), identify, and count
species, but a marked year-to-year improvement in individuals’ abilities. As suggested to
us by Bruce Perterjohn (USGS BBS Office, pers. comm.), we believe this not an issue for
raven surveys because they are large, highly visible birds in the open desert environment,
and, being the only large black bird in the area, cannot be confused with any other
species.
BBS experts recommend that a minimum of 14 routes are necessary to yield valid
estimates of changes in bird population sizes, which, if followed, would limit use of BBS
data to regional analyses. Route regression approaches were designed specifically for use
with BBS data, and are able to account for many of the known sources of error provided
that sufficient data are available. Traditional linear models are simpler in structure, and
by omitting parameters that control for various sources of error in the BBS, they can be
applied to smaller data sets. When sample sizes permit their use, route regressions are
superior analytical methods for BBS data compared to traditional linear models. We had
the additional difficulty that the residuals from the regression analyses showed that we
violated the homogeneity of variance assumption, and transformations failed to fix the
problem. Although the BBS is the only data set currently available to address whether
the rates and timings of raven increases have differed among subregions, if we strictly
adhered to standard statistical criteria we would be unable to use these data. We present
the results of this analysis with the caveat that the patterns uncovered should be
considered to be suggestive but not confirmatory, as an encouragement to conducting
more reliable research to explain the subregional differences we detected. In other words,
these results should be viewed as hypotheses requiring further investigation before being
accepted as fact.
Subregional differences.—The total number and distribution of ravens varied by
subregion. Routes in the West Mojave had two to three times the number of ravens as the
other subregions. The West Mojave also had the greatest number of stops with ravens,
which shows that ravens are not only more abundant where they occur, but they are more
evenly distributed spatially within the West Mojave than in other subregions. Colorado
Desert sites had the fewest ravens and the fewest stops with ravens, suggesting that
comparisons between Colorado Desert and West Mojave Desert raven populations might
be fruitful for understanding potential limiting factors for rave n populations.
Change over time.—The change in raven populations over time depended
strongly on which analysis we used, because of the peculiarities of the data set.
According to the BBS’s route regression method, raven populations increased nearly 2%
per year in the Mojave and Sonoran Deserts combined over the 37-year study period. We
were unable to reduce this trend with statistical certainty to specific regions or time

Raven Trends CSRC 9
9
frames, but an interesting, non-significant trend emerged: there may have been a leveling
off of the increases in the last four years. Unfortunately, the sample sizes (n = 6-10)
were too low to yield any certainty. The changes may be caused by different routes
surveyed or inconsistencies among years in which routes were surveyed. By analyzing
data separately for each subregion, we found increases in raven abundance of 795%
(which is equivalent to a 6% annual increase) in the West Mojave, but very little in the
East Mojave Desert (Table 8).
One of the dominant patterns in the data is that timing of increases, and rates of
change once increases begin, are highly site-specific. Combined with this heterogeneity
among the routes and subregions, the uneven coverage of routes over time can lead to
some very misleading results. For example, the linear regression method revealed a
small, negative change in total ravens over time in the Mojave and Sonoran Deserts
combined over the entire 37-year period when differences among routes or subregions
were not accounted for (Table 4). The tiny R2 (<0.01) suggests that, although statistically
significant, the pattern is very slight, but even a slight decline would be a very surprising
result to desert biologists. However, the apparent decline was due to an increase in later
years of the study in relative number of routes surveyed in areas that had few ravens. For
example, in recent years routes have been added in the Sonoran Desert, where raven
abundance is lower (Tables 2 & 3), and routes have not been surveyed in the West
Mojave where abundance is higher (Table 1). Analysis by subregion helps to prevent this
change in coverage from producing a spurious regional decrease in raven numbers.
Spread of a population expanding its range into new locations or new habitats can
be thought of as a two-stage process, with first a colonization of a new area followed by
an increase in abundance. Expansions are contagious, in the sense that new populations
will generally be founded by immigrants from existing, nearby populations. We expect
under these circumstances for different subregions of the desert to have started this
process at different times, and to be in different degrees of completion. Even if the
subregions are equally good raven habitat, we may still find subregional differences due
to these differences in timing. For example, if the West Mojave has the greatest number
of ravens because it was colonized first, then the East Mojave may have fewer ravens
simply because it has more recently been colonized. Subregional differences would need
to be considered in this case to improve the estimate of rate of change, but would not
necessarily imply that subregions with more ravens are better raven habitat. If this were
the case, however, we would expect that rates of change among subregions would be the
same, or if differences did occur that subregions with more ravens would have lower
rates of change if they are reaching carrying capacity. In fact, we found the West Mojave
has both the greatest number of ravens and a rapid rate of change in raven numbers and
numbers of stops. The East Mojave is also increasing in numbers of stops, but not in
numbers of ravens. This may mean either that ravens are spreading through the East
Mojave Desert, but have not yet started to rapidly increase in population size, or that
ravens can disperse into the area but are not able to increase in abundance. The Colorado
Desert had the smallest sample sizes, and thus the relatively rapid increase in abundance
observed was not significant. The Sonoran Desert was increasing slowly both in numbers
of stops and rapidly in abundance of ravens. This heterogeneity among subregions in the
characteristics of their raven expansion suggest that the subregions differ in their

Raven Trends CSRC 10
10
suitability for ravens, and it may be fruitful to study raven population dyna mics among
subregions to improve our understanding of the reasons for these differences.
We were not able to use linear regression to formally test for a change in direction
or intensity of the trends at a particular point in time, in part, because we did not have
sufficient data for a purely exploratory analysis, and did not have an a-priori hypothesis
for when to look for a change in rate. However, the residual plots did not show evidence
of nonlinearities which would have led us to suspect that a straight line is a poor
representation of the data.
Small-scale, site specific variation.—There was a high level of variation among
routes both among and within subregions. The differences among routes were caused by
both differences in timing (revealed by the inclusion of “route” as a factor in our models)
and differences in rates of change (revealed by the “route x year” interactions). This is
not surprising, because the desert is not uniformly high-quality habitat for ravens, and
their populations tend to cluster around human developments and the resources they
receive from them. Routes that are near anthropogenic sources of food and water are
expected to experience rapid raven population growth, whereas more remote routes
should generally lack large numbers of ravens, even within the populous West Mojave
Subregional differences were still detectable, however, even when this site specificity
was accounted for.
Management Recommendations.— Although much of the variation in raven
numbers is site-specific, the subregional differences in raven population growth suggests
that management needs to focus at both the local and the regional level. Furthermore,
ravens are both more numerous and more widely dispersed in the West Mojave than in
other subregions, suggesting that anthropogenic resources are also more widely dispersed
there. Consequently, the West Mojave subregion may require a broader multi -scale
management effort than other subregions where more localized efforts may be sufficient
to control raven populations. We recommend that, particularly in the West Mojave
Desert, management focus both on localized measures such as targeted removal of known
offenders (birds known by evidence to prey on tortoises) and aggressive removal of even
relatively minor sources of human-subsidized food and water; and regional methods such
as reduction of garbage availability at landfills and perhaps broader removal of birds
(Boarman 2003). In the Colorado, Sonoran, and East Mojave Deserts, efforts should be
focused more at specific locations where predation is known or suspected of occurring or
affecting tortoise recovery. Regional-level management may be wise for all subregions,
but may not need to be as aggressive at this point in time for the Sonoran, Colorado, and
East Mojave subregions.
Monitoring and Research Recommendations.—We recommend that the BBS
surveys not be relied upon solely to determine the effectiveness of or need for raven
management in the Mojave and Sonoran Deserts. There is too much variation and too
little consistency in coverage of routes. Instead, the best approach would be a
multifaceted one with the following components, in roughly descending order of
importance:

Raven Trends CSRC 11
11
1. Subregional road surveys;
2. Point counts at selected human subsidized resource sites, randomly selected
non-resource sites, and other sites of specific interest to the raven management program;
3. Use of an index of change in predation pressure, such as styrotorts (Styrofoam
tortoises; Kristan and Boarman 2003) placed randomly throughout the areas of interest;
and
4. Surveys of raven nests and predation activity during the breeding season.
Before developing detailed designs of the surveys, a thorough analysis should be
conducted of existing data to determine the optimal timing, best metho ds, and minimum
adequate sample sizes to ensure a cost effective, scientifically credible program is
implemented. Some experimentation with styrotorts, or some other index of predation
pressure, is warranted to understand the limits of the method and to determine the
frequency and timing of deployment. Whereas it is essential to measure the effect of
raven management on tortoise populations, such monitoring is costly and difficult to
accomplish, due to the challenges of working with juvenile desert tortoises in the wild.
We believe this aim can be most practically attained by monitoring predation pressure
(Item 3, above) plus evaluating long-term results of line distance sampling being
conducted by the Desert Tortoise Recovery Office of the USFWS.
Differences among subregions in the characteristics of their raven population
expansions may be in part due to differences in suitability of the subregions for raven
habitation. Comparative studies of the population dynamics of ravens in subregions that
are experiencing the greatest and least increase in ravens could help focus management
actions on the areas that are most at risk of experiencing raven population increases in the
future.
Summary.—Common raven populations clearly have increased in the Mojave
and Sonoran Deserts over the past 37 years. Subregions vary in raven abundance,
dispersion, and population growth rates, with the West Mojave Desert having the most
ravens and experiencing the large increases. Even within subregions, there is
considerable variation. All of these differences likely reflect spatial variation in
anthropogenic resources and recent historical differences in colonization and distribution
of ravens. Inconsistencies in coverage of BBS methods, particularly year-to-year
coverage of routes, and high annual variation in raven abundance and number of stops
with ravens make it difficult to track raven trends below the regional level using BBS
data. We recommend that long-term monitoring of raven populations associated with
raven management programs not rely solely on BBS data. Rather, a combination of more
frequent targeted surveys, nest use surveys, and indices of predation pressure would yield
more reliable and useful results.

Raven Trends CSRC 12
12
LITERATURE CITED
Boarman, W. I. 2003. Managing a subsidized predator population: reducing common
raven predation on desert tortoises. Environmental Management. 32:205-217.
Boarman, W.I. and K.H. Berry. 1995. Common ravens in the southwestern U.S. Pp. 73-
75. in Our living resources: a report to the nation on the distribution, abundance,
and health of U.S. plants, animals, and ecosystems. National Biological Service,
Washington, DC.
Kristan, W. B, III, and W. I. Boarman.2003. Spatial distribution of risk of desert tortoise
(Gopherus agassizii) predation by common ravens (Corvus corax). Ecology
84:2432-2443.
Kristan, W. B, III, W. I. Boarman, and J. Crayon. 2004. Diet composition of common
ravens across the urban-wildland interface of the west Mojave desert. Wildlife
Society Bulletin 32:244-253.
Robbins, C. S., D. Bystrak, and P. H. Geissler. 1986. The breeding bird survey: its first
fifteen years, 1965-1979. U.S. Fish Wildl. Serv. Resour. Publ. 157. 196pp.
Soulé, M. E., D. T. Bolger, A. C. Alberts, J. Wright, M. Sorice, and S. Hill. 1988.
Reconstructed dynamics of rapid extinctions of chaparral-requiring birds in urban
habitat islands. Conservation Biology 2:75-92.
Tracy, C. R., R. Averill-Murray, W. I. Boarman, D. Delehanty, J. Heaton, E. McCoy, D.
Morafka, K. Nussear, B. Hagerty, and P. Medica. 2004. Desert Tortoise Recovery
Plan Assessment. 217 pp.
Webb, W. C., W. I. Boarman, and J. T. Rotenberry. 2004. Common raven juvenile
survivorship in a human augmented landscape. Condor 106:517-528.

Raven Trends CSRC 13
13
Table 1. Official BBS routes included in our analysis, the desert subregion we assigned to each (CD = Colorado Desert, SD =
Sonoran Desert, EM = East Mojave Desert, and WM = West Mojave Desert), and the total number of routes surveyed per year. Years
each route was surveyed are represented by an ‘X.’ Refer to Figures A and B for location of each route.
Year
Region Route
1
9
6
8
1
9
6
9
1
9
7
0
1
9
7
1
1
9
7
2
1
9
7
3
1
9
7
4
1
9
7
5
1
9
7
6
1
9
7
7
1
9
7
8
1
9
7
9
1
9
8
0
1
9
8
1
1
9
8
2
1
9
8
3
1
9
8
4
1
9
8
5
1
9
8
6
1
9
8
7
1
9
8
8
1
9
8
9
1
9
9
0
1
9
9
1
1
9
9
2
1
9
9
3
1
9
9
4
1
9
9
5
1
9
9
6
1
9
9
7
1
9
9
8
1
9
9
9
2
0
0
0
2
0
0
1
2
0
0
2
2
0
0
3
2
0
0
4
Total
years
CD ANZA BORREGO X X X X X X X X X X X 11
BLYTHE X X 2
CADIZ X X 2
COACHELLA CN X X X X X X X 7
COTTONWOOD X X X X X X X X X X X X X X X X 16
ESSEX X X X X X 5
FLYNN X X X X X X X 7
GLAMIS X X 2
HAVASU LAKE X X X 3
IMPERIAL DAM X 1
IRON MTNS X 1
PARKER DAM X X X 3
SD AJO X X X X X X X X X 9
ALAMO RES. X X X X X X X X X X 10
ARABY X X 2
BATES WELL X X 2
CABEZA PRIETA X X X X 4
CASA GRANDE X X X X X X X X X X X X X X X 15
CATUS FOREST X X X X X X X X X X 10
CIBOLA LAKE X X X 3
COOLIDGE X X X 3
CUTTER X X X X X X X X 8

Raven Trends CSRC 14
14
FLORENCE X X X X X X X X 8
GILA BEND X X X X 4
HOPE X X X X X X X X 8
LAGUNA X X X 3
LUKEVILLE X X X X X X 6
NEW RIVER X X X X X X X X X X X X X 13
ORGAN PIPE X X X X X 5
PALO VERDE X X X X 4
PISINIMO X X 2
QUARTZSITE X X X X X X X 7
RED ROCK X X X X X X X 7
RIVIERA X X X X X X X 7
WIKIEUPP X X X X X X X X X X 10
EM BEATTY X X X X X X X X X X X 11
CIMA X X X X X X X X X X X X X X X X X X X X X 21
IVANPAH X X X X X X X X X X X X 12
JEAN LAKE X X X X X X X X X X X X 12
NELSON X 1
OATMAN X X X X X X X X X X X 11
SQUAW PEAK X 1
TECOPA X X X X X X X X X X X X X X X X X X X 19
TRONA X X X 3
VAL OF FIRE X X X X X X X X X X X X X X 14
VALLEY WELLS X X X X X X 6
WALKER CAN X X X X X X X X X X X X X X X X X X X X X X X X X X X X X X 30
WILLOW BEACH X X X X X X X X 8
WLLWLBCH 2 X 1
WM BARSTOW X X X X X X X X X X X X X X X X X X X X X X X 23
CALIF CITY X X X X X X X 7
FT IRWIN X X X X X X 6
GOLDSTONE X X X X X X X X X X X X X X X 15

Raven Trends CSRC 15
15
INYOKERN X X X X X X X X X X X X X X X X 16
JOSHUA TREE X X X X X X X X X X X X X X X X X X X X 20
LENWOOD X X X X X X X X X X X X X 13
LUCERNE VAL X X X X X X X X X X X X X 13
WILLOW SPGS X X X X X X X X X 9
TOTAL 5 4 5 4 5 9 6 11 8 10 9 9 10 11 7 6 5 8 9 11 15 15 11 16 23 27 22 31 24 28 20 17 20 17 11 19 14 482

Raven Trends CSRC 16
16
Table 2. One-way ANOVA of total ravens by region (West Mojave, East Mojave, Sonorant Desert,
Colorado Desert).
a) Mean number of ravens per route (R2 = 0.16).
ANOVA
Source DF Sum of
Squares
Mean Square F Ratio Prob > F
region 3 12189.609 4063.20 29.9943 <.0001
Error 478 64752.615 135.47
C. Total 481 76942.224
Means for ANOVA
Level Number Mean Std Error Lower 95% Upper 95%
Sonoran
Desert
150 6.1600 0.9503 4.293 8.027
Colorado
Desert
60 5.2500 1.5026 2.298 8.202
East Mojave 150 7.3000 0.9503 5.433 9.167
West Mojave 122 17.9508 1.0537 15.880 20.021
b) Mean number of stops per route containing ravens (R2 = 0.21).
ANOVA
Source DF Sum of
Squares
Mean Square F Ratio Prob > F
region 3 2870.180 956.727 43.1879 <.0001
Error 478 10588.959 22.153
C. Total 481 13459.139
Means for ANOVA
Level Number Mean Std Error Lower 95% Upper 95%
Sonoran
Desert
150 3.70000 0.38430 2.9449 4.455
Colorado
Desert
60 3.15000 0.60763 1.9560 4.344
East Mojave 150 4.52000 0.38430 3.7649 5.275
West Mojave 122 9.46721 0.42612 8.6299 10.305

Raven Trends CSRC 17
17
Table 3. Differences among subregions when classified
as having either "high" or "low" numbers of ravens, or
numbers of stops with raven detections.
Proportion with high:
Region N Ravens Stops
Sonoran Desert 150 0.41 0.39
Colorado Desert 60 0.37 0.28
East Mojave 150 0.57 0.53
West Mojave 122 0.70 0.72

Raven Trends CSRC 18
18
Table 4. Regression analysis of total ravens per route by year in the Mojave and Sonoran Deserts
combined. Model R2 < 0.01.
ANOVA
Source DF Sum of
Squares
Mean Square F Ratio Prob > F
Model 1 622.773 622.773 3.9168 0.0484
Error 480 76319.451 158.999
C. Total 481 76942.224
Parameter Estimate
Term Estimate Std Error t Ratio Prob>|t|
Intercept 249.70549 121.43 2.06 0.0403
Year -0.120739 0.061007 -1.98 0.0484

Raven Trends CSRC 19
19
Table 5a. One-way ANOVA for total number of ravens with routes treated as main effects and
nested within regions to account for the variation among routes that was explained by
subregional differences in raven numbers. R2 = 0.50
Analysis of Variance
Source DF Sum of
Squares
Mean Square F Ratio Prob > F
Model 58 7903.553 136.268 10.3754 <.0001
Error 423 5555.586 13.134
C. Total 481 13459.139
Effect Tests
Source Nparm DF Sum of
Squares
F Ratio Prob > F
Subregion 3 3 2915.5588 73.9965 <.0001
Route[Subregion] 55 55 5033.3728 6.9680 <.0001
Least Squares Means Table
Level Least Sq Mean Std Error Mean
Sonoran Desert 3.366534 0.35516308 3.70000
Colorado Desert 2.535354 0.66205780 3.15000
East Mojave 4.019767 0.52914755 4.52000
West Mojave 10.044895 0.35951394 9.46721

Raven Trends CSRC 20
20
Table 5b. One-way ANOVA for total number stops per route with ravens with routes treated as main
effects and nested within regions to account for the variation among routes that was explained by
subregional differences in raven numbers. R2 = 0.59
Analysis of Variance
Source DF Sum of
Squares
Mean Square F Ratio Prob > F
Model 58 38407.879 662.205 7.2692 <.0001
Error 423 38534.345 91.098
C. Total 481 76942.224
Effect Tests
Source Nparm DF Sum of Squares F Ratio Prob > F
Subregion 3 3 12888.320 47.1593 <.0001
Route[Subregion] 55 55 26218.270 5.2328 <.0001
Least Squares Means Table
Level Least Sq Mean Std Error Mean
Sonoran Desert 5.602086 0.9353774 6.1600
Colorado Desert 4.064683 1.7436325 5.2500
East Mojave 6.250591 1.3935926 7.3000
West Mojave 19.539684 0.9468360 17.9508

Raven Trends CSRC 21
21
Table 6. ANOVA model for total number of ravens with year and route independent of region (R2
= 0.66).
Analysis of Variance
Source DF Sum of
Squares
Mean Square F Ratio Prob > F
Model 75 48792.232 650.563 9.0971 <.0001
Error 359 25673.179 71.513
C. Total 434 74465.411
Effect Tests
Source Nparm DF Sum of
Squares
F Ratio Prob > F
Route 37 37 30506.710 11.5294 <.0001
Year 1 1 1024.777 14.3299 0.0002
Route*Year 37 37 8660.484 3.2731 <.0001

Raven Trends CSRC 22
22
Table 7a. Results of ANOVA of total number of ravens for model for effect of route, region, and
year. R2 = 0.55
Analysis of Variance
Source DF Sum of
Squares
Mean Square F Ratio Prob > F
Model 59 42139.222 714.224 8.6602 <.0001
Error 422 34803.002 82.472
C. Total 481 76942.224
Effect Tests
Source Nparm DF Sum of
Squares
F Ratio Prob > F
Year 1 1 3731.343 45.2440 <.0001
Subregion 3 3 16271.718 65.7670 <.0001
Route[Subregion] 55 55 29946.957 6.6022 <.0001
Least Squares Means Table
Level Least Sq Mean Std Error Mean
Sonoran Desert 4.232683 0.9129788 6.1600
Colorado Desert 4.711137 1.6618078 5.2500
East Mojave 5.682936 1.3286543 7.3000
West Mojave 21.519062 0.9477360 17.9508
Raven Trends CSRC 23
23
Table 7b. Results of ANOVA of number of stops ravens for model for effect of route, region, and
year. R2 = 0.66
Analysis of Variance
Source DF Sum of
Squares
Mean Square F Ratio Prob > F
Model 59 8890.735 150.690 13.9198 <.0001
Error 422 4568.404 10.826
C. Total 481 13459.139
Effect Tests
Source Nparm DF Sum of
Squares
F Ratio Prob > F
Year 1 1 987.1816 91.1895 <.0001
Subregion 3 3 3778.7880 116.3534 <.0001
Route[Subregion] 55 55 5940.1874 9.9767 <.0001
Least Squares Means Table
Level Least Sq Mean Std Error Mean
Sonoran Desert 2.662170 0.33077646 3.70000
Colorado Desert 2.867863 0.60208069 3.15000
East Mojave 3.727789 0.48137765 4.52000
West Mojave 11.063005 0.34336918 9.46721

Raven Trends CSRC 24
24
Table 8. Summary of effect of year on variation in
numbers of ravens and numbers of stops with ravens
within each subregion. The value represents the
change in number of ravens and number of stops with
ravens per year (% change over 37 years).
Change over time
Subregion Ravens Stops
Sonoran Desert 0.38 (1377%) 0.07 (136%)
Colorado Desert 0.21* (762%) 0.13 (486%)
East Mojave 0.09 (78%) 0.16 (588%)
West Mojave 0.88 (795%) 0.39 (431%)
* not significant

Raven Trends CSRC 25
25
Figure 1. Map showing all routes included in survey indicating direction and intensity of
average annual changes in number of ravens on each route by size and type of symbol.
Key to route numbers appears in Appendix A.
Figure 2. Map showing all routes included in survey indicating direction and intensity of
average annual changes in number of stops at which ravens were observed on each route
by size and type of symbol.

Raven Trends CSRC 26
26
Raven Trends CSRC 27
27
#S
#
#
#
#
#
##
S
S
S
S
S
S
S
#
#
#
#
#
S
#
S
#
#
#
S
#
#
#
##
#
#
#
# � � � � � � � � � � � � � ! � � " � # � $ � � � � � � % � � " � # � $ � � � � � � & � ' � � � � � � � � ( )) *( () +) ,-+, -* -* .* )/ , -*-), (, ), . ( +. .-(/ *, 0) 1-, 1 0. /0 *, +/ 1 -/0 + * ) ** ) (* * 1* + ,* + 1* -* * -+ 2 3 4 5 6 6 5 3 7 89 : 3 : ; < 5 = > 7 3 6 ? ; 8@ ; A ? 5 > 8
B > > = 3 C D E 3 > A ; ? > 8 : 5 F 8S
G HI J K G G HI K LS
G HI K L G H#
H G HI K L#
HI K L G HI J#
HI J G HI M L#
HI M L G HI N#
HI N G HI O L#
HI O L G HI P#
HI P G K I H L#
K I H L G K I K Q
R S S R S T U S V W X Y Z [ \] ^
_̀ a b c d e f b b g h i d j k l e m k n e o f m̀ j a p d b q d m d r m f k b e k p d j m f h d
Raven Trends CSRC 28
28
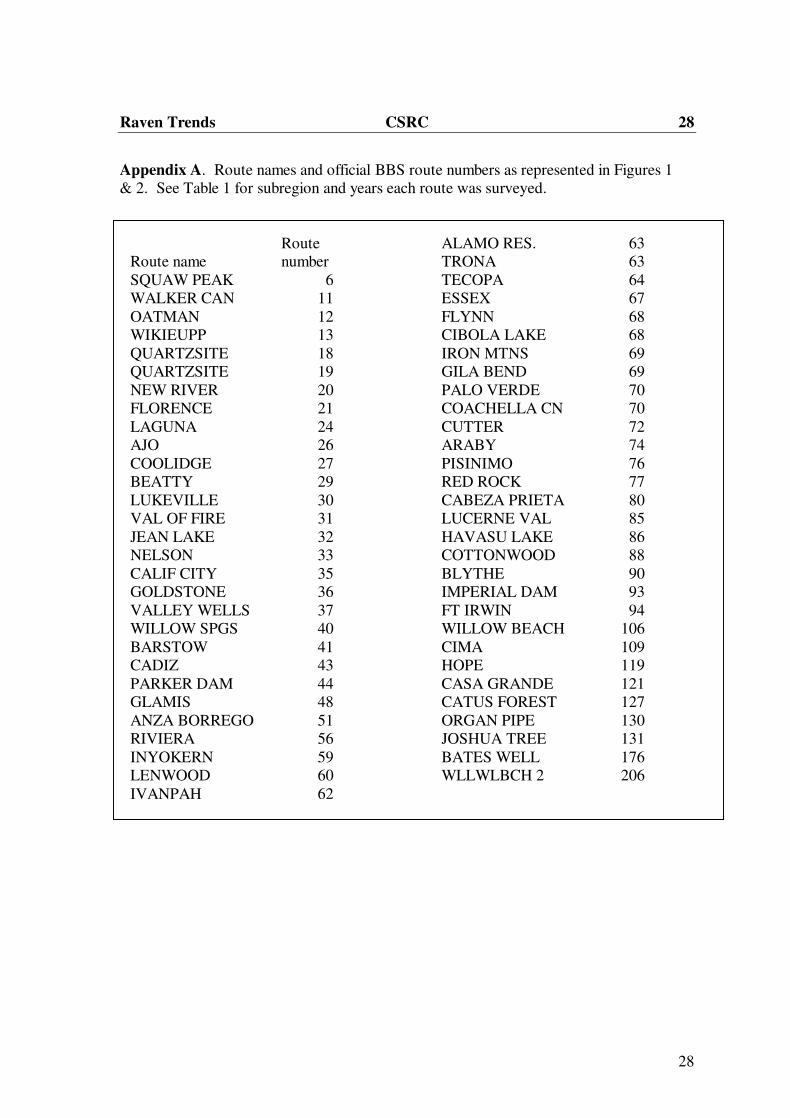
Appendix A. Route names and official BBS route numbers as represented in Figures 1
& 2. See Table 1 for subregion and years each route was surveyed.
Route name
Route
number
SQUAW PEAK 6
WALKER CAN 11
OATMAN 12
WIKIEUPP 13
QUARTZSITE 18
QUARTZSITE 19
NEW RIVER 20
FLORENCE 21
LAGUNA 24
AJO 26
COOLIDGE 27
BEATTY 29
LUKEVILLE 30
VAL OF FIRE 31
JEAN LAKE 32
NELSON 33
CALIF CITY 35
GOLDSTONE 36
VALLEY WELLS 37
WILLOW SPGS 40
BARSTOW 41
CADIZ 43
PARKER DAM 44
GLAMIS 48
ANZA BORREGO 51
RIVIERA 56
INYOKERN 59
LENWOOD 60
IVANPAH 62
ALAMO RES. 63
TRONA 63
TECOPA 64
ESSEX 67
FLYNN 68
CIBOLA LAKE 68
IRON MTNS 69
GILA BEND 69
PALO VERDE 70
COACHELLA CN 70
CUTTER 72
ARABY 74
PISINIMO 76
RED ROCK 77
CABEZA PRIETA 80
LUCERNE VAL 85
HAVASU LAKE 86
COTTONWOOD 88
BLYTHE 90
IMPERIAL DAM 93
FT IRWIN 94
WILLOW BEACH 106
CIMA 109
HOPE 119
CASA GRANDE 121
CATUS FOREST 127
ORGAN PIPE 130
JOSHUA TREE 131
BATES WELL 176
WLLWLBCH 2 206

Raven Trends CSRC 29
29
Appendix B. Graphs showing number of ravens per year for each route separately.

Raven Trends CSRC 30
30

Raven Trends CSRC 31
31

Raven Trends CSRC 32
32

Raven Trends CSRC 33
33
Appendix C. Graphs showing number of stops on which ravens were observed per year
for each route separately.

Raven Trends CSRC 34
34

Raven Trends CSRC 35
35

Raven Trends CSRC 36
36