Trends in childhood asthma and atopic diseases...The term ‘atopic diseases’ refers to three...
142
Transcript of Trends in childhood asthma and atopic diseases...The term ‘atopic diseases’ refers to three...

Trends in childhood asthma and atopic diseasesPractice-based research in Child and Youth Health Care
Dianne de Korte-de Boer
This research project was supported by the Public Health Service South Limburg (GGD Zuid-
Limburg) and has been made possible by research school CAPHRI. It was initiated by the Academic
Collaborative Centre for Public Health (Academische Werkplaats Publieke Gezondheid Limburg),
a collaboration between the Public Health Service South Limburg, the faculty of Health, Medicine
and Life Sciences of Maastricht University, and 18 municipalities in South Limburg.
The research was conducted at the School for Public Health and Primary Care: CAPHRI,
Department of Epidemiology, of Maastricht University. CAPHRI participates in the Netherlands
School of Primary Care Research CaRe.
Financial support for printing this thesis was kindly provided by Stichting Astma Bestrijding and
Longfonds.
Cover design: Maaike van der Beek, H2O ontwerpstudio
Lay-out: Marcel de Korte
Printed by: United Communicatie en Creatie, Roosendaal
Copyright © 2015 Dianne de Korte-de Boer, Maastricht, the Netherlands
All rights reserved. No part of this thesis may be reproduced or transmitted in any form of by any
means, electronic, or mechanical, including photocopying, recording or any information storage
or retrieval system, without permission from the author in writing, or when appropriate, from the
publishers of the publications.

Trends in childhood asthma and atopic diseasesPractice-based research in Child and Youth Health Care
PROEFSCHRIFT
ter verkrijging van de graad van doctor
aan de Universiteit Maastricht,
op gezag van de Rector Magnificus, Prof dr. L.L.G. Soete
volgens het besluit van het College van Decanen,
in het openbaar te verdedigen
op vrijdag 18 december 2015 om 12.00 uur
door
Johanna Dingena de Korte-de Boer
Promotores
Prof. dr. C.P. van Schayck
Prof. dr. F.J.M. Feron
Copromotor
Dr. M. Mommers
Beoordelingscommissie
Prof. dr. G. Wesseling (voorzitter)
Dr. M. Kamphuis (TNO Leiden)
Prof. dr. H. Raat (Erasmus MC)
Prof. dr. L.J.I. Zimmermann
Contents
Chapter 1 General introduction 7
Part I: Prevalence trends – ‘Astma Monitor Westelijke Mijnstreek’
Chapter 2 Stabilizing prevalence trends of eczema, asthma, and 23
rhinoconjunctivitis in Dutch schoolchildren (2001-2010)
Chapter 3 Trends in wheeze in Dutch schoolchildren and the role 35
of medication use
Chapter 4 Asthma and Overweight in Dutch schoolchildren with 49
diverging prevalence trends (1993-2010)
Part II: Early life growth – LucKi Birth Cohort Study
Chapter 5 LucKi Birth Cohort Study: rationale and design 65
Chapter 6 Early life growth and the development of preschool wheeze, 77
independent from overweight
Chapter 7 General Discussion 93
Summary 111
Samenvatting 117
Valorisation 121
About the author 127
List of publications 131
Dankwoord 135


Chapter 1General introduction
Chapter 1General introduction
7

88
Chapter 1
11
Asthma and atopic diseases are the most common non-communicable diseases of childhood
in developed countries, where overweight and obesity also present a significant threat to the
health of many children. These diseases are therefore important public health topics, and more
specifically important themes for Child and Youth Health Care in the Netherlands. In this thesis,
the results of a research collaboration between Maastricht University and Child and Youth Health
Care in South Limburg are described. We present prevalence trends of asthma and atopic diseases
among schoolchildren in the southeast of the Netherlands, and an association with childhood
growth and overweight.
Childhood asthma and atopic diseases
Asthma
Asthma is a chronic inflammatory pulmonary disorder, characterized by recurrent attacks of
shortness of breath and wheezing that are caused by temporally narrowed or obstructed airways,1
and is usually associated with bronchial hyperresponsiveness and chronic airway inflammation.2
Asthma is a heterogeneous disease, ranging from mild to very severe, and with different factors
triggering the attacks. Exacerbation may occur after an allergic reaction to allergens,3 such as
grass pollen or house dust mite, but also exposure to non-allergens such as tobacco smoke or
exhaust gases,4 or physical factors, such as exercise,5 stress and anxiety6 may trigger an asthma
attack. In most cases the first symptoms of asthma occur during childhood.2
Treatment of asthma with medication is targeted at gaining control of symptoms with as little
medication as possible. Two groups of medication play an important role in asthma management:
inhaled corticosteroids (preventers), which reduce airway inflammation and hyperresponsiveness,
and short-acting bronchodilators (relievers), which give short-term relief of acute symptoms.7
Atopic diseases
The term ‘atopic diseases’ refers to three closely related conditions: eczema (atopic dermatitis),
allergic asthma, and hay fever (seasonal allergic rhinitis or rhinoconjunctivitis). Atopy (defined as
a personal and/or familial tendency to become sensitized and produce immunoglobulin E (IgE)
antibodies in response to ordinary exposure to allergens),8 is an important underlying factor.
Eczema is an inflammatory, relapsing, itchy skin disease with lesions typically in flexural places.9
Eczema primarily affects young children; almost half of all children with eczema experienced
their first symptoms within the first year of life,10 and 75% will spontaneously grow over the
complaints before adolescence.11 Allergic asthma is the most common form of asthma, and
concerns the type of asthma in which inhaled allergens cause the exacerbations.3,12 Hay fever
is defined as non-infectious, allergic inflammation of the nasal mucosa, caused by seasonal
allergens, such as grass or tree pollens.13 Symptoms include sneezing, nasal blockage and/or
itching of the nose, and often also the eyes are affected (conjunctivitis).14,15 The prevalence of
99
General introduction
11
hay fever peaks in adolescence and then gradually decreases.14 Atopic diseases typically manifest
themselves at different ages: eczema starts early in the first few years of life, and forms a
major risk factor for developing allergic asthma and hay fever during or after childhood.16 This
progression from eczema to asthma and hay fever has been named the ‘atopic march’.10,17,18 In
the German Multicentre Atopy Study, early eczema was associated with wheeze and bronchial
hyperresponsiveness at 7 years of age, and major determinants of the increased risk were disease
severity and atopic sensitization.19 However, children with eczema who subsequently developed
asthma and/or hay fever already showed more symptoms (wheeze, nasal complaints) in early
childhood, indicating the co-existence of these atopic diseases rather than a progression from
one disease to the other.19,20
Prevalence trends of asthma and atopic diseases
Prevalence worldwide and in the Netherlands
Over the past decades, western countries have faced rapid increases of asthma and atopic
diseases prevalence amongst children.21 These unfavourable trends constitute major health
problems for individuals and societies.22 The significant worldwide increase in reported childhood
asthma prevalence in the second part of the 20th century has been referred to as the ‘asthma
epidemic’.23 While in most other countries prevalence of asthma continues to increase,21 or at
best has reached a plateau,24 in the Netherlands decreasing trends of wheeze25 and asthma26
have been observed among school-aged children. Nonetheless, asthma is nowadays still the most
prevalent chronic disease among Dutch children,1 affecting approximately 4-7% of children until
12 years of age in the Netherlands, with a higher prevalence among boys than girls.27 To the best
of our knowledge, for eczema and hay fever there is currently no data available on prevalence
trends among children in the Netherlands. In 2011, 2-6% of Dutch children under 14 years of
age were reported to have eczema,28 and in 2010 1-5% of children under 12 years of age, and
6-28% of 12-18 year-old children were reported to have hay fever.29
Explaining prevalence trends
Studying prevalence trends of asthma and atopic diseases is important for policy makers in order
to understand the extent of the problem in the population, and may furthermore provide clues
for potential modifiable risk factors that might be targeted with prevention and intervention
strategies by health care practitioners in the future.
It is important to note that explanatory factors for prevalence trends are not necessarily risk
factors for the disease under study, but may also include factors that influence the likelihood of
a disease (or its symptoms) to be detected in epidemiological studies. Examples of the latter are:
disease awareness, access to health care facilities, diagnostic habits, and disease management.
While changes in most of these factors would most likely lead to an increase in the detection of
1010
Chapter 1
11
(symptoms of) asthma and atopic diseases over time, only improvement in disease management
could be a plausible explanation for the more recently observed decrease in wheeze and asthma.
For public health purposes, it is important to know whether the prevalence is truly declining
or whether it is masked by improved disease management. Therefore, investigating the role of
asthma medication use in explaining the observed prevalence trends of wheeze is part of the
research described in this thesis.
Risk factors for asthma and atopic diseases
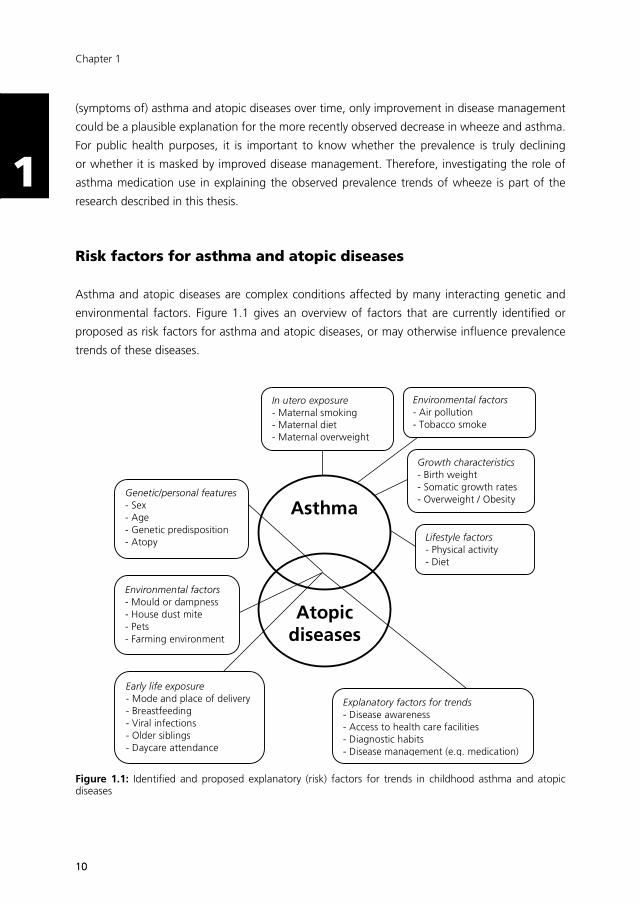
Asthma and atopic diseases are complex conditions affected by many interacting genetic and
environmental factors. Figure 1.1 gives an overview of factors that are currently identified or
proposed as risk factors for asthma and atopic diseases, or may otherwise influence prevalence
trends of these diseases.
Asthma
Atopic diseases
Genetic/personal features - Sex - Age - Genetic predisposition - Atopy
In utero exposure - Maternal smoking - Maternal diet - Maternal overweight
Environmental factors - Air pollution - Tobacco smoke exposure
Environmental factors - Mould or dampness - House dust mite - Pets - Farming environment
Early life exposure - Mode and place of delivery - Breastfeeding - Viral infections - Older siblings - Daycare attendance
Growth characteristics - Birth weight - Somatic growth rates - Overweight / Obesity
Lifestyle factors - Physical activity - Diet
Explanatory factors for trends - Disease awareness - Access to health care facilities - Diagnostic habits - Disease management (e.g. medication)
Figure 1.1: Identified and proposed explanatory (risk) factors for trends in childhood asthma and atopic diseases

1111
General introduction
11
Genetic factors clearly play a role in the development of asthma and atopic diseases. For example,
children with a family history of atopy have a 2-5 times higher risk of developing asthma.30
However, there is consensus that genetic changes in populations would occur too slow to explain
the observed rapid changes in prevalence over the past decades. Moreover, for atopic diseases it
was shown that immigrants moving from countries with lower prevalence rates to countries with
higher prevalence rates tend to acquire the rates of the local population over time,31 implying that
environmental factors ultimately determine the expression of atopic diseases.
Given the observations that the increase in asthma and atopic diseases prevalence primarily
occurred in developed countries, factors associated with adopting a modern lifestyle have
been implicated to play an important role in these trends. The evidence of the role of high
dietary energy intake, increased dietary salt and fat intake, and decreased physical activity in the
development of asthma and atopic diseases is currently inconclusive.32-35 According to the hygiene
hypothesis,36 the risk of developing atopy and asthma is increased through diminished microbial
stimulation of the immune system in young children. For example, children with more exposure to
infectious diseases (e.g through day care attendance, or the presence of older siblings at home),
have a lower incidence of atopic disease.37 Similar protective effects for atopic diseases have
been observed with regard to mode and place of delivery, which influence the gastrointestinal
microbiota composition,38 and living on a farm, where exposure to livestock and consumption
of unpasteurized milk in pregnancy and early life seems to protect against asthma and atopic
diseases.39
Overweight and obesity
The worldwide increase in asthma was paralleled by an increase in overweight and obesity.40
Prevalence of overweight among Dutch children (2-21 years of age) has increased from 5-7%
in 1980 to 13-15% in 2009.41 Likewise, obesity has increased from 0.3-0.5% in 1980 to 2% in
2009,41 and there are currently no signs of plateauing. These parallel rising prevalence trends
have led to interest in the potential link between asthma and overweight.
An association of overweight with asthma has been found in cross-sectional and longitudinal
studies, but the nature of the association remains unclear. While initially it was suggested that
asthma patients gain weight as a result of decreased physical activity because of their respiratory
limitations, there is now consensus that this explanation is not plausible.42-45 Other explanations of
the association include increased perception of respiratory symptoms in children with overweight,
and earlier recognition of asthma in children with overweight because they may visit their doctor
more frequently. A causal pathway from overweight to asthma has been proposed through
several potential mechanisms: overweight may mechanically lead to decreased lung function;
low-grade systemic inflammation in overweight may increase airway inflammation, resulting in
asthma;44 or enhanced gastro-esophageal reflux in overweight may lead to asthma.42
At present, we still do not have a comprehensive understanding of the exact nature of the
relationship between asthma and overweight. The diverging trends in prevalence that have
1212
Chapter 1
11
been observed only more recently in the Netherlands contradict a single causal pathway from
overweight to asthma and suggest a more complex relationship. It is also well possible that
asthma and overweight are not (only) causally related, but have certain risk factors in common
in early life.
Early life factors
Because asthma, atopic diseases and overweight have their beginnings in early life,46 the role of
prenatal and early life factors in the etiology have been studied extensively. In utero exposure to
dietary nutrients, cigarette smoking, etc. is thought to influence gene expression and subsequent
development and functioning of tissues and organs, ultimately predisposing for certain diseases.
This phenomenon is called ‘fetal programming’.47
Birth weight is often used as an indicator of fetal growth and maturation,48 and is associated with
both wheezing/asthma49,50 and overweight.51-53 Other well-studied fetal exposures are maternal
smoking during pregnancy and maternal pre-pregnancy overweight. Both maternal smoking
and maternal exposure to environmental tobacco smoke during pregnancy are important risk
factors for asthma in the offspring.54-56 Also, maternal pre-pregnancy overweight and increased
gestational weight gain appear to be associated with increased risk of childhood overweight,57
and evidence also suggests an association between maternal overweight and increased risk of
childhood asthma.58 In early life, rapid growth trajectories have been linked to both asthma and
overweight,59,60 and exclusive breastfeeding seems to protect against developing asthma61 and
overweight62 during childhood.
Identifying modifiable risk factors
For public health purposes, it is of importance to study risk factors that are modifiable at an age at
which Child and Youth Health Care practitioners have access to the children. Therefore, hereditary
and prenatal factors are beyond the scope of this thesis. For the research presented in this thesis,
our focus is on growth, overweight and obesity as possible determinants for childhood asthma.
This choice was made, because Child and Youth Health Care closely monitors these variables
and therefore has an extensive database on growth characteristics, and because the increase in
the number of children classified as overweight, and the shift to relatively more children who are
obese, are concerns for public health.41
Also, we will briefly consider exposure to environmental tobacco smoke (ETS) as an explanatory
factor for asthma prevalence trends. ETS is a very important risk factor for childhood asthma and
is the main primary prevention target according to the guideline ‘childhood asthma’ for Child and
Youth Health Care.63

1313
General introduction
11
Research in the ‘Westelijke Mijnstreek’
All data used for the research presented in this thesis have been collected in the ‘Westelijke
Mijnstreek’, a region in the southeast of the Netherlands (Figure 1.2). The regional Public Health
Service is obliged by law to monitor the health status of the population, and this data collection
forms the basis for local, provincial, and national health policy. In collaboration with Maastricht
University, the data has also been used for research purposes. Combining scientific research with
routinely collected data has the advantage for researchers to profit from existing infrastructures
(e.g. facilitating recruitment and follow-up of participants at low costs), and enables health care
practitioners to translate research results into preventive measures or therapeutic interventions
that are directly applicable to their daily practice.
Figure 1.2: Localisation of the study region ‘Westelijke Mijnstreek’ in the Netherlands
The ‘Astma Monitor Westelijke Mijnstreek’
In the late 1980s, suspicions arose that the prevalence of respiratory complaints in the ‘Westelijke
Mijnstreek’ was relatively high compared with other parts of the Netherlands. Therefore, the
Public Health Service South Limburg has been monitoring the prevalence of respiratory symptoms
with repeated cross-sectional surveys among schoolchildren in the region since 1989. The last,
sixth, survey of the ‘Astma Monitor Westelijke Mijnstreek’ study took place in 2010. In each survey
year, a questionnaire on respiratory health (and from 2001 onwards also including questions on
eczema and hay fever) was distributed among schoolchildren who were invited for a routine
preventive health examination by the Child and Youth Health Care department of the Public
Health Service. As part of the routine examination, the child’s height and weight were measured
in a standardised way. Figure 1.3 provides a schematic overview of the study. Children were
invited according to birth year, and as a result, children of certain birth years were surveyed in
two successive survey years.

1414
Chapter 1
11
The ‘Astma Monitor Westelijke Mijnstreek’ study has been of great value to investigate prevalence
trends of and risk factors for respiratory symptoms in school-aged children,25,64 and forms the
basis of the chapters 2 to 4 of this thesis. However, the cross-sectional design and the specific age
groups that were studied limit causal interpretation of the findings.
1983 1988 1992 1995 2000
1989 1993 1997 2001 2005 2010
Survey Year
Birth Year
Figure 1.3: Schematic overview of surveys in the ‘Astma Monitor Westelijke Mijnstreek’. Schoolchildren in the study area are invited for a routine preventive health examination according to year of birth. In survey years, additional questionnaires were distributed among invited children.
The Lucki Birth Cohort Study
In order to follow children prospectively from birth, the LucKi Birth Cohort Study was designed
and started in the same study area in 2006. LucKi is a Dutch acronym for: Respiratory Complaints
and Atopic Diseases in Children (Luchtwegklachten en atopische aandoeningen bij Kinderen). In
Chapter 5 of this thesis, the rationale and design of the LucKi Birth Cohort Study is described in
detail. In brief, LucKi is an ongoing, dynamic, prospective birth cohort study, embedded in the
Child and Youth Health Care practice of the ‘Westelijke Mijnstreek’. Participants are recruited
1-2 weeks after birth and followed until age 19 years. Recruitment and follow-up coincide with
routine Child and Youth Health Care contact moments, during which the child’s physical and
psychosocial development is closely monitored, and anthropometrics are measured repeatedly.
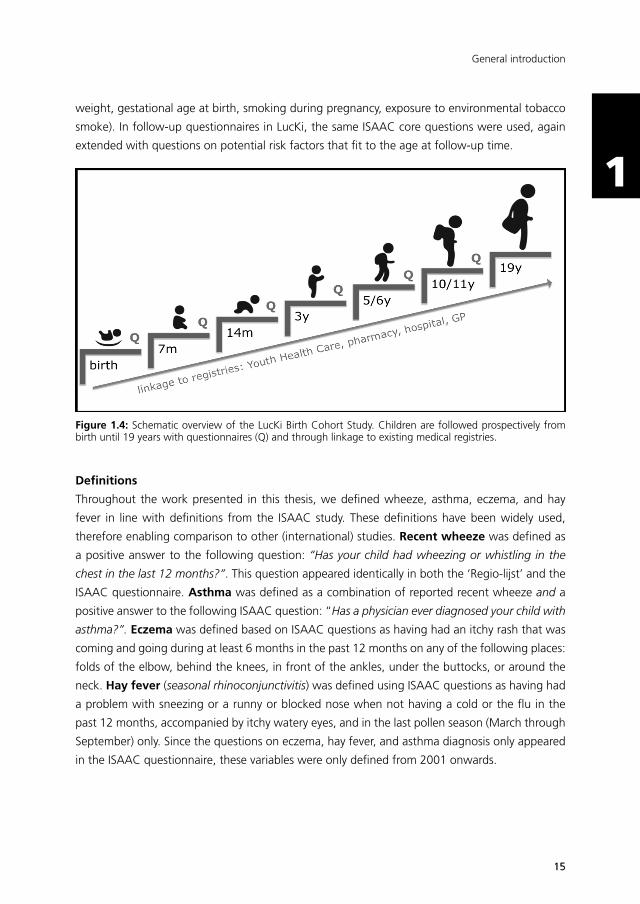
Information gathered through Child and Youth Health Care is complemented with repeated
parental questionnaires, and information from existing registries of pharmacy, hospital and/or
general practice (Figure 1.4).
Questionnaires
Between 1989 and 2001, the validated Dutch questionnaire (‘Regio-lijst’)65 on childhood
respiratory symptoms was used in the surveys of the ‘Astma Monitor Westelijke Mijnstreek’.
From 2001 onwards, the Dutch translation of the international validated ISAAC (International
Study of Asthma and Allergies in Childhood) core questionnaire66 was used, with questions on
respiratory, skin, and nasal complaints. In addition to disease symptoms, questions were asked
on diagnoses, medication use, and well-known risk factors for atopic diseases (including birth
1515
General introduction
11
weight, gestational age at birth, smoking during pregnancy, exposure to environmental tobacco
smoke). In follow-up questionnaires in LucKi, the same ISAAC core questions were used, again
extended with questions on potential risk factors that fit to the age at follow-up time.
Figure 1.4: Schematic overview of the LucKi Birth Cohort Study. Children are followed prospectively from birth until 19 years with questionnaires (Q) and through linkage to existing medical registries.
Definitions
Throughout the work presented in this thesis, we defined wheeze, asthma, eczema, and hay
fever in line with definitions from the ISAAC study. These definitions have been widely used,
therefore enabling comparison to other (international) studies. Recent wheeze was defined as
a positive answer to the following question: “Has your child had wheezing or whistling in the
chest in the last 12 months?”. This question appeared identically in both the ‘Regio-lijst’ and the
ISAAC questionnaire. Asthma was defined as a combination of reported recent wheeze and a
positive answer to the following ISAAC question: “Has a physician ever diagnosed your child with
asthma?”. Eczema was defined based on ISAAC questions as having had an itchy rash that was
coming and going during at least 6 months in the past 12 months on any of the following places:
folds of the elbow, behind the knees, in front of the ankles, under the buttocks, or around the
neck. Hay fever (seasonal rhinoconjunctivitis) was defined using ISAAC questions as having had
a problem with sneezing or a runny or blocked nose when not having a cold or the flu in the
past 12 months, accompanied by itchy watery eyes, and in the last pollen season (March through
September) only. Since the questions on eczema, hay fever, and asthma diagnosis only appeared
in the ISAAC questionnaire, these variables were only defined from 2001 onwards.

1616
Chapter 1
11
Objectives
The research described in this thesis has three main objectives. First, we aimed to describe preva-
lence trends of wheeze, asthma and atopic diseases in the ‘Westelijke Mijnstreek’. Second, we
aimed to explore whether changes in medication use or changes in overweight in the population
could (partly) explain these trends. For these objectives, data from the ‘Astma Monitor Westelijk
Mijnstreek’ was used. Third, we aimed to investigate whether growth patterns in early life could
explain the development of asthma symptoms and overweight in preschool children indepen-
dently. For this purpose, we used longitudinal data from the LucKi Birth Cohort Study.
These objectives are targeted at gaining more knowledge on the development of asthma and
atopic diseases, and their relation with overweight. Besides these objectives, this research project
served as an example of how data that is (routinely) collected within Child and Youth Health Care
practice can be used for scientific research. This issue is elaborated on in the general discussion.
Outline of the thesis
Part I: Prevalence trends – ‘Astma Monitor Westelijke Mijnstreek’
Preceding studies with data of the ‘Astma Monitor Westelijke Mijnstreek’ showed that between
1989 and 2001, wheeze prevalence was declining among schoolchildren in the study area.
Chapter 2 describes the continuation of this trend until 2010, and presents prevalence trends of
eczema, asthma, and rhinoconjunctivitis between 2001 and 2010.
Although a decrease in symptom prevalence may indicate a true decline of a disease, it is also
possible that the presence of a disease in a population is masked by improved treatment options
over the years. Therefore, in Chapter 3, we explored whether increased use of asthma medication
could explain the previously observed declining trend in wheeze symptoms. Finally, we used the
‘Astma Monitor Westelijke Mijnstreek’ data to study the association of overweight with asthma
in this population, the results of which are presented in Chapter 4 of this thesis.
Part II: Early life growth – LucKi Birth Cohort Study
Chapter 5 describes the rationale and design of the LucKi Birth Cohort Study. Longitudinal data
from LucKi participants that was collected between birth and the age of 3 years enabled us to
study the association of early life growth patterns with preschool wheeze and overweight. The
results of this study are presented in Chapter 6.
General discussion
Finally, Chapter 7 summarises the aims and main results of this thesis, critically discusses its impli-
cations and limitations, and gives recommendations for future research. Also, a paragraph in this
chapter is devoted to discuss our experiences with performing research in a public health setting.

1717
General introduction
11
References
1. WHO. Fact Sheet Asthma. November 2013. Available from: http://www.who.int/mediacentre/factsheets/fs307/en/index .html (accessed January 2015).
2. Martinez FD, Vercelli D. Asthma. Lancet 2013; 382(9901): 1360-72.
3. Tattersfield AE, Knox AJ, Britton JR, Hall IP. Asthma. Lancet 2002; 360(9342): 1313-22.
4. Guarnieri M, Balmes JR. Outdoor air pollution and asthma. Lancet 2014; 383(9928): 1581-92.
5. Randolph C. Pediatric exercise-induced bronchoconstriction: contemporary developments in epidemiology, pathogenesis, presentation, diagnosis, and therapy. Curr Allergy Asthma Rep 2013; 13(6): 662-71.
6. Rosenberg SL, Miller GE, Brehm JM, Celedon JC. Stress and asthma: novel insights on genetic, epigenetic, and immunologic mechanisms. J Allergy Clin Immunol 2014; 134(5): 1009-15.
7. Dirksen W, Geijer R, de Haan M, de Koning G, Flikweert S, Kolnaar B. [Dutch College of General Practitioners (NHG): Practice Guideline Asthma in Children (first revision)]. Huisarts en Wetenschap 1998; 41(3): 130-43.
8. Johansson SG, Bieber T, Dahl R, et al. Revised nomenclature for allergy for global use: Report of the Nomenclature Review Committee of the World Allergy Organization, October 2003. J Allergy Clin Immunol 2004; 113(5): 832-6.
9. Williams HC. Clinical practice. Atopic dermatitis. N Engl J Med 2005; 352(22): 2314-24.
10. Spergel JM, Paller AS. Atopic dermatitis and the atopic march. J Allergy Clin Immunol 2003; 112(6 Suppl): S118-27.
11. Thomsen SF. Atopic dermatitis: natural history, diagnosis, and treatment. ISRN Allergy 2014 (2014): article ID 354250.
12. Craig TJ. Aeroallergen sensitization in asthma: prevalence and correlation with severity. Allergy Asthma Proc 2010; 31(2): 96-102.
13. Bousquet J, Khaltaev N, Cruz AA, et al. Allergic Rhinitis and its Impact on Asthma (ARIA) 2008 update (in collaboration with the World Health Organization, GA(2)LEN and AllerGen). Allergy 2008; 63 Suppl 86: 8-160.
14. Wheatley LM, Togias A. Clinical practice. Allergic rhinitis. N Engl J Med 2015; 372(5): 456-63.
15. Bielory L. Allergic conjunctivitis and the impact of allergic rhinitis. Curr Allergy Asthma Rep 2010; 10(2): 122-34.
16. Wahn U. The significance of environmental exposure on the progression of allergic diseases. Allergy 2011; 66 Suppl 95: 7-9.
17. Zheng T, Yu J, Oh MH, Zhu Z. The atopic march: progression from atopic dermatitis to allergic rhinitis and asthma. Allergy Asthma Immunol Res 2011; 3(2): 67-73.
18. Nissen SP, Kjaer HF, Host A, Nielsen J, Halken S. The natural course of sensitization and allergic diseases from childhood to adulthood. Pediatr Allergy Immunol 2013; 24(6): 549-55.
19. Illi S, von Mutius E, Lau S, et al. The natural course of atopic dermatitis from birth to age 7 years and the association with asthma. J Allergy Clin Immunol 2004; 113(5): 925-31.
20. Rochat MK, Illi S, Ege MJ, et al. Allergic rhinitis as a predictor for wheezing onset in school-aged children. J Allergy Clin Immunol 2010; 126(6): 1170-5.e2.
21. Asher MI, Montefort S, Bjorksten B, et al. Worldwide time trends in the prevalence of symptoms of asthma, allergic rhinoconjunctivitis, and eczema in childhood: ISAAC Phases One and Three repeat multicountry cross-sectional surveys. Lancet 2006; 368(9537): 733-43.
22. O’Connell EJ. The burden of atopy and asthma in children. Allergy 2004; 59 Suppl 78: 7-11.

1818
Chapter 1
11
23. Russell G. The childhood asthma epidemic. Thorax 2006; 61(4): 276-8.
24. Anandan C, Nurmatov U, van Schayck OC, Sheikh A. Is the prevalence of asthma declining? Systematic review of epidemiological studies. Allergy 2010; 65(2): 152-67.
25. Mommers M, Gielkens-Sijstermans C, Swaen GM, van Schayck CP. Trends in the prevalence of respiratory symptoms and treatment in Dutch children over a 12 year period: results of the fourth consecutive survey. Thorax 2005; 60(2): 97-9.
26. van Schayck CP, Smit HA. The prevalence of asthma in children: a reversing trend. Eur Respir J 2005; 26(4): 647-50.
27. Hoeymans N, Melse JM, Schoemaker CG. Volksgezondheid Toekomst Verkenning 2010. Bilthoven: RIVM, 2010.
28. Bruijnzeel-Koomen C, Poos MJJC. Hoe vaak komt constitutioneel eczeem voor en neemt dit toe of af?In: Volksgezondheid Toekomst Verkenning, Nationaal Kompas Volksgezondheid. Bilthoven, RIVM: 11 June 2013.
29. Wijga AH, Scholtens S, van Oeffelen AAM, Beckers M. Klachten en kwalen bij kinderen in Nederland. Omvang en gevolgen geïnventariseerd. Bilthoven: Rijksinstituut voor Volksgezondheid en Milieu (RIVM), 2010.
30. Litonjua AA, Carey VJ, Burge HA, Weiss ST, Gold DR. Parental history and the risk for childhood asthma. Does mother confer more risk than father? Am J Respir Crit Care Med 1998; 158(1): 176-81.
31. Garcia Marcos L, Robertson CF, Ross Anderson H, Ellwood P, Williams HC, Wong GW. Does migration affect asthma, rhinoconjunctivitis and eczema prevalence? Global findings from the international study of asthma and allergies in childhood. Int J Epidemiol 2014; 43(6): 1846-54.
32. Corbo GM, Forastiere F, De Sario M, et al. Wheeze and asthma in children: associations with body mass index, sports, television viewing, and diet. Epidemiology 2008; 19(5): 747-55.
33. Rasmussen F, Lambrechtsen J, Siersted HC, Hansen HS, Hansen NC. Low physical fitness in childhood is associated with the development of asthma in young adulthood: the Odense schoolchild study. Eur Respir J 2000; 16(5): 866-70.
34. Welsh L, Roberts RG, Kemp JG. Fitness and physical activity in children with asthma. Sports Med 2004; 34(13): 861-70.
35. Eijkemans M, Mommers M, Draaisma JM, Thijs C, Prins MH. Physical activity and asthma: a systematic review and meta-analysis. PLoS One 2012; 7(12): e50775.
36. Strachan DP. Hay fever, hygiene, and household size. BMJ 1989; 299(6710): 1259-60.
37. Stone KD. Atopic diseases of childhood. Curr Opin Pediatr 2003; 15(5): 495-511.
38. van Nimwegen FA, Penders J, Stobberingh EE, et al. Mode and place of delivery, gastrointestinal microbiota, and their influence on asthma and atopy. J Allergy Clin Immunol 2011; 128(5): 948-55.e1-3.
39. von Mutius E. Environmental factors influencing the development and progression of pediatric asthma. J Allergy Clin Immunol 2002; 109(6 Suppl): S525-32.
40. WHO. Obesity: preventing and managing the global epidemic. Geneva, Switzerland: World Health Organisation, 2000.
41. Schonbeck Y, Talma H, van Dommelen P, et al. Increase in prevalence of overweight in Dutch children and adolescents: a comparison of nationwide growth studies in 1980, 1997 and 2009. PLoS One 2011; 6(11): e27608.
42. Chinn S. Obesity and asthma: evidence for and against a causal relation. J Asthma 2003; 40(1): 1-16.
43. Weiss ST. Obesity: insight into the origins of asthma. Nat Immunol 2005; 6(6): 537-9.
44. Story RE. Asthma and obesity in children. Current Opinion in Pediatrics 2007; 19(6): 680-4.
45. Eijkemans M, Mommers M, de Vries SI, et al. Asthmatic symptoms, physical activity, and overweight in young children: a cohort study. Pediatrics 2008; 121(3): e666-72.
1919
General introduction
11
46. Litonjua AA, Gold DR. Asthma and obesity: common early-life influences in the inception of disease. Journal of Allergy & Clinical Immunology 2008; 121(5): 1075-84; quiz 85-6.
47. Barker DJ. The fetal and infant origins of adult disease. BMJ 1990; 301(6761): 1111.
48. Turner S. Perinatal programming of childhood asthma: early fetal size, growth trajectory during infancy, and childhood asthma outcomes. Clin Dev Immunol 2012; 2012: 962923.
49. Remes ST, Patel SP, Hartikainen AL, Jarvelin MR, Pekkanen J. High birth weight, asthma and atopy at the age of 16 yr. Pediatr Allergy Immunol 2008; 19(6): 541-3.
50. Tedner SG, Ortqvist AK, Almqvist C. Fetal growth and risk of childhood asthma and allergic disease. Clin Exp Allergy 2012; 42(10): 1430-47.
51. Yu ZB, Han SP, Zhu GZ, et al. Birth weight and subsequent risk of obesity: a systematic review and meta-analysis. Obes Rev 2011; 12(7): 525-42.
52. Baird J, Fisher D, Lucas P, Kleijnen J, Roberts H, Law C. Being big or growing fast: systematic review of size and growth in infancy and later obesity. BMJ 2005; 331(7522): 929.
53. Oldroyd J, Renzaho A, Skouteris H. Low and high birth weight as risk factors for obesity among 4 to 5-year-old Australian children: does gender matter? Eur J Pediatr 2011; 170(7): 899-906.
54. Grabenhenrich LB, Gough H, Reich A, et al. Early-life determinants of asthma from birth to age 20 years: a German birth cohort study. J Allergy Clin Immunol 2014; 133(4): 979-88.
55. Bjerg A, Hedman L, Perzanowski M, Lundback B, Ronmark E. A strong synergism of low birth weight and prenatal smoking on asthma in schoolchildren. Pediatrics 2011; 127(4): e905-12.
56. Sly PD. The early origins of asthma: who is really at risk? Curr Opin Allergy Clin Immunol 2011; 11(1): 24-8.
57. Oken E, Kleinman KP, Belfort MB, Hammitt JK, Gillman MW. Associations of gestational weight gain with short- and longer-term maternal and child health outcomes. Am J Epidemiol 2009; 170(2): 173-80.
58. Scholtens S, Wijga AH, Brunekreef B, et al. Maternal overweight before pregnancy and asthma in offspring followed for 8 years. Int J Obes (Lond) 2010; 34(4): 606-13.
59. Sonnenschein-van der Voort AM, Jaddoe VW, Raat H, et al. Fetal and infant growth and asthma symptoms in preschool children: the Generation R Study. Am J Respir Crit Care Med 2012; 185(7): 731-7.
60. Stettler N, Iotova V. Early growth patterns and long-term obesity risk. Curr Opin Clin Nutr Metab Care 2010; 13(3): 294-9.
61. Midodzi WK, Rowe BH, Majaesic CM, Saunders LD, Senthilselvan A. Early life factors associated with incidence of physician-diagnosed asthma in preschool children: results from the Canadian Early Childhood Development cohort study. J Asthma 2010; 47(1): 7-13.
62. Verduci E, Banderali G, Barberi S, et al. Epigenetic effects of human breast milk. Nutrients 2014; 6(4): 1711-24.
63. Lanting CI, Heerdink-Obenhuijsen N, Wagenaar-Fischer MM, van Gameren-Oosterom HBM, Breuning Boers JM, Toll DB, Mohangoo AD. JGZ-richtlijn Astma bij kinderen [Guideline Asthma in children]. Utrecht: Nederlands Centrum jeugdgezondheid, 2011.
64. Mommers M, Derkx R, Swaen G, van Schayck O. Changing prevalence of respiratory symptoms and treatment in Dutch school children: 1989-1997. Primary Care Respiratory Journal 2002; 11(2): 38-41.
65. Verkerk P, Rijcken B. Evaluatie van een vragenlijst naar respiratoire symptomen en de maatschappelijke gevolgen hiervan in een open populatie [Evaluation of a respiratory symptoms questionnaire and its social implications in an open population]. T Soc Gezondheidsz 1988; 66: 102-5.
66. Asher MI, Keil U, Anderson HR, et al. International Study of Asthma and Allergies in Childhood (ISAAC): rationale and methods. Eur Respir J 1995; 8(3): 483-91.

20

21
Part I
Prevalence trends –
‘Astma Monitor Westelijke Mijnstreek’

22
Chapter 2Stabilizing prevalence trends of eczema, asthma, and rhinoconjunctivitis in Dutch schoolchildren (2001-2010)
Chapter 2Stabilizing prevalence trends of eczema,
asthma, and rhinoconjunctivitis in Dutch schoolchildren (2001-2010)
de Korte-de Boer D, Mommers M, Gielkens-Sijstermans CML, Creemers HMH, Mujakovic S, Feron FJM, van Schayck CP
Adapted from:ALLERGY 2015; DOI:10.1111/all.12728 [EPUB AHEAD OF PRINT]
23
2424
Chapter 2
22
Abstract
In contrast to many countries, a decrease in childhood wheeze prevalence was previously
reported for the Netherlands. In repeated cross-sectional surveys in 2001, 2005, and 2010 we
investigated whether this trend continued, and additionally examined prevalence trends of
eczema, asthma and rhinoconjunctivitis among 8-11 year-old schoolchildren eligible for a routine
physical examination.
Overall, ~90% participated (mean age: 8.8 years in 2001 and 10.5 years in 2005 and 2010). Ec-
zema, wheeze, and asthma prevalence did not change significantly between 2001 and 2010, but
rhinoconjunctivitis prevalence increased from 8.4% in 2001 to 12.3% in both 2005 and 2010
(ptrend<0.01).
In conclusion, after a decrease in wheeze prevalence among Dutch schoolchildren between 1989
and 2001, no further decrease was observed until 2010. Similarly, the prevalence of eczema and
asthma remained stable, but rhinoconjunctivitis prevalence increased between 2001 and 2010.
The latter may be an effect of older age and not a true increase over time.

2525
Prevalence trends of atopic diseases
22
Introduction
Worldwide, the prevalence of childhood asthma and allergies has been increasing since the
1960s.1 Our study in the Netherlands was one of the first to report a declining trend in childhood
wheeze between 1989 and 2001.2
The International Study of Asthma and Allergy in Childhood (ISAAC) reported large variations
between countries in the prevalence of atopic diseases (eczema, asthma, and rhinoconjunctivitis)
between 1992 and 2004, with overall more increases than decreases, and mostly diverging trends
of atopic diseases within countries.3 In a systematic review in 2010, Anandan et al. concluded
that in most countries asthma prevalence is continuing to increase or at best remaining stable,
but there was no sign of an overall decline.4
Because of large global variations, regional studies remain of great importance. In ISAAC,
prevalence trends within countries were based on two time-points, limiting the opportunity to
reveal non-linear time trends. More recently, some countries have added a third5,6 or fourth7 survey,
and found evidence of prevalence trends reaching a plateau. Our study has been continued with
two more surveys (resulting in a total of six consecutive surveys), and has been expanded with
questions on eczema and rhinoconjunctivitis in the last three surveys.
We aimed to investigate whether the previously observed decline in wheeze prevalence among
Dutch schoolchildren continued until 2010, and whether prevalence trends of eczema, asthma,
and rhinoconjunctivitis showed similar patterns between 2001 and 2010.
Methods
Study population
Data were obtained from repeated cross-sectional surveys in the south-east of the Netherlands,
details of which were reported previously.2,8,9 In brief, in 1989, 1993, 1997, 2001, 2005, and 2010
questionnaires were distributed to parents of children invited for a routine physical examination
at the regional Public Health Service. Between 1989 and 2001, children were invited at the age
of 8-9 years, but from 2005 onwards, children were invited at the age of 10-11 years. While until
2005 questionnaires were sent to all invited children, for logistic reasons, in 2010 questionnaires
were distributed to only a random half of invited children.
Questionnaire and outcomes
From 2001-2010 the Dutch translation of the internationally validated ISAAC-questionnaire10
was administered. Primary outcomes were current (past 12 months) eczema, wheeze, asthma,
rhinoconjunctivitis, and seasonal rhinoconjunctivitis. Current eczema was defined as having had
an itchy rash that was coming and going during at least 6 months in the past 12 months on any
of the following places: folds of the elbow, behind the knees, in front of the ankles, under the

2626
Chapter 2
22
buttocks, or around the neck. Current wheeze was defined as parentally reported wheezing or
whistling in the chest in the past 12 months. Current asthma was defined as having had a doctor’s
diagnosis of asthma, with reported wheezing in the past year. Current rhinitis was defined as
having had a problem with sneezing or a runny or blocked nose when not having a cold or the
flu in the past 12 months. Current rhinoconjunctivitis was defined as having rhinitis symptoms
in the past 12 months, accompanied by itchy watery eyes. Current seasonal rhinoconjunctivitis
was defined as having rhinoconjunctivitis symptoms in the last pollen season (March through
September) only.
Secondary outcomes were: ever eczema, wheeze, or rhinitis; ever diagnosed with eczema, asthma,
or rhinoconjunctivitis; and ever used medication for eczema, asthma, or rhinoconjunctivitis.
Finally, we combined ever eczema, wheeze, and/or rhinitis into eight co-morbidity categories.
Statistical analyses
Mantel-Haenszel’s Chi-square test for linear association was used to test for a time trend in
prevalence over the years 2001-2010. Because of the shift to an older age group in 2005,
Pearson Chi-square tests and univariable and multivariable logistic models with year of survey as
independent variable were performed to test differences between 2005 and 2010.
Results
Overall, high participation rates (~90%) were achieved. A change in questionnaire distribution
in 2010 resulted in a lower absolute number of children eligible for participation in this survey.
The proportion of boys was highest in 2001 and lowest in 2010 (Table 2.1). Because the age at
which children were invited for the physical examination was changed after 2001, mean age of
participants in 2001 was lower than in 2005 and 2010. In 2005 more children were exposed to
maternal smoking during pregnancy and environmental tobacco smoke (ETS). In 2010, a larger
proportion of children were breastfed. Other characteristics were distributed equally in 2005 and
2010.
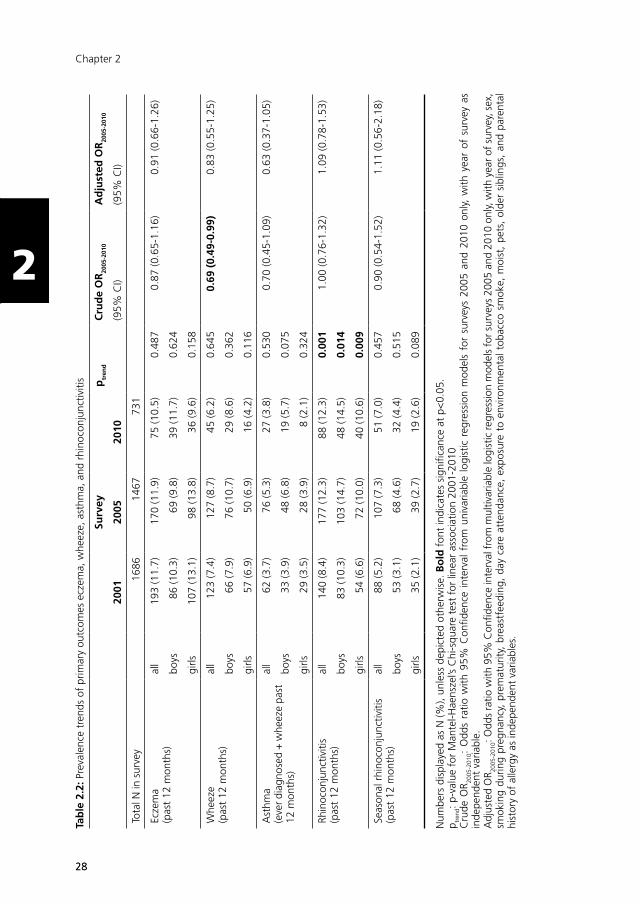
The prevalence of eczema, wheeze, and asthma did not change significantly between 2001
and 2010 (Table 2.2). Rhinoconjunctivitis prevalence increased significantly from 8.4% in 2001
to 12.3% in both 2005 and 2010 (ptrend<0.01). The prevalence of seasonal rhinoconjunctivitis
followed the same pattern, but did not reach statistical significance. There were no differences in
prevalence trends between boys and girls. Analysing prevalence differences between 2005 and
2010 with multivariable models confirmed there were no statistically significant changes over
these years.

2727
Prevalence trends of atopic diseases
22
Tab
le 2
.1: B
asel
ine
char
acte
ristic
s ac
ross
sur
veys
200
1-20
10
Surv
ey
2001
2005
2010
95%
C.I.
95%
C.I.
95%
C.I.
Tota
l in
surv
ey (N
)16
8614
6773
1
Sex
boys
853
(50.
6)71
9 (4
9.0)
341
(46.
6)
girls
830
(49.
2)73
6 (5
0.2)
382
(52.
3)
Mea
n ag
e (y
ears
± S
D)
8.8
± 0
.4
10.5
± 0
.510
.5 ±
0.5
Posi
tive
alle
rgy
test
(eve
r)23
2 (1
3.8)
12.2
-15.
524
8 (1
6.9)
15.0
-18.
910
7 (1
4.6)
12.2
-17.
4
Pare
ntal
his
tory
of
atop
y/al
lerg
y190
1 (6
1.4)
58.9
-63.
944
5 (6
0.9)
57.2
-64.
4
Born
pre
mat
urel
y215
8 (1
0.8)
9.2-
12.5
74 (1
0.1)
8.0-
12.5
Mat
erna
l sm
okin
g du
ring
preg
nanc
y 28
2 (1
9.2)
17.2
-21.
387
(11.
9)9.
6-14
.5
Brea
stfe
edin
g3 79
4 (5
4.1)
51.5
-56.
744
8 (6
1.3)
57.7
-64.
8
Day
car
e at
tend
ance
4 10
85 (7
4.0)
71.6
-76.
255
8 (7
6.3)
73.1
-79.
4
Old
er s
iblin
gs (1
or
mor
e)82
4 (5
6.2)
53.6
-58.
738
3 (5
2.4)
48.7
-56.
1
ETS
expo
sure
5 59
8 (4
0.8)
38.2
-43.
317
4 (2
3.8)
20.8
-27.
1
Moi
st6
288
(19.
6)17
.6-2
1.8
119
(16.
3)13
.7-1
9.2
Pets
(eve
r)
1039
(70.
8)68
.4-7
3.1
478
(65.
4)61
.8-6
8.8
Pets
(cur
rent
)82
4 (5
6.2)
53.6
-58.
738
3 (5
2.4)
48.7
-56.
1
Num
bers
dis
play
ed a
s N
(%),
unle
ss d
epic
ted
othe
rwis
e. A
ll va
riabl
es a
re p
aren
tally
rep
orte
d. Q
uest
ions
on
co-v
aria
bles
did
not
app
ear
in t
he 2
001
ques
tionn
aire
. 1 fa
ther
and
/or
mot
her
havi
ng a
his
tory
of
asth
ma,
whe
eze,
ecz
ema,
hay
fev
er, h
ouse
dus
t al
lerg
y an
d/or
pet
alle
rgy
2 bo
rn b
efor
e 37
wee
ks o
f ge
stat
ion
3 be
ing
brea
stfe
d ex
clus
ivel
y or
in c
ombi
natio
n w
ith f
orm
ula
feed
ing
4 ha
ving
vis
ited
day
care
or
pre-
scho
ol b
etw
een
birt
h an
d 4
year
s of
age
5 pa
rent
ally
rep
orte
d sm
okin
g in
the
hom
e si
nce
birt
h 6
moi
st o
r m
ould
spo
ts in
the
hom
e in
the
pas
t 12
mon
ths
2828
Chapter 2
22
Tab
le 2
.2: P
reva
lenc
e tr
ends
of
prim
ary
outc
omes
ecz
ema,
whe
eze,
ast
hma,
and
rhi
noco
njun
ctiv
itis
Surv
eyp
tren
dC
rud
e O
R20
05-2
010
Ad
just
ed O
R20
05-2
010
2001
2005
2010
(95%
CI)
(95%
CI)
Tota
l N in
sur
vey
1686
1467
731
Ecze
ma
(pas
t 12
mon
ths)
all
193
(11.
7)17
0 (1
1.9)
75 (1
0.5)
0.48
70.
87 (0
.65-
1.16
)0.
91 (0
.66-
1.26
)
boys
86 (1
0.3)
69 (9
.8)
39 (1
1.7)
0.62
4
girls
107
(13.
1)98
(13.
8)36
(9.6
)0.
158
Whe
eze
(pas
t 12
mon
ths)
all
123
(7.4
)12
7 (8
.7)
45 (6
.2)
0.64
50.
69 (
0.49
-0.9
9)0.
83 (0
.55-
1.25
)
boys
66 (7
.9)
76 (1
0.7)
29 (8
.6)
0.36
2
girls
57 (6
.9)
50 (6
.9)
16 (4
.2)
0.11
6
Ast
hma
(eve
r dia
gnos
ed +
whe
eze
past
12
mon
ths)
all
62 (3
.7)
76 (5
.3)
27 (3
.8)
0.53
00.
70 (0
.45-
1.09
)0.
63 (0
.37-
1.05
)
boys
33 (3
.9)
48 (6
.8)
19 (5
.7)
0.07
5
girls
29 (3
.5)
28 (3
.9)
8 (2
.1)
0.32
4
Rhin
ocon
junc
tiviti
s (p
ast
12 m
onth
s)al
l14
0 (8
.4)
177
(12.
3)88
(12.
3)0.
001
1.00
(0.7
6-1.
32)
1.09
(0.7
8-1.
53)
boys
83 (1
0.3)
103
(14.
7)48
(14.
5)0.
014
girls
54 (6
.6)
72 (1
0.0)
40 (1
0.6)
0.00
9
Seas
onal
rhi
noco
njun
ctiv
itis
(pas
t 12
mon
ths)
all
88 (5
.2)
107
(7.3
)51
(7.0
)0.
457
0.90
(0.5
4-1.
52)
1.11
(0.5
6-2.
18)
boys
53 (3
.1)
68 (4
.6)
32 (4
.4)
0.51
5
girls
35 (2
.1)
39 (2
.7)
19 (2
.6)
0.08
9
Num
bers
dis
play
ed a
s N
(%),
unle
ss d
epic
ted
othe
rwis
e. B
old
fon
t in
dica
tes
sign
ifica
nce
at p
<0.
05.
p tren
d: p
-val
ue f
or M
ante
l-Hae
nsze
l’s C
hi-s
quar
e te
st f
or li
near
ass
ocia
tion
2001
-201
0C
rude
OR 20
05-2
010:
Odd
s ra
tio w
ith 9
5% C
onfid
ence
int
erva
l fr
om u
niva
riabl
e lo
gist
ic r
egre
ssio
n m
odel
s fo
r su
rvey
s 20
05 a
nd 2
010
only,
with
yea
r of
sur
vey
as
inde
pend
ent
varia
ble.
A
djus
ted
OR 20
05-2
010:
Odd
s ra
tio w
ith 9
5% C
onfid
ence
inte
rval
fro
m m
ultiv
aria
ble
logi
stic
regr
essi
on m
odel
s fo
r su
rvey
s 20
05 a
nd 2
010
only,
with
yea
r of
sur
vey,
sex
, sm
okin
g du
ring
preg
nanc
y, p
rem
atur
ity,
brea
stfe
edin
g, d
ay c
are
atte
ndan
ce,
expo
sure
to
envi
ronm
enta
l tob
acco
sm
oke,
moi
st,
pets
, ol
der
sibl
ings
, an
d pa
rent
al
hist
ory
of a
llerg
y as
inde
pend
ent
varia
bles
.
2929
Prevalence trends of atopic diseases
22
In Table 2.3 prevalence trends for secondary outcomes are presented. Between 2001 and 2010
unchanging trends were observed for eczema ever and wheeze ever, but rhinitis ever increased
among boys (25.6% in 2001, 30.6% in 2005, and 30.4% in 2010, ptrend<0.05). Significantly
less girls were diagnosed with eczema (25.7% in 2001, 25.6% in 2005, and 19.1% in 2010,
ptrend<0.05), more boys were diagnosed with asthma (12.2 in 2001, 21.5% in 2005, and 16.3%
in 2010, ptrend<0.01), and more children (boys and girls) were diagnosed with rhinoconjunctivitis
(9.3% in 2001, 14.4% in 2005, and 14.8% in 2010, ptrend<0.001). Between 2005 and 2010,
fewer children used medication for eczema (14.9% in 2005 and 11.7% in 2010, ptrend<0.05, and
this decrease was mainly seen among girls (15.6% in 2005 and 9.4% in 2010, ptrend<0.01), see
Table 2.3.
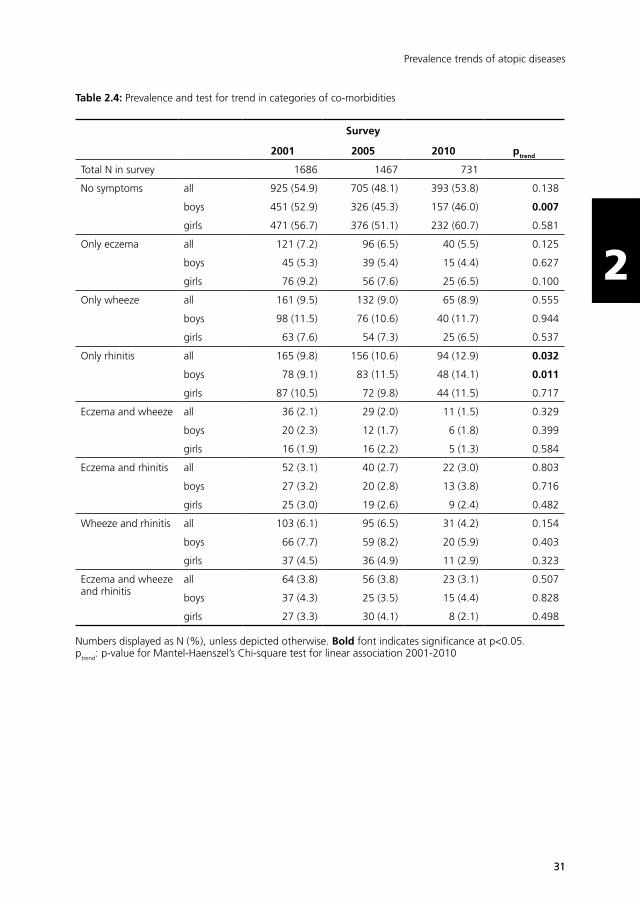
In Table 2.4 prevalence trends for all 8 co-morbidity categories are presented. Among the children
with symptoms, the groups of children with only wheeze, only rhinitis, and only eczema are the
largest. The combination of ever having had wheeze and rhinitis symptoms forms the largest
group of children with symptoms of more than one disease. Significant changes in prevalence
between 2001 and 2010 only occurred in the categories ‘no symptoms’ (decrease among boys;
from 52.9% in 2001 to 46.0% in 2010, ptrend<0.01), and ‘only rhinitis’ (an overall increase, but
when stratified by sex only significant among boys: from 9.1% in 2001 to 14.1% in 2010,
ptrend<0.05).
Discussion
In repeated cross-sectional surveys among 8-11 year-old children in the Netherlands, we found
unchanging prevalence trends of eczema, wheeze, asthma, and seasonal rhinoconjunctivitis
between 2001 and 2010, and a significant increasing trend in rhinoconjunctivitis prevalence.
After a previously observed decrease in wheeze prevalence between 1989 and 20012, we now
observed no further decrease until 2010. A similar unchanging trend between 2001 and 2010
was observed for asthma, and ever wheeze (Table 2.3). Although wheeze prevalence was lower in
2010 compared with 2005, after adjusting for potential confounders this decrease was no longer
statistically significant (Table 2.2). We suspect that wheeze prevalence in 2010 was lower because
this survey consisted of fewer boys.
The increase in rhinoconjunctivitis prevalence occurred between 2001 and 2005, and not between
2005 and 2010 (p2005-2010= 0.996 and 0.696 respectively, Table 2.2). The same pattern was also
seen for ever rhinitis (boys) and rhinoconjunctivitis diagnosis (Table 2.3), and seasonal rhino-
conjunctivitis, albeit it non-significant. In the German MAS cohort a steep rise in allergic rhinitis
prevalence occurred between 7 and 13 years of age,11 and a similar pattern has been reported
by other birth cohort studies.12,13 Therefore, the increase in rhinoconjunctivitis prevalence in our
study most likely reflects a higher prevalence among older children included in 2005 and 2010.

3030
Chapter 2
22
Table 2.3: Prevalence and test for trend of secondary outcomes
Survey
2001 2005 2010 ptrend
Total N in survey 1686 1467 731
Eczema (ever) all 279 (16.9) 224 (16.9) 96 (13.9) 0.120
boys 134 (16.1) 97 (14.9) 49 (15.4) 0.669
girls 145 (17.8) 123 (18.4) 47 (12.9) 0.080
Wheeze (ever) all 378 (22.6) 354 (24.4) 140 (19.2) 0.211
boys 227 (26.9) 202 (28.3) 88 (25.9) 0.920
girls 151 (18.3) 147 (20.2) 52 (13.6) 0.142
Rhinitis (ever) all 400 (24.0) 398 (27.4) 181 (25.2) 0.249
boys 216 (25.6) 217 (30.6) 102 (30.4) 0.040
girls 184 (22.4) 177 (24.2) 77 (20.4) 0.668
Eczema diagnosis all 429 (25.9) 325 (26.0) 145 (22.0) 0.093
boys 218 (26.1) 157 (26.7) 76 (25.5) 0.931
girls 210 (25.7) 166 (25.6) 68 (19.1) 0.034
Asthma diagnosis all 179 (10.8) 203 (16.6) 73 (11.5) 0.068
boys 102 (12.2) 127 (21.5) 47 (16.3) 0.003
girls 77 (9.4) 75 (12.1) 25 (7.4) 0.689
Rhinoconjunctivitis diagnosis
all 154 (9.3) 172 (14.4) 97 (14.8) <0.001
boys 89 (10.6) 112 (19.2) 60 (19.7) <0.001
girls 65 (8.0) 58 (9.6) 36 (10.5) 0.140
Eczema medication all 214 (14.9) 84 (11.7) 0.044
boys 99 (14.4) 48 (14.3) 0.922
girls 112 (15.6) 35 (9.4) 0.004
Asthma medication all 169 (11.6) 71 (9.8) 0.197
boys 100 (14.0) 45 (13.3) 0.741
girls 69 (9.5) 26 (6.9) 0.144
Rhinoconjunctivitis medication
all 292 (20.3) 150 (20.7) 0.859
boys 162 (23.0) 85 (25.1) 0.463
girls 129 (17.9) 64 (16.8) 0.663
Numbers displayed as N (%), unless depicted otherwise. Bold font indicates significance at p<0.05.ptrend: p-value for Mantel-Haenszel’s Chi-square test for linear association 2001-2010 or 2005-2010 (medication)
3131
Prevalence trends of atopic diseases
22
Table 2.4: Prevalence and test for trend in categories of co-morbidities
Survey
2001 2005 2010 ptrend
Total N in survey 1686 1467 731
No symptoms all 925 (54.9) 705 (48.1) 393 (53.8) 0.138
boys 451 (52.9) 326 (45.3) 157 (46.0) 0.007
girls 471 (56.7) 376 (51.1) 232 (60.7) 0.581
Only eczema all 121 (7.2) 96 (6.5) 40 (5.5) 0.125
boys 45 (5.3) 39 (5.4) 15 (4.4) 0.627
girls 76 (9.2) 56 (7.6) 25 (6.5) 0.100
Only wheeze all 161 (9.5) 132 (9.0) 65 (8.9) 0.555
boys 98 (11.5) 76 (10.6) 40 (11.7) 0.944
girls 63 (7.6) 54 (7.3) 25 (6.5) 0.537
Only rhinitis all 165 (9.8) 156 (10.6) 94 (12.9) 0.032
boys 78 (9.1) 83 (11.5) 48 (14.1) 0.011
girls 87 (10.5) 72 (9.8) 44 (11.5) 0.717
Eczema and wheeze all 36 (2.1) 29 (2.0) 11 (1.5) 0.329
boys 20 (2.3) 12 (1.7) 6 (1.8) 0.399
girls 16 (1.9) 16 (2.2) 5 (1.3) 0.584
Eczema and rhinitis all 52 (3.1) 40 (2.7) 22 (3.0) 0.803
boys 27 (3.2) 20 (2.8) 13 (3.8) 0.716
girls 25 (3.0) 19 (2.6) 9 (2.4) 0.482
Wheeze and rhinitis all 103 (6.1) 95 (6.5) 31 (4.2) 0.154
boys 66 (7.7) 59 (8.2) 20 (5.9) 0.403
girls 37 (4.5) 36 (4.9) 11 (2.9) 0.323
Eczema and wheeze and rhinitis
all 64 (3.8) 56 (3.8) 23 (3.1) 0.507
boys 37 (4.3) 25 (3.5) 15 (4.4) 0.828
girls 27 (3.3) 30 (4.1) 8 (2.1) 0.498
Numbers displayed as N (%), unless depicted otherwise. Bold font indicates significance at p<0.05.ptrend: p-value for Mantel-Haenszel’s Chi-square test for linear association 2001-2010
3232
Chapter 2
22
In contrast, among children in the co-morbidity category ‘rhinitis only’, a continued increase was
seen from 2001 and 2005, but also between 2005 and 2010 and can therefore not (only) be
explained by higher age.
We are unaware of recent prevalence (trends) studies elsewhere in the Netherlands, but we
can compare our prevalence rates to those in other European countries. The prevalence in our
population ranged from 10.5% to 11.7% for eczema, 3.7% to 5.3% for asthma, and 5.2%
to 7.3% for seasonal rhinoconjunctivitis. These proportions lie in the lower end of the range of
reported proportions in Western European countries participating in ISAAC phase Three (among
6-7 year old children in 1999-2004),3 which is surprising for rhinoconjunctivitis because in our
slightly older study population we would expect it to be in the higher end of the range. In
these countries, almost exclusively increasing prevalence trends were found between 1992 and
2004.3 Furthermore, the prevalence rates in our population are similar to those in 8-9 year-old
Greek children (10.8%, 6.9%, and 5.1% in 2008, respectively)7, but lower than in 7-13 year-
old Norwegian children (13.5%, 9.9%, and 13.5% in 2008, respectively)5. In Greece, wheeze/
asthma prevalence reached a plateau after an initial increase, but eczema and rhinoconjunctivitis
prevalence was still increasing until 2008.7 In Norway, the prevalence of current asthma,
rhinoconjunctivitis, and eczema increased between 1985 and 2008, only lifetime eczema
prevalence reached a plateau between 1995 and 2008.5 Thus, the prevalence of atopic diseases
in our study is comparable to other European countries, but the unchanging prevalence trends
seem to be unique.
It is still largely unknown what causes increasing or decreasing trends in asthma and atopic
diseases. Evidently underlying atopy is important, but atopy alone cannot explain diverging
trends of atopic diseases within populations. Other factors that possibly play a role include:
dietary habits, physical activity, microbial exposure, social-economic status, indoor and outdoor
environment, disease awareness, and disease management. In a previous study we showed that
(increased) medication use is not an explanation for the previously observed decrease in wheeze
in our population.9 Although we cannot rule out a role of increased disease awareness, this most
likely would have resulted in increasing prevalence trends over the years.
Strengths of the present study are a standardised way of conducting the surveys within
routine health examination practice, a long study period, high response rates, and enhanced
comparability with other studies by using ISAAC questions. Limitations include the change to an
older age group after 2001, which complicated the interpretation of the time trends, and the lack
of information on risk factors in 2001, which restricted performing multivariable analyses over
the whole study period. High response rates limit the possibility of selection bias. Misclassification
of outcome variables may have led to an underestimation of prevalence, e.g. because parents do
not recognize or recall symptoms correctly. Assumedly, this would not occur differentially over the
survey years and therefore would not affect the reported prevalence trends.
3333
Prevalence trends of atopic diseases
22
33
In conclusion, after a decrease in wheeze prevalence among Dutch schoolchildren between 1989
and 2001, no further decrease was observed between 2001 and 2010. The prevalence of eczema
and asthma remained stable between 2001 and 2010. Rhinoconjunctivitis showed an increase
over this period, which may be the result of an older age group surveyed in 2005 and 2010, and
not a true increase over time.
3434
Chapter 2
22
References
1. Eder W, Ege MJ, von Mutius E. The asthma epidemic. N Engl J Med 2006; 355(21): 2226-35.
2. Mommers M, Gielkens-Sijstermans C, Swaen GM, van Schayck CP. Trends in the prevalence of respiratory symptoms and treatment in Dutch children over a 12 year period: results of the fourth consecutive survey. Thorax 2005; 60(2): 97-9.
3. Asher MI, Montefort S, Bjorksten B, et al. Worldwide time trends in the prevalence of symptoms of asthma, allergic rhinoconjunctivitis, and eczema in childhood: ISAAC Phases One and Three repeat multicountry cross-sectional surveys. Lancet 2006; 368(9537): 733-43.
4. Anandan C, Nurmatov U, van Schayck OC, Sheikh A. Is the prevalence of asthma declining? Systematic review of epidemiological studies. Allergy 2010; 65(2): 152-67.
5. Hansen TE, Evjenth B, Holt J. Increasing prevalence of asthma, allergic rhinoconjunctivitis and eczema among schoolchildren: three surveys during the period 1985-2008. Acta Paediatr 2013; 102(1): 47-52.
6. Selnes A, Nystad W, Bolle R, Lund E. Diverging prevalence trends of atopic disorders in Norwegian children. Results from three cross-sectional studies. Allergy 2005; 60(7): 894-9.
7. Anthracopoulos MB, Fouzas S, Pandiora A, Panagiotopoulou E, Liolios E, Priftis KN. Prevalence trends of rhinoconjunctivitis, eczema, and atopic asthma in Greek schoolchildren: four surveys during 1991-2008. Allergy Asthma Proc 2011; 32(6): 56-62.
8. Mommers M, Derkx R, Swaen G, van Schayck O. Changing prevalence of respiratory symptoms and treatment in Dutch school children: 1989-1997. Primary Care Respiratory Journal 2002; 11(2): 38-41.
9. de Korte-de Boer D, Mommers M, Gielkens-Sijstermans CM, Creemers HM, Feron FJ, van Schayck OC. Trends in wheeze in Dutch school children and the role of medication use. Pediatr Pulmonol 2015; 50(7): 665-71.
10. Asher MI, Keil U, Anderson HR, et al. International Study of Asthma and Allergies in Childhood (ISAAC): rationale and methods. Eur Respir J 1995; 8(3): 483-91.
11. Wahn U. The significance of environmental exposure on the progression of allergic diseases. Allergy 2011; 66 Suppl 95: 7-9.
12. Ballardini N, Kull I, Lind T, et al. Development and comorbidity of eczema, asthma and rhinitis to age 12: data from the BAMSE birth cohort. Allergy 2012; 67(4): 537-44.
13. Fuertes E, Standl M, von Berg A, et al. Parental allergic disease before and after child birth poses similar risk for childhood allergies. Allergy 2015;70(7):873–876.
22
Chapter 3Trends in wheeze in Dutch schoolchildren and the role of medication use
Chapter 3Trends in wheeze in Dutch schoolchildren
and the role of medication use
de Korte-de Boer D, Mommers M, Gielkens-Sijstermans CML, Creemers HMH, Feron FJM, van Schayck CP
Adapted from: Pediatric Pulmonology 2015;50(7):665-671
35
3636
Chapter 3
33
Abstract
Background
While the prevalence of childhood wheeze continues to increase in many countries, decreasing
trends have also been reported. This may be explained by increased use of asthma medication,
which effectively suppresses wheeze symptoms. In this study we investigated trends in wheeze
in Dutch school children between 1989 and 2005, and their association with medication use.
Methods
In five repeated cross-sectional surveys between 1989 and 2005, parents of all 5- to 6-year-
old and 8- to 11-year-old children eligible for a routine physical examination were asked to
complete a questionnaire on their child’s respiratory health. We identified all children for whom
a questionnaire was completed in two successive surveys. Children were grouped according to
birth year and classified into one out of four wheeze categories: ‘no wheeze’, ‘discontinued
wheeze’, ‘continued wheeze’, or ‘new-onset wheeze’.
Results
In total, 3,339 children, born in 1983 (N = 670), 1988 (N = 607), 1992 (N = 980), and 1995
(N = 1,082), participated twice. Over the study period, the proportion of children with ‘no
wheeze’ increased from 73.8% to 86.1% (Ptrend < 0.001), while the proportion of children with
‘discontinued’ and ‘continued’ wheeze decreased from 13.2% to 6.3% (Ptrend < 0.001) and from
8.8% to 3.1% (Ptrend < 0.001), respectively. Medication use was consistently associated only with
the presence of wheeze symptoms and this association did not change over time (Pbirth year *medication
use > 0.05 for all wheeze categories).
Conclusion
An increasing trend of Dutch school children with ‘no wheeze’, and decreasing trends of children
with ‘discontinued’ and ‘continued’ wheeze between 1989 and 2005 could not be explained by
(increased) medication use. This suggests that wheeze prevalence is not masked by medication
use, but is truly declining.

3737
Wheeze trends and medication use
33
Introduction
Asthma is the most prevalent chronic disease among children worldwide.1 The major clinical
expression of childhood asthma is wheeze. Wheezing children form a heterogeneous group,
with different age of onset and course of wheeze symptoms. Not all children who wheeze at
an early age will develop asthma later in life. In early life, wheezing is usually associated with
viral infections, but in the majority of children that persist to wheeze up to the age of 6 years,
wheezing is associated with atopy.2
Since the second half of the 20th century, the prevalence of asthma and wheeze in children has
increased worldwide, especially in Western countries. Yet, considerable variation in prevalence
has been observed between countries and more recently, decreasing trends have been shown.3-5
In the Netherlands, a declining trend was reported for the prevalence of wheeze6 and asthma.7 It
was proposed that these declines reflect, at least partly, increased early detection and treatment
of children with asthma, rather than a true decline in asthma prevalence.5,8
Medication for asthma suppresses symptoms, but does not cure the disease. Especially the
introduction of inhaled corticosteroids for the treatment of childhood asthma in the 1990s is
considered to have led to better control of asthma symptoms. In several trials it was shown
that inhaled corticosteroids caused clinical improvement in children with wheeze, but the
improvements disappeared shortly after discontinuation of the treatment.9,10 It is therefore well
possible that as a result of increased medication use or a change in the type of medication used,
epidemiologic studies merely measure less asthma symptoms in the population, while in fact the
underlying disease is still present. To the best of our knowledge, this hypothesis has never been
tested in an epidemiological setting.
In the present study, we aimed to investigate trends in wheeze symptoms (classified into four
different categories) between 1989 and 2005, and their association with medication use.
Prescription of inhaled corticosteroids for the treatment of childhood asthma was introduced in
the revised Dutch guideline for pediatric pulmonologists in 199711 and in the revised guideline
for general practitioners in 1998.12 Since this occurred in the middle of our study period,
and corticosteroids are effective in suppressing asthma symptoms, we hypothesised that the
proportion of children with wheeze symptoms decreased over time, and that medication use was
more prevalent among non-symptomatic children in later birth year groups compared with earlier
birth year groups.
Methods
Study population
Data were obtained from an asthma monitor study in the Westelijke Mijnstreek, a region in the
south-east of the Netherlands. Details of this study were reported previously.6,13 In brief, in 1989,

3838
Chapter 3
33
1993, 1997, 2001, and 2005 repeated cross-sectional surveys were performed among Dutch
primary school children. In the Netherlands, all children are invited twice for a routine physical
examination by the Child and Youth Health Care department of the regional Public Health Service
during their primary school years; first at the age of 5-6 years and again at the age of 8-11
years. Along with an invitation for the physical examination visit, parents of all 5-6 year-old and
8-11 year-old children living in the study region received a paper-and-pencil questionnaire on the
respiratory health of their child, which they were asked to complete at home and bring with them
on the day of their visit.
Children of certain birth years were invited for examination in two successive survey years. As a
result, these children were surveyed twice; first at the age of 5-6 years and again at the age of
8-11 years. We identified all children for whom a questionnaire was completed in two successive
survey years.
Questionnaires
In 1989, 1993, 1997, and 2001, a validated Dutch questionnaire (‘Regio-lijst’14) was used. In
2001 and 2005 the Dutch translation of the internationally validated ISAAC-questionnaire15 was
used. The questions on recent wheeze in both questionnaires were identical (“Has your child had
wheezing or whistling in the chest in the last 12 months?”). In the questionnaire used in 1989,
1993, 1997, and 2001, the following question on medication use was asked: “Did your child use
medication for the airways (i.e. bronchitis, asthma, pneumonia, hay fever) in the past month?”.
Table 3.1: Classification into wheeze categories, based on reported recent wheeze at age 5-6 years (T1) and 8-11 years (T2)
Recent wheeze
Category T1 (5-6y) T2 (8-11y)
No wheeze - -
Discontinued wheeze + -
Continued wheeze + +
New-onset wheeze - +
+ parentally reported recent wheeze (past year); - no parentally reported recent wheeze (past year)
Classification into wheeze categories
All children were grouped according to birth year (1983, 1988, 1992, or 1995) and classified into
one out of four wheeze categories; ‘no wheeze’, ‘discontinued wheeze’, ‘continued wheeze’, or
‘new-onset wheeze’. Classification was based on reported recent wheeze (having had wheeze
symptoms in the past 12 months) at the age of 5-6 years (=T1) and at the age of 8-11 years (=T2).
Children for whom no recent wheeze was reported at both T1 and T2 were categorised to have
‘no wheeze’. Children with reported recent wheeze at T1 but no reported recent wheeze at T2
were categorised to have ‘discontinued wheeze’. Children for whom recent wheeze was reported
3939
Wheeze trends and medication use
33
at T1 and at T2 were categorised to have ‘continued wheeze’, and children with no reported
recent wheeze at T1, but reported recent wheeze at T2 were categorised to have ‘new-onset
wheeze’. Table 3.1 illustrates this classification. Children with missing data on recent wheeze at
T1 and/or T2 were excluded from the analyses.
Data analysis
For each of the wheeze categories the prevalence per birth year group was calculated. Mantel-
Haenszel’s Chi-square test for linear association was used to test for a time trend in wheeze
prevalence over the four birth year groups.
To test whether the time trends for ‘no wheeze’, ‘discontinued wheeze’, ‘continued wheeze’,
and ‘new-onset wheeze’ were modified by medication use, logistic regression adjusted for
gender and birth year, and including the interaction terms (birth year*medication use at T1) or
(birth year*medication use at T2) was used for each wheeze category separately. The dependent
variable was constructed as being classified into a certain wheeze category (y=1) versus being
classified into one of the remaining three wheeze categories (y=0).
All data were analysed with SPSS version 20.0. A p-value of <0.05 was considered statistically
significant.
Results
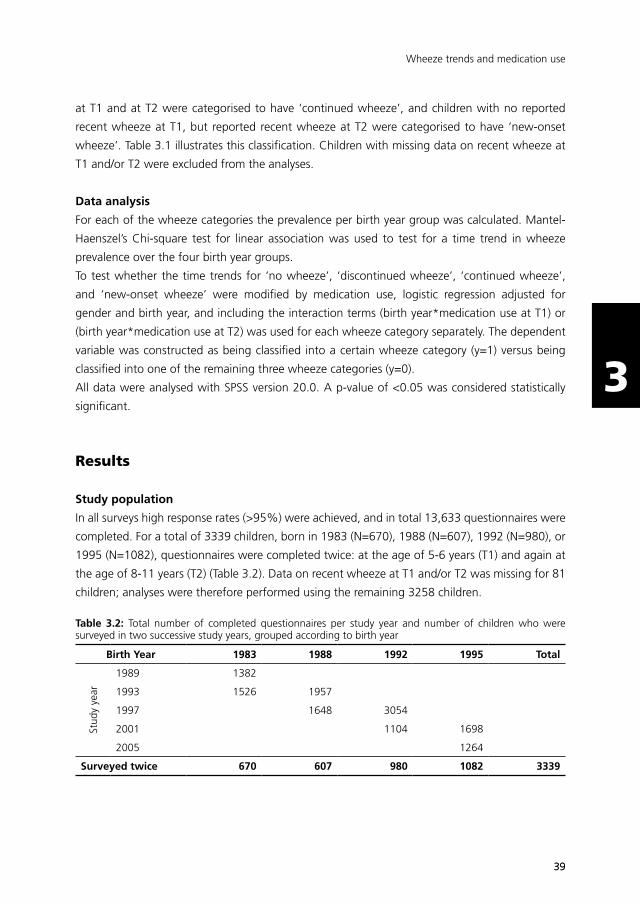
Study population
In all surveys high response rates (>95%) were achieved, and in total 13,633 questionnaires were
completed. For a total of 3339 children, born in 1983 (N=670), 1988 (N=607), 1992 (N=980), or
1995 (N=1082), questionnaires were completed twice: at the age of 5-6 years (T1) and again at
the age of 8-11 years (T2) (Table 3.2). Data on recent wheeze at T1 and/or T2 was missing for 81
children; analyses were therefore performed using the remaining 3258 children.
Table 3.2: Total number of completed questionnaires per study year and number of children who were surveyed in two successive study years, grouped according to birth year
Birth Year 1983 1988 1992 1995 Total
Stud
y ye
ar
1989 1382
1993 1526 1957
1997 1648 3054
2001 1104 1698
2005 1264
Surveyed twice 670 607 980 1082 3339
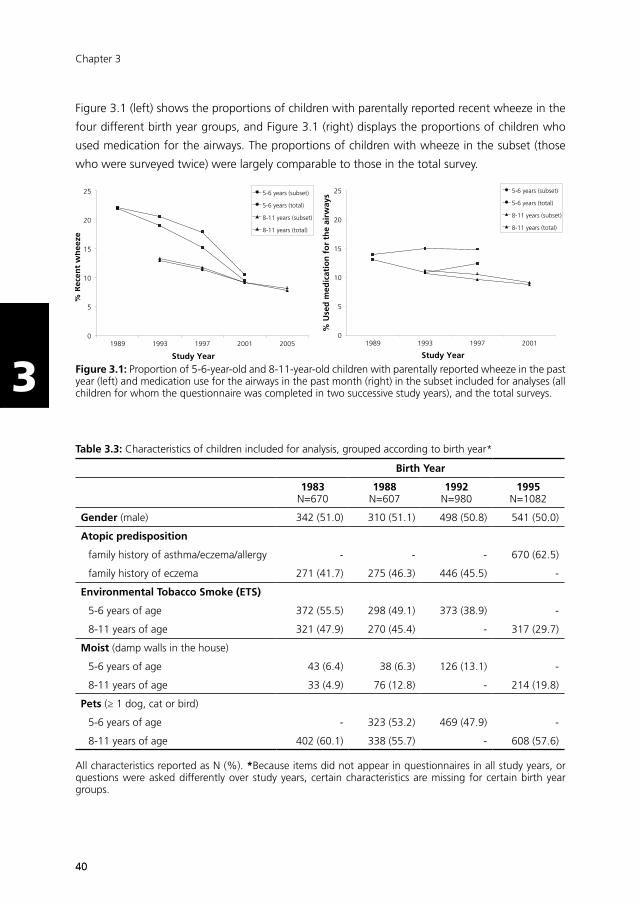
4040
Chapter 3
33
Figure 3.1 (left) shows the proportions of children with parentally reported recent wheeze in the
four different birth year groups, and Figure 3.1 (right) displays the proportions of children who
used medication for the airways. The proportions of children with wheeze in the subset (those
who were surveyed twice) were largely comparable to those in the total survey.
0
5
10
15
20
25
1989 1993 1997 2001 2005
% R
ecen
t w
hee
ze
Study Year
5-6 years (subset)
5-6 years (total)
8-11 years (subset)
8-11 years (total)
0
5
10
15
20
25
1989 1993 1997 2001
% U
sed
med
icat
ion
fo
r th
e ai
rway
s
Study Year
5-6 years (subset)
5-6 years (total)
8-11 years (subset)
8-11 years (total)
Figure 3.1: Proportion of 5-6-year-old and 8-11-year-old children with parentally reported wheeze in the past year (left) and medication use for the airways in the past month (right) in the subset included for analyses (all children for whom the questionnaire was completed in two successive study years), and the total surveys.
Table 3.3: Characteristics of children included for analysis, grouped according to birth year*
Birth Year
1983N=670
1988N=607
1992N=980
1995N=1082
Gender (male) 342 (51.0) 310 (51.1) 498 (50.8) 541 (50.0)
Atopic predisposition
family history of asthma/eczema/allergy - - - 670 (62.5)
family history of eczema 271 (41.7) 275 (46.3) 446 (45.5) -
Environmental Tobacco Smoke (ETS)
5-6 years of age 372 (55.5) 298 (49.1) 373 (38.9) -
8-11 years of age 321 (47.9) 270 (45.4) - 317 (29.7)
Moist (damp walls in the house)
5-6 years of age 43 (6.4) 38 (6.3) 126 (13.1) -
8-11 years of age 33 (4.9) 76 (12.8) - 214 (19.8)
Pets (≥ 1 dog, cat or bird)
5-6 years of age - 323 (53.2) 469 (47.9) -
8-11 years of age 402 (60.1) 338 (55.7) - 608 (57.6)
All characteristics reported as N (%). *Because items did not appear in questionnaires in all study years, or questions were asked differently over study years, certain characteristics are missing for certain birth year groups.

4141
Wheeze trends and medication use
33
Table 3.3 presents several characteristics that are known to be associated with asthma and allergy,
per birth year group. Although not all characteristics were available for all birth year groups, the
table shows that most characteristics remained stable, but living in a damp home seemed to
increase over time, and exposure to environmental tobacco smoke (ETS) seemed to decrease over
time.
Wheeze trends
Figure 3.2 shows the trends in the different wheeze categories. The proportion of children with no
wheeze increased significantly from 73.8% (birth year 1983) to 86.1% (birth year 1995) (p<0.001).
The proportion of children with discontinued and continued wheeze decreased significantly (from
13.2% to 6.3% (p<0.001) and from 8.8% to 3.1% (p<0.001), respectively). The proportion of
children with new-onset wheeze did not change significantly over time (p=0.554).
0
5
10
15
20
25
30
35
40
45
50
1983 1988 1992 1995
Wh
eeze
cat
ego
ries
(%
)
Birth Year
No wheeze
Discontinued
Continued
New-onset
70
75
80
85
90
Birth Year No wheeze Discontinued Continued New-onset
1983 (N=669) 494 (73.8%) 88 (13.2%) 59 (8.8%) 28 (4.2%)
1988 (N=600) 470 (78.3%) 61 (10.2%) 51 (8.5%) 18 (3.0%)
1992 (N=968) 788 (81.4%) 91 (9.4%) 56 (5.8%) 33 (3.4%)
1995 (N=1021) 879 (86.1%) 64 (6.3%) 32 (3.1%) 46 (4.5%)
p-value for trend* .000 .000 .000 .554
Figure 3.2: Absolute numbers (N) and proportions (%) of children in different wheeze categories, and trends over birth year groups. *linear-by-linear association.
Medication use
Among children with reported wheeze symptoms, medication use was more prevalent than
among children without symptoms (Table 3.4; Medication use). The interaction terms of birth
year and medication use at T1 or T2 were not statistically significant for any of the wheeze
categories (Table 3.4; Medication use*Birth year).

4242
Chapter 3
33
In all wheeze categories, medication use was consistently associated with having wheeze
symptoms (Table 3.4; Medication use). Odds Ratios (ORs) for medication use were higher than 1
when children experienced wheeze symptoms, and lower than 1 when children were symptom-
free. To illustrate: in children with discontinued wheeze, the OR for medication use at T1 (when
experiencing symptoms) was 5.1 (95% CI: 3.6 to 7.2) and at T2 (non-symptomatic) it was 0.3
(95% CI: 0.2 to 0.5). In children with continued wheeze (thus experiencing symptoms at both
T1 and T2), the ORs were 5.9 (95% CI: 3.9 to 8.9) at T1 and 14.8 (95% CI: 9.9 to 22.2) at T2.
Table 3.4: Medication use in different wheeze categories, the association with wheeze symptoms#, and interaction of medication use and birth year*
Medication use Medication use * Birth year
T1 (5-6y) T2 (8-11y) T1 * Birth year T2 * Birth year
No wheezeN (%)OR (95% C.I.)
100 (5.7%)0.2 (0.1-0.2)
60 (3.5%)0.1 (0.1-0.2)
-0.9 (0.6-1.2)
-1.4 (0.9-2.2)
DiscontinuedN (%)OR (95% C.I.)
69 (29.1%)5.1 (3.6-7.2)
16 (6.8%)0.3 (0.8-0.5)
-1.2 (0.8-1.7)
-0.8 (0.4-1.6)
ContinuedN (%)OR (95% C.I.)
85 (53.5%)5.9 (3.9-8.8)
96 (58.9%)14.8 (9.9-22.2)
-1.2 (0.7-1.8)
-0.9 (0.6-1.4)
New-onsetN (%)OR (95% C.I.)
13 (16.7%)0.5 (0.3-1.0)
35 (44.3%)11.7 (7.0-19.7)
-1.5 (0.7-3.3)
-0.9 (0.5-1.6)
Use of medication for the airways at different ages (T1 and T2) and over different wheeze categories is reported as N (%). The association of medication use with wheeze symptoms and the interaction of medication use with birth year is adjusted for birth year and gender and reported as Odds Ratio (OR) with 95% Confidence Intervals (C.I.). Bold font indicates significance at p<0.05.# The reference category for each wheeze category is the other three categories combined*Birth year groups 1983, 1988, and 1992 were included in logistic regression analysis (N=2275). Of these, children for whom data were missing on recent wheeze (N=20) or medication use (N=62) were excluded from analysis.
Discussion
This study showed that between 1989 and 2005 the proportion of Dutch schoolchildren with
‘discontinued’ and ‘continued’ wheeze decreased, whereas the proportion of children with ‘no
wheeze’ increased in the same period. Our analyses further revealed that medication use was
consistently associated with having wheeze symptoms, but this association did not change over
time. We therefore conclude that medication use cannot explain the declining trends in wheeze
symptoms, suggesting that wheeze prevalence is truly declining in the Netherlands.
Our conclusion is supported by the fact that there appears to be a shift over time from children with
‘discontinued’ and ‘continued’ wheeze to the group of children with ‘no wheeze’. Hypothetically,
if medication use would explain declining trends in wheeze, we would expect to observe a shift

4343
Wheeze trends and medication use
33
from children with ‘continued’ wheeze to the group of children with ‘discontinued’ wheeze (i.e.
children whose asthma is better controlled as they grow older).
Wheeze prevalence varies greatly across countries. Compared with other countries, the
Netherlands shows relatively high prevalence rates of recent wheeze. Besides the Netherlands,
also other countries have reported decreasing trends in childhood wheeze and asthma.16,17 In
Phase III of the International Study of Asthma and Allergies in Childhood, it was found that
wheeze prevalence increased predominantly in countries where prevalence was initially low,
while prevalence decreased mainly in English speaking and Western European countries.18 The
observed decreasing trends in our study are in line with these findings.
There is an ongoing debate about whether these declining trends reflect a true decline in asthma
incidence (suggesting that a saturation point in the asthma epidemic has been reached)19, or
that changes in health care (such as increased availability of effective treatment) may explain the
observed decline.20 In the Netherlands, prescription of inhaled corticosteroids for the treatment
of childhood asthma was introduced in revised guidelines for pediatric pulmonologists in 199711
and for general practitioners in 1998.12 Since this occurred in the middle of our study period, we
hypothesised that increased use of corticosteroids would (at least partly) explain the observed
declining trend between 1989 and 2005. However, the results of the present study show that
the explanation of increased medication use does not hold for the situation in the Netherlands.
Another remarkable observation is that at the age of 5-6 years, children with ‘continued’ wheeze
were already more likely to use medication for the airways than children with ‘discontinued’
wheeze (53.5% and 29.1% respectively; Table 3.4). This is striking because both groups of
children experienced wheeze symptoms at that age. An explanation may be that children with
‘continued’ and ‘discontinued’ wheeze differ in wheeze severity; ‘continued’ wheezers may
experience more and/or more severe wheeze episodes, for which they are more likely to use
asthma medication at a young age.
The fact that we found decreasing trends in wheeze prevalence does not necessarily mean that
the overall prevalence of (allergic) asthma is declining. It is possible that we observed a decline
in wheeze that is primarily associated with viral infections or with non-atopic triggers such as
environmental tobacco smoke exposure and air pollutants.
Children who are in close contact with other children in early life are more likely to experience
viral wheeze before the age of 3 years, but are less likely to have recurrent wheezing episodes by
the age of 6 years.21 Thus, an increased number of pre-school children attending day care in the
Netherlands could explain decreased prevalence of wheeze episodes during school years. Other
factors that have been linked to asthma, such as atopic predisposition, family size (or: number
of older siblings), damp houses, and pets, are unlikely to have changed or to have changed
unfavourably over time (see also Table 3.3) and are therefore unlikely to explain the decreasing
prevalence trends.

4444
Chapter 3
33
An alternative explanation for the decreasing trend may be found in a decrease in exposure to
environmental tobacco smoke (ETS) at home. As shown in Table 3.3, exposure to ETS at home
seems to have decreased over time in our study population. Another study also showed that the
exposure of Dutch children to environmental tobacco smoke has decreased drastically between
1996 and 200922, and this may have led to a decrease in wheeze prevalence. If true, the observed
decline is primarily a decline in non-atopic wheeze and not in atopic wheeze. The fact that atopic
predisposition in our study population remained stable over time (Table 3.3) suggests that this
may be indeed the case.
Finally, other, unmeasured variables may have contributed to the observed decline in wheeze
prevalence. Environmental changes such as improved outdoor air quality may explain a decrease
in reported wheeze complaints. In the Netherlands, a declining trend of NO2, NOx and PM10 yearly
average concentrations was observed between 1990 and 2006.23 Also, improved management of
respiratory problems early in life may have contributed to less wheeze symptoms in school-aged
children. To our knowledge, preterm birth rates have not dropped in the study area, but improved
management of respiratory complications in preterms may have favourable effects later in life.
This study has some limitations that must be acknowledged. First, the question on medication
use in the questionnaire was not specific for asthma medication, but asked more generally for the
use of ‘medication for the airways’. Therefore, we were not able to distinguish between effects
of specific types of medication. It is possible that within the overall prevalence of medication
use, the ratio of specific vs. non-specific asthma medication, or the ratio of corticosteroids vs.
bronchodilators has changed. Nonetheless, we believe that investigating the isolated effect
of specific types of asthma medication in our study would have resulted in the same findings,
because we found no increase in medication use in non-symptomatic children over time at all.
Second, different reference periods were used in the questionnaire for medication use (past month)
and wheeze symptoms (past 12 months). This may have led to misclassification of children who
did use medication in the past year, but not in the past month. It is possible that parents decide
or doctors advise to temporarily stop the use of asthma medication if the child is the symptom
free. If this ‘pause’ in medication use fell exactly in the month(s) before the questionnaire was
administered, and the child was at that time symptom free for at least 12 months, we may have
incidentally missed children whose asthma medication use effectively controlled their wheeze
symptoms. Assuming that this type of misclassification would be present in all study years, and
that to effectively control symptoms these children would eventually have to start using asthma
medication again, it may have introduced some background noise in our data, but it could
certainly not account for the total decrease in observed wheeze symptoms. Moreover, if this
type of misclassification was present in our dataset, we would expect to observe a shift from
‘continued’ to ‘discontinued’ wheezers, but instead we found a shift to the group without any
reported wheeze symptoms. Third, because we lacked comparable data on medication use for
the most recent birth year group (1995), we were not able to test the association of medication

4545
Wheeze trends and medication use
33
use with wheeze prevalence over the whole study period. However, given the consistent pattern
of medication use in symptomatic children over the first 3 birth year groups, we do not think that
adding the last, most recent, birth year group would have changed our main findings.
Given these limitations, conclusions of the present study should be interpreted with care, and
replication of our analyses with more detailed data on medication use (specific types and duration
of use) is recommended.
The strengths of our study include a long study period (16 years), a standardised way of conducting
the surveys, high response rates, and the use of longitudinal data. It is unlikely that selection bias
has occurred, because of the high response rates and the fact that the proportions of children
with recent wheeze and using medication were largely comparable between the total group of
participating children and the children who were surveyed twice.
In conclusion, the prevalence of wheeze symptoms in Dutch school children has decreased
between 1989 and 2005. Medication use did not explain this decline, but rather followed the
wheeze pattern, suggesting that wheeze prevalence is truly declining in the Netherlands.
4646
Chapter 3
33
References
1. WHO. Fact Sheet Asthma 2011. Available from: http://www.who.int/mediacentre/factsheets/fs307/en/ index.html (accessed August 2011).
2. Taussig LM, Wright AL, Holberg CJ, Halonen M, Morgan WJ, Martinez FD. Tucson Children’s Respiratory Study: 1980 to present. J Allergy Clin Immunol 2003; 111(4): 661-75; quiz 76.
3. Lai CK, Beasley R, Crane J, Foliaki S, Shah J, Weiland S. Global variation in the prevalence and severity of asthma symptoms: phase three of the International Study of Asthma and Allergies in Childhood (ISAAC). Thorax 2009; 64(6): 476-83.
4. Asher MI, Montefort S, Bjorksten B, et al. Worldwide time trends in the prevalence of symptoms of asthma, allergic rhinoconjunctivitis, and eczema in childhood: ISAAC Phases One and Three repeat multicountry cross-sectional surveys. Lancet 2006; 368(9537): 733-43.
5. Anandan C, Nurmatov U, van Schayck OC, Sheikh A. Is the prevalence of asthma declining? Systematic review of epidemiological studies. Allergy 2010; 65(2): 152-67.
6. Mommers M, Gielkens-Sijstermans C, Swaen GM, van Schayck CP. Trends in the prevalence of respiratory symptoms and treatment in Dutch children over a 12 year period: results of the fourth consecutive survey. Thorax 2005; 60(2): 97-9.
7. van Schayck CP, Smit HA. The prevalence of asthma in children: a reversing trend. Eur Respir J 2005; 26(4): 647-50.
8. von Hertzen L, Haahtela T. Signs of reversing trends in prevalence of asthma. Allergy 2005; 60(3): 283-92.
9. Strunk RC, Sternberg AL, Szefler SJ, Zeiger RS, Bender B, Tonascia J. Long-term budesonide or nedocromil treatment, once discontinued, does not alter the course of mild to moderate asthma in children and adolescents. J Pediatr 2009; 154(5): 682-7.
10. Waalkens HJ, Van Essen Zandvliet EE, Hughes MD, et al. Cessation of long-term treatment with inhaled corticosteroid (budesonide) in children with asthma results in deterioration. The Dutch CNSLD Study Group. Am Rev Respir Dis 1993; 148(5): 1252-7.
11. Hoekstra MO. [Treatment of asthma in children; revised guidelines by pediatric pneumologists. Section of Pediatric Lung Diseases of the Dutch Association of Pediatric Medicine]. Ned Tijdschr Geneeskd 1997; 141(46): 2223-9.
12. Dirksen W, Geijer R, de Haan M, de Koning G, Flikweert S, Kolnaar B. [Dutch College of General Practitioners (NHG): Practice Guideline Asthma in Children (first revision)]. Huisarts en Wetenschap 1998; 41(3): 130-43.
13. Mommers M, Derkx R, Swaen G, van Schayck O. Changing prevalence of respiratory symptoms and treatment in Dutch school children: 1989-1997. Primary Care Respiratory Journal 2002; 11(2): 38-41.
14. Verkerk P, Rijcken B. Evaluatie van een vragenlijst naar respiratoire symptomen en de maatschappelijke gevolgen hiervan in een open populatie [Evaluation of a respiratory symptoms questionnaire and its social implications in an open population]. T Soc Gezondheidsz 1988; 66: 102-5.
15. Asher MI, Keil U, Anderson HR, et al. International Study of Asthma and Allergies in Childhood (ISAAC): rationale and methods. Eur Respir J 1995; 8(3): 483-91.
16. Toelle BG, Ng K, Belousova E, Salome CM, Peat JK, Marks GB. Prevalence of asthma and allergy in schoolchildren in Belmont, Australia: three cross sectional surveys over 20 years. BMJ 2004; 328(7436): 386-7.
17. Grize L, Gassner M, Wüthrich B, et al. Trends in prevalence of asthma, allergic rhinitis and atopic dermatitis in 5–7-year old Swiss children from 1992 to 2001. Allergy 2006; 61(5): 556-62.
18. Pearce N, Ait Khaled N, Beasley R, et al. Worldwide trends in the prevalence of asthma symptoms: phase III of the International Study of Asthma and Allergies in Childhood (ISAAC). Thorax 2007; 62(9): 758-66.
4747
Wheeze trends and medication use
33
19. Pearce N, Douwes J. Commentary: asthma time trends--mission accomplished? Int J Epidemiol 2005; 34(5): 1018-9.
20. Chinn S, Jarvis D, Burney P, et al. Increase in diagnosed asthma but not in symptoms in the European Community Respiratory Health Survey. Thorax 2004; 59(8): 646-51.
21. Svanes C, Jarvis D, Chinn S, Omenaas E, Gulsvik A, Burney P. Early exposure to children in family and day care as related to adult asthma and hay fever: results from the European Community Respiratory Health Survey. Thorax 2002; 57(11): 945-50.
22. Crone MR, Nagelhout GE, van den Burg I, Hirasing RA. Meeroken door kinderen in Nederland sinds 1996 sterk gedaald [Passive smoking in young children in the Netherlands sharply decreased since 1996]. Ned Tijdschr Geneeskd 2010; 154(50): A1658.
23. Beijk R. [Year overview Air Quality 2003-2006]. Bilthoven, the Netherlands: RIVM (National Institute for Public Health and the Environment), 2007.

48

Chapter 4Asthma and Overweight in Dutch schoolchildren with diverging prevalence trends (1993-2010)
Chapter 3
de Korte-de Boer D, Mommers M, Gielkens-Sijstermans CML, Creemers HMH, Mujakovic S, Feron FJM, van Schayck CP
Submitted
Chapter 4Asthma and Overweight in Dutch schoolchildren
with diverging prevalence trends (1993-2010)
de Korte-de Boer D, Mommers M, Gielkens-Sijstermans CML, Creemers HMH, Mujakovic S, Feron FJM, van Schayck CP
Submitted
49

5050
Chapter 4
44
Abstract
Worldwide, childhood overweight and asthma prevalence have been increasing in parallel. We
examined the association of overweight with wheeze and asthma in Dutch school children among
whom wheeze prevalence decreased and overweight prevalence continues to increase.
In five cross-sectional surveys between 1993 and 2010, with 3491, 4776, 3394, 2927, and 733
participants respectively, wheeze and asthma were determined with questionnaires and weight
and height were measured during routine physical examinations of 4-11 year old children. For
efficiency, a nested case-control approach (1:4 ratio) was applied. Multivariable logistic regression
models with wheeze or asthma (cases) as outcome and BMI-SDS (body mass index, standardized
for age and sex) as determinant were adjusted for survey year, sex, and age. In total, 7017
participants were included for analyses. BMI-SDS was associated with wheeze (adjusted Odds
Ratio 1.09 and 95% Confidence Interval 1.03-1.16) and asthma (aOR 1.12 (1.00-1.27)), and no
differences were observed after stratification by survey year, sex, or age.
In conclusion, in a population with diverging prevalence trends overweight and wheeze/asthma
are associated in individuals. Many interacting factors ultimately determine prevalence trends,
but with a more recent stabilization in wheeze and continuing increases in overweight, in time,
wheeze/asthma may start to increase again.

5151
Asthma and overweight trends
44
Introduction
Over the past decades, the prevalence of both asthma and overweight in children has increased
worldwide.1,2 An association of overweight with asthma has been found in cross-sectional3
and longitudinal studies,4 but the nature of the association remains unclear. Proposed causal
pathways from overweight to asthma include: systemic inflammation, mechanical changes
associated with high body weight, changes in airway hyperresponsiveness, decreased physical
activity, and changes in diet.5,6 However, in studies among preschool7 and school children8 in the
UK and New-Zealand9 increasing prevalence trends of wheeze and asthma were not explained
by increased body mass index (BMI). Rather, the association between overweight and asthma
appears to be of recent origin:10 associations were found in surveys after 1990 but not before,7-9
contradicting a direct causal link. Since these studies were based on only two time points, and
the latest surveys were conducted in 1994, 1998, and 2000, respectively, an update with more
recent data is of interest.
In contrast to prevalence trends in most countries, in our repeated cross-sectional survey a
decreasing trend in wheeze was found among school children in the Netherlands between 1989
and 2001,11 and no further decrease in wheeze or asthma until 2010.12 With more recent data
from more time points available (5 surveys between 1993 and 2010), we aimed to examine
whether BMI was associated with wheeze and asthma, and whether this association changed
over time.
Methods
Study population
Data were obtained from repeated cross-sectional surveys in the ‘Westelijke Mijnstreek’, a region in
the southeast of the Netherlands. In 2010, the sixth consecutive survey was conducted. Identical
surveys were performed in 1989, 1993, 1997, 2001, and 2005, details of which were reported
previously.11,13,14 In brief, all children living in the study area who are either 4-7 years of age or 8-11
years of age are eligible for a routine physical examination at the Child and Youth Health Care
department of the regional Public Health Service. In survey years, parents of eligible children were
asked to complete a questionnaire on respiratory symptoms. From 2001 onwards, additionally a
question on asthma diagnosis was asked. While up to 2005 questionnaires were sent to all invited
children, for logistic reasons, in 2010 questionnaires were distributed to only a random half of
children in the oldest age group, resulting in a lower absolute number of participating children
of only one age group.

5252
Chapter 4
44
Questionnaires
In surveys until 1997, a validated Dutch questionnaire (‘Regio-lijst’)15 was used. From 2001
onwards, the Dutch translation of the internationally validated ISAAC-questionnaire16 was used.
The questions on recent wheeze in both questionnaires were identical (“Has your child had
wheezing or whistling in the chest in the last 12 months?”). A child was considered to have
recent wheeze if ‘yes’ was answered to this question. In the ISAAC questionnaire, a question on
asthma diagnosis was asked: “Did a physician ever diagnose your child with asthma?”. A child
was considered to have recent asthma if both a physician’s diagnosis of asthma and wheeze in
the past year were reported.
Anthropometrics
During each physical examination visit, a nurse assistant measured the child’s height and weight
in a standardised way. Measurement data were registered in either a paper file (1989-2001) or a
digital file (2005-2010).
Body mass index (BMI) was calculated with data of the measurement conducted closest to
completing the survey questionnaire, by dividing weight (in kg) by squared height (in m). Standard
deviation scores (SDS) for BMI were calculated using the Dutch growth reference, standardised
for age at measurement and sex.17 Furthermore, we categorised BMI-SDS into 4 categories:
underweight (BMI-SDS < -2), normal weight (BMI-SDS ≥ -2 and < +1), overweight (BMI-SDS
≥ +1 and < +2), and obese (BMI-SDS ≥ +2). These cut-off points are equivalent to a BMI at 19
years of 17 kg/m2 (underweight), 25 kg/m2 (overweight), and 30 kg/m2 (obese).18 Anthropometric
data could only be retrieved if sufficient identifying variables (full name and date of birth) were
available. Because full names were not available for the 1989 survey, this entire survey was left
out of the analyses. Ethical clearance for linking anthropometric data to questionnaires data in
a non-anonymous manner was ensured within the legal obligation of the Public Health Service
South Limburg to monitor and analyse the health status of the population.
Case-control selection
For the surveys 1993-2001, anthropometric data had to be retrieved by hand from paper files.
For efficiency, we identified all children with recent wheeze (cases), and for each case 4 controls
matched on age group. Controls were randomly selected from all children without reported
wheeze symptoms per survey year and age group by using the random sampling option in SPSS.
Only for this selection anthropometric data was searched. For the 2005 and 2010 surveys, selection
of cases and controls in a 1:4 ratio was made after linkage to the digital anthropometrics data
file. Children with missing data on identifying variables were left out the case/control selection.
Children whose anthropometric data was unavailable were left out of the analyses.
Statistical analyses
We performed univariable and multivariable logistic regression models with wheeze (y/n) or

5353
Asthma and overweight trends
44
asthma (y/n) as outcome variables. BMI-SDS (linear) and BMI categories were used as dependent
variables in separate analyses. Univariable models with BMI-SDS were performed for each survey,
age, and sex group separately. In multivariable models we adjusted for year of survey, sex, and
age group. To test whether the time trends were modified by BMI, we included an interaction
term (BMI-SDS*year of survey) in additional models. All data were analysed with SPSS version
22.0. A p-value of <0.05 was considered statistically significant.
Results
Study population
In all surveys, high response rates (~90%) were achieved, with 3491, 4776, 3394, 2927, and
733 participants in the respective surveys. Wheeze prevalence decreased from 17.3% in 1993 to
5.7% in 2010, the prevalence of asthma was 4.4% in 2001, 4.6% in 2005, and 3.5% in 2010
(Figure 4.1).
0
5
10
15
20
25
30
1993 1997 2001 2005 2010
Prev
alen
ce (
%)
Survey Year
Wheeze
Asthma
Overweight
Obesity
Figure 4.1: Prevalence of wheeze, asthma, overweight, and obesity in the respective surveys (overweight and obesity only in the selection of cases and controls included in the analyses)
The upper part of Table 4.1 shows the age and sex distribution of all children participating in
the surveys, as well as the prevalence of wheeze and asthma. From the 1993, 1997, and 2001
surveys, a total of 1543 cases were identified and 6129 controls were randomly selected (Table
4.1, middle part). In total, questionnaire data and anthropometric data were complete for 5737
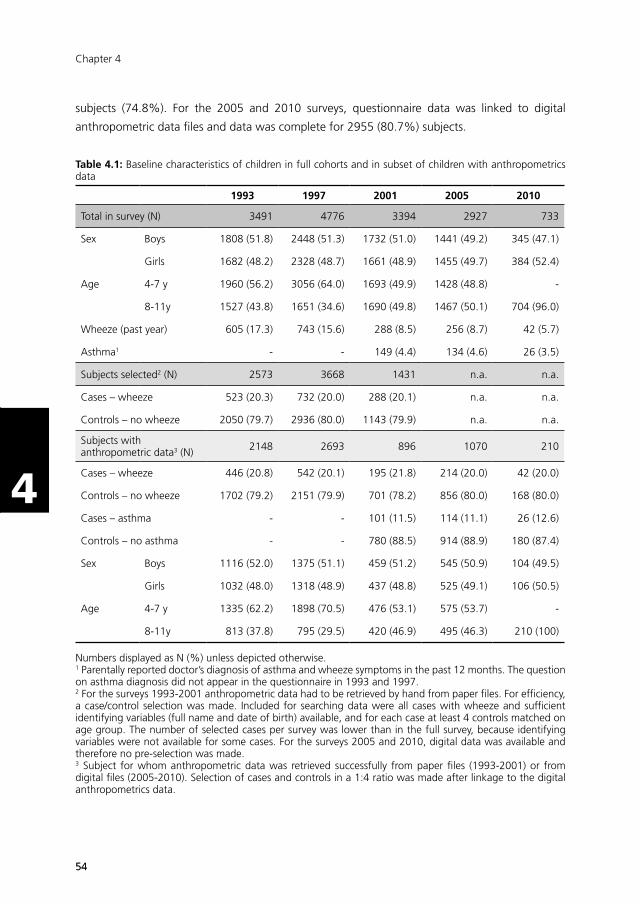
5454
Chapter 4
44
subjects (74.8%). For the 2005 and 2010 surveys, questionnaire data was linked to digital
anthropometric data files and data was complete for 2955 (80.7%) subjects.
Table 4.1: Baseline characteristics of children in full cohorts and in subset of children with anthropometrics data
1993 1997 2001 2005 2010
Total in survey (N) 3491 4776 3394 2927 733
Sex Boys 1808 (51.8) 2448 (51.3) 1732 (51.0) 1441 (49.2) 345 (47.1)
Girls 1682 (48.2) 2328 (48.7) 1661 (48.9) 1455 (49.7) 384 (52.4)
Age 4-7 y 1960 (56.2) 3056 (64.0) 1693 (49.9) 1428 (48.8) -
8-11y 1527 (43.8) 1651 (34.6) 1690 (49.8) 1467 (50.1) 704 (96.0)
Wheeze (past year) 605 (17.3) 743 (15.6) 288 (8.5) 256 (8.7) 42 (5.7)
Asthma1 - - 149 (4.4) 134 (4.6) 26 (3.5)
Subjects selected2 (N) 2573 3668 1431 n.a. n.a.
Cases – wheeze 523 (20.3) 732 (20.0) 288 (20.1) n.a. n.a.
Controls – no wheeze 2050 (79.7) 2936 (80.0) 1143 (79.9) n.a. n.a.
Subjects with anthropometric data3 (N) 2148 2693 896 1070 210
Cases – wheeze 446 (20.8) 542 (20.1) 195 (21.8) 214 (20.0) 42 (20.0)
Controls – no wheeze 1702 (79.2) 2151 (79.9) 701 (78.2) 856 (80.0) 168 (80.0)
Cases – asthma - - 101 (11.5) 114 (11.1) 26 (12.6)
Controls – no asthma - - 780 (88.5) 914 (88.9) 180 (87.4)
Sex Boys 1116 (52.0) 1375 (51.1) 459 (51.2) 545 (50.9) 104 (49.5)
Girls 1032 (48.0) 1318 (48.9) 437 (48.8) 525 (49.1) 106 (50.5)
Age 4-7 y 1335 (62.2) 1898 (70.5) 476 (53.1) 575 (53.7) -
8-11y 813 (37.8) 795 (29.5) 420 (46.9) 495 (46.3) 210 (100)
Numbers displayed as N (%) unless depicted otherwise. 1 Parentally reported doctor’s diagnosis of asthma and wheeze symptoms in the past 12 months. The question on asthma diagnosis did not appear in the questionnaire in 1993 and 1997.2 For the surveys 1993-2001 anthropometric data had to be retrieved by hand from paper files. For efficiency, a case/control selection was made. Included for searching data were all cases with wheeze and sufficient identifying variables (full name and date of birth) available, and for each case at least 4 controls matched on age group. The number of selected cases per survey was lower than in the full survey, because identifying variables were not available for some cases. For the surveys 2005 and 2010, digital data was available and therefore no pre-selection was made. 3 Subject for whom anthropometric data was retrieved successfully from paper files (1993-2001) or from digital files (2005-2010). Selection of cases and controls in a 1:4 ratio was made after linkage to the digital anthropometrics data.

5555
Asthma and overweight trends
44
The likelihood of retrieving anthropometric data was non-differential for cases and controls and
boys and girls, but differed per survey year. In total, 7017 participants were included in the
analyses. The lower part of Table 4.1 shows the age and sex distribution of subjects who were
in the analyses. The distribution of sex in the case-control study remained comparable to the
distribution in the full surveys. The distribution of the age groups changed because of higher
wheeze prevalence in the younger age group, resulting in more cases and controls selected from
the younger age group.
Overweight and obesity were more prevalent among children in more recent surveys (Figure
4.1). There were no large differences between boys and girls, but overweight and obesity were
consistently more prevalent in cases than in controls (Figure 4.2).
2.8$
82.7$
11.3$
3.2$3.3$
84.5$
9.7$
2.5$
Underweight$ Normal$weight$ Overweight$ Obese$
Wheeze%&%all%ages%
2.6$
75.1$
16.3$
6.0$4.1$
79.2$
13.0$
3.7$
Underweight$ Normal$weight$ Overweight$ Obese$
Asthma'('all'ages'
2.9$
86.5$
8.5$
2.2$3.3$
88.0$
7.0$
1.7$
Underweight$ Normal$weight$ Overweight$ Obese$
Wheeze%&%4&7%years%
1.0$
81.6$
13.6$
3.9$4.0$
85.5$
8.1$
2.3$
Underweight$ Normal$weight$ Overweight$ Obese$
Asthma'('4(7'years'
2.6$
76.6$
16.0$
4.8$3.2$
79.1$
14.0$
3.6$
Underweight$ Normal$weight$ Overweight$ Obese$
Wheeze%&%8&11%years%
3.8$
70.0$ 18.5$
7.7$4.2$
73.3$
17.5$
5.0$
Underweight$ Normal$weight$ Overweight$ Obese$
Asthma'('8(11'years'
2.8$
82.7$
11.3$
3.2$3.3$
84.5$
9.7$
2.5$
Underweight$ Normal$weight$ Overweight$ Obese$
Wheeze%&%all%ages%
Cases$
Controls$
Figure 4.2: Proportion (%) of cases with wheeze (left) or asthma (right) and their controls with underweight, normal weight, overweight and obesity
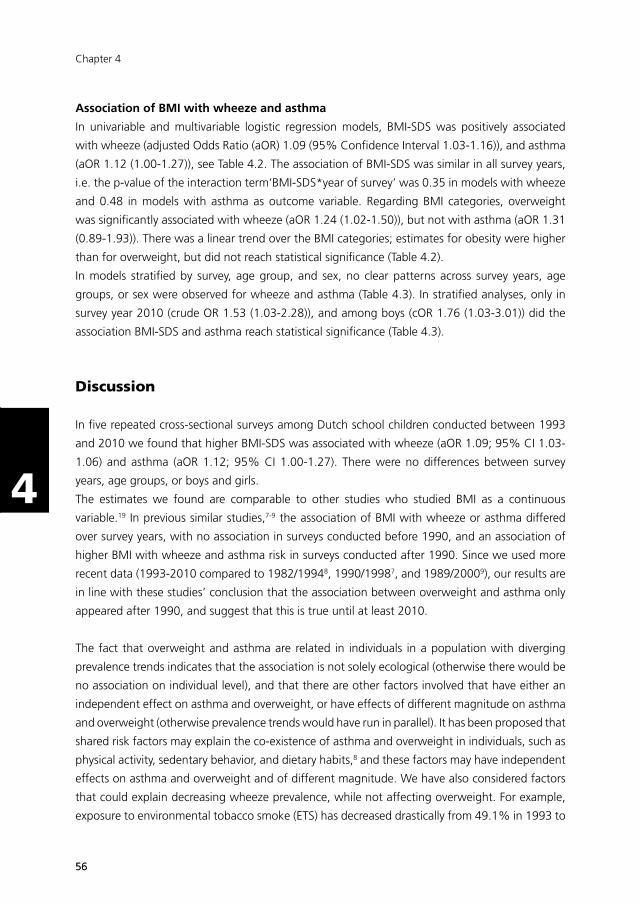
5656
Chapter 4
44
Association of BMI with wheeze and asthma
In univariable and multivariable logistic regression models, BMI-SDS was positively associated
with wheeze (adjusted Odds Ratio (aOR) 1.09 (95% Confidence Interval 1.03-1.16)), and asthma
(aOR 1.12 (1.00-1.27)), see Table 4.2. The association of BMI-SDS was similar in all survey years,
i.e. the p-value of the interaction term‘BMI-SDS*year of survey’ was 0.35 in models with wheeze
and 0.48 in models with asthma as outcome variable. Regarding BMI categories, overweight
was significantly associated with wheeze (aOR 1.24 (1.02-1.50)), but not with asthma (aOR 1.31
(0.89-1.93)). There was a linear trend over the BMI categories; estimates for obesity were higher
than for overweight, but did not reach statistical significance (Table 4.2).
In models stratified by survey, age group, and sex, no clear patterns across survey years, age
groups, or sex were observed for wheeze and asthma (Table 4.3). In stratified analyses, only in
survey year 2010 (crude OR 1.53 (1.03-2.28)), and among boys (cOR 1.76 (1.03-3.01)) did the
association BMI-SDS and asthma reach statistical significance (Table 4.3).
Discussion
In five repeated cross-sectional surveys among Dutch school children conducted between 1993
and 2010 we found that higher BMI-SDS was associated with wheeze (aOR 1.09; 95% CI 1.03-
1.06) and asthma (aOR 1.12; 95% CI 1.00-1.27). There were no differences between survey
years, age groups, or boys and girls.
The estimates we found are comparable to other studies who studied BMI as a continuous
variable.19 In previous similar studies,7-9 the association of BMI with wheeze or asthma differed
over survey years, with no association in surveys conducted before 1990, and an association of
higher BMI with wheeze and asthma risk in surveys conducted after 1990. Since we used more
recent data (1993-2010 compared to 1982/19948, 1990/19987, and 1989/20009), our results are
in line with these studies’ conclusion that the association between overweight and asthma only
appeared after 1990, and suggest that this is true until at least 2010.
The fact that overweight and asthma are related in individuals in a population with diverging
prevalence trends indicates that the association is not solely ecological (otherwise there would be
no association on individual level), and that there are other factors involved that have either an
independent effect on asthma and overweight, or have effects of different magnitude on asthma
and overweight (otherwise prevalence trends would have run in parallel). It has been proposed that
shared risk factors may explain the co-existence of asthma and overweight in individuals, such as
physical activity, sedentary behavior, and dietary habits,8 and these factors may have independent
effects on asthma and overweight and of different magnitude. We have also considered factors
that could explain decreasing wheeze prevalence, while not affecting overweight. For example,
exposure to environmental tobacco smoke (ETS) has decreased drastically from 49.1% in 1993 to
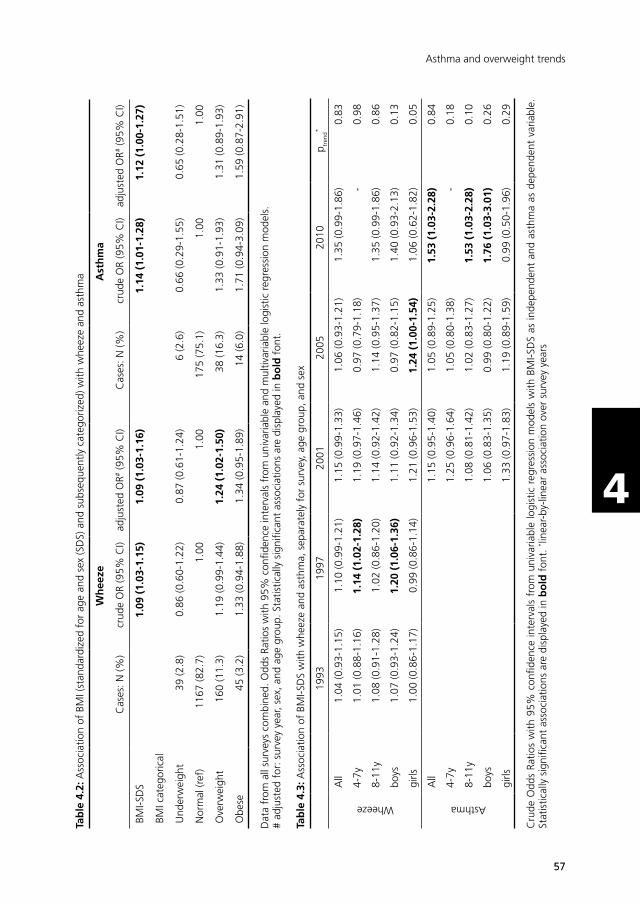
5757
Asthma and overweight trends
44
Tab
le 4
.2: A
ssoc
iatio
n of
BM
I (st
anda
rdiz
ed f
or a
ge a
nd s
ex (S
DS)
and
sub
sequ
ently
cat
egor
ized
) with
whe
eze
and
asth
ma
Wh
eeze
Ast
hm
a
Cas
es: N
(%)
crud
e O
R (9
5% C
I)ad
just
ed O
R# (9
5% C
I)C
ases
: N (%
)cr
ude
OR
(95%
CI)
adju
sted
OR#
(95%
CI)
BMI-S
DS
1.09
(1.
03-1
.15)
1.09
(1.
03-1
.16)
1.14
(1.
01-1
.28)
1.12
(1.
00-1
.27)
BMI c
ateg
oric
al
Und
erw
eigh
t39
(2.8
)0.
86 (0
.60-
1.22
)0.
87 (0
.61-
1.24
)6
(2.6
)0.
66 (0
.29-
1.55
)0.
65 (0
.28-
1.51
)
Nor
mal
(ref
)11
67 (8
2.7)
1.00
1.00
175
(75.
1)1.
001.
00
Ove
rwei
ght
160
(11.
3)1.
19 (0
.99-
1.44
)1.
24 (
1.02
-1.5
0)38
(16.
3)1.
33 (0
.91-
1.93
)1.
31 (0
.89-
1.93
)
Obe
se45
(3.2
)1.
33 (0
.94-
1.88
)1.
34 (0
.95-
1.89
)14
(6.0
)1.
71 (0
.94-
3.09
)1.
59 (0
.87-
2.91
)
Dat
a fr
om a
ll su
rvey
s co
mbi
ned.
Odd
s Ra
tios
with
95%
con
fiden
ce in
terv
als
from
uni
varia
ble
and
mul
tivar
iabl
e lo
gist
ic r
egre
ssio
n m
odel
s.
# ad
just
ed f
or: s
urve
y ye
ar, s
ex, a
nd a
ge g
roup
. Sta
tistic
ally
sig
nific
ant
asso
ciat
ions
are
dis
play
ed in
bo
ld f
ont.
Tab
le 4
.3: A
ssoc
iatio
n of
BM
I-SD
S w
ith w
heez
e an
d as
thm
a, s
epar
atel
y fo
r su
rvey
, age
gro
up, a
nd s
ex
1993
1997
2001
2005
2010
p tren
d*
Wheeze
All
1.04
(0.9
3-1.
15)
1.10
(0.9
9-1.
21)
1.15
(0.9
9-1.
33)
1.06
(0.9
3-1.
21)
1.35
(0.9
9-1.
86)
0.83
4-7y
1.01
(0.8
8-1.
16)
1.14
(1.
02-1
.28)
1.19
(0.9
7-1.
46)
0.97
(0.7
9-1.
18)
-0.
98
8-11
y1.
08 (0
.91-
1.28
)1.
02 (0
.86-
1.20
)1.
14 (0
.92-
1.42
)1.
14 (0
.95-
1.37
)1.
35 (0
.99-
1.86
)0.
86
boys
1.07
(0.9
3-1.
24)
1.20
(1.
06-1
.36)
1.11
(0.9
2-1.
34)
0.97
(0.8
2-1.
15)
1.40
(0.9
3-2.
13)
0.13
girls
1.00
(0.8
6-1.
17)
0.99
(0.8
6-1.
14)
1.21
(0.9
6-1.
53)
1.24
(1.
00-1
.54)
1.06
(0.6
2-1.
82)
0.05
Asthma
All
1.15
(0.9
5-1.
40)
1.05
(0.8
9-1.
25)
1.53
(1.
03-2
.28)
0.84
4-7y
1.25
(0.9
6-1.
64)
1.05
(0.8
0-1.
38)
-0.
18
8-11
y1.
08 (0
.81-
1.42
)1.
02 (0
.83-
1.27
)1.
53 (
1.03
-2.2
8)0.
10
boys
1.06
(0.8
3-1.
35)
0.99
(0.8
0-1.
22)
1.76
(1.
03-3
.01)
0.26
girls
1.33
(0.9
7-1.
83)
1.19
(0.8
9-1.
59)
0.99
(0.5
0-1.
96)
0.29
Cru
de O
dds
Ratio
s w
ith 9
5% c
onfid
ence
inte
rval
s fr
om u
niva
riabl
e lo
gist
ic r
egre
ssio
n m
odel
s w
ith B
MI-S
DS
as in
depe
nden
t an
d as
thm
a as
dep
ende
nt v
aria
ble.
St
atis
tical
ly s
igni
fican
t as
soci
atio
ns a
re d
ispl
ayed
in b
old
fon
t. * li
near
-by-
linea
r as
soci
atio
n ov
er s
urve
y ye
ars
5858
Chapter 4
44
13.9% in 2010 in our study population, and was associated with wheeze in our surveys (OR 1.24;
95% CI 1.09-1.41), which may explain the observed decrease in wheeze.
However, ETS exposure was also associated with higher BMI-SDS in our population (Beta
0.13; 95% CI 0.07-0.18), possibly because these children were already exposed to tobacco
smoke during pregnancy, which may have its effect on birth weight, subsequent growth, and
the development of overweight, or because ETS exposure nowadays indicates a lower socio-
economic status, with associated poorer diet and lower physical activity levels. However, adding
ETS to the multivariable models did not change the association of BMI-SDS with wheeze, and
the interaction term ETS*BMI-SDS was not statistically significant. A stronger effect of dietary
and physical activity factors on overweight may explain why the decrease in ETS exposure did
not translate into a decreasing trend in overweight and obesity. Remarkably, the estimates of
the association of ETS and overweight with wheeze are of the same magnitude (both an OR
of 1.24). A more profound decrease in ETS exposure (from 49.1% to 13.9%) than the increase
in overweight (from 10.0% to 25.4%) over time, may explain why wheeze prevalence was still
decreasing in our population. The more recent stabilising trend in wheeze and asthma may be the
resultant of these two opposing factors. Foreseeably, if in the future ETS exposure will not further
decrease and overweight will continue to increase, in time, the prevalence of wheeze and asthma
could start to increase again.
Many different factors influence asthma and overweight, but unfortunately we do not have
detailed enough data available to look further into explanatory factors for trends. Further research
into the association between asthma and overweight is needed to unravel potential underlying
mechanisms, and ultimately develop effective prevention and/or intervention strategies for
asthma. Meanwhile, for health care practitioners it is important to be aware of and anticipate to
a higher risk for asthma development in overweight and obese children.
In line with other studies20,21 we found no association of underweight with wheeze or asthma.
Thus, the linear trend over the BMI categories justifies the use of BMI-SDS as linear variable in the
primary analyses. To confirm, in sensitivity analyses we excluded children with underweight, and
this led to similar results. We also repeated our analyses with all subjects of the 2005 and 2010
surveys with available anthropometric data included (instead of cases and controls in a 1:4 ratio),
which resulted in similar associations. This confirmed that our selection of cases and controls
resulted in a representative sample for the entire surveys. Finally, to evaluate comparability with
other populations, we applied widely used international cut-off points for BMI22,23 to define BMI
categories instead of the Dutch reference, and found that this also led to similar results.
It is possible that with decreasing wheeze and asthma prevalence over the years - leading to a
lower absolute number of cases in our study in more recent years - the statistical power to detect
an association decreased, especially for subgroup analyses. In the stratified analyses, indeed the
association of BMI-SDS with wheeze did not reach statistical significance in the individual surveys.
Strengths of the present study include the standardized way of conducting the surveys, the use
5959
Asthma and overweight trends
44
of measured height and weight data, eliminating bias associated with self-reporting of height
and weight (e.g. social desirability bias and recall bias)24, the use of standardized BMI data,
enabling comparison to other populations, a long study period with 5 different time points,
and high response rates. This study is also subject to some limitations. Because the question
on asthma diagnosis only appeared in the questionnaires since 2001, we could only evaluate
associations of BMI with asthma between 2001 and 2010. Furthermore, the 2010 survey was
performed among fewer children, and only of the oldest age group, limiting the number of cases
and the possibility to evaluate associations in younger children in this survey. Selection bias may
have been introduced because anthropometric data was not available for all children, and the
likelihood of finding this data from paper files differentiated over survey years (83.5% in 1993,
73.4% in 1997, and 65.9% in 2001). At the time of data collection, children from earlier birth
years were no longer in active follow-up by Child and Youth Health Care, and their files were
archived. The files of children of more recent birth years who were still in active follow-up were
distributed over several Child and Youth Health Care locations, and were therefore more difficult
to locate. Missingness of anthropometric data was however not associated with the outcome: the
likelihood of finding a file was similar for cases (76.7%) and controls (74.3%). We cannot rule out
the possibility that children with under- or overweight were more likely to be in active follow-up
(and therefore less likely to have their paper file located), and therefore these children may have
been underrepresented in our analyses. Another reason for a missing file may be having moved
out of the study area, which is not likely to be associated with either wheezing or BMI.
In conclusion, overweight and wheeze/asthma are associated in individual school children in the
Netherlands, even in a population with diverging prevalence trends. The nature of the association
remains largely unclear, but with continuing increases in overweight in the population we must
be aware that wheeze and asthma prevalence may start to increase again in the future.
Acknowledgements
The authors wish to thank Peter van Schayck, Nicole Spitters, and Mirjam Wouters for collecting
anthropometric data from the Child and Youth Health Care archive, Rik Mayer and Gabriella
Konings for retrieving anthropometric data from the Child and Health Care digital registry, and all
parents and their children for participating in the ‘Astma Monitor Westelijke Mijnstreek’.

6060
Chapter 4
44
References
1. Anandan C, Nurmatov U, van Schayck OC, Sheikh A. Is the prevalence of asthma declining? Systematic review of epidemiological studies. Allergy 2010; 65(2): 152-67.
2. Wang Y, Lobstein T. Worldwide trends in childhood overweight and obesity. Int J Pediatr Obes 2006; 1(1): 11-25.
3. Chinn S. Obesity and asthma. Paediatr Respir Rev 2006; 7(3): 223-8.
4. Flaherman V, Rutherford GW. A meta-analysis of the effect of high weight on asthma. Arch Dis Child 2006; 91(4): 334-9.
5. Beuther DA. Recent insight into obesity and asthma. Curr Opin Pulm Med 2010; 16(1): 64-70.
6. Sin DD, Sutherland ER. Obesity and the lung: 4. Obesity and asthma. Thorax 2008; 63(11): 1018-23.
7. Goutaki M, Pescatore AM, Singh P, Beardsmore CS, Kuehni CE. Increased prevalence of pre-school wheeze is not explained by time trends in body mass index. Eur Respir J 2014; 44(4): 1078-82.
8. Chinn S, Rona RJ. Can the increase in body mass index explain the rising trend in asthma in children? Thorax 2001; 56(11): 845-50.
9. Wickens K, Barry D, Friezema A, et al. Obesity and asthma in 11-12 year old New Zealand children in 1989 and 2000. Thorax 2005; 60(1): 7-12.
10. Chinn S. Concurrent trends in asthma and obesity. Thorax 2005; 60(1): 3-4.
11. Mommers M, Gielkens-Sijstermans C, Swaen GM, van Schayck CP. Trends in the prevalence of respiratory symptoms and treatment in Dutch children over a 12 year period: results of the fourth consecutive survey. Thorax 2005; 60(2): 97-9.
12. de Korte-de Boer D, Mommers M, Gielkens-Sijstermans C, Creemers HMH, Mujakovic S, Feron FJM. Trends in the prevalence of wheeze, eczema, and hay fever in Dutch schoolchildren between 1989 and 2010. Allergy 2014; 69(Suppl s99): 55.
13. Mommers M, Derkx R, Swaen G, van Schayck O. Changing prevalence of respiratory symptoms and treatment in Dutch school children: 1989-1997. Primary Care Respiratory Journal 2002; 11(2): 38-41.
14. de Korte-de Boer D, Mommers M, Gielkens-Sijstermans CM, Creemers HM, Feron FJ, van Schayck OC. Trends in wheeze in Dutch school children and the role of medication use. Pediatr Pulmonol 2015; 50(7): 665-71.
15. Verkerk P, Rijcken B. Evaluatie van een vragenlijst naar respiratoire symptomen en de maatschappelijke gevolgen hiervan in een open populatie [Evaluation of a respiratory symptoms questionnaire and its social implications in an open population]. T Soc Gezondheidsz 1988; 66: 102-5.
16. Asher MI, Keil U, Anderson HR, et al. International Study of Asthma and Allergies in Childhood (ISAAC): rationale and methods. Eur Respir J 1995; 8(3): 483-91.
17. Fredriks AM, van Buuren S, Burgmeijer RJ, et al. Continuing positive secular growth change in The Netherlands 1955-1997. Pediatr Res 2000; 47(3): 316-23.
18. de Onis M, Onyango AW, Borghi E, Siyam A, Nishida C, Siekmann J. Development of a WHO growth reference for school-aged children and adolescents. Bull World Health Organ 2007; 85(9): 660-7.
19. Papoutsakis C, Priftis KN, Drakouli M, et al. Childhood overweight/obesity and asthma: is there a link? A systematic review of recent epidemiologic evidence. J Acad Nutr Diet 2013; 113(1): 77-105.
20. Baumann S, Lorentz A. Obesity - a promoter of allergy? Int Arch Allergy Immunol 2013; 162(3): 205-13.
21. Mitchell EA, Beasley R, Bjorksten B, Crane J, Garcia Marcos L, Keil U. The association between BMI, vigorous physical activity and television viewing and the risk of symptoms of asthma, rhinoconjunctivitis and eczema in children and adolescents: ISAAC Phase Three. Clin Exp Allergy 2013; 43(1): 73-84.
22. Mebrahtu TF, Feltbower RG, Greenwood DC, Parslow RC. Childhood body mass index and wheezing disorders: a systematic review and meta-analysis. Pediatr Allergy Immunol 2015; 26(1): 62-72.

6161
Asthma and overweight trends
44
23. Cole TJ, Bellizzi MC, Flegal KM, Dietz WH. Establishing a standard definition for child overweight and obesity worldwide: international survey. BMJ 2000; 320(7244): 1240-3.
24. Cole TJ, Flegal KM, Nicholls D, Jackson AA. Body mass index cut offs to define thinness in children and adolescents: international survey. BMJ 2007; 335(7612): 194.
25. Connor-Gorber S, Tremblay M, Moher D, Gorber B. A comparison of direct vs. self-report measures for assessing height, weight and body mass index: a systematic review. Obes Rev 2007; 8(4): 307-26.

62
63
Part II
Early life growth –
LucKi Birth Cohort Study

64

Chapter 5LucKi Birth Cohort Study: rationale and design
Chapter 4Chapter 3
de Korte-de Boer D, Mommers M, Gielkens-Sijstermans CML, Creemers HMH, Mujakovic S, Feron FJM, van Schayck CP
Submitted
Chapter 5LucKi Birth Cohort Study:
rationale and design
de Korte-de Boer D, Mommers M, Creemers HMH, Dompeling E, Feron FJM, Gielkens-Sijstermans CML, Jaminon M,
Mujakovic S, van Schayck CP, Thijs C, Jansen M.
BMC Public HEALTH 2015; 15:934
65
6666
Chapter 5
55
Abstract
Background
Infancy and childhood are characterized by rapid growth and development, which largely
determine health status and well-being across the lifespan. Identification of modifiable risk
factors and prognostic factors in critical periods of life will contribute to the development of
effective prevention and intervention strategies.
The LucKi Birth Cohort Study was designed and started in 2006 to follow children from birth into
adulthood on a wide range of determinants, disorders, and diseases. During preschool and school
years, the primary focus is on the etiology and prognosis of atopic diseases (eczema, asthma, and
hay fever) and overweight/obesity.
Methods/Design
LucKi is an ongoing, dynamic, prospective birth cohort study, embedded in the Child and Youth
Health Care (CYHC) practice of the ‘Westelijke Mijnstreek’ (a region in the southeast of the
Netherlands). Recruitment (1-2 weeks after birth) and follow-up (until 19 years) coincide with
routine CYHC contact moments, during which the child’s physical and psychosocial development
is closely monitored, and anthropometrics are measured repeatedly in a standardised way.
Information gathered through CYHC is complemented with repeated parental questionnaires,
and information from existing registries of pharmacy, hospital and/or general practice. Since the
start already more than 5,000 children were included in LucKi shortly after birth, reaching an
average participation rate of ~65%.
Discussion
The LucKi Birth Cohort Study provides a framework in which children are followed from birth
into adulthood. Embedding LucKi in CYHC simplifies implementation, leads to low maintenance
costs and high participation rates, and facilitates direct implementation of study results into
CYHC practice. Furthermore, LucKi provides opportunities to initiate new (experimental) studies
and/or to establish biobanking in (part of) the cohort, and contributes relevant information on
determinants and health outcomes to policy and decision makers. Cohort details can be found
on www.birthcohorts.net.
6767
LucKi rationale and design
55
Background
Infancy and childhood are characterised by rapid growth and development, and are considered
critical developmental periods in life that strongly contribute to health status, well-being, and
behaviour across the lifespan.1 In fact, many common diseases and challenges in adult life can
be traced back to early childhood.2 Because growth and development in early life are highly
influenced by the child’s environment, identification of modifiable risk factors (e.g. in lifestyle, and
physical and social environment) forms the basis for the development of preventive measures for
childhood and adult diseases.
The LucKi Birth Cohort Study was designed and started in 2006 to follow children from birth into
adulthood. Within LucKi, information on a wide range of determinants and outcomes is gathered
in order to answer etiological questions and to identify prognostic factors and modifiable risk
factors for various childhood and adult diseases and conditions. In time, the LucKi cohort will be
large enough to enable new (intervention) studies within part of the study population. Ultimately,
the LucKi database will contain relevant information on childhood and adulthood well-being,
health and disease that can help researchers, clinicians, and policy makers to develop and
implement prevention and intervention measures.
In preschool and early school age, the primary focus of LucKi is on atopic diseases (eczema,
asthma, and hay fever) and overweight/obesity. Atopic diseases are among the most prevalent
chronic disorders in childhood and their prevalence is still increasing in many developed
countries.3,4 While some children outgrow their complaints with increasing age, others persist to
suffer from atopic diseases into adulthood.5 Also childhood overweight and obesity are becoming
increasingly prevalent chronic disorders in developed societies,6 and increase the risk of long-term
adverse conditions, including cardiovascular, metabolic, pulmonary, and gastrointestinal diseases.7
It is still largely unknown what factors are involved in the etiology and/or are responsible for
the progression of atopic diseases, and there is even less knowledge on how atopic diseases
and overweight/obesity can be prevented or treated. This knowledge is essential for developing
effective prevention and intervention strategies and testing these in a real-life setting. Therefore,
within LucKi, the main objectives are: 1) to estimate the contribution and timing of known risk
factors, and 2) to identify and evaluate new risk factors for atopic diseases and overweight/
obesity. The latter requires add-on modules (e.g. questionnaires, measurements, biosampling) to
the exisiting LucKi infrastructure that specifically target potential new risk factors.
Suffering from atopic diseases, overweight or obesity, or other adverse conditions in childhood,
as well as acquiring certain lifestyle patterns early in life, may have lifelong consequences.
Therefore, in older children and adolescents also other outcomes will be studied, for example
social functioning, and behavioural and mental health conditions.
This paper describes the design of the LucKi Birth Cohort study, presents baseline characteristics
and prevalence of atopic diseases and overweight in part of the study population, and discusses
strengths and limitations of the study.

6868
Chapter 5
55
Methods/Design
Study design
LucKi is an ongoing, dynamic, prospective birth cohort study. Since the start in 2006, newborns
are continuously being included into the study and will be followed prospectively until at least the
age of 19 years. Given the ongoing character of the study, no end date or maximum number of
inclusions has been set. Cohort details can also be found on www.birthcohorts.net.
Figure 5.1: Localisation of the study region ‘Westelijke Mijnstreek’ in the Netherlands
Setting
LucKi is embedded in the Child and Youth Health Care practice of the Westelijke Mijnstreek, in
the Netherlands. The Westelijke Mijnstreek (Figure 5.1) is a region in the Province of Limburg in
the south east of the Netherlands that encompasses four municipalities: Sittard-Geleen, Stein,
Beek, and Schinnen, with a total area of ~150 km2 (~58 square miles). This former coal-mining
region is now characterized by a high building density, a relatively dense transport infrastructure,
and car and chemical industry. These characteristics, further strengthened by adjacent foreign
industrial areas, result in relatively high concentrations of air pollutants, such as nitric oxide and
nitrogen dioxide.8
Due to ageing of the population, the number of inhabitants has been gradually decreasing since
the late 1990s. In 2006 the total population size of the Westelijke Mijnstreek was ~154,000; in
2013 there were ~149,000 inhabitants. The large majority (97%) of inhabitants of the Westelijke
Mijnstreek are of Dutch nationality, but 19% of inhabitants are first or second generation
immigrants. Although these figures are comparable to national average (96% and 21%,
respectively), in the Westelijke Mijnstreek more immigrants originate from western countries
(75%) than from non-western countries (25%), while in the whole of the Netherlands this
ratio is 45% versus 55%. Furthermore, compared to the national average, inhabitants of the
Westelijke Mijnstreek have a slightly lower educational and income level, but unemployment
rates are comparable. Table 5.1 illustrates that the prevalence of certain health and life style

6969
LucKi rationale and design
55
characteristics, such as overweight and obesity and respiratory diseases is relatively high in this
part of the Netherlands.9
Table 5.1: Health and lifestyle characteristics of inhabitants (between 19 and 65 years of age) of the Westelijke Mijnstreek and the whole of the Netherlands
Westelijke Mijnstreek the Netherlands
Perceived health: good/very good 77.7% 80.7%
High blood pressure 14.5% 12.6%
Chronic respiratory complaints 9.5% 7.8%
Diabetes Mellitus 4.6% 3.6%
Never drinks alcohol 15.8% 16.5%
Heavy alcohol use 12.7% 11.6%
Smoker 25.5% 25.5%
Heavy smoker 5.5% 4.7%
Overweight (incl. obese) 48.5% 45.5%
Obese 13.3% 11.8%
Data over the year 2012, standardised for age and sex. Data obtained from regional Public Health Services (GGD), Statistics Netherlands (CBS), and the National Institute for Public Health and the Environment (RIVM).
Dutch Child and Youth Health Care System
Child and Youth Health Care (CYHC) in the Netherlands is obliged by law to promote and protect
the health and physical, cognitive and psychosocial development of children between 0 and
19 years of age, and to carry out the national immunisation program. To achieve these goals,
children are followed prospectively from birth.
All children living in the Netherlands and their parents or caregivers are invited regularly for
a routine physical and developmental check-up. A team consisting of physicians, nurses, and
assistants routinely check the child’s growth and development, and provide parents with requested
and unrequested support and advice. The first contact with CYHC (when the child is 1-2 weeks
old) takes place at home; all other contact moments take place at CYHC-centres. The frequency
of routine contact moments decreases with age (see Table 5.2), but if necessary, children are
invited more often to visit CYHC, e.g. when growth is impaired or there are other concerns.
In case of suspicion of diseases or disorders, the child is referred to a general practitioner or
medical specialist. In general, ~90% of all parents visit CYHC with their children regularly. The last
planned visit takes place when the child is 14 or 15 years old. Children between 16 and 19 years
are only invited for an extra check-up visit if their physical or social development raises concerns.
All relevant information is kept in a personal digital file in the CYHC registry. After the child
reaches the age of 19 years, the file is no longer updated, but is kept for another 15 years in the
registry.
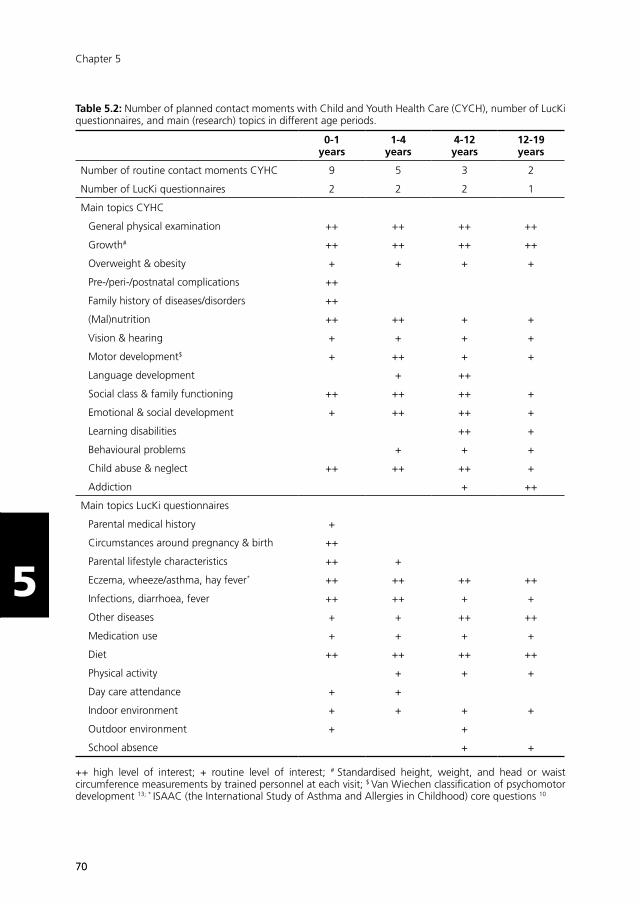
7070
Chapter 5
55
Table 5.2: Number of planned contact moments with Child and Youth Health Care (CYCH), number of LucKi questionnaires, and main (research) topics in different age periods.
0-1 years
1-4 years
4-12 years
12-19 years
Number of routine contact moments CYHC 9 5 3 2
Number of LucKi questionnaires 2 2 2 1
Main topics CYHC
General physical examination ++ ++ ++ ++
Growth# ++ ++ ++ ++
Overweight & obesity + + + +
Pre-/peri-/postnatal complications ++
Family history of diseases/disorders ++
(Mal)nutrition ++ ++ + +
Vision & hearing + + + +
Motor development$ + ++ + +
Language development + ++
Social class & family functioning ++ ++ ++ +
Emotional & social development + ++ ++ +
Learning disabilities ++ +
Behavioural problems + + +
Child abuse & neglect ++ ++ ++ +
Addiction + ++
Main topics LucKi questionnaires
Parental medical history +
Circumstances around pregnancy & birth ++
Parental lifestyle characteristics ++ +
Eczema, wheeze/asthma, hay fever* ++ ++ ++ ++
Infections, diarrhoea, fever ++ ++ + +
Other diseases + + ++ ++
Medication use + + + +
Diet ++ ++ ++ ++
Physical activity + + +
Day care attendance + +
Indoor environment + + + +
Outdoor environment + +
School absence + +
++ high level of interest; + routine level of interest; # Standardised height, weight, and head or waist circumference measurements by trained personnel at each visit; $ Van Wiechen classification of psychomotor development 13; * ISAAC (the International Study of Asthma and Allergies in Childhood) core questions 10

7171
LucKi rationale and design
55
Study population
The study population of the LucKi Birth Cohort study consists of all children born since July 2006
who live in the study area and whose parents agree to participate.
Recruitment
Recruitment of the newborns and their parents takes place during the routine home visit by a
CYHC-nurse, when the baby is 1-2 weeks old. Purposes of this home visit include to get ac-
quainted with the parents and introduce them to CYHC procedures, and to perform the neonatal
heel prick. CYHC receives a notification of an infants’ birth in their region as soon as the parents
have registered the newborn child at the municipal office. This registration is obligatory in the
Netherlands and has to take place within 3 days after birth. Upon notification CYHC contacts
the parents to plan a home visit. Parents receive oral and written information about the purpose
and methods of the study and are invited to participate. If parents agree to participate, they are
asked to sign informed consent for the use of data from the CYHC registry, pharmacy, hospital
and/or general practice.
Parents of children who are not included/invited to participate at birth, but visit CYHC from a later
age onwards (e.g. because they move into the study area), are also invited to participate in LucKi
from the moment they first visit CYHC in the study area.
In- and exclusion criteria
The only inclusion criterion for participating in LucKi is living in the study area. Children whose
parents never visit CYHC are excluded.
Data collection
Data collection takes place through repeated parental questionnaires and is complemented with
information from the CYHC registry, pharmacist, hospital and/or general practitioner, provided
informed consent to do so is given by the parents. The timing of the questionnaires coincides with
routine contact moments in CYHC.
Baseline questionnaire
At baseline (1-2 weeks after birth), parents are asked to complete a questionnaire that includes
questions on parental medical history, parental characteristics and lifestyle, indoor and outdoor
environment, and circumstances during pregnancy and around birth (Table 5.2).
Follow-up questionnaires
When the child is 6/7 months, 14 months, 3 years, and 5/6 years old, parents are asked to
complete a follow-up questionnaire for their child. Further follow-up questionnaires are being
planned for ages 10/11 and 14/15 years. Follow-up questionnaires include questions on atopic
diseases, infections, lifestyle, diet, physical activity, indoor and outdoor environment, medication

7272
Chapter 5
55
use, health care utilisation, and school absence (Table 5.2). Questions on atopic diseases are
based on the validated ISAAC (The International Study of Asthma and Allergies in Childhood)
questionnaire10, a questionnaire that is widely used in (monitor) studies on childhood asthma,
allergic rhinitis, and eczema.
Child and Youth Health Care (CYHC) registry
During the CYHC home-visit at 1-2 weeks of age an individual digital file is set up with information
on parental background (e.g. ethnicity, education, work status, family and medical history) and
circumstances during pregnancy and birth (e.g. pre-pregnancy weight, gestational age at birth,
mode and place of delivery) derived from midwife’s and/or obstetrician’s reports. This file is
complemented with new information after every subsequent visit to CYHC.
At each visit a nurse assistant measures the child’s height and weight in a standardised way.
Weight is measured on a digital baby scale (birth until 18 months, in a lying or sitting position
without clothes) or a digital flat scale (18 months and older, in a standing position wearing only
underpants or diaper). Height is measured using an infantometer (birth until 18 months, in a lying
position) or a microtoise (18 months and older, in a standing position). Scales and microtoise are
calibrated yearly and after translocation.
Other important information that is inquired during CYHC visits and registered in the digital file
includes the child’s nutritional status and physical and psychosocial development (Table 5.2).
Pharmacy, hospital, and general practice registries
If additional information on prescribed medication, doctor’s diagnosis, or treatment for various
conditions and diseases is needed to answer a specific research question, the variables of interest
will be obtained from pharmacy, hospital or general practice registries, provided parents gave
informed consent to do so.
Ethical clearance
The LucKi Birth Cohort Study was approved by the Medical Ethical Committee of Maastricht
University Medical Centre (MEC 09-4-058). LucKi is designed according to the privacy rules that
are stipulated in the Dutch ‘Code of Conduct for Health Research’.11
Preliminary cohort description
Inclusion of newborns and follow-up of LucKi participants is still ongoing. Since the start in 2006,
already more than 5,000 children were included in LucKi shortly after birth, reaching an average
participation rate of ~65%. Most parents completed one or more of the follow-up questionnaires
(>75%), and gave informed consent to use date from other registries (>80%).
Table 5.3 provides baseline characteristics of children that were included in LucKi between July
2006 and December 2011, and presents the prevalence of eczema, wheeze and overweight in
these children.

7373
LucKi rationale and design
55
Table 5.3: Baseline characteristics of LucKi participants born between July 2006 and December 2011
N=4.230
Sex (% male) 50.2%
Gestational age at birth#
<37 weeks37-40 weeks>40 weeks
5.8%70.7%22.9%
Maternal smoking during pregnancy 10.5%
Breastfeeding (exclusive or combined)until age 3 monthsuntil age 6 months
35.4%16.9%
Parental history of atopy§ 57.0%
Number of older siblings#
01>1
43.2%38.3%11.9%
Day care attendance† 55.2%
Pet keeping* 51.4%
Eczema prevalence1
Age 7 monthsAge 14 monthsAge 3 years
14.7%13.3%16.2%
Wheeze prevalence1
Age 7 monthsAge 14 monthsAge 3 years
16.4%18.3%13.0%
Overweight prevalence2
Age 3 years 7.6%
# Due to missing values, percentages do not add up to 100%;§ Defined as mother or father ever having asthma, hay fever, or eczema; † Defined as visiting day care weekly at age 7 months of age; * Defined as ≥1 pets in the home at baseline (1-2 weeks of age); 1 The prevalence of eczema and wheeze is based on parentally reported symptoms through validated ISAAC questionnaires10; 2 The prevalence of overweight was calculated with age- and sex-specific cut-off points for Body Mass Index of a widely used international standard14
Discussion
In this paper we presented the rationale and design of the LucKi Birth Cohort Study. Within LucKi,
children are followed prospectively from birth into adulthood through repeated questionnaires and
routine registries, with, during preschool and school years, a primary focus on the development
of atopic diseases and overweight.
Strengths and limitations
LucKi is entirely embedded in regular Child and Youth Health Care (CYHC) practice and is linked to
other registries, which has certain advantages. First, because recruitment and follow-up coincide
with routine contact moments, high participation and follow-up rates are ensured. Second,

7474
Chapter 5
55
maintenance costs and time investment are relatively low, permitting continuous inclusion of
new participants into LucKi. This results in several (birth year) groups within the cohort, some
of which may serve as study population for future experimental studies. Third, the continuous
character of the study allows us to adapt or supplement the data collection methods according
to new insights in the field or to harmonise with other birth cohort studies. Preferably, LucKi
measurements will be extended with the collection of biomaterial in the future. Fourth, because
information is gathered through different sources, data entries can be cross-checked for a large
number of variables, which strengthens the reliability of the data. And fifth, since CYHC has
direct access to a large number of children and at different ages, study results of LucKi may be
directly implemented into CYHC practice. Other important strengths of LucKi are the longitudinal
design, which allows investigating temporal and causal relationships, and the availability of
repeatedly measured weight and height data. The latter eliminates bias associated with self-
reporting (e.g. social desirability bias and recall bias), which is a well-known limitation in many
population studies on overweight and obesity.12
A limitation to LucKi (as to any observational study) is the possibility of selection in the study
population. Although LucKi reaches relatively high participation rates, a reason for not participa-
ting may be not speaking the Dutch language and therefore not being able to complete the
questionnaires. Also, parents of children who are hospitalised or under intensive pediatric
treatment may not attend the CYHC regularly, and in general, parents of higher socio-economic
status are more likely to participate in such a study. Descriptive data from the regional Public Health
Service will enable comparison of responders and non-responders on several characteristics, the
results of which will be reported in future research papers. Although any selection may affect
estimated prevalence rates, and therefore also the statistical power and generalizability of study
results, it will most likely not bias etiological associations. Furthermore, although CYHC only has
access to the children after birth, information on important prenatal factors are covered in the
baseline questionnaire.
Application of study results
The information gathered by the LucKi Birth Cohort Study is valuable for (child and youth) health
care and public health policy. Because children are studied at specific ages that coincide with
CYHC contact moments, findings from LucKi that can be translated into parental advice or other
preventive measures may directly be incorporated in CYHC protocols and reach a large group of
children and their parents at once. Furthermore, study results on (modifiable) risk factors, disease
prognosis, and medication use may also be relevant for general practitioners and pharmacists.
Moreover, LucKi’s findings may aid policy and decision makers, who need scientific evidence
to develop and implement prevention and intervention strategies. LucKi progressively builds
on a database containing policy relevant information on a broad range of determinants and
health outcomes that may be beneficial to response to current and future public health issues.
Furthermore, LucKi results may contribute to the evidence built up by several international birth
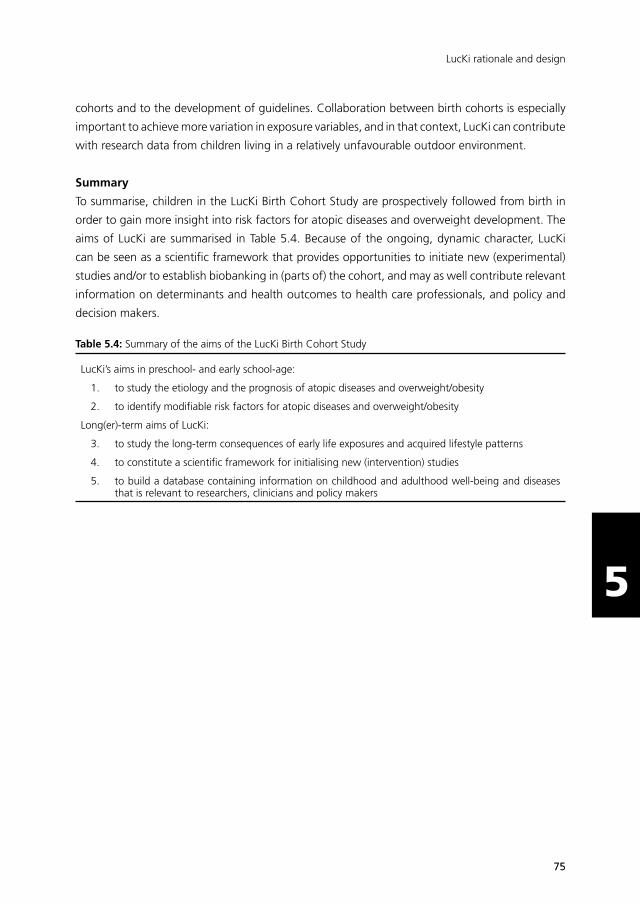
7575
LucKi rationale and design
55
cohorts and to the development of guidelines. Collaboration between birth cohorts is especially
important to achieve more variation in exposure variables, and in that context, LucKi can contribute
with research data from children living in a relatively unfavourable outdoor environment.
Summary
To summarise, children in the LucKi Birth Cohort Study are prospectively followed from birth in
order to gain more insight into risk factors for atopic diseases and overweight development. The
aims of LucKi are summarised in Table 5.4. Because of the ongoing, dynamic character, LucKi
can be seen as a scientific framework that provides opportunities to initiate new (experimental)
studies and/or to establish biobanking in (parts of) the cohort, and may as well contribute relevant
information on determinants and health outcomes to health care professionals, and policy and
decision makers.
Table 5.4: Summary of the aims of the LucKi Birth Cohort Study
LucKi’s aims in preschool- and early school-age:
1. to study the etiology and the prognosis of atopic diseases and overweight/obesity
2. to identify modifiable risk factors for atopic diseases and overweight/obesity
Long(er)-term aims of LucKi:
3. to study the long-term consequences of early life exposures and acquired lifestyle patterns
4. to constitute a scientific framework for initialising new (intervention) studies
5. to build a database containing information on childhood and adulthood well-being and diseases that is relevant to researchers, clinicians and policy makers

7676
Chapter 5
55
References
1. Irwin LG, Siddiqi A, Hertzman C. Early Child Development: a powerful equalizer. Vancouver: World Health Organisation, 2007.
2. WHO. Fact Sheet Early child development. August 2009. Available from: http://www.who.int/mediacentre/factsheets/fs332/ en/index.html.
3. Anandan C, Nurmatov U, van Schayck OC, Sheikh A. Is the prevalence of asthma declining? Systematic review of epidemiological studies. Allergy 2010; 65(2): 152-67.
4. Asher MI, Montefort S, Bjorksten B, et al. Worldwide time trends in the prevalence of symptoms of asthma, allergic rhinoconjunctivitis, and eczema in childhood: ISAAC Phases One and Three repeat multicountry cross-sectional surveys. Lancet 2006; 368(9537): 733-43.
5. Zheng T, Yu J, Oh MH, Zhu Z. The atopic march: progression from atopic dermatitis to allergic rhinitis and asthma. Allergy Asthma Immunol Res 2011; 3(2): 67-73.
6. Wang Y, Lobstein T. Worldwide trends in childhood overweight and obesity. Int J Pediatr Obes 2006; 1(1): 11-25.
7. Daniels SR. The consequences of childhood overweight and obesity. Future Child 2006; 16(1): 47-67.
8. Mooibroek D, Berkhout JP, Hoogerbrugge R. [Year Overview Air Quality 2012]. Bilthoven, the Netherlands: National Institute for Public Health and the Environment (RIVM), 2013.
9. Statistics Netherlands. Statline. The Hague/Heerlen: Statistics Netherlands [Centraal Bureau voor de Statistiek], 2011.
10. Asher MI, Keil U, Anderson HR, et al. International Study of Asthma and Allergies in Childhood (ISAAC): rationale and methods. Eur Respir J 1995; 8(3): 483-91.
11. Federa. Code of Conduct for Health Research. Rotterdam: Foundation Federation of Dutch Medical Scientific Societies, 2004.
12. Connor-Gorber S, Tremblay M, Moher D, Gorber B. A comparison of direct vs. self-report measures for assessing height, weight and body mass index: a systematic review. Obes Rev 2007; 8(4): 307-26.
13. de Angulo L. [Developmental tests in Child and Youth Health Care]. Assen: Van Gorcum, 2005.
14. Cole TJ, Bellizzi MC, Flegal KM, Dietz WH. Establishing a standard definition for child overweight and obesity worldwide: international survey. BMJ 2000; 320(7244): 1240-3.

55
Chapter 6Early life growth and the development of preschool wheeze, independent from overweight
Chapter 4Chapter 3
de Korte-de Boer D, Mommers M, Gielkens-Sijstermans CML, Creemers HMH, Mujakovic S, Feron FJM, van Schayck CP
Submitted
Chapter 6Early life growth and the development of
preschool wheeze, independent from overweight
de Korte-de Boer D, Mommers M, Thijs C, Jaminon M, Jansen M, Mujakovic S, Feron FJM, van Schayck CP
Adapted from: Journal of Pediatrics 2015;166(2):343-349
77

7878
Chapter 6
66
Abstract
Objective
An association between childhood wheezing and overweight has been proposed, but the
underlying (causal) pathways remain unclear. We investigated whether birth weight and postnatal
growth rates are independently related to overweight and wheezing up to age 3 years.
Study Design
Children from the LucKi Birth Cohort Study with complete follow-up for repeated questionnaires
(at ages 0, 7, 14 months and 3 years) and informed consent to use height and weight data
(measured by trained personnel at ages 0, 7, 14 months, 2 and 3 years) were included (N=566).
Wheezing (parentally reported) and overweight (body mass index (BMI) > 85th percentile) were
regressed with Generalised Estimating Equations on birth weight and relative growth rates
(difference standard deviation scores for weight, height and BMI).
Results
Higher birth weight and higher weight and BMI growth rates were associated with increased risk
of overweight up to 3 years, but not with wheezing. Higher height growth rate was associated
with lower risk of wheezing up to 3 years, independent from overweight (aOR: 0.65 (0.53-0.79)).
In time-lag models, wheezing was associated with subsequently reduced height growth up to age
14 months, and not vice versa.
Conclusion
Rather than weight and BMI growth, only height growth rate is associated with preschool
wheezing, independent from overweight. Children who wheeze demonstrate a subsequent
reduction in height growth up to 14 months of age, and not vice versa. Since height growth rates
were not associated with overweight, preschool wheezing and overweight are not associated
through early life growth.

7979
Early life growth and wheeze
66
Introduction
In the past decades, the prevalence of childhood asthma has increased in many countries.1
Parallel to the increase in asthma prevalence, rising trends in childhood overweight and obesity
have been observed.2 An association between asthma and overweight in children has been
found in several prospective studies,3 where the risk to develop asthma or asthma symptoms
was increased in overweight children. Proposed causal factors for this association include:
systemic inflammation, mechanical changes associated with high body weight, changes in airway
hyperresponsiveness, decreased physical activity, and changes in diet,4 but the exact pathways
through which overweight may lead to asthma are currently poorly understood.5
Alternatively, overweight and asthma may not be causally related, but certain (early life) factors
may play a role in the development of both asthma and overweight independently. One such
factor may be growth in fetal and early life. In parallel with somatic growth, development of the
lungs starts in utero, and continues after birth. After 16 weeks of gestation, the pattern of the
airway branching is complete and thereafter the airways only grow in size and not in number.6
In contrast, the alveoli develop mainly postnatally, from 36 weeks of gestation to at least three
years after birth, and continue to increase in volume until lung growth is completed in early
adult life.7 Reduced or accelerated growth in fetal and early life may therefore disrupt normal
airway development and growth, and lead to impaired functioning, for example because airway
growth cannot not keep up with accelerated somatic growth. Otherwise, an indirect effect of
unfavourable factors that lead to both abnormal somatic growth and lung functioning may also
explain how growth in early life can lead to overweight and asthma independently. In preschool
children asthma is difficult to diagnose, but symptoms of (recurrent) wheezing indicate that a
child is at increased risk for developing later asthma.
Previous research has shown that birth weight, an indicator of fetal growth and maturation, and
postnatal growth are associated with wheezing/asthma and overweight. Both low and high birth
weight seem to predispose for asthma8,9 and overweight10-12, although studies show inconsistent
findings. Unfavourable conditions in utero, such as maternal smoking during pregnancy,13 may
cause impaired somatic growth and impede lung development, and thereby explain the risk of
asthma in low birth weight children.9 Additionally, low birth weight children often show catch-up
growth during infancy, which may ultimately lead to overweight.14 Children born with a high birth
weight tend to remain overweight throughout childhood,11 and their increased risk of asthma is
thought to be mainly related to being overweight.9 Rapid postnatal weight gain is consistently
associated with overweight later in life,11,15 and has also been shown to be associated with later
wheeze16-18 or asthma,19,20 although some studies did not find an association between growth
rate and asthma (symptoms).21,22
Studies on the association between growth and asthma/wheeze show many methodological
differences. For example, great differences exist between studies in the definition of growth.
Particularly, only two previous studies controlled for current height and weight22 or body mass

8080
Chapter 6
66
index (BMI)19 in the analyses, and found conflicting results. It is therefore still unclear whether
rapid early life growth rates are a shared risk factor for developing asthma/wheeze and overweight
independently, or first lead to overweight which in turn leads to asthma. Moreover, to gain more
insight into potential causal pathways, it is of interest to study associations in different age periods,
and to study height, weight and BMI growth rates separately. In the present study, we therefore
examined whether birth weight and height, weight and BMI growth rates are independently
related to wheezing and overweight in children up to 3 years of age in a population-based
prospective cohort study.
Methods
Population and setting
Data were obtained from the LucKi Birth Cohort Study, a dynamic prospective cohort study in
the South-East of the Netherlands. LucKi is embedded in the Dutch Child and Youth Health
Care system, in which children are followed longitudinally from birth through routine contact
moments at child health care centres. Most Dutch parents (~90-95%) normally visit a child health
care centre 12 times between birth and 4 years of age. Since July 2006, all parents of newborn
children who live in the study region are invited to participate in LucKi 1-2 weeks after birth.
Parents are asked to complete questionnaires at baseline (1-2 weeks after birth), and when their
child is aged 7 months, 14 months, and 3 years. The timing of the questionnaires coincides
with routine contact moments. Parents are also asked to sign informed consent for extracting
additional data from the Child and Youth Health Care registry.
For the present study inclusion criteria were: born between July 2006 and December 2008,
availability of all 4 questionnaires, and availability of parental informed consent. Exclusion criteria
were: born before 37 weeks of gestation (because of associated respiratory complications in
preterm babies) and multiple birth (because of associated lower gestational age at birth and
lower birth weight).
Anthropometric measures
Birth weight was reported by the mother in the baseline questionnaire and was in addition
documented by Child and Youth Health Care personnel in the digital registry, based on
information from midwife or gynaecologist who was present at birth. Birth weight was treated
as a continuous variable.
Weight, height, and body mass index (BMI) growth rates were determined using data from the
Child and Youth Health Care registry. Nurse assistants measured the child’s height and weight at
each visit to the child health centre in a standardised way. BMI was calculated by dividing weight
(in kg) by squared length (in m). Relative growth rates were calculated over 3 different time
periods: between 1 and 7 months, between 7 and 14 months, and between 2 and 3 years of age.
8181
Early life growth and wheeze
66
For each child, height and weight measurements that were conducted closest to these ages were
used. If measurements were missing for a certain age, but other measurements were available,
height and/or weight were estimated by linear interpolating surrounding measurements. We
calculated standard deviation scores (SDS) for height, weight, and BMI at 1, 7, and 14 months,
and 2 and 3 years of age using the Dutch growth reference, standardised for age at measurement
and sex.23 For each growth characteristic (weight, height, and BMI), the difference between the
SDS score at the end and the beginning of a time period was calculated. This difference score
represents the child’s relative growth rate in each period and was treated as a continuous variable
in the analyses.
Wheeze and overweight
The primary outcome variable, wheeze, was determined at 7 months, 14 months, and 3 years
of age, based on validated ISAAC questions24 included in each follow-up questionnaire. Parents
were asked whether their child had wheezing or whistling in the chest in the last 7 months
(questionnaires at 7 and 14 months) or in the last 12 months (questionnaire at 3 years). A child
was considered to have wheezed in a certain period if the parents answered ‘yes’ to this question.
The secondary outcome variable, overweight, was determined using BMI at 7 months, 14 months
and 3 years of age. Since no cut-off values for overweight exist for children younger than 2 years
old, we classified children with an age- and sex-specific BMI above the 85th percentile of the
present study population as overweight.25
Potential confounders
Information on potential confounders was collected by questionnaires and registry. Sex, gestational
age, number of older siblings, maternal smoking during pregnancy, and parental history of atopy
were available from the baseline questionnaire. Breastfeeding duration, day care attendance, and
environmental tobacco smoke were reported in the follow-up questionnaires (ages 7 months, 14
months and 3 years). We cross-checked variables that were also available from the registry: sex,
gestational age at birth, and smoking during pregnancy.
The variables breastfeeding duration, day care attendance, and environmental tobacco smoke
were defined per time period (0-7 months, 7-14 months, and 2-3 years). Breastfeeding duration
was defined as the number of months per period a child received breast milk, exclusively or
partially. All potential confounders, except breastfeeding duration, were treated as categorical
variables in the analyses. Missing values were replaced with the value of the most frequent
category.
Statistical analyses
We performed univariable and multivariable logistic Generalised Estimating Equations (GEE)
models with exchangeable correlation structure, for birth weight and weight, height, and
BMI growth rates separately. GEE is a technique that is especially suitable for the analysis of
8282
Chapter 6
66
longitudinal data with repeated measurements.26 In multivariable analyses we adjusted for all
above-mentioned potential confounders simultaneously. Multivariable models with relative
growth rates as determinant were additionally adjusted for birth weight. An interaction term was
added to the models to explore possible differences of associations between age periods, with
the interaction variable ‘age period’ coded as 7, 14 and 36 (reflecting the age at measurement
in months), respectively.
Results are presented as odds ratios with 95% confidence intervals. A p-value of <0.05 was
considered statistically significant. Data were analysed with SPSS version 20.0.
Ethical clearance
The Lucki Birth Cohort study was approved by the Medical Ethical Committee of Maastricht
University Medical Centre.
RESULTS
Study population
Between July 2006 and December 2008, a total of 2317 children were enrolled in the LucKi Birth
Cohort Study shortly after birth (~65% of all births in the study region). For the present study
we excluded twins (n=36) and children who were born before 37 weeks of gestation (n=131,
16 of which were twins), leaving 2166 children who met the eligibility criteria. For a total of
566 (26.1%) children all questionnaires and informed consent for the use of registry data were
available. Compared with the total group of eligible children within the LucKi Study, the present
study population consisted of slightly more boys and slightly less children whose mother had
smoked during pregnancy (Table 6.1). Other characteristics were largely comparable (Table 6.1).
Wheeze and overweight
Parents of 75 children (75/566; 13.3%) reported wheezing between birth and 7 months, of which
5.3% (4/75) were ever diagnosed with asthma by a physician. Further, 37.3% (28/75) of children
with wheeze before 7 months of age ever used medication for their wheeze or asthma; 29.3%
(22/75) were reported to have used bronchodilators and 1.3% (1/75) corticosteroids. At the age
of 14 months, 107 children (107/566; 18.9%) were reported to have wheezed in the past seven
months, of which 36.4% (39/107) also wheezed before age 7 months and 7.5% (8/107) were
ever diagnosed with asthma by a physician. Further, 44.9% (48/107) of children with wheeze
between 7 and 14 months of age ever used medication for their wheeze or asthma; 32.7%
(35/107) were reported to have used bronchodilators and 4.7% (5/107) corticosteroids. At the
age of 3 years, parents reported wheezing in the past year for 75 children (75/566; 13.3%),
of which 66.7% (50/75) also wheezed before 7 months and/or before 14 months of age, and
17.3% (13/75) were ever diagnosed with asthma by a physician. Further, 65.3% (49/75) children

8383
Early life growth and wheeze
66
Table 6.1: Baseline characteristics of present study population, compared with total eligible study population within LucKi
Total eligibleStudy Population*
N=2166
PresentStudy Population#
N=566
Sex (male) 1066 (49.4%) 296 (52.3%)
Gestational age at birth37-38 weeks39-40 weeks41-42 weeksmissing
488 (22.5%)1123 (51.8%)545 (25.2%)
10 (0.5%)
118 (20.8%)288 (50.9%)159 (28.1%)
1 (0.2%)
Birth weight mean (SD) in grams 3467 (491) 3457 (484)
Breastfeeding duration0-7 months (% breastfed)mean (SD) in months7-14 months (% breastfed)mean (SD) in months
344 (60.8%)2.6 (2.8)
114 (20.1%)0.7 (1.7)
Parental history of atopyNoMaternalPaternalBoth parentsmissing
704 (32.5%)613 (28.3%)382 (17.6%)457 (21.1%)
10 (0.5%)
184 (32.5%)163 (28.8%)90 (15.9%)
125 (22.1%)4 (0.7%)
Smoking during pregnancy 271 (12.5%) 56 (9.9%)
Environmental Tobacco Smoke0-7 months7-14 months2-3 yearsmissing
43 (7.6%)37 (6.5%)50 (8.8%)8 (0.1%)
Day care attendance0-7 months7-14 months2-3 years
313 (55.3%)346 (61.1%)496 (87.6%)
Older siblingsNo older siblings1 or more older siblingsunkown
915 (42.2%)1068 (49.3%)
183 (8.4%)
246 (43.5%)265 (46.8%)
55 (9.7%)
Numbers presented as n (%) unless depicted otherwise* single birth children born between July 2006 and December 2008 after more than 36 weeks of gestation# selection of children with complete follow-up (questionnaires and informed consent for using data from the Youth Health Care registry)
with wheeze between 2 and 3 years of age ever used medication for their wheeze or asthma;
48.0% (36/75) were reported to have used bronchodilators and 5.3% (4/75) corticosteroids.
Mean BMI was 16.91 kg/m2 (range: 12.91 to 21.13) at age 7 months, 16.96 (range: 13.35 to
21.38) at age 14 months and 15.82 (range 12.79 to 20.31) at age 3 years. Cut-off points for the
85th percentile of BMI were 18.75 for boys and 17.99 for girls at the age of 7 months, 18.58 for
boys and 18.03 for girls at the age of 14 months, and 16.94 for boys and 16.92 for girls at the
age of 3 years.

8484
Chapter 6
66
Using univariable logistic GEE analyses we calculated the association between overweight
(determinant) and wheeze (outcome) in our population. We found that overweight was
associated with wheeze at the age of 7 months (crude Odds Ratio (cOR) 1.84 (95% confidence
interval 1.12-3.03), but not at 14 months and 3 years of age (cOR 1.19 (0.82-1.74) and cOR 0.77
(0.43-1.40), respectively).
Association of birth weight and relative growth rates with overweight
Higher birth weight and higher weight and BMI growth rates were associated with increased risk
of overweight up to 3 years (adjusted Odds Ratio (aOR) 1.50 (95% confidence interval 1.23-1.83)
for an increment of 500g birth weight, and aOR 2.33 (1.98-2.75) and aOR 2.47 (2.11-2.90) for
an increment of 1 SDS, respectively), but height growth rate was not associated with overweight
(Table 6.2). There was a significant interaction of weight growth rate and age (pinteraction<0.001);
the association between weight growth rate and overweight became stronger with increasing
age: aOR 1.98 (1.66-2.38) at age 7 months, 3.21 (2.49-4.13) at age 14 months, and 5.17 (3.16-
8.46) at age 3 years.
Table 6.2: Associations of birth weight and weight, height and BMI growth rates with overweight, wheeze, and wheeze independent from overweight in children until age 3 years
Determinant
Overweight Wheeze Wheeze independent from overweight†
Birth weight (per 500 g)
Crude OR (95% CI) 1.48 (1.24-1.76) 1.09 (0.92-1.30)
Adjusted OR§ (95% CI) 1.50 (1.23-1.83) 1.02 (0.83-1.24) 1.00 (0.82-1.22)
Weight growth rate (per SDS)
Crude OR (95% CI) 1.95 (1.69-2.24)* 0.89 (0.74-1.05)
Adjusted OR# (95% CI) 2.33 (1.98-2.75)* 0.88 (0.73-1.05) 0.85 (0.71-1.03)
Height growth rate (per SDS)
Crude OR (95% CI) 1.05 (0.89-1.24) 0.66 (0.55-0.80)
Adjusted OR# (95% CI) 1.12 (0.94-1.33) 0.65 (0.54-0.73) 0.65 (0.53-0.79)
BMI growth rate (per SDS)
Crude OR (95% CI) 2.20 (1.91-2.54) 1.16 (0.99-1.36)
Adjusted OR# (95% CI) 2.47 (2.11-2.90) 1.16 (0.99-1.37) 1.15 (0.98-1.36)
Odds ratios (OR) with 95% confidence intervals (CI) from General Estimations Equations logistic regression analyses, with exchangeable correlation structure. Wheeze, overweight, and growth rates have been measured repeatedly in three time periods (0-7 months, 7-14 months, and 2-3 years of age). Statistical significant associations (p<0.05) are displayed in bold font.* interaction of determinant with age period is statistically significant (p <0.001)§ adjusted for sex, gestational age, older siblings, parental history of atopy, smoking during pregnancy, breastfeeding duration, day care attendance, and environmental tobacco smoke# adjusted for birth weight, sex, gestational age, older siblings, parental history of atopy, smoking during pregnancy, breastfeeding duration, day care attendance, and environmental tobacco smoke† by adding overweight as determinant in the multivariable models
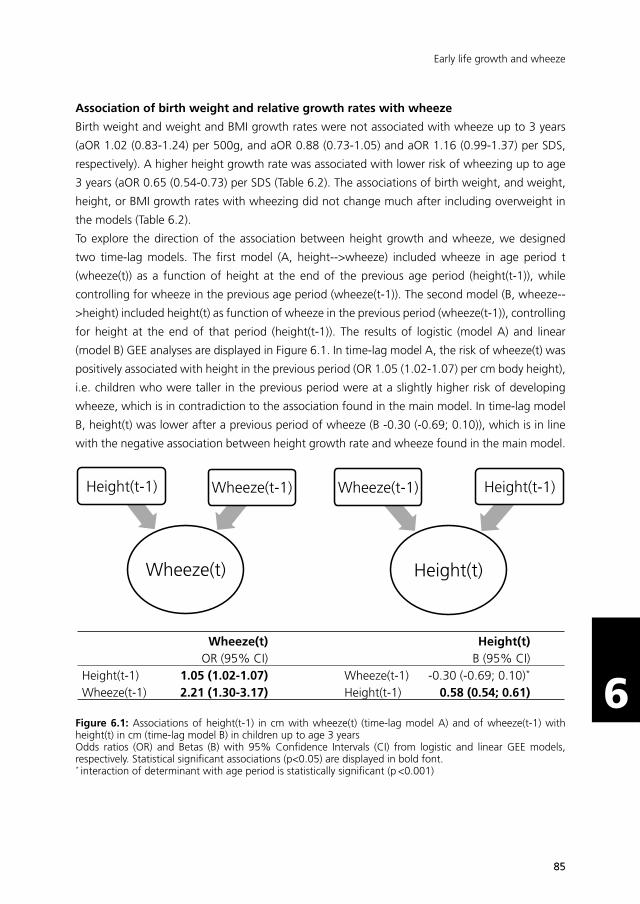
8585
Early life growth and wheeze
66
Association of birth weight and relative growth rates with wheeze
Birth weight and weight and BMI growth rates were not associated with wheeze up to 3 years
(aOR 1.02 (0.83-1.24) per 500g, and aOR 0.88 (0.73-1.05) and aOR 1.16 (0.99-1.37) per SDS,
respectively). A higher height growth rate was associated with lower risk of wheezing up to age
3 years (aOR 0.65 (0.54-0.73) per SDS (Table 6.2). The associations of birth weight, and weight,
height, or BMI growth rates with wheezing did not change much after including overweight in
the models (Table 6.2).
To explore the direction of the association between height growth and wheeze, we designed
two time-lag models. The first model (A, height-->wheeze) included wheeze in age period t
(wheeze(t)) as a function of height at the end of the previous age period (height(t-1)), while
controlling for wheeze in the previous age period (wheeze(t-1)). The second model (B, wheeze--
>height) included height(t) as function of wheeze in the previous period (wheeze(t-1)), controlling
for height at the end of that period (height(t-1)). The results of logistic (model A) and linear
(model B) GEE analyses are displayed in Figure 6.1. In time-lag model A, the risk of wheeze(t) was
positively associated with height in the previous period (OR 1.05 (1.02-1.07) per cm body height),
i.e. children who were taller in the previous period were at a slightly higher risk of developing
wheeze, which is in contradiction to the association found in the main model. In time-lag model
B, height(t) was lower after a previous period of wheeze (B -0.30 (-0.69; 0.10)), which is in line
with the negative association between height growth rate and wheeze found in the main model.Time-lag Model A
Height(t)
Wheeze(t-1) Height(t-1)
Wheeze(t)
Height(t-1) Wheeze(t-1)
Time-lag Model B
Wheeze(t)
OR (95% CI) Height(t)
B (95% CI)
Height(t-1) 1.05 (1.02-1.07) Wheeze(t-1) -0.30 (-0.69; 0.10)* Wheeze(t-1) 2.21 (1.30-3.17) Height(t-1) 0.58 (0.54; 0.61)
Figure 6.1: Associations of height(t-1) in cm with wheeze(t) (time-lag model A) and of wheeze(t-1) with height(t) in cm (time-lag model B) in children up to age 3 yearsOdds ratios (OR) and Betas (B) with 95% Confidence Intervals (CI) from logistic and linear GEE models, respectively. Statistical significant associations (p<0.05) are displayed in bold font.* interaction of determinant with age period is statistically significant (p <0.001)

8686
Chapter 6
66
Because the interaction term of wheeze(t-1) with age period was statistically significant in model
B (pinteraction<0.001), we repeated the analyses per age period. We then found that the negative
association of height with previous wheeze was strongest in the first 7 months (difference (cm)
in height growth between wheezers and non-wheezers: B -1.23 (-2.15; -0.31), attenuated in the
next period (B -0.51 (-0.92; -0.10) at 14 months), and had disappeared by 3 years of age (B 0.22
(-0.26; 0.70)) (Figure 6.2).
-1.23
-0.51
0.22
-3
-2
-1
0
1
2
7 months 14 months 3 years
B C
oef
fici
ent
Age
Figure 6.2: Associations of wheeze with subsequent height in cm up to age 3 years. B Coefficients with 95% Confidence Intervals from linear time-lag GEE analyses per age period. B Coefficients represent the difference of height (cm) between children who wheezed in the previous period compared with children who did not wheeze in that period, controlling for height at the end of the previous period.
Sensitivity Analyses
In order to check whether there was a non-linear association between birth weight and the
outcome variables wheeze and overweight, a centralised quadratic term for birth weight was
added to the univariable models. The quadratic term was not statistically significant in any model
and therefore dropped from all models.
To verify the existence of non-linear associations involving BMI (i.e. parabolic or U-shaped), we
performed two sensitivity analyses. First, we repeated all analyses after excluding children with a
BMI below the 15th percentile, which resulted in similar associations. Second, instead of defining
overweight as a binary variable based on 85th percentile of the BMI distribution, we used a
centralised, quadratic term of BMI as continuous variable in the models with wheeze as outcome
variable. In all models, the quadratic term for BMI was not statistically significant.
Using cut-off points for the 85th percentile of BMI to define overweight is arbitrary, especially for
children under 2 years of age. Therefore, we repeated the analyses using cut-off points for the
90th and 95th percentile of BMI, but this did not change the results. Also, we repeated the analyses

8787
Early life growth and wheeze
66
using cut-off points for 3-year old boys and girls of a widely used international standard27, which
were lower than the cut-off points for the 85th percentile of BMI. Instead of 85 children (15%)
with a BMI in the 85th percentile, only 37 children (6.2%) in our study population were overweight
according to the international standard. Nevertheless, using these different cut-off points for
3-year-old children did not change our results.
Finally, to increase comparability between our study and others, we repeated our univariable
logistic GEE analyses with wheeze as outcome and relative growth rates between 1 and 3 months
as determinant. We found associations similar to the original analyses, but with slightly broader
confidence intervals, indicating that more precision in the estimates is achieved by using multiple
growth rate periods in the analyses.
Discussion
In the present study we examined associations of birth weight and weight, height, and BMI
growth rates with wheeze and overweight between birth and 3 years of age. In our study
population overweight was associated with wheeze up to 7 months of age, and not thereafter.
Our findings show that in preschool children only height growth rate is associated with wheezing,
independent from overweight, and birth weight, weight growth rate, and BMI growth rate are
associated with overweight only. Early life growth rates can therefore not explain an association
between preschool wheezing and overweight. Furthermore, time-lag analyses revealed that
wheeze is associated with subsequently reduced height growth up to 14 months of age, and not
vice versa.
Our findings are in contrast with other studies on the association between early life growth
patterns and wheeze, in which an association of weight growth16-20 and no association of height
growth16-19 with later wheeze and/or asthma was found. In line with our findings, two other
studies found no association of weight growth and later wheeze,21,22 but no other study found
an association of height growth with wheeze. Furthermore, we could not confirm an association
of (high or low) birth weight with wheeze as found in some studies,9 although null-associations
have also been found in other studies.18,22
Conflicting results may derive from differences in methodological choices such as defining growth
rates and timing of outcome measurements. In our study, growth was defined as difference
scores of standardised weight, height or BMI in three periods (1-7 months, 7-14 months, and 2-3
years of age), while others categorised growth between 0 and 2 years,21 or several intermediate
periods,16-18 into slow, normal and rapid weight gain, or used parameters of modelled growth
curves to define growth patterns.19,20,22 Sensitivity analyses with relative growth rates calculated
over 1-3 months only as determinant did however not change our conclusions. Results of studies
that only focussed on BMI as marker for growth may be influenced by an inversed association
8888
Chapter 6
66
of height growth with wheeze as we found in our study, by inaccurately attributing an effect to
weight gain instead of reduced height growth, emphasising that it is important to study weight
and height separately.
Another difference is that we used repeatedly measured wheeze as outcome measure, whereas
in other studies the outcomes were measured only once, or were combined to one endpoint (e.g.
ever wheeze). Although the sample size of our study was smaller than some other studies, we
reached enough statistical power to detect a statistically significant negative association between
height growth and wheeze. Also, some other studies measured their outcome in school-aged
children. In preschool children, wheezing is more prevalent and mainly associated with viral
infections, while in older children who persist to wheeze up to the age of 6 years and older,
wheezing is mainly associated with atopy.28 It is therefore likely that not all children with wheezing
symptoms in our study population will go on to develop allergic asthma when they grow older.
Our results indicate that most likely a different mechanism is responsible for the association of
growth with overweight than for the association of growth with wheeze in preschool children.
In the association with overweight (based on BMI), weight gain seems to play a key role, while in
the association with wheeze reduced height is primarily involved. Since overweight and weight
gain are by definition closely related, a strong association between weight growth rate and
overweight was to be expected in our study. In the absence of an association of weight growth
rate and wheeze, however, our results do not confirm a causal relation between overweight and
wheeze/asthma through pathways related to high body weight, such as increased visceral fat
deposition, mechanical changes, and low-grade systemic inflammation. Remarkably, the (non-
significant) estimates of the association between weight growth rate and wheezing rather point
to a protective effect of weight growth rate for preschool wheezing in our study population,
implicating the need for replication of these analyses in a larger population to see whether these
estimates reach statistical significance or not.
From our time-lag models we conclude that in the association of height and wheeze reversed
causation was introduced: wheeze was associated with subsequently reduced height growth, and
not vice versa. This eliminates the explanation that restricted height growth affects airway growth
and thereby leads to respiratory problems. Potential explanations for height growth restriction in
children with wheeze include: an adverse effect on growth of asthma medication, such as inhaled
corticosteroids;29 co-morbidities of wheeze/asthma, such as gastro-oesophageal reflux disease30
which may hinder sufficient nutrient intake31 and thereby lead to reduced height growth; or
the presence of an underlying condition, for instance a respiratory tract infection, that induces
wheeze episodes and may as well cause temporal growth restriction. The latter explanation is
supported by the fact that the association between wheeze and height growth disappears at 3
years of age, because children become less susceptible to viral infections when they grow older.
The use of corticosteroids was low in this young population (1.3-5.3% of the children with
reported wheeze), and is therefore not a likely explanation for our findings.

8989
Early life growth and wheeze
66
Strengths of our study are the prospective design and the use of repeatedly measured outcome
measures. Also, because trained nurse-assistants measured height and weight in a standardised
way, bias associated with self-reporting of height and weight (e.g. social desirability bias and
recall bias) was eliminated.32 Furthermore, the use of standardised ISAAC questions to measure
the outcome of wheeze permits comparison with other studies.
Our study is also subject to some limitations. First, since we only included children with complete
follow-up for questionnaires and informed consent for the use of registry data, selection bias
may be introduced. In Table 6.1 we have shown that the present study population was largely
comparable to the total group of eligible children, but there were slightly more boys and slightly
less children whose mother had smoked during pregnancy included. Additional exploration
indicated that in the group with complete follow up, the prevalence of wheeze was slightly higher
(data not shown). Since boys are more likely to wheeze than girls, and mothers of lower socio-
economic status are more likely to smoke during pregnancy, these differences probably reflect
that parents of children with respiratory symptoms and parents with a higher socio-economic
status were more inclined to complete all questionnaires in the LucKi Birth Cohort Study. This
certainly has implications for the generalizability of the results, but since we adjusted in the
multivariable analyses for sex and smoking during pregnancy, and other related characteristics
such as birth weight were comparable, the internal validity of the present study is most likely not
threatened. Moreover, repeating our crude analyses with children with less complete follow-up
for questionnaires resulted in similar associations of relative growth rates and wheeze (data not
shown). The exclusion of preterm and/or multiple births children means that the present study
results cannot be generalized to these specific groups.
Second, the observational design leaves the possibility of residual confounding in the analyses,
for example because we lacked data on maternal height and weight. Nonetheless, we were able
to control our analyses for many potential confounders, some of which were also measured
repeatedly over the study period. A third limitation is the use of BMI cut-off points for overweight
in children younger than 2 years. BMI as a proxy for visceral fat mass is debated, and currently no
international validated cut-off points for children younger than 2 years of age exist. Although it
may thus not be a clinical relevant measure for overweight in this age category, we feel that using
BMI cut-off points for the purpose of defining (changes in) overweight in our study population
was justified. This was strengthened by the fact that using different cut-off points in the sensitivity
analyses did not change the results.
In conclusion, our findings show that, rather than weight and BMI growth, only height growth
rate is associated with preschool wheezing, independent from overweight. Preschool children
with wheeze demonstrate a subsequent reduction in height growth up to 14 months of age, and
not vice versa. Since height growth rates were not associated with overweight, early life growth
rates cannot explain an association between preschool wheezing and overweight.
9090
Chapter 6
66
References
1. Anandan C, Nurmatov U, van Schayck OC, Sheikh A. Is the prevalence of asthma declining? Systematic review of epidemiological studies. Allergy 2010; 65(2): 152-67.
2. Wang Y, Lobstein T. Worldwide trends in childhood overweight and obesity. Int J Pediatr Obes 2006; 1(1): 11-25.
3. Papoutsakis C, Priftis KN, Drakouli M, et al. Childhood overweight/obesity and asthma: is there a link? A systematic review of recent epidemiologic evidence. J Acad Nutr Diet 2013; 113(1): 77-105.
4. Beuther DA. Recent insight into obesity and asthma. Curr Opin Pulm Med 2010; 16(1): 64-70.
5. Sin DD, Sutherland ER. Obesity and the lung: 4. Obesity and asthma. Thorax 2008; 63(11): 1018-23.
6. Jeffery P. The development of the large and small airways. Am J Respir Crit Care Med 1998; 157(5): s174-s80.
7. Stick S. Pediatric origins of adult lung disease. 1. The contribution of airway development to paediatric and adult lung disease. Thorax 2000; 55(7): 587-94.
8. Remes ST, Patel SP, Hartikainen AL, Jarvelin MR, Pekkanen J. High birth weight, asthma and atopy at the age of 16 yr. Pediatr Allergy Immunol 2008; 19(6): 541-3.
9. Tedner SG, Ortqvist AK, Almqvist C. Fetal growth and risk of childhood asthma and allergic disease. Clin Exp Allergy 2012; 42(10): 1430-47.
10. Yu ZB, Han SP, Zhu GZ, et al. Birth weight and subsequent risk of obesity: a systematic review and meta-analysis. Obes Rev 2011; 12(7): 525-42.
11. Baird J, Fisher D, Lucas P, Kleijnen J, Roberts H, Law C. Being big or growing fast: systematic review of size and growth in infancy and later obesity. BMJ 2005; 331(7522): 929.
12. Oldroyd J, Renzaho A, Skouteris H. Low and high birth weight as risk factors for obesity among 4 to 5-year-old Australian children: does gender matter? Eur J Pediatr 2011; 170(7): 899-906.
13. Bjerg A, Hedman L, Perzanowski M, Lundback B, Ronmark E. A strong synergism of low birth weight and prenatal smoking on asthma in schoolchildren. Pediatrics 2011; 127(4): e905-12.
14. Ong KK, Ahmed ML, Emmett PM, Preece MA, Dunger DB. Association between postnatal catch-up growth and obesity in childhood: prospective cohort study. BMJ 2000; 320(7240): 967-71.
15. Ong KK, Loos RJ. Rapid infancy weight gain and subsequent obesity: systematic reviews and hopeful suggestions. Acta Paediatr 2006; 95(8): 904-8.
16. Sonnenschein-van der Voort AM, Jaddoe VW, Raat H, et al. Fetal and infant growth and asthma symptoms in preschool children: the Generation R Study. Am J Respir Crit Care Med 2012; 185(7): 731-7.
17. van der Gugten AC, Koopman M, Evelein AM, Verheij TJ, Uiterwaal CS, van der Ent CK. Rapid early weight gain is associated with wheeze and reduced lung function in childhood. Eur Respir J 2012; 39(2): 403-10.
18. Pike KC, Crozier SR, Lucas JS, et al. Patterns of fetal and infant growth are related to atopy and wheezing disorders at age 3 years. Thorax 2010; 65(12): 1099-106.
19. Flexeder C, Thiering E, Bruske I, et al. Growth velocity during infancy and onset of asthma in school-aged children. Allergy 2012; 67(2): 257-64.
20. Rzehak P, Wijga AH, Keil T, et al. Body mass index trajectory classes and incident asthma in childhood: results from 8 European Birth Cohorts--a Global Allergy and Asthma European Network initiative. J Allergy Clin Immunol 2013; 131(6): 1528-36.
21. Paul IM, Camera L, Zeiger RS, et al. Relationship between infant weight gain and later asthma. Pediatr Allergy Immunol 2010; 21(1 Pt 1): 82-9.
22. Anderson EL, Fraser A, Martin RM, et al. Associations of postnatal growth with asthma and atopy: the PROBIT Study. Pediatr Allergy Immunol 2013; 24(2): 122-30.

9191
Early life growth and wheeze
66
23. Fredriks AM, van Buuren S, Burgmeijer RJ, et al. Continuing positive secular growth change in The Netherlands 1955-1997. Pediatr Res 2000; 47(3): 316-23.
24. Asher MI, Keil U, Anderson HR, et al. International Study of Asthma and Allergies in Childhood (ISAAC): rationale and methods. Eur Respir J 1995; 8(3): 483-91.
25. Spear BA, Barlow SE, Ervin C, et al. Recommendations for treatment of child and adolescent overweight and obesity. Pediatrics 2007; 120 Suppl 4: S254-88.
26. Twisk J. Applied Longitudinal Data Analysis for Epidemiology. A Practical Guide. 1st ed. Cambrigde: Cambridge University Press; 2003.
27. Cole TJ, Bellizzi MC, Flegal KM, Dietz WH. Establishing a standard definition for child overweight and obesity worldwide: international survey. BMJ 2000; 320(7244): 1240-3.
28. Martinez FD, Wright AL, Taussig LM, Holberg CJ, Halonen M, Morgan WJ. Asthma and wheezing in the first six years of life. N Engl J Med 1995; 332(3): 133-8.
29. de Benedictis FM, Bush A. Corticosteroids in respiratory diseases in children. Am J Respir Crit Care Med 2012; 185(1): 12-23.
30. de Groot EP, Duiverman EJ, Brand PL. Comorbidities of asthma during childhood: possibly important, yet poorly studied. Eur Respir J 2010; 36(3): 671-8.
31. Mathisen B, Worrall L, Masel J, Wall C, Shepherd RW. Feeding problems in infants with gastro-oesophageal reflux disease: a controlled study. J Paediatr Child Health 1999; 35(2): 163-9.
32. Connor-Gorber S, Tremblay M, Moher D, Gorber B. A comparison of direct vs. self-report measures for assessing height, weight and body mass index: a systematic review. Obes Rev 2007; 8(4): 307-26.

92

Chapter 7. General discussionChapter 4Chapter 3
de Korte-de Boer D, Mommers M, Gielkens-Sijstermans CML, Creemers HMH, Mujakovic S, Feron FJM, van Schayck CP
Submitted
Chapter 7General Discussion
93
9494
Chapter 7
77
Asthma and atopic diseases are the most prevalent chronic diseases among children in the
Netherlands1 and are therefore important themes for Child and Youth Health Care. In order
to understand the extent of the problem, a series of studies on prevalence trends of childhood
wheeze, asthma and atopic diseases was undertaken. Also, since it is assumed that overweight
is linked to asthma, and because overweight is an important public health topic as well, the
association of body mass index and of growth rates with wheeze and asthma was explored. The
results of these respective studies are described in the previous chapters. Here, the main findings
are summarised and discussed in light of existing scientific literature and methodological strengths
and limitations. Thereafter, implications of the study results for public health are discussed, and
recommendations are made for future scientific studies. Finally, based on our experiences, several
opportunities and challenges of performing research in Child and Youth Health Care practice are
discussed.
Main findings
Part I: Prevalence trends – ‘Astma Monitor Westelijke Mijnstreek’
In Part I of this thesis, prevalence trends of wheeze and atopic diseases among school children
in the ‘Westelijke Mijnstreek’, a region in the south-east of the Netherlands, were examined
using data from the ‘Astma Monitor Westelijke Mijnstreek’. In consecutive cross-sectional
surveys conducted between 1989 and 2010 among 4-7 and 8-11 year-old school children, we
measured the prevalence of respiratory symptoms, asthma, eczema, and hay fever in the study
region. After a previously observed decrease in wheeze prevalence among 8-11 year-old school
children between 1989 and 2001, no further decrease was observed until 2010 (Chapter 2). Also,
unchanging prevalence trends of asthma, eczema and hay fever were found between 2001 and
2010 (Chapter 2). The initial decrease in wheeze prevalence was not explained by (increased)
medication use between 1989 and 2005, suggesting that wheeze prevalence was not masked by
better disease management, but was truly declining (Chapter 3).
While wheeze and asthma prevalence decreased and (then) stabilised, overweight continues
to increase in our population. An association of childhood overweight with asthma has been
described extensively in the literature, but appears counterintuitive in the presence of these
diverging prevalence trends. Nonetheless, we found that a higher body mass index standardised
for age and sex (BMI-SDS) was associated with wheeze and asthma in individuals in all surveys
between 1993 and 2010, confirming a link between childhood overweight and asthma (Chapter
4). Many interacting factors ultimately determine prevalence trends, but with a more recent
stabilization in wheeze and continuing increases in overweight, in time, wheeze/asthma may
start to increase again.

9595
General discussion
77
Part II: Early life growth – LucKi Birth Cohort Study
In Part II, the rationale and design of the LucKi Birth Cohort Study was described. LucKi is a
Dutch acronym for: Respiratory Complaints and Atopic Diseases in Children (Luchtwegklachten
en atopische aandoeningen bij Kinderen). The LucKi Birth Cohort Study is an ongoing, dynamic,
prospective birth cohort study, embedded in the Child and Youth Health Care practice of
the ‘Westelijke Mijnstreek’, and follows children from birth into adulthood (Chapter 5). With
longitudinal data from LucKi participants who were followed until 3 years of age, the association
of early life growth rates with preschool wheezing was explored. We hypothesised that rapid
somatic growth in early life was a shared risk factor for asthma and overweight. We found
that only a higher height growth rate was associated with preschool wheezing, but not with
overweight, while higher weight and BMI growth rates were associated with overweight and not
with wheezing. Therefore, we concluded that early life growth rates cannot explain an association
of wheeze and overweight in preschool children (Chapter 6).
Discussion of the findings
Prevalence trends of asthma and atopic diseases
Worldwide, the ‘Astma Monitor Westelijke Mijnstreek’ was one of the first to observe a decline
in wheeze prevalence among children until 2001.2 At present, the unchanging prevalence trends
of eczema, asthma, and hay fever in the region until 2010 seem to be unique when compared
to international studies on childhood atopic diseases. Up to 2004, the worldwide ISAAC study
revealed mostly increasing prevalence trends of atopic diseases, also in almost all participating
Western European countries.3 Also in more recent studies in Greece4 and Norway5 still almost
only increasing trends in atopic diseases were observed among school-aged children until 2008.
To the best of our knowledge, there are no recent prevalence trend studies among school children
available from other Dutch regions to compare our results with, but there is some data available
on adult asthma and eczema. From general practice registries in the city of Nijmegen and the
province Limburg6 it appears that the prevalence of diagnosed asthma among adults has been
increasing in both regions since 1990, but seems to have stabilised in the past decade. Possibly
this stabilisation reflects our previous results in school children in the early years of the ‘Astma
Monitor’, as by now they have reached an adult age. Also, Statistics Netherlands reported a
nationwide decline in doctor’s diagnosed asthma among 0-15 year-old children between 2001
and 2011, a stabilising trend among 15-30 year-olds, and slightly increasing trends among older
adults.7 Again, this is in line with our findings, and suggests that in the future the prevalence of
diagnosed asthma among older age groups may also stabilise or even decrease.
The prevalence of eczema (atopic dermatitis) in adults has been increasing steadily between
1992 and 2011 according to the general practice registry from Limburg.8 A comparison with our
findings is more complicated, because we only studied eczema prevalence in school children since

9696
Chapter 7
77
2001, some of whom just reached an adult age in 2011. However, the stable trend of eczema we
observed between 2001 and 2010 could imply that the increase among adults will come to an
end in the future. We are unaware of data on trends in he prevalence of hay fever or allergies in
children or adults in the Netherlands, and therefore further comparisons are not possible.
Explanatory factors for prevalence trends are not necessarily risk factors for the disease under
study. Other factors, such as changes in disease awareness, diagnostic habits, and disease
management, may also influence prevalence trends observed in epidemiological studies.
Increases in disease awareness and/or diagnostic habits might have led to an increase in symptom
reports and doctor’s diagnoses over the years, and the same applies to increased access to health
care facilities. Although it is therefore unlikely that these factors can explain our decreasing and
stabilising prevalence trends, we cannot completely rule out that some background noise was
introduced by these factors. For (increased) medication use we have shown in Chapter 3 that this
could not explain the decrease in reported wheeze symptoms, suggesting that wheeze prevalence
was truly declining in our population and not masked by improved disease management. For
eczema and hay fever we lacked data to perform similar analyses, but in Chapter 2 we showed
that medication for eczema seems to have decreased, and hay fever medication remained stable
between 2005 and 2010, which does not point towards an explanation for the stable trends over
time. Moreover, since the prevalence rates of atopic diseases in our population are comparable to
or even lower than those reported in other countries (Chapter 2), it is unlikely that regression to
the mean can explain the differences with trends in other countries.
Our prevalence trends studies may provide insight into what risk factors are responsible for
the development of childhood asthma and atopic diseases in the population. In this thesis,
we have mainly focussed on overweight as determinant for childhood wheeze and asthma,
and additionally have briefly considered exposure to environmental tobacco smoke (ETS) as
an explanatory factor. In our population, overweight and obesity continues to increase, while
exposure to ETS has steadily decreased over time. In Chapter 4, we found that in school children a
higher BMI-SDS was associated with wheeze in all survey years. Nonetheless, given the diverging
prevalence trends of wheeze/asthma and overweight in the population, changes in BMI did
not explain the observed wheeze and asthma prevalence trends. Thus, there must be another
factor or a combination of factors in play that is strongly related to asthma/wheeze prevalence,
but unrelated or loosely related to overweight/obesity. If such factors have a stronger effect on
asthma/wheeze than on overweight, they could explain decreasing or stabilising trends wheeze
and asthma trends in the presence of an increasing trend in overweight and obesity. In this
respect, we have considered exposure to ETS, which is a well-described risk factor for early life
wheezing and asthma,9 and has decreased drastically over the years in our population, and in
the Netherlands as a whole.10 However, we described in Chapter 4 that adjusting our models for
ETS exposure did not change the association of BMI-SDS with wheeze. Moreover, ETS exposure
was also associated with higher BMI, possibly because these children were already exposed to
tobacco smoke during pregnancy, which may have its effect on birth weight, subsequent growth,

9797
General discussion
77
and the development of overweight, or because ETS exposure nowadays indicates a lower socio-
economic status, with associated poorer diet and lower physical activity levels. Changes in ETS
exposure over the years can therefore not solely explain the diverging prevalence trends in our
population. It remains however a plausible explanation for the decrease in wheeze prevalence
over the past decades. A stronger effect of dietary factors and physical activity on overweight,
may explain why the decrease in ETS does not translate into a decreasing trend in overweight
and obesity.
Given the multifactorial etiology of asthma and overweight, not a single factor, but rather
changes in the pattern of protective and risk factors can explain the observed prevalence trends.
There is a need for (birth cohort) studies to collaborate so that the statistical power to detect
these complex associations increases. In Europe, there are currently some initiatives for such
collaborations (Chicos, GA2LEN).
The association between overweight and asthma
An association between childhood overweight and asthma is well established in the literature,11
but the exact nature of the relationship remains largely unknown. In Chapter 4, we found that in
school children a higher BMI-SDS was associated with wheeze (adjusted Odds Ratio 1.09; 95%
Confidence Interval 1.03-1.16) and asthma (aOR 1.12; 95% CI 1.00-1.27) in all survey years.
These estimates are comparable to other studies who analysed BMI as a continuous variable.11
Although these associations appear to be rather small, in our analyses with BMI as categorical
variable, overweight was significantly associated with wheeze with an odds ratio of 1.24 (95%
CI 1.02-1.50), implicating that overweight children have a 24% higher risk of having wheeze
symptoms than normal weight children. This estimate is also comparable to estimates found in
other studies among school-aged children.11
There is now consensus that reversed causation (i.e. children with asthma become less physically
active and subsequently develop overweight or obesity) cannot fully account for the associations
found,12 although the phenomenon may occur in individual cases. Also, increased perception of
respiratory symptoms in obese children, which are mistakenly perceived as asthma symptoms,
does in general not seem a likely explanation.13 Although a number of potential mechanisms
for a direct causal link between overweight and asthma have been described, a single pathway
from overweight to asthma is contradicted for several reasons. First, if overweight is causal for
asthma, a reduction in weight should lead to improvement in asthma symptoms, but in children
there is currently no convincing evidence for a positive effect of weight reduction programs on
asthma symptoms and severity.14 Second, population based studies found that the association
between overweight and asthma in children was only present in studies after 1990 and not
before,15,16 which is very unlikely in case of a causal link. Third, in this thesis we showed that the
prevalence of overweight and obesity continues to increase (Chapter 4), while the prevalence of
asthma (symptoms) has been decreasing and then stabilised (Chapter 2). Fourth, we showed that
the association between overweight and wheeze was not found to be continuously present at
9898
Chapter 7
77
preschool age: in school children in the Westelijke Mijnstreek we indeed observed a consistent
association of higher BMI-SDS with wheeze and asthma (Chapter 4), but in preschool children in
the same study area, we found an association between overweight and wheeze symptoms up to
7 months of age, but not at 2 or 3 years of age (Chapter 6).
For these reasons, an indirect mechanism in which shared determinants in early life affect the
development of asthma and overweight independently seems a more plausible explanation
for the association of overweight and asthma in children. Several shared risk factors have been
considered in the literature, the main of which are atopy, physical activity, diet, and growth. In
Chapter 6 we hypothesised that accelerated growth in early life would lead to overweight and
asthma independently. We found however that weight and BMI growth rates were not associated
with wheeze in our population. This is in contrast with other studies where rapid weight gain
between 0-3 months was associated with wheezing and asthma during childhood. In an editorial
dedicated to our publication,17 the editors postulate that an explanation for the absence of an
association between weight growth and wheezing in the LucKi Birth Cohort Study may be that
the cohort consists of a relatively large number of children with a parental history of atopy, and
therefore non-atopic, transient wheezers (i.e. children who outgrow their wheeze symptoms with
increasing age) may be underrepresented.18 Importantly, a recent publication from a birth cohort
in Australia found that an association of higher BMI with wheeze in 2 year-olds was restricted
to children with transient wheeze.19 This suggests that overweight is related to non-allergic
wheeze, and possibly not to allergic wheeze and asthma or other atopic diseases. Indeed, from a
systematic review it was concluded that in general, obesity is not a promoter of allergy, and that
there was a stronger impact of obesity on the non-atopic than on the atopic asthma phenotype.20
It may therefore still be possible that rapid growth may be a shared risk factor for overweight and
non-atopic wheeze and asthma, and that the association was absent in our population because
of the relatively large proportion of children predisposed for atopic diseases. Future studies on the
association of overweight and asthma should therefore distinguish effects between atopic and
non-atopic wheeze and asthma.
Previously we suggested that decreasing trends in wheeze prevalence could be explained by
decreasing ETS exposure. As ETS is a non-allergic trigger for wheeze and asthma, this would imply
that there is primarily a decrease in non-atopic wheeze and asthma in our population. This is in line
with the observation that with similar proportions of parental history of atopy, the prevalence of
wheeze was declining in the ‘Astma Monitor Westelijke Mijnstreek’, and with the aforementioned
relatively high prevalence of parental history of atopy in the LucKi Birth Cohort Study. However,
it is in contradiction with the assumption that overweight is related to non-allergic wheeze and
asthma. Reasonably, this assumption would imply that the continued increase in overweight and
obesity prevalence in our region would lead to an increase in non-atopic wheeze and asthma.
Although we are not able to further quantify these complex relations, it seems reasonable to
assume that the favourable effect of decreased ETS exposure is stronger than the harmful effect
of increased overweight and obesity on wheeze and asthma in the population.
9999
General discussion
77
Methodological considerations
Study design
The ‘Astma Monitor Westelijke Mijnstreek’ study consisted of repeated, population based, cross-
sectional surveys among school children of two specific age groups (4-7 and 8-11 years of age).
While this design is useful for studying the prevalence of asthma and atopic diseases over time, it
is not possible to study causality due to the cross-sectional nature of the respective surveys, and
the results are limited to the age groups under study. Therefore, the study may be hypothesis
generating in terms of revealing potential explanatory factors for prevalence trends, but is less
suitable for hypothesis testing because of temporal and directional restrictions. An important
strength of the ‘Astma Monitor’ is that it consisted of six repeated surveys, whereas many other
prevalence studies only consisted of two time-points.3 We were therefore able to reveal non-
linear time trends in the prevalence of atopic diseases. For the study in Chapter 4, we applied a
nested case-control design within the ‘Astma Monitor’ surveys, primarily to save time and money
in collecting anthropometric data from paper files. With a 1:4 ratio of cases and controls we
minimised the loss of statistical power to detect an association, thereby increasing efficiency.21
The LucKi Birth Cohort Study follows children prospectively from birth, enabling studying temporal
and causal relations and at different ages. In a regular cohort study, studying prevalence trends
is not possible because age and period are completely identical.22 LucKi, however, is an ongoing
cohort study (i.e. the cohort is not restricted to a certain maximum number of participants or an
end date for including participants), thereby combining the advantages of a regular cohort study
with the opportunity to study prevalence trends in the population.
Embedding both studies in routine Child and Youth Health Care practice resulted in high response
rates, which is especially important when studying prevalence trends in a population, and limits
selection bias. Another advantage of using the existing infrastructure of Child and Youth Health
Care for research is that we could make efficient use of the resources against relatively low costs.
Defining asthma in epidemiological studies
There are several difficulties in studying the epidemiology of asthma, which have also become
apparent in the work presented in this thesis. First, there is no standardized definition or gold
standard diagnostic test for asthma, and the heterogeneous clinical expression (in symptoms and
severity) of asthma further complicates distinguishing asthmatic from non-asthmatic children.
Nevertheless, agreement between clinicians in diagnosing asthma seems to be fairly good, and
therefore a clinical diagnosis of asthma is often used as best available standard.23 It has been
shown that adding other, more objective markers for asthma to questionnaire based studies,
such as bronchial hyperresponsiveness, only marginally increase the accuracy of defining asthma
in children.24 Given the invasive nature and costs of such tests, it is not advised to use them
in large scaled epidemiological studies. Second, a problem with defining asthma based on
reports of a doctor’s diagnosis is that diagnostic habits may differ between countries and may

100100
Chapter 7
77
have changed over time, which limits comparability and interpretation of prevalence (trends).
For this reason, the International Study of Asthma and Allergies (ISAAC) developed a symptom
questionnaire for their project, which was found to be a valid instrument25 and is now widely
used in epidemiological studies on asthma. Symptom questionnaires potentially suffer from
subjective symptom recognition or recall by parents and – as many asthma symptoms are non-
specific to the disease, especially in young children – may result in an overestimation of asthma
prevalence in populations. Also, if existing asthma is well controlled (with medication), symptom
questionnaires may no longer record respiratory complaints, while the underlying disease is still
present. The latter hypothesis formed the basis of our study described in Chapter 3, but could not
explain decreasing prevalence trends in our study area.
To overcome some of these potential problems, in our studies described in Chapter 2 and 4, we
used a combination of reports of a clinical diagnosis and parentally reported recent wheezing
to define asthma in school children, based on the ISAAC questionnaire. In preschool children
(Chapter 6), however, a clinical diagnosis is mostly unavailable, and therefore we used recent
wheezing as outcome variable for this age group. Although preschool children with wheeze
are not necessarily all asthmatic patients (almost 60% of children with wheeze outgrow their
complaints by the age of 6)26, they are certainly at higher risk of developing chronic asthma when
they grow older.
Taken together, in epidemiological studies on pediatric asthma it remains of great importance
to gather information on the triad of clinical diagnosis, presence of symptoms, and the use of
medication. Combining these variables will allow for the best available definition of asthma cases.
Potential sources of bias
Selection bias
The high participation rates (~90%) obtained in the ‘Astma Monitor Westelijke Mijnstreek’ limit
the possibility of selection bias. Nonetheless, a reason for not participating may have been not
speaking the Dutch language and therefore not being able to complete the questionnaires. Also,
parents of lower socio-economic status are generally less likely to participate in surveys. We were
not able to quantify the representation of these groups in our study population because we did
not have information on the ethnical background or socio-economic status of our participants.
Another selection mechanism may be that parents who are familiar with respiratory or atopic
symptoms may have been more motivated to complete the questionnaire, which could have led
to an overestimation of the prevalence rates studied. With a hypothetical study base of 1,000
children, a participation rate of 90%, and an asthma prevalence of 5.0% (45/900), this would
mean that, if none of the non-responders had asthma, the true prevalence in the population
would be 4.5% (45/1000). The overestimation potentially caused by this selection mechanism
would thus only be relatively small (5.0-4.5=0.5%).
For the analyses in Chapter 2 we selected participants who participated in two successive study

101101
General discussion
77
years, and we showed that this selection was comparable to the total survey on the main
determinants ‘wheeze’ and ‘medication use’, limiting the introduction of selection bias. In the
case-control study in Chapter 3 we found that the availability of anthropometrics data was
equal for cases and controls, but was dependent on the year of survey; paper files that were
archived (survey years 1993 and 1997) and digital files (2005 and 2010) were more likely available
than paper files of children who were still in active follow-up (2001). This may have led to an
underrepresentation of children with overweight in the analyses.
In the LucKi Birth Cohort Study, the current inclusion rate is ~65%. The same reasons for (not)
participating mentioned above apply to LucKi, but since participants are followed from birth,
the likelihood of disease status influencing the choice for participating in the study at baseline is
lower. It can however be of influence in the follow-up questionnaires; in the analyses in Chapter 6
we indeed showed that parents of children with respiratory symptoms and parents with a higher
socio-economic status were more likely to complete all follow-up questionnaires (at least until 3
years of age).
Overall, the internal validity of the studies presented in this thesis was most likely not threatened
by selection mechanisms. Regarding the external validity, the results may not be generalizable to
certain underrepresented groups, such as immigrants and inhabitants with lower socio-economic
status. This also influences the generalizability of our study results to other populations. However,
given the large demographic differences between our study region and other parts of the
Netherlands (especially the large cities), generalizability to other populations would be limited
even if all inhabitants from the ‘Westelijke Mijnstreek’ participated.
Information bias
Information bias may result in misclassification of outcome or misclassification of exposure. The
outcome variables (symptoms of asthma and atopic diseases) were measured with paper-and-
pencil questionnaires in both the ‘Astma Monitor Westelijke Mijnstreek’ and the LucKi Birth
Cohort Study. Questionnaires are particularly suitable to reach large numbers of participants
simultaneously and to gather information in a standardised way. Moreover, in questionnaires
it is more likely that honest answers are provided about controversial topics such as smoking
and alcohol use during pregnancy, compared to asking face-to-face. For example, in LucKi
questionnaires ~10% of the participating mothers indicated to have used alcohol at least once
during pregnancy, while in the Child and Youth Health Care registry, only 0.8% was registered
to have used alcohol during pregnancy. It is well possible that mothers were reluctant to admit
their alcohol use to the Child and Youth Health Care practitioner. This so-called social desirability
bias was also shown in different settings of the Strengths and Difficulties Questionnaire (SDQ), a
widely used questionnaire in Child and Youth Health Care in the Netherlands. Adolescents were
inclined to understate negative behaviour and exaggerate positive behaviour in an individual (non-
anonymous) setting compared with a collective (anonymous) setting.27 Given the anonymous
setting of the questionnaires used for this thesis, this type of bias was most likely not introduced.

102102
Chapter 7
77
The questionnaires used (‘Regio-lijst’ and ISAAC questionnaire) were both validated,25,28 limiting
the possibility of systematic misinterpretation of questions or answering options. Nevertheless,
the Dutch version of the ISAAC questionnaire was never validated, and it has been shown
that parental understanding of the term ‘wheeze’ is problematic in certain languages.29 In the
Dutch language however, appropriate words for ‘wheeze’ are available, and the phrasing of the
question on wheeze was exactly the same in the ‘Regio-lijst’, which was found to be valid in the
Dutch language. We are therefore confident that the Dutch version of the ISAAC questionnaire
is a valid instrument. Misclassification of outcome may have occurred because parents may have
incorrectly recognised or recalled symptoms in their child. If this occurred differentially for parents
who are familiar with respiratory or atopic symptoms themselves and those who are not, it may
have led to an overestimation of the influence of genetic predisposition on the risk of atopic
disease. Since this was not the subject of our analyses, this has no consequences for the internal
validity of our studies.
Misclassification of exposure may have occurred in defining medication use in Chapter 3, which
has already been described extensively there, and in overweight and obesity in Chapter 4 and 6.
For these studies, we made use of prospectively collected data on participants’ height and weight.
The fact that these were measured by trained personnel in a standardized way is important,
because it eliminates bias associated with selective recall and social desirability.30 Measurements
were performed in a total of 6 different Child and Youth Health Care centres, but a child always
visited the same centre for its subsequent physical examinations. Across centres, methods of
anthropometric measurements were identical, following detailed protocols, and using the same
brand and type of digital flat scale and microtoise. We therefore assume good comparability
between measurements performed in different centres.
Body mass index (BMI) is a convenient and widely used measure for defining overweight and
obesity in epidemiological studies, but may not be a clinically relevant measure for overweight
or obesity, especially in young children. Because BMI does not reflect body fat distribution it
is debated whether it is a good measure for overweight in epidemiological studies. In a study
of Garcia-Marcos et al, however, it was concluded that BMI, percentage body fat and skinfold
thickness in school children yielded comparable results when investigating an association of
overweight with asthma.31
The Dutch growth reference we used for calculating standardised BMI scores and categorising
overweight and obese children, originated from the year 1997. Although growth references of
more recent years are currently available, we chose to use the reference from 1997 because
with increasing overweight and obesity in the population, a higher weight-for-height would
otherwise become more ‘normal’ over the years. While this would most likely not have affected
the underlying associations as such, a lower prevalence of overweight and obesity would have
reduced the statistical power to detect significant associations.

103103
General discussion
77
Implications for public health
Asthma and atopic diseases are still the most prevalent chronic diseases of childhood in the
Netherlands, and can have significant influence on the child’s well-being, school attendance, and
sports participation.32 Already in the 1990s, the regional Public Health Service in the ‘Westelijke
Mijnstreek’ recognized childhood respiratory diseases as an important health issue in the
region. While at that time the prevalence of asthma symptoms was the highest in this region
when compared to other parts of the Netherlands,33 the observed decrease and more recent
stabilisation in wheeze and asthma prevalence may be reassuring. Because of large geographical
and demographic differences, however, the results of our region cannot be easily applied to other
parts of the country, and it is unclear whether the prevalence of asthma and atopic diseases is
now comparable, higher or even lower than the prevalence in other Dutch regions. It would
therefore be of interest to monitor prevalence trends in other regions in the Netherlands or in
adjacent regions in Germany and Belgium.
As long as the factors responsible for the decrease (or for the initial increase) in wheeze and
asthma have not been identified, it remains unclear what prevention or intervention strategies
may be effective for a further reduction of asthma and atopic diseases in the Netherlands. Child
and Youth Health Care has access to the children shortly after birth until 19 years of age, and
given the evidence that atopic diseases have their beginnings early in life, primary prevention
strategies should be targeted as early as possible. It would be even better to reach pregnant
women, for instance through midwifery practices, in order to start primary prevention as early as
possible. To date, primary prevention strategies for childhood asthma by Child and Youth Health
Care aim at reducing exposure to tobacco smoke, and at promoting breastfeeding.34 From our
data, and from others10, it appears that exposure to ETS in Dutch children has decreased drastically
over the years. This may be a joint effect of nationwide mass media campaigns, smoking bans,
and individual advice by Child and Youth Health Care or other health care professionals, and will
hopefully continue in the future. Furthermore, since ETS was also found to be associated with
overweight, discouraging ETS exposure may over time reduce overweight in the population as
well. Since it is well possible that the harm of active or passive smoking during pregnancy may
be even greater, it is also important to reach pregnant women with education on this topic.
The promotion of breastfeeding may be beneficial for the prevention or expression of atopic
diseases and may prevent children to become overweight or obese.35 Data on breastfeeding is not
available for all survey years in our study, but in Chapter 2 (Table 2.1) we showed that the number
of children who were breastfed has increased between 2005 and 2010.
While reducing ETS exposure and promoting breastfeeding is beneficial for all children, special
attention in primary prevention currently goes to children of parents with atopic diseases, because
they are at higher risk of developing atopic diseases themselves. Because our findings confirmed a
link between overweight and asthma, we would like to increase awareness that also overweight
children are at higher risk of developing asthma. Children who are overweight or at risk of
104104
Chapter 7
77
becoming overweight may therefore benefit from these primary prevention strategies as well.
Secondary prevention strategies for asthma and atopic diseases currently mainly comprises of
identifying and avoiding (allergic) triggers and gaining good control of complaints with medication.
Child and Youth Health Care professionals can have a role in identifying children with (early
signs of) asthma, eczema or hay fever, provide their parents with information, and refer them
to a general practitioner or medical specialist for further medical examination, diagnoses, and
treatment. Again, increased awareness that overweight in children may be related to their asthma
is important. There is currently no evidence that interventions aimed at tackling overweight are
beneficial for asthma severity in overweight children who already developed asthma.
As long as the etiology of atopic diseases and the association between overweight and asthma
are not fully explained and modifiable risk factors have not been clearly identified, designing
intervention strategies for these diseases is challenging and perhaps even premature. One must
bear in mind that with many interacting factors responsible for both asthma and overweight,
the effect of any intervention aimed at one specific risk factor will only be small. Thus far, results
of interventions for primary prevention of allergic sensitization, wheeze, and asthma have been
disappointing, and there is much work left to gain more insight into what strategies would be
effective.
Recommendations for future research
For the development of effective prevention and intervention strategies for public health, it is
essential to identify modifiable risk factors at an age at which Child and Youth Health Care has
access to the children. To achieve this, we make three recommendations for future research.
The first recommendation is to monitor the prevalence of asthma and atopic diseases in other
regions in the Netherlands, or in neighbouring regions in Germany or Belgium. This will enable
comparison of prevalence trends and obtaining clues for (modifiable) factors that may explain
these trends. Secondly, increased collaboration between birth cohorts (national and international)
is recommended to increase statistical power to address the complex etiology of asthma and
atopic diseases. Especially more variation in children with non-atopic and atopic asthma is needed
when studying the association between overweight and asthma. Finally, we recommend future
studies to follow children longitudinally into adulthood, in order to increase knowledge of the
prognosis and consequences of childhood asthma, atopic diseases, and overweight on the longer
term. The LucKi Birth Cohort Study is an example of such a study, and will in time foreseeably shed
more light on how diseases and lifestyle patterns acquired in childhood will affect adolescents
and adults.
105105
General discussion
77
Performing research in a public health practice
The research presented in this thesis was part of the ‘Academic Collaborative Centre for Public
Health’ (in Dutch: Academische Werkplaats Publieke Gezondheid Limburg’). Aim of this centre
is to promote long-lasting collaborations between researchers, health care practitioners, and
policy makers in the public health domain. To this end, Maastricht University and the regional
Public Health Service in Southern Limburg work together with 18 municipalities (approximate
population: 600,000). Policy makers in the region need comprehensive and reliable information
as a basis for designing new policies. Researchers are challenged to answer research questions
that originate from and can be directly applied to health care and public health practice, which
increases the societal impact of the work performed. Public health and health care practitioners
are challenged to adopt a scientific way of thinking and to work more evidence-based. In this
setting, the present research project served as an example of how researchers can make use of
the infrastructure and information of Child and Youth Health Care practice in the ‘Westelijke
Mijnstreek’ for scientific research and for informing policy makers and public health and health
care practitioners. Our experiences and the opportunities and challenges we encountered are
discussed here.
Organisational, logistical, and ethical aspects
Performing research in Child and Youth Health Care practice has the advantage of efficiency;
making use of existing data and infrastructures is faster and cheaper than setting up a whole
new study. Furthermore, we have shown that by making use of the existing infrastructure for
distribution of the questionnaires, participation rates are high against low costs. Within Child and
Youth Health Care, data is collected in individual electronic records for the purpose of (health)
care of the individual child, but by aggregating records, a dataset on group level may be used
for scientific research. In practice, retrieving aggregated data from the digital registry was not
established that easily, an experience that was earlier also encountered at Public Health Services
in other regions in the Netherlands.36 The currently used digital registry system is not designed for
research purposes, and it would be recommended to involve researchers in an early (or earlier)
phase when designing or updating a new registry system in the future.
A logistical problem arose when we needed information from paper files. While the oldest files
were kept in the central archive and were rather easy to locate there, newer files were distributed
over six different locations in the region (so called Centres for Youth and Families, in Dutch:
‘Centra voor Jeugd en Gezin’). Naturally, the likelihood of successfully locating a file in one of
these locations was significantly lower, a phenomenon that is undesirable for research because it
may introduce selection bias. While this specific logistic problem may not apply to our digital era
anymore, it is still possible that (digital) data get lost, for example when organisations change to a
different software system. In this process, data is often not transferred to the new system (or only
the data that is perceived to be crucial for health care purposes, see also under ‘Quality of Child

106106
Chapter 7
77
and Youth Health care data’ below). We have experienced this problem when we attempted
to collect additional historical data on medication use from pharmacies in the study region.
Although pharmacists were able to recognize whether a study participant was registered in their
pharmacy, they could often not provide us with information on medication use in the past (>10
years ago) because of expired software systems. Also in the transfer period from paper registries
to a digital registry system, data can easily get lost if not all information is transferred completely
and correctly.
Collaboration between different institutions appeared to be complicated by certain legal and
ethical issues. For example, there was no preceding experience with whether and under what
conditions the data kept in the Child and Youth Health Care registry could be transferred to
researchers affiliated to the University. The Public Health Service is obliged by law to monitor
the health status of the population and undertake actions to promote public health, and has
its own consent agreement with the parents and children in their region, that is not necessarily
transferable to people outside the organisation. After consulting the national ‘Code of Conduct
for Medical Research’ and an organisational jurist of the regional Public Health Service, we agreed
that researchers at the University were allowed to use the Child and Youth Health Care registry
data anonymously and would only publish data on a group level, according to national legislation
and within the legal mandate of the Public Health Service.37,38 For LucKi, and for the previously
described attempt we made to obtain data from pharmacies in the study region, we obtained
ethical clearance from the Medical Research and Ethics Committee, in the form of a non-WMO
statement (WMO is the Dutch Act for Medical Research Involving Human Subjects).
The data transfer was further complicated because Child and Youth Health Care in the region
is carried out by two different organisations (Orbis Child and Youth Health Care for children
between 0-4 years, and the Child and Youth Health Care Department of the regional Public
Health Service for children between 5 and 19 years). Although the data of the 0-4 year-olds is the
property of Orbis Child and Youth Health Care, it is kept in the digital registry of the Public Health
Service, and only after approval from all parties the data could be transferred.
Quality of Child and Youth Health Care data
Besides organisational and logistical difficulties, it is important to realise that data that is registered
for health care purposes is not necessarily suitable for scientific research. Important aspects
regarding the quality of the data are its completeness and precision. Data may be incomplete
because information on the presence of a risk factor or undesirable behaviour is more often
registered than the absence. While this is generally sufficient for health care purposes, in research
this results in too many missing values. Furthermore, Hoofs et al. showed that there was a large
variation in how digital files within Child and Youth Health Care were completed.39 They found
that variables were often not consistently completed in the digital registry, due to large variations
between health care practitioners. Also, different practitioners registered the same variable on
different places in the digital file, which complicates systematic recording of variables. Variation
107107
General discussion
77
between practitioners in how and where variables are entered into the digital file will also affect
the precision of the data. For example, whether smoking is registered as yes/no, current/former,
or quantified in the number of cigarettes per day, will largely influence the opportunities for
researchers to use the data for scientific purposes.
Large improvements in the quality of health care data can be achieved by training health care
practitioners on how to complete the variables in the digital registry in a standardised way. Further-
more, it is of great importance to add a systematic tool for prospectively gathering information.
Usually this will be in the form of a questionnaire, preferably in an anonymous setting, in order
to minimise social desirability bias.
The data that Child and Youth Health Care collects on height and weight is of a high quality
that could never be achieved with questionnaires. Height and weight are measured repeatedly
throughout childhood in a standardised way, which is of great value for studies on growth and
overweight, and would probably be too costly to organise for research purposes only. This is an
important strength of the Child and Youth Health Care database.
Performing research in Child and Youth Health Care practice
When performing research in health care practice, the research depends fully on the daily routine.
This may be problematic when care as usual changes over time. We encountered this when the
age at which children are invited for a routine physical examination changed from 8/9 years
to 10/11 years from 2005 onwards. As a result, the children surveyed in 2005 and 2010 were
on average 2 years older than the children surveyed in earlier years, which may threaten the
methodology and complicate interpretation of the findings. Decisions about such changes are
usually made on a management level, in consultation with health care practitioners. In the future,
researchers will preferably be involved in order to better anticipate on the effects of these changes
on ongoing research in Child and Youth Health Care practice.
An important strength of following health care practice is that studying the children at an age
at which Child and Youth Health Care has access to them facilitates direct application of study
results to daily practice. While interventions that were shown to be effective in a controlled
research setting often show disappointing results when applied to health care practice, the
implementation of study results obtained from a dynamic, real-life setting is more likely to be
successful.
Health care practitioners may not always be fully aware of the need for a systematic approach
in scientific research. For example, in the distribution of the ‘Astma Monitor’ questionnaires, the
(non-)response was not always registered systematically by nurse assistants. This complicated the
calculation of the response rates, and may be prevented in the future by good communication
and mutual understanding between researchers and health care practitioners.
Taken together, performing research in health care practice may increase the societal impact
and may enable direct implementation of study results, but the dynamic setting of health care

108108
Chapter 7
77
practice may complicate the research methodology. Furthermore, digitalisation increases the
opportunities to make efficient use of routinely collected data, but it remains crucial to train
health care practitioners in systematic registration methods and to add a systematic research
tool (e.g. questionnaires). Finally, mutual understanding between researchers and health care
practitioners is the key for a successful and sustained collaboration.

109109
General discussion
77
References
1. CBS [Statistics Netherlands]. Gezondheid en zorg in cijfers 2009 [Health and health care statistics 2009]. The Hague: Centraal Bureau voor de Statistiek [Statistics Netherlands], 2010.
2. Mommers M, Gielkens-Sijstermans C, Swaen GM, van Schayck CP. Trends in the prevalence of respiratory symptoms and treatment in Dutch children over a 12 year period: results of the fourth consecutive survey. Thorax 2005; 60(2): 97-9.
3. Asher MI, Montefort S, Bjorksten B, et al. Worldwide time trends in the prevalence of symptoms of asthma, allergic rhinoconjunctivitis, and eczema in childhood: ISAAC Phases One and Three repeat multicountry cross-sectional surveys. Lancet 2006; 368(9537): 733-43.
4. Anthracopoulos MB, Fouzas S, Pandiora A, Panagiotopoulou E, Liolios E, Priftis KN. Prevalence trends of rhinoconjunctivitis, eczema, and atopic asthma in Greek schoolchildren: four surveys during 1991-2008. Allergy Asthma Proc 2011; 32(6): 56-62.
5. Hansen TE, Evjenth B, Holt J. Increasing prevalence of asthma, allergic rhinoconjunctivitis and eczema among schoolchildren: three surveys during the period 1985-2008. Acta Paediatr 2013; 102(1): 47-52.
6. Wijga AH, Smit HA, Poos MJJC. Hoe vaak komt astma voor, hoeveel mensen sterven eraan en neemt dit toe of af? In: Volksgezondheid Toekomst Verkenning, Nationaal Kompas Volksgezondheid. Bilthoven: RIVM, 27 mei 2014. Available from: http://www.nationaalkompas.nl/gezondheid-en-ziekte/ziekten-en-aandoeningen/ademhalingswegen/astma/omvang/ (accessed September 2015).
7. CBS [Statistics Netherlands]. Statline. The Hague/Heerlen: Centraal Bureau voor de Statistiek [Statistics Netherlands], 2011.
8. Bruijnzeel-Koomen C, Poos MJJC. Hoe vaak komt constitutioneel eczeem voor en neemt dit toe of af?In: Volksgezondheid Toekomst Verkenning, Nationaal Kompas Volksgezondheid. Bilthoven, RIVM, 11 June 2013.
9. DiFranza JR, Aligne CA, Weitzman M. Prenatal and postnatal environmental tobacco smoke exposure and children’s health. Pediatrics 2004; 113(4 Suppl): 1007-15.
10. Crone MR, Nagelhout GE, van den Burg I, Hirasing RA. Meeroken door kinderen in Nederland sinds 1996 sterk gedaald [Passive smoking in young children in the Netherlands sharply decreased since 1996]. Ned Tijdschr Geneeskd 2010; 154(50): A1658.
11. Papoutsakis C, Priftis KN, Drakouli M, et al. Childhood overweight/obesity and asthma: is there a link? A systematic review of recent epidemiologic evidence. J Acad Nutr Diet 2013; 113(1): 77-105.
12. Chinn S. Obesity and asthma: evidence for and against a causal relation. J Asthma 2003; 40(1): 1-16.
13. Story RE. Asthma and obesity in children. Current Opinion in Pediatrics 2007; 19(6): 680-4.
14. Moreira A, Bonini M, Garcia Larsen V, et al. Weight loss interventions in asthma: EAACI evidence-based clinical practice guideline (part I). Allergy 2013; 68(4): 425-39.
15. Chinn S, Rona RJ. Can the increase in body mass index explain the rising trend in asthma in children? Thorax 2001; 56(11): 845-50.
16. Goutaki M, Pescatore AM, Singh P, Beardsmore CS, Kuehni CE. Increased prevalence of pre-school wheeze is not explained by time trends in body mass index. Eur Respir J 2014; 44(4): 1078-82.
17. de Korte-de Boer D, Mommers M, Thijs C, et al. Early life growth and the development of preschool wheeze, independent from overweight: the LucKi Birth Cohort Study. J Pediatr 2015; 166(2): 343-9.e1.
18. Voraphani N, Martinez FD. Postnatal growth and the heterogeneity of preschool wheeze. J Pediatr 2015; 166(2): 226-8.
19. Lodge CJ, Zaloumis S, Lowe AJ, et al. Early-life risk factors for childhood wheeze phenotypes in a high-risk birth cohort. J Pediatr 2014; 164(2): 289-94.e1-2.
20. Baumann S, Lorentz A. Obesity - a promoter of allergy? Int Arch Allergy Immunol 2013; 162(3): 205-13.
110110
Chapter 7
77
21. Rothman KJ, Greenland S, Lash TL. Modern Epidemiology. 3rd edtion ed. Philadelphia: Lippincott Williams & Wilkins; 2008.
22. Chinn S. Concurrent trends in asthma and obesity. Thorax 2005; 60(1): 3-4.
23. Pekkanen J, Pearce N. Defining asthma in epidemiological studies. Eur Respir J 1999; 14(4): 951-7.
24. Remes ST, Pekkanen J, Remes K, Salonen RO, Korppi M. In search of childhood asthma: questionnaire, tests of bronchial hyperresponsiveness, and clinical evaluation. Thorax 2002; 57(2): 120-6.
25. Asher MI, Keil U, Anderson HR, et al. International Study of Asthma and Allergies in Childhood (ISAAC): rationale and methods. Eur Respir J 1995; 8(3): 483-91.
26. Martinez FD, Wright AL, Taussig LM, Holberg CJ, Halonen M, Morgan WJ. Asthma and wheezing in the first six years of life. N Engl J Med 1995; 332(3): 133-8.
27. Hoofs H, Jansen NW, Mohren DC, Jansen MW, Kant IJ. The context dependency of the self-report version of the Strength and Difficulties Questionnaire (SDQ): a cross-sectional study between two administration settings. PLoS One 2015; 10(4): e0120930.
28. Verkerk P, Rijcken B. Evaluatie van een vragenlijst naar respiratoire symptomen en de maatschappelijke gevolgen hiervan in een open populatie [Evaluation of a respiratory symptoms questionnaire and its social implications in an open population]. T Soc Gezondheidsz 1988; 66: 102-5.
29. Michel G, Silverman M, Strippoli MP, et al. Parental understanding of wheeze and its impact on asthma prevalence estimates. Eur Respir J 2006; 28(6): 1124-30.
30. Connor Gorber S, Tremblay M, Moher D, Gorber B. A comparison of direct vs. self-report measures for assessing height, weight and body mass index: a systematic review. Obes Rev 2007; 8(4): 307-26.
31. Garcia Marcos L, Valverde Molina J, Ortega ML, Sanchez Solis M, Martinez Torres AE, Castro Rodriguez JA. Percent body fat, skinfold thickness or body mass index for defining obesity or overweight, as a risk factor for asthma in schoolchildren: which one to use in epidemiological studies? Matern Child Nutr 2008; 4(4): 304-10.
32. O’Connell EJ. The burden of atopy and asthma in children. Allergy 2004; 59 Suppl 78: 7-11.
33. van der Wal MF, Uitenbroek DG, Verhoeff AP. Toegenomen percentage basisschoolkinderen met astmatische klachten in Nederland, 1984/’85-1994/’95; een literatuuronderzoek. Ned Tijdschr Geneeskd 2000; 144(37): 1780-5.
34. Lanting CI, Heerdink-Obenhuijsen N, Wagenaar-Fischer MM, van Gameren-Oosterom HBM, Breuning Boers JM, Toll DB, Mohangoo AD. JGZ-richtlijn Astma bij kinderen [Guideline Asthma in children]. Utrecht: Nederlands Centrum jeugdgezondheid, 2011.
35. Verduci E, Banderali G, Barberi S, et al. Epigenetic effects of human breast milk. Nutrients 2014; 6(4): 1711-24.
36. Meuwissen L. Digital registry Child and Youth Health Care does not yet give insight [E-dossier jgz leidt nog niet tot inzicht]. Medisch Contact 2013; (2): 80-2.
37. Federa. Code of Conduct for Health Research. Rotterdam: Foundation Federation of Dutch Medical Scientific Societies, 2004.
38. Dutch DPA. Access to digital patient records within health care facilities [Toegang tot digitale patiëntendossiers binnen zorginstellingen]. The Hague: Dutch Data Protection Authority [College Bescherming Persoonsgegevens], 2013.
39. Hoofs H, Jansen M, Mohren DC, Reijs R, Jansen NW, Kant IJ. Is het DD-JGZ bruikbaar voor epidemiologisch onderzoek? [Is Youth Health Care Digital Registry useful for epidemiologic research]. JA!-Plus 2015; (33): 1-7.

77
SummaryChapter 4Chapter 3
de Korte-de Boer D, Mommers M, Gielkens-Sijstermans CML, Creemers HMH, Mujakovic S, Feron FJM, van Schayck CP
Submitted
Summary
111

112112
Summary
Asthma and atopic diseases (eczema (atopic dermatitis), allergic asthma, and hay fever (seasonal
rhinoconjunctivitis)) are the most common non-communicable diseases of childhood in developed
countries, where also overweight and obesity present a significant threat to the health of many
children. These diseases are therefore important themes for public health in the Netherlands.
The work presented in this thesis originates from a research project embedded in Child and
Youth Health Care Practice of the Public Health Service ‘South Limburg’, with the objectives
to 1) describe prevalence trends of wheeze, asthma and atopic diseases in the study region
the ‘Westelijke Mijnstreek’, 2) to explore whether changes in medication use or changes in
overweight in the population could (partly) explain these trends, and 3) to investigate whether
growth patterns in early life could explain the development of asthma symptoms and overweight
in preschool children. Besides these objectives, this research project served as an example of how
data that is (routinely) collected within the Child and Youth Health Care practice can be used for
scientific research.
Part I: Prevalence trends - ‘Astma Monitor Westelijke Mijnstreek’
In Part I of this thesis, prevalence trends of wheeze and atopic diseases among school children in
the ‘Westelijke Mijnstreek’ (a region in the southeast of the Netherlands) were examined using
data from the ‘Astma Monitor Westelijke Mijnstreek’. In the ‘Astma Monitor’, the Child and Youth
Health Care department of the Public Health Service South Limburg has been monitoring the
prevalence of respiratory symptoms with repeated cross-sectional surveys among schoolchildren
in the region since 1989. The last, sixth, survey of the ‘Astma Monitor Westelijke Mijnstreek’
study took place in 2010. In each survey year, a questionnaire on respiratory health (and from
2001 onwards also including questions on eczema and hay fever) was distributed among
schoolchildren who were invited for a routine preventive health examination by Child and Youth
Health Care. As part of the routine examination, the child’s height and weight were measured in
a standardised way. In consecutive cross-sectional surveys between 1989 and 2010 among 4-7
and 8-11 year-old school children, we measured the prevalence of respiratory symptoms, asthma,
eczema, and hay fever in the study region.
Previously, a decrease in childhood wheeze prevalence was shown with data from the ‘Astma
Monitor’ for the Netherlands. This was in contrast with many other countries where prevalence
trends of asthma and atopic diseases are still increasing or at best stabilising. In Chapter 2 we
investigated whether the previously observed decreasing trend in wheeze continued between
2001 and 2010, and additionally examined prevalence trends of eczema, asthma and hay fever
among 8-11 year-old schoolchildren eligible for a routine physical examination. Overall, ~90%
participated (mean age: 8.8 years in 2001 and 10.5 years in 2005 and 2010). We observed
no further decrease in wheeze prevalence until 2010. Similarly, the prevalence of asthma and
eczema did not change significantly between 2001 and 2010, but hay fever prevalence increased
113113
Summary
from 8.4% in 2001 to 12.3% in both 2005 and 2010 (ptrend<0.01). The latter may be an effect of
older age and not a true increase over time.
It has been suggested that the initial decrease in wheeze prevalence in our study region may, at
least partly, reflect increased early detection and treatment of children with asthma, rather than a
true decline in asthma prevalence. In Chapter 3 we hypothesised that the introduction of inhaled
corticosteroids for the treatment of childhood asthma in the 1990s has led to better control
of asthma symptoms, and consequently epidemiologic studies merely measured less asthma
symptoms in the population, while in fact the underlying disease was still present. We tested
this hypothesis with data from the ‘Astma Monitor’ between 1989 and 2005, and identified
all children for whom a questionnaire was completed in two successive surveys. Children were
grouped according to birth year and classified into one out of four wheeze categories: ‘no
wheeze’, ‘discontinued wheeze’, ‘continued wheeze’, or ‘new-onset wheeze’. In total, 3339
children, born in 1983 (N=670), 1988 (N=607), 1992 (N=980), and 1995 (N=1082), participated
twice. We found that over the study period, the proportion of children with ‘no wheeze’ increased
from 73.8% to 86.1% (ptrend<0.001), while the proportion of children with ‘discontinued’ and
‘continued’ wheeze decreased from 13.2% to 6.3% (ptrend<0.001) and from 8.8% to 3.1%
(ptrend<0.001), respectively. Medication use was consistently associated only with the presence of
wheeze symptoms and this association did not change over time (pbirth year*medication use>0.05 for all
wheeze categories). Thus, we concluded that an increasing trend of Dutch school children with
‘no wheeze’, and decreasing trends of children with (‘discontinued’ and ‘continued’) wheeze
between 1989 and 2005 could not be explained by (increased) medication use. This suggests that
wheeze prevalence is not masked by medication use, but is truly declining.
While wheeze and asthma prevalence decreased and (then) stabilised, overweight continues
to increase in our population. An association of childhood overweight with asthma has been
described extensively in the literature, but appears counterintuitive in the presence of these
diverging prevalence trends. Nonetheless, in Chapter 4 we found that a higher body mass index
standardised for age and sex (BMI-SDS) was associated with wheeze (aOR 1.09 (1.03-1.16)) and
asthma (aOR 1.12 (1.00-1.27)) in individuals in all surveys between 1993 and 2010, confirming
a link between childhood overweight and asthma. The nature of the association remains largely
unclear, and many interacting factors ultimately determine prevalence trends, but with a more
recent stabilization in wheeze and continuing increases in overweight, we must be aware that
wheeze and asthma prevalence may start to increase again in the future.
Part II: Early life growth - LucKi Birth Cohort Study
In Chapter 5, the rationale and design of the LucKi Birth Cohort Study was described. LucKi is an
ongoing, dynamic, prospective birth cohort study, embedded in the Child and Youth Health Care
(CYHC) practice of the ‘Westelijke Mijnstreek’, and follows children from birth into adulthood
114114
Summary
on a wide range of determinants, disorders, and diseases. During preschool and school years,
the primary focus is on the etiology and prognosis of atopic diseases (eczema, asthma, and
hay fever) and overweight/obesity. Recruitment (1-2 weeks after birth) and follow-up (until
19 years) coincide with routine CYHC contact moments, during which the child’s physical and
psychosocial development is closely monitored, and anthropometrics are measured repeatedly
in a standardised way. Information gathered through CYHC is complemented with repeated
parental questionnaires, and information from existing registries of pharmacy, hospital and/
or general practice. The LucKi Birth Cohort Study provides a framework in which children are
followed from birth into adulthood. Through embedment in CYHC, LucKi is easily implemented,
has low maintenance costs and high participation rates, and facilitates direct implementation
of study results into CYHC practice. Furthermore, LucKi provides opportunities to initiate new
(experimental) studies and/or to establish biobanking in (part of) the cohort, and contributes
relevant information on determinants and health outcomes to policy and decision makers.
With longitudinal data from LucKi participants who were followed until 3 years of age, the
association of early life growth rates with preschool wheezing was explored in Chapter 6. We
hypothesised that rapid somatic growth in early life was a shared risk factor for asthma and
overweight. Children from the LucKi Birth Cohort Study with complete follow-up for repeated
questionnaires (at ages 0, 7, 14 months and 3 years) and informed consent to use height and
weight data (measured by trained personnel at ages 0, 7, 14 months, 2 and 3 years) were
included (N=566). Wheezing (parentally reported) and overweight (Body Mass Index (BMI) > 85th
percentile) were regressed with Generalised Estimating Equations on birth weight and relative
growth rates (difference standard deviation scores for weight, height and BMI). We found that
higher birth weight and higher weight and BMI growth rates were associated with increased risk
of overweight up to 3 years, but not with wheezing. Higher height growth rate was associated
with lower risk of wheezing up to 3 years, independent from overweight (aOR: 0.65 (0.53-0.79)).
In time-lag models, wheezing was associated with subsequently reduced height growth up to
age 14 months, and not vice versa. Rather than weight and BMI growth, only height growth
rate is associated with preschool wheezing, independent from overweight. Children who wheeze
demonstrate a subsequent reduction in height growth up to 14 months of age, and not vice
versa. Since height growth rates were not associated with overweight, preschool wheezing and
overweight are not associated through early life growth.
General Discussion
In Chapter 7 the main findings of the work in this thesis were summarised and discussed in light
of existing scientific literature and methodological strengths and limitations. Also, implications of
the study results for public health were discussed, and recommendations were made for future
scientific studies. Finally, based on our experiences, opportunities and pitfalls of doing research in

115115
Summary
a public health environment were discussed.
We concluded that the decreasing and stabilising prevalence trends of asthma and atopic
diseases in the ‘Westelijke Mijnstreek’ are reassuring for the region, but – since the factors
that are responsible for the worldwide increase and/or the more recently observed decreases
are largely unknown – further research is needed to investigate the complex associations of all
factors involved in the etiology of asthma, atopic diseases and overweight. Only if the role of
protective and risk factors becomes clearer, effective prevention and intervention strategies can be
developed. Meanwhile, Child and Youth Health Care aims at reducing exposure to environmental
tobacco smoke and promoting breastfeeding. Based on our results, we would like to increase
awareness that overweight and obese children may be at risk for developing asthma and may
therefore also benefit from these prevention strategies.
Performing research in Child and Youth Health Care practice offers excellent opportunities. The
societal impact of the research is naturally higher, and direct implementation of study results into
daily practice is easily facilitated. However, the research depends fully on the dynamic setting,
which may complicate the research methodology, and data that is collected for health care
purposes is not necessarily suitable for scientific research purposes. Digitalisation of the data
collection further increases the opportunities to make efficient use of routinely collected data, but
it remains crucial to train health care practitioners in systematic registration methods and to add a
systematic research tool (e.g. questionnaires). Finally, mutual understanding between researchers
and health care practitioners is the key for a successful and sustained collaboration.

116

117
Samenvatting
Chapter 4Chapter 3
Samenvatting
117

118118
Samenvatting
Algemene inleiding
Astma en atopische aandoeningen (eczeem, allergisch astma en hooikoorts) zijn de meest voorko-
mende chronische aandoeningen bij kinderen in westerse landen. Ook overgewicht en obesitas
bedreigen de gezondheid van veel kinderen. Deze aandoeningen zijn daarom belangrijke thema’s
voor jeugdgezondheidszorg in Nederland.
Het onderzoek dat in dit proefschrift beschreven wordt komt voort uit een langdurige samen-
werking tussen de Universiteit Maastricht en de GGD Zuid-Limburg. In een later stadium is ook
Orbis Jeugdgezondheidszorg (sinds kort: Zuyderland Jeugdgezondheidszorg) betrokken bij dit
onderzoek. De doelstellingen van dit onderzoeksproject waren:
1. het beschrijven van trends in de prevalentie (het vóórkomen) van luchtwegklachten en
atopische aandoeningen tussen 1989 en 2010 bij schoolkinderen in de regio ‘de Westelijke
Mijnstreek’,
2. onderzoeken of het gebruik van medicatie en/of veranderingen in de prevalentie van over-
gewicht deze trends kan verklaren,
3. onderzoeken of groeipatronen in de eerste drie levensjaren de ontwikkeling van astma-
(symptomen) en overgewicht kunnen verklaren.
Daarnaast diende dit onderzoeksproject als voorbeeld hoe routinematige verzamelde gegevens in
de jeugdgezondheidszorg gebruikt kunnen worden voor wetenschappelijk onderzoek.
Deel 1: Prevalentietrends ‘Astma Monitor Westelijke Mijnstreek’
Voor de eerste drie artikelen uit dit proefschrift werd gebruik gemaakt van gegevens van de
‘Astma Monitor Westelijke Mijnstreek’. De GGD Zuid-Limburg heeft tussen 1989 en 2010 gege-
vens verzameld over het vóórkomen van luchtwegklachten en atopische aandoeningen bij
schoolgaande kinderen in de Westelijke Mijnstreek door middel van herhaalde, cross-sectionele
vragenlijstonderzoeken. Elke vier à vijf jaar vond een peiling plaats onder alle kinderen die in dat
jaar in aanmerking kwamen voor een Periodiek Gezondheidsonderzoek (PGO) bij de GGD.
In Hoofdstuk 2 onderzochten we of een in eerder onderzoek aangetoonde daling in de preva-
lentie van luchtwegklachten onder 8- tot 11-jarigen (tussen 1989 en 2001), doorzette tussen
2001 en 2010. Dit bleek niet het geval: het percentage kinderen met luchtwegklachten daalde in
deze periode niet significant (7.4% in 2001, 8.7% in 2005 en 6.2% in 2010). Ook de prevalentie
van eczeem en astma (diagnose) in de regio bleef in de periode 2001-2010 stabiel. De prevalentie
van hooikoorts leek te stijgen van 8.4% naar 12.3% in zowel 2005 als 2010, maar dit is zeer
waarschijnlijk een effect van een hogere gemiddelde leeftijd in de groep kinderen in 2005 en
2010.
In de jaren ’90 werden in Nederland inhalatiecorticosteroïden voor de behandeling van astma
bij kinderen geïntroduceerd. Deze medicatie zorgt voor een betere controle van astmaklachten,

119119
Samenvatting
maar kan astma niet genezen. Dit kan tot gevolg hebben dat in vragenlijstonderzoek astma-
symptomen minder vaak gerapporteerd worden, waardoor de prevalentie van de ziekte
ogenschijnlijk afneemt, terwijl de onderliggende ziekte in werkelijkheid nog wel aanwezig is. In
Hoofdstuk 3 onderzochten we of de in eerder onderzoek aangetoonde daling in de prevalentie
van luchtwegklachten verklaard kan worden door veranderingen in medicatiegebruik. Over de
periode 1989-2005 konden we dit niet aantonen. Het lijkt er dus op dat het voorkomen van
luchtwegklachten niet gemaskeerd wordt door medicatiegebruik, maar dat het in werkelijkheid
is afgenomen.
Terwijl de prevalentie van astma en astmasymptomen bij schoolgaande kinderen in de Westelijke
Mijnstreek afnam en daarna stabiliseerde, neemt de prevalentie van overgewicht en obesitas in
deze populatie nog altijd toe. Dit lijkt een verband tussen astma en overgewicht tegen te spreken,
terwijl een dergelijk verband uitgebreid beschreven wordt in de wetenschappelijke literatuur.
Desondanks vonden we in Hoofdstuk 4 dat in alle peiljaren tussen 1993 en 2010 kinderen met een
hogere body mass index (BMI) vaker astmasymptomen en een astmadiagnose hadden. Er zijn veel
verschillende factoren van invloed op het voorkomen van astma en overgewicht. We hebben in dit
hoofdstuk in meer detail onderzocht wat het effect van blootstelling aan omgevingstabaksrook op
de prevalentietrends van astma en overgewicht zijn; blootstelling aan tabaksrook was gerelateerd
aan het vaker voorkomen van zowel astma als overgewicht. Het percentage kinderen dat thuis
blootgesteld wordt aan tabaksrook is in onze studiepopulatie sterk gedaald van 49.1% in 1993
naar 13.9% in 2010. Deze daling zou de afname in astma(symptomen) in onze populatie kunnen
verklaren, maar verklaart niet waarom overgewicht nog blijft toenemen. Waarschijnlijk hebben
andere factoren, zoals fysieke activiteit en voedingsinname een grotere invloed op overgewicht
dan de blootstelling aan omgevingstabaksrook. Indien de blootstelling aan omgevingstabaksrook
niet verder daalt en overgewicht blijft toenemen, bestaat de mogelijkheid dat de prevalentie van
astma in de toekomst weer gaat stijgen.
Deel 2: Groei in de eerste levensjaren ‘LucKi Birth Cohort Study’
In Hoofdstuk 5 wordt de achtergrond en de aanpak van de ‘LucKi Birth Cohort Study’ beschreven.
LucKi is de opvolger van de ‘Astma Monitor Westelijke Mijnstreek’, waarin kinderen die onder het
bereik van de jeugdgezondheidszorg in de regio vallen vanaf de geboorte gevolgd worden. Met
behulp van vragenlijsten en gegevens uit de jeugdgezondheidszorgregistratie, aangevuld met
informatie van apotheken, huisartsen en ziekenhuizen, worden ontwikkelingen in groei, welzijn,
ziekte en gezondheid van een grote en groeiende groep kinderen en adolescenten in kaart
gebracht. Gedurende de kinderjaren ligt de nadruk op atopische aandoeningen en overgewicht.
Uiteindelijk zullen LucKi onderzoekers over een rijke gegevensverzameling beschikken waarmee
actuele onderzoeksvragen vanuit de zorg- en beleidspraktijk beantwoord kunnen worden.
In Hoofdstuk 6 onderzochten we de relatie tussen groei(snelheid) en het ontwikkelen van

120120
Samenvatting
astmasymptomen en overgewicht met behulp van de gegevens van kinderen die binnen LucKi
tot en met 3 jaar werden gevolgd. We vonden dat een hoger geboortegewicht en een hogere
gewichts- en BMI-toename op 3-jarige leeftijd een hogere kans op overgewicht met zich
meebrachten, maar geen relatie vertoonden met astmasymptomen. Een snellere lengtegroei was
op 3-jarige leeftijd juist gerelateerd aan een hogere kans op astmasymptomen, maar niet op
overgewicht. Dit betekent dat groeisnelheid in de eerste levensjaren niet kan verklaren hoe astma
en overgewicht samenhangen.
Algemene discussie
In Hoofdstuk 7 worden de belangrijkste bevindingen samengevat en bediscussieerd tegen de
achtergrond van bestaande wetenschappelijke literatuur en methodologische sterke en zwakke
punten. Ook worden aanbevelingen gedaan voor toekomstig wetenschappelijk onderzoek en
worden implicaties voor de jeugdgezondheidszorgpraktijk besproken. Daarnaast beschrijven
we in dit hoofdstuk onze ervaringen met het uitvoeren van wetenschappelijk onderzoek in de
praktijk van de jeugdgezondheidszorg.
De dalende en stabiliserende prevalentietrends van astma, eczeem en hooikoorts in de
Westelijke Mijnstreek zijn geruststellend voor de publieke gezondheidszorg. Echter, aangezien
het grotendeels onduidelijk is welke factoren deze trends verklaren, is er vervolgonderzoek
nodig naar de complexe relaties tussen alle factoren die van invloed zijn op astma, atopische
aandoeningen en overgewicht. Pas als de rol van beschermende en risicofactoren duidelijker
wordt, kunnen gerichte preventie- en interventiemaatregelen ontwikkeld worden. In de
tussentijd richt jeugdgezondheidszorg in Nederland zich op het verminderen van blootstelling aan
omgevingstabaksrook en het bevorderen van borstvoeding, met name bij kinderen bij wie astma
en allergieën in de familie voorkomen. Op basis van onze bevinding dat kinderen met overgewicht
vaker astma en astmasymptomen hebben, bevelen we aan dat deze preventiemaatregelen ook
gericht worden aan kinderen met (een verhoogd risico op) overgewicht.
Onderzoek doen in de praktijk van de jeugdgezondheidszorg kent belangrijke voordelen. De
maatschappelijke impact van het onderzoek is hoog omdat actuele onderzoeksvragen vanuit
de praktijk beantwoord kunnen worden en studieresultaten direct geïmplementeerd kunnen
worden. Niettemin liggen er in de dynamische zorgpraktijk uitdagingen voor de methodologie
van het onderzoek; veranderingen in logistiek en zorgstructuur compliceren het onderzoek en
bovendien zijn gegevens die verzameld worden ten behoeve van de zorg niet vanzelfsprekend
geschikt voor onderzoeksdoeleinden. Digitalisering van gegevens schept de mogelijkheid om
zeer efficiënt gebruik te maken van de verzamelde data, maar het is van cruciaal belang om
zorgverleners te trainen in het systematisch registreren van gegevens en om een systematisch
onderzoeksinstrument toe te voegen aan bestaande registraties. Wederzijds begrip tussen
onderzoekers en zorgverleners is de sleutel tot een succesvolle en bestendige samenwerking.

VALORISATION
Valorisation
121
122122
Valorisation
In the previous chapters we described a series of studies on (trends in) asthma, atopic diseases
and overweight among Dutch children, and discussed their value in terms of recommendations
for future scientific research and implications for public health. Furthermore, we reflected on our
experiences of performing research in health care practice. In this valorisation addendum, we
discuss how the acquired knowledge may further impact society.
Valorisation is the term that governmental and university policy makers use to denote the process
of ‘translating academic wisdom to societal benefit’.1 This chapter is dedicated to knowledge
valorisation of our study results to three specific target audiences: health care practitioners, policy
makers, and parents and children. For each group separately we describe which knowledge is
particularly applicable, why it is specifically suited for this audience, what valorisation steps we
have already undertaken, and how we can establish further knowledge transfer in the (nearby)
future.
Health care practitioners
In Chapter 7 we have highlighted the implications of our study results for public health. Given
the evidence that atopic diseases and overweight have their beginnings early in life, we made the
recommendation to target primary prevention strategies for these diseases as early as possible.
Reaching children who are at high(er) risk of developing asthma, atopic diseases and overweight,
requires awareness of health care practitioners for risk factors, signs and symptoms of these
diseases. Preferably, Child and Youth Health Care should expand its network by (increased) colla-
boration with midwifery practices and obstetrics departments in the region, so that pregnant
women can be reached with important information on risk factors and prevention strategies for
asthma, atopic diseases, and overweight. At least, such collaboration comprises of the distri-
bution of information leaflets with up-to-date and evidence-based recommendations for lifestyle
choices. Ideally, the collaboration also includes an active information exchange between health
care practitioners of different specialisations and a referral system for pregnant women at high
risk for asthma, atopic diseases, and overweight to receive tailored prevention advice from a
specialised practitioner.
We also recommended that among health care practitioners awareness should be raised for the
fact that children with overweight are at increased risk for asthma. This is important for targeting
prevention strategies, but also for diagnostics and treatment for asthma and overweight. Based on
this information Child and Youth Health Care physicians may decide to refer overweight children
with signs and symptoms of asthma at an earlier stage to a general practitioner or pediatrician.
A brief description of overweight as a risk factor for asthma is already included in the national
guideline ‘Asthma in children’ for Child and Youth Health Care physicians,2 but by presenting
our results in a newsletter and/or a specialised national journal, or through a presentation at a
refresher seminar we hope to draw more attention to this important topic.

123123
Valorisation
Furthermore, in Chapter 7 we have underlined the importance of close collaboration between
scientific researchers and health care practitioners. This is essential for two reasons; first, the
information and infrastructure of health care practice is valuable for research purposes, and
second, relevant research should (more often) focus on research questions that originate from
health care practice. In order to increase understanding of the needs of researchers (e.g. the
need for standardised data collection) and health care practitioners (e.g. the need for scientific
research that is directly applicable to daily practice) several steps may be taken. During this PhD
project, we have presented some results of the LucKi Birth Cohort Study at a refresher education
seminar organised for Child and Youth Health Care physicians, resulting in a lively discussion of
future research opportunities within Child and Youth Health Care. In the nearby future we plan
to organise a (series of) meeting(s) between LucKi researchers and Child and Youth Health Care
physicians and nurse assistants, in order to increase and maintain awareness for the possibilities
and yields of scientific research in health care practice, and to receive input for new relevant
research questions.
Next to presenting scientific research and increasing dialogues between researchers and health
care practitioners, the Academic Collaborative Centre for Public Health invests in education and
‘academisation’ of nurses and physicians working in public health. Increased scientific thinking
and promoting an evidence-based approach in health care practice from the inside out will in
time tighten or even close the (perceived) gap between research and practice.
Policy makers
Public health is an important theme for local, national and regional authorities. In order to make
decisions on public health policies, policy makers need comprehensive and reliable input on
health and disease in the population. Among other things, up-to-date scientific evidence on
levels and trends of disease in the population is essential for designing integrated health policies.
Therefore, practice- and region-based research such as ours is helpful for local, regional and
national policy makers.
The fact that we observed an initial decline and a more recent stabilisation in the prevalence of
asthma symptoms and atopic diseases is reassuring for public health. Because the decline may
(partly) be explained by a profound decrease in exposure to environmental tobacco smoke (ETS)
over the years, this information may strengthen policy makers in their efforts to further control
passive and active smoking. Importantly, since asthma is not the only harmful effect of active
and passive smoking, tobacco control measures will have beneficial effects on many other health
aspects of the population.
As we described earlier, the association of overweight and asthma (symptoms) may imply that
with continuing increases in overweight and obesity, the prevalence of asthma may start to
increase again. However, since the exact nature of the association between overweight and
124124
Valorisation
asthma is currently not completely understood, it is too early to conclude that prevention or
treatment of overweight and obesity will also affect asthma prevalence. Nevertheless, overweight
and obesity increase the risk of many other health aspects, and it is therefore important for policy
makers to understand the future risks of overweight and obesity, and to promote healthy living
environments that support an active and healthy lifestyle. Our study can contribute to keeping
this theme high on the agenda in local, regional and national government, not only in the policy
domain of health, but also in the policy domains of spatial planning, living environment, and
social support.
With data from the ‘Astma Monitor Westelijke Mijnstreek’ and the LucKi Birth Cohort Study we
have already contributed to the ‘National Public Health Compass’ (NPHC) (in Dutch: Nationaal
Kompas Volksgezondheid)3 and the regional ‘Public Health Status and Foresight Report’
(PHSF) 20144 (in Dutch: regionale Volksgezondheid Toekomst Verkenning 2014). The NPHC is
the gateway to information about health and disease, risk factors, care and prevention in the
Netherlands, and the regional PHSF 2014 provides a broad overview of the most important trends
in public health in South Limburg. These reports are freely accessible on the internet and are
meant for professionals who are active in the field of public health, such as policy makers at
the ministry of health, regional and local authorities, health care providers, patients, consumer
organisations, insurers, researchers and health educators.
Furthermore, we plan to publish a public friendly summary on the GGD website, and a factsheet
especially targeted at policy makers in South Limburg. Also, all 18 municipalities will receive
an invitation to join a meeting during which the results of this thesis will be presented and its
implications for public health policy will be discussed.
Parents and children
Citizens are increasingly more involved and interested in scientific results. There is a need for
researchers to be transparent and inform the lay public about why and how public money is
spent on scientific research. The results of our study are especially noteworthy for parents and
their children, and therefore we will make effort to transfer our acquired knowledge to parents;
primarily in the study region, but possibly also in other parts of the Netherlands. This target
audience will best be reached through the regional Child and Youth Health Care network and
through primary and secondary schools.
Our observation that the prevalence of asthma and atopic diseases has been stabilising over the
past years in the region may be reassuring, especially because childhood respiratory diseases were
recognised as an import public health issue in the region, and because there are longstanding
concerns about the air quality in this region. Also, it is important to communicate the relation
between asthma and overweight, as we suspect that this is not generally known.
125125
Valorisation
Through a newsletter that is distributed to all parents of 0-18-year-old children in the region,
we will be able to thank parents for their participation in the studies and inform them about the
latest findings and parenting advices. For children in primary and secondary education, LucKi
researchers may develop guest lectures on important health related topics and healthy lifestyles
such as physical activity and non-smoking behaviour. Also, using modern (social) media platforms
(e.g. developing a website or app, and using platforms such as Facebook and Twitter) to involve
and educate school children is a great opportunity for dissemination of LucKi findings and healthy
lifestyle messages in the future.

126126
Valorisation
References
1. Maastricht Centre for Entrepeneurship. Workshop ‘Crafting the Valorisation Paragraph for your Doctoral Thesis’. 2015. Available from: http://valorisationworkshop.nl/ (accessed September 2015).
2. Lanting CI, Heerdink-Obenhuijsen N, Wagenaar-Fischer MM, van Gameren-Oosterom HBM, Breuning Boers JM, Toll DB, Mohangoo AD. JGZ-richtlijn Astma bij kinderen [Guideline Asthma in children]. Utrecht: Nederlands Centrum jeugdgezondheid, 2011.
3. Wijga AH, Smit HA, Poos MJJC. Hoe vaak komt astma voor, hoeveel mensen sterven eraan en neemt dit toe of af? In: Volksgezondheid Toekomst Verkenning, Nationaal Kompas Volksgezondheid. Bilthoven: RIVM, 27 mei 2014. Available from: http://www.nationaalkompas.nl/gezondheid-en-ziekte/ziekten-en-aandoeningen/ademhalingswegen/astma/omvang/ (accessed September 2015).
4. Steenbakkers M, Vermeer AJM, Janssen-Goffin MJH, Hajema K. Een nieuwe kijk op gezondheid in Zuid-Limburg. Regionaal rapport Volksgezondheid Toekomst Verkenning 2014 [A new view on health in South Limburg. Regional report Public Health 2014]. Geleen: GGD Zuid-Limburg, 2014

127127
About the author
About the author
About the author
127

128

129129
About the author
Dianne de Korte-de Boer was born on 24 January 1982 in Utrecht, the Netherlands. In 1999, after
graduating from secondary school (VWO, pre-university education) at the Niftarlake College in
Maarssen, she followed a one-year basic program at the Evangelische Hogeschool in Amersfoort.
In 2000, she moved to Maastricht to study Health Sciences at Maastricht University, and graduated
in 2005 with a specialisation in Movement Sciences (MSc degree).
Before starting the research project that resulted in this thesis, Dianne worked on several research
projects in the field of tobacco smoking and smoking cessation. For ‘MIRO: innovation in smoking
cessation’, a care optimisation program in which smoking cessation experts in the Netherlands
work together, she wrote an extensive review on the state of knowledge on supporting smoking
cessation in health care, which served as starting point for initiating new research on this topic. For
STIVORO, the Dutch expert centre on tobacco control in The Hague, she wrote several publications
on trends in smoking and smoking behaviour in the Netherlands. At the department of General
Practice at Maastricht University (school CAPHRI), she investigated the effect of smoking bans on
the incidence of sudden cardiac arrest in South Limburg, the Netherlands.
In December 2009, Dianne started working as a PhD candidate at the department of Epidemiology
at Maastricht University (school CAPHRI), under the supervision of Prof. Dr. Onno van Schayck,
Prof. Dr. Frans Feron and Dr. Monique Mommers. The project was part of the ‘Academic
Collaborative Centre for Public Health’ (in Dutch: Academische Werkplaats Publieke Gezondheid
Limburg), and therefore took place in close collaboration with the regional Public Health Service
(GGD Zuid-Limburg). During this PhD project she investigated trends in childhood asthma and
atopic diseases, which resulted in the publications presented in this thesis and in several oral
and poster presentations at national and international conferences. In September 2010, Dianne
enrolled as a part-time student in the Epidemiology Master Program of Maastricht University, and
obtained her second MSc degree cum laude in May 2013.
In December 2013, Dianne continued working at the department of Epidemiology on a
demonstration project in which data of a birth cohort study was linked to a large pharmaceutical
database. Together with Dr. Carel Thijs and Dr. Monique Mommers she prepared the linkage and
investigated the feasibility, validity and added value of such a linkage for future research.
From April 2015 onwards, Dianne works as an epidemiologist at the department of Anesthesiology
and Pain Management at Maastricht University Medical Centre, where she contributes to several
research projects.

130

131
List of publications
List of publications
131

132132
List of publications
Peer-reviewed publications
De Korte-de Boer D, Mommers M, Gielkens-Sijstermans CML, Creemers HMH, Mujakovic SM, Feron
FJM, van Schayck OC. Stabilizing prevalence trends of eczema, asthma and rhinoconjunctivitis in
Dutch school children (2001-2010). Allergy 2015; DOI:10.1111/all.12728 [Epub ahead of print].
De Korte-de Boer D, Mommers M, Creemers HMH, Dompeling E, Feron FJM, Gielkens-Sijstermans
CML, Jaminon M, Mujakovic SM, van Schayck CP, Thijs C, Jansen M. LucKi Birth Cohort Study:
rationale and design. BMC Public Health 2015; 15: 934.
De Korte-de Boer D, Mommers M, Thijs C, Jaminon M, Jansen M, Mujakovic SM, Feron FJM,
van Schayck CP. Early life growth and the development of preschool wheeze, independent from
overweight. Journal of Pediatrics 2015; 166(2): 343-349.
De Korte-de Boer D, Mommers M, Gielkens-Sijstermans CML, Creemers HMH, Feron FJM, van
Schayck CP. Trends in wheeze in Dutch school children and the role of medication use. Pediatric
Pulmonology 2015; 50(7): 665-671.
De Korte-de Boer D, Kotz D, Viechtbauer W, van Haren E, Grommen D, de Munter M, Coenen
H, Gorgels AP, van Schayck OC. Effect of smoke-free legislation on the incidence of sudden
circulatory arrest in the Netherlands. Heart 2012; 98(13): 995-999.
Nagelhout GE, de Korte-de Boer D, Kunst AE, van der Meer RM, de Vries H, van Gelder BM,
Willemsen MC. Trends in socioeconomic inequalities in smoking prevalence, consumption,
initiation, and cessation between 2001 and 2008 in the Netherlands. Findings from a national
population survey. BMC Public Health 2012; 12: 303.
De Korte D, Van Schayck C.P. et al. Supporting smoking cessation in healthcare: obstacles in
scientific understanding and tobacco addiction management. Health 2010; 2(11): 1272-1279.
Submitted for publication
De Korte-de Boer D, Mommers M, Gielkens-Sijstermans CML, Creemers HMH, Mujakovic SM,
Feron FJM, van Schayck CP. Asthma and overweight in Dutch schoolchildren with diverging
prevalence trends (1993-2010).

133133
List of publications
Other publications
De Korte D, Ariel A, Verkerk ECM, van Grootheest G, de Bruijn W, Visser ST, Mommers M, de
Groot MCH, Kroon JDL, Bakker BFM, Thijs C. Linkage of community pharmacy records to the
KOALA birth cohort study. Chapter in: Van Grootheest G, de Groot MCH, van der Laan DJ, Smit
JH, Bakker BFM, editors. Record linkage for health studies: three demonstration projects. Den
Haag/Heerlen: Statistics Netherlands, 2015.
De Korte JD, Nagelhout GE, van der Meer RM, Feenstra D, Willemsen MC. Themapublicatie:
Sociaaleconomische verschillen in roken in Nederland 1988-2008. Den Haag: STIVORO – voor
een rookvrije toekomst, 2010.
De Korte JD, Nagelhout GE, Willemsen MC. Themapublicatie: Stoppen-met-rokenadvisering door
de huisarts in Nederland 2001-2009. Den Haag: STIVORO – voor een rookvrije toekomst, 2009.
De Korte JD, Nagelhout GE, Feenstra D, Zeegers T, van der Meer RM, Willemsen MC.
Themapublicatie: Hulpmiddelen voor stoppen met roken 1992-2008. Den Haag: STIVORO – voor
een rookvrije toekomst, 2008.
De Korte JD (2008). Narrative Review ‘Stoppen met roken’. Capelle a/d IJssel: MIRO – innovation
in smoking cessation, 2008.

134

Dankwoord
Dankwoord
135
136136
Dankwoord
Promoveren doe je niet alleen. Dit proefschrift is het resultaat van samenwerking met en steun
van vele anderen, die ik op deze plaats graag wil bedanken.
Allereerst dank ik mijn promotoren, Onno van Schayck en Frans Feron, en mijn copromotor,
Monique Mommers, voor het vertrouwen dat zij in mijn stelden en de ruimte die ze mij gaven
om binnen de kaders van dit onderzoeksproject mijn eigen weg te zoeken. Onno, heel veel dank
voor de kansen die je me geboden hebt om me te ontwikkelen binnen het wetenschappelijk
onderzoek, al ver voor de start van dit promotietraject. Ik heb heel veel geleerd van de projecten
waarin we samenwerkten, niet in de laatste plaats dankzij jouw betrokken en deskundige
begeleiding. Frans, jij vormde de schakel tussen de universiteit en de GGD. Het was prettig om
jou als arts-onderzoeker tussen de epidemiologen in het promotieteam te hebben; bedankt voor
jouw bijdrage vanuit deze invalshoek. Monique, ik heb het erg getroffen met jou als dagelijks
begeleider. We zaten eigenlijk altijd op één lijn, maar je hebt me steeds uitgedaagd om focus te
houden en kritisch te blijven kijken naar resultaten en teksten. Het is de kwaliteit gegarandeerd
ten goede gekomen! Dank voor je tijd en voor alle gesprekken, zowel over werk als over alle
andere belangrijke zaken in het leven.
Dit onderzoeksproject was onderdeel van de Academische Werkplaats Publieke Gezondheid.
Ik dank Maria Jansen, als bevlogen kartrekker van de Academische Werkplaats, voor haar
onmisbare bijdrage aan een aantal hoofdstukken uit dit proefschrift. In de samenwerking met
de GGD Zuid-Limburg waren Cindy Gielkens, Huub Creemers en Suhreta Mujakovic van grote
waarde. Dank voor jullie bijdrage aan de dataverzameling en het schrijven en publiceren van
de artikelen. Bij Orbis Jeugdgezondheidzorg heeft Mariëlle Jaminon veel werk verzet voor de
doorlopende dataverzameling bij de 0-4 jarigen van ‘LucKi’ en ook bijgedragen aan publicaties
uit dit proefschrift. Dank daarvoor! Ook ben ik dank verschuldigd aan studenten van de UM en
medewerkers van de GGD Zuid-Limburg en Orbis Jeugdgezondheidszorg die hebben bijgedragen
aan het verzamelen en verwerken van de onderzoeksgegevens.
De programmaleiders van de drie CAPHRI programma’s waar mijn onderzoeksproject onder viel,
Luc Smits, Jean Muris en Hans Bosma, wil ik danken voor het mogelijk maken van een verlenging
van mijn aanstelling. In die extra maanden heb ik heel wat meters kunnen maken.
Zonder deelnemers geen onderzoek. Daarom dank ik alle ouders en kinderen uit de Westelijke
Mijnstreek voor hun vrijwillige deelname aan de ‘Astma Monitor’ en ‘LucKi’.
Tijdens mijn promotieonderzoek volgde ik de Master Epidemiologie aan onze universiteit.
Collega’s die daardoor mijn docent werden: dank voor jullie enthousiasme en deskundigheid.
Carel Thijs, bedankt voor je inbreng als tweede begeleider van mijn master thesis. Het is mede
dankzij jou een mooie publicatie geworden.
137137
Dankwoord
Alle collega’s van de vakgroep Epidemiologie dank ik voor de prettige werksfeer die ervoor zorgde
dat ik met plezier naar het werk kwam. Een bijzonder bedankje is op zijn plaats voor alle collega-
promovendi: ons ‘lotgenotencontact’ hielp meermaals om de moed erin te houden. Dank voor
jullie openheid en gezelligheid!
In de periode dat ik op het DEB1 werkte, had ik het geluk om tweemaal de allerleukste
kamergenoten te treffen. Luc en Daniel, dankzij jullie voelde ik me al snel helemaal thuis. Ik kijk
nog altijd met plezier terug op die periode bij HAG en de koffie-uurtjes die we na mijn vertrek nog
lang hebben volgehouden. Patty, Daniëlle en Sander, wat een eer dat ik er als vierde bij mocht
op jullie kamer bij EPID. We hebben door de jaren heen lief en leed gedeeld, met als terugkerend
thema: eten. Ik ben blij dat we elkaar dankzij onze gezellige etentjes niet uit het oog verloren zijn.
Geen mens bepaalt zelf waar zijn wieg staat en wie of wat er gedurende zijn leven op zijn pad
komt. Daarom is een prestatie als het voltooien van dit proefschrift voor een bevoorrecht mens als
ik maar in beperkte mate ‘eigen verdienste’. Ik dank God, mijn Hemelse Vader, voor de talenten
en mogelijkheden die ik kreeg en voor de mensen die om mij heen stonden en staan.
Mijn lieve ouders zet ik hier graag in het zonnetje. Pap en mam; heel veel dank voor jullie
vertrouwen in mij, jullie enthousiasme voor alles wat ik doe en ook jullie praktische steun, in het
bijzonder tijdens mijn promotieonderzoek!
Ook ben ik heel dankbaar voor de rest van mijn (schoon-)familie en alle vrienden en vriendinnen:
dank voor jullie interesse voor mijn werk, maar juist ook jullie begrip wanneer ik liever een ander
onderwerp aansneed. Het is heerlijk om zoveel lieve en gezellige mensen om mij heen te weten.
Ed en Paul, wat geweldig dat jullie met United het drukwerk en de website van mijn proefschrift
wilden verzorgen. Het was een prettige samenwerking met een prachtig resultaat!
Tenslotte, mijn mannen: Marcel, Lucas en Niels. Lang heb ik weten vol te houden dat promoveren
‘ook maar een baan’ is, maar in de eindspurt heeft het toch nog behoorlijk veel kostbare gezinstijd
opgeslokt. Ik ben blij dat jullie daar een positieve draai aan wisten te geven. Lucas en Niels, samen
met jullie het leven ontdekken is het mooiste wat er is. Marcel, wat een geluk dat wij bij elkaar
horen! Sinds we samen de zeilen hesen hebben we al veel mooie avonturen beleefd. Ik zie uit
naar waar ons huwelijksbootje ons in de toekomst nog brengt!

138

139
Voor het lezen en downloaden van een digitale versie van dit
proefschrift, ga naar www.proefschriftdiannedekorte.nl of scan
de QR-code.

140


![Childhood Asthma A triad of atopic eczema, allergic rhinitis and asthma is called atopy.[53] The strongest risk factor for developing asthma is a history.](https://static.fdocuments.in/doc/165x107/56649e4b5503460f94b3f101/childhood-asthma-a-triad-of-atopic-eczema-allergic-rhinitis-and-asthma-is.jpg)

