Trend of Performance in the Licensure Examination of ... · PDF filee in the Licensure...
12
International Journal of Applied Engineering Research ISSN 0973-4562 Volume 12, Number 24 (2017) pp. 15734-15745 © Research India Publications. http://www.ripublication.com 15734 Trend of Performance in the Licensure Examination of Teacher Education Institutions in Central Luzon, Philippines Nelvin Rivera Nool 1 * and Maria Agnes Panganiban Ladia 1 1 College of Education, Tarlac State University, Tarlac City 2300, Philippines. *Orcid: 0000-0001-5242-7207 Abstract This study examined the trend of performance in the licensure examination of teacher education institutions (TEIs) in Central Luzon from 2009 to 2016. This quantitative analysis employed descriptive-correlational research design to analyze the performance in the licensure examination for teachers (LET) of the 110 TEIs based on the data released by the Professional Regulation Commission. Results showed that about 54 percent of the first timers and 19 percent of the repeaters passed the LET, with an overall passing of 33 percent, which was higher than the national passing of 29 percent. Majority of the TEIs performed poorly in the LET over the seven-year period. Moreover, the trend of the performance of the TEIs was significantly closely related to the national passing percentage. There was also a significant positive relationship between the number of first timers and LET performance, which implies that the greater the number of first timers, the greater the tendency to attain better performance. Finally, the number of repeaters and LET performance were significantly but negatively correlated, which suggests that TEIs with fewer repeaters tend to obtain a higher performance. Suggestions for policy and practice on teacher education are also discussed. Keywords: licensure examination for teachers, trend of LET performance, teacher education institutions INTRODUCTION Schools play a very significant role in nation building. It is in schools where the future leaders in government, business, and other sectors are developed and nurtured so that our country will reach economic progress. To fulfill such function, schools should have competent and committed teachers. The quality of education delivered by schools largely depends on the teachers. To ensure the quality of pre-service preparation of teachers in basic education, the Commission on Higher Education (CHED) issued the CHED Memorandum Order (CMO) No. 30 series of 2004 entitled Revised Policies and Standards for Undergraduate Teacher Education Curriculum [1]. The program specification, competency standards, curriculum and course specifications, among others are identified in the CMO 30, s. 2004. The implementation of the new teacher education commenced in the first semester of the school year 2005-2006 and the first batch of graduates took the licensure examination in October 2009. Passing the licensure examination is a mandatory requirement for teacher education graduates to teach in the elementary and secondary levels in both private and public schools, as stipulated in Republic Act No. 7836, also known as the Teachers’ Professionalization Act of 1994 [2]. Those who passed the LET are assumed to possess the minimum competence and skill to teach in the basic education. Thus, LET passers are considered as quality teachers. In support of this claim, Diaz and colleagues (2013) found out that LET performance is positively and significantly related to teaching performance [3]. Moreover, Tan et al. (2015) argued that graduates’ performance in the licensure examination reflects the quality of education and training provided by their schools [4]. Furthermore, the Professional Regulation Commission (PRC) is mandated to monitor the performance of schools in the licensure examination as stipulated in Section 7(m) of Republic Act No. 8981 otherwise known as PRC Modernization Act of 2000 [5]. Regular monitoring of the performance of higher education institutions in board examinations provides various stakeholders with significant information that will aid them in policy and decision making. Hence, this study aimed to analyze the LET performance of teacher education institutions (TEIs) in Central Luzon from October 2009 to March 2016. Results from this study will provide valuable baseline data for making policies and implementing practices for the improvement of teacher preparation among TEIs in the region. OBJECTIVES This study examined the licensure examination performance of teacher education institutions in Central Luzon from 2009 to 2016. Specifically, it aimed to (1) determine the performance of the TEIs in the LET elementary level in terms of first-timers, repeaters and overall performance; (2) describe the performance of the TEIs in terms of top, better, good, poor
Transcript of Trend of Performance in the Licensure Examination of ... · PDF filee in the Licensure...

International Journal of Applied Engineering Research ISSN 0973-4562 Volume 12, Number 24 (2017) pp. 15734-15745
© Research India Publications. http://www.ripublication.com
15734
Trend of Performance in the Licensure Examination of Teacher Education
Institutions in Central Luzon, Philippines
Nelvin Rivera Nool1* and Maria Agnes Panganiban Ladia1
1College of Education, Tarlac State University, Tarlac City 2300, Philippines.
*Orcid: 0000-0001-5242-7207
Abstract
This study examined the trend of performance in the licensure
examination of teacher education institutions (TEIs) in Central
Luzon from 2009 to 2016. This quantitative analysis
employed descriptive-correlational research design to analyze
the performance in the licensure examination for teachers
(LET) of the 110 TEIs based on the data released by the
Professional Regulation Commission. Results showed that
about 54 percent of the first timers and 19 percent of the
repeaters passed the LET, with an overall passing of 33
percent, which was higher than the national passing of 29
percent. Majority of the TEIs performed poorly in the LET
over the seven-year period. Moreover, the trend of the
performance of the TEIs was significantly closely related to
the national passing percentage. There was also a significant
positive relationship between the number of first timers and
LET performance, which implies that the greater the number
of first timers, the greater the tendency to attain better
performance. Finally, the number of repeaters and LET
performance were significantly but negatively correlated,
which suggests that TEIs with fewer repeaters tend to obtain a
higher performance. Suggestions for policy and practice on
teacher education are also discussed.
Keywords: licensure examination for teachers, trend of LET
performance, teacher education institutions
INTRODUCTION
Schools play a very significant role in nation building. It is in
schools where the future leaders in government, business, and
other sectors are developed and nurtured so that our country
will reach economic progress. To fulfill such function, schools
should have competent and committed teachers. The quality
of education delivered by schools largely depends on the
teachers.
To ensure the quality of pre-service preparation of teachers in
basic education, the Commission on Higher Education
(CHED) issued the CHED Memorandum Order (CMO) No.
30 series of 2004 entitled Revised Policies and Standards for Undergraduate Teacher Education Curriculum [1]. The
program specification, competency standards, curriculum and
course specifications, among others are identified in the CMO
30, s. 2004. The implementation of the new teacher education
commenced in the first semester of the school year 2005-2006
and the first batch of graduates took the licensure examination
in October 2009.
Passing the licensure examination is a mandatory requirement
for teacher education graduates to teach in the elementary and
secondary levels in both private and public schools, as
stipulated in Republic Act No. 7836, also known as the
Teachers’ Professionalization Act of 1994 [2]. Those who
passed the LET are assumed to possess the minimum
competence and skill to teach in the basic education. Thus,
LET passers are considered as quality teachers. In support of
this claim, Diaz and colleagues (2013) found out that LET
performance is positively and significantly related to teaching
performance [3].
Moreover, Tan et al. (2015) argued that graduates’
performance in the licensure examination reflects the quality
of education and training provided by their schools [4].
Furthermore, the Professional Regulation Commission (PRC)
is mandated to monitor the performance of schools in the
licensure examination as stipulated in Section 7(m) of
Republic Act No. 8981 otherwise known as PRC Modernization Act of 2000 [5]. Regular monitoring of the
performance of higher education institutions in board
examinations provides various stakeholders with significant
information that will aid them in policy and decision making.
Hence, this study aimed to analyze the LET performance of
teacher education institutions (TEIs) in Central Luzon from
October 2009 to March 2016. Results from this study will
provide valuable baseline data for making policies and
implementing practices for the improvement of teacher
preparation among TEIs in the region.
OBJECTIVES
This study examined the licensure examination performance
of teacher education institutions in Central Luzon from 2009
to 2016. Specifically, it aimed to (1) determine the
performance of the TEIs in the LET elementary level in terms
of first-timers, repeaters and overall performance; (2) describe
the performance of the TEIs in terms of top, better, good, poor

International Journal of Applied Engineering Research ISSN 0973-4562 Volume 12, Number 24 (2017) pp. 15734-15745
© Research India Publications. http://www.ripublication.com
15735
and worse performing; (3) examine the performance of the
TEIs and its relationship to the national passing percentage;
and (4) analyze the relationship between the number of
examinees and LET performance.
Moreover, the following null hypotheses were tested at .05
level of significance: (1) The performance of the TEIs is not
significantly related to the national passing percentage. (2)
There is no significant relationship between the number of
examinees and LET performance of the TEIs.
METHODOLOGY
This quantitative analysis employed the descriptive-
correlational research design to examine the LET
performance of 110 TEIs in Central Luzon from October
2009 to March 2016. The data on the LET performance of the
TEIs were obtained from the official results released by the
Professional Regulation Commission. Since the data on the
LET performance of schools have been published in a
newspaper as well as in the PRC official website, no data
privacy is violated.
The list of TEIs in Central Luzon offering teacher education
courses was obtained from the website of Commission on
Higher Education (CHED). Table 1 presents the distribution
of TEIs according to the seven provinces. The table shows
that a little more than a quarter of the TEIs were located in
Bulacan, while the fewest number of TEIs were in Aurora and
Bataan. There was an almost similar number of TEIs from
Pampanga, Nueva Ecija, Tarlac and Zambales.
Table 1: Distribution of TEIs according to Province
Province No. of TEIs Percentage
Aurora 3 2.7
Bataan 8 7.3
Bulacan 28 25.5
Nueva Ecija 18 16.4
Pampanga 19 17.3
Tarlac 18 16.4
Zambales 16 14.5
Total 110 100.0
The examinees in the TEIs were classified as first timers and
repeaters. First timers are the examinees who took the LET
for the first time, while repeaters are those who took the LET
for two or more times. Table 2 shows the number of first
timers, repeaters and total examinees or takers from the TEIs
in the seven provinces from 2009 to 2016.
Table 2: Distribution of Examinees by Province
Province First Timers Repeaters Overall
Number % Number % Number %
Aurora 392 2.2 245 0.9 637 1.4
Bataan 1,761 9.7 1,600 6.1 3,361 7.6
Bulacan 4,331 23.9 6,057 23.2 10,388 23.5
Nueva Ecija 3,750 20.7 6,393 24.5 10,143 22.9
Pampanga 2,581 14.2 4,536 17.4 7,117 16.1
Tarlac 3,818 21.0 5,144 19.7 8,962 20.2
Zambales 1,520 8.4 2,143 8.2 3,663 8.3
Total 18,153 100.0 26,118 100.0 44,271 100.0
LET performance is operationally defined as the percentage
of examinees who passed in the LET. The LET performance
of the TEIs was described based on their passing percentage
from 2009 to 2016. The description of LET performance was
partly based on the classification made by the PRC. The
following categories were used in describing the performance
of each TEI.
Top performing – 80%-100% passing rate
Better performing – 75%-79.99% passing rate
Good performing – at least 50% passing rate and
higher than the national passing percentage (NPP)
Poor performing – 20%-49.99% passing rate,
including passing rate less than the NPP
Worse performing – less than 20% passing rate
LET is administered by the PRC twice a year: usually every
March and September. However, the schedule of
examination for March was once moved to January or April,
while that of September was once moved to August or
October. For brevity and consistency purposes, the March
schedule covered the January, March and April
examinations, while September schedule included August,
September and October examinations. Fourteen examination
schedules were included in this study: seven each from
March and September schedules.
Before deciding the statistical test to use in determining
whether the trend of the performance of the TEIs in Central
Luzon (CL) is significantly related to the national passing
percentage (NPP), the normality of the variables was analyzed
first using Shapiro-Wilk test [6]. Table 3 presents the results of
the Shapiro-Wilk test on the LET performance of the TEIs and
the NPP in the 14 examination schedules from 2009 to 2016.
The results indicated that the data on the LET performance in
14 examination schedules did not deviate from a normal
distribution since the significance values of the Shapiro-Wilk
test were greater than .05. Therefore, the Pearson product
moment correlation coefficient (r) was used to analyze the
relationship of the performance of the TEIs and the NPP.
International Journal of Applied Engineering Research ISSN 0973-4562 Volume 12, Number 24 (2017) pp. 15734-15745
© Research India Publications. http://www.ripublication.com
15736
Table 3: Shapiro-Wilk Test of Normality on the LET
Performance in 14 Exam Schedules
Variables Statistic df Sig.
First timers’ performance in CL .937 14 .378
Repeaters’ performance in CL .895 14 .097
Overall performance in CL .911 14 .163
First timers’ NPP .920 14 .221
Repeaters’ NPP .891 14 .082
Overall NPP .942 14 .439
Similarly, the Shapiro-Wilk test was used to establish the
normality of the data in determining the relationship
between the number of examinees and the LET performance
of the 110 TEIs from 2009 to 2016. As shown in Table 4,
results indicate that the data on the number of first timers,
number of repeaters, repeaters’ performance, overall takers
and overall performance significantly deviate from a normal
distribution since the significance values of the Shapiro-
Wilk test are less than .05. Data that deviate from a normal
distribution are marked with the presence of outliers or
extremely high or low values.
Table 4: Shapiro-Wilk Test of Normality on the Number
of Takers and LET Performance of the TEIs
Variables Statistic df Sig.
Number of first timers .635 110 .000
First timers’ performance .985 110 .250
Number of repeaters .670 110 .000
Repeaters’ performance .923 110 .000
Overall takers .671 110 .000
Overall performance .970 110 .015
On the other hand, the data on first timers’ performance are
normally distributed since the significance value of the
Shapiro-Wilk test is greater than .05. Since five of the six
variables significantly deviate from a normal distribution,
then Spearman rank correlation coefficient (rs) was used to
determine the relationship between the number of takers
and LET performance. All statistical computations were
done using SPSS (Statistical Package for the Social
Sciences) and MS Excel.
Table 5: First Timers, Repeaters and Overall LET Performance
Exam
Schedule
First Timers Repeaters Overall
Takers Passers % Passed Takers Passers % Passed Takers Passers % Passed
Oct-2009 1,720 612 35.6 1,661 24 1.4 3,381 636 18.81
Apr-2010 276 113 40.9 1,414 174 12.4 1,690 287 17.03
Sep-2010 1,458 405 27.8 1,493 88 5.9 2,951 493 16.71
Apr-2011 419 144 34.4 1,811 267 14.7 2,230 411 18.43
Sep-2011 1,637 701 42.8 1,565 74 4.7 3,202 775 24.20
Mar-2012 334 230 68.9 1,688 886 52.5 2,022 1,116 55.17
Sep-2012 1,722 1,337 77.7 1,865 640 34.3 3,587 1,977 55.13
Mar-2013 511 314 61.4 1,820 400 22.0 2,331 714 30.63
Sep-2013 2,554 1,465 57.4 2,130 92 4.3 4,684 1,557 33.26
Jan-2014 439 301 68.6 2,073 717 34.6 2,512 1,018 40.53
Aug-2014 2,777 1,779 64.1 2,285 186 8.1 5,062 1,965 38.81
Mar-2015 748 476 63.6 2,198 540 24.6 2,946 1,016 34.49
Sep-2015 3,004 1,682 56.0 1,735 96 5.5 4,739 1,778 37.51
Mar-2016 554 328 59.2 2,380 666 27.9 2,934 994 33.84
Total 18,153 9,887 54.5 26,118 4,850 18.6 44,271 14,737 33.29

International Journal of Applied Engineering Research ISSN 0973-4562 Volume 12, Number 24 (2017) pp. 15734-15745
© Research India Publications. http://www.ripublication.com
15737
RESULTS AND DISCUSSION
LET Performance of the TEIs from 2009 to 2016
The performance in the licensure examination of the 110
teacher education institutions in Central Luzon was
analyzed in terms of first-timers, repeaters and overall
performance. Table 5 presents the LET performance of the
TEIs in the 14 examination schedules.
As regards the first timers’ performance, the TEIs registered
the highest performance of 77.7% in September 2012,
followed by 68.9% in March 2012 and 68.6% in January
2014. The TEIs obtained at least 56.0% passing rate since
2012 onward. On the other hand, the lowest performance of
27.8% was recorded in September 2010, followed by 34.4%
in April 2011 and 35.6% in October 2009. It could be noticed
from the table that the TEIs had less than 50% passing rate
from 2009 to 2011, which reflects much difficulty among the
examinees. These were the times when the LET elementary
level consisted of three areas with their corresponding
weight, namely: General Education (GenEd, 20%),
Professional Education (ProfEd, 40%) and Content Courses
(40%, similar to Specialization in LET Secondary Level).
However, when the Content Courses part of the LET was
removed in 2012, leaving only GenEd (40%) and ProfEd
(60%), the first timers performed very well. In general, the
TEIs obtained a total passing percentage of 54.5% among the
first timers, which can be considered as a good performance
since at least half of them passed the LET.
In contrast, the repeaters’ performance was generally poor.
Similar to the first timers’ experience, the repeaters had also
extreme difficulty during the first three years of the
examinations when they barely reached a 15% passing rate.
The highest passing rate of 52.5% was recorded in March
2012, followed by 34.6% in January 2014 and 34.3% in
September 2012. It was very alarming that only 1.4% of the
repeaters passed in October 2009. This was when the first
time the new batch of teacher education graduates took the
LET, which contains the Content Courses part. The
repeaters might not have prepared well on this area of the
LET since the previous examinations consisted of only two
components. The repeaters’ overall performance of 18.6%
reflects a poor performance, where only one in every five
repeaters passed the LET.
In terms of overall performance, the TEIs obtained the
highest passing rate of 55.17% in March 2012 and 55.13%
in September 2012. This result was expected since both first
timers and repeaters also achieved the highest performance
in these schedules. For the other schedules, the passing rate
ranged from 16.71% in September 2010 to 40.53% in
January 2014. When the total performance of the first
timers (54.5%) and that of the repeaters (18.6%) were
combined, the TEIs had an overall passing rate of 33.29%,
which indicates that only one in every three takers passed
the LET in the past 14 examination schedules. It can be
observed that the overall performance was 21.2% lower
than the first timers’ performance, while it was 14.7%
higher than the repeaters’ performance. Since there were
more repeaters (59% of the total takers) than the first
timers, it was expected that the repeaters’ poor performance
pulled down the good performance of the first timers,
resulting to a poor overall performance.
These findings had similarity to those found in the research
conducted by Nool and Ladia (2012) [7] concerning the
LET performance of state universities and colleges in
Central Luzon from 2009 to 2012. Their study revealed that
the passing rate was 49% among the first timers, 26%
among the repeaters and 37% overall. In addition, the
performance of first timers is significantly higher than the
repeaters among Centers of Excellence and Centers of
Development in teacher education (Ladia, 2014 [8]; Nool et
al., 2012 [9]). It is evident that the first timers performed
better than the repeaters, whose very low performance
unfavorably affected the overall passing percentage
(Antiojo, 2017 [10]; Nool & Corpuz, 2017 [11]; Nool,
Hilario & Santos, 2007 [12]; Balanquit et al., 2017 [13]).
Description of LET Performance of the TEIs
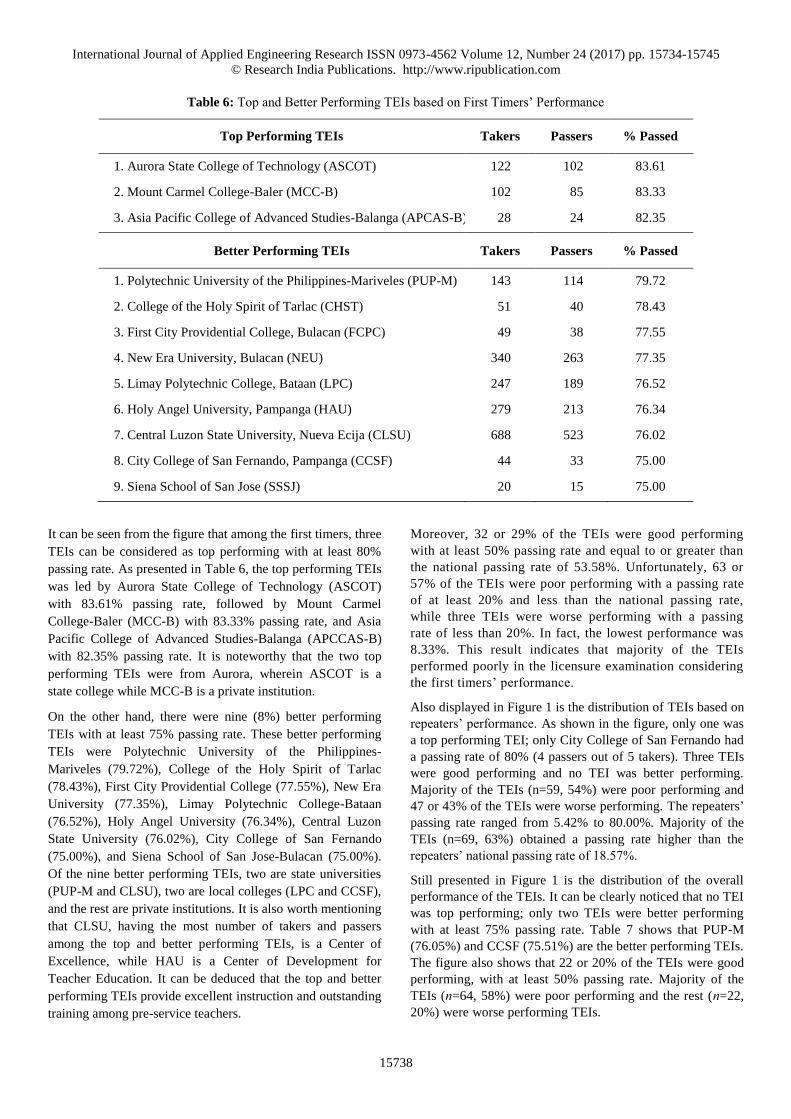
The frequency distribution of the LET performance of the
TEIs in Central Luzon from 2009 to 2016 in terms of top,
better, good, poor and worse is displayed in Figure 1.
Figure 1: Frequency Distribution of TEIs according to Description of LET Performance
Top Better Good Poor Worse
First timers 3 9 32 63 3
Repeaters 1 0 3 59 47
Overall 0 2 22 64 22
International Journal of Applied Engineering Research ISSN 0973-4562 Volume 12, Number 24 (2017) pp. 15734-15745
© Research India Publications. http://www.ripublication.com
15738
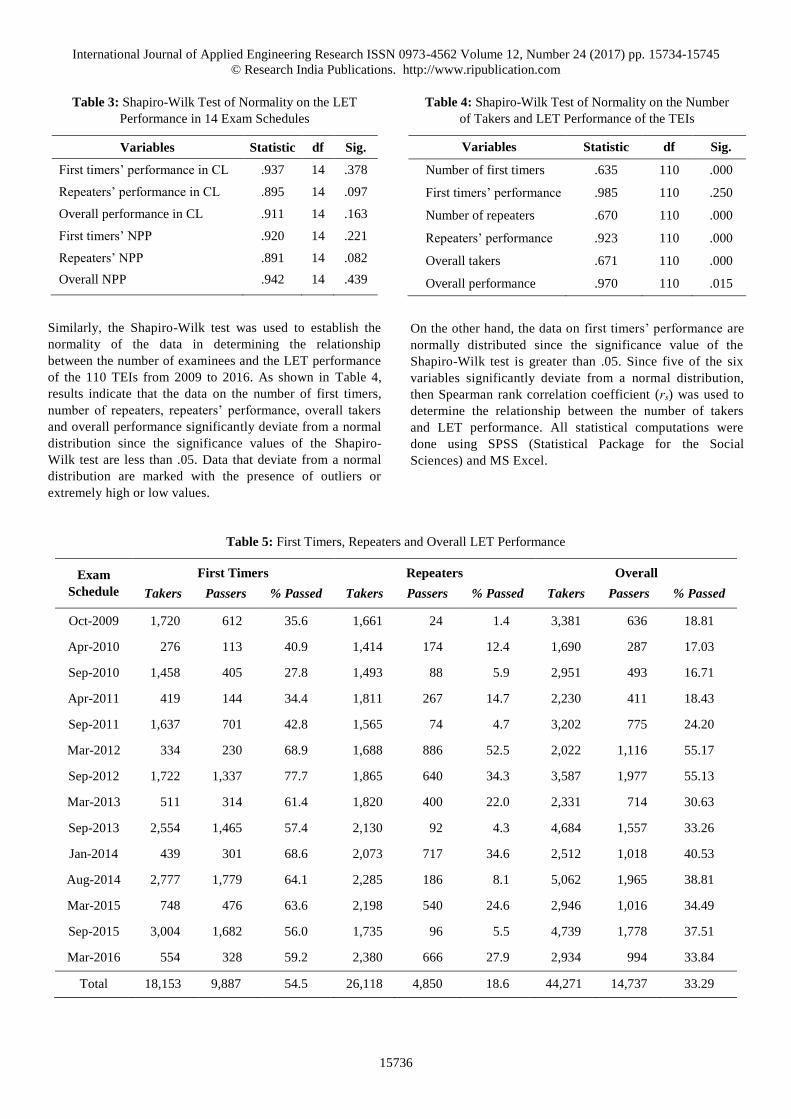
Table 6: Top and Better Performing TEIs based on First Timers’ Performance
Top Performing TEIs Takers Passers % Passed
1. Aurora State College of Technology (ASCOT) 122 102 83.61
2. Mount Carmel College-Baler (MCC-B) 102 85 83.33
3. Asia Pacific College of Advanced Studies-Balanga (APCAS-B) 28 24 82.35
Better Performing TEIs Takers Passers % Passed
1. Polytechnic University of the Philippines-Mariveles (PUP-M) 143 114 79.72
2. College of the Holy Spirit of Tarlac (CHST) 51 40 78.43
3. First City Providential College, Bulacan (FCPC) 49 38 77.55
4. New Era University, Bulacan (NEU) 340 263 77.35
5. Limay Polytechnic College, Bataan (LPC) 247 189 76.52
6. Holy Angel University, Pampanga (HAU) 279 213 76.34
7. Central Luzon State University, Nueva Ecija (CLSU) 688 523 76.02
8. City College of San Fernando, Pampanga (CCSF) 44 33 75.00
9. Siena School of San Jose (SSSJ) 20 15 75.00
It can be seen from the figure that among the first timers, three
TEIs can be considered as top performing with at least 80%
passing rate. As presented in Table 6, the top performing TEIs
was led by Aurora State College of Technology (ASCOT)
with 83.61% passing rate, followed by Mount Carmel
College-Baler (MCC-B) with 83.33% passing rate, and Asia
Pacific College of Advanced Studies-Balanga (APCCAS-B)
with 82.35% passing rate. It is noteworthy that the two top
performing TEIs were from Aurora, wherein ASCOT is a
state college while MCC-B is a private institution.
On the other hand, there were nine (8%) better performing
TEIs with at least 75% passing rate. These better performing
TEIs were Polytechnic University of the Philippines-
Mariveles (79.72%), College of the Holy Spirit of Tarlac
(78.43%), First City Providential College (77.55%), New Era
University (77.35%), Limay Polytechnic College-Bataan
(76.52%), Holy Angel University (76.34%), Central Luzon
State University (76.02%), City College of San Fernando
(75.00%), and Siena School of San Jose-Bulacan (75.00%).
Of the nine better performing TEIs, two are state universities
(PUP-M and CLSU), two are local colleges (LPC and CCSF),
and the rest are private institutions. It is also worth mentioning
that CLSU, having the most number of takers and passers
among the top and better performing TEIs, is a Center of
Excellence, while HAU is a Center of Development for
Teacher Education. It can be deduced that the top and better
performing TEIs provide excellent instruction and outstanding
training among pre-service teachers.
Moreover, 32 or 29% of the TEIs were good performing
with at least 50% passing rate and equal to or greater than
the national passing rate of 53.58%. Unfortunately, 63 or
57% of the TEIs were poor performing with a passing rate
of at least 20% and less than the national passing rate,
while three TEIs were worse performing with a passing
rate of less than 20%. In fact, the lowest performance was
8.33%. This result indicates that majority of the TEIs
performed poorly in the licensure examination considering
the first timers’ performance.
Also displayed in Figure 1 is the distribution of TEIs based on
repeaters’ performance. As shown in the figure, only one was
a top performing TEI; only City College of San Fernando had
a passing rate of 80% (4 passers out of 5 takers). Three TEIs
were good performing and no TEI was better performing.
Majority of the TEIs (n=59, 54%) were poor performing and
47 or 43% of the TEIs were worse performing. The repeaters’
passing rate ranged from 5.42% to 80.00%. Majority of the
TEIs (n=69, 63%) obtained a passing rate higher than the
repeaters’ national passing rate of 18.57%.
Still presented in Figure 1 is the distribution of the overall
performance of the TEIs. It can be clearly noticed that no TEI
was top performing; only two TEIs were better performing
with at least 75% passing rate. Table 7 shows that PUP-M
(76.05%) and CCSF (75.51%) are the better performing TEIs.
The figure also shows that 22 or 20% of the TEIs were good
performing, with at least 50% passing rate. Majority of the
TEIs (n=64, 58%) were poor performing and the rest (n=22,
20%) were worse performing TEIs.
International Journal of Applied Engineering Research ISSN 0973-4562 Volume 12, Number 24 (2017) pp. 15734-15745
© Research India Publications. http://www.ripublication.com
15739
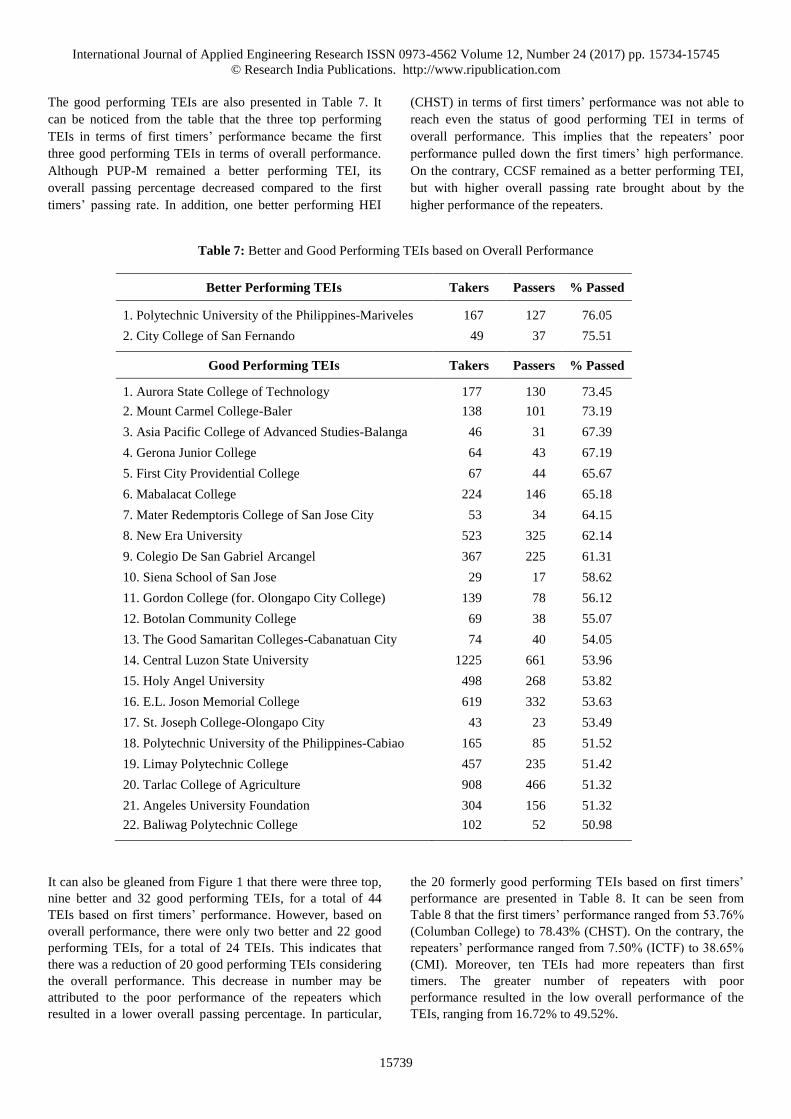
The good performing TEIs are also presented in Table 7. It
can be noticed from the table that the three top performing
TEIs in terms of first timers’ performance became the first
three good performing TEIs in terms of overall performance.
Although PUP-M remained a better performing TEI, its
overall passing percentage decreased compared to the first
timers’ passing rate. In addition, one better performing HEI
(CHST) in terms of first timers’ performance was not able to
reach even the status of good performing TEI in terms of
overall performance. This implies that the repeaters’ poor
performance pulled down the first timers’ high performance.
On the contrary, CCSF remained as a better performing TEI,
but with higher overall passing rate brought about by the
higher performance of the repeaters.
Table 7: Better and Good Performing TEIs based on Overall Performance
It can also be gleaned from Figure 1 that there were three top,
nine better and 32 good performing TEIs, for a total of 44
TEIs based on first timers’ performance. However, based on
overall performance, there were only two better and 22 good
performing TEIs, for a total of 24 TEIs. This indicates that
there was a reduction of 20 good performing TEIs considering
the overall performance. This decrease in number may be
attributed to the poor performance of the repeaters which
resulted in a lower overall passing percentage. In particular,
the 20 formerly good performing TEIs based on first timers’
performance are presented in Table 8. It can be seen from
Table 8 that the first timers’ performance ranged from 53.76%
(Columban College) to 78.43% (CHST). On the contrary, the
repeaters’ performance ranged from 7.50% (ICTF) to 38.65%
(CMI). Moreover, ten TEIs had more repeaters than first
timers. The greater number of repeaters with poor
performance resulted in the low overall performance of the
TEIs, ranging from 16.72% to 49.52%.
Better Performing TEIs Takers Passers % Passed
1. Polytechnic University of the Philippines-Mariveles 167 127 76.05
2. City College of San Fernando 49 37 75.51
Good Performing TEIs Takers Passers % Passed
1. Aurora State College of Technology 177 130 73.45
2. Mount Carmel College-Baler 138 101 73.19
3. Asia Pacific College of Advanced Studies-Balanga 46 31 67.39
4. Gerona Junior College 64 43 67.19
5. First City Providential College 67 44 65.67
6. Mabalacat College 224 146 65.18
7. Mater Redemptoris College of San Jose City 53 34 64.15
8. New Era University 523 325 62.14
9. Colegio De San Gabriel Arcangel 367 225 61.31
10. Siena School of San Jose 29 17 58.62
11. Gordon College (for. Olongapo City College) 139 78 56.12
12. Botolan Community College 69 38 55.07
13. The Good Samaritan Colleges-Cabanatuan City 74 40 54.05
14. Central Luzon State University 1225 661 53.96
15. Holy Angel University 498 268 53.82
16. E.L. Joson Memorial College 619 332 53.63
17. St. Joseph College-Olongapo City 43 23 53.49
18. Polytechnic University of the Philippines-Cabiao 165 85 51.52
19. Limay Polytechnic College 457 235 51.42
20. Tarlac College of Agriculture 908 466 51.32
21. Angeles University Foundation 304 156 51.32
22. Baliwag Polytechnic College 102 52 50.98

International Journal of Applied Engineering Research ISSN 0973-4562 Volume 12, Number 24 (2017) pp. 15734-15745
© Research India Publications. http://www.ripublication.com
15740
Table 8: Formerly Good Performing TEIs based on First Timers’ Performance
Trend of Performance of the TEIs in Central Luzon
and National Passing Percentage
The LET performance of the TEIs in Central Luzon and the
national passing percentage (NPP) were also examined to
identify their similarity. Figure 2 displays the trend of the
performance of the TEIs and the NPP in the 14 examination
schedules from 2009 to 2016.
Figure 2: Performance of the TEIs and National Passing Percentage
Oct-
09
Apr-
10
Sep-
10
Apr-
11
Sep-
11
Mar-
12
Sep-
12
Mar-
13
Sep-
13
Jan-
14
Aug-
14
Mar-
15
Sep-
15
Mar-
16
Over-
all
1st timers-CL 35.6 40.9 27.8 34.4 42.8 68.9 77.7 61.4 57.4 68.6 64.1 63.6 56.0 59.2 54.5
1st timers-Nat'l 37.3 37.4 35.6 35.3 45.3 55.0 74.6 54.3 58.2 58.2 62.5 53.8 54.1 51.6 53.6
Repeaters-CL 1.4 12.4 5.9 14.7 4.7 52.5 34.3 22.0 4.3 34.6 8.1 24.6 5.5 27.9 18.6
Repeaters-Nat'l 4.9 11.0 4.7 12.3 3.8 39.8 27.6 21.3 5.0 29.9 10.1 19.3 4.2 23.4 16.2
Overall-CL 18.8 17.0 16.7 18.4 24.2 55.2 55.1 30.6 33.3 40.5 38.8 34.5 37.5 33.8 33.3
Overall-Nat'l 18.7 15.4 19.6 15.8 22.7 42.5 49.3 27.8 31.2 29.0 35.7 27.4 31.4 28.4 29.2
-
50.0
Teacher Education Institutions
First Timers Repeaters Overall
Takers Passers %
Passed Takers Passers
%
Passed Takers Passers
%
Passed
1. College of Mary Immaculate (CMI) 61 35 57.38 44 17 38.64 105 52 49.52
2. Don Honorio Ventura Technological State University 638 385 60.34 475 164 34.53 1113 549 49.33
3. Nueva Ecija University of Science and Tech-Cabanatuan 844 533 63.15 599 168 28.05 1443 701 48.58
4. Ecumenical Christian College 65 41 63.08 41 10 24.39 106 51 48.11
5. Ramon Magsaysay Technological University-San Marcelino 103 57 55.34 72 26 36.11 175 83 47.43
6. Bataan Peninsula State University-Orani (for. BPSC) 249 134 53.82 150 51 34.00 399 185 46.37
7. College of the Holy Spirit of Tarlac (CHST) 51 40 78.43 59 10 16.95 110 50 45.45
8. Pampanga State Agricultural University (formerly PAC) 502 281 55.98 482 162 33.61 984 443 45.02
9. Wesleyan University-Philippines-Maria Aurora 168 103 61.31 154 41 26.62 322 144 44.72
10. Tomas Del Rosario College 232 161 69.40 245 50 20.41 477 211 44.23
11. Megabyte College of Science and Technology 51 30 58.82 41 9 21.95 92 39 42.39
12. M.V. Gallego Foundation Colleges 21 13 61.90 15 2 13.33 36 15 41.67
13. Columban College-Olongapo City 93 50 53.76 145 38 26.21 238 88 36.97
14. Mondrian Aura College-Subic 45 29 64.44 86 17 19.77 131 46 35.11
15. La Consolacion Univ Phil (formerly Univ. Regina Carmeli) 136 78 57.35 144 20 13.89 280 98 35.00
16. Saint Paul College of San Miguel 127 77 60.63 205 36 17.56 332 113 34.04
17. Tarlac State University (formerly Tarlac College of Tech) 1319 726 55.04 2108 400 18.98 3427 1126 32.86
18. Interworld College of Tech Foundation-Tarlac City (ICTF) 16 9 56.25 40 3 7.50 56 12 21.43
19. Centro Escolar University-Malolos 23 13 56.52 89 10 11.24 112 23 20.54
20. College of the Immaculate Conception-Cabanatuan 112 69 61.61 558 43 7.71 670 112 16.72

International Journal of Applied Engineering Research ISSN 0973-4562 Volume 12, Number 24 (2017) pp. 15734-15745
© Research India Publications. http://www.ripublication.com
15741
The graph illustrates that the first timers’ performance among
the TEIs in Central Luzon nearly resembles the trend of the
national passing percentage. The performance of the TEIs and
the NPP nearly coincided with seven of the 14 examination
schedules namely: October 2009, April and September 2011,
September 2012 and 2013, August 2014, and September 2015.
Likewise, the overall performance of the TEIs (54.5%) and
the NPP (53.6%) are closely similar. In contrast, the
performance of the TEIs exceeded the NPP in April 2010 by
4%, in March 2012 by 14%, in March 2013 by 7%, in January
2014 by 10%, in March 2015 by 10% and in March 2016 by
8%, but was lower than the NPP in September 2010 by 8%.
To statistically verify the similarity in the trend of the LET
performance of the TEIs and the NPP, Pearson product
moment correlation coefficient r was computed and the results
are shown in Table 9. The table shows that the trend of the
first timers’ performance of the TEIs in Central Luzon is very
closely related to the NPP as reflected by the very large value
of correlation coefficient (r = .937, p = .000). This confirms
the observation that the pattern of performance of the TEIs
followed the trend of the NPP.
Table 9: Correlation between the Performance of the TEIs
and the National Passing Percentage
Variables Pearson
r
p-
value
Inter-
pretation
First timers’ performance in CL
and First timers’ NPP .937 .000 Significant
Repeaters’ performance in CL
and Repeaters’ NPP .990 .000 Significant
Overall performance in CL and
Overall NPP .964 .000 Significant
With regard to the repeaters, it can be seen in Figure 2 that
the performance of the TEIs was almost similar to the NPP
in all of the examination schedules, except in March and
September 2012, when the performance of the TEIs was
higher than the NPP by about 13% and 7%, respectively.
The graph clearly shows a correspondence in the trend of the
performance of the TEIs and the NPP. This is supported by
the nearly perfect positive correlation coefficient (r = .990,
p = .000). Therefore, the trend of LET performance of the
TEIs almost coincided with the NPP.
In terms of the overall performance, it can be noticed in
Figure 2 that except in September 2010 the performance of
the TEIs was higher than the NPP, which ranged from a
negligible difference of 0.1% in October 2009 to 12.7% in
March 2012. However, the similarity in the performance of
the TEIs and the NPP was evident. This was confirmed by the
extremely large value of the correlation coefficient (r = .964,
p = .000). Then, it can be concluded that the trend of the LET
performance of the TEIs was closely related to the NPP.
Relationship between the Number of Examinees and LET
Performance
The relationship between the number of examinees and LET
performance of the 110 TEIs from 2009 to 2016 was
determined using Spearman rank correlation coefficient (rs)
and the results are summarized in Table 10.
Table 10: Correlation between Number of Examinees
and LET Performance
Variables Spearman
rs
p-
value
Inter-
pretation
Number of first timers
and their LET
performance
.223 .019 Significant
Number of first timers
and Overall LET
performance
.162 .092 Not
Significant
Number of repeaters
and their LET
performance
–.412 .000 Significant
Number of repeaters
and Overall LET
performance
–.425 .000 Significant
Number of overall
takers and their
LET performance
–.198 .038 Significant
There was a significant positive relationship between the
number of first timers and LET performance (rs = .223,
p = .019). This indicates that greater number of first timers
who take the LET tend to result in a higher passing rate.
Conversely, the fewer number of first timers will likely result
in a lower LET performance. Although the relationship
between the number of first timers and overall LET
performance did not reach statistical significance (rs = .162,
p = .092), the result shows a positive direction on the
relationship between the variables. This indicates that a
higher number of first timers taking the LET may result in a
higher overall passing percentage. Since the first timers’
overall passing rate is 54%, having more first timers taking
the LET will likely result in a better performance.
On the contrary, the number of repeaters was significantly
but negatively related to their LET performance (rs = –.412,
p = .000) and overall LET performance (rs = –.425, p = .000).
This implies that a greater number of repeaters who take the
LET will likely result in a lower passing percentage. As

International Journal of Applied Engineering Research ISSN 0973-4562 Volume 12, Number 24 (2017) pp. 15734-15745
© Research India Publications. http://www.ripublication.com
15742
found out in the previous section, only about 19% or one in
every five repeaters pass the LET. When there are more
repeaters than first timers, the first timers’ good performance
will be pulled down by the repeaters’ poor performance,
which will consequently lead to a low overall passing
percentage. Conversely, when a greater number of first timers
take the LET, their good performance will help raise the
repeaters’ poor performance, which will lead to a high overall
performance. This result was consistent with the finding in
the study of Nool, Ladia and Balanquit (2017) [14] that the
centers of excellence and centers of development in teacher
education with more repeaters had lower passing percentage.
Similarly, the overall number of takers and overall LET
performance were negatively correlated (rs = –.198, p = .038).
This indicates that the greater the number of examinees, the
less likely to obtain a high passing percentage in the LET.
Conversely, the fewer the number of LET takers, the higher
the tendency to attain a better performance. Similar findings
had been found in the research of Nool and Ladia (2017) [15]
that state universities and colleges (SUCs) having fewer
examinees attained higher passing percentage, while SUCs
with more examinees obtained lower LET performance.
CONCLUSIONS AND IMPLICATIONS
The TEIs in Central Luzon had good performance among the
first timers but had poor performance among the repeaters and
overall performance from 2009 to 2016. As to the description
of the TEIs in terms of first timers’ performance, there were
three top performing TEIs led by Aurora State College of
Technology (ASCOT), Mount Carmel College-Baler (MCC-
B) and Asia Pacific College of Advanced Studies-Balanga
(APCCAS-B), and there were nine better performing TEIs.
Nearly one-third of the TEIs were good performing, the
majority of the TEIs were poor performing, and three TEIs
were worse performing. Thus, the poor performing TEIs have
to benchmark the top performing TEIs in order to explore and
adapt their good policies and practices for the improvement of
students’ academic and licensure performance.
Based on the repeaters’ performance, the majority of the
TEIs were poor performing and two-fifths of the TEIs were
worse performing. Only CCSF was a top performing TEI, no
TEI was better performing, and three TEIs were good
performing. In terms of overall performance, no TEI was top
performing, only two institutions were the better performing
TEIs, and two-fifths of the TEIs were good performing.
Majority of the TEIs were poor performing and the rest were
worse performing TEIs. This result calls for the Commission
on Higher and Education to monitor regularly the TEIs’ LET
performance. The institutions that consistently perform
poorly should be sanctioned for closure so that only TEIs
that perform well in the licensure examination should be
retained and recognized.
The performance of the TEIs in Central Luzon was
significantly and closely related to the national passing
percentage in terms of first-timers, repeaters and overall
performance. Moreover, there was a significant positive
relationship between the number of first timers and LET
performance. This implies that a greater number of first
timers who take the LET tend to result in a higher passing
rate, while a fewer number of first timers will likely result in
a lower LET performance.
On the contrary, the number of repeaters was significantly but
negatively related to the LET performance and overall LET
performance. Similarly, the overall number of repeaters and
overall LET performance were strongly but negatively
correlated. This indicates that a greater number of repeaters
who take the LET will likely result in a lower passing
percentage. As found out in the earlier findings, only one in
every five repeaters passed the LET. When there are more
repeaters than first timers, the first timers’ good performance
will be pulled down by the repeaters’ poor performance,
which will consequently lead to a low overall passing
percentage. Conversely, when a greater number of first timers
take the LET, their good performance will help raise the poor
performance of the repeaters, which will lead to a high overall
performance. Thus, the Professional Regulation Commission
should implement a policy that limits the number of times an
examinee can take the LET, perhaps up to three times just like
in other professional licensure examinations.
Furthermore, there was a significant negative correlation
between the number of overall takers and LET performance.
This implies that the greater the number of examinees,
particularly the repeaters, the greater the tendency to have a
lower passing percentage in the LET. Conversely, the fewer
the number of LET takers (particularly the repeaters), the
more likely to obtain a better LET performance. This
suggests that the TEIs have to implement strict admission and
retention policy so that only qualified and outstanding
students will be retained.
In addition to college admission test, TEIs may include
other pre-screening assessments like the NCAE (National
Career Assessment Examination), teaching aptitude test and
interview in selecting students. Conducting retention or
qualifying examinations and setting a minimum college
grade point average may also be done to retain deserving
students. Institution-related variables such as advanced
degrees of faculty members, accreditation status, faculty to
student ratio, and cost per student should also be considered
by school administrators. These admission and institution
variables have been found as predictors of success in
licensure examinations (Bañez & Pardo [16]; Nool & Ladia,
2017 [17]; Calingacion [18]; Nool, Balanquit & Ladia, 2017
[19]; Depamaylo [20]; Nool et al., 2017 [21]; Esmeralda &
Espinosa [22]; Nool & Ladia, 2017 [23]; Faltaldo [24];
Nool, Ladia & Corpuz, 2017 [25]; Gono [26]; Nool &
Ladia, 2017 [27]; Hena et al. [28]; Nool, Embesan & Ladia,
2017 [29]; Kalaw [30]; Nool et al., 2017 [45]; Montemayor,

International Journal of Applied Engineering Research ISSN 0973-4562 Volume 12, Number 24 (2017) pp. 15734-15745
© Research India Publications. http://www.ripublication.com
15743
Roxas & Panayon [32]; Nool and colleagues, 2017 [33];
Puertos [34]; Nool, Corpuz & Ladia, 2017 [35]; Rabanal
[36]; Nool, Ladia & Embesan, 2017 [37]; Rudio [38];
Nool, 2017 [39]; Soriano [40]; Nool et al., 2017 [41];
Tarun [42]; Nool and colleagues, 2017 [43]; Visco [44];
Nool et al., 2017 [45]; Ladia & Nool, 2017 [46]; Nool,
Ladia & Balanquit, 2017 [47]).
Moreover, future researchers may explore the qualities of
teachers such as emotional intelligence, self-awareness,
tolerance, and empathy since these are essential traits of a
teacher. Further research should also be conducted to
examine the supply of teachers in the region and correlate to
other variables (e.g. adequacy).
REFERENCES
[1] CHED Memorandum Order (CMO) No. 30 series
of 2004. Revised Policies and Standards for
Undergraduate Teacher Education Curriculum.
[2] Republic Act No. 7836. Teachers’
Professionalization Act of 1994.
[3] Diaz, R.V. et al. (2013). LET as a Predictor of
Teaching Performance: The Case of PNU
Graduates Across Disciplines (2007-2010). The
Normal Lights, 7(2), 19-36.
[4] Tan, W.S., Almerez, A.U., Pardillo, A., Batulan,
S.S., Gonzales, J., Cal, C.I., Labang, J. (2015).
Trend of Customs Licensure Examination of the
Philippines. Educational Measurement and
Evaluation Review, 6, 11-22.
[5] Republic Act No. 8981. PRC Modernization Act
of 2000.
[6] Hair. J.F., Black, W.C., Babin, B.J., & Anderson,
R.E. (2010). Multivariate Data Analysis (7 th ed.).
Upper Saddle River, New Jersey: Prentice Hall.
[7] Nool, N.R., & Ladia, M.A.P., (2012). Analysis of
the Performance in the Licensure Examination for
Teachers of State Universities and Colleges in
Region III. Paper Presented at the Annual Agency
In-House Review for Completed Researches,
Tarlac State University, Tarlac City, Philippines.
[8] Ladia, M.A.P. (2014). Analysis of the LET
Performance of Centers of Excellence and Centers
of Development for Teacher Education:
Implications to Policy, Practice and Research.
International Journal of Engineering Research and
Management, 1(6), 210-220.
[9] Nool, N.R., Ladia, M.A.P., Facun, R.D., & Garcia,
R.C. (2012). Centers of Excellence and Centers of
Development for Teacher Education: Their
Contribution to the Elementary Teacher Force.
International Proceedings of Economic
Development and Research, Vol. 30, 326–330.
[10] Antiojo, L.P. (2017). Performance of Education
Graduates in the Licensure Examination for
Teachers (LET). PEOPLE: International Journal of
Social Sciences, 3(2), 1363-1384.
[11] Nool, N.R. & Corpuz, N.B. (2017). Comparative
Analysis of the LET Performance of BEEd
Graduates in Tarlac State University. Tarlac City,
Philippines.
[12] Nool, N.R., Hilario, C.B. & Santos, A.L. (2007).
BSIE Graduates’ LET Performance from 1998 to
2006. The Education Journal, Volume 8.
[13] Balanquit, E.P., Nool, N.R., Ladia, M.A.P., &
Punzalan, J.Y. (2017). Exploring the Variations in
the LET Performance of TSU BSEd graduates.
Tarlac State University, Tarlac City, Philippines.
[14] Nool, N.R., Ladia, M.A.P., & Balanquit, E.P.
(2017). Variations in the Licensure Examination
Performance of Centers of Excellence and Centers
of Development in Teacher Education in the
Philippines. Tarlac State University, Tarlac City,
Philippines.
[15] Nool, N.R., & Ladia, M.A.P. (2017). Comparative
Analysis of the LET Performance of State
Universities and Colleges in the Philippines. Tarlac
State University, Tarlac City, Philippines.
[16] Bañez, S.E.S., & Pardo, C.G. (2016). Licensure
Examination Performance of BSEd-Biological and
Physical Science Graduates in a State University in
Northern Philippines. Journal of Educational and
Human Resource Development, 4, 119-132.
[17] Nool, N.R., & Ladia, M.A.P. (2017). Exploring the
Differences in the LET Performance of State
Universities and Colleges in the Philippines. Tarlac
State University, Tarlac City, Philippines.
[18] Calingacion, E. (2015). 2014 LET Performance of
Schools in the Philippines: An Analysis of
Roughness. Prism, 20(1), 21-26.
[19] Nool, N.R., Balanquit, E.P., & Ladia, M.A.P.
(2017). Cost per Student in State Universities and
Colleges: Does it Affect Graduates’ Licensure
Examination Performance? Tarlac State
University, Tarlac City, Philippines.
[20] Depamaylo, K.P. (2015). The Relationship of
College Admission Test and Mock Board
Examination to the Licensure Examination for
Customs Brokers. Proceedings Journal of
Interdisciplinary Research, 227-232.
[21] Nool, N.R., Ladia, M.A.P., Garcia, R.C.,
Balanquit, E.P., & Corpuz, N.B. (2017).
Accreditation Status and LET Performance of State
Universities and Colleges in the Philippines. Tarlac
State University, Tarlac City, Philippines.

International Journal of Applied Engineering Research ISSN 0973-4562 Volume 12, Number 24 (2017) pp. 15734-15745
© Research India Publications. http://www.ripublication.com
15744
[22] Esmeralda, A.B. & Espinosa, J.P. (2015). Teacher
Education Graduates’ Performance as Predictor of
Licensure Examination for Teachers’ Results.
JPAIR Multidisciplinary Research, 21(1).
[23] Nool, N.R., & Ladia, M.A.P. (2017). Faculty
Student Ratio and LET Performance of State
Universities and Colleges in the Philippines. Tarlac
State University, Tarlac City, Philippines.
[24] Faltaldo, R.E. (2014). Correlates of performance in
the Licensure Examination of Selected Public and
Private Teacher Institutions. International Journal
of Education and Research, 2(8), 167-176.
[25] Nool, N.R., Corpuz, N.B., & Ladia, M.A.P. (2017).
Faculty Student Ratio in State Universities and
Colleges: Does it Predict Graduates’ Licensure
Examination Performance? Tarlac State
University, Tarlac City, Philippines.
[26] Gono, E.R. (2016). Probabilistic Estimation of
Passing the Pharmacist Licensure Examination.
University of Mindanao International
Multidisciplinary Research Journal, 1(2), 132-139.
[27] Nool, N.R., & Ladia, M.A.P. (2017). Performance
of Teacher Education Graduates in Licensure
Examination: Does Admission Test Matter? Tarlac
State University, Tarlac City, Philippines.
[28] Hena, R.H., Ballado, R.S., Dalucapas, M.C.,
Ubane, S.C., & Basierto, R.C. (2014). Variates of
the Performance of Teacher Education Graduates
in the Licensure Examination for Teachers (LET).
International Journal of Interdisciplinary Research
and Innovations, 2(4), 157-163.
[29] Nool, N.R., Embesan, S.A., & Ladia, M.A.P.
(2017). Cost per Student and LET Performance of
State Universities and Colleges in the Philippines:
Is There a Link? Tarlac State University, Tarlac
City, Philippines.
[30] Kalaw, M.T.B. (2017). Trend of De La Salle Lipa
Education Graduates’ Performance in the
Licensure Examination for Teachers (LET) from
2011 to 2015. International Journal of Evaluation
and Research in Education, 6(2), 138-149.
[31] Nool, N.R., Ladia, M.A.P., Corpuz, N.B.,
Balanquit, E.P., & Embesan, S.A. (2017).
Exploring Academic Variables Predicting the LET
Performance of Teacher Education Graduates.
Tarlac State University, Tarlac City, Philippines.
[32] Montemayor, E.S., Roxas, C.C., & Panayon, V.L.
(2009). Mock Examination: Its Influence on
Performance in the Licensure Examination for
Teachers. University of the Cordilleras Research
Journal, 1(3).
[33] Nool, N.R., Ladia, M.A.P., Corpuz, N.B., &
Embesan, S.A. (2017). Exploring the Validity of
TSU College Admission Test in Predicting
Graduates’ LET Performance. Paper presented at
the 2017 Year-End In-House Review of Completed
Researches, Tarlac State University, Tarlac City,
Philippines.
[34] Puertos, J.D. (2015). Performance on the Licensure
Exam for Teachers among Liceo De Cagayan
University Education Graduates. Liceo Journal of
Higher Education Research, 11(1), 119-131.
[35] Nool, N.R., Corpuz, N.B., & Ladia, M.A.P. (2017).
Advanced Degrees of Faculty Members in State
Universities and Colleges: Does it Influence
Graduates’ Licensure Examination Performance?
Tarlac State University, Tarlac City, Philippines.
[36] Rabanal, G.C. (2016). Academic Achievement and
LET Performance of the Bachelor of Elementary
Education Graduates, University of Northern
Philippines. International Journal of Scientific and
Research Publications, 6(6), 455-461.
[37] Nool, N.R., Ladia, M.A.P., & Embesan, S.A.
(2017). Educational Attainment of Faculty
Members as a Predictor of LET Performance in
State Universities and Colleges in the Philippines.
Tarlac State University, Tarlac City, Philippines.
[38] Rudio, V.O. (2016). Performance of Teacher
Education Graduates, DMMMSU-NLUC,
Philippines in the Licensure Examination CY 2011
to 2013. International Journal of Educational
Science and Research, 6(3), 1-16.
[39] Nool, N.R. (2017). A Model for Predicting the LET
Performance of State Universities and Colleges in
the Philippines. Tarlac State University, Tarlac
City, Philippines.
[40] Soriano, H.A.S. (2009). Factors Associated with
the Performance of USM College of Education
Graduates in the 2007 Licensure Examination for
Teachers. USM R&D Journal, 17(2), 151-160.
[41] Nool, N.R., Balanquit, E.P., Ladia, M.A.P., &
Embesan, S.A. (2017). Top Performing Schools in
the Licensure Examination for Teachers: Where do
they come from? Tarlac State University, Tarlac
City, Philippines.
International Journal of Applied Engineering Research ISSN 0973-4562 Volume 12, Number 24 (2017) pp. 15734-15745
© Research India Publications. http://www.ripublication.com
15745
[42] Tarun, I.M. (2017). Prediction Models for
Licensure Examination Performance using Data
Mining Classifiers for Online Test and Decision
Support System. Asia Pacific Journal of
Multidisciplinary Research, 5(3), 10-21.
[43] Nool, N.R., Ladia, M.A.P. Corpuz, N.B., David,
S.M., Mendoza, J.P., & Punzalan, J.Y. (2017). Does
the College Retention Examination Predict the LET
Performance of Teacher Education Graduates?
Tarlac State University, Tarlac City, Philippines.
[44] Visco, D.A. (2015). Predictors of Performance in
the Licensure Examination for Teachers of the
Graduates of Higher Education Institutions in
Abra. International Journal of Management
Research and Business Strategy, 4(1), 181-191.
[45] Nool, N.R., Corpuz, N.B., Ladia, M.A.P., &
Balanquit, E.P. (2017). Licensure Examination
Performance and Accreditation Status of
Secondary Teacher Education Programs of State
Universities and Colleges. Tarlac State University,
Tarlac City, Philippines.
[46] Ladia, M.A.P., & Nool, N.R. (2017). Development
of a Model of Faculty-Student Ratio and LET
Performance of Centers of Excellence and Centers
of Development in Teacher Education. Tarlac State
University, Tarlac City, Philippines.
[47] Nool, N.R., Ladia, M.A.P., & Balanquit, E.P.
(2017). LET Performance of Centers of Excellence
and Centers of Development in Teacher
Education: Does Faculty Members’ Educational
Attainment Matter? Tarlac State University, Tarlac
City, Philippines.