Trend Line Drawing Rules For Better Trades
48
-
Upload
netpickstrading -
Category
Education
-
view
173 -
download
4
Transcript of Trend Line Drawing Rules For Better Trades


Like most forms of technical
analysis, trend lines are often
abused, misused, and for the
most part are not drawn with
any sort of consistency.

What they mean
How to draw them
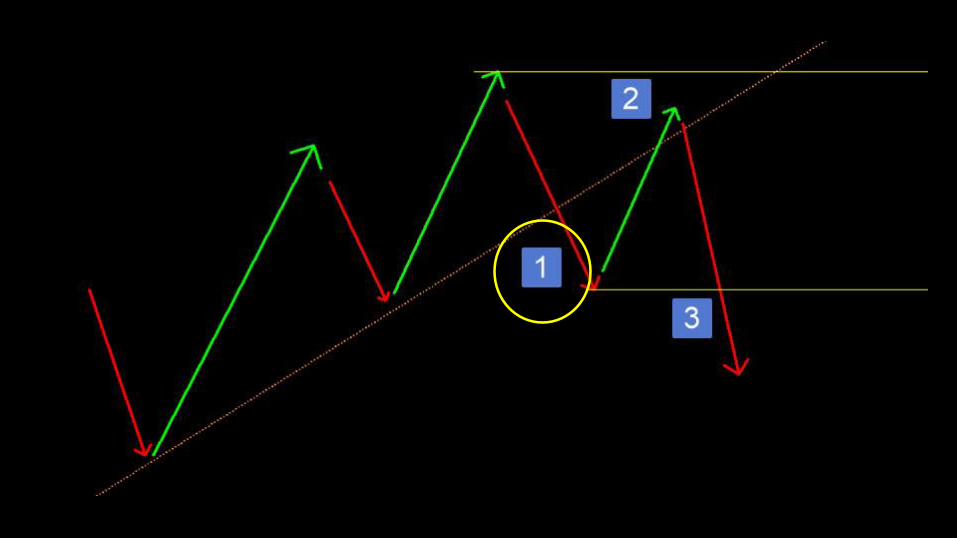
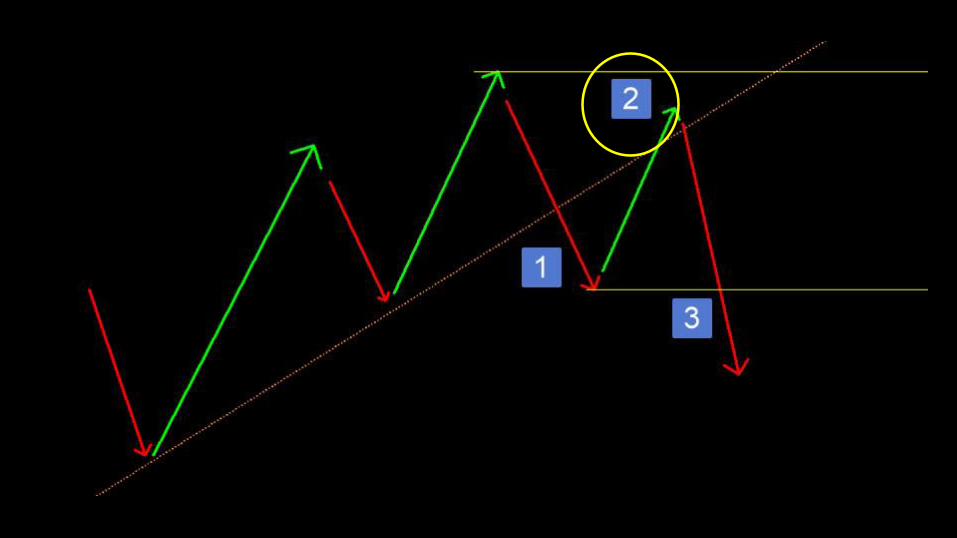
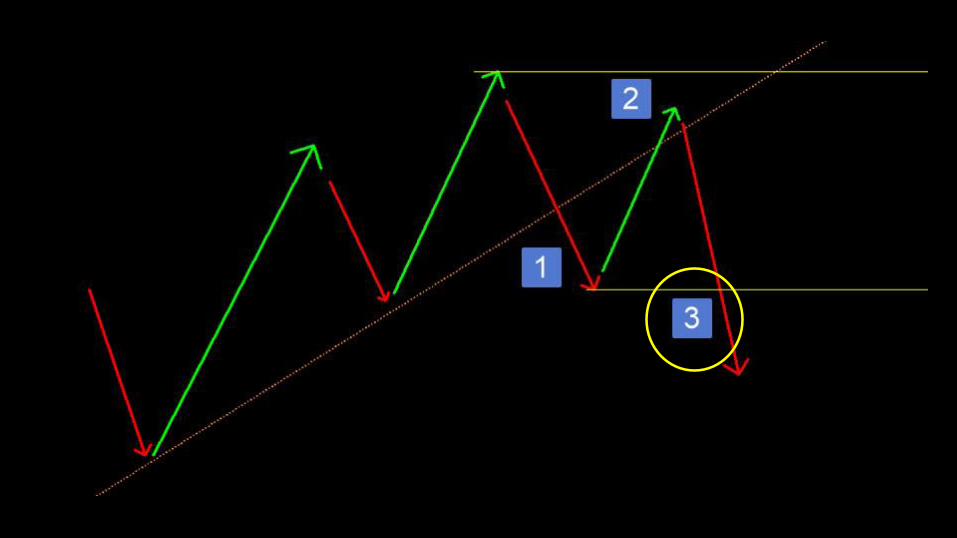
1-2-3 reversal

Lower demand –
smaller impulse moves
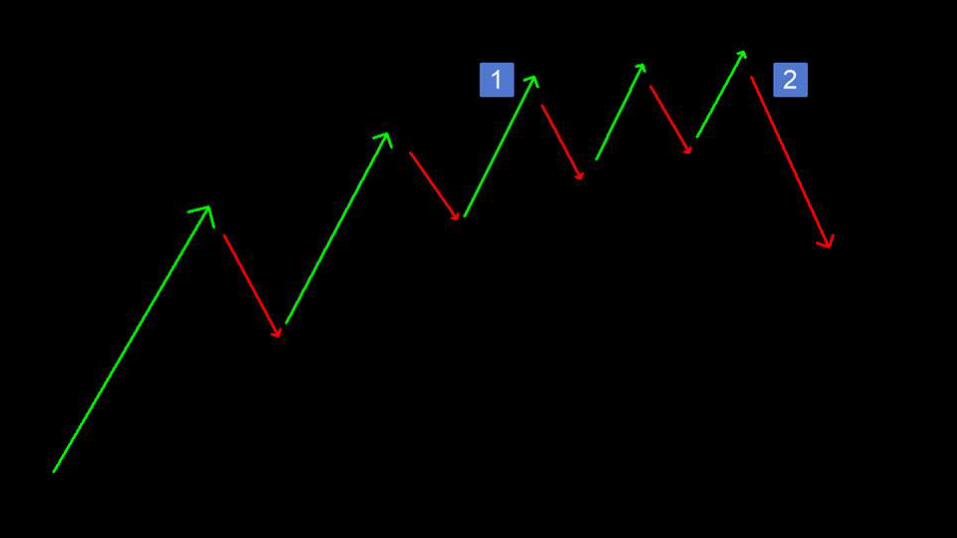
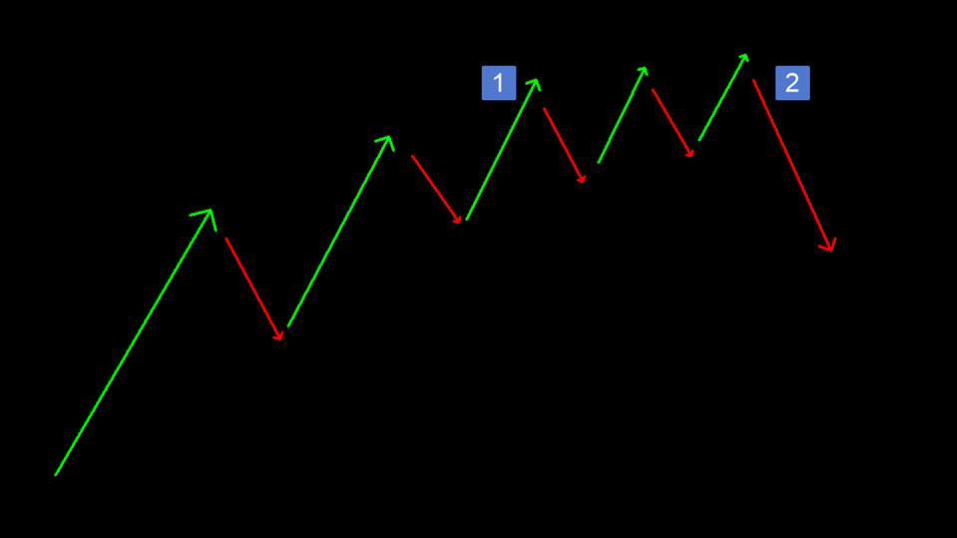

Being in tune with the
swings can give you a
“heads up”


Retest of the highs
Consolidation
Complex correction

Steady trend leading to
Acceleration


Look for pullbacks after
these moves

You could be looking at
least at a temporary
top/bottom

Don't let the fear of missing
out on a trade lead you to
jump in just as the market
begins the turn.
No hard and fast
rules…..but you must be
consistent.

"Lessons From A Wall
Street Master“
Victor Sperandeo
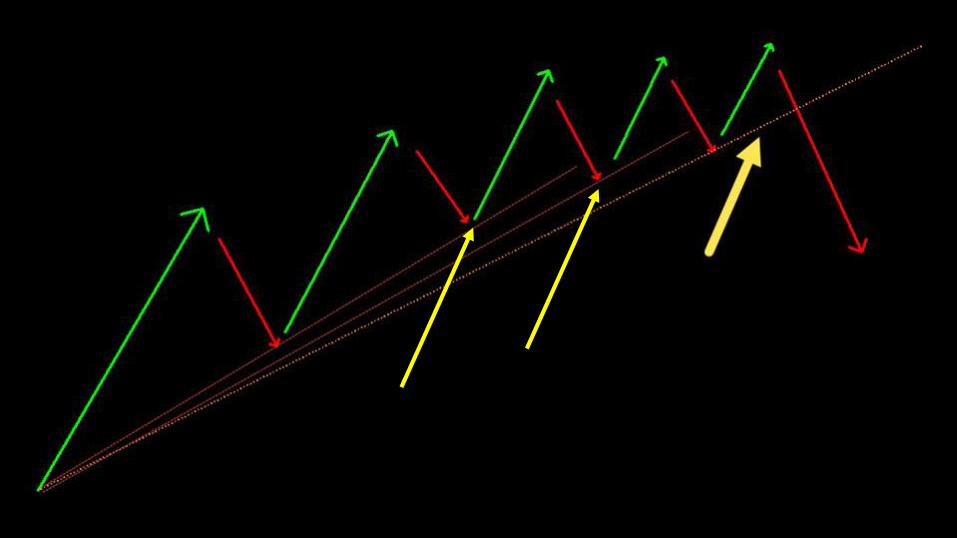
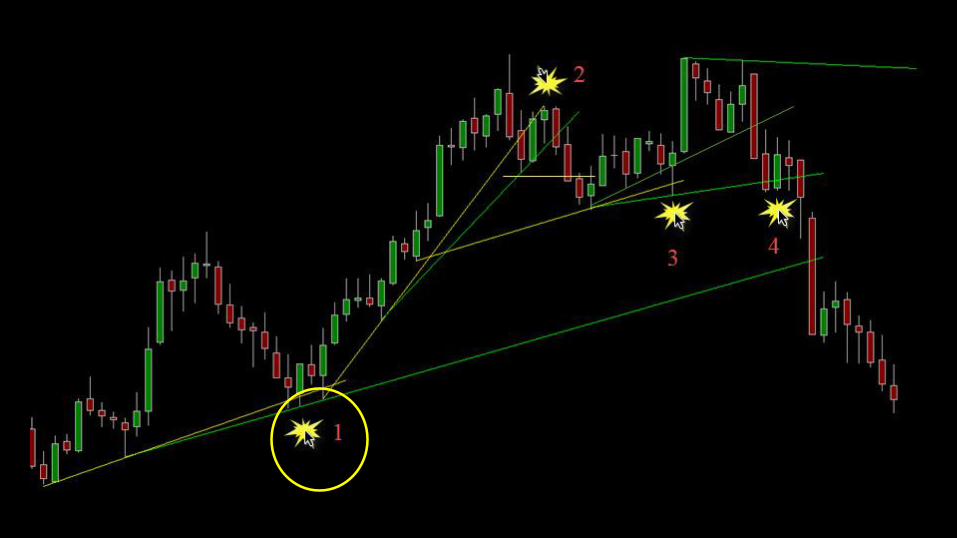
Start at initial pivot
New highs/lows = adjust
Do not cut through price
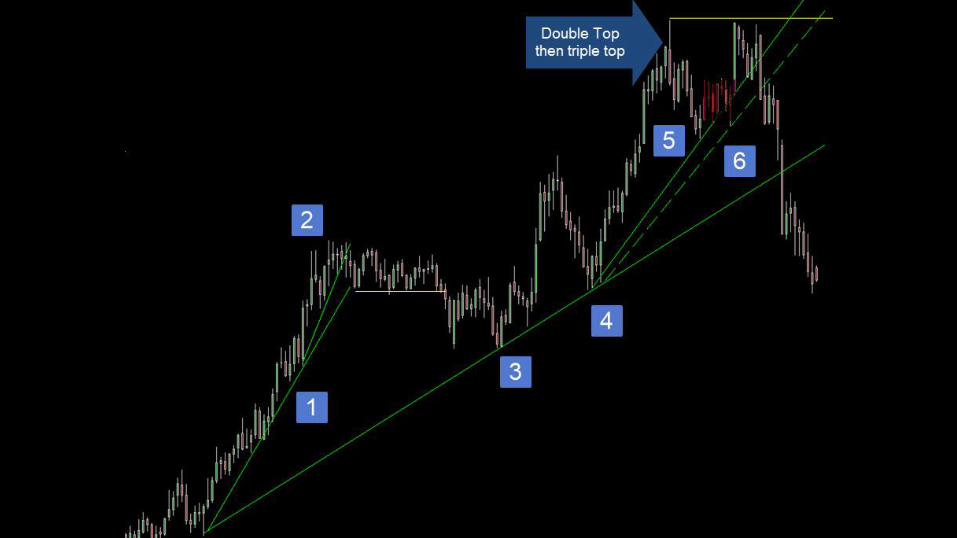


Use the initial anchor
where price changed
trend
Each time price makes a
new high, use the
previous low to draw to
from the anchor
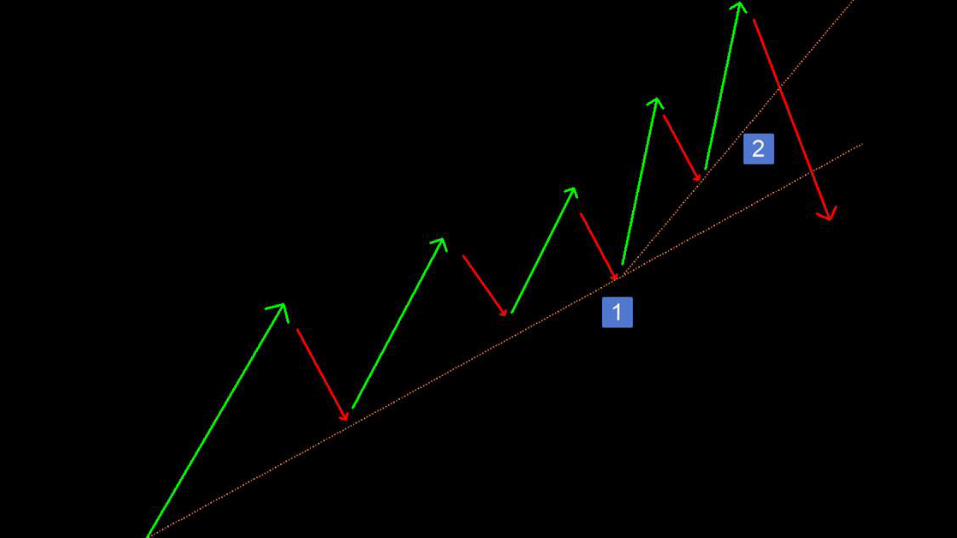
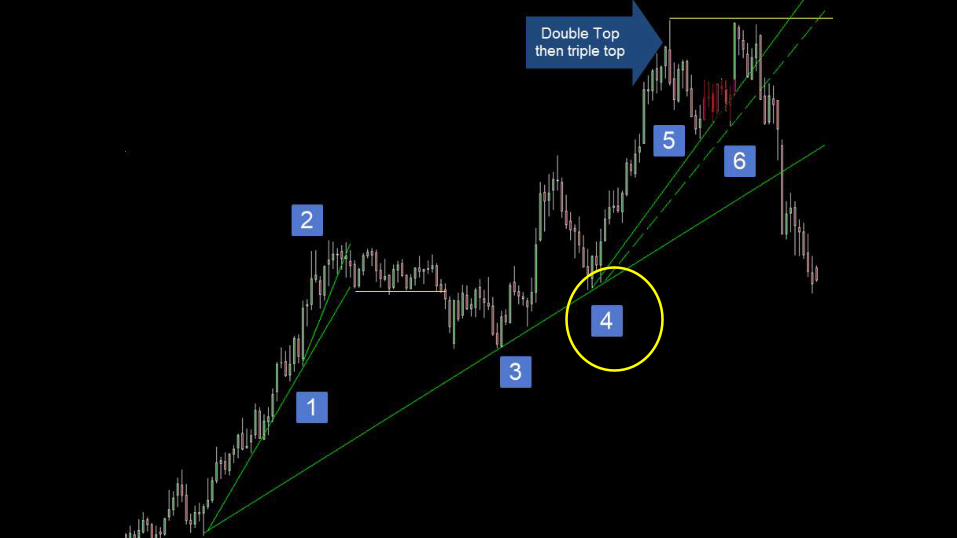
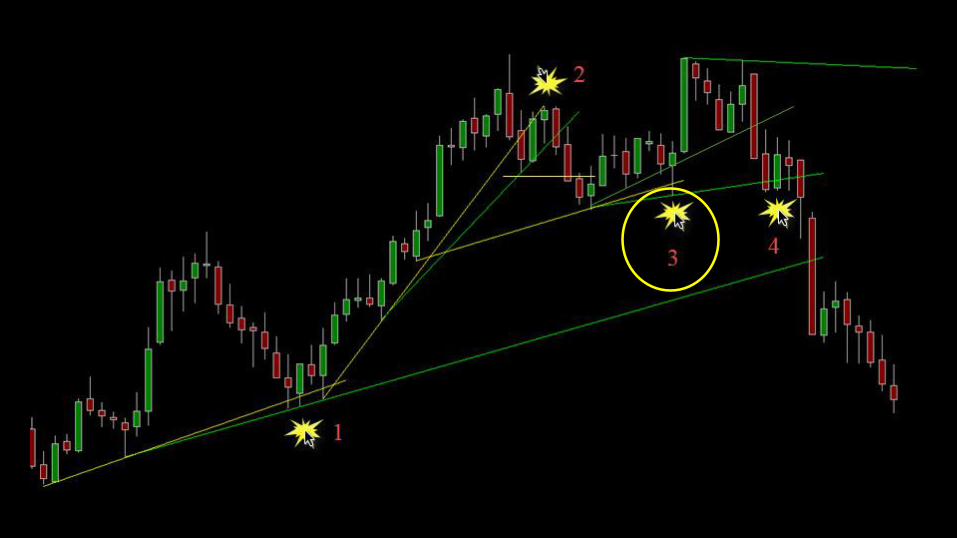
If the trend line starts to
cut through price, there is
a change in the rhythm of
the market and possibly a
change in trend.

Use a new anchor point
to fan the trend line
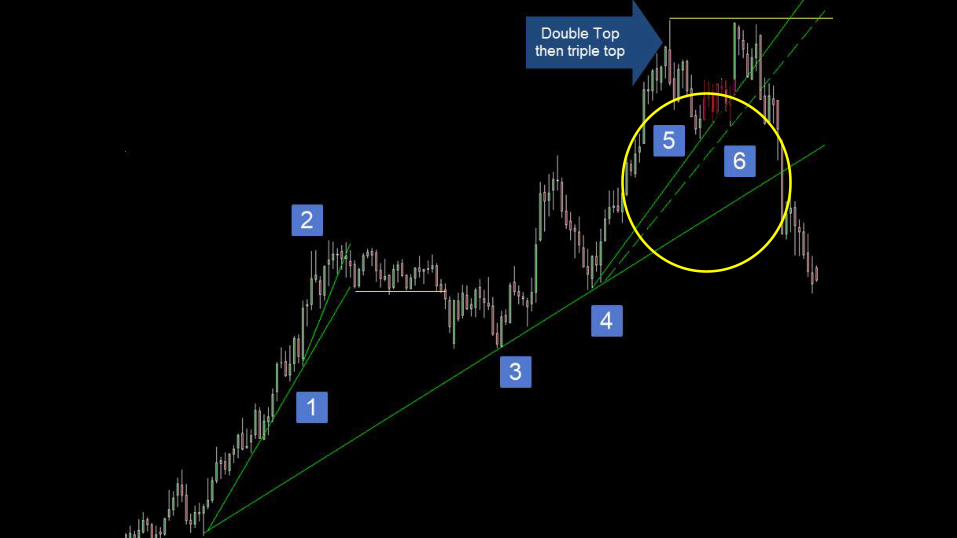
Continue to meet new
higher lows until a reversal
pattern emerges

en.wikipedia.org/wiki/Thomas_DeMark

Connecting pivot levels
that are at least a three
candle pattern


How you use this
information depends on
how it speaks to you

1-2-3 Reversals With
Trend Lines

Correction on a higher
time frame is a down trend
on a lower time frame.(opposite higher time frame downtrend)

Trend lines show rhythm
of market

A skill you can master…
but maybe never execute

Trend lines can show you
zones of opportunity

Consistent practice