


TREND INVESTMENT
312
North America Equity Research 02 January 2008 Nothing But Net 2008 Internet Investment Guide Internet Imran Khan AC (1-212) 622-6693 [email protected] Bridget Weishaar (1-212) 622-5032 [email protected] Lev Polinsky, CFA (1-212) 622-8343 [email protected] Joseph Boushelle, CFA (1-212) 622-8523 [email protected] www.morganmarkets.com J.P. Morgan Securities Inc. See page 309 for analyst certification and important disclosures, including investment banking relationships. JPMorgan does and seeks to do business with companies covered in its research reports. As a result, investors should be aware that the firm may have a conflict of interest that could affect the objectivity of this report. Investors should consider this report as only a single factor in making their investment decision. Customers of JPMorgan in the United States can receive independent, third-party research on the company or companies covered in this report, at no cost to them, where such research is available. Customers can access this independent research at www.morganmarkets.com or can call 1-800-477-0406 toll free to request a copy of this research. China Internet Dick Wei AC (852) 2800 8535 [email protected] Please see our notes changing ratings for Priceline, and our note changing estimates for the remainder of our coverage released simultaneously. All data and valuation in this report priced as of 26 Dec 2007. 2007 saw Internet companies outperform the broader stock market, as the HHH rose ~14%, vs. a ~5% rise in the S&P 500. We believe some of the factors that drove F’07 outperformance will persist into F’08, and thus expect the sector to outperform the broader market. • Expect 34% EPS Growth, vs. 8% for the S&P 500. We expect revenue growth to decelerate to 21.2% in F’08, from 25.6% in F’07. We are projecting 34% earnings growth for our coverage universe, compared to 8% for the S&P 500. • Expect Blended CPM Pricing Growth Rate to Accelerate. We think blended CPM pricing bottomed out in F’07. We expect tighter offline inventory and better monetization techniques will lead to a re-acceleration of growth in F’08. • We Project Global Search Revenue to Hit $60B by 2011. We are raising our F’08 global search revenue estimate to $30.5B, from $26.2B, driven by strong volume trends, better-than-expected monetization, and continued robust growth in Continental Europe. We expect the global search market to reach $60B by 2011, growing at a 28% CAGR over the next four years. • Global Consumer Growth Should Benefit Internet Companies. World GDP growth has outpaced US growth in recent years, and a projected 3-year CAGR of 6.5% for emerging economies means hundreds of millions of new consumers. We think large Internet companies’ global reach means they’ll benefit from this rising tide. • M&A Market Likely to Remain Healthy. The five biggest companies in our universe generated $8.8B in FCF in F’07, a number we project will grow to $12.5B in F’08. While some of that cash should continue to fund share repurchases, we think a significant portion of the incremental cash flow is likely to lead to continued M&A in the sector. • Top Picks. The above trends translate into our top Overweight ideas going into the new year: GOOG, YHOO, EXPE, OMTR, SFLY and MNST.
-
Upload
mba-corner-by-babasab-patil-karrisatte -
Category
Education
-
view
752 -
download
0
description
TREND INVESTMENT OF JP MORGON AND FINANCE
Transcript of TREND INVESTMENT

North America Equity Research 02 January 2008
Nothing But Net
2008 Internet Investment Guide
Internet
Imran KhanAC
(1-212) 622-6693 [email protected]
Bridget Weishaar (1-212) 622-5032 [email protected]
Lev Polinsky, CFA (1-212) 622-8343 [email protected]
Joseph Boushelle, CFA (1-212) 622-8523 [email protected]
www.morganmarkets.com J.P. Morgan Securities Inc.
See page 309 for analyst certification and important disclosures, including investment banking relationships.JPMorgan does and seeks to do business with companies covered in its research reports. As a result, investors should be aware that the firm may have a conflict of interest that could affect the objectivity of this report. Investors should consider this report as only a single factor in making their investment decision. Customers of JPMorgan in the United States can receive independent, third-party research on the company or companies covered in this report, at no cost to them, where such research is available. Customers can access this independent research at www.morganmarkets.com or can call 1-800-477-0406 toll free to request a copy of this research.
China Internet
Dick WeiAC (852) 2800 8535 [email protected]
Please see our notes changing ratings for Priceline, and our note changing estimates for the remainder of our coverage released simultaneously. All data and valuation in this report priced as of 26 Dec 2007.
2007 saw Internet companies outperform the broader stock market, as the HHH rose ~14%, vs. a ~5% rise in the S&P 500. We believe some of the factors that drove F’07 outperformance will persist into F’08, and thus expect the sector to outperform the broader market.
• Expect 34% EPS Growth, vs. 8% for the S&P 500. We expect revenue growth to decelerate to 21.2% in F’08, from 25.6% in F’07. We are projecting 34% earnings growth for our coverage universe, compared to 8% for the S&P 500.
• Expect Blended CPM Pricing Growth Rate to Accelerate. We think blended CPM pricing bottomed out in F’07. We expect tighter offline inventory and better monetization techniques will lead to a re-acceleration of growth in F’08.
• We Project Global Search Revenue to Hit $60B by 2011. We are raising our F’08 global search revenue estimate to $30.5B, from $26.2B, driven by strong volume trends, better-than-expected monetization, and continued robust growth in Continental Europe. We expect the global search market to reach $60B by 2011, growing at a 28% CAGR over the next four years.
• Global Consumer Growth Should Benefit Internet Companies. World GDP growth has outpaced US growth in recent years, and a projected 3-year CAGR of 6.5% for emerging economies means hundreds of millions of new consumers. We think large Internet companies’ global reach means they’ll benefit from this rising tide.
• M&A Market Likely to Remain Healthy. The five biggest companies in our universe generated $8.8B in FCF in F’07, a number we project will grow to $12.5B in F’08. While some of that cash should continue to fund share repurchases, we think a significant portion of the incremental cash flow is likely to lead to continued M&A in the sector.
• Top Picks. The above trends translate into our top Overweight ideas going into the new year: GOOG, YHOO, EXPE, OMTR, SFLY and MNST.
2
North America Equity Research 02 January 2008
Imran Khan (1-212) 622-6693 [email protected]
Table of Contents Key Investment Themes ..........................................................5 Dot.Khan’s Top Ten for 2008.................................................13 U.S. Sector Outlooks..............................................................15 China Outlook.........................................................................99 Amazon.com, Neutral ($92.85) ............................................121 Blue Nile, Neutral ($74.16) ...................................................129 CNET Networks, Neutral ($8.90) ..........................................136 eBay, Overweight ($34.49) ...................................................144 Expedia, Overweight ($32.56)..............................................154 Google, Overweight ($710.84) .............................................161 HouseValues, Underweight ($2.94) .....................................169 InfoSpace, Neutral ($18.96)..................................................177 InnerWorkings, Neutral ($18.40)..........................................183 Liberty Interactive, Neutral ($19.79) ....................................190 Mercadolibre, Overweight ($72.85) .....................................199 Monster Worldwide, Overweight ($33.91)...........................208 Move, Inc., Neutral ($2.70) ...................................................215 Omniture, Overweight ($34.95)............................................222 Priceline, Overweight ($118.23)...........................................229 Shutterfly, Overweight ($27.38) ...........................................239 ValueClick, Overweight ($23.39)..........................................247 Yahoo!, Overweight ($23.96) ...............................................255 Baidu, Overweight ($399.67)................................................267 China Finance Online, Overweight ($23.75) .......................272 NetEase, Neutral ($19.33).....................................................276 Ninetowns, Underweight ($3.45) .........................................281 Shanda, Overweight ($34.39)...............................................285 Sina, Neutral ($45.50) ...........................................................290 Sohu, Overweight ($56.58)...................................................294 The9, Overweight ($23.50) ...................................................299 The authors acknowledge the contribution of Deval Delivala and Rachna Srivastava of J.P. Morgan Services India Private Ltd., Mumbai, and John Ventimiglia of J.P. Morgan Securities Inc. to this report.
3
North America Equity Research 02 January 2008
Imran Khan (1-212) 622-6693 [email protected]
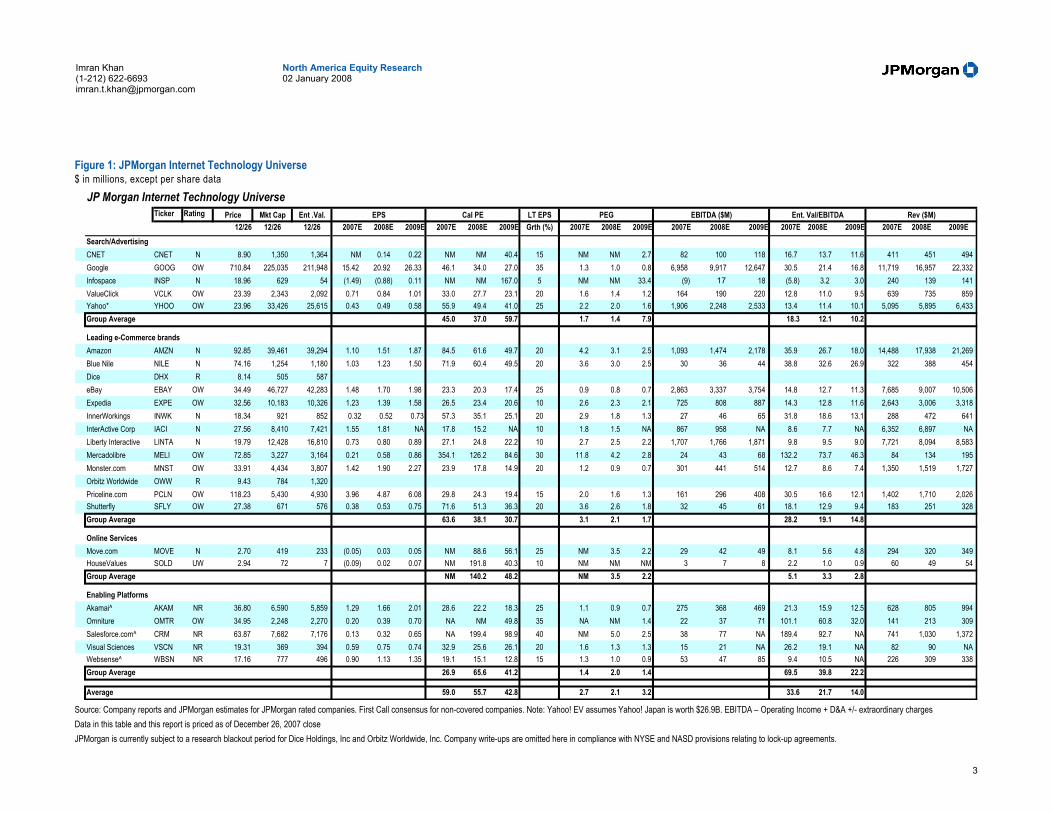
Figure 1: JPMorgan Internet Technology Universe $ in millions, except per share data
Ticker Rating Price Mkt Cap Ent .Val. EPS Cal PE LT EPS PEG EBITDA ($M) Ent. Val/EBITDA Rev ($M)12/26 12/26 12/26 2007E 2008E 2009E 2007E 2008E 2009E Grth (%) 2007E 2008E 2009E 2007E 2008E 2009E 2007E 2008E 2009E 2007E 2008E 2009E
Search/AdvertisingCNET CNET N 8.90 1,350 1,364 NM 0.14 0.22 NM NM 40.4 15 NM NM 2.7 82 100 118 16.7 13.7 11.6 411 451 494 Google GOOG OW 710.84 225,035 211,948 15.42 20.92 26.33 46.1 34.0 27.0 35 1.3 1.0 0.8 6,958 9,917 12,647 30.5 21.4 16.8 11,719 16,957 22,332 Infospace INSP N 18.96 629 54 (1.49) (0.88) 0.11 NM NM 167.0 5 NM NM 33.4 (9) 17 18 (5.8) 3.2 3.0 240 139 141 ValueClick VCLK OW 23.39 2,343 2,092 0.71 0.84 1.01 33.0 27.7 23.1 20 1.6 1.4 1.2 164 190 220 12.8 11.0 9.5 639 735 859 Yahoo* YHOO OW 23.96 33,426 25,615 0.43 0.49 0.58 55.9 49.4 41.0 25 2.2 2.0 1.6 1,906 2,248 2,533 13.4 11.4 10.1 5,095 5,895 6,433 Group Average 45.0 37.0 59.7 1.7 1.4 7.9 18.3 12.1 10.2
Leading e-Commerce brandsAmazon AMZN N 92.85 39,461 39,294 1.10 1.51 1.87 84.5 61.6 49.7 20 4.2 3.1 2.5 1,093 1,474 2,178 35.9 26.7 18.0 14,488 17,938 21,269 Blue Nile NILE N 74.16 1,254 1,180 1.03 1.23 1.50 71.9 60.4 49.5 20 3.6 3.0 2.5 30 36 44 38.8 32.6 26.9 322 388 454 Dice DHX R 8.14 505 587 eBay EBAY OW 34.49 46,727 42,283 1.48 1.70 1.98 23.3 20.3 17.4 25 0.9 0.8 0.7 2,863 3,337 3,754 14.8 12.7 11.3 7,685 9,007 10,506 Expedia EXPE OW 32.56 10,183 10,326 1.23 1.39 1.58 26.5 23.4 20.6 10 2.6 2.3 2.1 725 808 887 14.3 12.8 11.6 2,643 3,006 3,318 InnerWorkings INWK N 18.34 921 852 0.32 0.52 0.73 57.3 35.1 25.1 20 2.9 1.8 1.3 27 46 65 31.8 18.6 13.1 288 472 641 InterActive Corp IACI N 27.56 8,410 7,421 1.55 1.81 NA 17.8 15.2 NA 10 1.8 1.5 NA 867 958 NA 8.6 7.7 NA 6,352 6,897 NALiberty Interactive LINTA N 19.79 12,428 16,810 0.73 0.80 0.89 27.1 24.8 22.2 10 2.7 2.5 2.2 1,707 1,766 1,871 9.8 9.5 9.0 7,721 8,094 8,583 Mercadolibre MELI OW 72.85 3,227 3,164 0.21 0.58 0.86 354.1 126.2 84.6 30 11.8 4.2 2.8 24 43 68 132.2 73.7 46.3 84 134 195 Monster.com MNST OW 33.91 4,434 3,807 1.42 1.90 2.27 23.9 17.8 14.9 20 1.2 0.9 0.7 301 441 514 12.7 8.6 7.4 1,350 1,519 1,727 Orbitz Worldwide OWW R 9.43 784 1,320 Priceline.com PCLN OW 118.23 5,430 4,930 3.96 4.87 6.08 29.8 24.3 19.4 15 2.0 1.6 1.3 161 296 408 30.5 16.6 12.1 1,402 1,710 2,026 Shutterfly SFLY OW 27.38 671 576 0.38 0.53 0.75 71.6 51.3 36.3 20 3.6 2.6 1.8 32 45 61 18.1 12.9 9.4 183 251 328 Group Average 63.6 38.1 30.7 3.1 2.1 1.7 28.2 19.1 14.8
Online ServicesMove.com MOVE N 2.70 419 233 (0.05) 0.03 0.05 NM 88.6 56.1 25 NM 3.5 2.2 29 42 49 8.1 5.6 4.8 294 320 349 HouseValues SOLD UW 2.94 72 7 (0.09) 0.02 0.07 NM 191.8 40.3 10 NM NM NM 3 7 8 2.2 1.0 0.9 60 49 54 Group Average NM 140.2 48.2 NM 3.5 2.2 5.1 3.3 2.8
Enabling PlatformsAkamai^ AKAM NR 36.80 6,590 5,859 1.29 1.66 2.01 28.6 22.2 18.3 25 1.1 0.9 0.7 275 368 469 21.3 15.9 12.5 628 805 994 Omniture OMTR OW 34.95 2,248 2,270 0.20 0.39 0.70 NA NM 49.8 35 NA NM 1.4 22 37 71 101.1 60.8 32.0 141 213 309 Salesforce.com^ CRM NR 63.87 7,682 7,176 0.13 0.32 0.65 NA 199.4 98.9 40 NM 5.0 2.5 38 77 NA 189.4 92.7 NA 741 1,030 1,372 Visual Sciences VSCN NR 19.31 369 394 0.59 0.75 0.74 32.9 25.6 26.1 20 1.6 1.3 1.3 15 21 NA 26.2 19.1 NA 82 90 NAWebsense^ WBSN NR 17.16 777 496 0.90 1.13 1.35 19.1 15.1 12.8 15 1.3 1.0 0.9 53 47 85 9.4 10.5 NA 226 309 338 Group Average 26.9 65.6 41.2 1.4 2.0 1.4 69.5 39.8 22.2
Average 59.0 55.7 42.8 2.7 2.1 3.2 33.6 21.7 14.0
JP Morgan Internet Technology Universe
Source: Company reports and JPMorgan estimates for JPMorgan rated companies. First Call consensus for non-covered companies. Note: Yahoo! EV assumes Yahoo! Japan is worth $26.9B. EBITDA – Operating Income + D&A +/- extraordinary charges Data in this table and this report is priced as of December 26, 2007 close JPMorgan is currently subject to a research blackout period for Dice Holdings, Inc and Orbitz Worldwide, Inc. Company write-ups are omitted here in compliance with NYSE and NASD provisions relating to lock-up agreements.

4
North America Equity Research 02 January 2008
Imran Khan (1-212) 622-6693 [email protected]
Table 1: JPMorgan Estimates vs. Consensus Estimates $ in millions, except per share data EPS Revenue Company Ticker FC 08 JPM 08 FC 09 JPM 09 FC 08 JPM 08 FC 09 JPM 09 Amazon.Com Inc AMZN 1.62 1.51 2.41 1.87 18,256 17,938 22,373 21,269 CNET Networks Inc CNET 0.14 0.14 0.20 0.22 450 451 487 494 eBay Inc EBAY 1.66 1.70 1.94 1.98 9,031 9,007 10,603 10,506 Expedia Inc EXPE 1.46 1.39 1.74 1.58 3,008 3,006 3,371 3,318 Google Inc GOOG 20.65 20.92 25.89 26.33 16,547 16,957 21,306 22,332 IAC/Interactivecorp IACI 1.81 1.81 2.06 6,862 6,897 7,206 Infospace Inc INSP -0.29 -0.88 -0.42 0.11 137 139 144 141 Innerworkings Inc INWK 0.52 0.52 0.72 0.73 468 472 625 641 Liberty Media Interactive LINTA 0.79 0.80 1.02 0.89 8,156 8,094 8,727 8,583 Mercadolibre Inc MELI 0.53 0.58 0.83 0.86 131 134 186 195 Monster Worldwide Inc MNST 1.83 1.90 2.22 2.27 1,561 1,519 1,815 1,727 Move Inc MOVE 0.04 0.03 0.17 0.05 318 320 374 349 Blue Nile Inc NILE 1.32 1.23 1.67 1.50 394 388 470 454 Omniture Inc OMTR 0.41 0.39 0.69 0.70 220 213 327 309 Priceline.Com Inc PCLN 4.78 4.87 5.79 6.08 1,690 1,710 1,870 2,026 Shutterfly Inc SFLY 0.57 0.53 0.90 0.75 252 251 326 328 HouseValues Inc SOLD -0.07 0.02 N/A 0.07 46 49 #N/A 54 Valueclick Inc VCLK 0.82 0.84 1.06 1.01 741 735 869 859 Yahoo Inc YHOO 0.55 0.49 0.72 0.58 5,954 5,895 6,833 6,433 Source: Company filings, First Call, and JPMorgan estimates
5
North America Equity Research 02 January 2008
Imran Khan (1-212) 622-6693 [email protected]
Key Investment Themes We Expect CPMs to Rise in 2008 While we think CPM growth was relatively muted in 2007, we expect 2008 will see it accelerate, driven by several factors, including easier comps, better inventory sell-through, behavioral and geographic targeting, and ad exchanges.
Tighter Offline Inventory Broadcast network total day ratings were ~8% lower in 2007, and we expect inventory is likely to continue shrinking further in 2008. Additionally, the reduced supply will face higher demand, as we believe as much as 6% of spot TV ads in 2008 may be taken up by political ads. We expect the inventory tightness will have a spillover effect online, as advertisers continue to shift a greater percentage of their spend away from traditional media.
The Rise of Ad Networks More than 80% of online inventory currently sells for less than a $1 CPM. As such, we think ad networks present a significant opportunity for publishers to increase yield, and, given the low base, the CPM enhancement from using ad networks will not have to be very large, in absolute terms, to move the needle.
Inventory Aggregation Many companies are aggregating traffic through partnerships and acquisitions. We think aggregation is likely to lead to a certain degree of pricing power for the aggregators. More importantly, we expect advertisers to be more willing to buy from aggregators that offer them sufficient scale.
Easier Comps 2007 saw pressure on graphical ad CPMs, driven primarily by increases in non-premium inventory, from sites such as MySpace and Facebook. We think the 2007 softness in the market is likely to set a lower base for 2008.
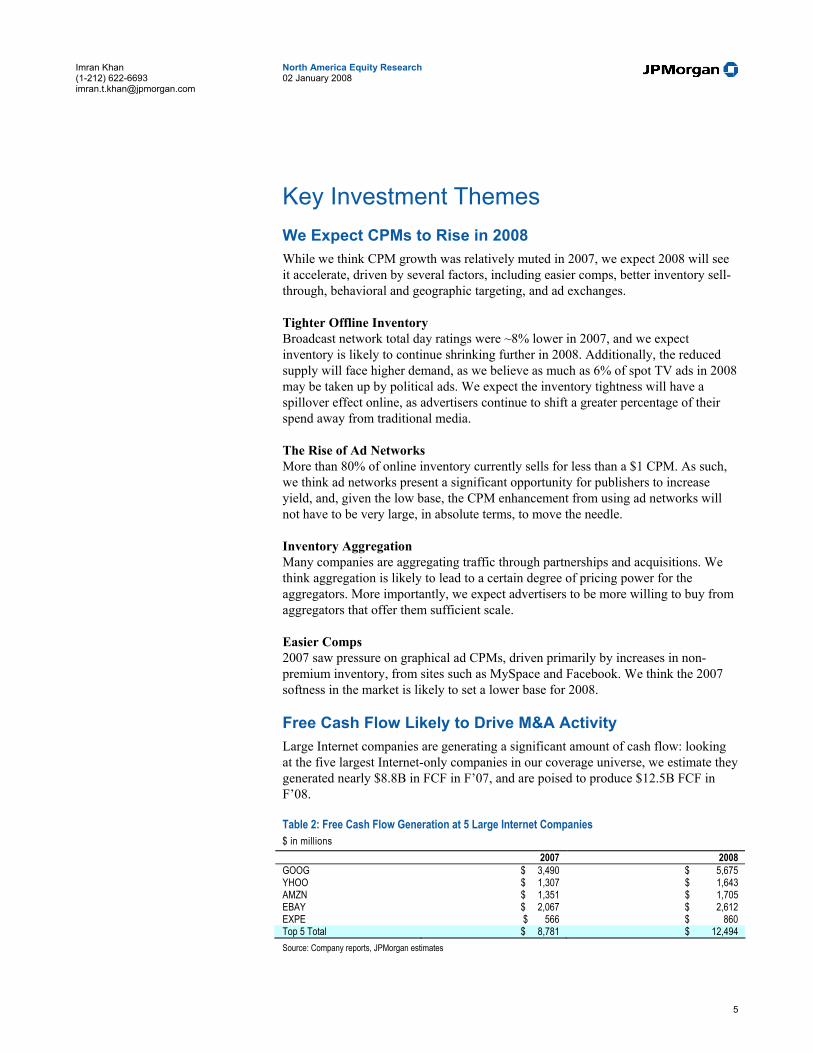
Free Cash Flow Likely to Drive M&A Activity Large Internet companies are generating a significant amount of cash flow: looking at the five largest Internet-only companies in our coverage universe, we estimate they generated nearly $8.8B in FCF in F’07, and are poised to produce $12.5B FCF in F’08.
Table 2: Free Cash Flow Generation at 5 Large Internet Companies $ in millions
2007 2008 GOOG $ 3,490 $ 5,675 YHOO $ 1,307 $ 1,643 AMZN $ 1,351 $ 1,705 EBAY $ 2,067 $ 2,612 EXPE $ 566 $ 860 Top 5 Total $ 8,781 $ 12,494 Source: Company reports, JPMorgan estimates

6
North America Equity Research 02 January 2008
Imran Khan (1-212) 622-6693 [email protected]
While we believe some of these companies will use part of their income stream on share repurchases, we expect that a significant part will continue to spur increased M&A activity in the sector.
Table 3: Uses of Free Cash Flow at 5 Large Internet Companies, TTM $ in million, 4Q’06 – 3Q’07
TTM FCF ($M) Cash Acquisitions/FCF Buyback/FCF GOOG 2,902 33.4% 0.0% YHOO 1,300 33.6% 104.9% AMZN 801 6.1% 31.0% EBAY 2,052 15.5% 105.8% EXPE 777 8.0% 179.8% Top 5 Total 7,831 23.4% 66.1% Source: Company reports, JPMorgan Estimates Note: Table does not include acquisitions made with stock, such as Google’s YouTube acquisition In particular, we believe large companies will continue to seek out investments in social media, where sites often grow virally and the large-caps appear satisfied, for the most part, to let the public pick the winners out of a crowded field before making acquisitions.
In the ad network and ad exchange space, we expect the need for scale to lead to continued consolidation and M&A activity, although perhaps not at the scale we have witnessed in F’07, most sizably with the DoubleClick and aQuantive transactions.
We expect continued M&A to be motivated by one or more of these key factors:
• Traffic. Developing high-traffic sites is difficult, and larger companies are often willing to pay for sites that have proven an ability to generate traffic.
• Technology. Companies that develop a technology that is difficult or uneconomical to replicate are often targets for acquisitions; such companies may also generate traffic, but the technology is a motivator for the buyer.
• Transactional. Companies with a proven track record of revenue and sales generation make attractive targets, as well; a recent example of a transactional-focused acquisition is the 2007 purchase of Mezimedia by ValueClick.
Additionally, we continue to believe that there are synergies to be captured by a strategic partnership among large-cap Internet companies, due to (1) increased scale, (2) strengthened global footprint, (3) broadened user insights and (4) improved operational efficiencies. We believe continuing share gains and product introductions by Google may compel other large-cap Internet companies to explore strategic alliances.
7
North America Equity Research 02 January 2008
Imran Khan (1-212) 622-6693 [email protected]
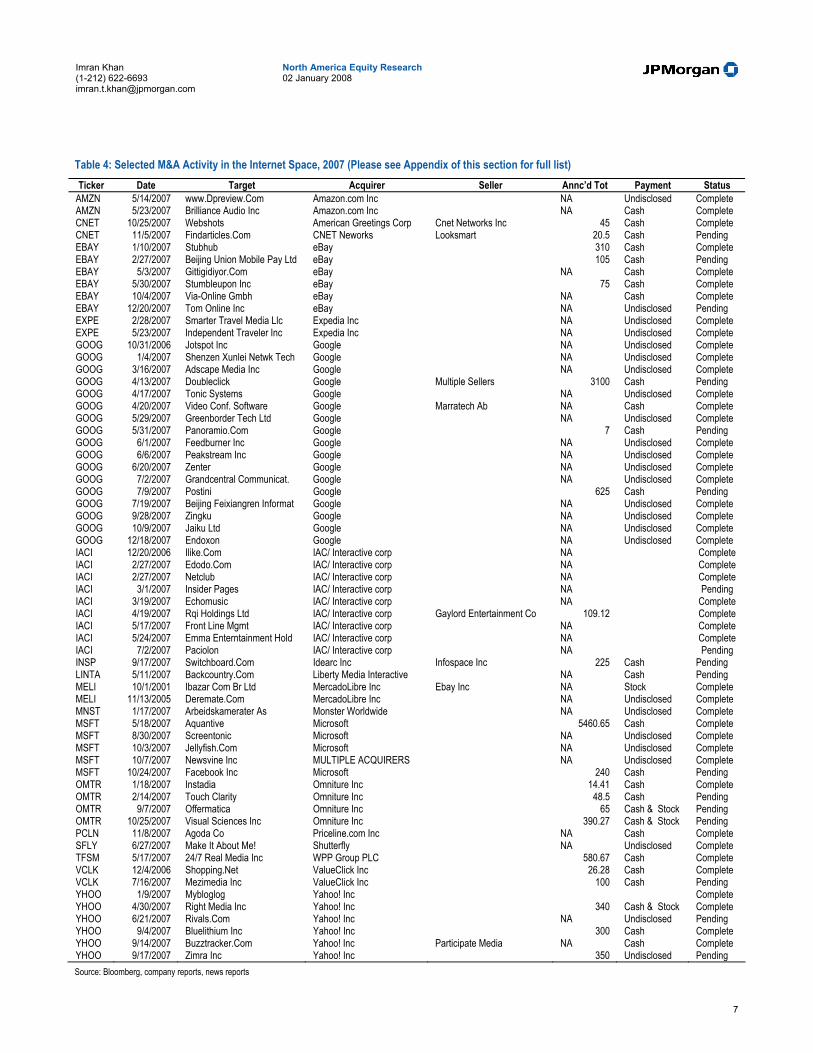
Table 4: Selected M&A Activity in the Internet Space, 2007 (Please see Appendix of this section for full list) Ticker Date Target Acquirer Seller Annc’d Tot Payment Status
AMZN 5/14/2007 www.Dpreview.Com Amazon.com Inc NA Undisclosed Complete AMZN 5/23/2007 Brilliance Audio Inc Amazon.com Inc NA Cash Complete CNET 10/25/2007 Webshots American Greetings Corp Cnet Networks Inc 45 Cash Complete CNET 11/5/2007 Findarticles.Com CNET Neworks Looksmart 20.5 Cash Pending EBAY 1/10/2007 Stubhub eBay 310 Cash Complete EBAY 2/27/2007 Beijing Union Mobile Pay Ltd eBay 105 Cash Pending EBAY 5/3/2007 Gittigidiyor.Com eBay NA Cash Complete EBAY 5/30/2007 Stumbleupon Inc eBay 75 Cash Complete EBAY 10/4/2007 Via-Online Gmbh eBay NA Cash Complete EBAY 12/20/2007 Tom Online Inc eBay NA Undisclosed Pending EXPE 2/28/2007 Smarter Travel Media Llc Expedia Inc NA Undisclosed Complete EXPE 5/23/2007 Independent Traveler Inc Expedia Inc NA Undisclosed Complete GOOG 10/31/2006 Jotspot Inc Google NA Undisclosed Complete GOOG 1/4/2007 Shenzen Xunlei Netwk Tech Google NA Undisclosed Complete GOOG 3/16/2007 Adscape Media Inc Google NA Undisclosed Complete GOOG 4/13/2007 Doubleclick Google Multiple Sellers 3100 Cash Pending GOOG 4/17/2007 Tonic Systems Google NA Undisclosed Complete GOOG 4/20/2007 Video Conf. Software Google Marratech Ab NA Cash Complete GOOG 5/29/2007 Greenborder Tech Ltd Google NA Undisclosed Complete GOOG 5/31/2007 Panoramio.Com Google 7 Cash Pending GOOG 6/1/2007 Feedburner Inc Google NA Undisclosed Complete GOOG 6/6/2007 Peakstream Inc Google NA Undisclosed Complete GOOG 6/20/2007 Zenter Google NA Undisclosed Complete GOOG 7/2/2007 Grandcentral Communicat. Google NA Undisclosed Complete GOOG 7/9/2007 Postini Google 625 Cash Pending GOOG 7/19/2007 Beijing Feixiangren Informat Google NA Undisclosed Complete GOOG 9/28/2007 Zingku Google NA Undisclosed Complete GOOG 10/9/2007 Jaiku Ltd Google NA Undisclosed Complete GOOG 12/18/2007 Endoxon Google NA Undisclosed Complete IACI 12/20/2006 Ilike.Com IAC/ Interactive corp NA Complete IACI 2/27/2007 Edodo.Com IAC/ Interactive corp NA Complete IACI 2/27/2007 Netclub IAC/ Interactive corp NA Complete IACI 3/1/2007 Insider Pages IAC/ Interactive corp NA Pending IACI 3/19/2007 Echomusic IAC/ Interactive corp NA Complete IACI 4/19/2007 Rqi Holdings Ltd IAC/ Interactive corp Gaylord Entertainment Co 109.12 Complete IACI 5/17/2007 Front Line Mgmt IAC/ Interactive corp NA Complete IACI 5/24/2007 Emma Enterntainment Hold IAC/ Interactive corp NA Complete IACI 7/2/2007 Paciolon IAC/ Interactive corp NA Pending INSP 9/17/2007 Switchboard.Com Idearc Inc Infospace Inc 225 Cash Pending LINTA 5/11/2007 Backcountry.Com Liberty Media Interactive NA Cash Pending MELI 10/1/2001 Ibazar Com Br Ltd MercadoLibre Inc Ebay Inc NA Stock Complete MELI 11/13/2005 Deremate.Com MercadoLibre Inc NA Undisclosed Complete MNST 1/17/2007 Arbeidskamerater As Monster Worldwide NA Undisclosed Complete MSFT 5/18/2007 Aquantive Microsoft 5460.65 Cash Complete MSFT 8/30/2007 Screentonic Microsoft NA Undisclosed Complete MSFT 10/3/2007 Jellyfish.Com Microsoft NA Undisclosed Complete MSFT 10/7/2007 Newsvine Inc MULTIPLE ACQUIRERS NA Undisclosed Complete MSFT 10/24/2007 Facebook Inc Microsoft 240 Cash Pending OMTR 1/18/2007 Instadia Omniture Inc 14.41 Cash Complete OMTR 2/14/2007 Touch Clarity Omniture Inc 48.5 Cash Pending OMTR 9/7/2007 Offermatica Omniture Inc 65 Cash & Stock Pending OMTR 10/25/2007 Visual Sciences Inc Omniture Inc 390.27 Cash & Stock Pending PCLN 11/8/2007 Agoda Co Priceline.com Inc NA Cash Complete SFLY 6/27/2007 Make It About Me! Shutterfly NA Undisclosed Complete TFSM 5/17/2007 24/7 Real Media Inc WPP Group PLC 580.67 Cash Complete VCLK 12/4/2006 Shopping.Net ValueClick Inc 26.28 Cash Complete VCLK 7/16/2007 Mezimedia Inc ValueClick Inc 100 Cash Pending YHOO 1/9/2007 Mybloglog Yahoo! Inc Complete YHOO 4/30/2007 Right Media Inc Yahoo! Inc 340 Cash & Stock Complete YHOO 6/21/2007 Rivals.Com Yahoo! Inc NA Undisclosed Pending YHOO 9/4/2007 Bluelithium Inc Yahoo! Inc 300 Cash Complete YHOO 9/14/2007 Buzztracker.Com Yahoo! Inc Participate Media NA Cash Complete YHOO 9/17/2007 Zimra Inc Yahoo! Inc 350 Undisclosed Pending Source: Bloomberg, company reports, news reports

8
North America Equity Research 02 January 2008
Imran Khan (1-212) 622-6693 [email protected]
Worldwide Growth and Economic Prosperity Creating an Ever-Larger Consumer Base JPMorgan estimates that GDP growth has been stronger outside the US than domestically in all but one year since 2000. At the same time, worldwide Internet penetration has been growing rapidly, as well. As such, we believe that, for larger Internet companies, the importance of the US, while remaining high, will continue to fade in relative terms in coming years.
Table 5: JPMorgan’s Global GDP growth projections 2001 2002 2003 2004 2005 2006 2007E 2008E 2009E
World 1.6% 1.9% 2.5% 3.8% 3.2% 3.6% 3.4% 3.0% 3.4% Developed mkts 1.2% 1.3% 1.8% 2.9% 2.4% 2.8% 2.4% 2.1% 2.7% G-7 1.0% 1.2% 1.8% 2.8% 2.3% 2.7% 2.2% 2.1% 2.7% Emerging Econ. 3.0% 4.1% 5.0% 7.0% 6.3% 6.9% 6.9% 6.3% 6.2% Latin America 0.5% 0.1% 1.8% 6.2% 4.3% 5.3% 5.1% 4.5% 4.4% Emerging Asia 5.1% 6.6% 7.2% 7.9% 7.8% 8.4% 8.5% 7.7% 7.6% ex China 2.7% 4.8% 5.1% 6.3% 6.0% 6.5% 6.3% 5.8% 5.9% China 8.3% 9.1% 10.0% 10.1% 10.4% 11.1% 11.4% 10.5% 10.0% Emerging Eur. 1.6% 4.5% 5.7% 6.8% 5.8% 6.4% 6.3% 5.8% 5.7% ex Russia -0.6% 4.4% 4.7% 6.6% 5.5% 6.2% 5.5% 5.1% 5.2% Russia 5.1% 4.7% 7.3% 7.2% 6.4% 6.7% 7.5% 6.8% 6.3% Developed Eur. 1.9% 1.1% 1.1% 2.2% 1.8% 3.0% 2.8% 1.9% 2.4% World ex-US 1.9% 2.0% 2.5% 3.8% 3.2% 4.0% 3.9% 3.2% 3.5% United States 0.7% 1.6% 2.5% 3.6% 3.1% 2.9% 2.2% 2.5% 3.1% Source: JPMorgan Economic and Policy Research We believe the continued global GDP growth is creating an ever-expanding consumer class. Twinned with the trend of rising Internet penetration, we believe an ever-growing market opportunity exists outside the US for Internet companies, especially those with the scale to invest meaningfully in their international operations.
Table 6: Revenue Mix Is Shifting Away from US at Large Ad-driven, eCommerce and Travel Sites % of revenue derived from US
2006 2007E 2008E 2009E Amazon (see note) 54.8% 55.0% 54.7% 54.0% eBay 52.1% 49.3% 47.5% 47.0% Expedia (see note) 74.2% 70.0% 67.1% 64.6% Google 57.0% 52.4% 50.6% 49.4% Priceline 59.4% 44.9% 35.8% 29.8% Yahoo! 75.0% 74.9% 73.5% 68.9% Total (revenue wtd) 59.0% 55.8% 54.0% 52.4% Source: Company reports, JPMorgan estimates Note: For Amazon and Expedia, the percentage given is North America revenue share, rather than US. In this respect, we believe Internet companies are somewhat ahead of the broader market: based on FactSet data we estimate that ~64% of the revenue of S&P 500 companies is derived from US/North American sales.
We see no reason for the shift away from the US to abate in the near future, and as such we believe that the large-cap companies in our coverage universe are likely to retain at least a somewhat firm footing even if the US economy and US consumer experience a slowdown. At the same time, given the significant exposure of these companies to the US, we believe it would be a mistake to think of them as “recession-proof”.
Internet companies are more internationally diversified: we estimate that ~64% of the revenue of S&P 500 companies is derived from US/North American sales, compared to less than 60% for large Internet firms.
9
North America Equity Research 02 January 2008
Imran Khan (1-212) 622-6693 [email protected]
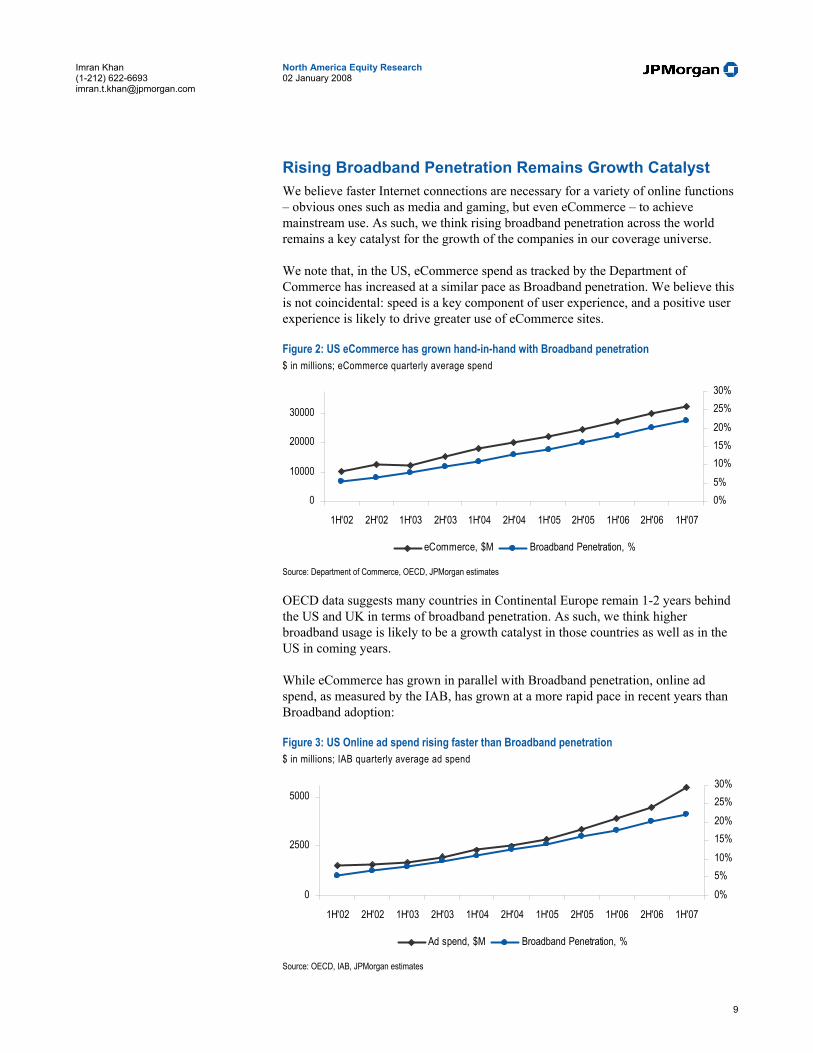
Rising Broadband Penetration Remains Growth Catalyst We believe faster Internet connections are necessary for a variety of online functions – obvious ones such as media and gaming, but even eCommerce – to achieve mainstream use. As such, we think rising broadband penetration across the world remains a key catalyst for the growth of the companies in our coverage universe.
We note that, in the US, eCommerce spend as tracked by the Department of Commerce has increased at a similar pace as Broadband penetration. We believe this is not coincidental: speed is a key component of user experience, and a positive user experience is likely to drive greater use of eCommerce sites.
Figure 2: US eCommerce has grown hand-in-hand with Broadband penetration $ in millions; eCommerce quarterly average spend
0
10000
20000
30000
1H'02 2H'02 1H'03 2H'03 1H'04 2H'04 1H'05 2H'05 1H'06 2H'06 1H'07
0%5%10%15%20%25%30%
eCommerce, $M Broadband Penetration, %
Source: Department of Commerce, OECD, JPMorgan estimates OECD data suggests many countries in Continental Europe remain 1-2 years behind the US and UK in terms of broadband penetration. As such, we think higher broadband usage is likely to be a growth catalyst in those countries as well as in the US in coming years.
While eCommerce has grown in parallel with Broadband penetration, online ad spend, as measured by the IAB, has grown at a more rapid pace in recent years than Broadband adoption:
Figure 3: US Online ad spend rising faster than Broadband penetration $ in millions; IAB quarterly average ad spend
0
2500
5000
1H'02 2H'02 1H'03 2H'03 1H'04 2H'04 1H'05 2H'05 1H'06 2H'06 1H'07
0%5%10%15%20%25%30%
Ad spend, $M Broadband Penetration, %
Source: OECD, IAB, JPMorgan estimates

10
North America Equity Research 02 January 2008
Imran Khan (1-212) 622-6693 [email protected]
We believe the faster rate of growth can be attributed in part to network effects: as more users have access to a faster, more complete Internet experience, a greater number of advertisers find it economical to direct part of their spend online. An additional factor is the ability of richer media ads – which take advantage of higher bandwidth – to command higher CPMs.
Newspaper Ad Spend Declining Advertising spend at US newspapers is continuing to decline: 2007 saw an acceleration of newspaper ad spend declines, and we think this trend is likely to continue as time spent on newspapers declines in favor of time spent online. We expect a continuation of the shift away from newspapers to be a tailwind for Internet advertising in the coming year.
Figure 4: Newspaper Ad Spend Continues to Decline $ in billions
44.9 46.7 47.4 46.642.6
1.9%3.9%
1.5%
-1.7%
-8.6%
35.0
45.0
55.0
2003 2004 2005 2006 2007
-10.0%-8.0%-6.0%-4.0%-2.0%0.0%2.0%4.0%
Source: NAA.org, JPMorgan estimates
Involvement of Regulatory Authorities Likely to Grow As the industry grows and becomes entwined in more and more aspects of people’s lives, we think regulators are going to take more and more notice of Internet companies. Going forward, regulatory risk will likely grow, although we believe it will remain relatively small, compared to other industries.
M&A in question 2007 saw several large mergers take place within the Internet space, most notably Google’s purchase of DoubleClick and Microsoft’s acquisition of aQuantive. While the latter was able to achieve regulatory clearance, European authorities are still (as of mid-December) examining whether the Google – DoubleClick merger will create a player in the online ad industry that is too dominant.
We think such regulatory flare-ups are likely to reoccur. Further, as online advertising continues to take share away from traditional avenues, we expect the incumbent players to pursue a variety of approaches, including lobbying for regulatory/legislative intervention, to attempt to defend their position.
Privacy concerns abound As search companies become larger and ad networks begin to capture more and more data about users, privacy concerns have become more common.

11
North America Equity Research 02 January 2008
Imran Khan (1-212) 622-6693 [email protected]
In response, several companies have made voluntary steps to lower the quantity of personalized data collection they do. For example, Google has said it will anonymize searcher data after 18 months, while Ask has given users the option of erasing their search history immediately.
Social networking sites, which often collect more personal information than do search engines, have also faced attention in regards to their data practices. As we note in the Social Networks Primer, below, we think history indicates that users are willing to sacrifice incremental erosions of their privacy in exchange for features they find useful, especially if sites do not over-reach. Thus far, the desire of users to express themselves has been stronger than the desire to hide, and we think that is likely to continue.
Internet Taxation: Likely Not on the Horizon in US Two key Internet tax issues exist in the US: an Internet access tax and a sales tax. A bill renewing the ban on an Internet access tax for seven years passed the US Congress in October 2007.
As regards sales taxes on online retail sales, JPMorgan’s Senior Vice President for Government Relations, Tom Block, believes that a recently proposed bill, intended to allow states to implement an Internet sales tax under certain conditions, does not have a significant chance of passing in the foreseeable future. While offline retailers and state governors have lobbied for rules such as this, voting for this bill could be construed as a tax increase, and Tom Block thinks that makes passage of the bill a non-starter, especially in an election year.
Internet IPO Market Remains Healthy 2007 saw solid IPO activity in the Internet and online space, with deals in the double digits (please see chart below). We believe the trend is likely to continue in F’08, as an ever-evolving marketplace gives rise to new opportunities.
Table 7: Selected Internet IPOs, F’07 $ in millions except per-share amounts Pricing Date Issuer Name Symbol Amt ($mm) Mkt cap ($mm) % mcap Offering Price Price, 12/7 Performance 06/26/07 Comscore Inc SCOR 101 457 22% 16.50 36.13 119% 10/02/07 Constant Contact CTCT 123 433 28% 16.00 21.69 36% 07/17/07 Dice Holdings Inc DHX 221 805 27% 13.00 10.01 -23% 03/21/07 Glu Mobile Inc GLUU 86 327 26% 11.50 5.33 -54% 11/16/07 Internet Brands Inc INET 48 334 14% 8.00 7.99 0% 06/07/07 Limelight Networks Inc LLNW 276 1,192 23% 15.00 8.01 -47% 08/09/07 MercadoLibre Inc MELI 333 752 44% 18.00 43.77 143% 07/19/07 Orbitz Worldwide Inc OWW 510 1,244 41% 15.00 9.87 -34% 07/25/07 Perfect World Co Ltd PWRD 217 894 24% 16.00 31.53 97% 02/15/07 Salary.com Inc SLRY 69 158 44% 10.50 13.27 26% 05/16/07 TechTarget Inc TTGT 115 508 23% 13.00 13.66 5% 02/08/07 U.S. Auto Parts Network Inc PRTS 115 298 39% 10.00 8.59 -14% 03/08/07 Xinhua Finance Media Ltd XFML 300 883 34% 13.00 6.80 -48% Source: Company reports, FactSet, JPMorgan estimates
We see the Internet landscape continuing to undergo changes in F’08. We expect several types of companies to start achieving a level of scale and operational visibility where a public offering makes sense. Particularly, we think the growing maturity of sectors of the Internet previously thought to be not yet mature, such as social networks, will spur deal activity.

12
North America Equity Research 02 January 2008
Imran Khan (1-212) 622-6693 [email protected]
We Think 2008 Could Bring Greater Profitability In 2006, 12 of the Internet companies in our coverage universe saw EBITDA margins decline, and nine had increases. In F’07, the numbers were reversed, with 12 risers and nine decliners. We think, as some of the companies in our universe reach greater maturity, profitability becomes a higher priority than growth, and more achievable, and are forecasting rising EBITDA margins at 16 of these companies in F’08.
At the same time, we do not believe that, given the scale of these firms, the leverage that can be achieved in the short term is significant: of the 16 companies whose margins we expect to improve, we are modeling greater than 100 bps EBITDA margin improvement at only eight.
Finally, we would note that, should an economic downturn in F’08 be more severe than currently expected, it is possible that our projected margin levels could see pressure.
Table 8: Change in EBITDA margins for the JPMorgan Internet Coverage Universe 2006 2007E 2008E EBITDA mgn Y/Y change EBITDA mgn Y/Y change EBITDA mgn Y/Y change
AMZN 6.6% -1.0% 7.5% 1.0% 8.2% 0.7% CNET 20.8% 1.5% 19.9% -0.8% 22.1% 2.2% DHX 35.0% -0.4% 41.4% 6.4% 41.5% 0.2% EBAY 34.4% -6.3% 33.1% -1.3% 33.3% 0.1% EXPE 27.3% -3.2% 27.4% 0.2% 26.9% -0.6% GOOG 63.2% -2.0% 59.4% -3.8% 58.5% -0.9% IACI 15.2% 0.7% 13.6% -1.6% 13.9% 0.2% INSP -7.5% -28.3% -3.9% 3.6% -11.2% -7.3% INWK 9.0% 2.4% 9.3% 0.3% 9.7% 0.4% LINTA 36.3% 3.0% 35.2% -1.1% 34.8% -0.4% MELI 14.2% 5.8% 28.3% 14.1% 32.1% 3.8% MNST 25.1% 2.1% 22.3% -2.8% 29.0% 6.7% MOVE 8.4% 6.3% 9.8% 1.4% 13.0% 3.2% NILE 8.9% -0.8% 9.5% 0.5% 9.3% -0.1% OMTR 10.1% 24.1% 16.0% 5.9% 17.5% 1.6% OWW -8.3% -8.3% 11.6% 19.9% 16.8% 5.2% PCLN 9.5% 2.3% 11.5% 2.0% 17.3% 5.8% SFLY 16.8% -0.8% 17.4% 0.6% 17.8% 0.5% SOLD 8.3% -19.5% 5.7% -2.6% 15.1% 9.4% VCLK 26.6% -1.8% 25.6% -0.9% 25.8% 0.2% YHOO 41.8% -0.3% 37.4% -4.4% 38.1% 0.7% Source: Company reports, JPMorgan estimates

13
North America Equity Research 02 January 2008
Imran Khan (1-212) 622-6693 [email protected]
Dot.Khan’s Top Ten for 2008 1. CPM growth rate will accelerate
2. M&A market will remain robust
3. Audience Fragmentation: Will the Ad Network strategy work?
4. Domestic eCommerce growth will slow: Can Amazon continue to deliver above-market growth?
5. Can Jerry Yang turn Yahoo! around?
6. Mobile ads will be like video ads: A whole lot of talk, not a whole lot of $
7. Booking fees are not going away: consider that USAirways just introduced fees
8. Economic slowdown may impact profitability somewhat, but we expect margins to stabilize
9. Internet will continue to cannibalize Newspaper ad spend, which declined ~8% in F’07
10. Battle of Facebook vs. MySpace: both will thrive, but we think Facebook will do better

U.S. Sector O
utlooks

17
North America Equity Research 02 January 2008
Imran Khan (1-212) 622-6693 [email protected]
2008 Search Advertising Outlook Given a very strong 2007 performance, we are increasing our outlook for the global paid search market heading into 2008. We now believe global paid search revenues will reach $30.5B in 2008, up from our prior estimate of $26.2B. We believe that 2008 paid search growth will be driven by:
• International growth due to continued adoption of paid search as a marketing vehicle
• Keyword price inflation due to increased volume in advertisements
• Volume growth driven by increases in web usage
• CTR improvement driven by improvements in relevancy
Within search, we continue to believe that Google will take volume market share from competitors as we have greater faith in the company’s ability to execute relevancy enhancements and technological improvements and in its superior brand. However, we believe that on a dollar market share basis, Yahoo! will grow its share over Google due to the improved monetization from the global rollout of Project Panama.
We estimate that Google has a 73% dollar market share currently (including revenues from AOL, Ask, and other affiliates). We believe that this may decline to 71% by the end of 2008 as AOL and Ask have renegotiated their TAC rates and Yahoo! has improved its monetization. While Internet and broadband usage appears to be flattening out in developed countries, we believe that advertiser adoption of this well-targeted marketing vehicle is in its infancy and that there is still much room for monetization and click-through rate improvements.
Lessons Learned from 2007 In our “Nothing but Net" preview and outlook for 2007, we stated that we preferred paid search to other Internet sub-sectors such as e-commerce, travel, and graphical advertising. Looking back on the year, paid search actually exceeded our expectations. Entering 2007, we expected the paid search market to grow 39% over 2006 (29% in the US and 52% internationally). However, due to better monetization by Google, Yahoo!, and MSN, as well as volume gains, we now expect global paid search revenues to grow 48% in 2007 (37% in the US and 64% internationally). We were surprised by how robust search volume growth was during F'07. At the beginning of the year we thought that much of F’07’s US search market growth would come from increases in coverage and were modeling a 190 bp improvement in coverage vs. 18% Y/Y growth in search volume. We now think that F’07 US coverage will only improve 70 bps vs 25% growth in volume. We are encouraged by this trend as it demonstrates that the market is less mature than we thought and that search companies have not had to resort to increasing the number of ads on a page.
Global Search Overview: Global Search Expected to Grow 39% in F’08 We believe 2008 will be another strong year for global paid search. On the back of 48.3% growth in 2007, we forecast that global paid search revenues will grow 38.7%
Yahoo! will grow its share over Google due to the improved monetization from the global rollout of Project Panama.
18
North America Equity Research 02 January 2008
Imran Khan (1-212) 622-6693 [email protected]
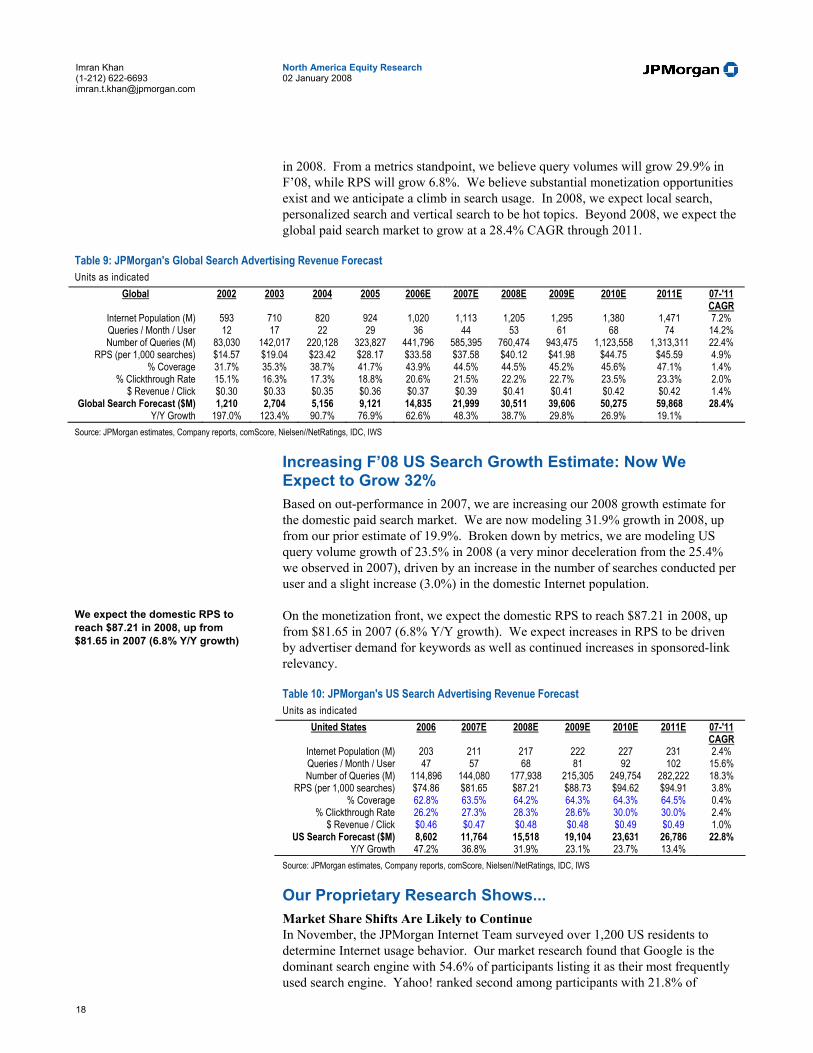
in 2008. From a metrics standpoint, we believe query volumes will grow 29.9% in F’08, while RPS will grow 6.8%. We believe substantial monetization opportunities exist and we anticipate a climb in search usage. In 2008, we expect local search, personalized search and vertical search to be hot topics. Beyond 2008, we expect the global paid search market to grow at a 28.4% CAGR through 2011.
Table 9: JPMorgan's Global Search Advertising Revenue Forecast Units as indicated
Global 2002 2003 2004 2005 2006E 2007E 2008E 2009E 2010E 2011E 07-'11 CAGR
Internet Population (M) 593 710 820 924 1,020 1,113 1,205 1,295 1,380 1,471 7.2% Queries / Month / User 12 17 22 29 36 44 53 61 68 74 14.2% Number of Queries (M) 83,030 142,017 220,128 323,827 441,796 585,395 760,474 943,475 1,123,558 1,313,311 22.4%
RPS (per 1,000 searches) $14.57 $19.04 $23.42 $28.17 $33.58 $37.58 $40.12 $41.98 $44.75 $45.59 4.9% % Coverage 31.7% 35.3% 38.7% 41.7% 43.9% 44.5% 44.5% 45.2% 45.6% 47.1% 1.4%
% Clickthrough Rate 15.1% 16.3% 17.3% 18.8% 20.6% 21.5% 22.2% 22.7% 23.5% 23.3% 2.0% $ Revenue / Click $0.30 $0.33 $0.35 $0.36 $0.37 $0.39 $0.41 $0.41 $0.42 $0.42 1.4%
Global Search Forecast ($M) 1,210 2,704 5,156 9,121 14,835 21,999 30,511 39,606 50,275 59,868 28.4% Y/Y Growth 197.0% 123.4% 90.7% 76.9% 62.6% 48.3% 38.7% 29.8% 26.9% 19.1%
Source: JPMorgan estimates, Company reports, comScore, Nielsen//NetRatings, IDC, IWS
Increasing F’08 US Search Growth Estimate: Now We Expect to Grow 32% Based on out-performance in 2007, we are increasing our 2008 growth estimate for the domestic paid search market. We are now modeling 31.9% growth in 2008, up from our prior estimate of 19.9%. Broken down by metrics, we are modeling US query volume growth of 23.5% in 2008 (a very minor deceleration from the 25.4% we observed in 2007), driven by an increase in the number of searches conducted per user and a slight increase (3.0%) in the domestic Internet population.
On the monetization front, we expect the domestic RPS to reach $87.21 in 2008, up from $81.65 in 2007 (6.8% Y/Y growth). We expect increases in RPS to be driven by advertiser demand for keywords as well as continued increases in sponsored-link relevancy.
Table 10: JPMorgan's US Search Advertising Revenue Forecast Units as indicated
United States 2006 2007E 2008E 2009E 2010E 2011E 07-'11 CAGR
Internet Population (M) 203 211 217 222 227 231 2.4% Queries / Month / User 47 57 68 81 92 102 15.6% Number of Queries (M) 114,896 144,080 177,938 215,305 249,754 282,222 18.3%
RPS (per 1,000 searches) $74.86 $81.65 $87.21 $88.73 $94.62 $94.91 3.8% % Coverage 62.8% 63.5% 64.2% 64.3% 64.3% 64.5% 0.4%
% Clickthrough Rate 26.2% 27.3% 28.3% 28.6% 30.0% 30.0% 2.4% $ Revenue / Click $0.46 $0.47 $0.48 $0.48 $0.49 $0.49 1.0%
US Search Forecast ($M) 8,602 11,764 15,518 19,104 23,631 26,786 22.8% Y/Y Growth 47.2% 36.8% 31.9% 23.1% 23.7% 13.4%
Source: JPMorgan estimates, Company reports, comScore, Nielsen//NetRatings, IDC, IWS
Our Proprietary Research Shows... Market Share Shifts Are Likely to Continue In November, the JPMorgan Internet Team surveyed over 1,200 US residents to determine Internet usage behavior. Our market research found that Google is the dominant search engine with 54.6% of participants listing it as their most frequently used search engine. Yahoo! ranked second among participants with 21.8% of
We expect the domestic RPS to reach $87.21 in 2008, up from $81.65 in 2007 (6.8% Y/Y growth)

19
North America Equity Research 02 January 2008
Imran Khan (1-212) 622-6693 [email protected]
participants using it most frequently. MSN and AOL trailed with 8.6% and 7.2% of participants using them most frequently, respectively.
Figure 5: Most Frequently Used Search Engine % of participants
Google54%
MSN9%
Yahoo!22%
Other3%
AOL7%
Don't use/Don't know2% Ask
3%
Source: JPMorgan research However, we note that while Google was the overwhelming favorite among participants, 38.5% of respondents use search engines other than their favorite at least 30% of the time. Thus, it appears that respondents are willing to try different search engines for better results.
Surprisingly, older participants were more likely to try different brand search engines than younger participants. 44% of participants older than 42 used a search engine other than their favorite more than 30% of the time vs. only 32% of participants in the 18-41 age category. This difference was statistically significant (t=-4.37, p<.05).
62% of Respondents Would Be Willing to Consider Switching Search Engines When asked what improvements by other search engines would cause you to switch from your preferred brand, only 38% of respondents stated that nothing would cause them to switch as they were satisfied with their current search engine. The most frequently selected improvement was results that better matched the search term, with 43% of respondents stating that this would cause them to switch search engines. Other factors that would cause respondents to consider switching search engines were the user-friendliness of the site (28% of participants) and search engine speed (28% of participants).
Table 11: Factors that Would Cause Search Engine Switching % of Respondents
Results that better match search term 42.9% Results that include video, music, and other forms of information 14.2% A more uncluttered easy to navigate site 27.8% Ability to preview web content 22.5% Faster response speed to searches 27.5% Other 1.7% Nothing, happy with current search engine 37.6% Source: JPMorgan research
44% of participants older than 42 used a search engine other than their favorite more than 30% of the time vs. only 32% of participants in the 18-41 age category.
20
North America Equity Research 02 January 2008
Imran Khan (1-212) 622-6693 [email protected]
What would make participants try a different search engine? Friend and family recommendations held the most weight, with 33.8% of respondents stating this as a driver to try a new search engine. 21.7% of respondents stated that the recommendation of a tech expert would influence them to try a new engine. Trailing in the rankings of persuasiveness were TV ads (11.3% of respondents), billboards (4.1% of respondents), newspapers and magazines (7.7% of respondents), and radio (3.5% of respondents).
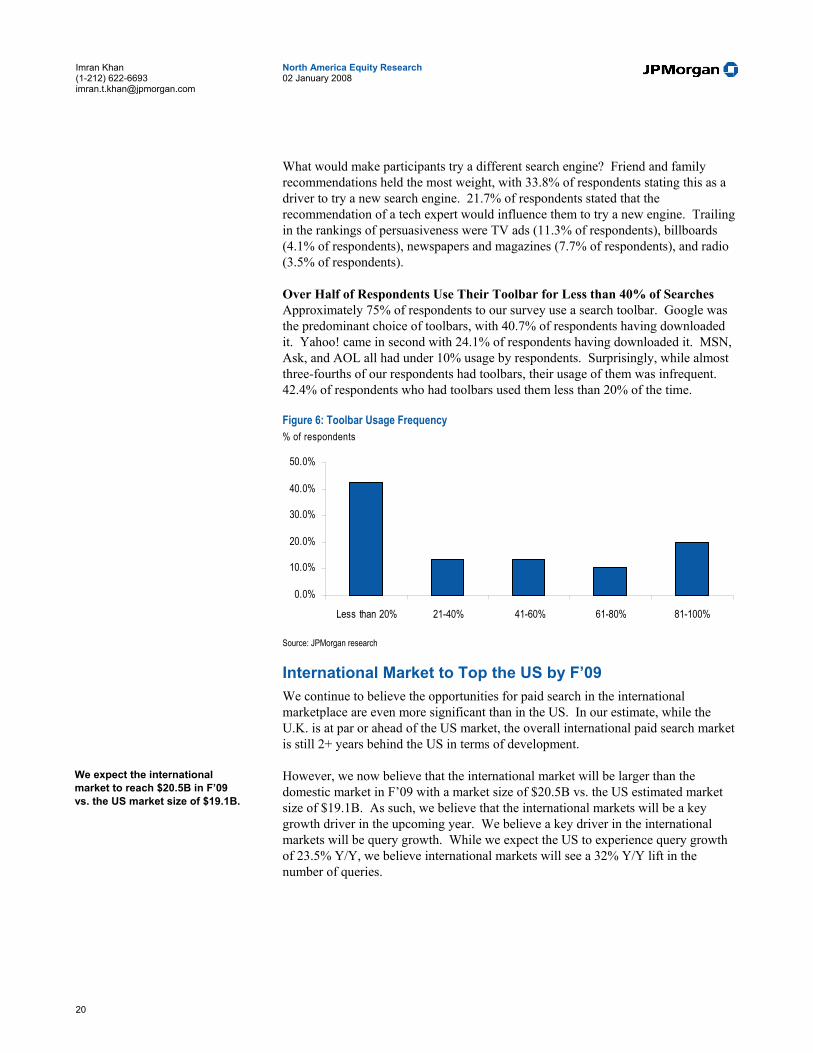
Over Half of Respondents Use Their Toolbar for Less than 40% of Searches Approximately 75% of respondents to our survey use a search toolbar. Google was the predominant choice of toolbars, with 40.7% of respondents having downloaded it. Yahoo! came in second with 24.1% of respondents having downloaded it. MSN, Ask, and AOL all had under 10% usage by respondents. Surprisingly, while almost three-fourths of our respondents had toolbars, their usage of them was infrequent. 42.4% of respondents who had toolbars used them less than 20% of the time.
Figure 6: Toolbar Usage Frequency % of respondents
0.0%
10.0%
20.0%
30.0%
40.0%
50.0%
Less than 20% 21-40% 41-60% 61-80% 81-100%
Source: JPMorgan research
International Market to Top the US by F’09 We continue to believe the opportunities for paid search in the international marketplace are even more significant than in the US. In our estimate, while the U.K. is at par or ahead of the US market, the overall international paid search market is still 2+ years behind the US in terms of development.
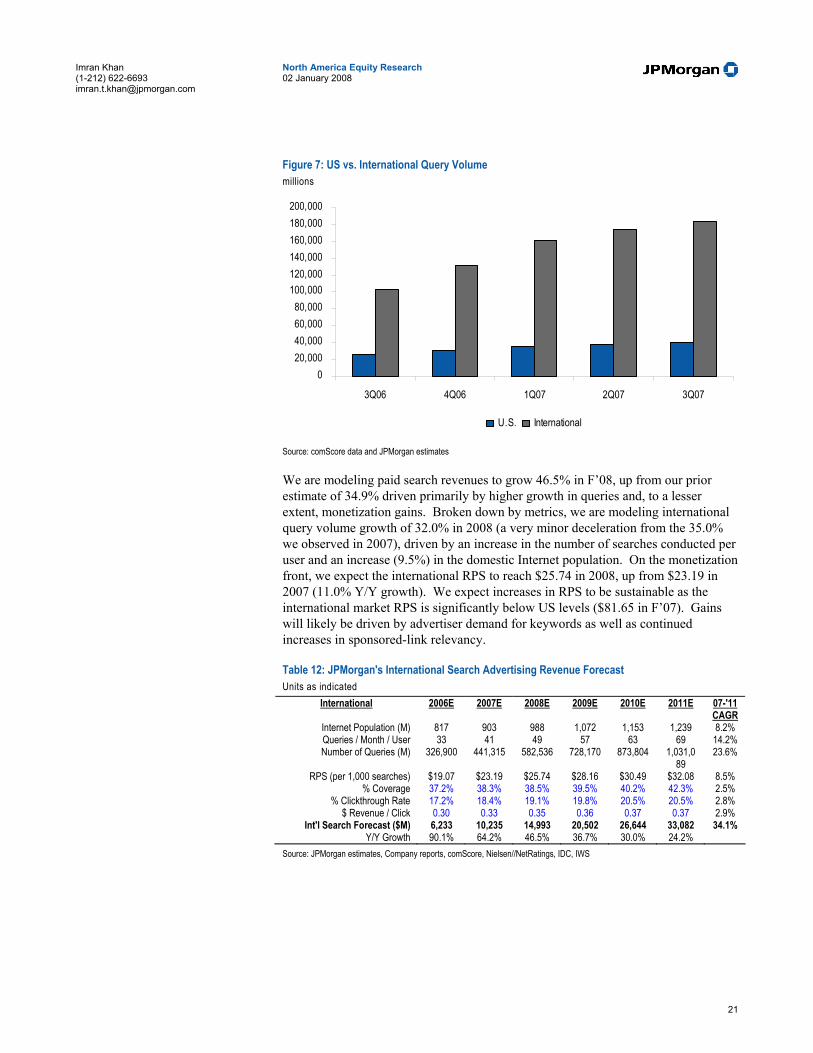
However, we now believe that the international market will be larger than the domestic market in F’09 with a market size of $20.5B vs. the US estimated market size of $19.1B. As such, we believe that the international markets will be a key growth driver in the upcoming year. We believe a key driver in the international markets will be query growth. While we expect the US to experience query growth of 23.5% Y/Y, we believe international markets will see a 32% Y/Y lift in the number of queries.
We expect the international market to reach $20.5B in F’09 vs. the US market size of $19.1B.
21
North America Equity Research 02 January 2008
Imran Khan (1-212) 622-6693 [email protected]
Figure 7: US vs. International Query Volume millions
020,00040,00060,00080,000
100,000120,000140,000160,000180,000200,000
3Q06 4Q06 1Q07 2Q07 3Q07
U.S. International
Source: comScore data and JPMorgan estimates We are modeling paid search revenues to grow 46.5% in F’08, up from our prior estimate of 34.9% driven primarily by higher growth in queries and, to a lesser extent, monetization gains. Broken down by metrics, we are modeling international query volume growth of 32.0% in 2008 (a very minor deceleration from the 35.0% we observed in 2007), driven by an increase in the number of searches conducted per user and an increase (9.5%) in the domestic Internet population. On the monetization front, we expect the international RPS to reach $25.74 in 2008, up from $23.19 in 2007 (11.0% Y/Y growth). We expect increases in RPS to be sustainable as the international market RPS is significantly below US levels ($81.65 in F’07). Gains will likely be driven by advertiser demand for keywords as well as continued increases in sponsored-link relevancy.
Table 12: JPMorgan's International Search Advertising Revenue Forecast Units as indicated
International 2006E 2007E 2008E 2009E 2010E 2011E 07-'11 CAGR
Internet Population (M) 817 903 988 1,072 1,153 1,239 8.2% Queries / Month / User 33 41 49 57 63 69 14.2% Number of Queries (M) 326,900 441,315 582,536 728,170 873,804 1,031,0
89 23.6%
RPS (per 1,000 searches) $19.07 $23.19 $25.74 $28.16 $30.49 $32.08 8.5% % Coverage 37.2% 38.3% 38.5% 39.5% 40.2% 42.3% 2.5%
% Clickthrough Rate 17.2% 18.4% 19.1% 19.8% 20.5% 20.5% 2.8% $ Revenue / Click 0.30 0.33 0.35 0.36 0.37 0.37 2.9%
Int'l Search Forecast ($M) 6,233 10,235 14,993 20,502 26,644 33,082 34.1% Y/Y Growth 90.1% 64.2% 46.5% 36.7% 30.0% 24.2%
Source: JPMorgan estimates, Company reports, comScore, Nielsen//NetRatings, IDC, IWS

22
North America Equity Research 02 January 2008
Imran Khan (1-212) 622-6693 [email protected]
2008 Graphical Advertising Outlook After a difficult 2007 where CPMs were pressured from a non-premium inventory glut, we believe that 2008 will see stronger graphical advertising growth. Specifically, we think that 2008 growth will be driven by:
• Easier comps as growth will be computed off of this year’s depressed CPMs
• Improving CPMs as companies employ targeting techniques and use ad exchanges
• Improving RPMs due to higher sell-through and increased ads per page
• Increased advertiser interest due to the increased TV ad demand due to political campaigns
• Increased page views from rising broadband usage and social networking
As a result, we are slightly increasing our F’08 graphical advertising global growth estimate to 22.1% from 20.6% to reflect better monetization (CPMs) through the use of targeting and exchanges and expected growth from social networking sites and blogs. We favor web publishers who are organically growing their page views at a rapid pace and who have targeting capabilities.
Lessons Learned from 2007 In our “Nothing but Net” preview and outlook for 2007, we expressed our view that the US graphical advertising market was poised to grow 20% in 2007. Now that the year is almost complete, we have revised our F’07 US growth estimate to 23.4%. We believe that we correctly recognized the audience fragmentation trend due to the rise of social networking and blog usage. We also forecasted the resulting depressed CPMs from the glut of non-premium inventory. However, we did overestimate the impact of video advertising. We thought that the increase in video inventory, coupled with lower CPMs, would cause many graphical advertisers to shift their advertising budgets toward video and away from more traditional graphical advertising. We now recognize that reaching revenue sharing agreements and developing unobtrusive video ads accepted by viewers will be a longer process than we first thought.
Global Graphical Advertising Overview: Expect to Grow 22.1% in F’08 We believe that 2008 will be a strong year for graphical advertising publishers, particularly those with targeting capabilities. On the back of expected 23.4% growth in 2007, we believe global graphical advertising revenues will grow 22.1% in F’08. From a metrics standpoint, we believe page views and RPMs will grow 11.1% and 9.9% in 2008, respectively. We expect the global Internet population to expand 8.3% to 1.2B in 2008 and web usage to expand by 2.7% per Internet user. We believe RPM growth will be driven by (1) improving CPMs as companies employ targeting techniques and use ad exchanges, (2) increased sell-through rates, and (3) increased ads per page. We expect the global graphical advertising market to grow at a 17.6% CAGR from 2007 through 2011.

23
North America Equity Research 02 January 2008
Imran Khan (1-212) 622-6693 [email protected]
Table 13: JPMorgan's Global Graphical Advertising Revenue Forecast Units as indicated
Global 2002 2003 2004 2005 2006E 2007E 2008E 2009E 2010E 2011E 07-'11 CAGR
Internet Population (M) 593 710 820 924 1,020 1,113 1,205 1,295 1,380 1,471 7.2% Pages Viewed / User / Day 33 34 36 37 38 39 40 41 43 44 2.7%
Total Pages Viewed (B) 7,209 8,897 10,724 12,607 14,275 15,986 17,768 19,563 21,469 23,487 10.1% RPM (per 1,000 pages) $1.02 $0.75 $0.81 $0.87 $0.97 $1.07 $1.17 $1.26 $1.33 $1.39 6.8%
Global Graphical Forecast ($M) 7,354 6,674 8,642 10,984 13,829 17,068 20,846 24,561 28,573 32,685 17.6% Y/Y Growth -19.6% -9.2% 29.5% 27.1% 25.9% 23.4% 22.1% 17.8% 16.3% 14.4%
Source: JPMorgan estimates, Company reports, comScore, Nielsen//NetRatings, IDC, IWS, IAB
We Think that US CPMs Will Rise in 2008 We expect the US graphical advertising market to grow 19.9% in 2008, slightly below our estimate from a year ago. We believe that page view growth will slow to 6.5% in 2008 (down from 8.0% in 2007) as social networking sites and blogs begin to mature and reach saturated penetration levels. In our estimate, page view growth will be driven by an increase of 3.0% in Internet users and an increase of 3.4% in usage per Internet user. We are modeling RPMs to grow 12.6% in 2008, driven by an 8.3% increase in the number of ad impressions per page view and a 3.9% increase in CPMs. We expect the US graphical advertising market to grow at a 14.2% CAGR from 2007 through 2011.
Table 14: JPMorgan's US Graphical Advertising Revenue Forecast Units as indicated United States 2006 2007E 2008E 2009E 2010E 2011E 07-'11
CAGR Internet Population (M) 203 211 217 222 227 231 2.4% Pages Viewed / User / Day 45 47 49 50 52 53 3.3% Total Pages Viewed (B) 3,341 3,608 3,843 4,093 4,297 4,512 5.7% Impressions / Page 0.50 0.60 0.65 0.68 0.70 0.70 3.9% Total Impressions (B) 1,671 2,165 2,498 2,783 2,987 3,158 9.9% CPM (per 1,000 impressions) $3.50 $3.31 $3.44 $3.60 $3.76 $3.86 3.9% RPM (per 1,000 pages) $1.75 $1.99 $2.24 $2.45 $2.61 $2.70 8.0% US Graphical Forecast ($M) 5,847 7,166 8,593 10,019 11,230 12,192 14.2% Y/Y Growth 23.0% 22.6% 19.9% 16.6% 12.1% 8.6% Source: JPMorgan estimates, Company reports, comScore, Nielsen//NetRatings, IDC, IWS, IAB
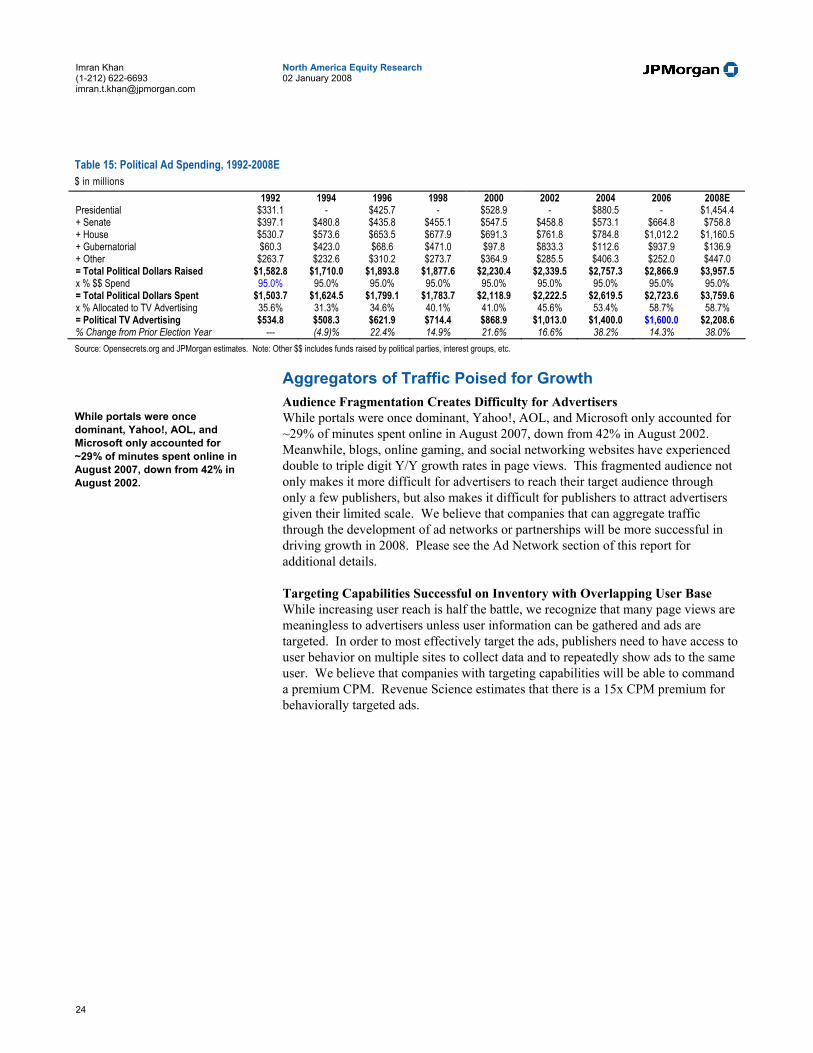
Political Advertising Likely to Drive Up Scatter Inventory We estimate that political ad spend on TV will total approximately $2.2B in the 2008 political cycle, up about 38% from 2006 levels. We estimate that presidential TV ad spending alone should total over $600M in the 2008 election cycle. Since 1982, political advertising revenues have contributed about 34% of spot TV ad growth in even-numbered years.
Given the fixed quantity of available TV inventory and our expectation that political ads may account for 6% of 2008 spot TV ads, we think that it is likely that some advertisers will shift their ad spend to online display advertising.
Political advertising revenues have contributed about 34% of spot TV ad growth in even-numbered years.
24
North America Equity Research 02 January 2008
Imran Khan (1-212) 622-6693 [email protected]
Table 15: Political Ad Spending, 1992-2008E $ in millions 1992 1994 1996 1998 2000 2002 2004 2006 2008E Presidential $331.1 - $425.7 - $528.9 - $880.5 - $1,454.4 + Senate $397.1 $480.8 $435.8 $455.1 $547.5 $458.8 $573.1 $664.8 $758.8 + House $530.7 $573.6 $653.5 $677.9 $691.3 $761.8 $784.8 $1,012.2 $1,160.5 + Gubernatorial $60.3 $423.0 $68.6 $471.0 $97.8 $833.3 $112.6 $937.9 $136.9 + Other $263.7 $232.6 $310.2 $273.7 $364.9 $285.5 $406.3 $252.0 $447.0 = Total Political Dollars Raised $1,582.8 $1,710.0 $1,893.8 $1,877.6 $2,230.4 $2,339.5 $2,757.3 $2,866.9 $3,957.5 x % $$ Spend 95.0% 95.0% 95.0% 95.0% 95.0% 95.0% 95.0% 95.0% 95.0% = Total Political Dollars Spent $1,503.7 $1,624.5 $1,799.1 $1,783.7 $2,118.9 $2,222.5 $2,619.5 $2,723.6 $3,759.6 x % Allocated to TV Advertising 35.6% 31.3% 34.6% 40.1% 41.0% 45.6% 53.4% 58.7% 58.7% = Political TV Advertising $534.8 $508.3 $621.9 $714.4 $868.9 $1,013.0 $1,400.0 $1,600.0 $2,208.6 % Change from Prior Election Year --- (4.9)% 22.4% 14.9% 21.6% 16.6% 38.2% 14.3% 38.0% Source: Opensecrets.org and JPMorgan estimates. Note: Other $$ includes funds raised by political parties, interest groups, etc.
Aggregators of Traffic Poised for Growth Audience Fragmentation Creates Difficulty for Advertisers While portals were once dominant, Yahoo!, AOL, and Microsoft only accounted for ~29% of minutes spent online in August 2007, down from 42% in August 2002. Meanwhile, blogs, online gaming, and social networking websites have experienced double to triple digit Y/Y growth rates in page views. This fragmented audience not only makes it more difficult for advertisers to reach their target audience through only a few publishers, but also makes it difficult for publishers to attract advertisers given their limited scale. We believe that companies that can aggregate traffic through the development of ad networks or partnerships will be more successful in driving growth in 2008. Please see the Ad Network section of this report for additional details.
Targeting Capabilities Successful on Inventory with Overlapping User Base While increasing user reach is half the battle, we recognize that many page views are meaningless to advertisers unless user information can be gathered and ads are targeted. In order to most effectively target the ads, publishers need to have access to user behavior on multiple sites to collect data and to repeatedly show ads to the same user. We believe that companies with targeting capabilities will be able to command a premium CPM. Revenue Science estimates that there is a 15x CPM premium for behaviorally targeted ads.
While portals were once dominant, Yahoo!, AOL, and Microsoft only accounted for ~29% of minutes spent online in August 2007, down from 42% in August 2002.

25
North America Equity Research 02 January 2008
Imran Khan (1-212) 622-6693 [email protected]
Figure 8: Behavioral Targeting Effects on CPM
0
200
400
600
800
1000
1200
1400
1600
1 2 3 4 5 6 7 8 9
Web impressions Percent
Aver
age C
PM D
ollar
s
80
70
12
10
8
6
4
2
020 40 60 80
Tier 3< $1
Tier 2$1-10
Tier 1$10+
Revenue Science Targeting~$10.00 - 12.00
Exchange modelpotential benefits~$0.75 - 1.50
Traditional optimizedad network$0.50 - 1.00
Source: Revenue Science Presentation
International Growth Is Still a Big Theme International markets continue to benefit from increased broadband penetration and increased ad spend moving online. Even in markets where broadband is approaching saturation, such as in the UK, display ad prices are likely to rise as more advertisers compete for a more limited quantity of inventory. We estimate that international display advertising will grow at 23.8% in 2008 and at a 19.9% 2007-2011 CAGR.
Table 16: JPMorgan's International Graphical Advertising Revenue Forecast Units as indicated International 2006E 2007E 2008E 2009E 2010E 2011E 07-'11
CAGR Internet Population (M) 817 903 988 1,072 1,153 1,239 8.2% Pages Viewed / User / Day 37 38 39 40 41 42 2.8% Total Pages Viewed (B) 10,934 12,378 13,925 15,470 17,172 18,975 11.3% RPM (per 1,000 pages) $0.73 $0.80 $0.88 $0.94 $1.01 $1.08 7.8% Int'l Graphical Forecast ($M) 7,982 9,902 12,254 14,542 17,344 20,493 19.9% Y/Y Growth 28.1% 24.1% 23.8% 18.7% 19.3% 18.2% Source: JPMorgan estimates, Company reports, comScore, Nielsen//NetRatings, IDC, IWS, IAB
We estimate that international display advertising will grow at 23.8% in 2008 and at a 19.9% 2007-2011 CAGR.

26
North America Equity Research 02 January 2008
Imran Khan (1-212) 622-6693 [email protected]
Ad Networks on the Rise What Are Ad Networks? We see ad networks defined by the following:
transacts, serves, tracks and reports the distribution of advertiser ads to publisher pages.
enables marketers to advertise on multiple publisher sites through one central location
publishers enjoy the benefit of advertising revenue without investing in a sales force or as a source to sell remnant inventory
varies in the ability to target a specific audience and in methods of payment (CPM, CPC, and CPA)
revenues are determined by revenue share agreements
The definition of ad networks is fuzzy with lead generation sometimes included. However, we are differentiating between the ad network and lead generation space. We are defining lead generation as much more targeted and deep into specific verticals. As a result, we believe that this commands much higher CPM's, in the $100-$150 range. While we believe that this is also an interesting ad model, we believe it deserves a more detailed consideration and will thus save it for a later note.
A Significant Market Opportunity We estimate that the global graphical advertising market as a whole will grow over 22% through 2008. The sector should benefit from 1) increased online viewership as more people turn to the Internet as a source of content and 2) increased RPMs as audience targeting improves.
Additionally, increasing keyword prices and the ability of networks to provide response advertising in addition to branding campaigns will likely drive more marketers to ad networks. On the publisher side, as the long tail of information is increasing, more publishers are looking to monetize their content. We estimate that the top 20 ad networks will earn approximately $2B+ in revenue in 2007 (~14% of the display ad market) and are growing much faster than the general graphical advertising industry. We estimate ad networks to contribute ~17% of the total display ad market in 2010 (25% F’08-F’10 CAGR).
Lead generation is more vertical specific and performance oriented than ad networks
Int'l Ad Network penetration is so small that it is not yet tracked by ComScore. We expect that it is ~3-5 yrs developmentally behind the US and will be a significant future growth driver.

27
North America Equity Research 02 January 2008
Imran Khan (1-212) 622-6693 [email protected]
Figure 9: Global Ad Network Market Forecast $ in millions
0
1000
2000
3000
4000
5000
6000
2005 2006 2007E 2008E 2009E 2010E
Source: ComScore data, Company reports, and JPMorgan estimates Table 17: Ad Networks by Page Views millions
August Page Views (M) August Y/Y Growth Advertising.com 72,598.6 56% AdBrite 28,529.9 901% Traffic Marketplace 25,629.0 321% ValueClick 22,732.2 64% 24/7 Real Media 13,532.5 104% Tribal Fusion 10,829.5 -4% CPX Interactive 9,764.1 N/A Casale Media Network 9,575.9 -59% Blue Lithium 5,450.2 211% Specific Media 5,407.0 N/A Vibrant Media 5,096.6 168% ContextWeb 5,065.6 122% PrecisionClick 4,497.8 -52% Burst Media 3,746.3 26% DRIVEpm 2,993.1 140% Interclick 1,992.1 N/A Kontera 1,894.7 N/A adconion media group 943.6 N/A AdDynamix.com 918.3 264% Undertone Networks 441.2 734% Indieclick 175.8 N/A Rydium Network 27.3 -52% Total 231,841.3 77% Source: ComScore and JPMorgan estimates
The Future of Ad Networks The ad network space is becoming increasingly competitive as new ventures are launched and as Google, Yahoo!, AOL, and Microsoft enter the space through acquisitions. We believe that differentiation will be key to success. Following are capabilities that we see important to market leadership.
Behavioral Targeting We believe that advertisers used to pay for audiences on websites but will now start to pay for specific users. Marketers appear to value targeted advertising as evidenced by Google’s well targeted search ads generating RPQs of more than double Yahoo!'s.
Behavioral targeting will increase CPMs and drive volume.
28
North America Equity Research 02 January 2008
Imran Khan (1-212) 622-6693 [email protected]
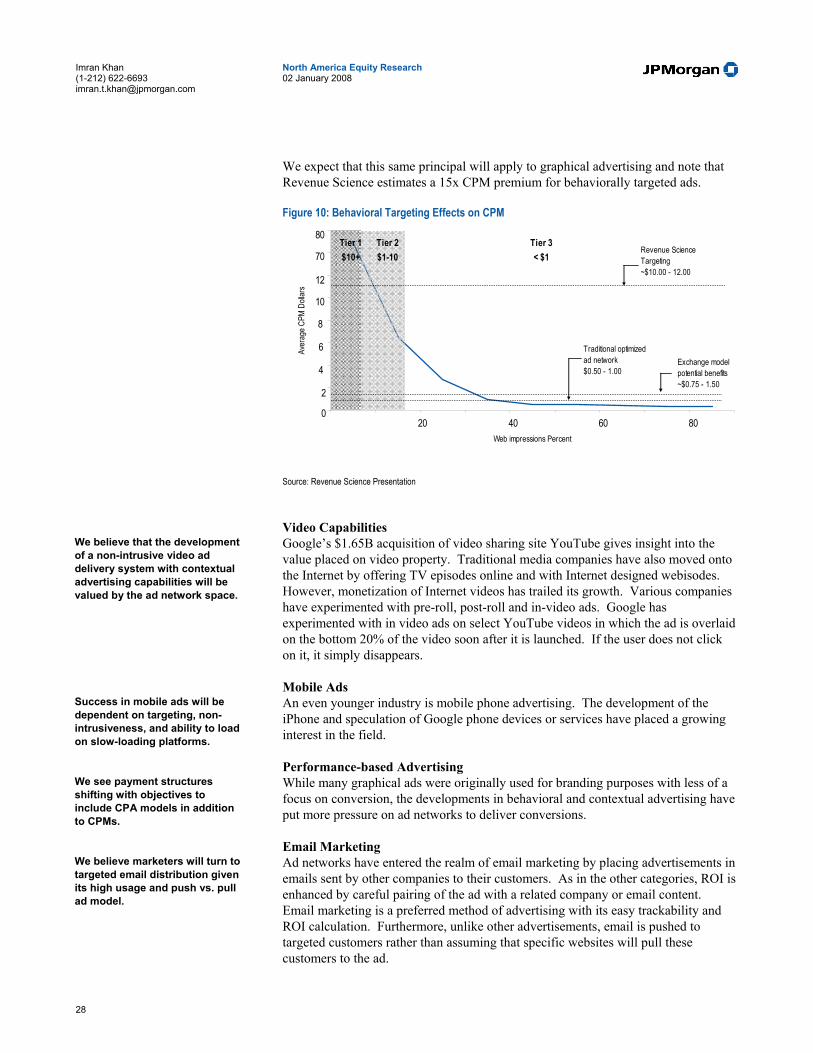
We expect that this same principal will apply to graphical advertising and note that Revenue Science estimates a 15x CPM premium for behaviorally targeted ads.
Figure 10: Behavioral Targeting Effects on CPM
0
200
400
600
800
1000
1200
1400
1600
1 2 3 4 5 6 7 8 9
Web impressions Percent
Aver
age C
PM D
ollar
s
80
70
12
10
8
6
4
2
020 40 60 80
Tier 3< $1
Tier 2$1-10
Tier 1$10+
Revenue Science Targeting~$10.00 - 12.00
Exchange modelpotential benefits~$0.75 - 1.50
Traditional optimizedad network$0.50 - 1.00
Source: Revenue Science Presentation
Video Capabilities Google’s $1.65B acquisition of video sharing site YouTube gives insight into the value placed on video property. Traditional media companies have also moved onto the Internet by offering TV episodes online and with Internet designed webisodes. However, monetization of Internet videos has trailed its growth. Various companies have experimented with pre-roll, post-roll and in-video ads. Google has experimented with in video ads on select YouTube videos in which the ad is overlaid on the bottom 20% of the video soon after it is launched. If the user does not click on it, it simply disappears.
Mobile Ads An even younger industry is mobile phone advertising. The development of the iPhone and speculation of Google phone devices or services have placed a growing interest in the field.
Performance-based Advertising While many graphical ads were originally used for branding purposes with less of a focus on conversion, the developments in behavioral and contextual advertising have put more pressure on ad networks to deliver conversions.
Email Marketing Ad networks have entered the realm of email marketing by placing advertisements in emails sent by other companies to their customers. As in the other categories, ROI is enhanced by careful pairing of the ad with a related company or email content. Email marketing is a preferred method of advertising with its easy trackability and ROI calculation. Furthermore, unlike other advertisements, email is pushed to targeted customers rather than assuming that specific websites will pull these customers to the ad.
We believe that the development of a non-intrusive video ad delivery system with contextual advertising capabilities will be valued by the ad network space.
Success in mobile ads will be dependent on targeting, non-intrusiveness, and ability to load on slow-loading platforms.
We see payment structures shifting with objectives to include CPA models in addition to CPMs.
We believe marketers will turn to targeted email distribution given its high usage and push vs. pull ad model.

29
North America Equity Research 02 January 2008
Imran Khan (1-212) 622-6693 [email protected]
Ultimately, we believe successful ad networks are going to need to be able to provide a diversity of advertising platforms to its marketers with clear targeting capabilities.
Dominant Portals’ Role in the Growing Ad Network Market In our view, potential consolidation in the ad network space is strategically feasible. We believe that consolidation will occur throughout the industry as ad networks grow their user base and leverage user information through behavioral targeting across a larger audience base. We believe large portals are well positioned as it is easier for both advertisers and publishers to fulfill all of their needs on fewer platforms while a consolidated network yields greater leverage of technology and advertiser/publisher relationships.
Creating Ad Networks Could be the Answer to an Ever-Fragmenting Audience While portals were once the dominant source of news and information, Yahoo!, AOL and Microsoft only accounted for ~27% of total minutes spent online in October vs. 42% in 2002. A similar trend can be seen in page views as October page views on the top 3 portals declined 22% from October 2004 vs. 22% total Internet growth in page views. We note that some of these losses can be attributed to losses in dial-up subs. We believe portals will become more significant players in ad networks as they turn to networks to grow their user reach, leverage user information through behavioral targeting, and leverage their existing capabilities to sell, place, and analyze display ads. Figure 11: Total Minutes Spent on Portal in October 2002 and 2007 millions
0
10,000
20,000
30,000
40,000
50,000
60,000
Yahoo! Sites Time Warner Network Microsoft Sites
Oct '02 Oct '07
34% growth
21% decline
43% decline
Source: ComScore data and JPMorgan estimates
Minutes spent on portals has declined over the last 5 years despite 37% growth in total minutes spent on the Internet.

30
North America Equity Research 02 January 2008
Imran Khan (1-212) 622-6693 [email protected]
Figure 12: Total Page Views for Leading Portals, October 2004 and 2007 millions
0
5,000
10,000
15,000
20,000
25,000
30,000
35,000
40,000
45,000
Yahoo! Sites Time Warner Network Microsoft Sites
Oct '04 Oct '07
7% decline
54% decline
4% growth
Source: comScore data and JPMorgan estimates User Information Will Lead to Dominance Accurate and rich user information is among an Internet company’s most valuable assets. Additionally, the ability to leverage accurate user information to deliver relevant content to users is the key to increasing conversion rates. We think large cap companies are particularly well suited to running ad networks as they can lever their user information with that of the publisher network to provide well targeted advertising. This should increase user conversion and monetization capabilities. A combination between any of the search players, a large publisher network, and a company with behavioral targeting capabilities would make sense, in our view.
One Platform for Multiple Advertising Products=Higher Ad Dollar Allocation From the standpoint of an advertiser, advertising campaign management would be easier with a single ad firm offering multiple products (search, graphical, cost-per-lead, cost-per-action, in-game advertising, mobile advertising, video). Publishers would benefit from the scale of various advertisers across verticals and the higher CPMs accompanying better targeted ads.
If a company had demographic, search query, and web navigation data on a user, we believe it could provide advertising that is more user relevant and could tailor the ads to the user as he/she navigates the web.
31
North America Equity Research 02 January 2008
Imran Khan (1-212) 622-6693 [email protected]
Figure 13: Online Advertising Services by Company
Service AOL GOOG MSN YHOOSearchAd NetworkAd Serving***Traffic Exchange***TargetingLead GenerationAffiliate Marketing***Rich MediaMobileEmail
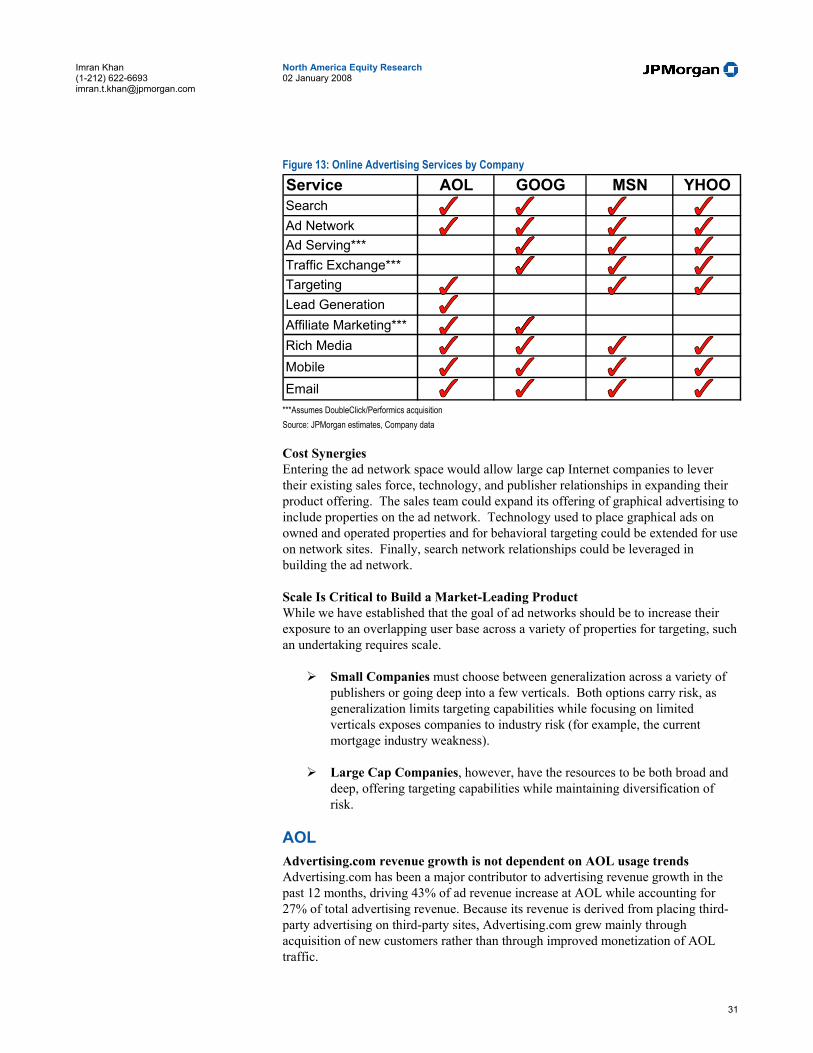
***Assumes DoubleClick/Performics acquisition Source: JPMorgan estimates, Company data Cost Synergies Entering the ad network space would allow large cap Internet companies to lever their existing sales force, technology, and publisher relationships in expanding their product offering. The sales team could expand its offering of graphical advertising to include properties on the ad network. Technology used to place graphical ads on owned and operated properties and for behavioral targeting could be extended for use on network sites. Finally, search network relationships could be leveraged in building the ad network.
Scale Is Critical to Build a Market-Leading Product While we have established that the goal of ad networks should be to increase their exposure to an overlapping user base across a variety of properties for targeting, such an undertaking requires scale.
Small Companies must choose between generalization across a variety of publishers or going deep into a few verticals. Both options carry risk, as generalization limits targeting capabilities while focusing on limited verticals exposes companies to industry risk (for example, the current mortgage industry weakness).
Large Cap Companies, however, have the resources to be both broad and deep, offering targeting capabilities while maintaining diversification of risk.
AOL Advertising.com revenue growth is not dependent on AOL usage trends Advertising.com has been a major contributor to advertising revenue growth in the past 12 months, driving 43% of ad revenue increase at AOL while accounting for 27% of total advertising revenue. Because its revenue is derived from placing third-party advertising on third-party sites, Advertising.com grew mainly through acquisition of new customers rather than through improved monetization of AOL traffic.
32
North America Equity Research 02 January 2008
Imran Khan (1-212) 622-6693 [email protected]
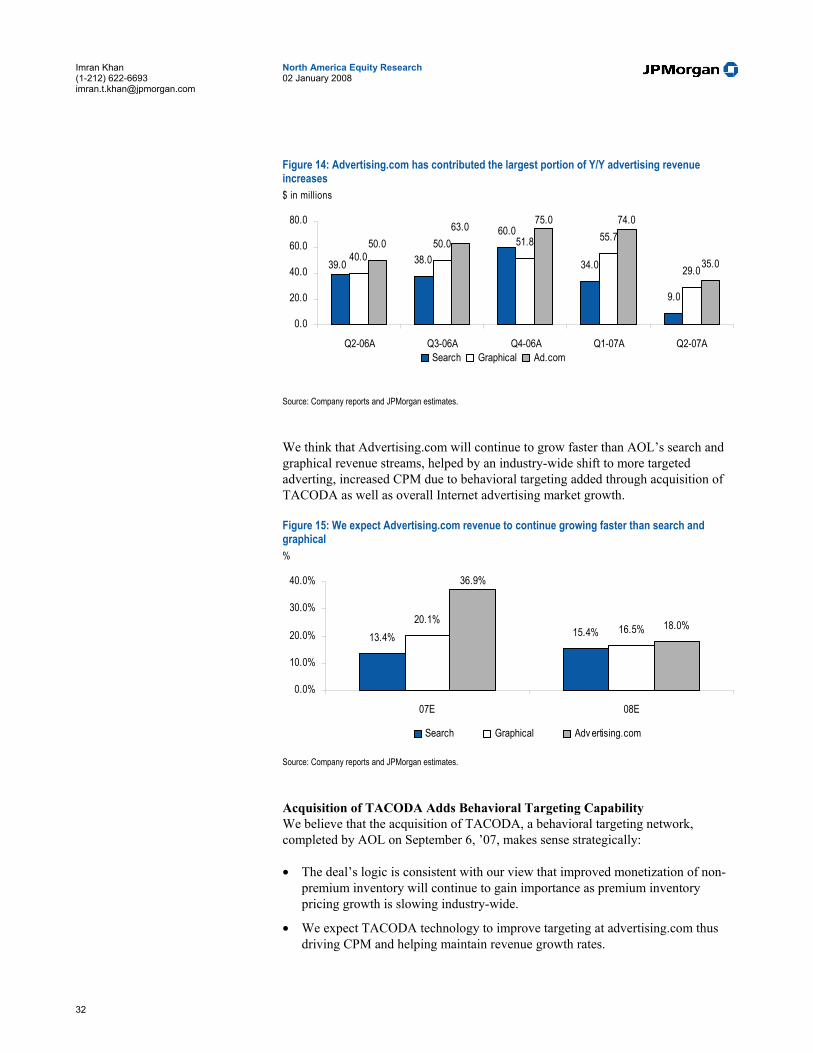
Figure 14: Advertising.com has contributed the largest portion of Y/Y advertising revenue increases $ in millions
38.0
60.0
34.0
9.0
40.050.0 51.8 55.7
29.0
50.063.0 75.0 74.0
35.039.0
0.0
20.0
40.0
60.0
80.0
Q2-06A Q3-06A Q4-06A Q1-07A Q2-07ASearch Graphical Ad.com
Source: Company reports and JPMorgan estimates.
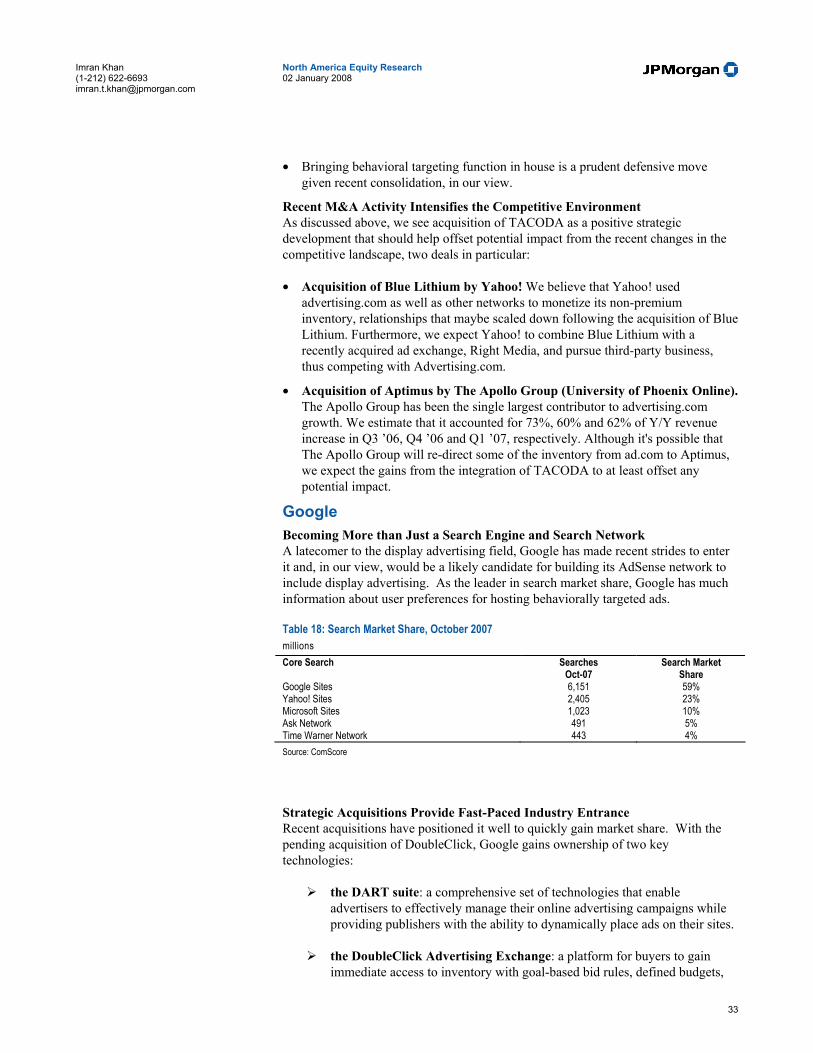
We think that Advertising.com will continue to grow faster than AOL’s search and graphical revenue streams, helped by an industry-wide shift to more targeted adverting, increased CPM due to behavioral targeting added through acquisition of TACODA as well as overall Internet advertising market growth.
Figure 15: We expect Advertising.com revenue to continue growing faster than search and graphical %
13.4% 15.4%20.1%
16.5%
36.9%
18.0%
0.0%
10.0%
20.0%
30.0%
40.0%
07E 08E
Search Graphical Adv ertising.com
Source: Company reports and JPMorgan estimates.
Acquisition of TACODA Adds Behavioral Targeting Capability We believe that the acquisition of TACODA, a behavioral targeting network, completed by AOL on September 6, ’07, makes sense strategically:
• The deal’s logic is consistent with our view that improved monetization of non-premium inventory will continue to gain importance as premium inventory pricing growth is slowing industry-wide.
• We expect TACODA technology to improve targeting at advertising.com thus driving CPM and helping maintain revenue growth rates.
33
North America Equity Research 02 January 2008
Imran Khan (1-212) 622-6693 [email protected]
• Bringing behavioral targeting function in house is a prudent defensive move given recent consolidation, in our view.
Recent M&A Activity Intensifies the Competitive Environment As discussed above, we see acquisition of TACODA as a positive strategic development that should help offset potential impact from the recent changes in the competitive landscape, two deals in particular:
• Acquisition of Blue Lithium by Yahoo! We believe that Yahoo! used advertising.com as well as other networks to monetize its non-premium inventory, relationships that maybe scaled down following the acquisition of Blue Lithium. Furthermore, we expect Yahoo! to combine Blue Lithium with a recently acquired ad exchange, Right Media, and pursue third-party business, thus competing with Advertising.com.
• Acquisition of Aptimus by The Apollo Group (University of Phoenix Online). The Apollo Group has been the single largest contributor to advertising.com growth. We estimate that it accounted for 73%, 60% and 62% of Y/Y revenue increase in Q3 ’06, Q4 ’06 and Q1 ’07, respectively. Although it's possible that The Apollo Group will re-direct some of the inventory from ad.com to Aptimus, we expect the gains from the integration of TACODA to at least offset any potential impact.
Google Becoming More than Just a Search Engine and Search Network A latecomer to the display advertising field, Google has made recent strides to enter it and, in our view, would be a likely candidate for building its AdSense network to include display advertising. As the leader in search market share, Google has much information about user preferences for hosting behaviorally targeted ads.
Table 18: Search Market Share, October 2007 millions Core Search Searches Search Market Oct-07 Share Google Sites 6,151 59% Yahoo! Sites 2,405 23% Microsoft Sites 1,023 10% Ask Network 491 5% Time Warner Network 443 4% Source: ComScore
Strategic Acquisitions Provide Fast-Paced Industry Entrance Recent acquisitions have positioned it well to quickly gain market share. With the pending acquisition of DoubleClick, Google gains ownership of two key technologies:
the DART suite: a comprehensive set of technologies that enable advertisers to effectively manage their online advertising campaigns while providing publishers with the ability to dynamically place ads on their sites.
the DoubleClick Advertising Exchange: a platform for buyers to gain immediate access to inventory with goal-based bid rules, defined budgets,
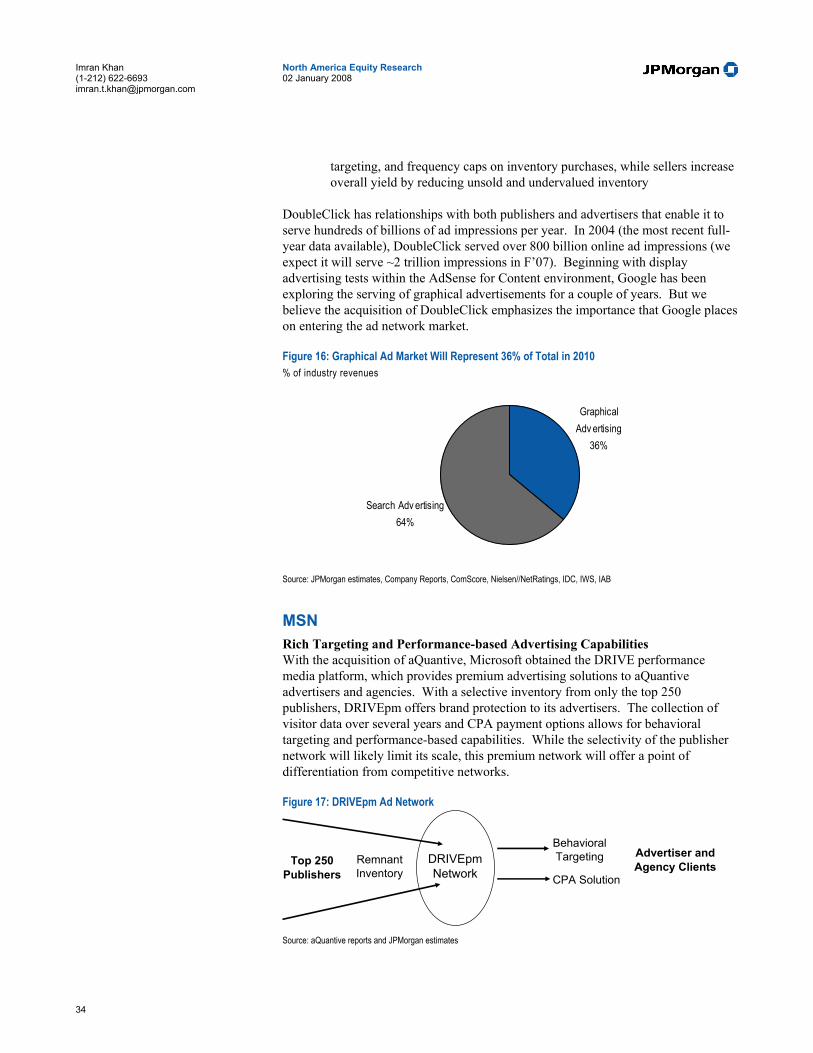
34
North America Equity Research 02 January 2008
Imran Khan (1-212) 622-6693 [email protected]
targeting, and frequency caps on inventory purchases, while sellers increase overall yield by reducing unsold and undervalued inventory
DoubleClick has relationships with both publishers and advertisers that enable it to serve hundreds of billions of ad impressions per year. In 2004 (the most recent full-year data available), DoubleClick served over 800 billion online ad impressions (we expect it will serve ~2 trillion impressions in F’07). Beginning with display advertising tests within the AdSense for Content environment, Google has been exploring the serving of graphical advertisements for a couple of years. But we believe the acquisition of DoubleClick emphasizes the importance that Google places on entering the ad network market.
Figure 16: Graphical Ad Market Will Represent 36% of Total in 2010 % of industry revenues
Graphical Adv ertising
36%
Search Adv ertising64%
Source: JPMorgan estimates, Company Reports, ComScore, Nielsen//NetRatings, IDC, IWS, IAB
MSN Rich Targeting and Performance-based Advertising Capabilities With the acquisition of aQuantive, Microsoft obtained the DRIVE performance media platform, which provides premium advertising solutions to aQuantive advertisers and agencies. With a selective inventory from only the top 250 publishers, DRIVEpm offers brand protection to its advertisers. The collection of visitor data over several years and CPA payment options allows for behavioral targeting and performance-based capabilities. While the selectivity of the publisher network will likely limit its scale, this premium network will offer a point of differentiation from competitive networks.
Figure 17: DRIVEpm Ad Network
DRIVEpmNetwork
Top 250Publishers
RemnantInventory
Behavioral Targeting
CPA Solution
Advertiser andAgency Clients
Source: aQuantive reports and JPMorgan estimates

35
North America Equity Research 02 January 2008
Imran Khan (1-212) 622-6693 [email protected]
AdECN Should Improve Monetization In July, Microsoft announced its intention to acquire AdECN in 1H08. AdECN serves as a hub for ad networks to buy and sell display advertising in a real-time auction marketplace. Advertisers will get more access to inventory to enable better matching to their requirements and increasing ROI. Publishers should be able to increase their yield through increased volume of available inventory. With both parties benefiting, AdECN should provide better monetization through higher CPMs for Microsoft remnant and non-premium inventory. We believe this will be instrumental in monetizing inventory from the Facebook and Digg partnerships.
Partnerships Are Growing MSN’s Display Reach Outside Its O&O Properties Agreements to provide advertising on Facebook and Digg have expanded MSN's advertising network beyond its owned and operated properties and have allowed MSN to capitalize on the growing social networking trend. Facebook and Digg are two of the fastest growing social networks with Y/Y page view growth well in excess of 100%. The challenge that we believe Microsoft will face will be providing targeting capabilities sufficient to monetize such a diverse user and content base.
Table 19: Partner Page View Growth, August 2007 millions
Aug-2006 Aug-2007 Y/Y Growth Total Internet 501,260 474,003 -5% FACEBOOK.COM 6,463 15,260 136% DIGG.COM 4 24 496% Source: comScore data and JPMorgan estimates
Yahoo! A Clear Fit in the Ad Network Space Yahoo! is particularly well positioned to provide targeted advertising to a network. As the top-ranked website by unique visitors (according to comScore), Yahoo! has a wealth of information about visitor habits and preferences.
Figure 18: Top Sites by Unique Visitors and % Reach, October 2007 thousands
0
20,000
40,000
60,000
80,000
100,000
120,000
140,000
160,000
Yahoo! Sites Google Sites Time WarnerNetwork
Microsoft Sites Fox InteractiveMedia
75% 72%66% 66%
46%
Source: ComScore data Yahoo! has made strategic acquisitions to build off its existing assets and to gain dominance in this space.
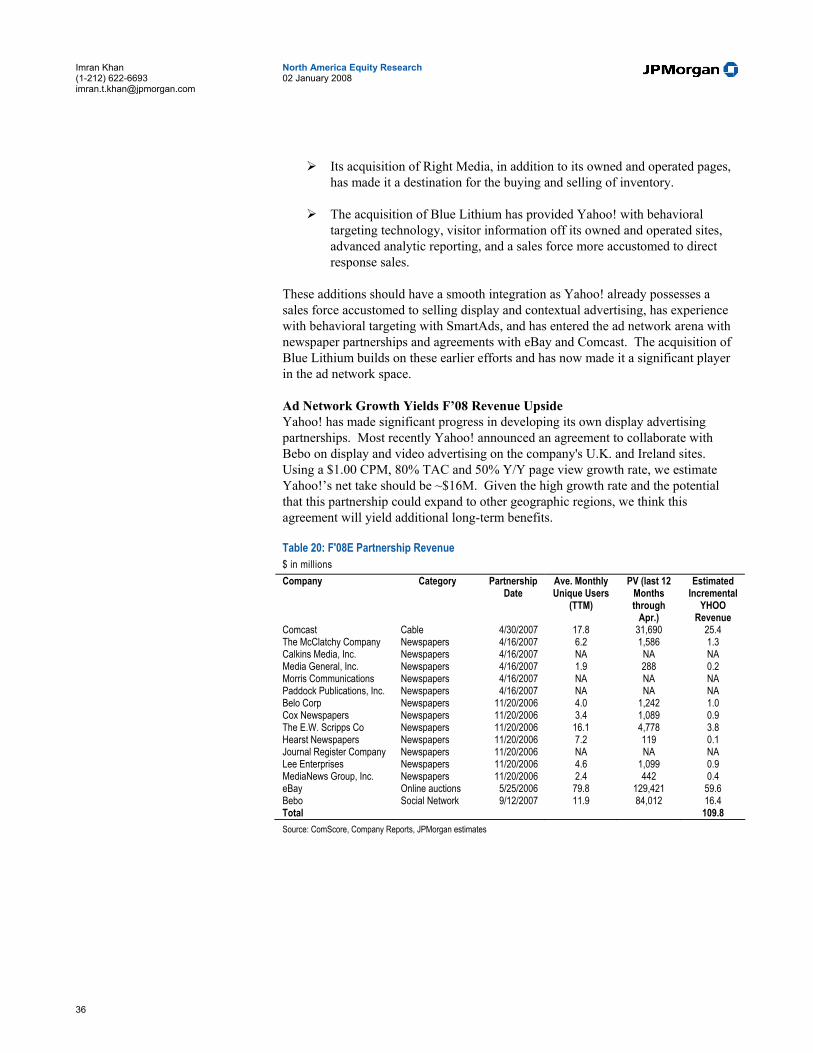
36
North America Equity Research 02 January 2008
Imran Khan (1-212) 622-6693 [email protected]
Its acquisition of Right Media, in addition to its owned and operated pages, has made it a destination for the buying and selling of inventory.
The acquisition of Blue Lithium has provided Yahoo! with behavioral targeting technology, visitor information off its owned and operated sites, advanced analytic reporting, and a sales force more accustomed to direct response sales.
These additions should have a smooth integration as Yahoo! already possesses a sales force accustomed to selling display and contextual advertising, has experience with behavioral targeting with SmartAds, and has entered the ad network arena with newspaper partnerships and agreements with eBay and Comcast. The acquisition of Blue Lithium builds on these earlier efforts and has now made it a significant player in the ad network space.
Ad Network Growth Yields F’08 Revenue Upside Yahoo! has made significant progress in developing its own display advertising partnerships. Most recently Yahoo! announced an agreement to collaborate with Bebo on display and video advertising on the company's U.K. and Ireland sites. Using a $1.00 CPM, 80% TAC and 50% Y/Y page view growth rate, we estimate Yahoo!’s net take should be ~$16M. Given the high growth rate and the potential that this partnership could expand to other geographic regions, we think this agreement will yield additional long-term benefits.
Table 20: F'08E Partnership Revenue $ in millions Company Category Partnership
Date Ave. Monthly Unique Users
(TTM)
PV (last 12 Months through
Apr.)
Estimated Incremental
YHOO Revenue
Comcast Cable 4/30/2007 17.8 31,690 25.4 The McClatchy Company Newspapers 4/16/2007 6.2 1,586 1.3 Calkins Media, Inc. Newspapers 4/16/2007 NA NA NA Media General, Inc. Newspapers 4/16/2007 1.9 288 0.2 Morris Communications Newspapers 4/16/2007 NA NA NA Paddock Publications, Inc. Newspapers 4/16/2007 NA NA NA Belo Corp Newspapers 11/20/2006 4.0 1,242 1.0 Cox Newspapers Newspapers 11/20/2006 3.4 1,089 0.9 The E.W. Scripps Co Newspapers 11/20/2006 16.1 4,778 3.8 Hearst Newspapers Newspapers 11/20/2006 7.2 119 0.1 Journal Register Company Newspapers 11/20/2006 NA NA NA Lee Enterprises Newspapers 11/20/2006 4.6 1,099 0.9 MediaNews Group, Inc. Newspapers 11/20/2006 2.4 442 0.4 eBay Online auctions 5/25/2006 79.8 129,421 59.6 Bebo Social Network 9/12/2007 11.9 84,012 16.4 Total 109.8 Source: ComScore, Company Reports, JPMorgan estimates
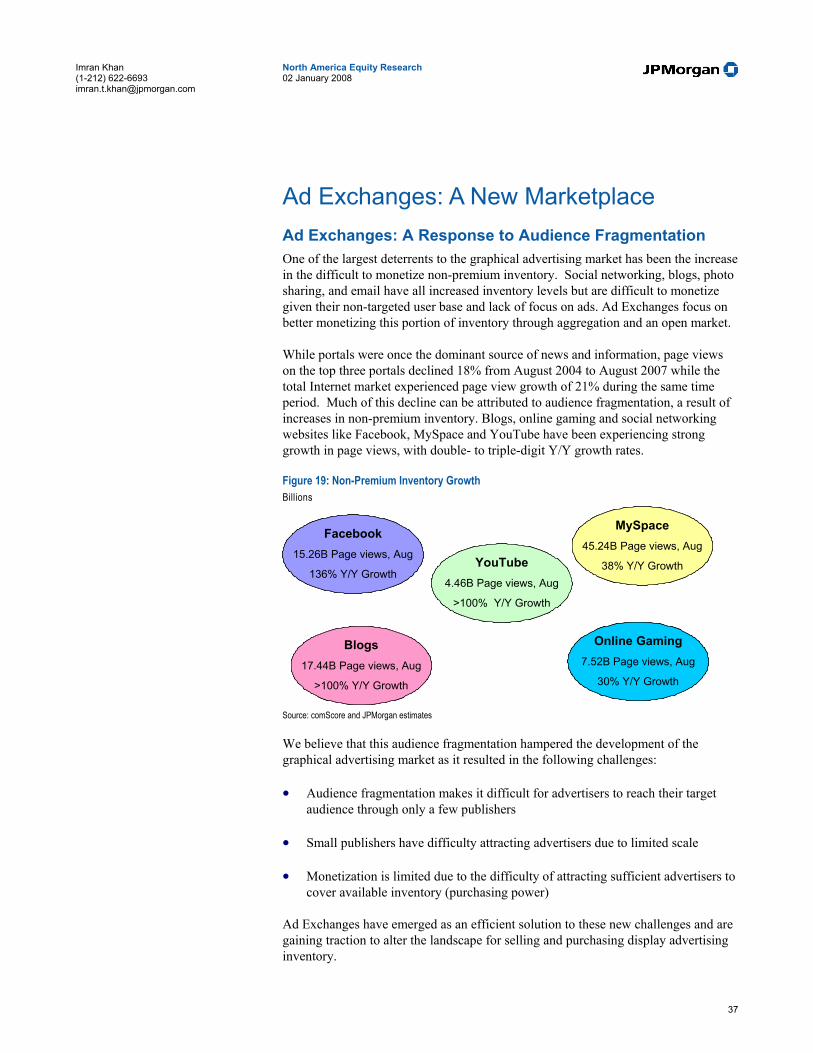
37
North America Equity Research 02 January 2008
Imran Khan (1-212) 622-6693 [email protected]
Ad Exchanges: A New Marketplace Ad Exchanges: A Response to Audience Fragmentation One of the largest deterrents to the graphical advertising market has been the increase in the difficult to monetize non-premium inventory. Social networking, blogs, photo sharing, and email have all increased inventory levels but are difficult to monetize given their non-targeted user base and lack of focus on ads. Ad Exchanges focus on better monetizing this portion of inventory through aggregation and an open market.
While portals were once the dominant source of news and information, page views on the top three portals declined 18% from August 2004 to August 2007 while the total Internet market experienced page view growth of 21% during the same time period. Much of this decline can be attributed to audience fragmentation, a result of increases in non-premium inventory. Blogs, online gaming and social networking websites like Facebook, MySpace and YouTube have been experiencing strong growth in page views, with double- to triple-digit Y/Y growth rates.
Figure 19: Non-Premium Inventory Growth Billions
Facebook15.26B Page views, Aug
136% Y/Y Growth
MySpace45.24B Page views, Aug
38% Y/Y GrowthYouTube4.46B Page views, Aug
>100% Y/Y Growth
Blogs17.44B Page views, Aug
>100% Y/Y Growth
Online Gaming7.52B Page views, Aug
30% Y/Y Growth
Facebook15.26B Page views, Aug
136% Y/Y Growth
Facebook15.26B Page views, Aug
136% Y/Y Growth
MySpace45.24B Page views, Aug
38% Y/Y Growth
MySpace45.24B Page views, Aug
38% Y/Y GrowthYouTube4.46B Page views, Aug
>100% Y/Y Growth
YouTube4.46B Page views, Aug
>100% Y/Y Growth
Blogs17.44B Page views, Aug
>100% Y/Y Growth
Blogs17.44B Page views, Aug
>100% Y/Y Growth
Online Gaming7.52B Page views, Aug
30% Y/Y Growth
Online Gaming7.52B Page views, Aug
30% Y/Y Growth
Source: comScore and JPMorgan estimates We believe that this audience fragmentation hampered the development of the graphical advertising market as it resulted in the following challenges:
• Audience fragmentation makes it difficult for advertisers to reach their target audience through only a few publishers
• Small publishers have difficulty attracting advertisers due to limited scale • Monetization is limited due to the difficulty of attracting sufficient advertisers to
cover available inventory (purchasing power) Ad Exchanges have emerged as an efficient solution to these new challenges and are gaining traction to alter the landscape for selling and purchasing display advertising inventory.

38
North America Equity Research 02 January 2008
Imran Khan (1-212) 622-6693 [email protected]
The Rise of the Ad Exchange The ad exchange is a real time marketplace with an auction-based system where the participants - advertisers and publishers – transact on a common platform to purchase and sell online graphical advertising. The publishers place remnant inventory on the exchange for the advertisers to purchase through bidding on a user-friendly interface. Network barriers are lowered and all participants interact on a common platform, while the outside relationships are not disturbed. Ad Exchanges do not compete with ad networks, targeting technologies, or publishers, but rather serve as a more efficient way for the exchange of inventory within these groups.
Figure 20: Ad Exchange Linkages
Ad Exchange
Bid Optimization
Rich Media VendorsContextual Networks
Other Ad Exchanges
Targeting Technologies
Display Networks
Large Publishers
Agency Side Ad Servers
Source: www.clickz.com (Article: Ad exchanges are the future)
Key features of ad exchanges:
• Transparent and dynamic pricing landscape due to open bidding process
• Reduced operational friction due to improved clarity of placement of ad serving on a website
• Enhanced efficiency due to simplification and standardization of business processes
• Improved liquidity of ad inventory
• Interests of smaller niche players safeguarded as existing relationships and budget sizes exert no influence and each bidder has equal access to the media
• Increased role of technology to automate and provide a common platform
• Elimination of intermediaries and their margins
The Value of an Ad Exchange For Advertisers: An advertising exchange establishes a transparent and automated clearinghouse, easing pricing concerns. The advertiser can place different bids for each ad impression after evaluation of the perceived value against the buy criteria. Thus, the advertisers gain from:

39
North America Equity Research 02 January 2008
Imran Khan (1-212) 622-6693 [email protected]
• Smarter spending
• Better ROI
• Access for inventory for targeting purposes
For Publishers: The ad exchange model will usher in more competition and enhanced technologies for targeting. This should drive the demand for inventory upwards, resulting in higher CPMs. The publisher can set a floor price for the impressions to be accepted by the exchange and will gain as yields optimize when highest bids win in a real-time auction. The benefits for the publishers are:
• Better targeting
• More valuable inventory
• Higher prices
• Better yield
Key Takeaways • Exchanges should increase CPMs for publishers as they provide an open auction
market to a large population of advertisers • Advertisers should gain easier access to a broad range of inventory, which can
be used for targeted advertising • The major Internet players should become ad exchange operators as they strive to
provide a one-stop solution to all of an advertiser’s needs
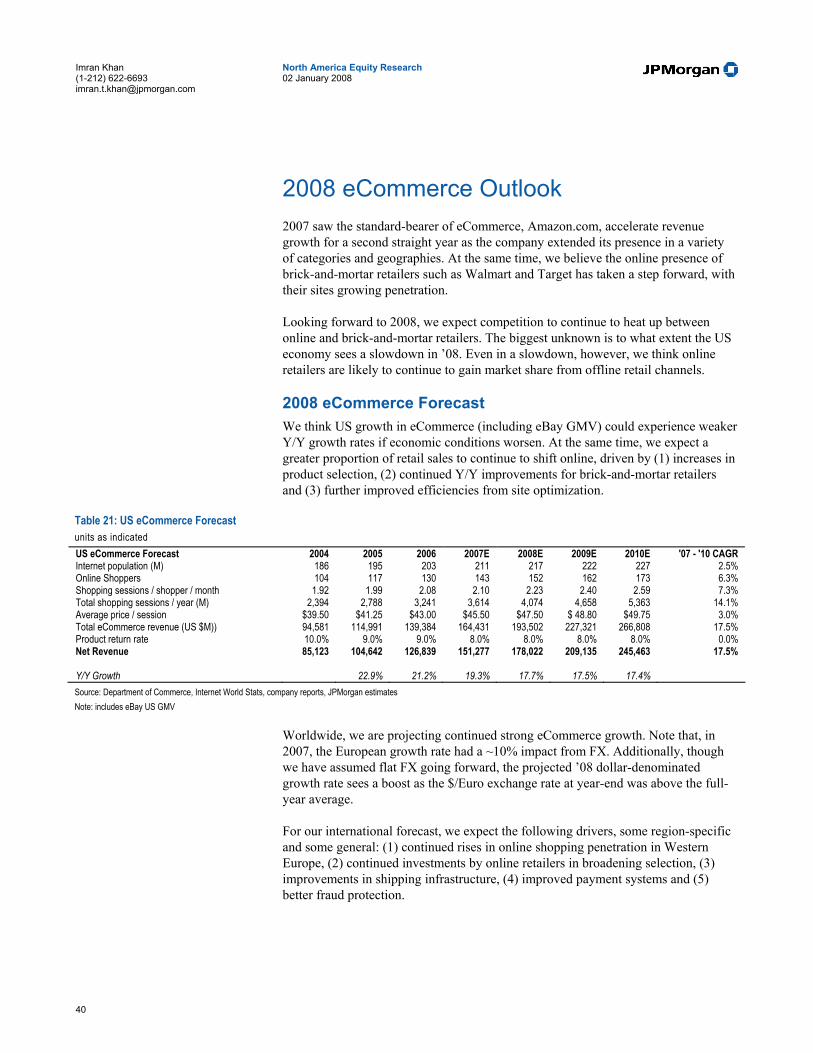
40
North America Equity Research 02 January 2008
Imran Khan (1-212) 622-6693 [email protected]
2008 eCommerce Outlook 2007 saw the standard-bearer of eCommerce, Amazon.com, accelerate revenue growth for a second straight year as the company extended its presence in a variety of categories and geographies. At the same time, we believe the online presence of brick-and-mortar retailers such as Walmart and Target has taken a step forward, with their sites growing penetration.
Looking forward to 2008, we expect competition to continue to heat up between online and brick-and-mortar retailers. The biggest unknown is to what extent the US economy sees a slowdown in ’08. Even in a slowdown, however, we think online retailers are likely to continue to gain market share from offline retail channels.
2008 eCommerce Forecast We think US growth in eCommerce (including eBay GMV) could experience weaker Y/Y growth rates if economic conditions worsen. At the same time, we expect a greater proportion of retail sales to continue to shift online, driven by (1) increases in product selection, (2) continued Y/Y improvements for brick-and-mortar retailers and (3) further improved efficiencies from site optimization.
Table 21: US eCommerce Forecast units as indicated US eCommerce Forecast 2004 2005 2006 2007E 2008E 2009E 2010E '07 - '10 CAGR Internet population (M) 186 195 203 211 217 222 227 2.5% Online Shoppers 104 117 130 143 152 162 173 6.3% Shopping sessions / shopper / month 1.92 1.99 2.08 2.10 2.23 2.40 2.59 7.3% Total shopping sessions / year (M) 2,394 2,788 3,241 3,614 4,074 4,658 5,363 14.1% Average price / session $39.50 $41.25 $43.00 $45.50 $47.50 $ 48.80 $49.75 3.0% Total eCommerce revenue (US $M)) 94,581 114,991 139,384 164,431 193,502 227,321 266,808 17.5% Product return rate 10.0% 9.0% 9.0% 8.0% 8.0% 8.0% 8.0% 0.0% Net Revenue 85,123 104,642 126,839 151,277 178,022 209,135 245,463 17.5% Y/Y Growth 22.9% 21.2% 19.3% 17.7% 17.5% 17.4% Source: Department of Commerce, Internet World Stats, company reports, JPMorgan estimates Note: includes eBay US GMV
Worldwide, we are projecting continued strong eCommerce growth. Note that, in 2007, the European growth rate had a ~10% impact from FX. Additionally, though we have assumed flat FX going forward, the projected ’08 dollar-denominated growth rate sees a boost as the $/Euro exchange rate at year-end was above the full-year average.
For our international forecast, we expect the following drivers, some region-specific and some general: (1) continued rises in online shopping penetration in Western Europe, (2) continued investments by online retailers in broadening selection, (3) improvements in shipping infrastructure, (4) improved payment systems and (5) better fraud protection.
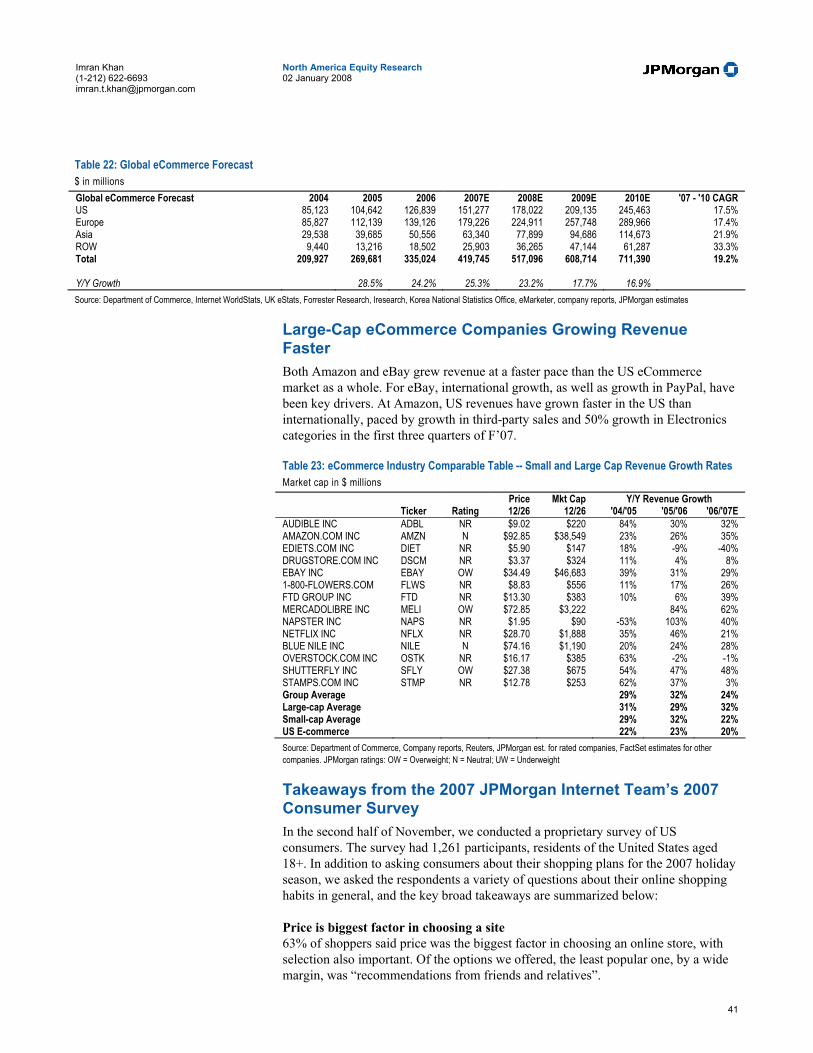
41
North America Equity Research 02 January 2008
Imran Khan (1-212) 622-6693 [email protected]
Table 22: Global eCommerce Forecast $ in millions Global eCommerce Forecast 2004 2005 2006 2007E 2008E 2009E 2010E '07 - '10 CAGR US 85,123 104,642 126,839 151,277 178,022 209,135 245,463 17.5% Europe 85,827 112,139 139,126 179,226 224,911 257,748 289,966 17.4% Asia 29,538 39,685 50,556 63,340 77,899 94,686 114,673 21.9% ROW 9,440 13,216 18,502 25,903 36,265 47,144 61,287 33.3% Total 209,927 269,681 335,024 419,745 517,096 608,714 711,390 19.2% Y/Y Growth 28.5% 24.2% 25.3% 23.2% 17.7% 16.9% Source: Department of Commerce, Internet WorldStats, UK eStats, Forrester Research, Iresearch, Korea National Statistics Office, eMarketer, company reports, JPMorgan estimates
Large-Cap eCommerce Companies Growing Revenue Faster Both Amazon and eBay grew revenue at a faster pace than the US eCommerce market as a whole. For eBay, international growth, as well as growth in PayPal, have been key drivers. At Amazon, US revenues have grown faster in the US than internationally, paced by growth in third-party sales and 50% growth in Electronics categories in the first three quarters of F’07.
Table 23: eCommerce Industry Comparable Table -- Small and Large Cap Revenue Growth Rates Market cap in $ millions
Price Mkt Cap Y/Y Revenue Growth Ticker Rating 12/26 12/26 '04/'05 '05/'06 '06/'07E
AUDIBLE INC ADBL NR $9.02 $220 84% 30% 32% AMAZON.COM INC AMZN N $92.85 $38,549 23% 26% 35% EDIETS.COM INC DIET NR $5.90 $147 18% -9% -40% DRUGSTORE.COM INC DSCM NR $3.37 $324 11% 4% 8% EBAY INC EBAY OW $34.49 $46,683 39% 31% 29% 1-800-FLOWERS.COM FLWS NR $8.83 $556 11% 17% 26% FTD GROUP INC FTD NR $13.30 $383 10% 6% 39% MERCADOLIBRE INC MELI OW $72.85 $3,222 84% 62% NAPSTER INC NAPS NR $1.95 $90 -53% 103% 40% NETFLIX INC NFLX NR $28.70 $1,888 35% 46% 21% BLUE NILE INC NILE N $74.16 $1,190 20% 24% 28% OVERSTOCK.COM INC OSTK NR $16.17 $385 63% -2% -1% SHUTTERFLY INC SFLY OW $27.38 $675 54% 47% 48% STAMPS.COM INC STMP NR $12.78 $253 62% 37% 3% Group Average 29% 32% 24% Large-cap Average 31% 29% 32% Small-cap Average 29% 32% 22% US E-commerce 22% 23% 20% Source: Department of Commerce, Company reports, Reuters, JPMorgan est. for rated companies, FactSet estimates for other companies. JPMorgan ratings: OW = Overweight; N = Neutral; UW = Underweight
Takeaways from the 2007 JPMorgan Internet Team’s 2007 Consumer Survey In the second half of November, we conducted a proprietary survey of US consumers. The survey had 1,261 participants, residents of the United States aged 18+. In addition to asking consumers about their shopping plans for the 2007 holiday season, we asked the respondents a variety of questions about their online shopping habits in general, and the key broad takeaways are summarized below:
Price is biggest factor in choosing a site 63% of shoppers said price was the biggest factor in choosing an online store, with selection also important. Of the options we offered, the least popular one, by a wide margin, was “recommendations from friends and relatives”.

42
North America Equity Research 02 January 2008
Imran Khan (1-212) 622-6693 [email protected]
Table 24: Price is paramount: factors that influence buyers’ choices % among respondents who indicated they shop online Factor #1 factor #2 factor In top 5 Price 63.0% 13.7% 87.1% Selection 11.8% 36.5% 74.3% Customer service 3.9% 9.1% 48.0% Promotions/Advertisements 2.2% 7.3% 43.4% Payment options 2.3% 7.8% 42.0% Familiarity/experience with store 5.7% 6.2% 40.9% Name recognition 2.7% 6.3% 40.0% Ability to purchase multiple items 4.1% 5.0% 37.8% Access to customer reviews/product information 3.2% 4.6% 33.7% Recommendations from friends/relatives 1.3% 3.6% 23.1% Source: JPMorgan Internet Team 2007 Consumer Survey Looking at the data on a site-by-site basis does not change the conclusion: price remains the top consideration for shoppers regardless of site, with 60-63% of shoppers at each of Amazon, eBay, Walmart.com and Target.com listing price as their top factor in choosing a site.
Higher-income shoppers look for slightly different things in a site. More than 50% of shoppers with incomes over $100K listed “familiarity/experience with store” as one of their top five factors, compared to below 40% for those earning less than $100K. Selection and the ability to purchase multiple items were more important to those with incomes over $100K, while payment options were less important. Even for the >$100K-income shoppers, price is the biggest factor: fewer respondents in this income category chose it as their #1 factor, but approximately 86% listed it in their top five, in line with the sample as a whole.
Table 25: Familiarity and selection matter more to higher-income shoppers % of online shoppers who indicated factor was one of their top 5 factors in choosing a site Factor Income <$100K Income >$100K Difference Price 87.2% 86.2% -1.1% Selection 73.6% 79.7% 6.1% Customer service 48.0% 48.0% -0.1% Promotions/Advertisements 42.7% 48.0% 5.3% Payment options 43.7% 29.3% -14.5% Familiarity/experience with store 39.5% 50.4% 10.9% Name recognition 40.8% 34.1% -6.6% Ability to purchase multiple items 37.1% 43.1% 6.0% Access to customer reviews/product information 34.1% 30.9% -3.2% Recommendations from friends/relatives 22.9% 24.4% 1.5% Source: JPMorgan Internet Team 2007 Consumer Survey Walmart.com, Target.com catching up to large online sites Third-party metrics indicate eBay and Amazon are the two largest online-only stores in terms of unique users, whereas Walmart.com and Target.com are the two biggest sites belonging to brick-and-mortar retailers. In ’06, only Amazon and eBay drew business from at least 30% of our respondents, more than any other sites. For the ’07 holiday season, our survey shows no significant change in Amazon’s and eBay’s reach, but strong growth for the two largest brick-and-mortar retailers’ sites, with 20+% increases in respondents planning to use Walmart.com and Target.com. We also saw a significant increase in the number of users expecting to use Circuitcity.com.

43
North America Equity Research 02 January 2008
Imran Khan (1-212) 622-6693 [email protected]
Table 26: Respondents who used (’06) or plan to use (’07) specific sites for holiday shopping Site 2006 2007 Y/Y difference significant? Amazon 36.9% 36.2% No eBay 30.0% 28.4% No Walmart.com 22.9% 27.8% Yes, up 21% Y/Y Target.com 15.3% 19.9% Yes, up 30% Y/Y Bestbuy.com 17.9% 18.6% No Circuitcity.com 9.1% 12.0% Yes, up 31% Y/Y QVC.com 6.3% 5.9% No HSN.com 4.5% 4.7% No Source: JPMorgan Internet Team 2007 Consumer Survey. Statistical significance at a p<.01 level. Media, Apparel top categories Books, music and video were the top category, with nearly 66% of online shoppers reporting they had bought such items online within the past year. Apparel and accessories, at 57% penetration, was second, tilted predominantly toward female shoppers. Unsurprisingly, men were much more likely to shop in both the Computers and VideoGames category and the Electronics category.
Table 27: Media items popular with both genders: Top five categories among men and women %, among respondents who indicated they shop online, that indicated they had made purchases in category Men Women Books, music, videos and other media 63.7% Books, music, videos and other media 67.0% Computer and videogames software and hardware
51.4% Apparel and accessories (includes shoes, handbags and jewelry)
64.2%
Apparel and accessories (includes shoes, handbags and jewelry)
46.5% Health and beauty 38.2%
Electronics (includes television and stereo equipment)
36.1% Computer and videogames software and hardware
32.7%
Health and beauty 24.3% Toys 32.2% Source: JPMorgan Internet Team 2007 Consumer Survey Younger users shop online more, and gap is widening Among online shoppers, 29% of those aged 18-41 did more than 40% of their holiday shopping online in ’06, and 39% expected to do so this year. Among those aged 42+, the respective numbers were 17% and 20% for ’06 and ’07.
Figure 21: Expectation of money spent shopping online, holiday season ’07 vs. ’06 % among respondents who indicated they shop online
Ages 18-41
About the same, 40%
More, 43%
Less, 16%
Ages 42+More, 17%
About the same, 51%
Less, 31%
Source: JPMorgan Internet Team 2007 Consumer Survey
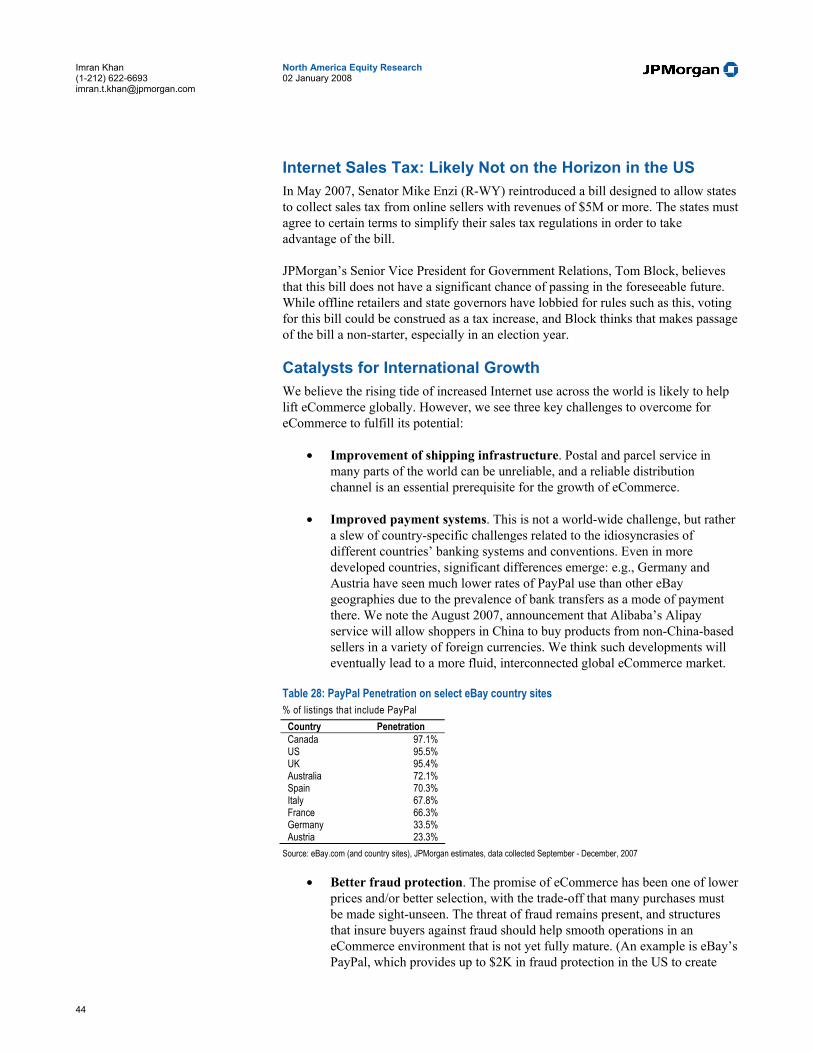
44
North America Equity Research 02 January 2008
Imran Khan (1-212) 622-6693 [email protected]
Internet Sales Tax: Likely Not on the Horizon in the US In May 2007, Senator Mike Enzi (R-WY) reintroduced a bill designed to allow states to collect sales tax from online sellers with revenues of $5M or more. The states must agree to certain terms to simplify their sales tax regulations in order to take advantage of the bill.
JPMorgan’s Senior Vice President for Government Relations, Tom Block, believes that this bill does not have a significant chance of passing in the foreseeable future. While offline retailers and state governors have lobbied for rules such as this, voting for this bill could be construed as a tax increase, and Block thinks that makes passage of the bill a non-starter, especially in an election year.
Catalysts for International Growth We believe the rising tide of increased Internet use across the world is likely to help lift eCommerce globally. However, we see three key challenges to overcome for eCommerce to fulfill its potential:
• Improvement of shipping infrastructure. Postal and parcel service in many parts of the world can be unreliable, and a reliable distribution channel is an essential prerequisite for the growth of eCommerce.
• Improved payment systems. This is not a world-wide challenge, but rather a slew of country-specific challenges related to the idiosyncrasies of different countries’ banking systems and conventions. Even in more developed countries, significant differences emerge: e.g., Germany and Austria have seen much lower rates of PayPal use than other eBay geographies due to the prevalence of bank transfers as a mode of payment there. We note the August 2007, announcement that Alibaba’s Alipay service will allow shoppers in China to buy products from non-China-based sellers in a variety of foreign currencies. We think such developments will eventually lead to a more fluid, interconnected global eCommerce market.
Table 28: PayPal Penetration on select eBay country sites % of listings that include PayPal
Country Penetration Canada 97.1% US 95.5% UK 95.4% Australia 72.1% Spain 70.3% Italy 67.8% France 66.3% Germany 33.5% Austria 23.3%
Source: eBay.com (and country sites), JPMorgan estimates, data collected September - December, 2007
• Better fraud protection. The promise of eCommerce has been one of lower prices and/or better selection, with the trade-off that many purchases must be made sight-unseen. The threat of fraud remains present, and structures that insure buyers against fraud should help smooth operations in an eCommerce environment that is not yet fully mature. (An example is eBay’s PayPal, which provides up to $2K in fraud protection in the US to create

45
North America Equity Research 02 January 2008
Imran Khan (1-212) 622-6693 [email protected]
buyer confidence, with transaction loss rates for the PayPal unit of 25-33 bps, as denominated by total payment volume).
We note that the above is not intended to be an exhaustive list of catalysts for international growth – many specific markets can present unique challenges – such as governmental ones – for the operation of eCommerce companies.

46
North America Equity Research 02 January 2008
Imran Khan (1-212) 622-6693 [email protected]
2008 Online Travel Outlook In 2007, online travel agency companies continued to face slowing US growth due to a maturing market and increased competition from suppliers and have come to rely more heavily on growth from Europe. The companies in our coverage universe continue to pursue their international growth strategies and have begun to position themselves in the Asian market.
Looking to 2008, we expect to see the following dynamics shape the online travel agency space: (1) acceleration of domestic growth as GDS air revenue declines are anniversaried, (2) increased dependence on international growth, (3) a focus on developing Asian markets as European markets mature, (4) higher sales and marketing costs due to keyword inflation, and (5) investment in customer service, technology and processes.
Online Travel Market Should Continue to Grow US Online Travel Estimates We believe US online travel growth in 2008 will be driven by: (1) increased travel volume, (2) increased prices, particularly in hotel bookings where demand continues to exceed supply, and (3) to a lesser extent, increased online vs. offline travel booking.
Our updated market forecast calls for F’08 online travel gross bookings of $90.4B, representing Y/Y growth of 9.5%. We are estimating domestic online travel gross bookings to grow at a CAGR of approximately 7.5% through 2010.
Table 29: US Online Travel Market Projection $ in millions 2004 2005 2006 2007 2008E 2009E 2010E 2007-2010 CAGR Average Price 272.6 287.1 302.2 317.3 331.6 343.2 350.1 3.3% Total Trips 1,953.3 1,992.4 2,032.2 2,072.9 2,114.4 2,146.1 2,178.3 1.6% Total Travel Spend 532,400.0 572,100.0 614,200.0 657,808.2 701,157.8 736,583.8 762,585.2 5.0% % online 9.8% 11.0% 12.0% 12.6% 12.9% 13.2% 13.5% 2.4% Online Travel Spend 52,400.0 62,800.0 73,400.0 82,600.0 90,449.4 97,229.1 102,949.0 7.5% Average Price Growth 5.3% 5.3% 5.0% 4.5% 3.5% 2.0% Total Trips Growth 2.0% 2.0% 2.0% 2.0% 1.5% 1.5% Total Travel Spend Growth 7.5% 7.4% 7.1% 6.6% 5.1% 3.5% Online Travel Spend Growth 19.8% 16.9% 12.5% 9.5% 7.5% 5.9% Source: JPMorgan estimates, PhoCusWright, eMarketer, Jupiter, and TIA
International Online Travel Estimates Consistent with last year, many US companies are looking abroad to supplement slowing US growth. We believe international online travel growth in 2008 will be driven by (1) continued growth in online vs. offline bookings in Europe and Asia, (2) increased inventory placed online, (3) international acquisitions to facilitate market inroads, (4) continued investments in international operational infrastructure, (5) increased broadband penetration in Europe and Asia, and (6) increased prices and volumes.

47
North America Equity Research 02 January 2008
Imran Khan (1-212) 622-6693 [email protected]
Our updated forecast calls for F’08 European online travel gross bookings of $59.5B, representing Y/Y growth of 18%. We estimate that European online travel gross bookings will grow at a CAGR of approximately 16% through 2010.
Table 30: Europe Online Travel Forecast $ in millions 2004 2005 2006 2007 2008E 2009E 2010E 2007-2010 CAGR Average Price 621.3 627.3 642.0 652.9 662.0 668.6 675.3 1.1% Total Trips 1,423.1 1,480.0 1,552.0 1,629.6 1,694.8 1,762.6 1,833.1 4.0% Total Travel Spend 884,210.5 928,421.0 996,333.0 1,063,934.2 1,121,982.4 1,178,530.4 1,237,928.3 5.1% % online 2.8% 3.6% 4.2% 4.7% 5.3% 5.9% 6.3% 9.9% Online Travel Spend 25,100.0 33,500.0 41,900.0 50,300.0 59,465.1 69,533.3 77,989.5 15.6% Average Price Growth 1.0% 2.3% 1.7% 1.4% 1.0% 1.0% Total Trips Growth 4.0% 4.9% 5.0% 4.0% 4.0% 4.0% Total Travel Spend Growth 5.0% 7.3% 6.8% 5.5% 5.0% 5.0% Online Travel Spend Growth 33.5% 25.1% 20.0% 18.2% 16.9% 12.2% Source: JPMorgan estimates, PhoCusWright, eMarketer, Jupiter, and IPK International
Our updated Asian F’08 forecast calls for online travel gross bookings of $43.6B, representing Y/Y growth of 35%. We estimate that Asian online travel gross bookings will grow at a CAGR of approximately 30% through 2010.
Table 31: Asia Online Travel Forecast $ in millions
2004 2005 2006 2007 2008E 2009E 2010E 2007-2010 CAGR
Asia Online Travel Sales
12,100.0 15,900.0 22,300.0 32,300.0 43,600.0 56,600.0 70,800.0 29.6%
Y/Y Growth Rate
31.4% 40.3% 44.8% 35.0% 29.8% 25.1%
Source: JPMorgan estimates, PhoCusWright, eMarketer, and Jupiter
This adds up to an F’08 global online travel forecast of $193.5B, which is a 17% increase from 2007. Our forecasted CAGR through 2008 calls for 15% growth.
Table 32: Global Online Travel Forecast $ in millions
2004 2005 2006 2007 2008E 2009E 2010E 2007-2010 CAGR
US Online Travel Sales
52,400.0 62,800.0 73,400.0 82,600.0 90,449.4 97,229.1 102,949.0 7.5%
Y/Y Growth Rate
19.8% 16.9% 12.5% 9.5% 7.5% 5.9%
Europe Online Travel Sales
25,100.0 33,500.0 41,900.0 50,300.0 59,465.1 69,533.3 77,989.5 15.6%
Y/Y Growth Rate
33.5% 25.1% 20.0% 18.2% 16.9% 12.2%
Asia Online Travel Sales
12,100.0 15,900.0 22,300.0 32,300.0 43,600.0 56,600.0 70,800.0 29.6%
Y/Y Growth Rate
31.4% 40.3% 44.8% 35.0% 29.8% 25.1%
WW Online Travel Market
89,600.0 112,200.0 137,600.0 165,200.0 193,514.4 223,362.3 251,738.5 14.9%
Y/Y Growth Rate
25.2% 22.6% 20.1% 17.1% 15.4% 12.7%
Source: JPMorgan estimates, PhoCusWright, eMarketer, Jupiter, TIA.org, and IPK International
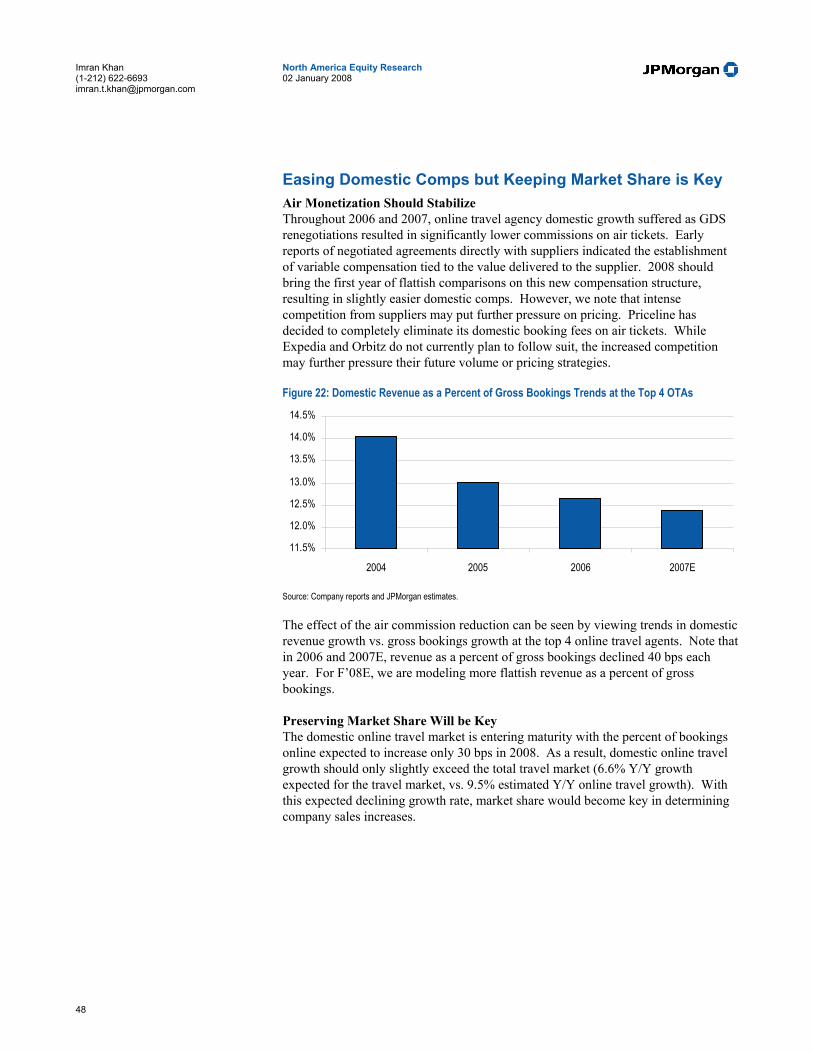
48
North America Equity Research 02 January 2008
Imran Khan (1-212) 622-6693 [email protected]
Easing Domestic Comps but Keeping Market Share is Key Air Monetization Should Stabilize Throughout 2006 and 2007, online travel agency domestic growth suffered as GDS renegotiations resulted in significantly lower commissions on air tickets. Early reports of negotiated agreements directly with suppliers indicated the establishment of variable compensation tied to the value delivered to the supplier. 2008 should bring the first year of flattish comparisons on this new compensation structure, resulting in slightly easier domestic comps. However, we note that intense competition from suppliers may put further pressure on pricing. Priceline has decided to completely eliminate its domestic booking fees on air tickets. While Expedia and Orbitz do not currently plan to follow suit, the increased competition may further pressure their future volume or pricing strategies.
Figure 22: Domestic Revenue as a Percent of Gross Bookings Trends at the Top 4 OTAs
11.5%
12.0%
12.5%
13.0%
13.5%
14.0%
14.5%
2004 2005 2006 2007E
Source: Company reports and JPMorgan estimates. The effect of the air commission reduction can be seen by viewing trends in domestic revenue growth vs. gross bookings growth at the top 4 online travel agents. Note that in 2006 and 2007E, revenue as a percent of gross bookings declined 40 bps each year. For F’08E, we are modeling more flattish revenue as a percent of gross bookings.
Preserving Market Share Will be Key The domestic online travel market is entering maturity with the percent of bookings online expected to increase only 30 bps in 2008. As a result, domestic online travel growth should only slightly exceed the total travel market (6.6% Y/Y growth expected for the travel market, vs. 9.5% estimated Y/Y online travel growth). With this expected declining growth rate, market share would become key in determining company sales increases.
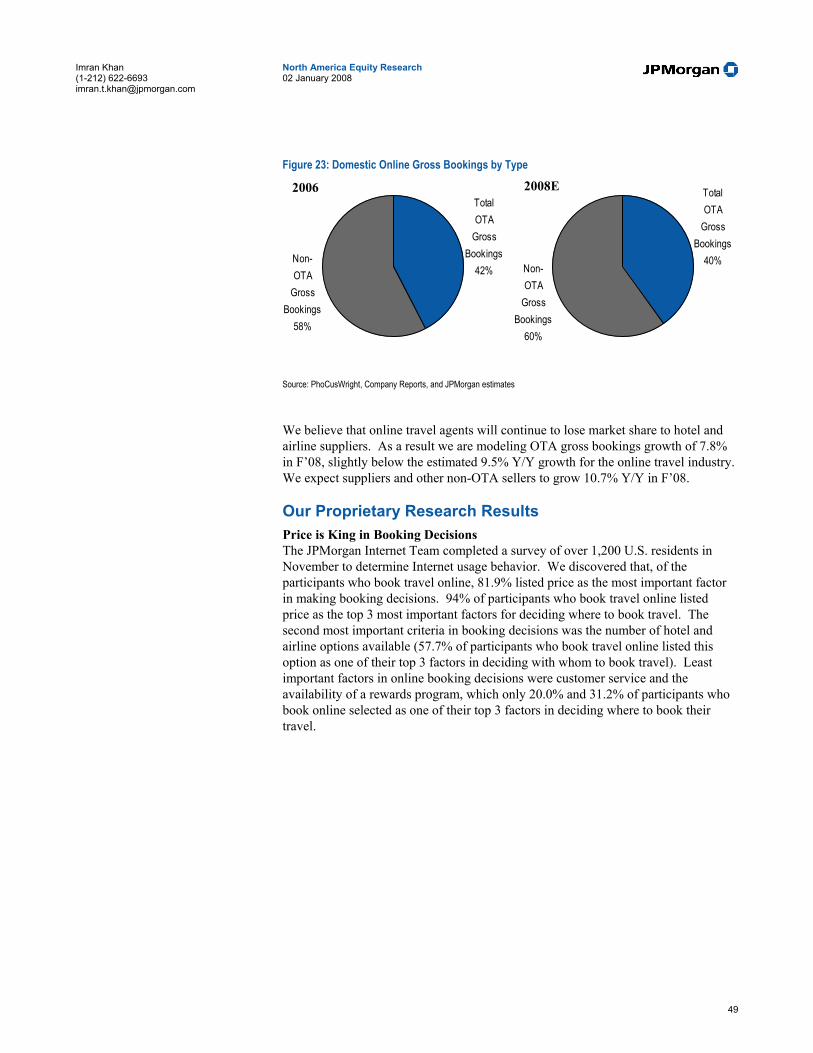
49
North America Equity Research 02 January 2008
Imran Khan (1-212) 622-6693 [email protected]
Figure 23: Domestic Online Gross Bookings by Type
Total OTA
Gross Bookings
42%Non-OTA
Gross Bookings
58%
Total OTA
Gross Bookings
40%Non-OTA
Gross Bookings
60%
Source: PhoCusWright, Company Reports, and JPMorgan estimates
We believe that online travel agents will continue to lose market share to hotel and airline suppliers. As a result we are modeling OTA gross bookings growth of 7.8% in F’08, slightly below the estimated 9.5% Y/Y growth for the online travel industry. We expect suppliers and other non-OTA sellers to grow 10.7% Y/Y in F’08.
Our Proprietary Research Results Price is King in Booking Decisions The JPMorgan Internet Team completed a survey of over 1,200 U.S. residents in November to determine Internet usage behavior. We discovered that, of the participants who book travel online, 81.9% listed price as the most important factor in making booking decisions. 94% of participants who book travel online listed price as the top 3 most important factors for deciding where to book travel. The second most important criteria in booking decisions was the number of hotel and airline options available (57.7% of participants who book travel online listed this option as one of their top 3 factors in deciding with whom to book travel). Least important factors in online booking decisions were customer service and the availability of a rewards program, which only 20.0% and 31.2% of participants who book online selected as one of their top 3 factors in deciding where to book their travel.
2006 2008E
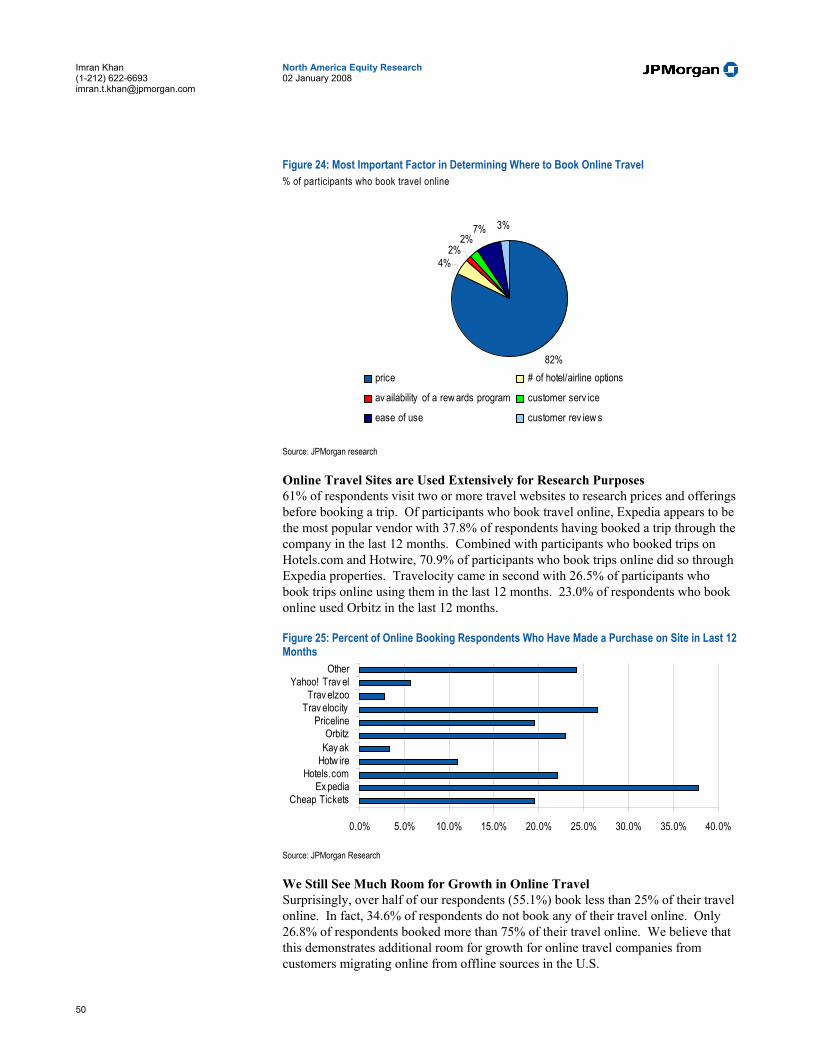
50
North America Equity Research 02 January 2008
Imran Khan (1-212) 622-6693 [email protected]
Figure 24: Most Important Factor in Determining Where to Book Online Travel % of participants who book travel online
82%
7% 3%
2%2%
4%
price # of hotel/airline options
av ailability of a rew ards program customer serv ice
ease of use customer rev iew s
Source: JPMorgan research Online Travel Sites are Used Extensively for Research Purposes 61% of respondents visit two or more travel websites to research prices and offerings before booking a trip. Of participants who book travel online, Expedia appears to be the most popular vendor with 37.8% of respondents having booked a trip through the company in the last 12 months. Combined with participants who booked trips on Hotels.com and Hotwire, 70.9% of participants who book trips online did so through Expedia properties. Travelocity came in second with 26.5% of participants who book trips online using them in the last 12 months. 23.0% of respondents who book online used Orbitz in the last 12 months.
Figure 25: Percent of Online Booking Respondents Who Have Made a Purchase on Site in Last 12 Months
0.0% 5.0% 10.0% 15.0% 20.0% 25.0% 30.0% 35.0% 40.0%
Cheap TicketsEx pedia
Hotels.comHotw ireKay akOrbitz
PricelineTrav elocity
Trav elzooYahoo! Trav el
Other
Source: JPMorgan Research We Still See Much Room for Growth in Online Travel Surprisingly, over half of our respondents (55.1%) book less than 25% of their travel online. In fact, 34.6% of respondents do not book any of their travel online. Only 26.8% of respondents booked more than 75% of their travel online. We believe that this demonstrates additional room for growth for online travel companies from customers migrating online from offline sources in the U.S.

51
North America Equity Research 02 January 2008
Imran Khan (1-212) 622-6693 [email protected]
However, our thesis that suppliers pose a threat to online travel agent market share seems to have been supported by our survey results. Of respondents who book trips online, 39.9% of respondents stated that they preferred to book flights directly from the airline while 45.3% of respondents stated that they preferred to book rooms directly from the hotel of their choice. 25% of respondents booking flights online and 23% of respondents booking hotels online stated that they had no preference in where they booked their trips. Given the stated priorities of our participants, we believe that pricing differences will be a key driver in their decision of where to book their trip. Package offerings do not appear to attract purchases with 38.1% of respondents who book online stating that they prefer to book hotel and air travel separately and 31.9% of respondents have no preference.
International Expansion Integral to OTA Growth We expect this theme from 2007 to continue into 2008. As a result of GDS commission reductions and increased competitive pressure from suppliers on the domestic front, we believe that movement into international markets is critical to the success of OTAs in driving both top-line and bottom-line growth. We believe that international markets yield revenue as a percent of gross bookings margins almost double those of the US because the OTA services are more valued by suppliers abroad who find it difficult to market their inventory in multiple languages across Europe and Asia. Furthermore, we believe that international suppliers are less of a threat to OTAs as they tend to be smaller independent hotels that would have a difficult time achieving the scale necessary to move online booking in house.
Europe is Starting to Mature; Companies Establish an Asia Presence While still a high-growth area, European online bookings growth is beginning to slow as the market enters maturity. For F’08 we are projecting online bookings growth of 18.2% (vs. 20.0% in F'07) due to a 60 bp increase in online vs. offline bookings and a 5.5% increase in total European travel spend. Asia markets have become more attractive to OTAs. We are projecting F'08 Asia online bookings growth of 35% to $43.6B. We expect that many OTAs will grow faster than the market rates as they increase inventory on their sites, expand into new markets, and make strategic international acquisitions.
Figure 26: 2007 Estimated European Market Share
Ex pedia17%
ebookers7%
Lastminute (Trav elocity )
17%Priceline
10%Opodo
9%
Others40%
Source: PhoCusWright, Company Reports, and JPMorgan estimates
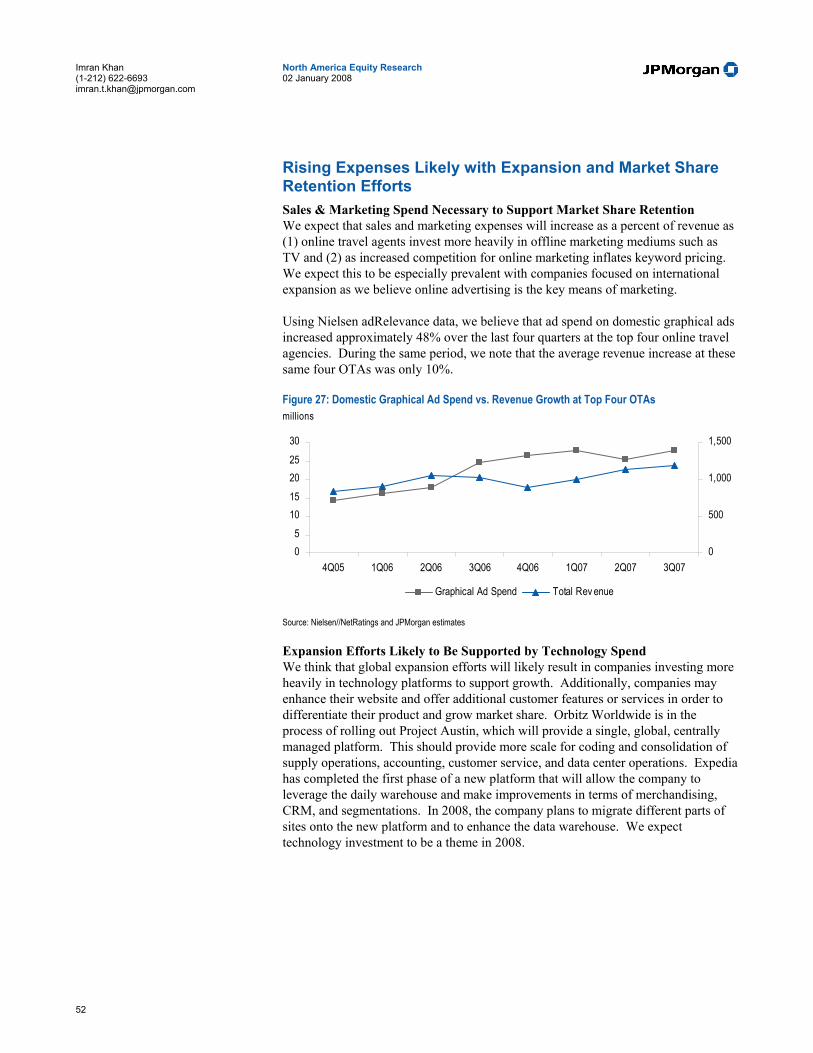
52
North America Equity Research 02 January 2008
Imran Khan (1-212) 622-6693 [email protected]
Rising Expenses Likely with Expansion and Market Share Retention Efforts Sales & Marketing Spend Necessary to Support Market Share Retention We expect that sales and marketing expenses will increase as a percent of revenue as (1) online travel agents invest more heavily in offline marketing mediums such as TV and (2) as increased competition for online marketing inflates keyword pricing. We expect this to be especially prevalent with companies focused on international expansion as we believe online advertising is the key means of marketing.
Using Nielsen adRelevance data, we believe that ad spend on domestic graphical ads increased approximately 48% over the last four quarters at the top four online travel agencies. During the same period, we note that the average revenue increase at these same four OTAs was only 10%.
Figure 27: Domestic Graphical Ad Spend vs. Revenue Growth at Top Four OTAs millions
05
1015202530
4Q05 1Q06 2Q06 3Q06 4Q06 1Q07 2Q07 3Q070
500
1,000
1,500
Graphical Ad Spend Total Rev enue
Source: Nielsen//NetRatings and JPMorgan estimates Expansion Efforts Likely to Be Supported by Technology Spend We think that global expansion efforts will likely result in companies investing more heavily in technology platforms to support growth. Additionally, companies may enhance their website and offer additional customer features or services in order to differentiate their product and grow market share. Orbitz Worldwide is in the process of rolling out Project Austin, which will provide a single, global, centrally managed platform. This should provide more scale for coding and consolidation of supply operations, accounting, customer service, and data center operations. Expedia has completed the first phase of a new platform that will allow the company to leverage the daily warehouse and make improvements in terms of merchandising, CRM, and segmentations. In 2008, the company plans to migrate different parts of sites onto the new platform and to enhance the data warehouse. We expect technology investment to be a theme in 2008.
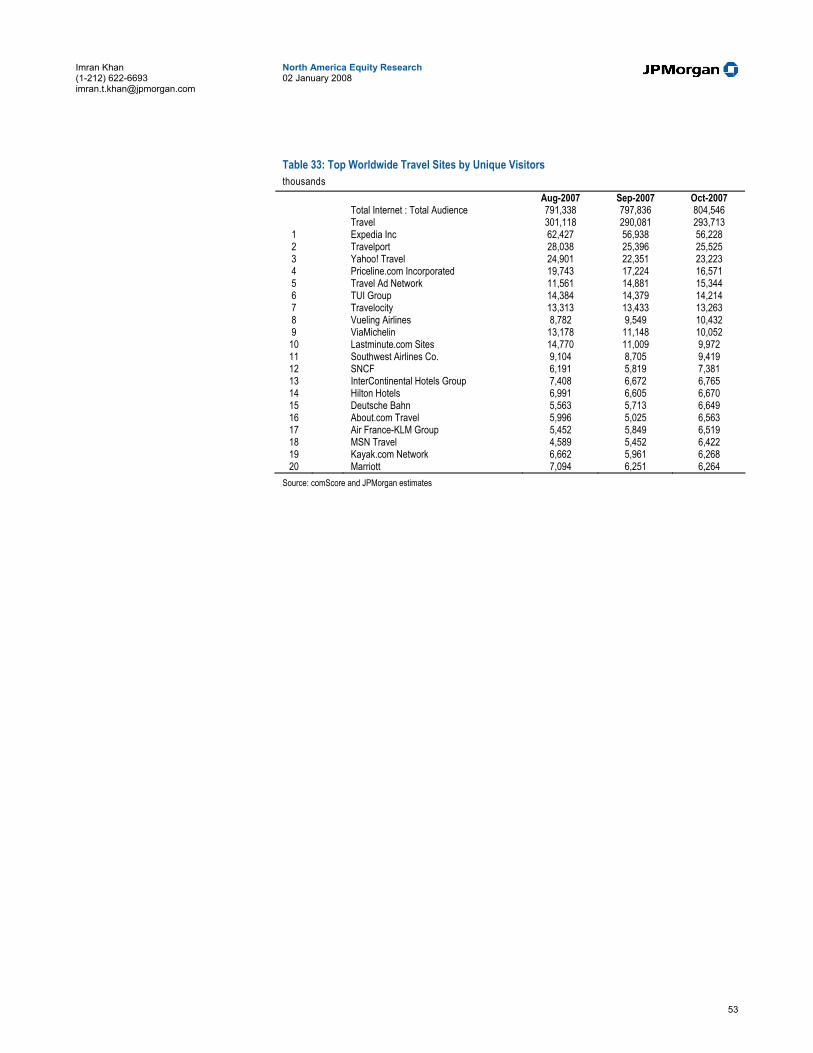
53
North America Equity Research 02 January 2008
Imran Khan (1-212) 622-6693 [email protected]
Table 33: Top Worldwide Travel Sites by Unique Visitors thousands
Aug-2007 Sep-2007 Oct-2007 Total Internet : Total Audience 791,338 797,836 804,546 Travel 301,118 290,081 293,713
1 Expedia Inc 62,427 56,938 56,228 2 Travelport 28,038 25,396 25,525 3 Yahoo! Travel 24,901 22,351 23,223 4 Priceline.com Incorporated 19,743 17,224 16,571 5 Travel Ad Network 11,561 14,881 15,344 6 TUI Group 14,384 14,379 14,214 7 Travelocity 13,313 13,433 13,263 8 Vueling Airlines 8,782 9,549 10,432 9 ViaMichelin 13,178 11,148 10,052 10 Lastminute.com Sites 14,770 11,009 9,972 11 Southwest Airlines Co. 9,104 8,705 9,419 12 SNCF 6,191 5,819 7,381 13 InterContinental Hotels Group 7,408 6,672 6,765 14 Hilton Hotels 6,991 6,605 6,670 15 Deutsche Bahn 5,563 5,713 6,649 16 About.com Travel 5,996 5,025 6,563 17 Air France-KLM Group 5,452 5,849 6,519 18 MSN Travel 4,589 5,452 6,422 19 Kayak.com Network 6,662 5,961 6,268 20 Marriott 7,094 6,251 6,264
Source: comScore and JPMorgan estimates
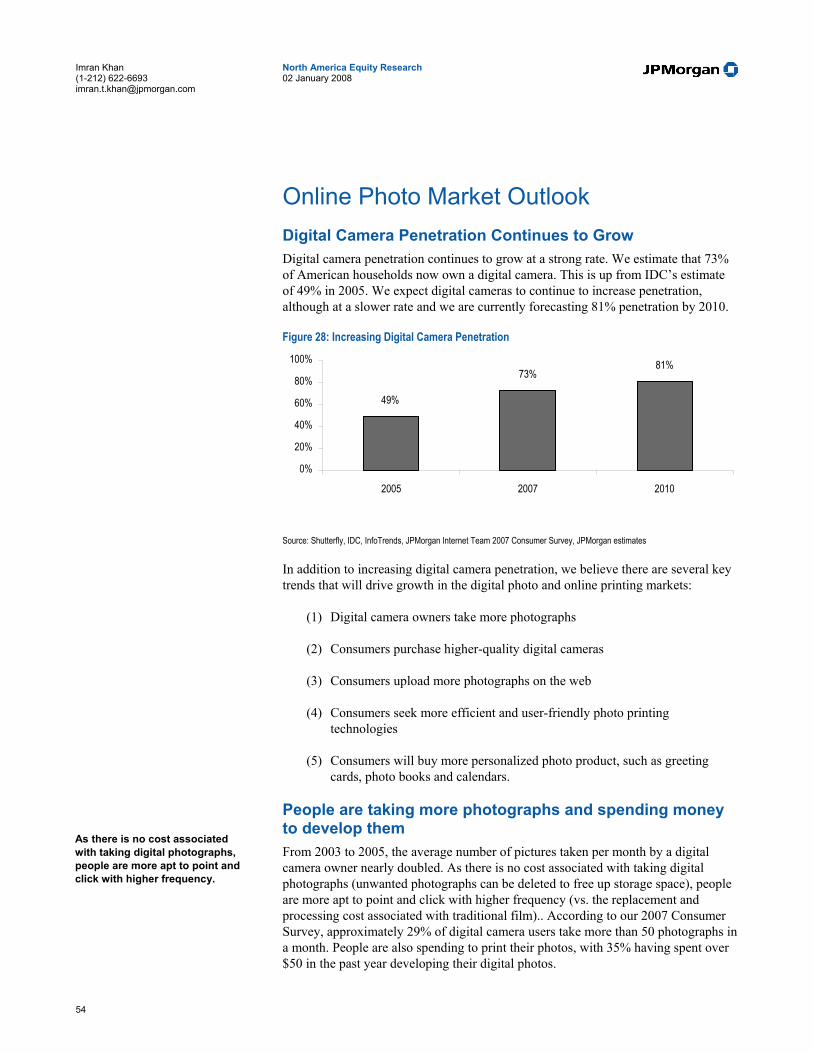
54
North America Equity Research 02 January 2008
Imran Khan (1-212) 622-6693 [email protected]
Online Photo Market Outlook Digital Camera Penetration Continues to Grow Digital camera penetration continues to grow at a strong rate. We estimate that 73% of American households now own a digital camera. This is up from IDC’s estimate of 49% in 2005. We expect digital cameras to continue to increase penetration, although at a slower rate and we are currently forecasting 81% penetration by 2010.
Figure 28: Increasing Digital Camera Penetration
49%
73%81%
0%
20%
40%
60%
80%
100%
2005 2007 2010
Source: Shutterfly, IDC, InfoTrends, JPMorgan Internet Team 2007 Consumer Survey, JPMorgan estimates In addition to increasing digital camera penetration, we believe there are several key trends that will drive growth in the digital photo and online printing markets:
(1) Digital camera owners take more photographs
(2) Consumers purchase higher-quality digital cameras
(3) Consumers upload more photographs on the web
(4) Consumers seek more efficient and user-friendly photo printing technologies
(5) Consumers will buy more personalized photo product, such as greeting cards, photo books and calendars.
People are taking more photographs and spending money to develop them From 2003 to 2005, the average number of pictures taken per month by a digital camera owner nearly doubled. As there is no cost associated with taking digital photographs (unwanted photographs can be deleted to free up storage space), people are more apt to point and click with higher frequency (vs. the replacement and processing cost associated with traditional film).. According to our 2007 Consumer Survey, approximately 29% of digital camera users take more than 50 photographs in a month. People are also spending to print their photos, with 35% having spent over $50 in the past year developing their digital photos.
As there is no cost associated with taking digital photographs, people are more apt to point and click with higher frequency.
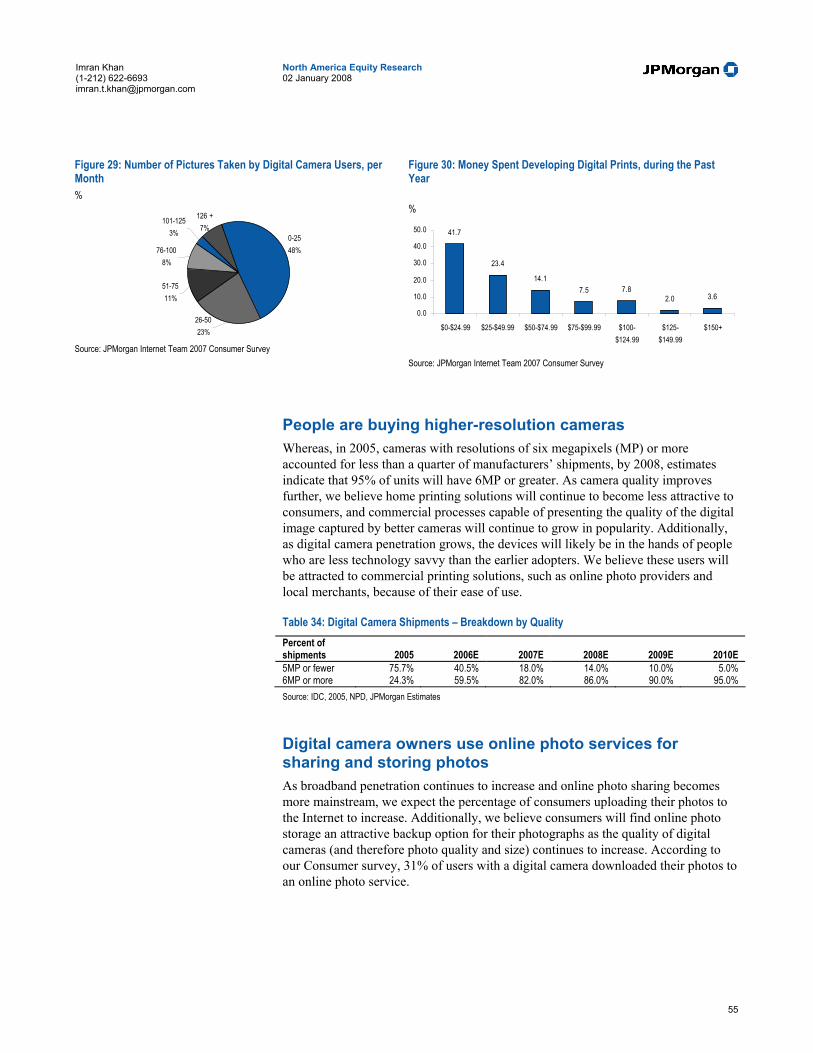
55
North America Equity Research 02 January 2008
Imran Khan (1-212) 622-6693 [email protected]
Figure 29: Number of Pictures Taken by Digital Camera Users, per Month %
0-2548%
51-7511%
26-5023%
76-1008%
101-1253%
126 +7%
Source: JPMorgan Internet Team 2007 Consumer Survey
Figure 30: Money Spent Developing Digital Prints, during the Past Year %
41.7
23.4
14.17.5 7.8
2.0 3.6
0.0
10.0
20.0
30.0
40.0
50.0
$0-$24.99 $25-$49.99 $50-$74.99 $75-$99.99 $100-$124.99
$125-$149.99
$150+
Source: JPMorgan Internet Team 2007 Consumer Survey
People are buying higher-resolution cameras Whereas, in 2005, cameras with resolutions of six megapixels (MP) or more accounted for less than a quarter of manufacturers’ shipments, by 2008, estimates indicate that 95% of units will have 6MP or greater. As camera quality improves further, we believe home printing solutions will continue to become less attractive to consumers, and commercial processes capable of presenting the quality of the digital image captured by better cameras will continue to grow in popularity. Additionally, as digital camera penetration grows, the devices will likely be in the hands of people who are less technology savvy than the earlier adopters. We believe these users will be attracted to commercial printing solutions, such as online photo providers and local merchants, because of their ease of use.
Table 34: Digital Camera Shipments – Breakdown by Quality Percent of shipments 2005 2006E 2007E 2008E 2009E 2010E 5MP or fewer 75.7% 40.5% 18.0% 14.0% 10.0% 5.0% 6MP or more 24.3% 59.5% 82.0% 86.0% 90.0% 95.0% Source: IDC, 2005, NPD, JPMorgan Estimates
Digital camera owners use online photo services for sharing and storing photos As broadband penetration continues to increase and online photo sharing becomes more mainstream, we expect the percentage of consumers uploading their photos to the Internet to increase. Additionally, we believe consumers will find online photo storage an attractive backup option for their photographs as the quality of digital cameras (and therefore photo quality and size) continues to increase. According to our Consumer survey, 31% of users with a digital camera downloaded their photos to an online photo service.
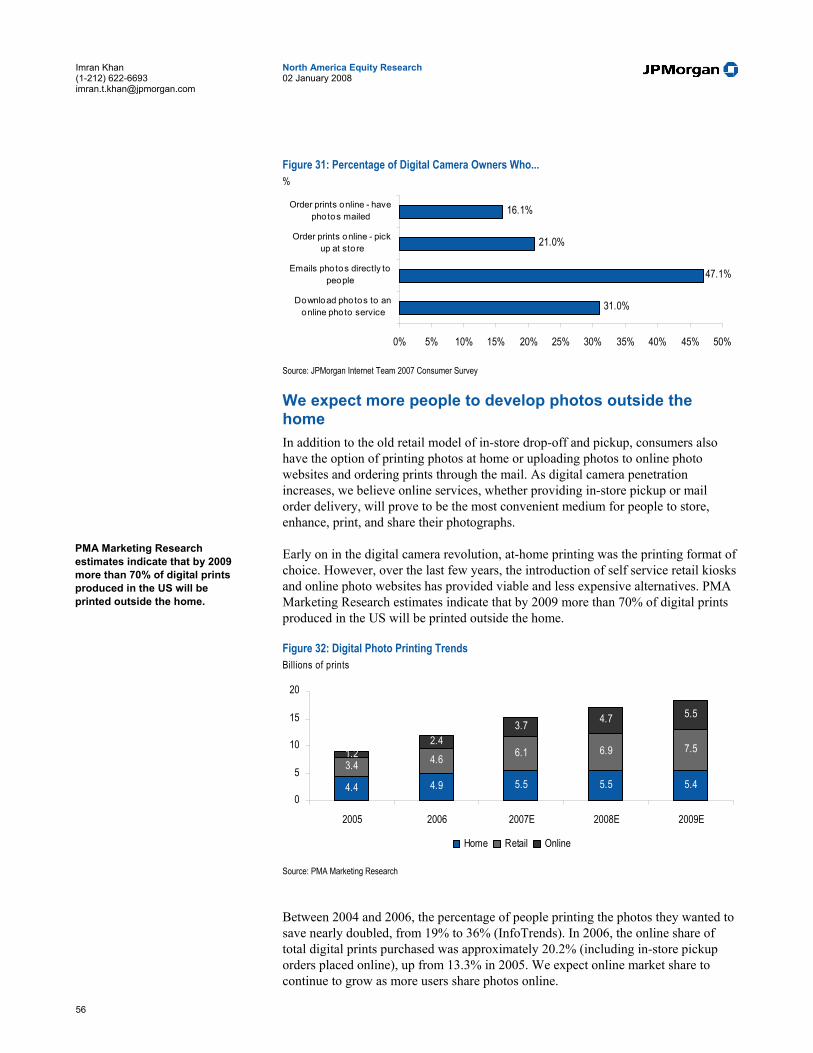
56
North America Equity Research 02 January 2008
Imran Khan (1-212) 622-6693 [email protected]
Figure 31: Percentage of Digital Camera Owners Who... %
31.0%
47.1%
21.0%
16.1%
0% 5% 10% 15% 20% 25% 30% 35% 40% 45% 50%
Download photos to anonline photo service
Emails photos directly topeople
Order prints online - pickup at store
Order prints online - havephotos mailed
Source: JPMorgan Internet Team 2007 Consumer Survey
We expect more people to develop photos outside the home In addition to the old retail model of in-store drop-off and pickup, consumers also have the option of printing photos at home or uploading photos to online photo websites and ordering prints through the mail. As digital camera penetration increases, we believe online services, whether providing in-store pickup or mail order delivery, will prove to be the most convenient medium for people to store, enhance, print, and share their photographs.
Early on in the digital camera revolution, at-home printing was the printing format of choice. However, over the last few years, the introduction of self service retail kiosks and online photo websites has provided viable and less expensive alternatives. PMA Marketing Research estimates indicate that by 2009 more than 70% of digital prints produced in the US will be printed outside the home.
Figure 32: Digital Photo Printing Trends Billions of prints
4.4 4.9 5.5 5.5 5.43.4 4.6 6.1 6.9 7.51.2
2.43.7 4.7 5.5
0
5
10
15
20
2005 2006 2007E 2008E 2009E
Home Retail Online
Source: PMA Marketing Research
Between 2004 and 2006, the percentage of people printing the photos they wanted to save nearly doubled, from 19% to 36% (InfoTrends). In 2006, the online share of total digital prints purchased was approximately 20.2% (including in-store pickup orders placed online), up from 13.3% in 2005. We expect online market share to continue to grow as more users share photos online.
PMA Marketing Research estimates indicate that by 2009 more than 70% of digital prints produced in the US will be printed outside the home.
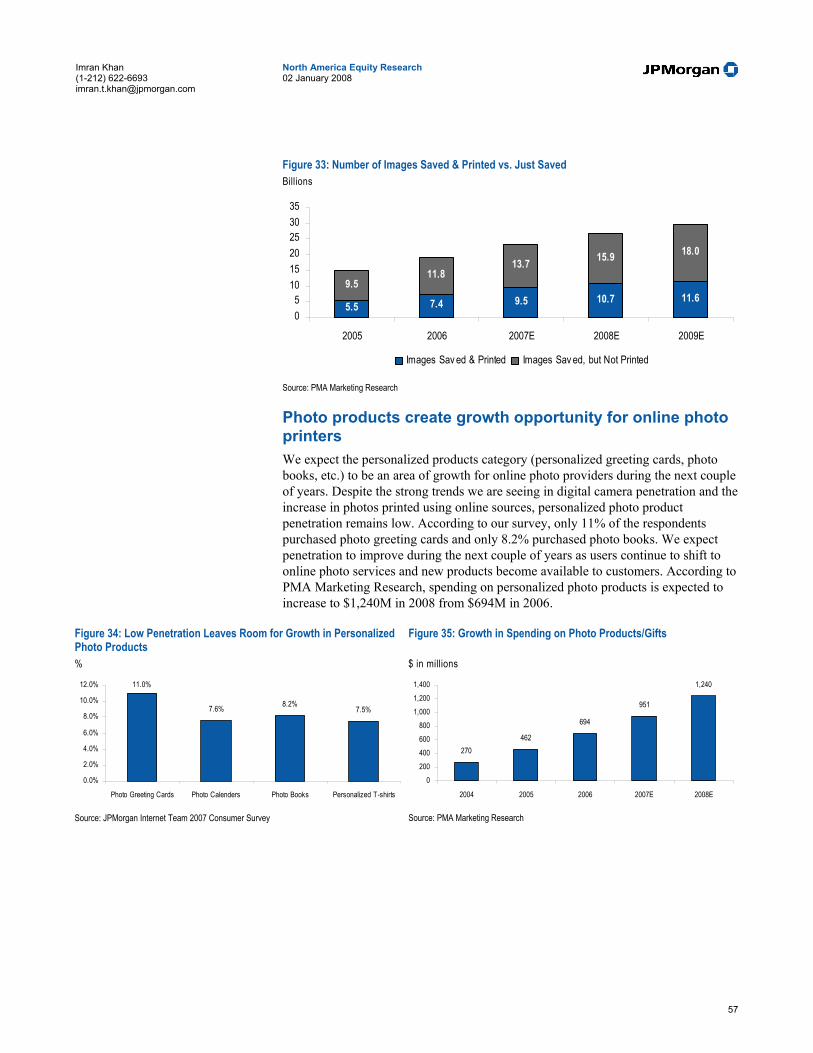
57
North America Equity Research 02 January 2008
Imran Khan (1-212) 622-6693 [email protected]
Figure 33: Number of Images Saved & Printed vs. Just Saved Billions
5.5 7.4 9.5 10.7 11.69.5
11.813.7 15.9 18.0
05
101520253035
2005 2006 2007E 2008E 2009E
Images Sav ed & Printed Images Sav ed, but Not Printed
Source: PMA Marketing Research
Photo products create growth opportunity for online photo printers We expect the personalized products category (personalized greeting cards, photo books, etc.) to be an area of growth for online photo providers during the next couple of years. Despite the strong trends we are seeing in digital camera penetration and the increase in photos printed using online sources, personalized photo product penetration remains low. According to our survey, only 11% of the respondents purchased photo greeting cards and only 8.2% purchased photo books. We expect penetration to improve during the next couple of years as users continue to shift to online photo services and new products become available to customers. According to PMA Marketing Research, spending on personalized photo products is expected to increase to $1,240M in 2008 from $694M in 2006.
Figure 34: Low Penetration Leaves Room for Growth in Personalized Photo Products %
11.0%
7.6% 8.2%7.5%
0.0%
2.0%
4.0%
6.0%
8.0%
10.0%
12.0%
Photo Greeting Cards Photo Calenders Photo Books Personalized T-shirts
Source: JPMorgan Internet Team 2007 Consumer Survey
Figure 35: Growth in Spending on Photo Products/Gifts $ in millions
270462
694
951
1,240
0200400600800
1,0001,2001,400
2004 2005 2006 2007E 2008E
Source: PMA Marketing Research
58
North America Equity Research 02 January 2008
Imran Khan (1-212) 622-6693 [email protected]
2008 Online Payment Outlook 2007 proved to be a strong year for online payment platforms. PayPal saw third-quarter growth accelerate as the Merchant processing business saw particularly strong growth, Amazon entered the payment foray with its Amazon Payment offering and Google Checkout is still viable. Revolution Money is trying to revolutionize money management with its new money transfer service and credit card offering. In Latin America, Mercadolibre has seen strong growth in its payment business and is rolling out direct payment features starting in Chile. We expect trends to remain strong in 2008 helped by:
• Continued strength in global e-commerce growth, helped by increased global broadband penetration.
• The growing acceptance of payment solutions on third-party platforms, including travel sites.
• Increased P2P money transfers, driven by the growing remittance market and increased micro-lending.
• Increased use of mobile money transfer platforms should help drive revenues for those with a presence in the market, such as PayPal and Amazon Payment (through its relationship with Textpayme).
• Increased fee generation as platforms look at adding deferred payment plan options, which are particularly attractive in developing markets.
Key Highlights from 2007 This past year was a successful one for online payment companies. Both PayPal, which benefited from strength in its Merchants business, and MercadoPago, Mercadolibre’s Latin America Payment platform, saw growth accelerate in the third quarter of 2007. Some key events in 2007:
• PayPal launched a toolbar features that allows users to shop at any site that accepts MasterCard. The toolbar automatically populates the credit card information with a randomly generated credit card number.
• Amazon launched its Amazon Payment service and now requires all third-party sellers on its Marketplace and Auction platforms to offer it as a payment option.
• Steve Case entered the online payment business helping to fund Revolution Money, an online payment portal and credit card company.
• MercadoPago launched a direct payment version and began offering services to third-party sellers, beginning with a roll-out in Chili.
• Alipay began offering Chinese shoppers the ability to purchase merchandise from overseas web sites.
Global e-commerce growth expected to remain strong We expect online payment portals to benefit from strong e-commerce growth in 2008 in both the U.S. and global markets. While we expect the overall retail environment

59
North America Equity Research 02 January 2008
Imran Khan (1-212) 622-6693 [email protected]
in the U.S. to remain weak, we expect online retailers to benefit from the continued shift of retail dollars online, driven by (1) increases in product selection, (2) continued Y/Y online sales improvements for brick-and-mortar retailers and (3) further improved efficiencies from site optimization. Our international forecast is driven by (1) continued rises in online shopping penetration, especially Western Europe, (2) continued investments by online retailers in broadening selection, (3) improvements in shipping infrastructure, (4) improved payment systems and (5) better fraud protection.
Table 35: JPMorgan Global E-commerce Projections $ in millions Global eCommerce Forecast 2004 2005 2006 2007E 2008E 2009E 2010E '07 - '10 CAGR US 94,581 114,991 139,384 164,431 193,502 227,321 266,808 17.5% Europe 85,827 112,139 139,126 179,226 224,911 257,748 289,966 17.4% Asia 29,538 39,685 50,556 63,340 77,899 94,686 114,673 21.9% ROW 9,440 13,216 18,502 25,903 36,265 47,144 61,287 33.3% Total 219,385 280,031 347,568 432,900 532,577 626,899 732,735 19.2% Source: JPMorgan estimates.
Global remittance market is expected to grow 10.9% in 2008 Celent estimates that over $311B in 2007 was transferred in the global remittance market, and global remittance is expected to grow at a 10.2% CAGR between 2000 and 2008. The mobile global population and the desire to send money back to family have led to the strong growth in remittance. The United Nation estimates that about 3% of the world's population, or roughly 175M people, is migrant, with the stock of immigrants to high-income countries growing at 3% per annum between 1980 and 2000.
With about 31% of the population in developing countries under the age of 14, vs. 14% in developed countries, global migration is expected to remain robust. The World Bank highlights two drivers behind the expected strong migration trends through 2025. They include:
1. The labor force in high-income countries is expected to decline. The World Bank expects the labor force in high-income countries to peak near 500M in 2010, then fall to 475M by 2025. This would lead to 100 workers supporting 111 dependents, compared to less than 100 today. As a result, there would be greater demand for workers in the labor force.
2. Developing countries can supply the needed labor. With a large population under the age of 14, and higher birth rates, the developing world is expected to supply 1B workers by 2025, many of whom would migrate to higher-income countries to meet their labor demands.
These workers likely would continue to send money back to their country of origin. According to the World Bank's base-case scenario, new migrant workers could earn as much as $481B more in real (after-tax) income in high-income countries than they would have if they stayed in the developing countries. A large portion of this excess wealth would likely find its way back to the migrant worker's country of origin through remittance channels.

60
North America Equity Research 02 January 2008
Imran Khan (1-212) 622-6693 [email protected]
Figure 36: Global Remittance Receive Trends $ in billions
159 167 183213 233
256281
311345
050
100150200250300350400
2000 2001 2002 2003 2004 2005E 2006E 2007E 2008E
Source: Celent
PayPal Remains the Dominant Player According to our proprietary survey, 55% of online shoppers use PayPal, compared to 6% who use Google Checkout and 7% who use Amazon Payment. While the sample is small, 57% of those who used all three payment services preferred PayPal. Credit cards remain the preferred method for online shoppers with 83% stating that they use credit cards to make online purchases.
Table 36: Preferred Online Payment Providers for Users of PayPal, Google Checkout and Amazon Payments
Preferred Service Services Used
Number of Respondents
PayPal
GOOG Checkout
AMZN Payments
Other
PayPal, Checkout & Payments 16 9 2 3 2 PayPal and Checkout 21 16 4 - 1 PayPal and Payments 39 30 - 8 1 Checkout & Payments 2 - - 2 - Source: JPMorgan Internet Team 2007 Consumer Survey Note: Survey of 1,261 Internet Users
Figure 37: Payments Methods Used by Online Shoppers % of respondents who stated they shop online
83.5%
54.8%
6.2% 7.0% 5.8%
0.0%
20.0%
40.0%
60.0%
80.0%
100.0%
Credit Card Pay Pal Google Checkout Amazon Pay ment Other
Source: JPMorgan Internet Team 2007 Consumer Survey
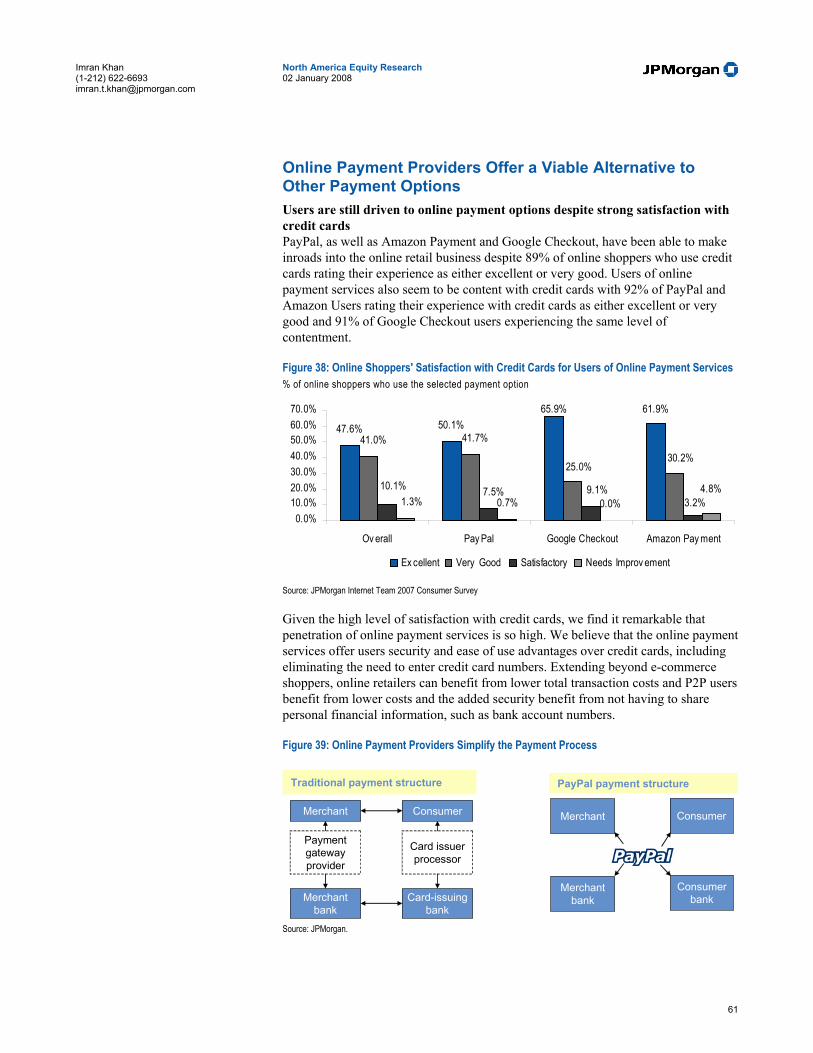
61
North America Equity Research 02 January 2008
Imran Khan (1-212) 622-6693 [email protected]
Online Payment Providers Offer a Viable Alternative to Other Payment Options Users are still driven to online payment options despite strong satisfaction with credit cards PayPal, as well as Amazon Payment and Google Checkout, have been able to make inroads into the online retail business despite 89% of online shoppers who use credit cards rating their experience as either excellent or very good. Users of online payment services also seem to be content with credit cards with 92% of PayPal and Amazon Users rating their experience with credit cards as either excellent or very good and 91% of Google Checkout users experiencing the same level of contentment.
Figure 38: Online Shoppers' Satisfaction with Credit Cards for Users of Online Payment Services % of online shoppers who use the selected payment option
47.6% 50.1%65.9% 61.9%
0.7% 0.0%
25.0%30.2%
41.7%41.0%
10.1%3.2%
9.1%7.5%1.3%
4.8%
0.0%10.0%20.0%30.0%40.0%50.0%60.0%70.0%
Ov erall Pay Pal Google Checkout Amazon Pay ment
Ex cellent Very Good Satisfactory Needs Improv ement
Source: JPMorgan Internet Team 2007 Consumer Survey Given the high level of satisfaction with credit cards, we find it remarkable that penetration of online payment services is so high. We believe that the online payment services offer users security and ease of use advantages over credit cards, including eliminating the need to enter credit card numbers. Extending beyond e-commerce shoppers, online retailers can benefit from lower total transaction costs and P2P users benefit from lower costs and the added security benefit from not having to share personal financial information, such as bank account numbers.
Figure 39: Online Payment Providers Simplify the Payment Process
Traditional payment structure
Merchant Consumer
Payment gateway provider
Card issuer processor
Merchantbank
Card-issuing bank
PayPal payment structure
Merchant Consumer
Merchantbank
Consumerbank
Source: JPMorgan.
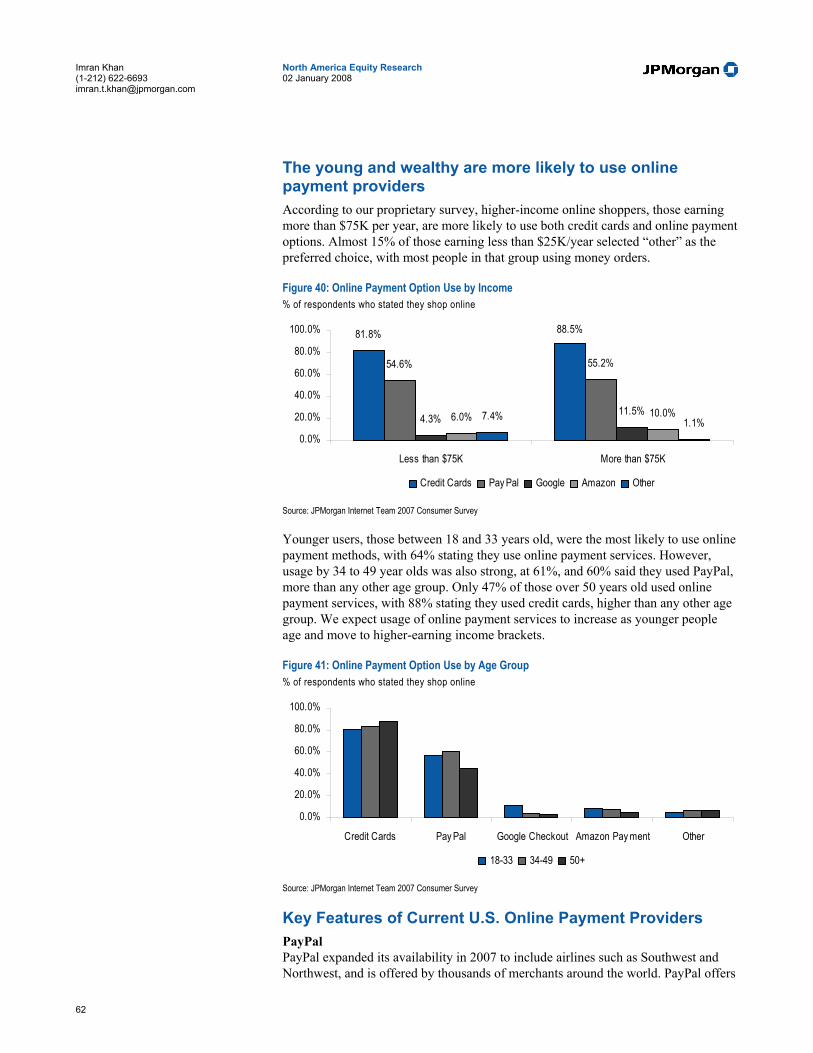
62
North America Equity Research 02 January 2008
Imran Khan (1-212) 622-6693 [email protected]
The young and wealthy are more likely to use online payment providers According to our proprietary survey, higher-income online shoppers, those earning more than $75K per year, are more likely to use both credit cards and online payment options. Almost 15% of those earning less than $25K/year selected “other” as the preferred choice, with most people in that group using money orders.
Figure 40: Online Payment Option Use by Income % of respondents who stated they shop online
81.8% 88.5%
54.6% 55.2%
4.3%11.5%6.0% 10.0%7.4% 1.1%
0.0%
20.0%
40.0%
60.0%
80.0%
100.0%
Less than $75K More than $75K
Credit Cards Pay Pal Google Amazon Other
Source: JPMorgan Internet Team 2007 Consumer Survey Younger users, those between 18 and 33 years old, were the most likely to use online payment methods, with 64% stating they use online payment services. However, usage by 34 to 49 year olds was also strong, at 61%, and 60% said they used PayPal, more than any other age group. Only 47% of those over 50 years old used online payment services, with 88% stating they used credit cards, higher than any other age group. We expect usage of online payment services to increase as younger people age and move to higher-earning income brackets.
Figure 41: Online Payment Option Use by Age Group % of respondents who stated they shop online
0.0%
20.0%
40.0%
60.0%
80.0%
100.0%
Credit Cards Pay Pal Google Checkout Amazon Pay ment Other
18-33 34-49 50+
Source: JPMorgan Internet Team 2007 Consumer Survey
Key Features of Current U.S. Online Payment Providers PayPal PayPal expanded its availability in 2007 to include airlines such as Southwest and Northwest, and is offered by thousands of merchants around the world. PayPal offers

63
North America Equity Research 02 January 2008
Imran Khan (1-212) 622-6693 [email protected]
a money market account for deposits, financing options and P2P money transfers. While a majority of PayPal's volume still takes place on eBay's site, its Merchant business is growing at a faster rate. We expect 2008 to be another strong year for PayPal as it grows its international and Merchants business and are forecasting transaction volume to increase 24.2% Y/Y to $61.36B.
Table 37: PayPal Fee Structure Description Personal Account Premier/Business Account
Fee for a buyer to make a purchase Free
Fees for specific actions Open an Account Free Free Send Money Free Free Withdraw Funds Free for bank accounts in the US Free for bank accounts in the
US
Add Funds Free Free Receive payments funded by PayPal Balance, PayPal Instant Transfer or PayPal eCheck
Free 1.9% to 2.9% + $0.30 USD
Receive payments funded by Credit Card, Debit Card or Buyer Credit
4.9% + $0.30 USD (limit of 5 transactions per 12 month period) for domestic or U.S. transactions
1.9% to 2.9% + $0.30 USD
2% + applicable Fees for cross
border payments
4.9% plus $0.30 USD for card
payments received using PayPal on Skype
Multiple Currency Transactions Exchange rate includes a 2.5% fee Exchange rate includes a 2.5% fee
Source: www.paypal.com Amazon Payments Amazon rolled out its Amazon Payments Service in 2007 and now requires all third-party sellers on its Marketplace and Auctions platform to offer it as a payment option. Amazon Payments offers P2P money transfer options and has teamed up with Textpayme to offer mobile services. Amazon Payments is also integrated with Amazon Web Services to help developers create e-commerce sites.
Table 38: Amazon Payments Fees Fees to send payments Fees Sending Payments No fees
Fees to receive payments (by
payment method) less than $0.05 $0.05 to $9.99 $10.00 and more
Bank Account 2% of T V + $0.05 2% of T V + $0.05 2% of T V + $0.05 Credit Card 5% of T V + $0.05 5% of T V + $0.05 2.9% of T V + $0.30 International Credit Card 6% of T V + $0.05 6% of T V + $0.05 3.9% of T V + $0.30 Amazon Payments stored funds
20% of T V, minimum fee of $0.0025
1.5% of T V + $0.01
1.5% of T V + $0.01
Source: payments.amazon.com Google Checkout Google Checkout is now available on hundreds of Internet retail sites. Google Adwords advertisers are offered discounted processing rates. Google Checkout does not currently offer P2P money transfer services.
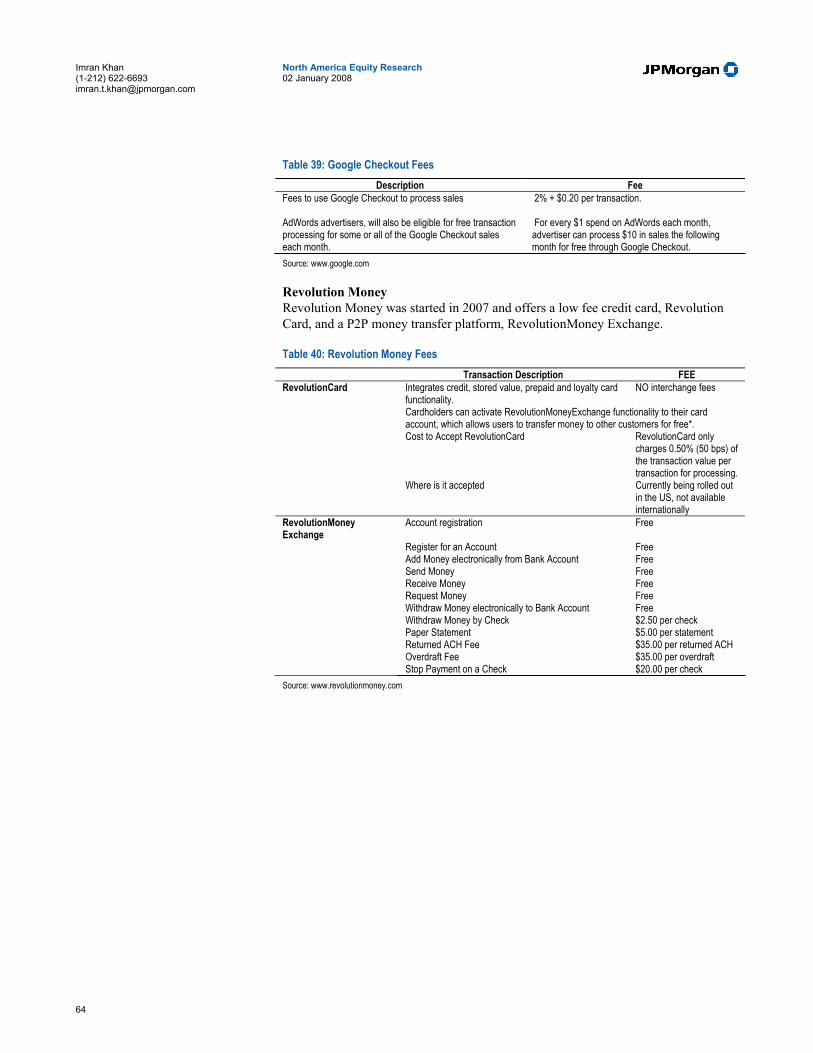
64
North America Equity Research 02 January 2008
Imran Khan (1-212) 622-6693 [email protected]
Table 39: Google Checkout Fees Description Fee
Fees to use Google Checkout to process sales 2% + $0.20 per transaction.
AdWords advertisers, will also be eligible for free transaction processing for some or all of the Google Checkout sales each month.
For every $1 spend on AdWords each month, advertiser can process $10 in sales the following month for free through Google Checkout.
Source: www.google.com Revolution Money Revolution Money was started in 2007 and offers a low fee credit card, Revolution Card, and a P2P money transfer platform, RevolutionMoney Exchange.
Table 40: Revolution Money Fees Transaction Description FEE RevolutionCard Integrates credit, stored value, prepaid and loyalty card
functionality. NO interchange fees
Cardholders can activate RevolutionMoneyExchange functionality to their card account, which allows users to transfer money to other customers for free*.
Cost to Accept RevolutionCard RevolutionCard only charges 0.50% (50 bps) of the transaction value per transaction for processing.
Where is it accepted Currently being rolled out in the US, not available internationally
RevolutionMoney Exchange
Account registration Free
Register for an Account Free Add Money electronically from Bank Account Free Send Money Free Receive Money Free Request Money Free Withdraw Money electronically to Bank Account Free Withdraw Money by Check $2.50 per check Paper Statement $5.00 per statement Returned ACH Fee $35.00 per returned ACH Overdraft Fee $35.00 per overdraft Stop Payment on a Check $20.00 per check
Source: www.revolutionmoney.com
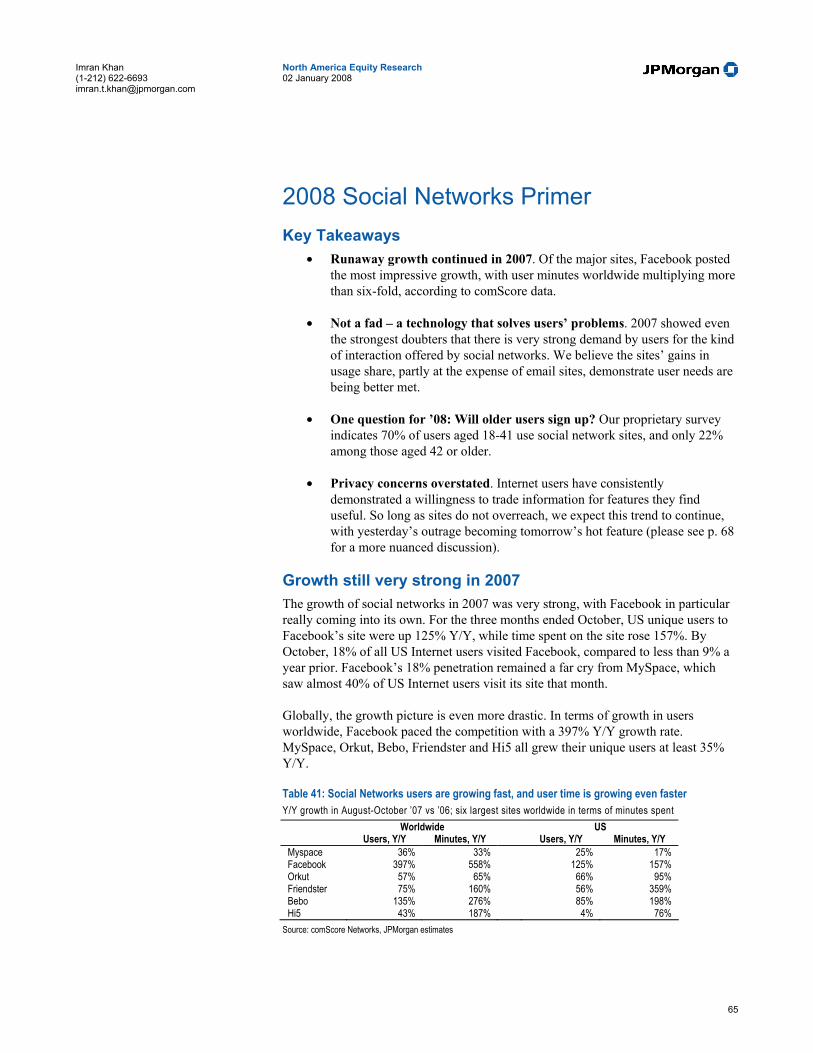
65
North America Equity Research 02 January 2008
Imran Khan (1-212) 622-6693 [email protected]
2008 Social Networks Primer Key Takeaways
• Runaway growth continued in 2007. Of the major sites, Facebook posted the most impressive growth, with user minutes worldwide multiplying more than six-fold, according to comScore data.
• Not a fad – a technology that solves users’ problems. 2007 showed even the strongest doubters that there is very strong demand by users for the kind of interaction offered by social networks. We believe the sites’ gains in usage share, partly at the expense of email sites, demonstrate user needs are being better met.
• One question for ’08: Will older users sign up? Our proprietary survey indicates 70% of users aged 18-41 use social network sites, and only 22% among those aged 42 or older.
• Privacy concerns overstated. Internet users have consistently demonstrated a willingness to trade information for features they find useful. So long as sites do not overreach, we expect this trend to continue, with yesterday’s outrage becoming tomorrow’s hot feature (please see p. 68 for a more nuanced discussion).
Growth still very strong in 2007 The growth of social networks in 2007 was very strong, with Facebook in particular really coming into its own. For the three months ended October, US unique users to Facebook’s site were up 125% Y/Y, while time spent on the site rose 157%. By October, 18% of all US Internet users visited Facebook, compared to less than 9% a year prior. Facebook’s 18% penetration remained a far cry from MySpace, which saw almost 40% of US Internet users visit its site that month.
Globally, the growth picture is even more drastic. In terms of growth in users worldwide, Facebook paced the competition with a 397% Y/Y growth rate. MySpace, Orkut, Bebo, Friendster and Hi5 all grew their unique users at least 35% Y/Y.
Table 41: Social Networks users are growing fast, and user time is growing even faster Y/Y growth in August-October ’07 vs ’06; six largest sites worldwide in terms of minutes spent
Worldwide US Users, Y/Y Minutes, Y/Y Users, Y/Y Minutes, Y/Y
Myspace 36% 33% 25% 17% Facebook 397% 558% 125% 157% Orkut 57% 65% 66% 95% Friendster 75% 160% 56% 359% Bebo 135% 276% 85% 198% Hi5 43% 187% 4% 76%
Source: comScore Networks, JPMorgan estimates

66
North America Equity Research 02 January 2008
Imran Khan (1-212) 622-6693 [email protected]
Meet the big six Based on minutes spent in the second half of the year (as measured by comScore), the following six sites are the largest social networking sites in the world:
• MySpace. Launched August 2003, the site was acquired by News Corporation in July 2005. MySpace’s user base tends to tilt somewhat toward teens, and is more US-based than the audience for any of the other big six. Also popular with musicians and bands.
• Facebook. Launched February 2004, the site remains independent but in October 2007, drew a $240M investment from Microsoft, which acquired a 1.6% equity stake. Microsoft also sells ads on Facebook. The site became open to non-academic users in September 2006.
• Orkut. Launched by Google in January 2004. The site has not taken off significantly in the US, but is quite popular in Brazil as well as India and Pakistan.
• Friendster. Launched March 2003. In the US, the site has faded somewhat after being an early leader in the space, but it remains quite popular in Southeast Asia.
• Bebo. Launched January 2005. The site is popular in the UK and other English-speaking countries, including Ireland, as well as in Poland. In 4Q’07, announced a partnership with AOL for integration of instant-messenger software.
• Hi5. Launched 2003. The site, though based out of the San Francisco Bay Area, maintains a base of popularity in Latin America, as well as some Asian countries.
Technology that fits a customer need We think much of the success of social networks is attributable, at heart, to the fact that they provide a superior technology for filling users’ social needs more efficiently. In our 2007 Consumer survey, over 80% of social network users indicated that they use the sites to keep in touch with friends.
Table 42: Users overwhelmingly lean on social networks to keep in touch % among users of social network sites; respondents could choose multiple answers Function % choosing Keep in touch with friends 80.1% Reconnect with old friends 47.7% Share photographs 36.8% Meet new people with similar interests 34.7% Share Music/Find new music 17.8% To plan social events 17.5% Play games 11.6% Career networking 9.0% Source: JPMorgan Internet Team 2007 Consumer Survey When it comes to filling this user need, we believe social networks have two key competitive advantages over alternative methods of keeping in touch:
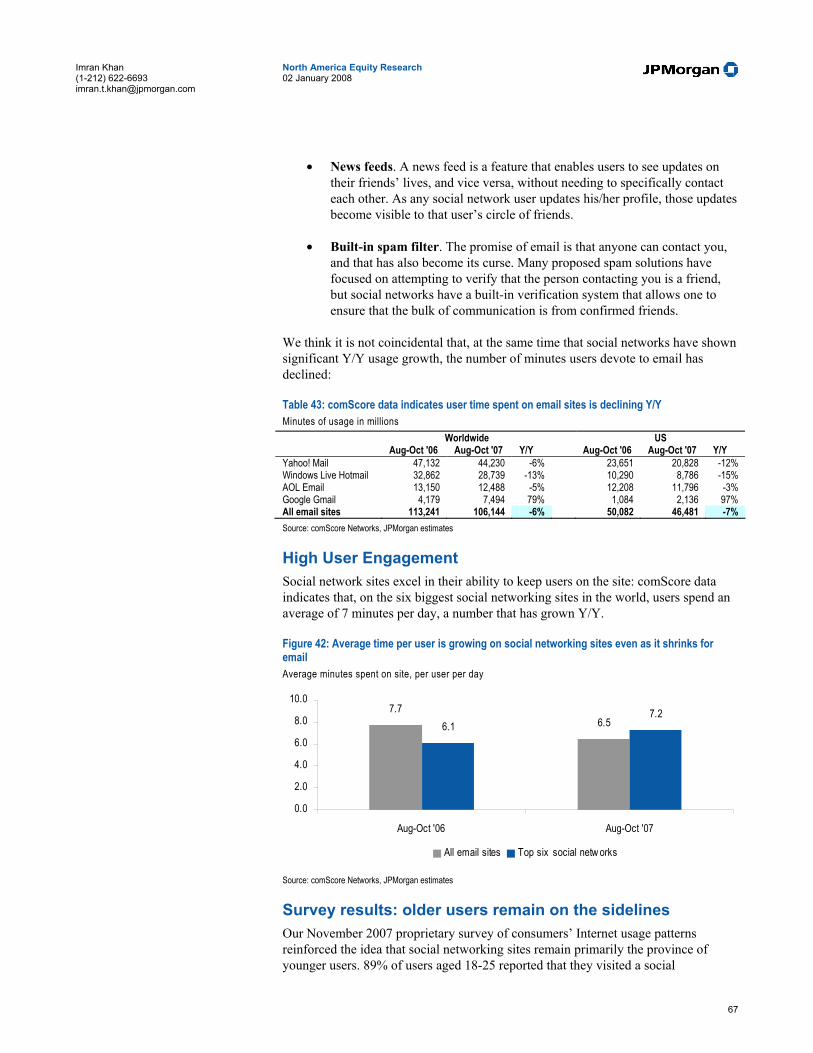
67
North America Equity Research 02 January 2008
Imran Khan (1-212) 622-6693 [email protected]
• News feeds. A news feed is a feature that enables users to see updates on their friends’ lives, and vice versa, without needing to specifically contact each other. As any social network user updates his/her profile, those updates become visible to that user’s circle of friends.
• Built-in spam filter. The promise of email is that anyone can contact you, and that has also become its curse. Many proposed spam solutions have focused on attempting to verify that the person contacting you is a friend, but social networks have a built-in verification system that allows one to ensure that the bulk of communication is from confirmed friends.
We think it is not coincidental that, at the same time that social networks have shown significant Y/Y usage growth, the number of minutes users devote to email has declined:
Table 43: comScore data indicates user time spent on email sites is declining Y/Y Minutes of usage in millions
Worldwide US Aug-Oct '06 Aug-Oct '07 Y/Y Aug-Oct '06 Aug-Oct '07 Y/Y
Yahoo! Mail 47,132 44,230 -6% 23,651 20,828 -12% Windows Live Hotmail 32,862 28,739 -13% 10,290 8,786 -15% AOL Email 13,150 12,488 -5% 12,208 11,796 -3% Google Gmail 4,179 7,494 79% 1,084 2,136 97% All email sites 113,241 106,144 -6% 50,082 46,481 -7% Source: comScore Networks, JPMorgan estimates
High User Engagement Social network sites excel in their ability to keep users on the site: comScore data indicates that, on the six biggest social networking sites in the world, users spend an average of 7 minutes per day, a number that has grown Y/Y.
Figure 42: Average time per user is growing on social networking sites even as it shrinks for email Average minutes spent on site, per user per day
7.76.56.1
7.2
0.0
2.0
4.0
6.0
8.0
10.0
Aug-Oct '06 Aug-Oct '07
All email sites Top six social netw orks
Source: comScore Networks, JPMorgan estimates
Survey results: older users remain on the sidelines Our November 2007 proprietary survey of consumers’ Internet usage patterns reinforced the idea that social networking sites remain primarily the province of younger users. 89% of users aged 18-25 reported that they visited a social
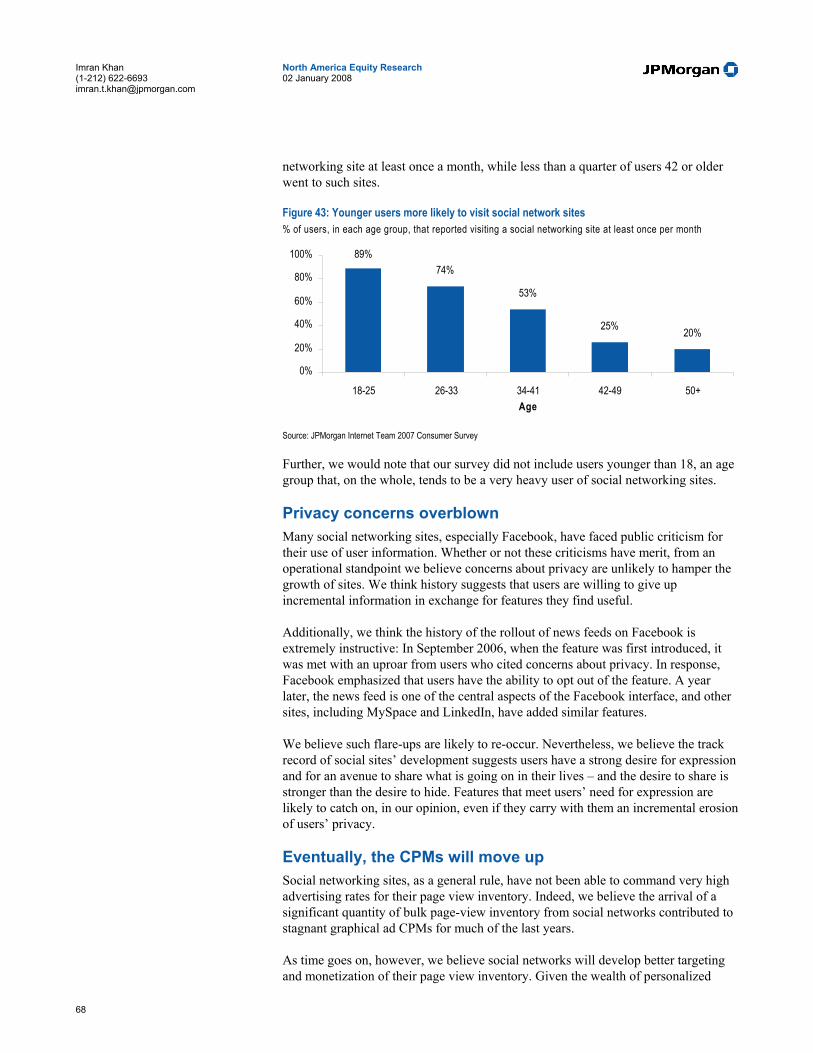
68
North America Equity Research 02 January 2008
Imran Khan (1-212) 622-6693 [email protected]
networking site at least once a month, while less than a quarter of users 42 or older went to such sites.
Figure 43: Younger users more likely to visit social network sites % of users, in each age group, that reported visiting a social networking site at least once per month
89%74%
53%
25% 20%
0%
20%
40%
60%
80%
100%
18-25 26-33 34-41 42-49 50+Age
Source: JPMorgan Internet Team 2007 Consumer Survey Further, we would note that our survey did not include users younger than 18, an age group that, on the whole, tends to be a very heavy user of social networking sites.
Privacy concerns overblown Many social networking sites, especially Facebook, have faced public criticism for their use of user information. Whether or not these criticisms have merit, from an operational standpoint we believe concerns about privacy are unlikely to hamper the growth of sites. We think history suggests that users are willing to give up incremental information in exchange for features they find useful.
Additionally, we think the history of the rollout of news feeds on Facebook is extremely instructive: In September 2006, when the feature was first introduced, it was met with an uproar from users who cited concerns about privacy. In response, Facebook emphasized that users have the ability to opt out of the feature. A year later, the news feed is one of the central aspects of the Facebook interface, and other sites, including MySpace and LinkedIn, have added similar features.
We believe such flare-ups are likely to re-occur. Nevertheless, we believe the track record of social sites’ development suggests users have a strong desire for expression and for an avenue to share what is going on in their lives – and the desire to share is stronger than the desire to hide. Features that meet users’ need for expression are likely to catch on, in our opinion, even if they carry with them an incremental erosion of users’ privacy.
Eventually, the CPMs will move up Social networking sites, as a general rule, have not been able to command very high advertising rates for their page view inventory. Indeed, we believe the arrival of a significant quantity of bulk page-view inventory from social networks contributed to stagnant graphical ad CPMs for much of the last years.
As time goes on, however, we believe social networks will develop better targeting and monetization of their page view inventory. Given the wealth of personalized

69
North America Equity Research 02 January 2008
Imran Khan (1-212) 622-6693 [email protected]
information available to the sites, there are powerful avenues for improved monetization, although the technology remains fairly nascent.
Large Internet and media companies have not been shy about making their presence felt in the social space, both through acquisitions and through advertising deals, such as Google’s $900M partnership with MySpace and Microsoft’s relationship and small ownership stake in Facebook.
Table 44: Large Internet Companies’ Investments in and Partnerships with Social Sites Date Acquirer Target Description January, 2004 Google Launch of Orkut Social Network site 3/12/2005 Yahoo! Inc Ludicorp Research, the owner of Flickr ($40M) Photo-sharing site 5/18/2005 Google Dodgeball A social networking software provider for mobile
devices. 6/20/2005 Yahoo! Inc Yahoo! acquires Blo.gs. RSS aggregator 7/19/2005 News Corp Intermix (including MySpace) ($580M) Social Network site 8/7/2006 Google Fox Interactive Media Enters Into Agreement with Google Inc. Advertising deal 8/23/2006 Microsoft Microsoft Signs Agreement to Show Ads on Facebook Advertising deal 11/17/2006 Yahoo! Inc Bix.com Interactive contests 12/20/2006 IAC/ Interactive corp Ilike.com Music sharing for SN sites 12/30/2006 Yahoo! Inc del.icio.us Website sharing 1/9/2007 Yahoo! Inc Mybloglog blog communities service 2/27/2007 IAC/ Interactive corp Edodo.Com Dating site in China 2/27/2007 IAC/ Interactive corp Netclub Dating site in France 5/30/2007 eBay Stumbleupon Inc ($75M) Website sharing 6/1/2007 Google Feedburner Inc RSS feed distribution. 8/1/2007 Disney ClubPenguin ($350M) Virtual world 9/14/2007 Yahoo! Inc Buzztracker.Com Popularity-based news 9/28/2007 Google Zingku Photo sharing for mobile phones 10/4/2007 Time Waner AOL’s AIM and Bebo to offer seamless integration A global partnership to deliver AIM to Bebo users 10/7/2007 GE and Microsoft Newsvine Inc (acquired by MSNBC Interactive News) Popularity-based news 10/9/2007 Google Jaiku Ltd Social Networking software for mobile phones 10/24/2007 Microsoft Facebook (Microsoft acquired a 1.6% stake for $240M) Source: Company reports, news reports

70
North America Equity Research 02 January 2008
Imran Khan (1-212) 622-6693 [email protected]
2008 Virtual Online Worlds Primer Key Takeaways
• The market is in its infancy, so ’08 should bring continued rapid growth. Due to increased awareness, continued product innovation, and faster Internet connections, we think the short-term portends significant usage growth for virtual worlds.
• We are bullish on sites for children. Virtual worlds present parents an opportunity to let their kids play online and interact in a closed environment that is perceived as safe, especially when sites are operated by companies with trusted brands.
• We think sites aimed at adults have yet to prove mainstream appeal. Adults have much more freedom than children to choose other avenues of social interaction. As such, while short-term growth should remain robust, we think that, in their current form, virtual worlds aimed at adults are unproven in their ability to achieve meaningful mainstream penetration over the long term.
Two Audiences, Two Differing Growth Curves With investments by major media companies, virtual worlds have been making news for several years. Most recently, Disney purchased Club Penguin in July ’07 for as much as $700M, and throughout the year there has been a steady flow of news stories, both positive and negative, regarding virtual world sites, primarily Second Life.
We believe that virtual worlds are still in the very early stage of their growth, and as such have the capacity to grow very rapidly in the near future. However, we think the market is ultimately one that should be seen as consisting of two parts – virtual worlds for children, and ones for adults– with diverging longer-term growth prospects.
We think virtual worlds for kids are a product with strong promise, and one that could achieve mainstream status in coming years. To the contrary, we think that virtual worlds aimed at adults face greater challenges. We think it is telling that virtual worlds have proven successful among kids, who have limited social options, and in places such as Finland, where external factors such as climate may limit users’ offline social options.
As such, we think the ability of virtual worlds (as distinct from video games, which target a different, more male demographic) to achieve mainstream penetration has not yet been proven.
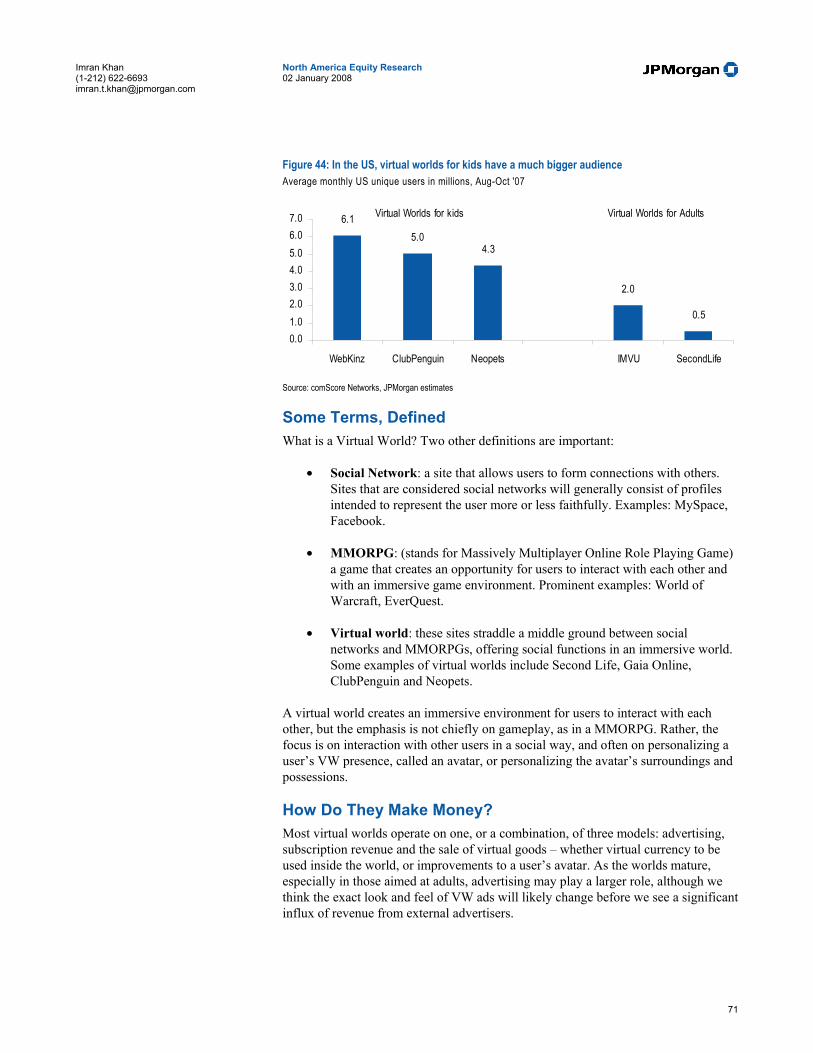
71
North America Equity Research 02 January 2008
Imran Khan (1-212) 622-6693 [email protected]
Figure 44: In the US, virtual worlds for kids have a much bigger audience Average monthly US unique users in millions, Aug-Oct '07
6.15.0
4.3
2.0
0.5
0.01.02.03.04.05.06.07.0
WebKinz ClubPenguin Neopets IMVU SecondLife
Virtual Worlds for kids Virtual Worlds for Adults
Source: comScore Networks, JPMorgan estimates
Some Terms, Defined What is a Virtual World? Two other definitions are important:
• Social Network: a site that allows users to form connections with others. Sites that are considered social networks will generally consist of profiles intended to represent the user more or less faithfully. Examples: MySpace, Facebook.
• MMORPG: (stands for Massively Multiplayer Online Role Playing Game) a game that creates an opportunity for users to interact with each other and with an immersive game environment. Prominent examples: World of Warcraft, EverQuest.
• Virtual world: these sites straddle a middle ground between social networks and MMORPGs, offering social functions in an immersive world. Some examples of virtual worlds include Second Life, Gaia Online, ClubPenguin and Neopets.
A virtual world creates an immersive environment for users to interact with each other, but the emphasis is not chiefly on gameplay, as in a MMORPG. Rather, the focus is on interaction with other users in a social way, and often on personalizing a user’s VW presence, called an avatar, or personalizing the avatar’s surroundings and possessions.
How Do They Make Money? Most virtual worlds operate on one, or a combination, of three models: advertising, subscription revenue and the sale of virtual goods – whether virtual currency to be used inside the world, or improvements to a user’s avatar. As the worlds mature, especially in those aimed at adults, advertising may play a larger role, although we think the exact look and feel of VW ads will likely change before we see a significant influx of revenue from external advertisers.
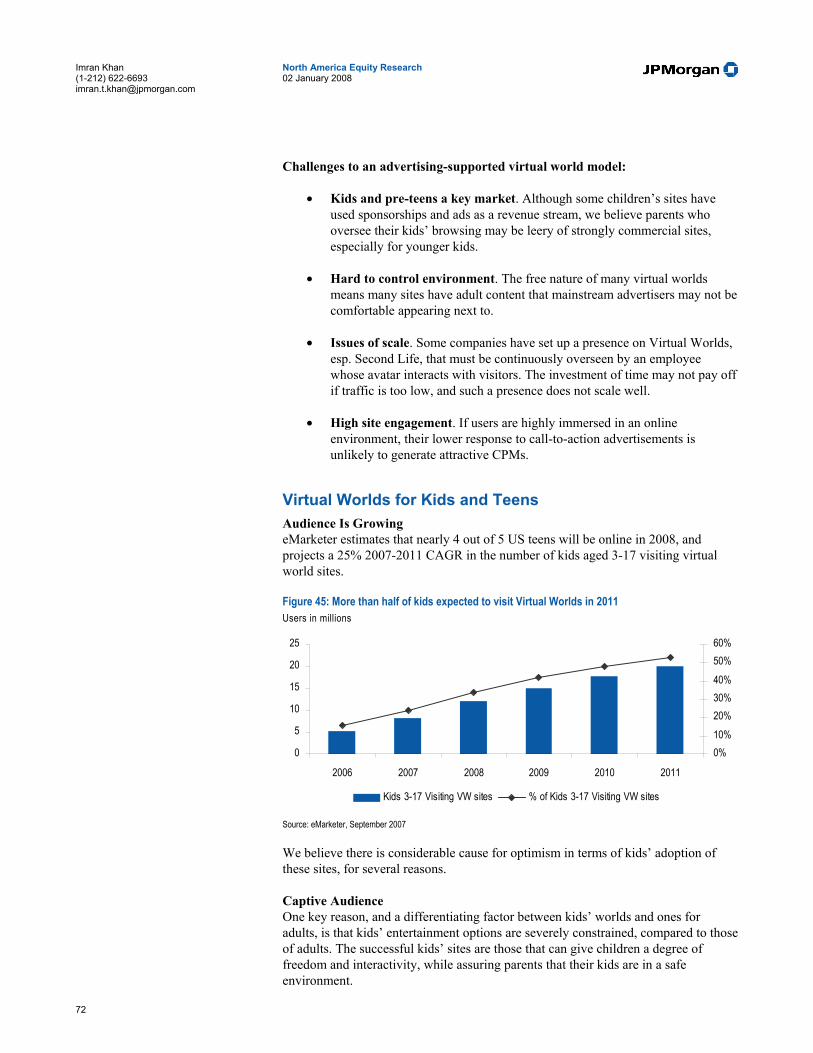
72
North America Equity Research 02 January 2008
Imran Khan (1-212) 622-6693 [email protected]
Challenges to an advertising-supported virtual world model:
• Kids and pre-teens a key market. Although some children’s sites have used sponsorships and ads as a revenue stream, we believe parents who oversee their kids’ browsing may be leery of strongly commercial sites, especially for younger kids.
• Hard to control environment. The free nature of many virtual worlds means many sites have adult content that mainstream advertisers may not be comfortable appearing next to.
• Issues of scale. Some companies have set up a presence on Virtual Worlds, esp. Second Life, that must be continuously overseen by an employee whose avatar interacts with visitors. The investment of time may not pay off if traffic is too low, and such a presence does not scale well.
• High site engagement. If users are highly immersed in an online environment, their lower response to call-to-action advertisements is unlikely to generate attractive CPMs.
Virtual Worlds for Kids and Teens Audience Is Growing eMarketer estimates that nearly 4 out of 5 US teens will be online in 2008, and projects a 25% 2007-2011 CAGR in the number of kids aged 3-17 visiting virtual world sites.
Figure 45: More than half of kids expected to visit Virtual Worlds in 2011 Users in millions
0
5
10
15
20
25
2006 2007 2008 2009 2010 2011
0%10%20%30%40%50%60%
Kids 3-17 Visiting VW sites % of Kids 3-17 Visiting VW sites
Source: eMarketer, September 2007 We believe there is considerable cause for optimism in terms of kids’ adoption of these sites, for several reasons.
Captive Audience One key reason, and a differentiating factor between kids’ worlds and ones for adults, is that kids’ entertainment options are severely constrained, compared to those of adults. The successful kids’ sites are those that can give children a degree of freedom and interactivity, while assuring parents that their kids are in a safe environment.
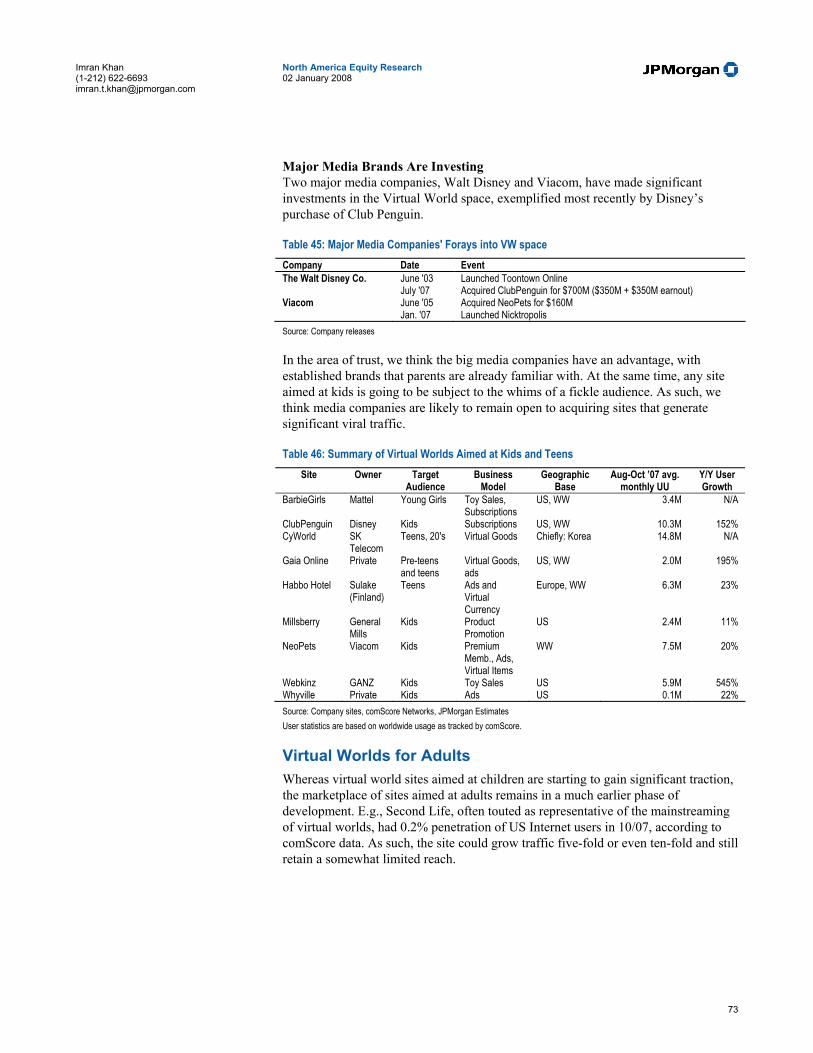
73
North America Equity Research 02 January 2008
Imran Khan (1-212) 622-6693 [email protected]
Major Media Brands Are Investing Two major media companies, Walt Disney and Viacom, have made significant investments in the Virtual World space, exemplified most recently by Disney’s purchase of Club Penguin.
Table 45: Major Media Companies' Forays into VW space Company Date Event The Walt Disney Co. June '03 Launched Toontown Online
July '07 Acquired ClubPenguin for $700M ($350M + $350M earnout) Viacom June '05 Acquired NeoPets for $160M
Jan. '07 Launched Nicktropolis Source: Company releases In the area of trust, we think the big media companies have an advantage, with established brands that parents are already familiar with. At the same time, any site aimed at kids is going to be subject to the whims of a fickle audience. As such, we think media companies are likely to remain open to acquiring sites that generate significant viral traffic.
Table 46: Summary of Virtual Worlds Aimed at Kids and Teens Site Owner Target
Audience Business
Model Geographic
Base Aug-Oct ’07 avg.
monthly UU Y/Y User Growth
BarbieGirls Mattel Young Girls Toy Sales, Subscriptions
US, WW 3.4M N/A
ClubPenguin Disney Kids Subscriptions US, WW 10.3M 152% CyWorld SK
Telecom Teens, 20's Virtual Goods Chiefly: Korea 14.8M N/A
Gaia Online Private Pre-teens and teens
Virtual Goods, ads
US, WW 2.0M 195%
Habbo Hotel Sulake (Finland)
Teens Ads and Virtual Currency
Europe, WW 6.3M 23%
Millsberry General Mills
Kids Product Promotion
US 2.4M 11%
NeoPets Viacom Kids Premium Memb., Ads, Virtual Items
WW 7.5M 20%
Webkinz GANZ Kids Toy Sales US 5.9M 545% Whyville Private Kids Ads US 0.1M 22% Source: Company sites, comScore Networks, JPMorgan Estimates User statistics are based on worldwide usage as tracked by comScore.
Virtual Worlds for Adults Whereas virtual world sites aimed at children are starting to gain significant traction, the marketplace of sites aimed at adults remains in a much earlier phase of development. E.g., Second Life, often touted as representative of the mainstreaming of virtual worlds, had 0.2% penetration of US Internet users in 10/07, according to comScore data. As such, the site could grow traffic five-fold or even ten-fold and still retain a somewhat limited reach.
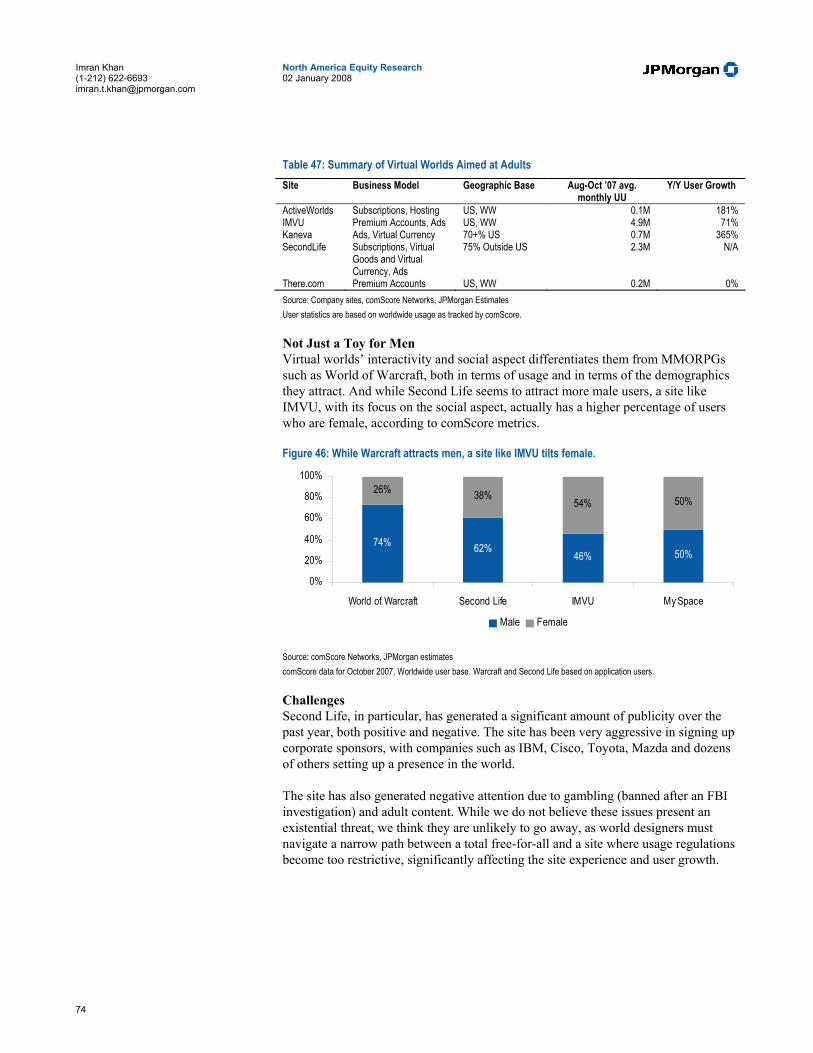
74
North America Equity Research 02 January 2008
Imran Khan (1-212) 622-6693 [email protected]
Table 47: Summary of Virtual Worlds Aimed at Adults Site Business Model Geographic Base Aug-Oct ’07 avg.
monthly UU Y/Y User Growth
ActiveWorlds Subscriptions, Hosting US, WW 0.1M 181% IMVU Premium Accounts, Ads US, WW 4.9M 71% Kaneva Ads, Virtual Currency 70+% US 0.7M 365% SecondLife Subscriptions, Virtual
Goods and Virtual Currency, Ads
75% Outside US 2.3M N/A
There.com Premium Accounts US, WW 0.2M 0% Source: Company sites, comScore Networks, JPMorgan Estimates User statistics are based on worldwide usage as tracked by comScore. Not Just a Toy for Men Virtual worlds’ interactivity and social aspect differentiates them from MMORPGs such as World of Warcraft, both in terms of usage and in terms of the demographics they attract. And while Second Life seems to attract more male users, a site like IMVU, with its focus on the social aspect, actually has a higher percentage of users who are female, according to comScore metrics.
Figure 46: While Warcraft attracts men, a site like IMVU tilts female.
74% 62%46% 50%
26% 38%54% 50%
0%
20%
40%
60%
80%
100%
World of Warcraft Second Life IMVU My Space
Male Female
Source: comScore Networks, JPMorgan estimates comScore data for October 2007, Worldwide user base. Warcraft and Second Life based on application users. Challenges Second Life, in particular, has generated a significant amount of publicity over the past year, both positive and negative. The site has been very aggressive in signing up corporate sponsors, with companies such as IBM, Cisco, Toyota, Mazda and dozens of others setting up a presence in the world.
The site has also generated negative attention due to gambling (banned after an FBI investigation) and adult content. While we do not believe these issues present an existential threat, we think they are unlikely to go away, as world designers must navigate a narrow path between a total free-for-all and a site where usage regulations become too restrictive, significantly affecting the site experience and user growth.
75
North America Equity Research 02 January 2008
Imran Khan (1-212) 622-6693 [email protected]
The Mobile Ad Market One-third of the World’s Population Are Mobile Subscribers The mobile market is a large and quickly growing industry with an estimated 2.2B mobile subscribers worldwide growing at an estimated pace of 23% Y/Y. Given this level of reach, we think this medium would be attractive to advertisers. A quick comparison to broadband penetration demonstrates this point.
We estimate that 67% of Americans are mobile phone subscribers while only 57% have broadband subscriptions.
We believe that this disparity is even greater in developing countries. In China, for example, our estimates indicate there are approximately 30% mobile subscribers per 100 persons but only 4% broadband subscribers per 100 people.
On a worldwide basis, 33% of the population has mobile subscriptions vs. 4% with broadband subscriptions.
In short, this medium offers advertising brands very large reach in marketing their products. Please see Table 1 on the following page for a breakdown of subscription rates by country.
Mobile Ads Offer Targeting and Relationship Capabilities Traditional advertising forms offered limited targeting capabilities. Advertisers would select specific television programs, newspaper sections, or magazines that attracted a certain demographic and then hope that some of those viewers were searching for their product. Targeting capabilities were much better with the Internet. Search marketing offered the opportunity to pair an advertisement with a person searching for information on that specific product. Display advertising is improving so that ads can now be targeted to consumers based on previous sites they have visited. In all cases, the ads were typically pushed onto the consumer.
Figure 47: Traditional Advertising Methods
Consumer Behavior: Watch The Food Network
Advertiser Response: Show ad for for general food products
Consumer Behavior: Search for wine
Advertiser Response: Show ad for popular red wine brand
Source: JPMorgan
On a worldwide basis, 33% of the population has mobile subscriptions vs. 4% with broadband subscriptions

76
North America Equity Research 02 January 2008
Imran Khan (1-212) 622-6693 [email protected]
Table 48: Mobile and Broadband Penetration by Country millions
Country Population (M)Broadband Subs
(M) BB Subs per 100
Persons Mobile Subs (M)Mobile Subs per
100 Persons Egypt 71.4 0.1 0.1 13.6 19.1 Morocco 30.7 0.3 1.0 16.0 52.1 South Africa 47.6 0.2 0.5 39.7 83.3 Africa 914.3 2.9 0.3 193.8 21.2 China 1,323.7 47.0 3.6 461.1 34.8 Hong Kong 7.1 1.5 21.6 9.4 131.5 India 1,119.7 2.0 0.2 166.1 14.8 Indonesia 225.5 0.5 0.2 63.8 28.3 Japan 128.2 24.2 19.0 101.7 79.3 Malaysia 25.8 0.7 2.7 19.5 75.5 Pakistan 157.0 0.1 0.1 34.5 22.0 Philippines 84.5 0.1 0.2 42.9 50.8 South Korea 48.0 12.8 26.1 40.2 83.8 Taiwan 22.8 4.4 19.2 23.2 102.0 Thailand 64.8 0.3 0.5 40.8 63.0 Vietnam 85.3 0.3 0.4 15.5 18.2 Asia Pacific 3,693.0 99.6 2.7 1,073.3 29.1 Austria 8.2 1.5 17.8 9.3 112.8 Belgium 10.4 2.0 19.5 9.7 92.6 Czech Republic 10.2 1.0 9.4 12.1 119.0 Denmark 5.4 1.6 29.1 5.8 107.3 Finland 5.3 1.3 25.0 5.7 107.8 France 60.7 11.1 17.7 51.7 85.1 Germany 82.7 12.4 15.1 84.3 101.9 Greece 11.1 0.3 2.8 11.1 99.6 Hungary 10.1 0.8 7.9 10.0 99.0 Italy 58.1 8.0 13.8 71.5 123.1 Netherlands 16.3 4.7 28.5 15.8 97.2 Norway 4.6 1.1 24.7 5.0 108.6 Poland 38.5 2.0 5.3 36.7 95.5 Portugal 10.5 1.4 12.8 12.2 116.0 Romania 21.6 0.4 1.8 17.4 80.5 Russia 142.5 2.1 1.5 150.0 105.2 Spain 43.4 5.9 14.6 46.2 106.4 Sweden 9.1 2.1 22.7 9.6 105.9 Switzerland 7.3 2.0 25.9 7.4 102.1 Turkey 74.2 2.1 3.0 52.7 71.0 Ukraine 46.0 0.1 0.2 49.1 106.7 United Kingdom 59.8 11.6 19.1 69.7 116.4 Europe 813.1 72.4 9.0 797.6 98.1 Iran 69.1 NA NA 13.7 19.4 Israel 6.4 1.5 23.5 8.4 122.7 Middle East 190.0 3.8 2.0 63.6 33.5 Canada 32.4 7.2 21.5 17.0 52.5 Mexico 108.3 3.0 2.7 57.0 52.6 United States 299.7 56.5 18.8 201.7 67.3 North America 439.0 66.6 15.2 275.7 62.8 Australia 20.4 3.5 17.3 19.8 97.0 New Zealand 4.0 0.5 11.7 3.5 87.6 Oceania 33.2 4.0 11.8 24.1 72.6 Argentina 39.1 1.1 2.7 31.5 80.5 Brazil 188.9 4.9 2.6 99.9 52.9 Chile 16.5 1.1 6.8 12.5 75.6 Colombia 46.3 0.5 1.1 29.8 64.3 Peru 28.4 0.4 1.5 8.5 30.0 Venezuela 27.2 0.4 1.6 18.8 69.0 South America 461.8 9.7 2.6 282.3 61.1 World Wide 6,544.4 259.1 3.9 2,710.4 41.4 Source: CIA Government Stats (http://www.cia.gov/cia/publications/factbook/index.html), International Telecommunications Union (http://www.itu.int/ITU-D/ict/statistics), JPMorgan estimates.
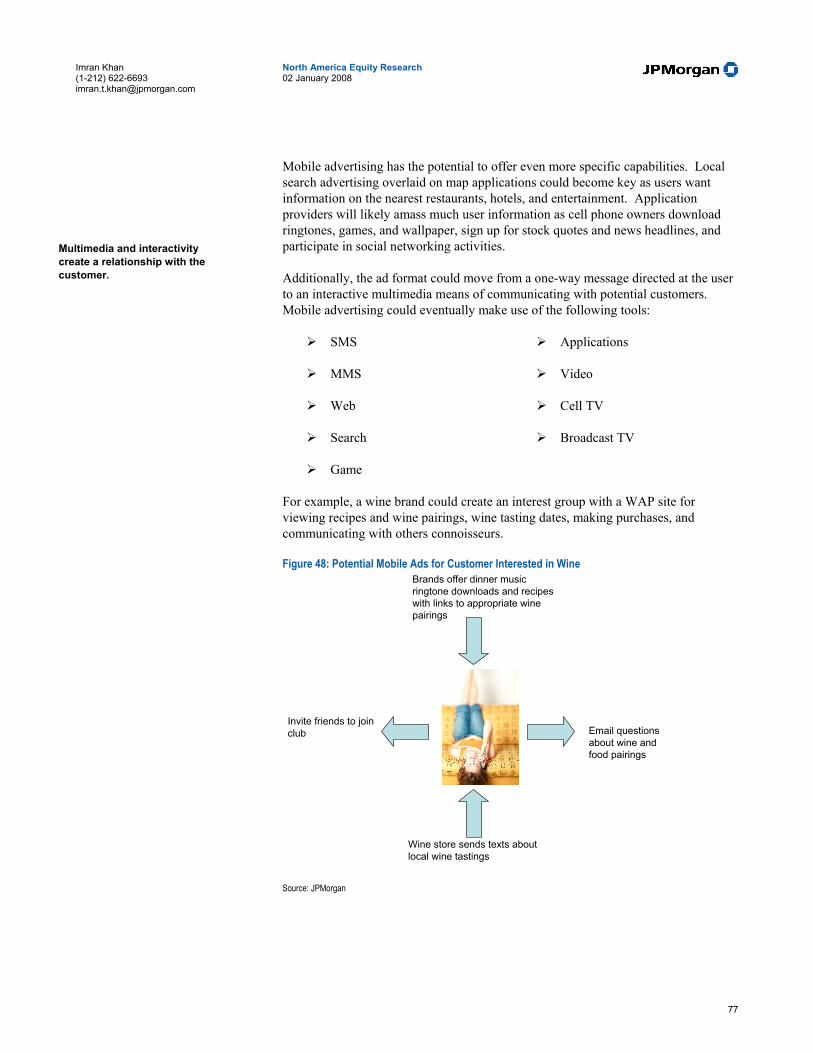
77
North America Equity Research 02 January 2008
Imran Khan (1-212) 622-6693 [email protected]
Mobile advertising has the potential to offer even more specific capabilities. Local search advertising overlaid on map applications could become key as users want information on the nearest restaurants, hotels, and entertainment. Application providers will likely amass much user information as cell phone owners download ringtones, games, and wallpaper, sign up for stock quotes and news headlines, and participate in social networking activities.
Additionally, the ad format could move from a one-way message directed at the user to an interactive multimedia means of communicating with potential customers. Mobile advertising could eventually make use of the following tools:
SMS
MMS
Web
Search
Game
Applications
Video
Cell TV
Broadcast TV
For example, a wine brand could create an interest group with a WAP site for viewing recipes and wine pairings, wine tasting dates, making purchases, and communicating with others connoisseurs.
Figure 48: Potential Mobile Ads for Customer Interested in Wine
Email questions about wine and food pairings
Wine store sends texts about local wine tastings
Invite friends to join club
Brands offer dinner music ringtone downloads and recipes with links to appropriate wine pairings
Source: JPMorgan
Multimedia and interactivity create a relationship with the customer.
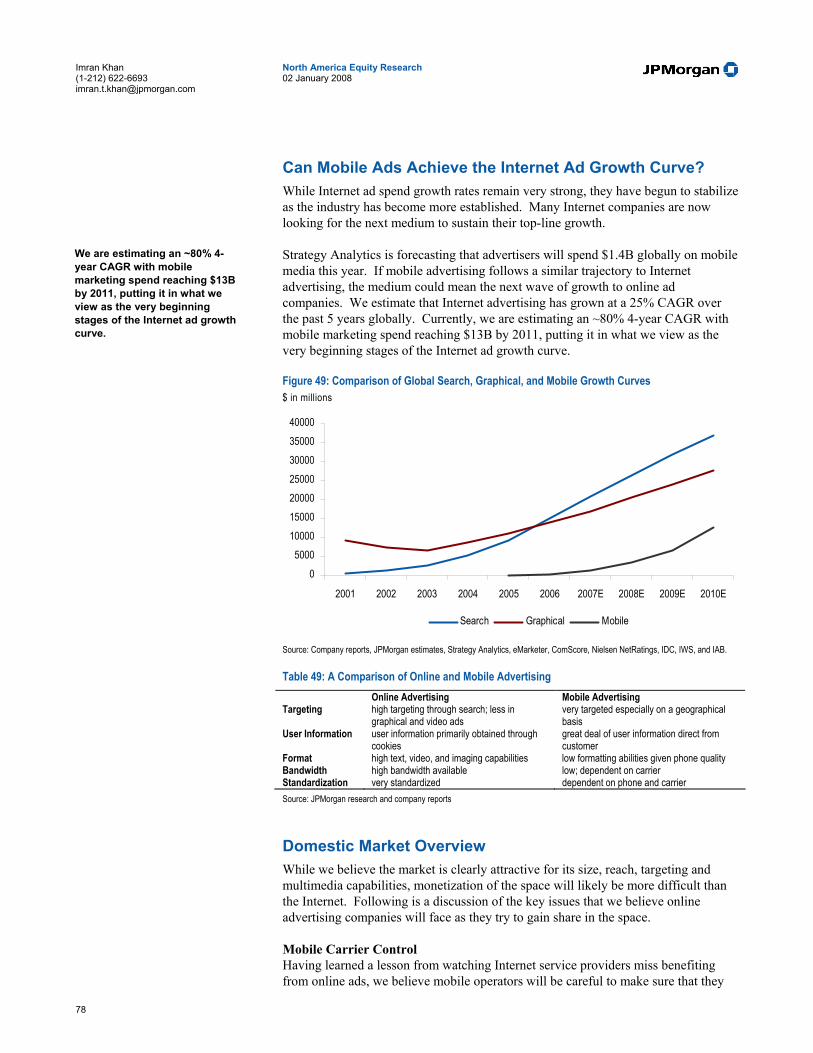
78
North America Equity Research 02 January 2008
Imran Khan (1-212) 622-6693 [email protected]
Can Mobile Ads Achieve the Internet Ad Growth Curve? While Internet ad spend growth rates remain very strong, they have begun to stabilize as the industry has become more established. Many Internet companies are now looking for the next medium to sustain their top-line growth.
Strategy Analytics is forecasting that advertisers will spend $1.4B globally on mobile media this year. If mobile advertising follows a similar trajectory to Internet advertising, the medium could mean the next wave of growth to online ad companies. We estimate that Internet advertising has grown at a 25% CAGR over the past 5 years globally. Currently, we are estimating an ~80% 4-year CAGR with mobile marketing spend reaching $13B by 2011, putting it in what we view as the very beginning stages of the Internet ad growth curve.
Figure 49: Comparison of Global Search, Graphical, and Mobile Growth Curves $ in millions
05000
10000150002000025000300003500040000
2001 2002 2003 2004 2005 2006 2007E 2008E 2009E 2010E
Search Graphical Mobile
Source: Company reports, JPMorgan estimates, Strategy Analytics, eMarketer, ComScore, Nielsen NetRatings, IDC, IWS, and IAB. Table 49: A Comparison of Online and Mobile Advertising
Online Advertising Mobile Advertising Targeting high targeting through search; less in
graphical and video ads very targeted especially on a geographical basis
User Information user information primarily obtained through cookies
great deal of user information direct from customer
Format high text, video, and imaging capabilities low formatting abilities given phone quality Bandwidth high bandwidth available low; dependent on carrier Standardization very standardized dependent on phone and carrier Source: JPMorgan research and company reports
Domestic Market Overview While we believe the market is clearly attractive for its size, reach, targeting and multimedia capabilities, monetization of the space will likely be more difficult than the Internet. Following is a discussion of the key issues that we believe online advertising companies will face as they try to gain share in the space.
Mobile Carrier Control Having learned a lesson from watching Internet service providers miss benefiting from online ads, we believe mobile operators will be careful to make sure that they
We are estimating an ~80% 4-year CAGR with mobile marketing spend reaching $13B by 2011, putting it in what we view as the very beginning stages of the Internet ad growth curve.

79
North America Equity Research 02 January 2008
Imran Khan (1-212) 622-6693 [email protected]
get a good slice of the mobile advertising pie. As a result of this, they have created a somewhat “walled garden” in their mobile portals where operators have better control over the flow of mobile ads and the revenue they generate.
Recently, we have seen Internet companies partner with operators in revenue sharing agreements. For example, Yahoo! and Rogers Communications just announced a partnership for Yahoo! to deliver their Go 2.0 and oneSearch products across wireless customers in Canada. Another notable partnership was the iPhone arrangement between Apple and AT&T. While AT&T allowed Apple to develop an ongoing relationship with customers through its iTunes platform, AT&T was named the exclusive domestic mobile provider of iPhones. We believe that more partnerships will be developed but that mobile carrier control has somewhat hindered mobile innovation due to the lack of scale developers can achieve.
Google has approached the control issue differently with its entry into the 700 MHz spectrum auction. Partly as a result of Google's lobbying efforts, the FCC ruled that the C Block of spectrum would be limited open access (open devices and open applications) if a minimum bid of $4.6B was met. In December, Google officially announced its intention to participate in the FCC auction scheduled to start January 24th. If Google is successful, it is in the position to operate a wireless network itself or to help it build one and potentially resell wireless services.
Device and Network Capabilities Until the advent of the iPhone, cellular devices were not well designed for web browsing and messaging use. Small screen size prevented easy viewing. Small keyboards demanding multiple taps to get the letter desired made messaging difficult.
Navigation to various features required multiple clicks and complexity for many people. Slow-loading browsers and networks make mobile web navigation reminiscent of PC capabilities over a decade ago. As a result of this, US uptake of various features has been limited. In a survey by NPD Group, only 13% of Americans had mobile access to their email, 12% had mobile Internet access, and 39% used text messaging features.
Figure 50: U.S. Mobile Feature Usage
0%20%40%60%80%
100%
Mobile email Internet access fromhandset
Tex t Messaging Instant Messaging
Source: NPD Group and JPMorgan estimates
Mobile carriers control what software, services, and applications will be available on mobile phones.
Complex user-interfaces, small screens, and slow loading browsers have limited mobile feature use.
80
North America Equity Research 02 January 2008
Imran Khan (1-212) 622-6693 [email protected]
User Reaction Consumers consider cell phones a highly personal device and it is not clear how they would react to having advertisements delivered through it. Some advertisers may fear reactions similar to those to email spam and telemarketer calls.
We believe that in order for advertisers to successfully use this medium, they must deliver clear value to consumers. This could take many forms, including:
Free or reduced-priced mobile service
Additional services or applications provided by the advertiser
Ads targeted to a specific and immediate need
Opt-in/out features
Whatever the method, we believe advertisers must be sure not to alienate the customer and his/her privacy in marketing endeavors.
International Markets Are More Attractive The U.S. Trails International Markets in Mobile Services Adoption While U.S. adoption of mobile services outside of phone use has been low, international users have embraced the technology. In Japan, 85% of cellphone owners have mobile email and 78% access the Internet from their handset. Over 66% of Japanese mobile phone owners use PDA functions on the device.
Consumers may have a negative reaction to mobile advertising.
While U.S. adoption of mobile services outside of phone use has been low, international users have embraced the technology.

81
North America Equity Research 02 January 2008
Imran Khan (1-212) 622-6693 [email protected]
Figure 51: Mobile Feature Use in Japan and the U.S.
0% 10% 20% 30% 40% 50% 60% 70% 80% 90%
Mobile email
Internet access from handset
Dow nloading ringtones
PDA functions
Dow nload graphics/screensav ers
Play mobile games
Picture messaging
Tex t messaging
Digital Music Play er
Instant Messaging
Video Messaging
Watch TV on Mobile Phone
Japan US
Source: NPD Group and JPMorgan estimates Although mobile feature usage in Europe is not as high as in Japan, Europeans, on average, still outpace Americans in mobile feature usage. The two countries are similar on SMS usage with 41% of Europeans using the technology vs. 39% of Americans. However, there are vast differences in multimedia messaging and mobile Internet access. In both cases, approximately 26% of Europeans use the technologies while only 12% of their American counterparts do.
Table 50: Mobile Feature Usage in Europe US Europe
SMS 39% 41% MMS 12% 26% Mobile Internet 12% 26% Source: NPD, Gartner G2, M: Metrics, Forrester, comScore, and JPMorgan estimates So why are American consumers trailing in mobile adoption? It doesn’t appear to be due to lack of interest. In a Pew Research Center survey, the company found that 47% of Americans would like to have mobile maps, 38% were interested in IM services for their phone, and 24% wanted email access and search capabilities to find movie listings, weather reports, and stock quotes. Media-Screen surveys found that the reasons most cited for not using mobile Internet services were cost and connectivity issues.

82
North America Equity Research 02 January 2008
Imran Khan (1-212) 622-6693 [email protected]
Figure 52: U.S. Survey Respondents Interested in Using the Following Mobile Services
0%10%20%30%40%50%
Maps IM Search forserv ices (mov ies,
etc)
Email Cameras
Source: Pew Research Centers and JPMorgan estimates International Advertisers Have Begun to Enter the Market Due to these higher mobile services adoption levels, marketers have begun to experiment with mobile advertising in the international market.
Surveys by Airwide Solutions of 50 brand name European companies revealed that 89% of brands plan to use text and multimedia messaging to reach their audience by 2008. Of these, one-third plan to spend over 10% of their marketing budget on the medium. In five years, 52% of the brands expect to spend between 5%-25% of their total marketing budget on mobile marketing. Currently, 40% of the brands have already initiated text messaging campaigns and 18% have launched MMS campaigns.
Figure 53: Global Mobile Ad Spend Forecast for 2011 10%
48%
32%
1%3%2%2%
1%1%
SMS MMS Web Search Game Application Video Cell TV Bcast TV
Source: Strategy Analytics, eMarketer, and JPMorgan estimates
Challenges in the International Market While the launch of mobile ad campaigns seems to have progressed further overseas than domestically, it is not without its weaknesses. For mobile advertising to maximize revenue streams, business models need to be established by carriers, advertisers, and marketing companies. Issues such as opting in or opting out of text advertisements and controlling the number of text ads received still need to be determined. Finally, each country’s privacy laws must be taken into consideration to determine how much information possessed by operators about their clients’ habits can be shared with advertisers and marketers to target ads.
Surveys of 50 brand name European companies revealed that 89% of brands plan to use text and multimedia messaging to reach their audience by 2008.
83
North America Equity Research 02 January 2008
Imran Khan (1-212) 622-6693 [email protected]
Conclusions Attractive market size and reach The mobile market is a large and quickly growing industry with an estimated 2.2B mobile subscribers worldwide growing at an estimated pace of 23% Y/Y. On a worldwide basis, 33% of the population has mobile subscriptions vs. 4% with broadband subscriptions. In short, this medium offers advertising brands a very large reach in marketing their products.
Strong targeting and relationship building capabilities Application providers will likely amass much user information as cell phone owners download ringtones, games, and wallpaper, sign up for stock quotes and news headlines, and participate in social networking activities. Additionally, the ad format could move from a one-way message directed at the user to an interactive multimedia means of communicating with potential customers including email, text messaging, web pages, applications, search, and MMS.
Mobile ad growth could approximate that of the Internet We estimate that Internet advertising has grown at a 25% CAGR over the past 5 years globally. Currently, Strategy Analytics and eMarketer are estimating an ~80% 4-year CAGR with mobile marketing spend reaching $13B by 2011, putting it in what we view as the very beginning stages of the Internet ad growth curve.
Barriers to entry could slow domestic adoption We believe that development of mobile ads has been inhibited primarily by three factors. First, mobile carrier control seems to have limited Internet entrants who need to make partnerships to have their services available on the phone. Second, devices have poor user interfaces, high costs, and slow connectivity times. Finally, users view their mobile phones as personal devices and reception to mobile marketing may be cool.
International markets are in the early stages of development Use of mobile services and features is greater in Europe and Japan than in the U.S. As a result marketers have begun to test mobile advertising in these markets. Surveys by Airwide Solutions of 50 brand name European companies revealed that 89% of brands plan to use text and multimedia messaging to reach their audience by 2008. Of these, one-third plan to spend over 10% of their marketing budget on the medium.
Company Initiatives Google Introduces Android Google decided to address distribution difficulties head-on with the creation of the Open Handset Alliance, composed of leading technology and wireless companies committed to the development of an open platform for mobile devices. The Android platform is a fully integrated mobile "software stack” consisting of an operating system, middleware, user-friendly interface, and applications. The first phones based on Android are expected to debut in the second half of 2008. By bringing the Internet developer model to the mobile market, it is hoped that increased innovation will make the phone features more attractive, affordable, and user-friendly for the consumer.
84
North America Equity Research 02 January 2008
Imran Khan (1-212) 622-6693 [email protected]
Despite speculation about the development of a Google Phone or GPhone, we believe that it is unlikely that Google will choose to enter the hardware business. First, none of Google’s core competencies lie in this business and it would take much investment in technology, marketing, and people to ramp it up. Secondly, the handset business is a much lower-margin business than online advertising. We estimate that operating margins for handset makers range from 10%-20% and are skewed toward the lower end of the range. In contrast to this, we believe that Google will achieve an operating margin north of 50%.
Instead, we believe that it is more likely that Google will pursue methods to increase the distribution of its products and services, so that they may later be monetized. If the Android open platform is widely rolled out, more consumers would have access to Google features. Google has introduced many mobile products, including search, Gmail, YouTube, Picassa, maps, and GOOG-411. We believe that Google is well positioned to capitalize on the mobile space with its search dominance. Currently, advertisers can elect to place mobile search or content ads through AdWords.
Yahoo! Enters Carrier Partnerships Similar to Google, Yahoo! is focused on increasing the distribution of its mobile products. Yahoo! recently announced nine new partnerships with mobile operators across Asia Pacific, as well as the availability of Yahoo! Go 2.0 in Chinese language for Taiwan. These new partnerships bring the total distribution partnership count to 20, and include Rogers Communications, Telefonica, BPL Mobile, and 3 Group. We believe that these agreements, in addition to the company’s leading email platform and content portal, will firmly establish Yahoo! in the mobile market.
The Yahoo! Go 2.0 application allows consumers to personalize their mobile Internet experience with content across the Internet and access to oneSearch. Users are offered access to Yahoo! Go widgets, personal channels for email, local information, satellite and hybrid maps, news sports, finance, entertainment, weather, Flickr, search, and some GPS integration capabilities.
On the advertising front, Yahoo! offers mobile display advertising in 19 countries with search marketing live in the U.S., the U.K., and Japan. Yahoo! is also the exclusive advertising partner for Vodafone in the U.K. Publishers can use Yahoo!'s Mobile Publisher Services to increase the discovery, distribution, and monetization of their content on mobile phones and to access the Yahoo! Mobile Ad Network, Mobile Content Engine, Mobile Media Directory, and Mobile Site Submit.
MSN Updates Its Mobile Portal and Acquires Ad Firm Earlier this summer, Microsoft launched MSN Mobile, a redesigned portal providing customers with access to email, news, sports, entertainment, local movie listings, maps and directions, Windows Live Messenger, and Live Search. Like Yahoo!, Microsoft is pursuing alliances with operators to integrate MSN Mobile on WAP home pages.
Microsoft now has a firm footing in the mobile advertising world with its May announcement of the acquisition of Screen Tonic, a Paris based company that specializes in delivering location-based ads to mobile devices. ScreenTonic's platform, called Stamp, enables delivery of text or banner links on portals, ads in SMS (Short Message Service) messages and ads in mobile Web pages that vary depending on where the reader is located.

85
North America Equity Research 02 January 2008
Imran Khan (1-212) 622-6693 [email protected]
Mobile Payment Business Outlook Mobile networks cover over 80% of the world’s population and over 2.7B people have access to mobile phones. Meanwhile the global remittance market is expected to grow at a 10.2% CAGR between 2000 and 2008 as the world’s population has become more mobile. In this section we analyze the impact of the growth in the global remittance market and mobile phone technology on the emerging payment portals designed to take advantage of this growth.
• Global remittance is expected to grow 10.9% in 2008. According to Celent, the global remittance market is expected to grow at a 10.2% CAGR between 2000 and 2008 as the global population becomes more mobile. Inexpensive methods for P2P money transfers do not exist, except in the most developed remittance corridors. Mobile money transfer solutions could provide an inexpensive solution for the 200M people who are involved in the global remittance trade.
• Increased utilization of mobile phones and broadband mobile networks provides opportunity for growth in mobile payments business. According to the CDMA Association, there are over 402B 3G subscribers around the world and according to JPMorgan’s estimates, global mobile phone penetration is expected to reach 68% by 2010. With lower infrastructure costs, we expect mobile Internet penetration growth to exceed land-based broadband penetration growth during the next five years. We believe increased mobile broadband penetration provides a robust platform for growth in both the mobile remittance and m-commerce business.
• M-commerce is expected to grow as mobile Internet usage increases. According to Jupiter Research, m-commerce was a $30B industry in 2006. While most m-commerce money was spent on phone features, the amount of money spent on physical purchases still remains relatively small. However, we expect this number to grow as broadband Internet connectivity increases and the difference between accessing the Internet from a mobile phone compared to a broadband connected PC is minimized. While we expect POS transactions to increase, we believe users will be slow to warm to NFC devices and bar-code displays will be limited to ticket purchases (both transportation and entertainment) and coupons.
• While a number of players are currently looking to enter the mobile payment business, we expect only a few to survive. In the U.S., PayPal Mobile and Textpayme both benefit from their relationships with the large online retailers, eBay and Amazon, respectively. We believe smaller players who enter the field will eventually need to team up with bigger operators, such as Obopay’s relationship with Citibank, in order to compete against the likes of Western Union, MasterCard, and major banks.
Background Global Remittance Is a $311B Market Celent estimates that over $311B in 2007 was transferred in the global remittance market, and global remittance is expected to grow at a 10.2% CAGR between 2000 and 2008. The mobile global population and the desire to send money back to family have led to the strong growth in remittance. The United Nation estimates that about 3% of the world's population, or roughly 175M people, is migrant, with the stock of
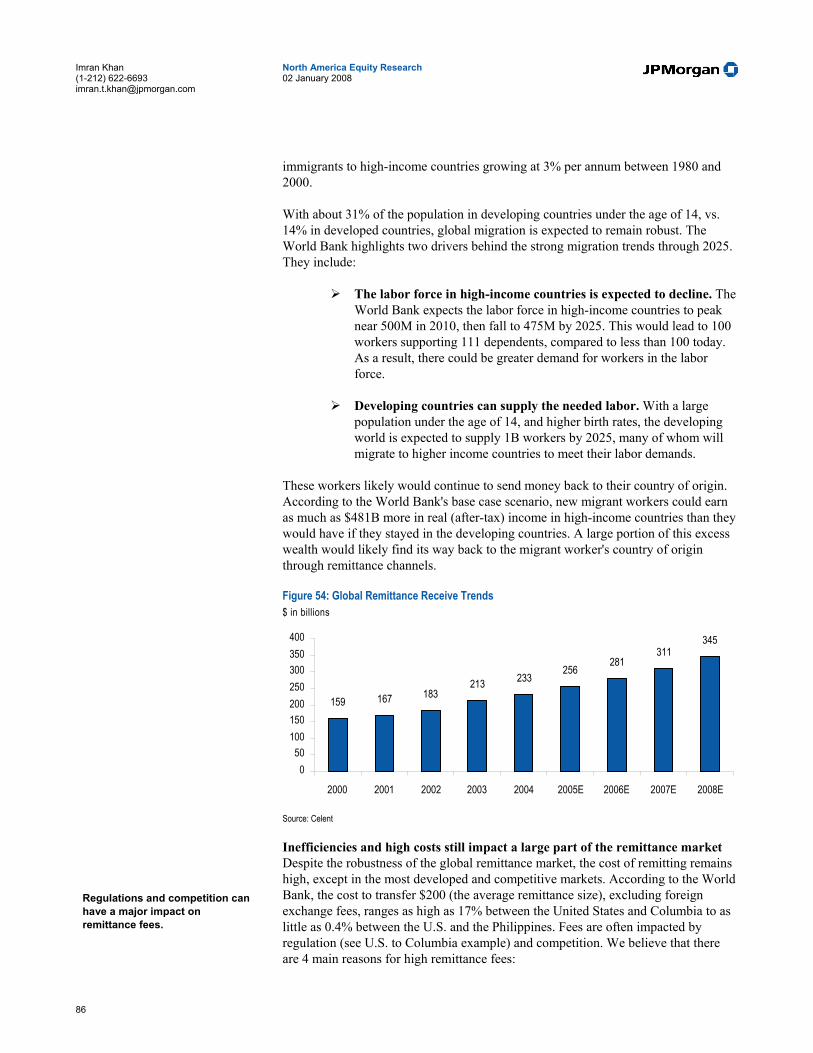
86
North America Equity Research 02 January 2008
Imran Khan (1-212) 622-6693 [email protected]
immigrants to high-income countries growing at 3% per annum between 1980 and 2000.
With about 31% of the population in developing countries under the age of 14, vs. 14% in developed countries, global migration is expected to remain robust. The World Bank highlights two drivers behind the strong migration trends through 2025. They include:
The labor force in high-income countries is expected to decline. The World Bank expects the labor force in high-income countries to peak near 500M in 2010, then fall to 475M by 2025. This would lead to 100 workers supporting 111 dependents, compared to less than 100 today. As a result, there could be greater demand for workers in the labor force.
Developing countries can supply the needed labor. With a large population under the age of 14, and higher birth rates, the developing world is expected to supply 1B workers by 2025, many of whom will migrate to higher income countries to meet their labor demands.
These workers likely would continue to send money back to their country of origin. According to the World Bank's base case scenario, new migrant workers could earn as much as $481B more in real (after-tax) income in high-income countries than they would have if they stayed in the developing countries. A large portion of this excess wealth would likely find its way back to the migrant worker's country of origin through remittance channels.
Figure 54: Global Remittance Receive Trends $ in billions
159 167 183213 233
256281
311345
050
100150200250300350400
2000 2001 2002 2003 2004 2005E 2006E 2007E 2008E
Source: Celent Inefficiencies and high costs still impact a large part of the remittance market Despite the robustness of the global remittance market, the cost of remitting remains high, except in the most developed and competitive markets. According to the World Bank, the cost to transfer $200 (the average remittance size), excluding foreign exchange fees, ranges as high as 17% between the United States and Columbia to as little as 0.4% between the U.S. and the Philippines. Fees are often impacted by regulation (see U.S. to Columbia example) and competition. We believe that there are 4 main reasons for high remittance fees:
Regulations and competition can have a major impact on remittance fees.
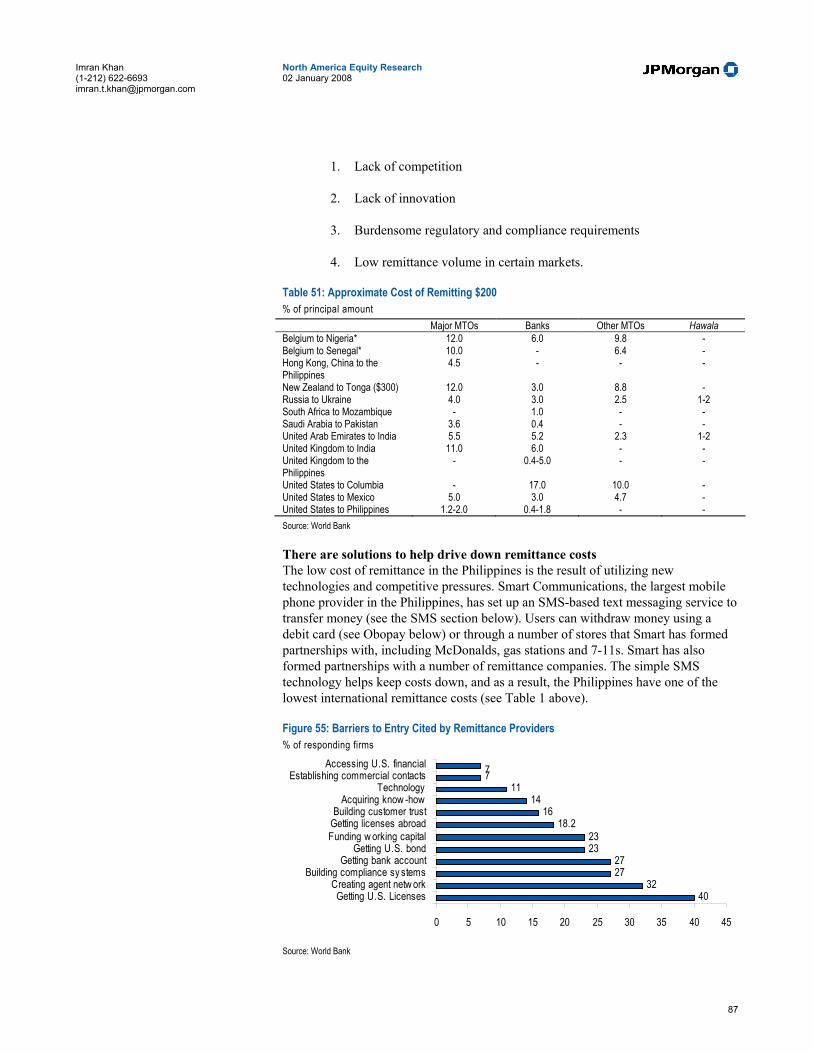
87
North America Equity Research 02 January 2008
Imran Khan (1-212) 622-6693 [email protected]
1. Lack of competition
2. Lack of innovation
3. Burdensome regulatory and compliance requirements
4. Low remittance volume in certain markets.
Table 51: Approximate Cost of Remitting $200 % of principal amount
Major MTOs Banks Other MTOs Hawala Belgium to Nigeria* 12.0 6.0 9.8 - Belgium to Senegal* 10.0 - 6.4 - Hong Kong, China to the Philippines
4.5 - - -
New Zealand to Tonga ($300) 12.0 3.0 8.8 - Russia to Ukraine 4.0 3.0 2.5 1-2 South Africa to Mozambique - 1.0 - - Saudi Arabia to Pakistan 3.6 0.4 - - United Arab Emirates to India 5.5 5.2 2.3 1-2 United Kingdom to India 11.0 6.0 - - United Kingdom to the Philippines
- 0.4-5.0 - -
United States to Columbia - 17.0 10.0 - United States to Mexico 5.0 3.0 4.7 - United States to Philippines 1.2-2.0 0.4-1.8 - - Source: World Bank There are solutions to help drive down remittance costs The low cost of remittance in the Philippines is the result of utilizing new technologies and competitive pressures. Smart Communications, the largest mobile phone provider in the Philippines, has set up an SMS-based text messaging service to transfer money (see the SMS section below). Users can withdraw money using a debit card (see Obopay below) or through a number of stores that Smart has formed partnerships with, including McDonalds, gas stations and 7-11s. Smart has also formed partnerships with a number of remittance companies. The simple SMS technology helps keep costs down, and as a result, the Philippines have one of the lowest international remittance costs (see Table 1 above).
Figure 55: Barriers to Entry Cited by Remittance Providers % of responding firms
4032
2727
2323
18.216
1411
77
0 5 10 15 20 25 30 35 40 45
Getting U.S. LicensesCreating agent netw ork
Building compliance sy stemsGetting bank account
Getting U.S. bondFunding w orking capitalGetting licenses abroadBuilding customer trust
Acquiring know -howTechnology
Establishing commercial contactsAccessing U.S. financial
Source: World Bank
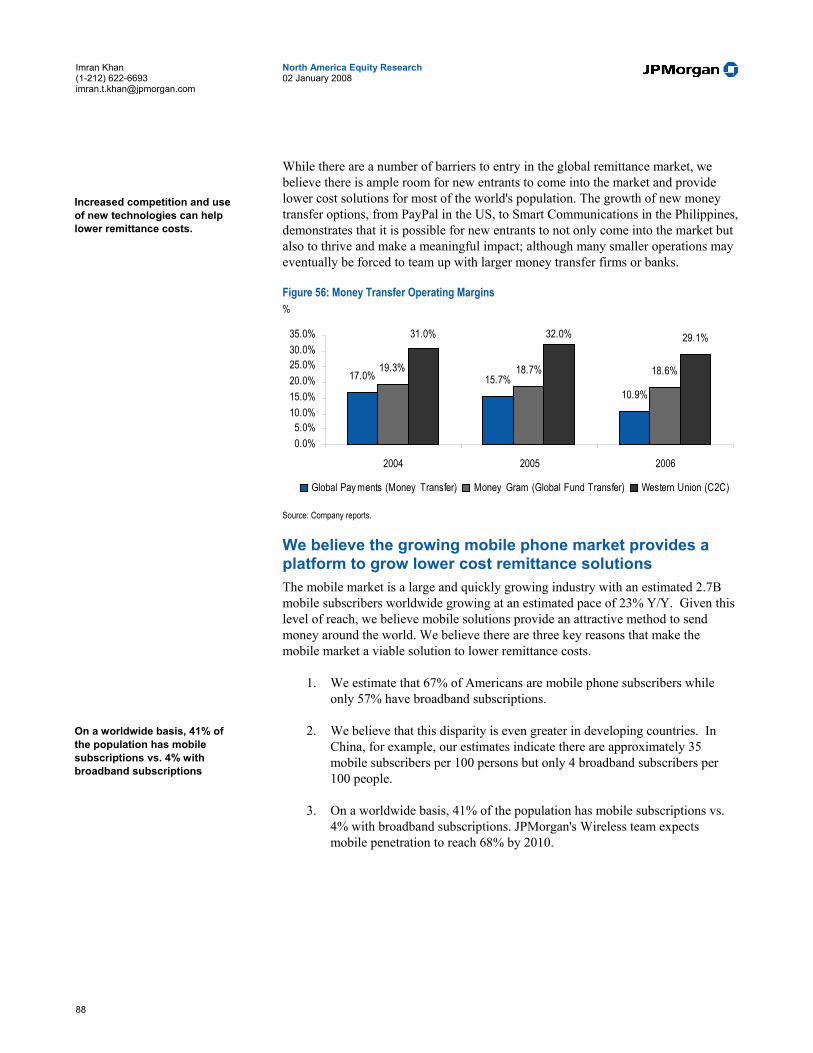
88
North America Equity Research 02 January 2008
Imran Khan (1-212) 622-6693 [email protected]
While there are a number of barriers to entry in the global remittance market, we believe there is ample room for new entrants to come into the market and provide lower cost solutions for most of the world's population. The growth of new money transfer options, from PayPal in the US, to Smart Communications in the Philippines, demonstrates that it is possible for new entrants to not only come into the market but also to thrive and make a meaningful impact; although many smaller operations may eventually be forced to team up with larger money transfer firms or banks.
Figure 56: Money Transfer Operating Margins %
17.0% 15.7%10.9%
19.3% 18.7% 18.6%
31.0% 32.0% 29.1%
0.0%5.0%
10.0%15.0%20.0%25.0%30.0%35.0%
2004 2005 2006
Global Pay ments (Money Transfer) Money Gram (Global Fund Transfer) Western Union (C2C)
Source: Company reports.
We believe the growing mobile phone market provides a platform to grow lower cost remittance solutions The mobile market is a large and quickly growing industry with an estimated 2.7B mobile subscribers worldwide growing at an estimated pace of 23% Y/Y. Given this level of reach, we believe mobile solutions provide an attractive method to send money around the world. We believe there are three key reasons that make the mobile market a viable solution to lower remittance costs.
1. We estimate that 67% of Americans are mobile phone subscribers while only 57% have broadband subscriptions.
2. We believe that this disparity is even greater in developing countries. In China, for example, our estimates indicate there are approximately 35 mobile subscribers per 100 persons but only 4 broadband subscribers per 100 people.
3. On a worldwide basis, 41% of the population has mobile subscriptions vs. 4% with broadband subscriptions. JPMorgan's Wireless team expects mobile penetration to reach 68% by 2010.
Increased competition and use of new technologies can help lower remittance costs.
On a worldwide basis, 41% of the population has mobile subscriptions vs. 4% with broadband subscriptions

89
North America Equity Research 02 January 2008
Imran Khan (1-212) 622-6693 [email protected]
Table 52: Mobile and Broadband Penetration by Country millions Country Population (M) Broadband
Subs (M) BB Subs per 100 Persons
Mobile Subs (M)
Mobile Subs per 100 Persons
Egypt 71.4 0.1 0.1 13.6 19.1 Morocco 30.7 0.3 1.0 16.0 52.1 South Africa 47.6 0.2 0.5 39.7 83.3 Africa 914.3 2.9 0.3 193.8 21.2 China 1,323.7 47.0 3.6 461.1 34.8 Hong Kong 7.1 1.5 21.6 9.4 131.5 India 1,119.7 2.0 0.2 166.1 14.8 Indonesia 225.5 0.5 0.2 63.8 28.3 Japan 128.2 24.2 19.0 101.7 79.3 Malaysia 25.8 0.7 2.7 19.5 75.5 Pakistan 157.0 0.1 0.1 34.5 22.0 Philippines 84.5 0.1 0.2 42.9 50.8 South Korea 48.0 12.8 26.1 40.2 83.8 Taiwan 22.8 4.4 19.2 23.2 102.0 Thailand 64.8 0.3 0.5 40.8 63.0 Vietnam 85.3 0.3 0.4 15.5 18.2 Asia Pacific 3,693.0 99.6 2.7 1,073.3 29.1 Austria 8.2 1.5 17.8 9.3 112.8 Belgium 10.4 2.0 19.5 9.7 92.6 Czech Republic 10.2 1.0 9.4 12.1 119.0 Denmark 5.4 1.6 29.1 5.8 107.3 Finland 5.3 1.3 25.0 5.7 107.8 France 60.7 11.1 17.7 51.7 85.1 Germany 82.7 12.4 15.1 84.3 101.9 Greece 11.1 0.3 2.8 11.1 99.6 Hungary 10.1 0.8 7.9 10.0 99.0 Italy 58.1 8.0 13.8 71.5 123.1 Netherlands 16.3 4.7 28.5 15.8 97.2 Norway 4.6 1.1 24.7 5.0 108.6 Poland 38.5 2.0 5.3 36.7 95.5 Portugal 10.5 1.4 12.8 12.2 116.0 Romania 21.6 0.4 1.8 17.4 80.5 Russia 142.5 2.1 1.5 150.0 105.2 Spain 43.4 5.9 14.6 46.2 106.4 Sweden 9.1 2.1 22.7 9.6 105.9 Switzerland 7.3 2.0 25.9 7.4 102.1 Turkey 74.2 2.1 3.0 52.7 71.0 Ukraine 46.0 0.1 0.2 49.1 106.7 United Kingdom 59.8 11.6 19.1 69.7 116.4 Europe 813.1 72.4 9.0 797.6 98.1 Iran 69.1 NA NA 13.7 19.4 Israel 6.4 1.5 23.5 8.4 122.7 Middle East 190.0 3.8 2.0 63.6 33.5 Canada 32.4 7.2 21.5 17.0 52.5 Mexico 108.3 3.0 2.7 57.0 52.6 United States 299.7 56.5 18.8 201.7 67.3 North America 439.0 66.6 15.2 275.7 62.8 Australia 20.4 3.5 17.3 19.8 97.0 New Zealand 4.0 0.5 11.7 3.5 87.6 Oceania 33.2 4.0 11.8 24.1 72.6 Argentina 39.1 1.1 2.7 31.5 80.5 Brazil 188.9 4.9 2.6 99.9 52.9 Chile 16.5 1.1 6.8 12.5 75.6 Colombia 46.3 0.5 1.1 29.8 64.3 Peru 28.4 0.4 1.5 8.5 30.0 Venezuela 27.2 0.4 1.6 18.8 69.0 Latin America 461.8 9.7 2.6 282.3 61.1
World Wide 6,544.4 259.1 3.9 2,710.4 41.4 Source: CIA Government Stats (http://www.cia.gov/cia/publications/factbook/index.html), International Telecommunications Union (http://www.itu.int/ITU-D/ict/statistics), JPMorgan estimates.

90
North America Equity Research 02 January 2008
Imran Khan (1-212) 622-6693 [email protected]
Developing payment processing solutions geared around mobile devices would greatly improve the reach of current remittance options, in our view. With the growing prevalence of mobile devices, someone in Ghana may some day be able to transfer money to someone in Northern Alaska without needing to visit a bank or Western Union. As the example of the Philippines demonstrates, this may even be at a lower cost than the options that are currently available.
Increased Mobile Internet Penetration Gives Users the Freedom to Access and Send Information from Almost Anywhere U.S. mobile Internet usage has been slow to take off; the number of users with Internet capable phones and high-speed mobile data connections has remained small. However, that is changing as more users buy data-enabled phones, such as the iPhone, and access high-speed mobile data networks such as Sprint’s EVDO network and AT&T’s HSDPA network. According the Pew Internet & American Life Project report on mobile usage, only 14% of mobile subscribers use their phones to access the Internet, but 16% stated that they would like to have mobile Internet access. Despite a low penetration, mobile broadband access (defined as speeds of 200kps or more in at least one direction) continues to grow, increasing from 2,574 individual users in June 2005 to 2.4M individual users (21.9M if business devices are included) in Dec. 2006, according to the FCC. We expect mobile broadband growth to remain robust and to play a key role in the adaptation of m-commerce and mobile payment solutions.
Figure 57: U.S. Mobile Device Usage %
0% 10% 20% 30% 40% 50% 60%
Send/receiv e tex t messagesTake still pictures
Play gamesAccess the InternetSend/receiv e email
Perform Internet searchesTrade instant messages
Currently use Would like to hav e
Source: Pew Internet & American Life Project
Mobile Users Are Adopting SMS as a Primary Way to Communicate While mobile Internet growth has been slow, text messaging, or SMS, use has thrived, unencumbered by slow connections or text-heavy displays. According to the Pew Internet & American Life Project, over 35% of all cell phone users use text-based messaging, while 65% of those 18-29 use text messaging. SMS growth in the US has been robust during the past 2 years, growing 300%, according to the CTIA. SMS usage outside the US has also been strong, with 41% of Europeans using text messaging services. SMS, which doesn’t require the latest mobile technology or high-priced cell phones, provides a low-cost method to grow the mobile remittance
According to the FCC, individuals in the U.S. with high-speed mobile access increased to 2.4M in Dec. 2006, from 2,574 in June 2005.
In the U.S., 65% of 18-29 year olds use text messaging.
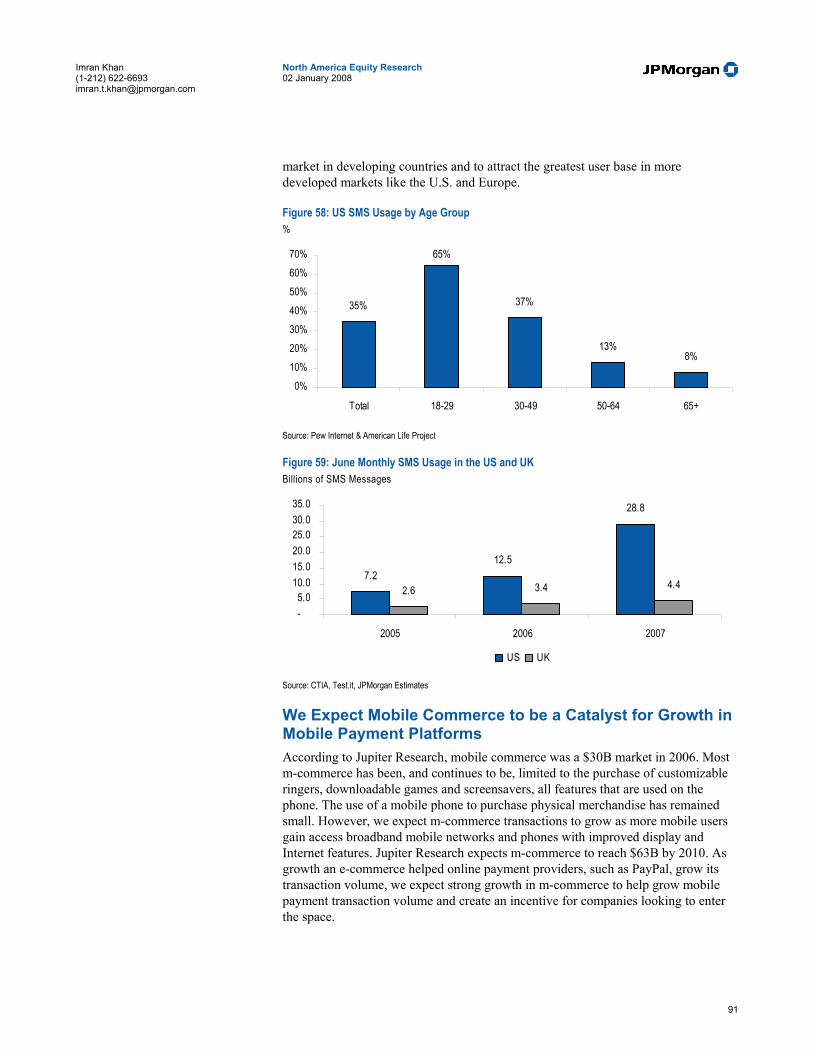
91
North America Equity Research 02 January 2008
Imran Khan (1-212) 622-6693 [email protected]
market in developing countries and to attract the greatest user base in more developed markets like the U.S. and Europe.
Figure 58: US SMS Usage by Age Group %
35%
65%
37%
13%8%
0%10%20%30%40%50%60%70%
Total 18-29 30-49 50-64 65+
Source: Pew Internet & American Life Project Figure 59: June Monthly SMS Usage in the US and UK Billions of SMS Messages
7.212.5
28.8
2.6 3.4 4.4
-5.0
10.015.020.025.030.035.0
2005 2006 2007
US UK
Source: CTIA, Test.it, JPMorgan Estimates
We Expect Mobile Commerce to be a Catalyst for Growth in Mobile Payment Platforms According to Jupiter Research, mobile commerce was a $30B market in 2006. Most m-commerce has been, and continues to be, limited to the purchase of customizable ringers, downloadable games and screensavers, all features that are used on the phone. The use of a mobile phone to purchase physical merchandise has remained small. However, we expect m-commerce transactions to grow as more mobile users gain access broadband mobile networks and phones with improved display and Internet features. Jupiter Research expects m-commerce to reach $63B by 2010. As growth an e-commerce helped online payment providers, such as PayPal, grow its transaction volume, we expect strong growth in m-commerce to help grow mobile payment transaction volume and create an incentive for companies looking to enter the space.

92
North America Equity Research 02 January 2008
Imran Khan (1-212) 622-6693 [email protected]
Figure 60: PayPal Transaction Volume Growth and eCommerce Penetration 2000-2007E $ in millions
-
100,000
200,000
300,000
400,000
500,000
2000 2001 2002 2003 2004 2005 2006 2007E
0.0%2.0%4.0%6.0%8.0%10.0%12.0%
eCommerce Sales Pay Pal TPV TPV as % eCommerce
Source: US Department of Commerce, JPMorgan estimates, Company data. We expect point of sale transactions to have a limited impact on mobile commerce growth Companies such as Nokia and Samsung have looked at adding microchips to cell phones to drive mobile commerce growth at the retail store level. Using a chip embedded in their cell phone, a user can scan their phone near a reader and pay for merchandise at the store (point of sale) using funds from their credit card, bank account or other account, possibly set up through the cell phone provider.
While companies focus on near field communication solution (NFC) to drive point of sale (POS) transactions, the marketplace for NFC solutions and the new technologies being tested are beyond the scope of this report. However, we are skeptical of the long-term viability of NFC solutions principally for four reasons –
1. We believe most people are fairly happy with their current POS solutions – NFC using credit cards, regular credit and debit cards and cash, and have little incentive to try something new.
2. Security is an issue for many users who are concerned about not only extra phone charges when they lose their phone, but also someone purchasing items with it. Also, many people are concerned about accidental charges, since their phone only needs to pass in the vicinity of a reader.
3. Having a chip embedded in the cell phone limits a customer’s choices and the ability to change phones, mobile providers or credit card companies easily.
4. Transactions can require the cooperation of as many as seven separate parties: (1) consumer, (2) merchant, (3) the consumer's bank, (4) the merchant's bank, (5) the payment network, (6) mobile operator, and (7) merchant processor. All of these parties create additional transaction costs and make implementation more difficult.
Bar codes are another payment option for POS transactions. Under this method, a mobile user purchases an item online, usually a ticket, and then receives a bar code verifying that the payment was made. When the user goes to use the ticket, or pick up the merchandise, the bar code on the phone is scanned. Mobilrelay (mbo.com) is one
93
North America Equity Research 02 January 2008
Imran Khan (1-212) 622-6693 [email protected]
company that sells movie tickets online and sends users a bar code to confirm their purchase. In Belgian, users who purchase tickets for the De Lijn train line between Antwerp and Ghent can use SMS to receive rail tickets. Bar codes and SMS payment confirmations are essentially a replacement for the printed ticket. As a result, we expect usage will be primarily limited to entertainment and travel ticket purchases.
Current Mobile Payment Systems SMS-Based Solutions With the popularity of SMS services on mobile networks, and helped by the fact that SMS-based services can operate independently of the users mobile service provider, SMS-based solutions are the most common option for mobile P2P money transfers. A typical P2P money transfer takes place in the following steps:
1. Send a text message to the Payment provider's number. Include the amount and phone number or email address (some providers, such as PayPal, allow transfers to PayPal members using an email address).
2. Since the transaction occurs over an unsecured SMS channel, the payment processor will typically send a text message or make a phone call to confirm the payment.
3. Once the payment is confirmed, the recipient receives a text or email notifying them that they have funds available in their account. If the recipient is not a current user of the payment service, they are invited to join, and typically cannot access their funds until they do so. Money that is not claimed is usually returned to the sender after a set period of time.
Users of SMS-based solutions can often use SMS messaging for other account-management services. Some common features include:
1. The ability to check your balance by sending a predetermined text message (ex. bal) to the service provider’s number.
2. The ability to request money from other users. This can be done by sending a text message to the provider’s number with the user’s information and the amount requested. Funds are not deposited until the transfer is confirmed by the user sending the money.
3. Users can also text to buy items using SMS payment solutions.
Adding and withdrawing money is usually done online, through a web-based interface, or sometimes through the use of a specially branded credit/debit card.
Web Interface and Software-Based Solutions Slow speeds and difficult to read text displays have kept many away from web interface solutions. However, as newer mobile broadband technologies (3G, etc) and better graphical interfaces (i.e. Apple iPhone) are rolled out, we expect cell phone Internet usage to grow. Web-based interface has the benefit of operability on most service provider networks (at least those that offer advanced Internet capabilities) and eliminates the need to download software on the user’s phone. It also creates a more secure transmission environment; the sender usually must log in with a user

94
North America Equity Research 02 January 2008
Imran Khan (1-212) 622-6693 [email protected]
name and password prior to sending money, and can enter a PIN number through the web interface, eliminating the need to receive a callback and/or text message verifying the sender’s information.
Figure 61: How KushCash Works
Source: www.kushcash.com
Software-based applications, offered by firms such as KushCash and retail banks (such as Bank of America, Citibank and Wachovia), offer another secure solution. The drawback to using software-based applications is that their usage is limited to certain carrier networks, which often depend more on relationships than the size of the network, and model of cell phones, although this limitation also exists for both SMS-based and web-based services. The advantage of software solutions is usually a more secure environment, as transfer requests are encrypted, and increased functionality over SMS-based solutions.
Conclusions Global migration has created a large market opportunity in remittance The increase in global migration has created a global remittance market that is expected to reach $345B by 2008, according to Celent. According to the World Bank remittance options for many people still remain high, with some people paying fees of 10% or more, before foreign currency exchange costs. We believe there is room for new competitors, other than the existing money transfer companies, to provide lower cost solutions, such as Smart Communications does in the Philippines.
The growth in mobile penetration creates an attractive vehicle to transfer funds. With over 68% of the world expected to have a mobile phone by 2010, we believe that mobile technology offers a viable and low-cost solution in the global remittance market. The attractiveness of this market has not been lost on the big players in the space as Western Union and MasterCard have teamed up with the GSM Association and Citibank has teamed with Obopay to offer mobile money transfer solutions.
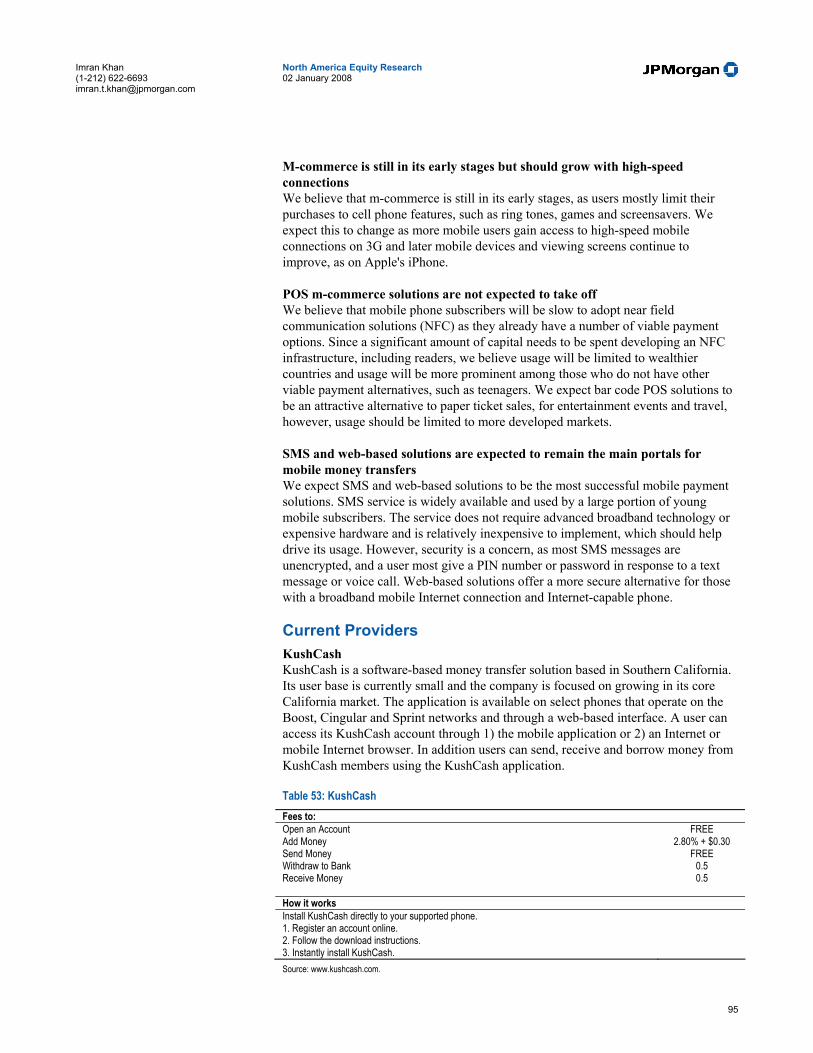
95
North America Equity Research 02 January 2008
Imran Khan (1-212) 622-6693 [email protected]
M-commerce is still in its early stages but should grow with high-speed connections We believe that m-commerce is still in its early stages, as users mostly limit their purchases to cell phone features, such as ring tones, games and screensavers. We expect this to change as more mobile users gain access to high-speed mobile connections on 3G and later mobile devices and viewing screens continue to improve, as on Apple's iPhone.
POS m-commerce solutions are not expected to take off We believe that mobile phone subscribers will be slow to adopt near field communication solutions (NFC) as they already have a number of viable payment options. Since a significant amount of capital needs to be spent developing an NFC infrastructure, including readers, we believe usage will be limited to wealthier countries and usage will be more prominent among those who do not have other viable payment alternatives, such as teenagers. We expect bar code POS solutions to be an attractive alternative to paper ticket sales, for entertainment events and travel, however, usage should be limited to more developed markets.
SMS and web-based solutions are expected to remain the main portals for mobile money transfers We expect SMS and web-based solutions to be the most successful mobile payment solutions. SMS service is widely available and used by a large portion of young mobile subscribers. The service does not require advanced broadband technology or expensive hardware and is relatively inexpensive to implement, which should help drive its usage. However, security is a concern, as most SMS messages are unencrypted, and a user most give a PIN number or password in response to a text message or voice call. Web-based solutions offer a more secure alternative for those with a broadband mobile Internet connection and Internet-capable phone.
Current Providers KushCash KushCash is a software-based money transfer solution based in Southern California. Its user base is currently small and the company is focused on growing in its core California market. The application is available on select phones that operate on the Boost, Cingular and Sprint networks and through a web-based interface. A user can access its KushCash account through 1) the mobile application or 2) an Internet or mobile Internet browser. In addition users can send, receive and borrow money from KushCash members using the KushCash application.
Table 53: KushCash Fees to: Open an Account FREE Add Money 2.80% + $0.30 Send Money FREE Withdraw to Bank 0.5 Receive Money 0.5
How it works Install KushCash directly to your supported phone. 1. Register an account online. 2. Follow the download instructions. 3. Instantly install KushCash. Source: www.kushcash.com.
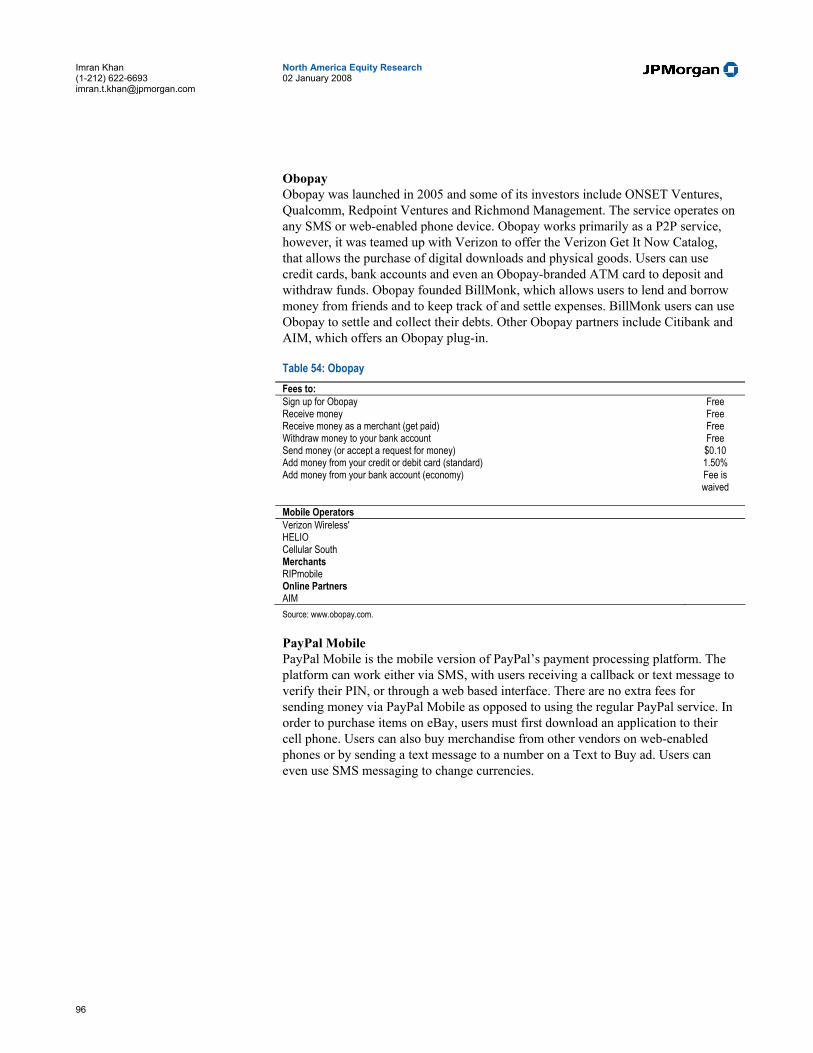
96
North America Equity Research 02 January 2008
Imran Khan (1-212) 622-6693 [email protected]
Obopay Obopay was launched in 2005 and some of its investors include ONSET Ventures, Qualcomm, Redpoint Ventures and Richmond Management. The service operates on any SMS or web-enabled phone device. Obopay works primarily as a P2P service, however, it was teamed up with Verizon to offer the Verizon Get It Now Catalog, that allows the purchase of digital downloads and physical goods. Users can use credit cards, bank accounts and even an Obopay-branded ATM card to deposit and withdraw funds. Obopay founded BillMonk, which allows users to lend and borrow money from friends and to keep track of and settle expenses. BillMonk users can use Obopay to settle and collect their debts. Other Obopay partners include Citibank and AIM, which offers an Obopay plug-in.
Table 54: Obopay Fees to: FEE Sign up for Obopay Free Receive money Free Receive money as a merchant (get paid) Free Withdraw money to your bank account Free Send money (or accept a request for money) $0.10 Add money from your credit or debit card (standard) 1.50% Add money from your bank account (economy) Fee is
waived Mobile Operators Verizon Wireless' HELIO Cellular South Merchants RIPmobile Online Partners AIM Source: www.obopay.com. PayPal Mobile PayPal Mobile is the mobile version of PayPal’s payment processing platform. The platform can work either via SMS, with users receiving a callback or text message to verify their PIN, or through a web based interface. There are no extra fees for sending money via PayPal Mobile as opposed to using the regular PayPal service. In order to purchase items on eBay, users must first download an application to their cell phone. Users can also buy merchandise from other vendors on web-enabled phones or by sending a text message to a number on a Text to Buy ad. Users can even use SMS messaging to change currencies.
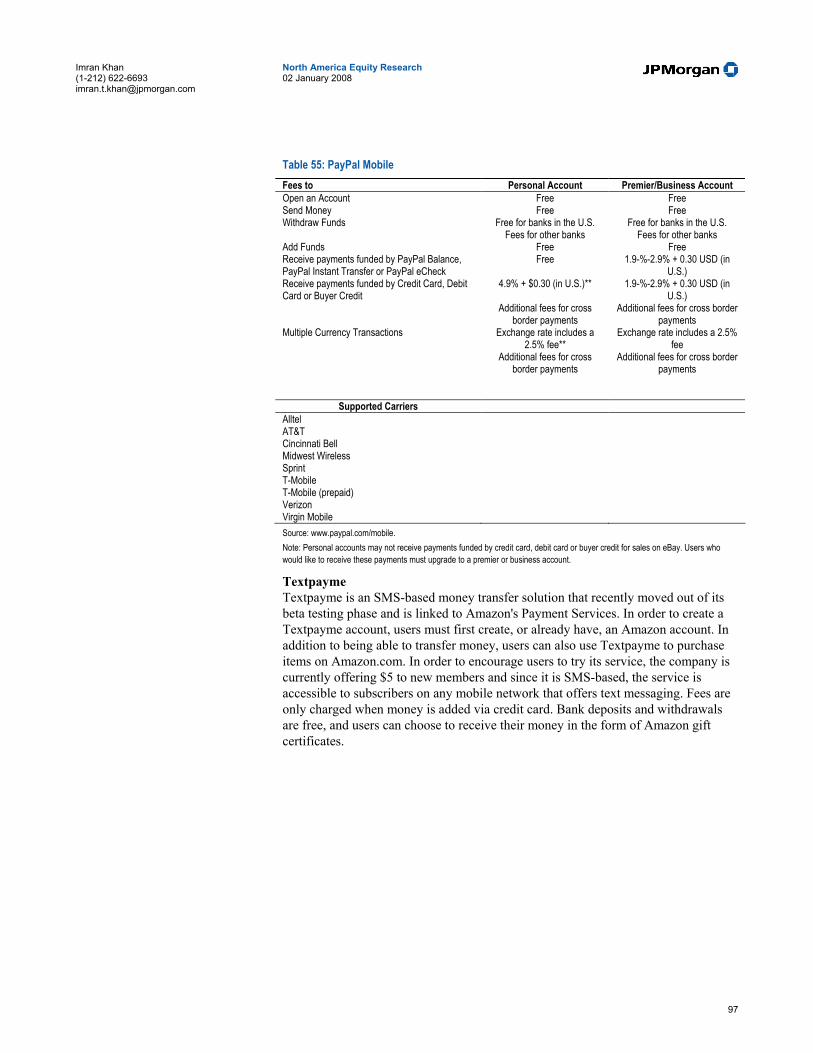
97
North America Equity Research 02 January 2008
Imran Khan (1-212) 622-6693 [email protected]
Table 55: PayPal Mobile Fees to Personal Account Premier/Business Account Open an Account Free Free Send Money Free Free Withdraw Funds Free for banks in the U.S.
Fees for other banks Free for banks in the U.S.
Fees for other banks Add Funds Free Free Receive payments funded by PayPal Balance, PayPal Instant Transfer or PayPal eCheck
Free 1.9-%-2.9% + 0.30 USD (in U.S.)
Receive payments funded by Credit Card, Debit Card or Buyer Credit
4.9% + $0.30 (in U.S.)** 1.9-%-2.9% + 0.30 USD (in U.S.)
Additional fees for cross border payments
Additional fees for cross border payments
Multiple Currency Transactions Exchange rate includes a 2.5% fee**
Exchange rate includes a 2.5% fee
Additional fees for cross border payments
Additional fees for cross border payments
Supported Carriers Alltel AT&T Cincinnati Bell Midwest Wireless Sprint T-Mobile T-Mobile (prepaid) Verizon Virgin Mobile Source: www.paypal.com/mobile. Note: Personal accounts may not receive payments funded by credit card, debit card or buyer credit for sales on eBay. Users who would like to receive these payments must upgrade to a premier or business account.
Textpayme Textpayme is an SMS-based money transfer solution that recently moved out of its beta testing phase and is linked to Amazon's Payment Services. In order to create a Textpayme account, users must first create, or already have, an Amazon account. In addition to being able to transfer money, users can also use Textpayme to purchase items on Amazon.com. In order to encourage users to try its service, the company is currently offering $5 to new members and since it is SMS-based, the service is accessible to subscribers on any mobile network that offers text messaging. Fees are only charged when money is added via credit card. Bank deposits and withdrawals are free, and users can choose to receive their money in the form of Amazon gift certificates.
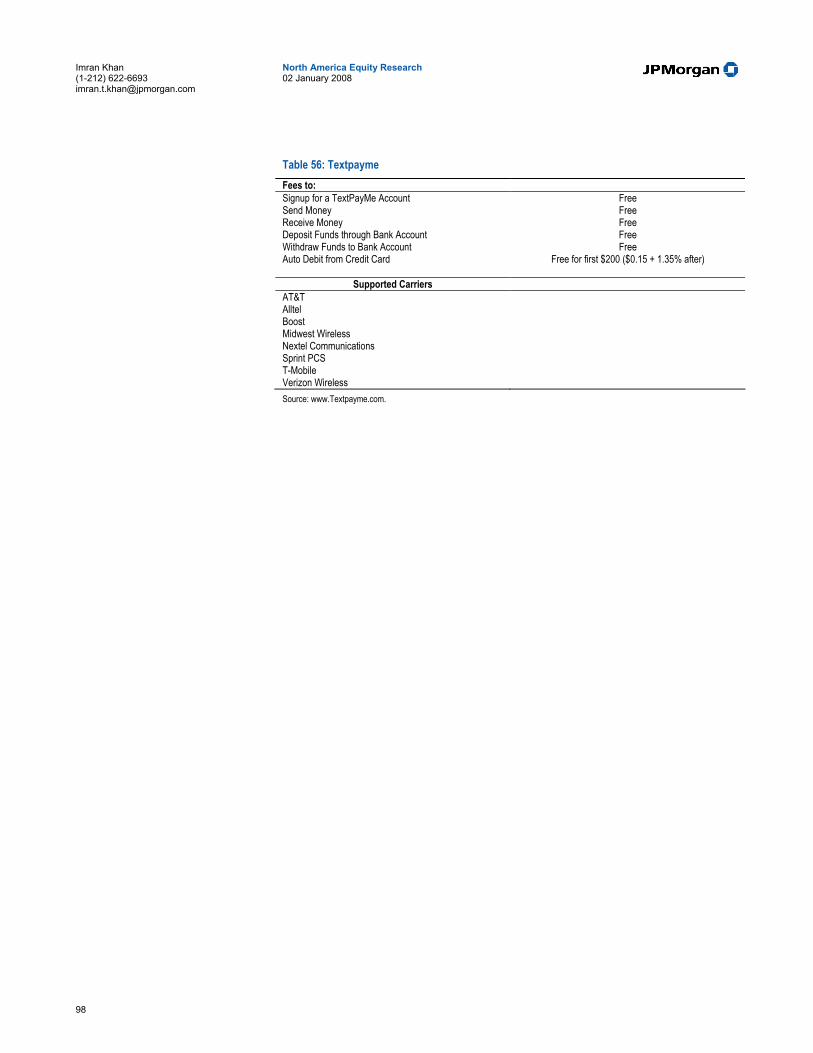
98
North America Equity Research 02 January 2008
Imran Khan (1-212) 622-6693 [email protected]
Table 56: Textpayme Fees to: Signup for a TextPayMe Account Free Send Money Free Receive Money Free Deposit Funds through Bank Account Free Withdraw Funds to Bank Account Free Auto Debit from Credit Card Free for first $200 ($0.15 + 1.35% after)
Supported Carriers
AT&T Alltel Boost Midwest Wireless Nextel Communications Sprint PCS T-Mobile Verizon Wireless Source: www.Textpayme.com.

China Sector O
utlook

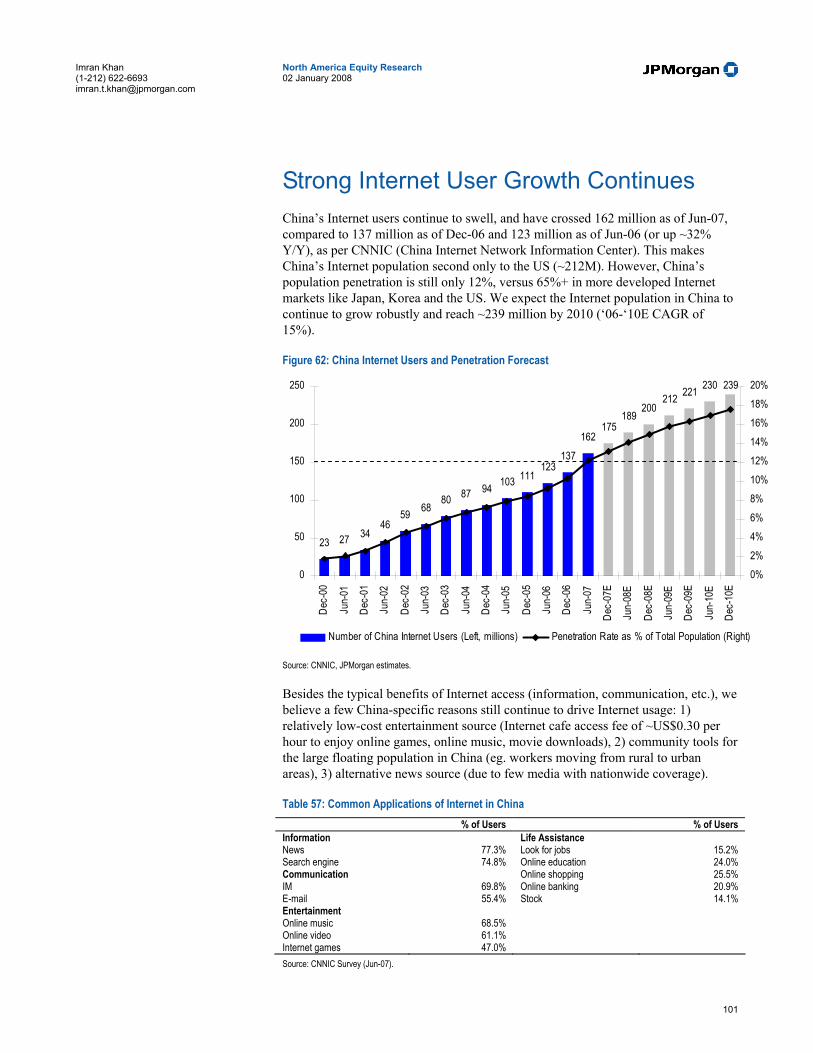
101
North America Equity Research 02 January 2008
Imran Khan (1-212) 622-6693 [email protected]
Strong Internet User Growth Continues China’s Internet users continue to swell, and have crossed 162 million as of Jun-07, compared to 137 million as of Dec-06 and 123 million as of Jun-06 (or up ~32% Y/Y), as per CNNIC (China Internet Network Information Center). This makes China’s Internet population second only to the US (~212M). However, China’s population penetration is still only 12%, versus 65%+ in more developed Internet markets like Japan, Korea and the US. We expect the Internet population in China to continue to grow robustly and reach ~239 million by 2010 (‘06-‘10E CAGR of 15%).
Figure 62: China Internet Users and Penetration Forecast
23 27 3446
59 6880 87 94 103 111
123137
162175
189200
212 221 230 239
0
50
100
150
200
250
Dec-
00
Jun-
01
Dec-
01
Jun-
02
Dec-
02
Jun-
03
Dec-
03
Jun-
04
Dec-
04
Jun-
05
Dec-
05
Jun-
06
Dec-
06
Jun-
07
Dec-
07E
Jun-
08E
Dec-
08E
Jun-
09E
Dec-
09E
Jun-
10E
Dec-
10E
0%2%4%6%8%10%12%14%16%18%20%
Number of China Internet Users (Left, millions) Penetration Rate as % of Total Population (Right)
Source: CNNIC, JPMorgan estimates. Besides the typical benefits of Internet access (information, communication, etc.), we believe a few China-specific reasons still continue to drive Internet usage: 1) relatively low-cost entertainment source (Internet cafe access fee of ~US$0.30 per hour to enjoy online games, online music, movie downloads), 2) community tools for the large floating population in China (eg. workers moving from rural to urban areas), 3) alternative news source (due to few media with nationwide coverage).
Table 57: Common Applications of Internet in China % of Users % of Users Information Life Assistance News 77.3% Look for jobs 15.2% Search engine 74.8% Online education 24.0% Communication Online shopping 25.5% IM 69.8% Online banking 20.9% E-mail 55.4% Stock 14.1% Entertainment Online music 68.5% Online video 61.1% Internet games 47.0% Source: CNNIC Survey (Jun-07).
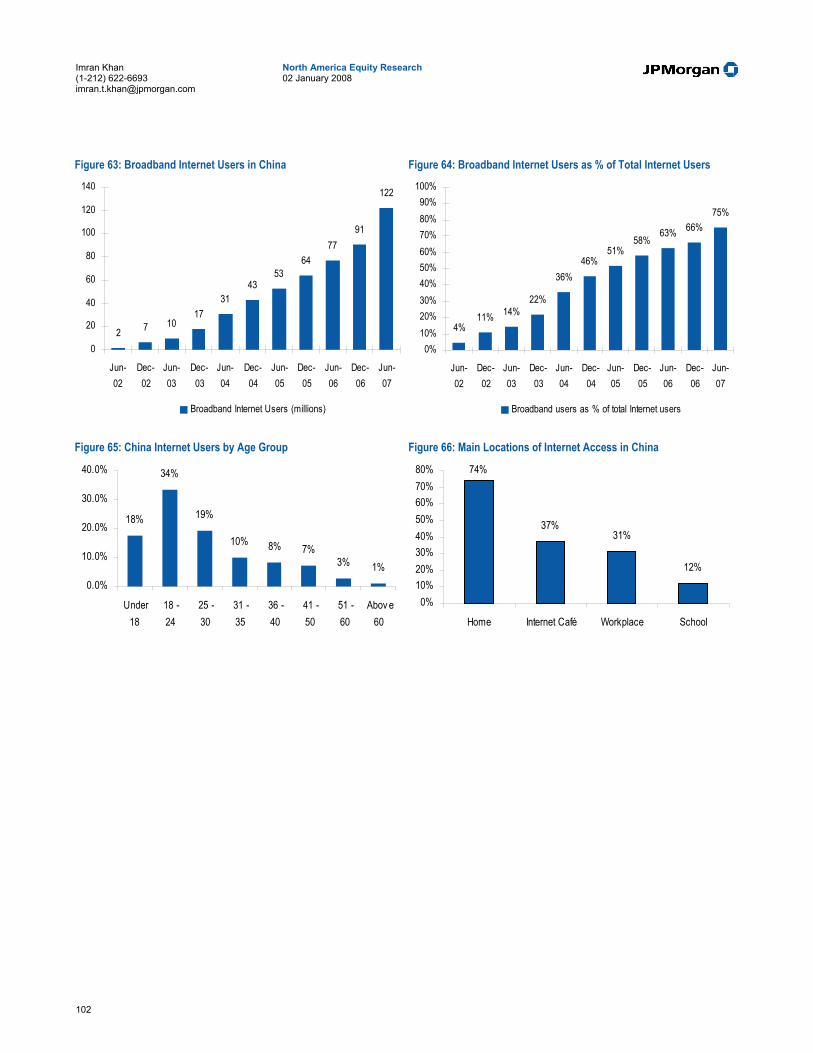
102
North America Equity Research 02 January 2008
Imran Khan (1-212) 622-6693 [email protected]
Figure 63: Broadband Internet Users in China
2 7 1017
3143
5364
7791
122
0
20
40
60
80
100
120
140
Jun-02
Dec-02
Jun-03
Dec-03
Jun-04
Dec-04
Jun-05
Dec-05
Jun-06
Dec-06
Jun-07
Broadband Internet Users (millions)
Figure 64: Broadband Internet Users as % of Total Internet Users
4%11% 14%
22%
36%46%
51%58%
63% 66%75%
0%10%20%30%40%50%60%70%80%90%
100%
Jun-02
Dec-02
Jun-03
Dec-03
Jun-04
Dec-04
Jun-05
Dec-05
Jun-06
Dec-06
Jun-07
Broadband users as % of total Internet users
Figure 65: China Internet Users by Age Group
18%
34%
19%
10% 8% 7%3% 1%
0.0%
10.0%
20.0%
30.0%
40.0%
Under18
18 -24
25 -30
31 -35
36 -40
41 -50
51 -60
Abov e60
Figure 66: Main Locations of Internet Access in China
74%
37%31%
12%
0%10%20%30%40%50%60%70%80%
Home Internet Café Workplace School
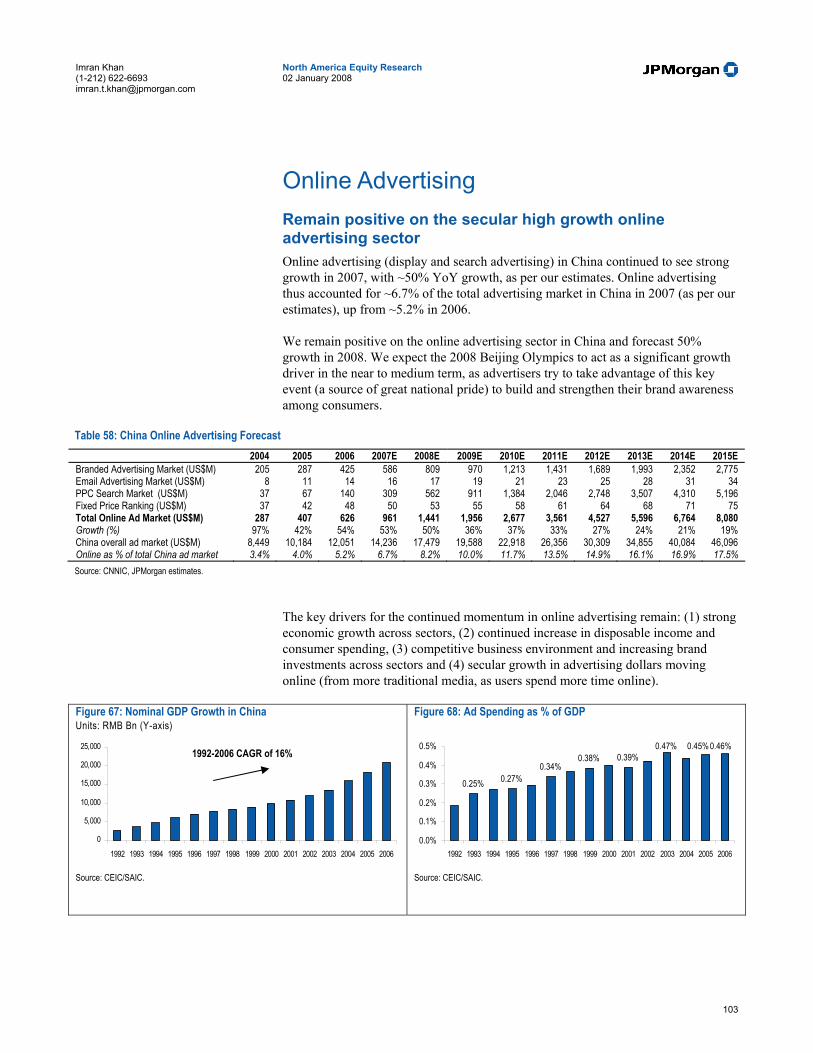
103
North America Equity Research 02 January 2008
Imran Khan (1-212) 622-6693 [email protected]
Online Advertising Remain positive on the secular high growth online advertising sector Online advertising (display and search advertising) in China continued to see strong growth in 2007, with ~50% YoY growth, as per our estimates. Online advertising thus accounted for ~6.7% of the total advertising market in China in 2007 (as per our estimates), up from ~5.2% in 2006.
We remain positive on the online advertising sector in China and forecast 50% growth in 2008. We expect the 2008 Beijing Olympics to act as a significant growth driver in the near to medium term, as advertisers try to take advantage of this key event (a source of great national pride) to build and strengthen their brand awareness among consumers.
Table 58: China Online Advertising Forecast 2004 2005 2006 2007E 2008E 2009E 2010E 2011E 2012E 2013E 2014E 2015E
Branded Advertising Market (US$M) 205 287 425 586 809 970 1,213 1,431 1,689 1,993 2,352 2,775 Email Advertising Market (US$M) 8 11 14 16 17 19 21 23 25 28 31 34 PPC Search Market (US$M) 37 67 140 309 562 911 1,384 2,046 2,748 3,507 4,310 5,196 Fixed Price Ranking (US$M) 37 42 48 50 53 55 58 61 64 68 71 75 Total Online Ad Market (US$M) 287 407 626 961 1,441 1,956 2,677 3,561 4,527 5,596 6,764 8,080 Growth (%) 97% 42% 54% 53% 50% 36% 37% 33% 27% 24% 21% 19% China overall ad market (US$M) 8,449 10,184 12,051 14,236 17,479 19,588 22,918 26,356 30,309 34,855 40,084 46,096 Online as % of total China ad market 3.4% 4.0% 5.2% 6.7% 8.2% 10.0% 11.7% 13.5% 14.9% 16.1% 16.9% 17.5% Source: CNNIC, JPMorgan estimates.
The key drivers for the continued momentum in online advertising remain: (1) strong economic growth across sectors, (2) continued increase in disposable income and consumer spending, (3) competitive business environment and increasing brand investments across sectors and (4) secular growth in advertising dollars moving online (from more traditional media, as users spend more time online).
Figure 67: Nominal GDP Growth in China Units: RMB Bn (Y-axis)
0
5,000
10,000
15,000
20,000
25,000
1992 1993 1994 1995 1996 1997 1998 1999 2000 2001 2002 2003 2004 2005 2006
Source: CEIC/SAIC.
Figure 68: Ad Spending as % of GDP
0.25% 0.27%0.34%
0.38% 0.39%0.47% 0.45% 0.46%
0.0%
0.1%
0.2%
0.3%
0.4%
0.5%
1992 1993 1994 1995 1996 1997 1998 1999 2000 2001 2002 2003 2004 2005 2006
Source: CEIC/SAIC.
1992-2006 CAGR of 16%
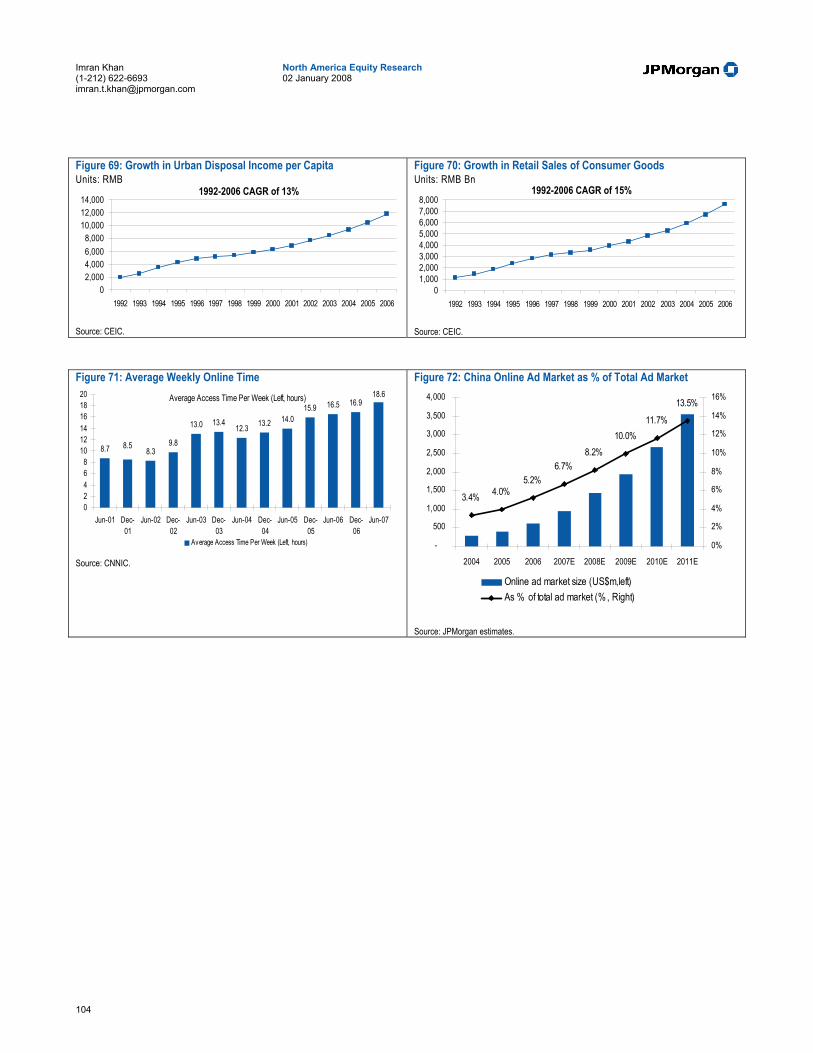
104
North America Equity Research 02 January 2008
Imran Khan (1-212) 622-6693 [email protected]
Figure 69: Growth in Urban Disposal Income per Capita Units: RMB
02,0004,0006,0008,000
10,00012,00014,000
1992 1993 1994 1995 1996 1997 1998 1999 2000 2001 2002 2003 2004 2005 2006
Source: CEIC.
Figure 70: Growth in Retail Sales of Consumer Goods Units: RMB Bn
01,0002,0003,0004,0005,0006,0007,0008,000
1992 1993 1994 1995 1996 1997 1998 1999 2000 2001 2002 2003 2004 2005 2006
Source: CEIC.
Figure 71: Average Weekly Online Time Average Access Time Per Week (Left, hours)
8.7 8.39.8
13.0 13.4 12.3 13.2 14.015.9 16.5 16.9
18.6
8.5
02468
101214161820
Jun-01 Dec-01
Jun-02 Dec-02
Jun-03 Dec-03
Jun-04 Dec-04
Jun-05 Dec-05
Jun-06 Dec-06
Jun-07
Average Access Time Per Week (Left, hours)
Source: CNNIC.
Figure 72: China Online Ad Market as % of Total Ad Market
11.7%
13.5%
10.0%8.2%
6.7%5.2%
4.0%3.4%
-
500
1,000
1,500
2,000
2,500
3,000
3,500
4,000
2004 2005 2006 2007E 2008E 2009E 2010E 2011E
0%
2%
4%
6%
8%
10%
12%
14%
16%
Online ad market size (US$m,left)As % of total ad market (% , Right)
Source: JPMorgan estimates.
1992-2006 CAGR of 13% 1992-2006 CAGR of 15%
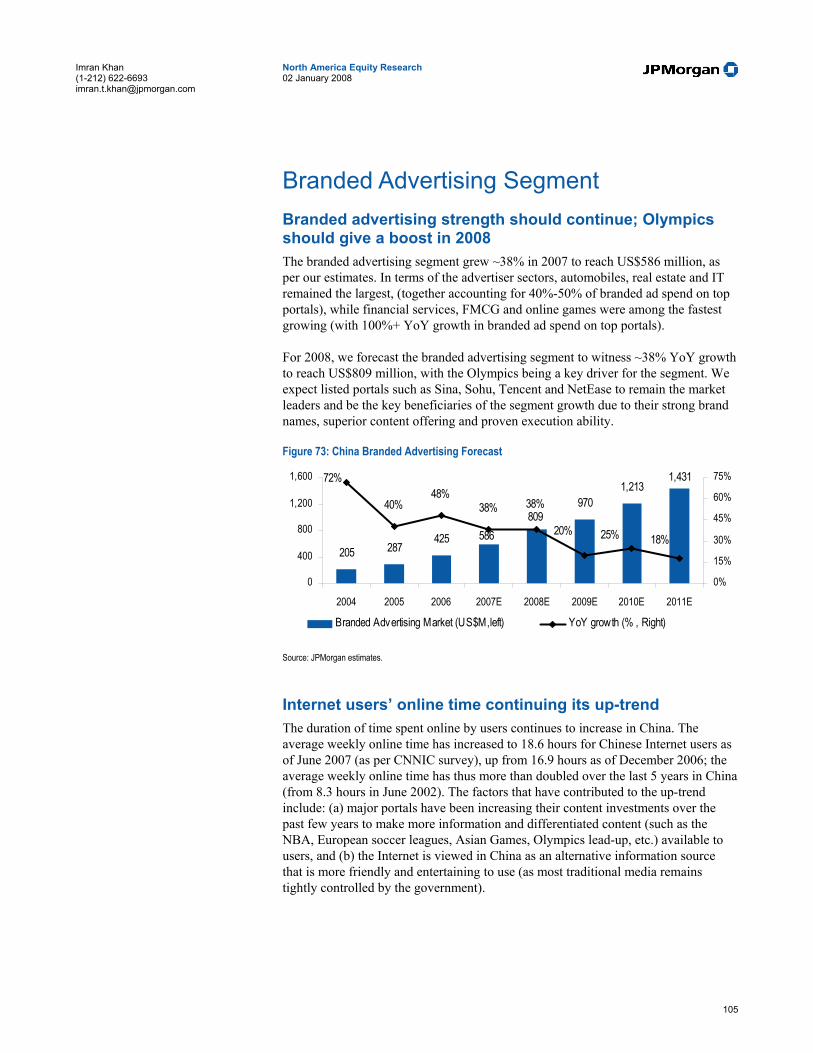
105
North America Equity Research 02 January 2008
Imran Khan (1-212) 622-6693 [email protected]
Branded Advertising Segment Branded advertising strength should continue; Olympics should give a boost in 2008 The branded advertising segment grew ~38% in 2007 to reach US$586 million, as per our estimates. In terms of the advertiser sectors, automobiles, real estate and IT remained the largest, (together accounting for 40%-50% of branded ad spend on top portals), while financial services, FMCG and online games were among the fastest growing (with 100%+ YoY growth in branded ad spend on top portals).
For 2008, we forecast the branded advertising segment to witness ~38% YoY growth to reach US$809 million, with the Olympics being a key driver for the segment. We expect listed portals such as Sina, Sohu, Tencent and NetEase to remain the market leaders and be the key beneficiaries of the segment growth due to their strong brand names, superior content offering and proven execution ability.
Figure 73: China Branded Advertising Forecast
205 287425
9701,213
1,431
809586 18%25%
72%
40%48%
38% 38%
20%
0
400
800
1,200
1,600
2004 2005 2006 2007E 2008E 2009E 2010E 2011E
0%
15%
30%
45%
60%
75%
Branded Advertising Market (US$M,left) YoY growth (% , Right)
Source: JPMorgan estimates.
Internet users’ online time continuing its up-trend The duration of time spent online by users continues to increase in China. The average weekly online time has increased to 18.6 hours for Chinese Internet users as of June 2007 (as per CNNIC survey), up from 16.9 hours as of December 2006; the average weekly online time has thus more than doubled over the last 5 years in China (from 8.3 hours in June 2002). The factors that have contributed to the up-trend include: (a) major portals have been increasing their content investments over the past few years to make more information and differentiated content (such as the NBA, European soccer leagues, Asian Games, Olympics lead-up, etc.) available to users, and (b) the Internet is viewed in China as an alternative information source that is more friendly and entertaining to use (as most traditional media remains tightly controlled by the government).
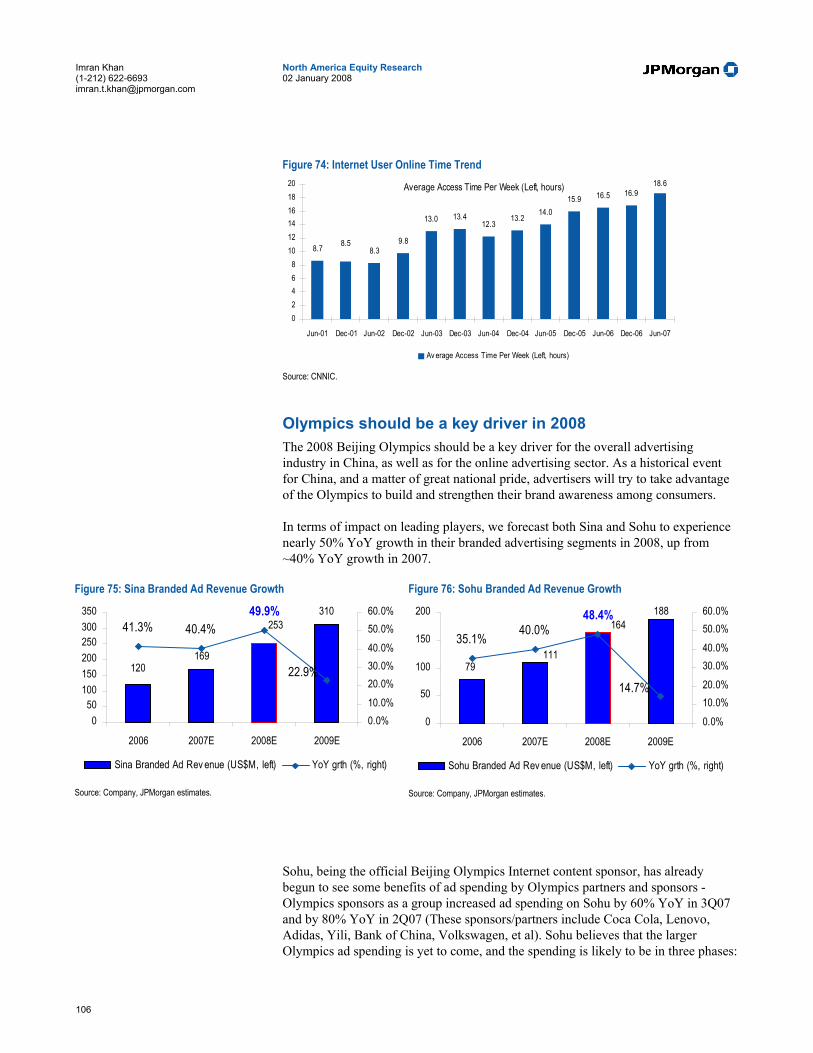
106
North America Equity Research 02 January 2008
Imran Khan (1-212) 622-6693 [email protected]
Figure 74: Internet User Online Time Trend
Average Access Time Per Week (Left, hours)
8.7 8.39.8
13.0 13.412.3
13.214.0
15.9 16.5 16.918.6
8.5
02468
101214161820
Jun-01 Dec-01 Jun-02 Dec-02 Jun-03 Dec-03 Jun-04 Dec-04 Jun-05 Dec-05 Jun-06 Dec-06 Jun-07
Av erage Access Time Per Week (Left, hours) Source: CNNIC.
Olympics should be a key driver in 2008 The 2008 Beijing Olympics should be a key driver for the overall advertising industry in China, as well as for the online advertising sector. As a historical event for China, and a matter of great national pride, advertisers will try to take advantage of the Olympics to build and strengthen their brand awareness among consumers.
In terms of impact on leading players, we forecast both Sina and Sohu to experience nearly 50% YoY growth in their branded advertising segments in 2008, up from ~40% YoY growth in 2007.
Figure 75: Sina Branded Ad Revenue Growth
120
310253
169
41.3% 40.4%49.9%
22.9%
050
100150200250300350
2006 2007E 2008E 2009E
0.0%10.0%20.0%30.0%40.0%50.0%60.0%
Sina Branded Ad Rev enue (US$M, left) YoY grth (%, right)
Source: Company, JPMorgan estimates.
Figure 76: Sohu Branded Ad Revenue Growth
188
79111
16435.1% 40.0%
14.7%
48.4%
0
50
100
150
200
2006 2007E 2008E 2009E
0.0%10.0%20.0%30.0%40.0%50.0%60.0%
Sohu Branded Ad Rev enue (US$M, left) YoY grth (%, right)
Source: Company, JPMorgan estimates.
Sohu, being the official Beijing Olympics Internet content sponsor, has already begun to see some benefits of ad spending by Olympics partners and sponsors - Olympics sponsors as a group increased ad spending on Sohu by 60% YoY in 3Q07 and by 80% YoY in 2Q07 (These sponsors/partners include Coca Cola, Lenovo, Adidas, Yili, Bank of China, Volkswagen, et al). Sohu believes that the larger Olympics ad spending is yet to come, and the spending is likely to be in three phases:
107
North America Equity Research 02 January 2008
Imran Khan (1-212) 622-6693 [email protected]
(1) 4Q07 until early May: Advertisers likely will still be relatively slow in Olympics-related spending.
(2) From May until early August: The Olympics torch relay will begin in May, and advertisers likely will increase their ad spending.
(3) During the month of August: The largest ad spending likely will take place during the actual Olympics event.
Growth after the Olympics We expect online ad spending to continue to grow after 2008, on the back of: (1) strong domestic consumer growth and high industry competition should continue even after Olympics, (2) while a portion of Olympics-related ad spend may come from international companies targeting international visitors (buying ads in China during Olympics to show their presence there) and will not come back post-Olympics, we believe these international companies likely weill not use Chinese Internet portals to advertise in the first place, (3) accelerated Internet usage likely in China after Olympics – as Olympics are held during daytime, office workers likely turn to Internet for updates, (4) various industries, such as FMCG, will likely increase their percentage of online spending after the Olympics - as they are likely to see good ROI during Olympics advertising, and (5) the 2010 World Expo in Shanghai is another highly anticipated international event, and would provide advertisers another opportunity to associate their products / brands with a high-profile international event that demonstrates the success of China.
Regulatory risk remains lower than other online sectors We believe the regulatory risk remains lower for the portal online ad business, compared to other segments in China, such as WVAS, online music or online games. Online advertising is the most established online business in China (since the late 90s), and regulations and boundaries are well-understood by industry players. We believe the leading portals have strict internal compliance departments and automated content scans to ensure content is in compliance with government standards. While Web 2.0 content such as music, video, and blogs has come to the government’s attention, we believe if there is further regulatory tightening for Web 2.0 content, leading portals should be less impacted than pure Web 2.0 companies. Leading portals are the most trusted by the government among Internet companies and have the best compliance procedures; further, the financial impact would be less significant because only a small portion of their revenues is likely to be from Web 2.0 content.
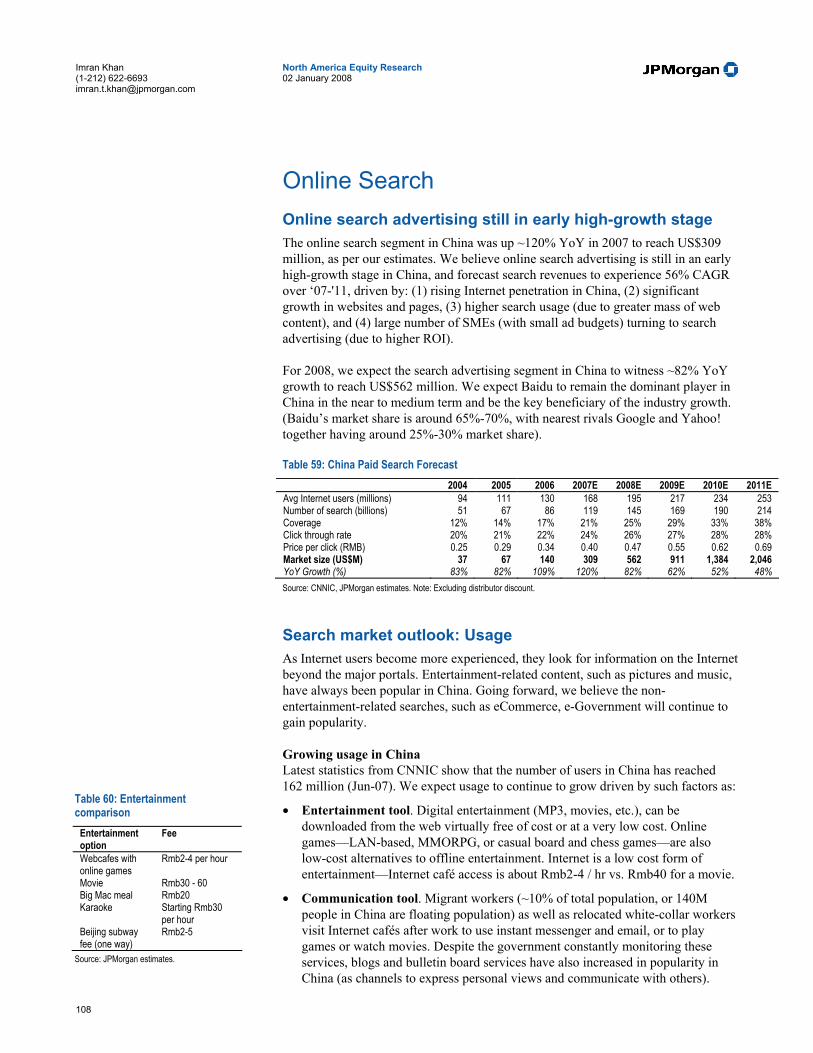
108
North America Equity Research 02 January 2008
Imran Khan (1-212) 622-6693 [email protected]
Online Search Online search advertising still in early high-growth stage The online search segment in China was up ~120% YoY in 2007 to reach US$309 million, as per our estimates. We believe online search advertising is still in an early high-growth stage in China, and forecast search revenues to experience 56% CAGR over ‘07-'11, driven by: (1) rising Internet penetration in China, (2) significant growth in websites and pages, (3) higher search usage (due to greater mass of web content), and (4) large number of SMEs (with small ad budgets) turning to search advertising (due to higher ROI).
For 2008, we expect the search advertising segment in China to witness ~82% YoY growth to reach US$562 million. We expect Baidu to remain the dominant player in China in the near to medium term and be the key beneficiary of the industry growth. (Baidu’s market share is around 65%-70%, with nearest rivals Google and Yahoo! together having around 25%-30% market share).
Table 59: China Paid Search Forecast 2004 2005 2006 2007E 2008E 2009E 2010E 2011E
Avg Internet users (millions) 94 111 130 168 195 217 234 253 Number of search (billions) 51 67 86 119 145 169 190 214 Coverage 12% 14% 17% 21% 25% 29% 33% 38% Click through rate 20% 21% 22% 24% 26% 27% 28% 28% Price per click (RMB) 0.25 0.29 0.34 0.40 0.47 0.55 0.62 0.69 Market size (US$M) 37 67 140 309 562 911 1,384 2,046 YoY Growth (%) 83% 82% 109% 120% 82% 62% 52% 48% Source: CNNIC, JPMorgan estimates. Note: Excluding distributor discount.
Search market outlook: Usage As Internet users become more experienced, they look for information on the Internet beyond the major portals. Entertainment-related content, such as pictures and music, have always been popular in China. Going forward, we believe the non-entertainment-related searches, such as eCommerce, e-Government will continue to gain popularity.
Growing usage in China Latest statistics from CNNIC show that the number of users in China has reached 162 million (Jun-07). We expect usage to continue to grow driven by such factors as:
• Entertainment tool. Digital entertainment (MP3, movies, etc.), can be downloaded from the web virtually free of cost or at a very low cost. Online games—LAN-based, MMORPG, or casual board and chess games—are also low-cost alternatives to offline entertainment. Internet is a low cost form of entertainment—Internet café access is about Rmb2-4 / hr vs. Rmb40 for a movie.
• Communication tool. Migrant workers (~10% of total population, or 140M people in China are floating population) as well as relocated white-collar workers visit Internet cafés after work to use instant messenger and email, or to play games or watch movies. Despite the government constantly monitoring these services, blogs and bulletin board services have also increased in popularity in China (as channels to express personal views and communicate with others).
Table 60: Entertainment comparison
Entertainment option
Fee
Webcafes with online games
Rmb2-4 per hour
Movie Rmb30 - 60 Big Mac meal Rmb20 Karaoke Starting Rmb30
per hour Beijing subway fee (one way)
Rmb2-5
Source: JPMorgan estimates.
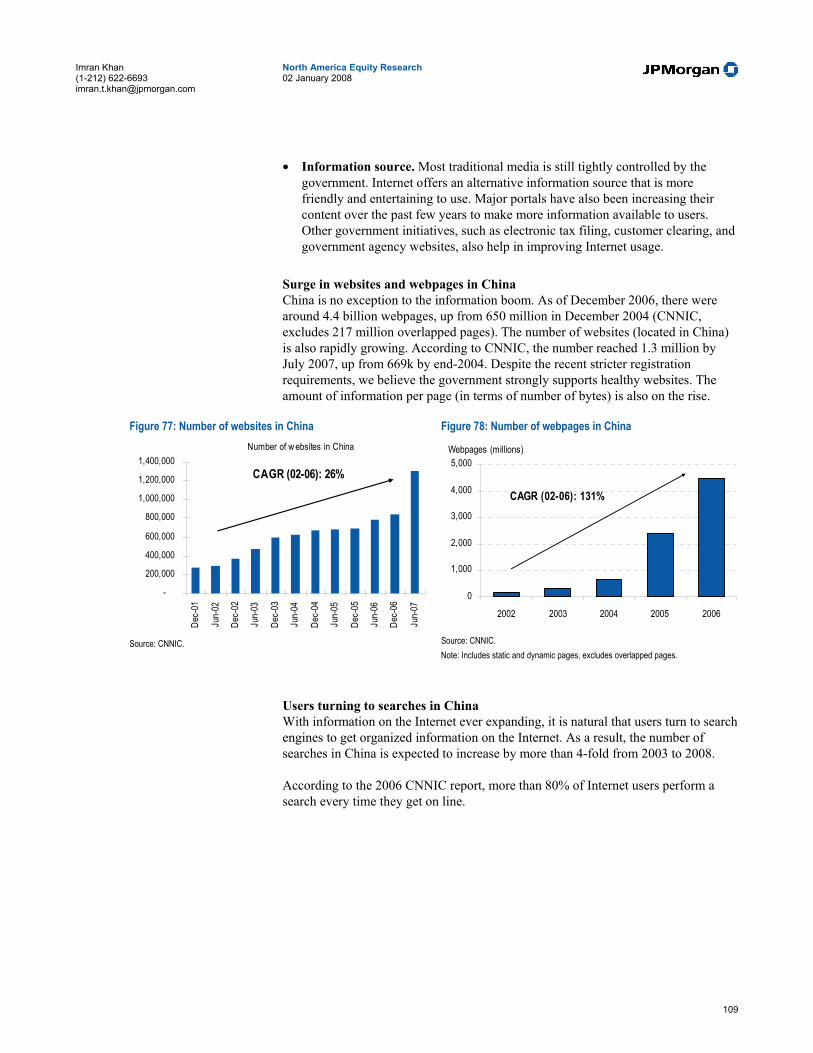
109
North America Equity Research 02 January 2008
Imran Khan (1-212) 622-6693 [email protected]
• Information source. Most traditional media is still tightly controlled by the government. Internet offers an alternative information source that is more friendly and entertaining to use. Major portals have also been increasing their content over the past few years to make more information available to users. Other government initiatives, such as electronic tax filing, customer clearing, and government agency websites, also help in improving Internet usage.
Surge in websites and webpages in China China is no exception to the information boom. As of December 2006, there were around 4.4 billion webpages, up from 650 million in December 2004 (CNNIC, excludes 217 million overlapped pages). The number of websites (located in China) is also rapidly growing. According to CNNIC, the number reached 1.3 million by July 2007, up from 669k by end-2004. Despite the recent stricter registration requirements, we believe the government strongly supports healthy websites. The amount of information per page (in terms of number of bytes) is also on the rise.
Figure 77: Number of websites in China Number of w ebsites in China
-
200,000
400,000
600,000
800,000
1,000,000
1,200,000
1,400,000
Dec-
01
Jun-
02
Dec-
02
Jun-
03
Dec-
03
Jun-
04
Dec-
04
Jun-
05
Dec-
05
Jun-
06
Dec-
06
Jun-
07
CAGR (02-06): 26%
Source: CNNIC.
Figure 78: Number of webpages in China
0
1,000
2,000
3,000
4,000
5,000
2002 2003 2004 2005 2006
Webpages (millions)
CAGR (02-06): 131%
Source: CNNIC. Note: Includes static and dynamic pages, excludes overlapped pages.
Users turning to searches in China With information on the Internet ever expanding, it is natural that users turn to search engines to get organized information on the Internet. As a result, the number of searches in China is expected to increase by more than 4-fold from 2003 to 2008.
According to the 2006 CNNIC report, more than 80% of Internet users perform a search every time they get on line.
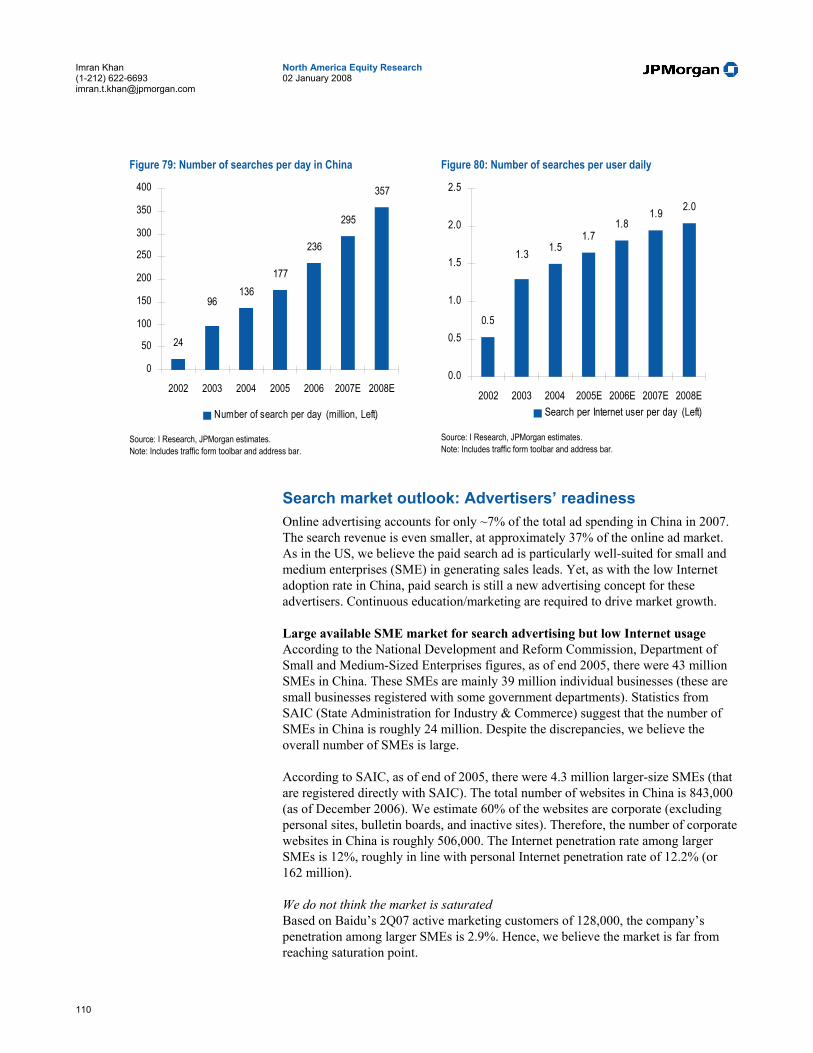
110
North America Equity Research 02 January 2008
Imran Khan (1-212) 622-6693 [email protected]
Figure 79: Number of searches per day in China
24
136177
236
295
357
96
0
50
100
150
200
250
300
350
400
2002 2003 2004 2005 2006 2007E 2008E
Number of search per day (million, Left)
Source: I Research, JPMorgan estimates. Note: Includes traffic form toolbar and address bar.
Figure 80: Number of searches per user daily
0.5
1.51.7
1.81.9 2.0
1.3
0.0
0.5
1.0
1.5
2.0
2.5
2002 2003 2004 2005E 2006E 2007E 2008ESearch per Internet user per day (Left)
Source: I Research, JPMorgan estimates. Note: Includes traffic form toolbar and address bar.
Search market outlook: Advertisers’ readiness Online advertising accounts for only ~7% of the total ad spending in China in 2007. The search revenue is even smaller, at approximately 37% of the online ad market. As in the US, we believe the paid search ad is particularly well-suited for small and medium enterprises (SME) in generating sales leads. Yet, as with the low Internet adoption rate in China, paid search is still a new advertising concept for these advertisers. Continuous education/marketing are required to drive market growth.
Large available SME market for search advertising but low Internet usage According to the National Development and Reform Commission, Department of Small and Medium-Sized Enterprises figures, as of end 2005, there were 43 million SMEs in China. These SMEs are mainly 39 million individual businesses (these are small businesses registered with some government departments). Statistics from SAIC (State Administration for Industry & Commerce) suggest that the number of SMEs in China is roughly 24 million. Despite the discrepancies, we believe the overall number of SMEs is large.
According to SAIC, as of end of 2005, there were 4.3 million larger-size SMEs (that are registered directly with SAIC). The total number of websites in China is 843,000 (as of December 2006). We estimate 60% of the websites are corporate (excluding personal sites, bulletin boards, and inactive sites). Therefore, the number of corporate websites in China is roughly 506,000. The Internet penetration rate among larger SMEs is 12%, roughly in line with personal Internet penetration rate of 12.2% (or 162 million).
We do not think the market is saturated Based on Baidu’s 2Q07 active marketing customers of 128,000, the company’s penetration among larger SMEs is 2.9%. Hence, we believe the market is far from reaching saturation point.
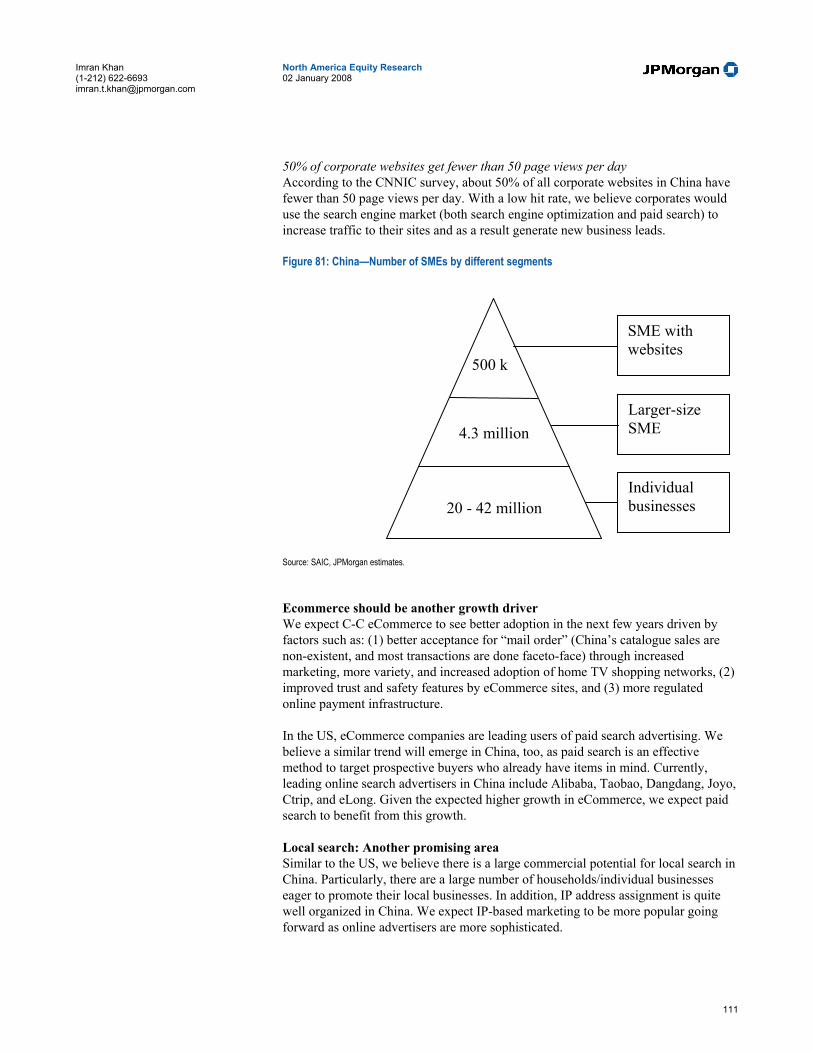
111
North America Equity Research 02 January 2008
Imran Khan (1-212) 622-6693 [email protected]
50% of corporate websites get fewer than 50 page views per day According to the CNNIC survey, about 50% of all corporate websites in China have fewer than 50 page views per day. With a low hit rate, we believe corporates would use the search engine market (both search engine optimization and paid search) to increase traffic to their sites and as a result generate new business leads.
Figure 81: China—Number of SMEs by different segments
Source: SAIC, JPMorgan estimates.
Ecommerce should be another growth driver We expect C-C eCommerce to see better adoption in the next few years driven by factors such as: (1) better acceptance for “mail order” (China’s catalogue sales are non-existent, and most transactions are done faceto-face) through increased marketing, more variety, and increased adoption of home TV shopping networks, (2) improved trust and safety features by eCommerce sites, and (3) more regulated online payment infrastructure.
In the US, eCommerce companies are leading users of paid search advertising. We believe a similar trend will emerge in China, too, as paid search is an effective method to target prospective buyers who already have items in mind. Currently, leading online search advertisers in China include Alibaba, Taobao, Dangdang, Joyo, Ctrip, and eLong. Given the expected higher growth in eCommerce, we expect paid search to benefit from this growth.
Local search: Another promising area Similar to the US, we believe there is a large commercial potential for local search in China. Particularly, there are a large number of households/individual businesses eager to promote their local businesses. In addition, IP address assignment is quite well organized in China. We expect IP-based marketing to be more popular going forward as online advertisers are more sophisticated.
SME with websites
Larger-size SME
Individual businesses 20 - 42 million
4.3 million
500 k
112
North America Equity Research 02 January 2008
Imran Khan (1-212) 622-6693 [email protected]
IT outsourcing companies are the main educators for search usage The two types of companies that help drive paid search usage of SMEs are ad agencies and IT outsourcing companies. While ad agencies mainly focus on companies that already have websites, IT outsourcing companies target SMEs that are less sophisticated in IT infrastructure.
IT outsourcing companies such as Sino-I (250.HK), and Hichina (net.cn), provide one-stop services for SMEs—domain name registration, web hosting, website design, promotions (mainly through search engine optimization (SEO), paid search, directory listing). We believe the IT outsourcing companies will be key players in the future to drive Internet adoption growth and search usage for SMEs.
China Enterprise (ce.net) (fully owned by Sino-I) is one of the first official agents for Google in China. It has approximately 220,000 customers. The company is a dedicated educator for IT services in China with each of its 77 offices conducting regular meetings for entrepreneurs and SMEs. We believe this kind of education will help expand the number of advertisers for online search services.
Ad agencies would have to drive search market growth Paid search marketing campaigns are usually more involved than display ads. Advertisers need to decide on what keywords to use, the number of keywords, bidding strategy and bidding period. In addition, more sophisticated advertisers also pay attention to competitors’ strategy, lead quality and ROI. A well-run search campaign is arguably more difficult than banner ads where advertisers simply design the banners and place them on as many relevant websites as possible.
Furthermore, budgets for search campaigns are more difficult to manage as spending is based on the number of clicks, which non-experienced advertisers do not have control over. The ad spending amount essentially has no limit. Hence, advertisers are generally quite cautious about the initial spending and only allocate a small daily budget for trial, or even worse, just give up on paid search campaigns. We believe education by agents and distributors can eventually help advertisers overcome these barriers, and advertisers will thus increase their budgets on search campaigns.
Search market outlook: Monetization We expect monetization of the paid search market to grow quickly driven by both higher search usage by users and better adoption by advertisers. The coverage ratio is low compared with the US, and we expect it to increase and drive monetization of the market.
Self-fueling cycle to expand monetization We view the market as a self-fueling cycle driven by user and advertiser growth. Higher search usage typically leads to a higher number of sales leads for advertisers. With more high-quality leads coming from paid search, advertisers would place more keywords in more search engines. As users find more relevant product information by advertisers, they likely will conduct more searches, thus leading to higher usage. This cycle should continue and lead to market-size expansion.
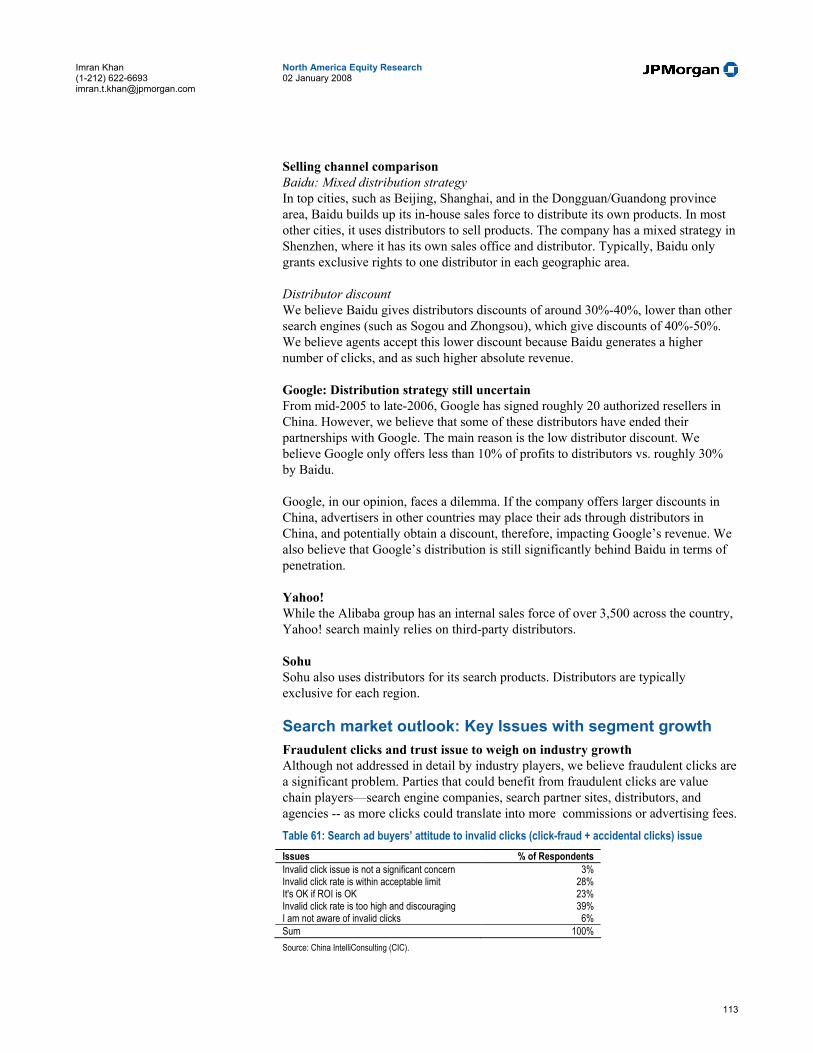
113
North America Equity Research 02 January 2008
Imran Khan (1-212) 622-6693 [email protected]
Selling channel comparison Baidu: Mixed distribution strategy In top cities, such as Beijing, Shanghai, and in the Dongguan/Guandong province area, Baidu builds up its in-house sales force to distribute its own products. In most other cities, it uses distributors to sell products. The company has a mixed strategy in Shenzhen, where it has its own sales office and distributor. Typically, Baidu only grants exclusive rights to one distributor in each geographic area.
Distributor discount We believe Baidu gives distributors discounts of around 30%-40%, lower than other search engines (such as Sogou and Zhongsou), which give discounts of 40%-50%. We believe agents accept this lower discount because Baidu generates a higher number of clicks, and as such higher absolute revenue.
Google: Distribution strategy still uncertain From mid-2005 to late-2006, Google has signed roughly 20 authorized resellers in China. However, we believe that some of these distributors have ended their partnerships with Google. The main reason is the low distributor discount. We believe Google only offers less than 10% of profits to distributors vs. roughly 30% by Baidu.
Google, in our opinion, faces a dilemma. If the company offers larger discounts in China, advertisers in other countries may place their ads through distributors in China, and potentially obtain a discount, therefore, impacting Google’s revenue. We also believe that Google’s distribution is still significantly behind Baidu in terms of penetration.
Yahoo! While the Alibaba group has an internal sales force of over 3,500 across the country, Yahoo! search mainly relies on third-party distributors.
Sohu Sohu also uses distributors for its search products. Distributors are typically exclusive for each region.
Search market outlook: Key Issues with segment growth Fraudulent clicks and trust issue to weigh on industry growth Although not addressed in detail by industry players, we believe fraudulent clicks are a significant problem. Parties that could benefit from fraudulent clicks are value chain players—search engine companies, search partner sites, distributors, and agencies -- as more clicks could translate into more commissions or advertising fees.
Table 61: Search ad buyers’ attitude to invalid clicks (click-fraud + accidental clicks) issue Issues % of Respondents Invalid click issue is not a significant concern 3% Invalid click rate is within acceptable limit 28% It's OK if ROI is OK 23% Invalid click rate is too high and discouraging 39% I am not aware of invalid clicks 6% Sum 100% Source: China IntelliConsulting (CIC).
114
North America Equity Research 02 January 2008
Imran Khan (1-212) 622-6693 [email protected]
Unethical practices by ad agencies remain a risk As most search advertisers turn to agents to manage their ad campaigns, agents have full access to advertisers’ accounts. It is not uncommon for some ad agencies to deceive advertiser clients (as per search ad buyer surveys) by, for example, increasing the bid price for keywords or adding some unrelated high-price keywords (and receiving monetary benefits from search partner sites or search engines), or even colluding in fraudulent clicks (as previously mentioned). Despite this industry-wide issue, advertisers continue to place ads on search sites, which we believe demonstrates that search advertising provides a reasonable ROI (return on investment) despite fraudulent click issues. Nonetheless, we believe unethical practices by ad agencies remain a risk to healthy long-term growth of the search advertising market in China.
Regulatory Risks Search companies are in an interesting position. On one hand, search engines try to index as much information as possible, on the other hand, some of these materials may be deemed to be politically sensitive. We believe Chinese Internet companies in general are cautious about the issue, and avoid keywords/results content that could be sensitive. We believe this political risk has existed since the beginning of the Internet in China 10 years ago, and none of the major websites were closed because of it (the only widely mentioned incident was the Google site being blocked in China in 2002). Hence, we do not believe the political risk is high. We also do not expect search companies’ revenue growth to be affected by politically sensitive content, as they are difficult to commercialize, and we believe search companies have no interest in including them in search results.
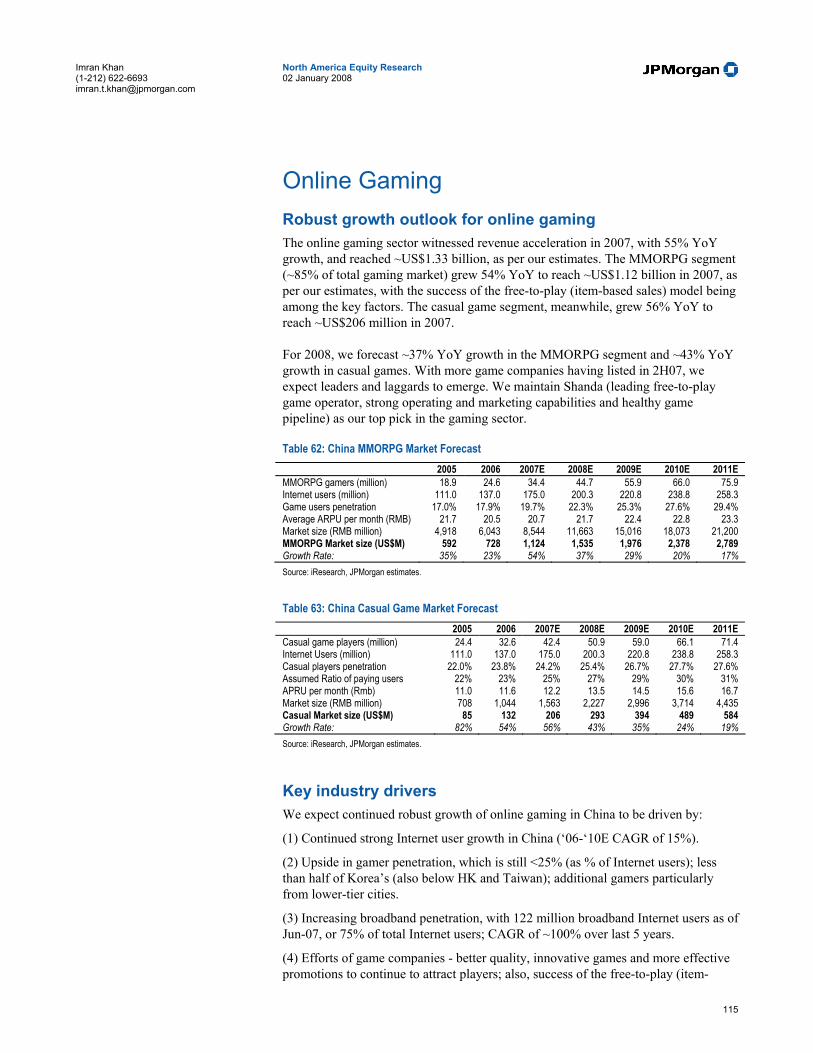
115
North America Equity Research 02 January 2008
Imran Khan (1-212) 622-6693 [email protected]
Online Gaming Robust growth outlook for online gaming The online gaming sector witnessed revenue acceleration in 2007, with 55% YoY growth, and reached ~US$1.33 billion, as per our estimates. The MMORPG segment (~85% of total gaming market) grew 54% YoY to reach ~US$1.12 billion in 2007, as per our estimates, with the success of the free-to-play (item-based sales) model being among the key factors. The casual game segment, meanwhile, grew 56% YoY to reach ~US$206 million in 2007.
For 2008, we forecast ~37% YoY growth in the MMORPG segment and ~43% YoY growth in casual games. With more game companies having listed in 2H07, we expect leaders and laggards to emerge. We maintain Shanda (leading free-to-play game operator, strong operating and marketing capabilities and healthy game pipeline) as our top pick in the gaming sector.
Table 62: China MMORPG Market Forecast 2005 2006 2007E 2008E 2009E 2010E 2011E MMORPG gamers (million) 18.9 24.6 34.4 44.7 55.9 66.0 75.9 Internet users (million) 111.0 137.0 175.0 200.3 220.8 238.8 258.3 Game users penetration 17.0% 17.9% 19.7% 22.3% 25.3% 27.6% 29.4% Average ARPU per month (RMB) 21.7 20.5 20.7 21.7 22.4 22.8 23.3 Market size (RMB million) 4,918 6,043 8,544 11,663 15,016 18,073 21,200 MMORPG Market size (US$M) 592 728 1,124 1,535 1,976 2,378 2,789 Growth Rate: 35% 23% 54% 37% 29% 20% 17% Source: iResearch, JPMorgan estimates.
Table 63: China Casual Game Market Forecast 2005 2006 2007E 2008E 2009E 2010E 2011E
Casual game players (million) 24.4 32.6 42.4 50.9 59.0 66.1 71.4 Internet Users (million) 111.0 137.0 175.0 200.3 220.8 238.8 258.3 Casual players penetration 22.0% 23.8% 24.2% 25.4% 26.7% 27.7% 27.6% Assumed Ratio of paying users 22% 23% 25% 27% 29% 30% 31% APRU per month (Rmb) 11.0 11.6 12.2 13.5 14.5 15.6 16.7 Market size (RMB million) 708 1,044 1,563 2,227 2,996 3,714 4,435 Casual Market size (US$M) 85 132 206 293 394 489 584 Growth Rate: 82% 54% 56% 43% 35% 24% 19% Source: iResearch, JPMorgan estimates.
Key industry drivers We expect continued robust growth of online gaming in China to be driven by:
(1) Continued strong Internet user growth in China (‘06-‘10E CAGR of 15%).
(2) Upside in gamer penetration, which is still <25% (as % of Internet users); less than half of Korea’s (also below HK and Taiwan); additional gamers particularly from lower-tier cities.
(3) Increasing broadband penetration, with 122 million broadband Internet users as of Jun-07, or 75% of total Internet users; CAGR of ~100% over last 5 years.
(4) Efforts of game companies - better quality, innovative games and more effective promotions to continue to attract players; also, success of the free-to-play (item-
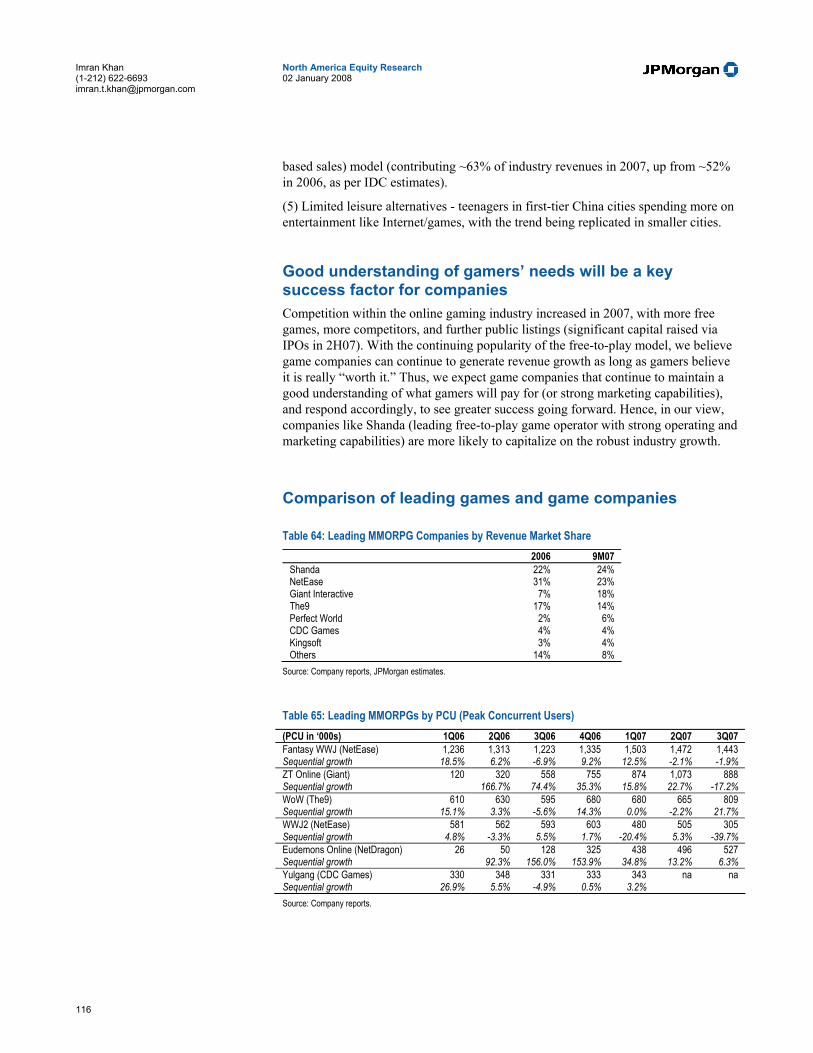
116
North America Equity Research 02 January 2008
Imran Khan (1-212) 622-6693 [email protected]
based sales) model (contributing ~63% of industry revenues in 2007, up from ~52% in 2006, as per IDC estimates).
(5) Limited leisure alternatives - teenagers in first-tier China cities spending more on entertainment like Internet/games, with the trend being replicated in smaller cities.
Good understanding of gamers’ needs will be a key success factor for companies Competition within the online gaming industry increased in 2007, with more free games, more competitors, and further public listings (significant capital raised via IPOs in 2H07). With the continuing popularity of the free-to-play model, we believe game companies can continue to generate revenue growth as long as gamers believe it is really “worth it.” Thus, we expect game companies that continue to maintain a good understanding of what gamers will pay for (or strong marketing capabilities), and respond accordingly, to see greater success going forward. Hence, in our view, companies like Shanda (leading free-to-play game operator with strong operating and marketing capabilities) are more likely to capitalize on the robust industry growth.
Comparison of leading games and game companies Table 64: Leading MMORPG Companies by Revenue Market Share
2006 9M07 Shanda 22% 24% NetEase 31% 23% Giant Interactive 7% 18% The9 17% 14% Perfect World 2% 6% CDC Games 4% 4% Kingsoft 3% 4% Others 14% 8%
Source: Company reports, JPMorgan estimates.
Table 65: Leading MMORPGs by PCU (Peak Concurrent Users) (PCU in ‘000s) 1Q06 2Q06 3Q06 4Q06 1Q07 2Q07 3Q07 Fantasy WWJ (NetEase) 1,236 1,313 1,223 1,335 1,503 1,472 1,443 Sequential growth 18.5% 6.2% -6.9% 9.2% 12.5% -2.1% -1.9% ZT Online (Giant) 120 320 558 755 874 1,073 888 Sequential growth 166.7% 74.4% 35.3% 15.8% 22.7% -17.2% WoW (The9) 610 630 595 680 680 665 809 Sequential growth 15.1% 3.3% -5.6% 14.3% 0.0% -2.2% 21.7% WWJ2 (NetEase) 581 562 593 603 480 505 305 Sequential growth 4.8% -3.3% 5.5% 1.7% -20.4% 5.3% -39.7% Eudemons Online (NetDragon) 26 50 128 325 438 496 527 Sequential growth 92.3% 156.0% 153.9% 34.8% 13.2% 6.3% Yulgang (CDC Games) 330 348 331 333 343 na na Sequential growth 26.9% 5.5% -4.9% 0.5% 3.2% Source: Company reports.
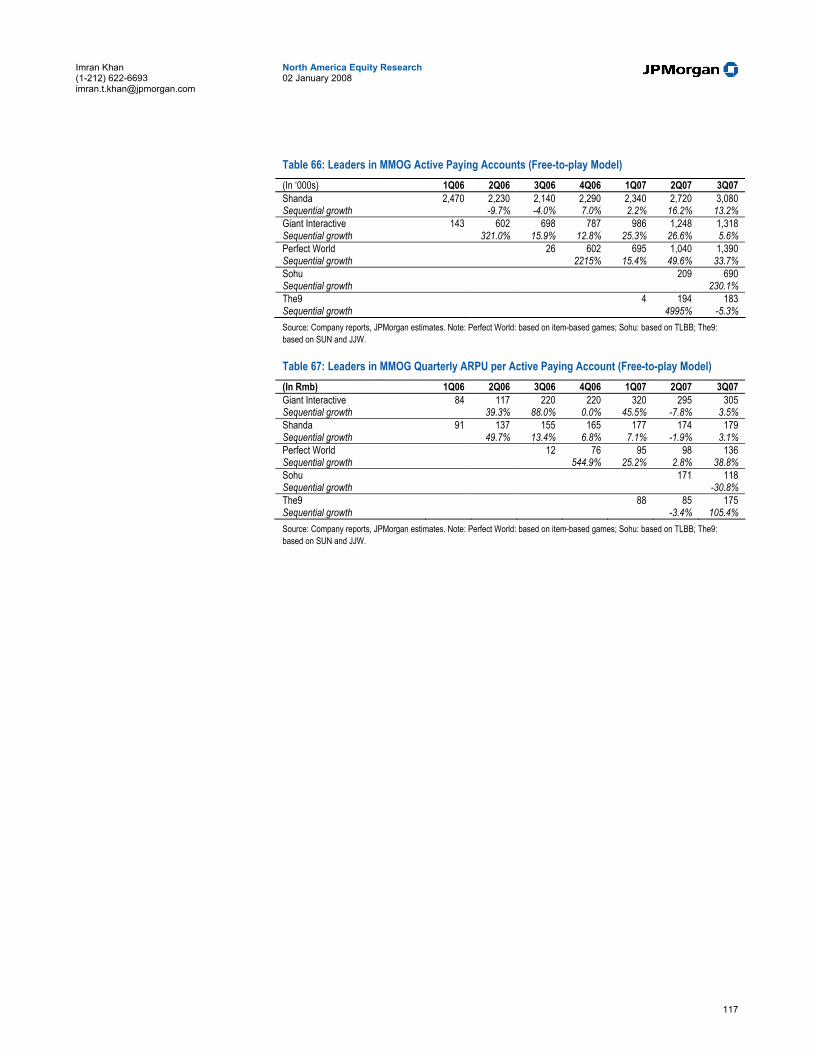
117
North America Equity Research 02 January 2008
Imran Khan (1-212) 622-6693 [email protected]
Table 66: Leaders in MMOG Active Paying Accounts (Free-to-play Model) (In ‘000s) 1Q06 2Q06 3Q06 4Q06 1Q07 2Q07 3Q07 Shanda 2,470 2,230 2,140 2,290 2,340 2,720 3,080 Sequential growth -9.7% -4.0% 7.0% 2.2% 16.2% 13.2% Giant Interactive 143 602 698 787 986 1,248 1,318 Sequential growth 321.0% 15.9% 12.8% 25.3% 26.6% 5.6% Perfect World 26 602 695 1,040 1,390 Sequential growth 2215% 15.4% 49.6% 33.7% Sohu 209 690 Sequential growth 230.1% The9 4 194 183 Sequential growth 4995% -5.3% Source: Company reports, JPMorgan estimates. Note: Perfect World: based on item-based games; Sohu: based on TLBB; The9: based on SUN and JJW. Table 67: Leaders in MMOG Quarterly ARPU per Active Paying Account (Free-to-play Model) (In Rmb) 1Q06 2Q06 3Q06 4Q06 1Q07 2Q07 3Q07 Giant Interactive 84 117 220 220 320 295 305 Sequential growth 39.3% 88.0% 0.0% 45.5% -7.8% 3.5% Shanda 91 137 155 165 177 174 179 Sequential growth 49.7% 13.4% 6.8% 7.1% -1.9% 3.1% Perfect World 12 76 95 98 136 Sequential growth 544.9% 25.2% 2.8% 38.8% Sohu 171 118 Sequential growth -30.8% The9 88 85 175 Sequential growth -3.4% 105.4% Source: Company reports, JPMorgan estimates. Note: Perfect World: based on item-based games; Sohu: based on TLBB; The9: based on SUN and JJW.

U.S. C
ompany Preview
s


121
North America Equity Research 02 January 2008
Imran Khan (1-212) 622-6693 [email protected]
Amazon.com, Neutral ($92.85) We are maintaining our Neutral rating on Amazon. Although we have been impressed with the company’s ability to generate above-market revenue growth despite its size, we believe the stock’s valuation leaves limited room for upside.
• Third-party sales growth to offset margin pressure from pricing. As a percentage of units, the company saw third-party sales increase more than 200 bps Y/Y in the first three quarters of ’07. We believe third-party as a % of sales is likely to continue growing in F’08. Further, we believe the platform helps Amazon expand selection, which ranked as the #2 factor influencing shoppers’ site choices in our proprietary survey. We think the more profitable 3P business should help offset margin pressure resulting from the site’s continued competitiveness in the #1 factor, price. As such, we are modeling flat gross margins in F’08, at 22.9%.
• Slight improvement in operating margins. We are modeling F’08 operating margin improvement of ~30 bps and F’09 improvement of ~20 bps, partly due to our expectation of increased leverage in expense lines such as tech & content as the company grows. We do not expect any leverage on gross margins, as we expect Amazon will continue to offer discounts to spur continued US sales growth. Additionally, we do not expect material leverage from fulfillment, as the company invests to support sales growth.
• 2008 drivers. In our view, the following factors will drive the stock in 2008: (1) Amazon’s continued ability to outperform the eCommerce market’s growth rate; (2) the competitiveness of online offerings from brick-and-mortar retailers; (3) third-party sales mix; (4) potential for tech & content leverage. Additionally, the broader state of consumer spending is likely to have a continued impact on Amazon.
• Maintaining 4Q and 2007 estimates. We remain comfortable with our 4Q revenue, GAAP operating income and EPS estimates of $5.3B, $273M and $0.46. For the full year, we expect revenue, GAAP operating income and EPS of $14.5B, $657M, and $1.10.
Table 68: Amazon Estimates Snapshot $ in millions, except per share data AMZN Y/Y 4Q'07E F'07E F'08E F'09E F'07E F'08E F'09E JPM Revenue 5,325 14,488 17,938 21,269 35.3% 23.8% 18.6% EBITDA 392 1,093 1,474 2,178 84.0% 34.8% 47.8% EPS 0.46 $1.10 $1.51 $1.87 144.2% 37.2% 23.8%
Consensus Revenue 5,360 14,504 18,256 22,373 35.4% 25.9% 22.5% EBITDA 393 1,080 1,446 1,884 81.8% 33.9% 30.3% EPS 0.48 1.12 1.61 2.41 148.6% 44.2% 49.2% Source: Company reports, FactSet, JPMorgan estimates
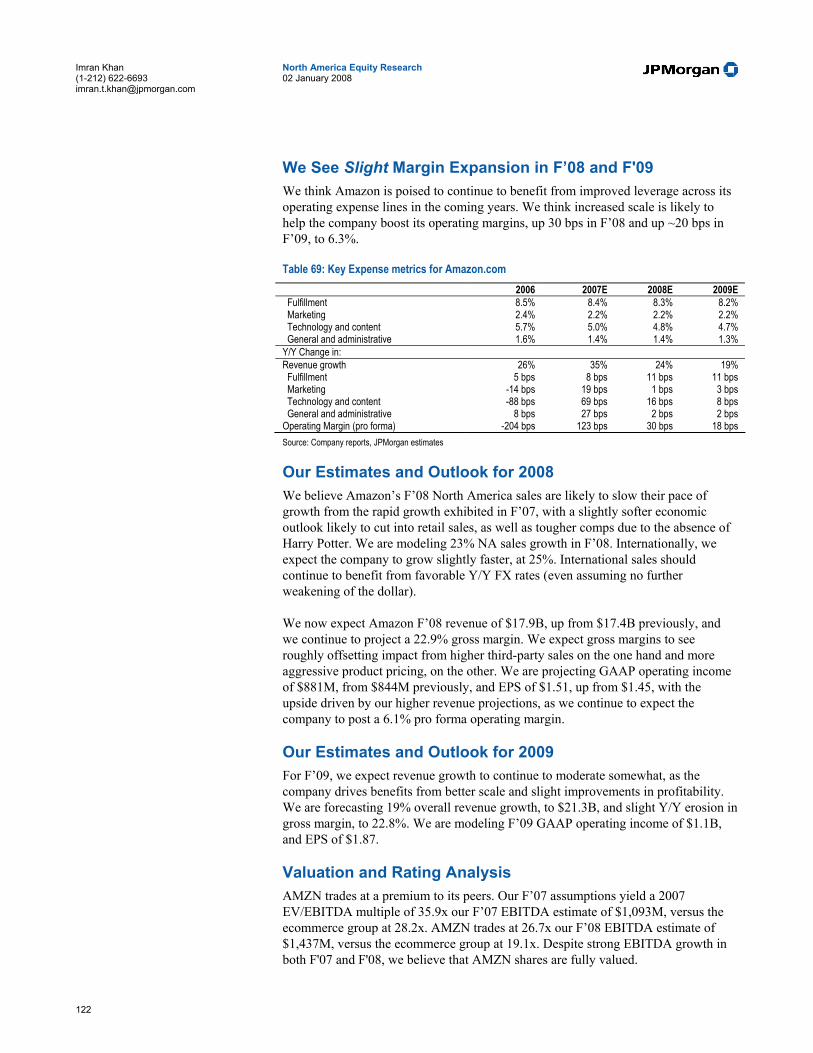
122
North America Equity Research 02 January 2008
Imran Khan (1-212) 622-6693 [email protected]
We See Slight Margin Expansion in F’08 and F'09 We think Amazon is poised to continue to benefit from improved leverage across its operating expense lines in the coming years. We think increased scale is likely to help the company boost its operating margins, up 30 bps in F’08 and up ~20 bps in F’09, to 6.3%.
Table 69: Key Expense metrics for Amazon.com 2006 2007E 2008E 2009E
Fulfillment 8.5% 8.4% 8.3% 8.2% Marketing 2.4% 2.2% 2.2% 2.2% Technology and content 5.7% 5.0% 4.8% 4.7% General and administrative 1.6% 1.4% 1.4% 1.3% Y/Y Change in: Revenue growth 26% 35% 24% 19% Fulfillment 5 bps 8 bps 11 bps 11 bps Marketing -14 bps 19 bps 1 bps 3 bps Technology and content -88 bps 69 bps 16 bps 8 bps General and administrative 8 bps 27 bps 2 bps 2 bps Operating Margin (pro forma) -204 bps 123 bps 30 bps 18 bps Source: Company reports, JPMorgan estimates
Our Estimates and Outlook for 2008 We believe Amazon’s F’08 North America sales are likely to slow their pace of growth from the rapid growth exhibited in F’07, with a slightly softer economic outlook likely to cut into retail sales, as well as tougher comps due to the absence of Harry Potter. We are modeling 23% NA sales growth in F’08. Internationally, we expect the company to grow slightly faster, at 25%. International sales should continue to benefit from favorable Y/Y FX rates (even assuming no further weakening of the dollar).
We now expect Amazon F’08 revenue of $17.9B, up from $17.4B previously, and we continue to project a 22.9% gross margin. We expect gross margins to see roughly offsetting impact from higher third-party sales on the one hand and more aggressive product pricing, on the other. We are projecting GAAP operating income of $881M, from $844M previously, and EPS of $1.51, up from $1.45, with the upside driven by our higher revenue projections, as we continue to expect the company to post a 6.1% pro forma operating margin.
Our Estimates and Outlook for 2009 For F’09, we expect revenue growth to continue to moderate somewhat, as the company drives benefits from better scale and slight improvements in profitability. We are forecasting 19% overall revenue growth, to $21.3B, and slight Y/Y erosion in gross margin, to 22.8%. We are modeling F’09 GAAP operating income of $1.1B, and EPS of $1.87.
Valuation and Rating Analysis AMZN trades at a premium to its peers. Our F’07 assumptions yield a 2007 EV/EBITDA multiple of 35.9x our F’07 EBITDA estimate of $1,093M, versus the ecommerce group at 28.2x. AMZN trades at 26.7x our F’08 EBITDA estimate of $1,437M, versus the ecommerce group at 19.1x. Despite strong EBITDA growth in both F'07 and F'08, we believe that AMZN shares are fully valued.
123
North America Equity Research 02 January 2008
Imran Khan (1-212) 622-6693 [email protected]
Risks to Our Rating AMZN could outperform if the company is able to successfully expand its third-party relationships faster than we are forecasting, in which case our margin assumptions could be too conservative. Additionally, an ever-growing portion of Amazon’s revenue is from its international business, exposing the company to foreign currency fluctuations.
AMZN could underperform if it encounters difficulties in its international expansion, including regulatory hurdles that make the business climate less hospitable and potentially less profitable than the markets where it currently operates. Amazon may have difficulty growing revenues while maintaining its current operating margins.
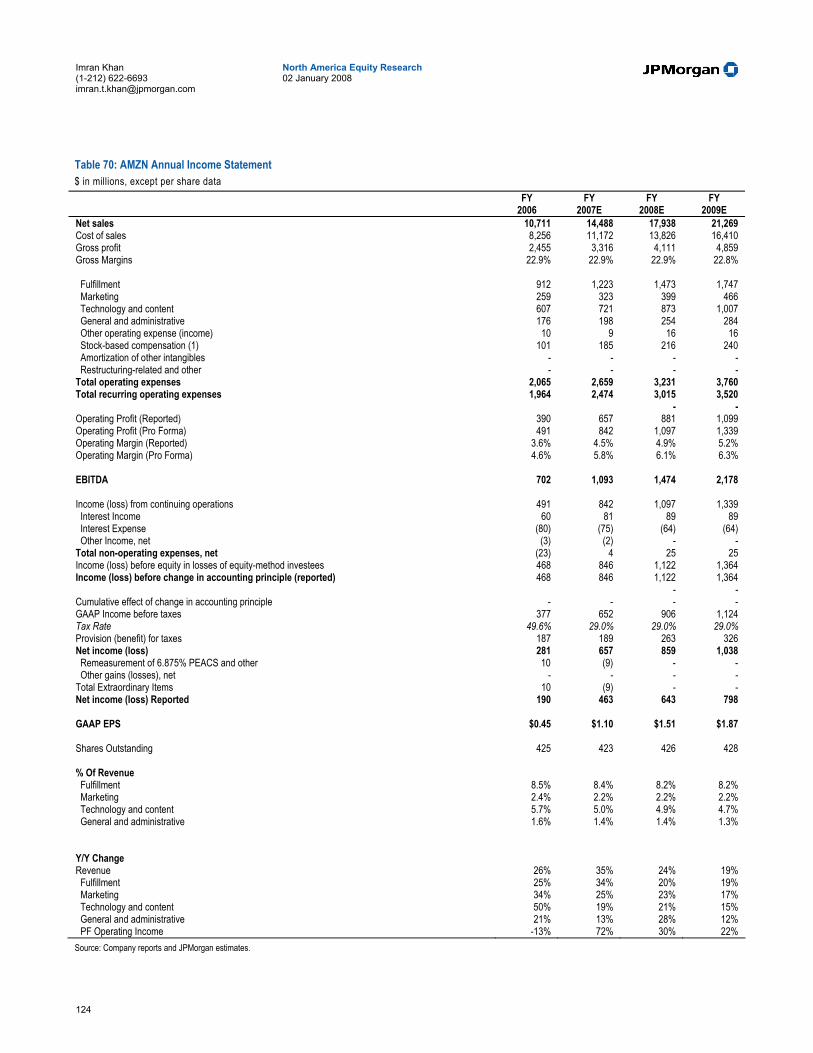
124
North America Equity Research 02 January 2008
Imran Khan (1-212) 622-6693 [email protected]
Table 70: AMZN Annual Income Statement $ in millions, except per share data FY FY FY FY 2006 2007E 2008E 2009E Net sales 10,711 14,488 17,938 21,269 Cost of sales 8,256 11,172 13,826 16,410 Gross profit 2,455 3,316 4,111 4,859 Gross Margins 22.9% 22.9% 22.9% 22.8% Fulfillment 912 1,223 1,473 1,747 Marketing 259 323 399 466 Technology and content 607 721 873 1,007 General and administrative 176 198 254 284 Other operating expense (income) 10 9 16 16 Stock-based compensation (1) 101 185 216 240 Amortization of other intangibles - - - - Restructuring-related and other - - - - Total operating expenses 2,065 2,659 3,231 3,760 Total recurring operating expenses 1,964 2,474 3,015 3,520 - - Operating Profit (Reported) 390 657 881 1,099 Operating Profit (Pro Forma) 491 842 1,097 1,339 Operating Margin (Reported) 3.6% 4.5% 4.9% 5.2% Operating Margin (Pro Forma) 4.6% 5.8% 6.1% 6.3% EBITDA 702 1,093 1,474 2,178 Income (loss) from continuing operations 491 842 1,097 1,339 Interest Income 60 81 89 89 Interest Expense (80) (75) (64) (64) Other Income, net (3) (2) - - Total non-operating expenses, net (23) 4 25 25 Income (loss) before equity in losses of equity-method investees 468 846 1,122 1,364 Income (loss) before change in accounting principle (reported) 468 846 1,122 1,364 - - Cumulative effect of change in accounting principle - - - - GAAP Income before taxes 377 652 906 1,124 Tax Rate 49.6% 29.0% 29.0% 29.0% Provision (benefit) for taxes 187 189 263 326 Net income (loss) 281 657 859 1,038 Remeasurement of 6.875% PEACS and other 10 (9) - - Other gains (losses), net - - - - Total Extraordinary Items 10 (9) - - Net income (loss) Reported 190 463 643 798 GAAP EPS $0.45 $1.10 $1.51 $1.87 Shares Outstanding 425 423 426 428 % Of Revenue Fulfillment 8.5% 8.4% 8.2% 8.2% Marketing 2.4% 2.2% 2.2% 2.2% Technology and content 5.7% 5.0% 4.9% 4.7% General and administrative 1.6% 1.4% 1.4% 1.3%
Y/Y Change Revenue 26% 35% 24% 19% Fulfillment 25% 34% 20% 19% Marketing 34% 25% 23% 17% Technology and content 50% 19% 21% 15% General and administrative 21% 13% 28% 12% PF Operating Income -13% 72% 30% 22% Source: Company reports and JPMorgan estimates.
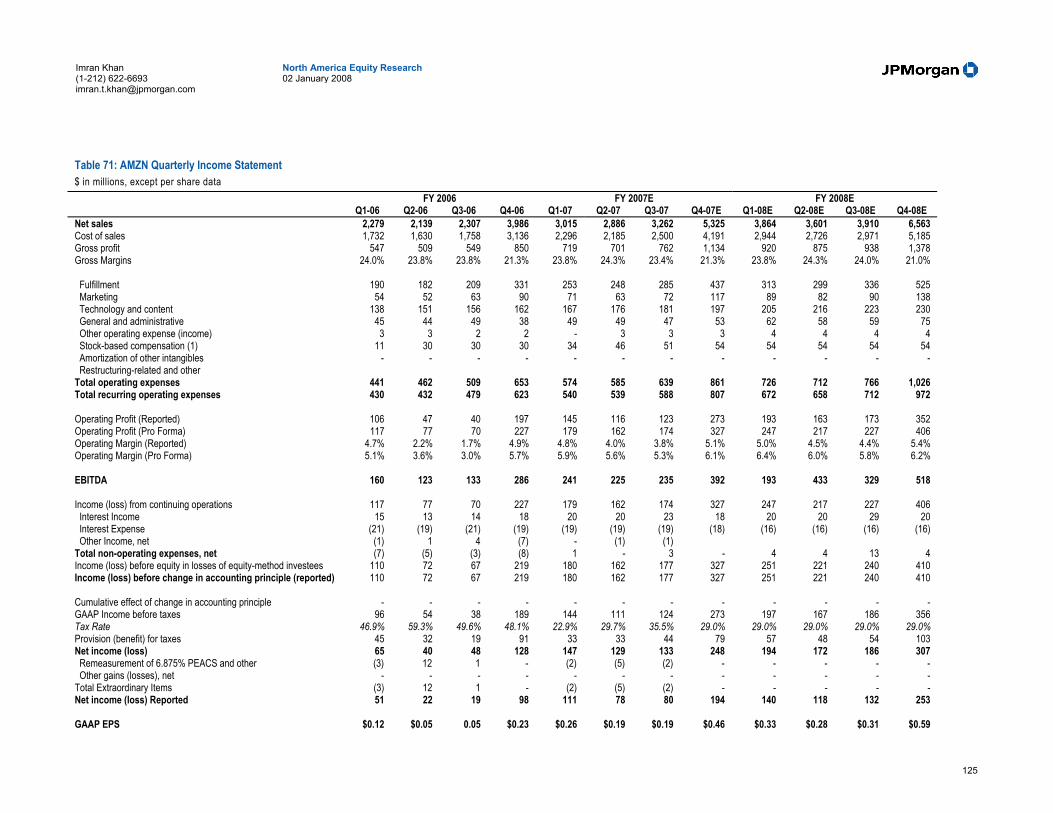
125
North America Equity Research 02 January 2008
Imran Khan (1-212) 622-6693 [email protected]
Table 71: AMZN Quarterly Income Statement $ in millions, except per share data FY 2006 FY 2007E FY 2008E Q1-06 Q2-06 Q3-06 Q4-06 Q1-07 Q2-07 Q3-07 Q4-07E Q1-08E Q2-08E Q3-08E Q4-08E Net sales 2,279 2,139 2,307 3,986 3,015 2,886 3,262 5,325 3,864 3,601 3,910 6,563 Cost of sales 1,732 1,630 1,758 3,136 2,296 2,185 2,500 4,191 2,944 2,726 2,971 5,185 Gross profit 547 509 549 850 719 701 762 1,134 920 875 938 1,378 Gross Margins 24.0% 23.8% 23.8% 21.3% 23.8% 24.3% 23.4% 21.3% 23.8% 24.3% 24.0% 21.0% Fulfillment 190 182 209 331 253 248 285 437 313 299 336 525 Marketing 54 52 63 90 71 63 72 117 89 82 90 138 Technology and content 138 151 156 162 167 176 181 197 205 216 223 230 General and administrative 45 44 49 38 49 49 47 53 62 58 59 75 Other operating expense (income) 3 3 2 2 - 3 3 3 4 4 4 4 Stock-based compensation (1) 11 30 30 30 34 46 51 54 54 54 54 54 Amortization of other intangibles - - - - - - - - - - - - Restructuring-related and other Total operating expenses 441 462 509 653 574 585 639 861 726 712 766 1,026 Total recurring operating expenses 430 432 479 623 540 539 588 807 672 658 712 972 Operating Profit (Reported) 106 47 40 197 145 116 123 273 193 163 173 352 Operating Profit (Pro Forma) 117 77 70 227 179 162 174 327 247 217 227 406 Operating Margin (Reported) 4.7% 2.2% 1.7% 4.9% 4.8% 4.0% 3.8% 5.1% 5.0% 4.5% 4.4% 5.4% Operating Margin (Pro Forma) 5.1% 3.6% 3.0% 5.7% 5.9% 5.6% 5.3% 6.1% 6.4% 6.0% 5.8% 6.2% EBITDA 160 123 133 286 241 225 235 392 193 433 329 518 Income (loss) from continuing operations 117 77 70 227 179 162 174 327 247 217 227 406 Interest Income 15 13 14 18 20 20 23 18 20 20 29 20 Interest Expense (21) (19) (21) (19) (19) (19) (19) (18) (16) (16) (16) (16) Other Income, net (1) 1 4 (7) - (1) (1) Total non-operating expenses, net (7) (5) (3) (8) 1 - 3 - 4 4 13 4 Income (loss) before equity in losses of equity-method investees 110 72 67 219 180 162 177 327 251 221 240 410 Income (loss) before change in accounting principle (reported) 110 72 67 219 180 162 177 327 251 221 240 410 Cumulative effect of change in accounting principle - - - - - - - - - - - - GAAP Income before taxes 96 54 38 189 144 111 124 273 197 167 186 356 Tax Rate 46.9% 59.3% 49.6% 48.1% 22.9% 29.7% 35.5% 29.0% 29.0% 29.0% 29.0% 29.0% Provision (benefit) for taxes 45 32 19 91 33 33 44 79 57 48 54 103 Net income (loss) 65 40 48 128 147 129 133 248 194 172 186 307 Remeasurement of 6.875% PEACS and other (3) 12 1 - (2) (5) (2) - - - - - Other gains (losses), net - - - - - - - - - - - - Total Extraordinary Items (3) 12 1 - (2) (5) (2) - - - - - Net income (loss) Reported 51 22 19 98 111 78 80 194 140 118 132 253 GAAP EPS $0.12 $0.05 0.05 $0.23 $0.26 $0.19 $0.19 $0.46 $0.33 $0.28 $0.31 $0.59

126
North America Equity Research 02 January 2008
Imran Khan (1-212) 622-6693 [email protected]
FY 2006 FY 2007E FY 2008E Q1-06 Q2-06 Q3-06 Q4-06 Q1-07 Q2-07 Q3-07 Q4-07E Q1-08E Q2-08E Q3-08E Q4-08E Shares Outstanding 426 426 424 422 420 423 425 425 426 426 426 427 % Of Revenue Fulfillment 8.3% 8.5% 9.1% 8.3% 8.4% 8.6% 8.7% 8.2% 8.1% 8.3% 8.6% 8.0% Marketing 2.4% 2.4% 2.7% 2.3% 2.4% 2.2% 2.2% 2.2% 2.3% 2.3% 2.3% 2.1% Technology and content 6.1% 7.1% 6.8% 4.1% 5.5% 6.1% 5.5% 3.7% 5.3% 6.0% 5.7% 3.5% General and administrative 2.0% 2.1% 2.1% 1.0% 1.6% 1.7% 1.4% 1.0% 1.6% 1.6% 1.5% 1.2% Q/Q Change Revenue -23% -6% 8% 73% -24% -4% 13% 63% -27% -7% 9% 68% Fulfillment -23% -4% 15% 58% -24% -2% 15% 53% -28% -5% 13% 56% Marketing -19% -4% 21% 43% -21% -11% 14% 63% -24% -8% 10% 53% Technology and content 12% 9% 3% 4% 3% 5% 3% 9% 4% 5% 3% 3% General and administrative -2% -2% 11% -22% 29% 0% -4% 13% 16% -7% 2% 29% PF Operating Income -35% -34% -9% 224% -21% -9% 7% 88% -24% -12% 5% 79% PF Net Income -69% -38% 21% 165% 15% -12% 3% 86% -22% -11% 8% 65% Y/Y Change Revenue 20% 22% 24% 34% 32% 35% 41% 34% 28% 25% 20% 23% Fulfillment 17% 19% 26% 35% 33% 36% 36% 32% 24% 21% 18% 20% Marketing 23% 30% 50% 34% 31% 21% 14% 30% 25% 30% 25% 18% Technology and content 68% 62% 44% 32% 21% 17% 16% 22% 23% 23% 23% 17% General and administrative 7% 38% 88% -17% 9% 11% -4% 40% 26% 18% 25% 42% PF Operating Income -9% -42% -42% 25% 53% 110% 149% 44% 38% 34% 30% 24% Additional Revenue 377 386 449 1,009 736 747 955 1,339 849 715 648 1,238 Operating profit (11) (55) (51) 46 62 85 104 100 68 55 53 79 Contribution Margins -3% -14% -11% 5% 8% 11% 11% 7% 8% 8% 8% 6% Source: Company reports and JPMorgan estimates.
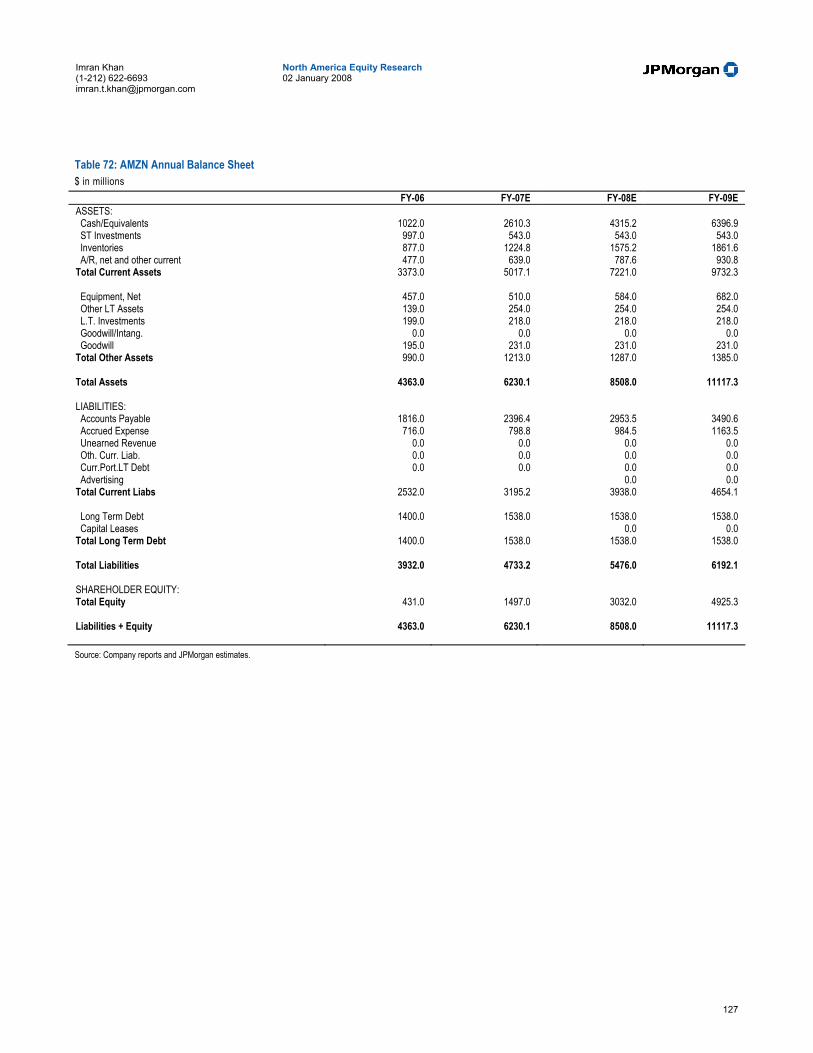
127
North America Equity Research 02 January 2008
Imran Khan (1-212) 622-6693 [email protected]
Table 72: AMZN Annual Balance Sheet $ in millions
FY-06 FY-07E FY-08E FY-09E ASSETS: Cash/Equivalents 1022.0 2610.3 4315.2 6396.9 ST Investments 997.0 543.0 543.0 543.0 Inventories 877.0 1224.8 1575.2 1861.6 A/R, net and other current 477.0 639.0 787.6 930.8 Total Current Assets 3373.0 5017.1 7221.0 9732.3
Equipment, Net 457.0 510.0 584.0 682.0 Other LT Assets 139.0 254.0 254.0 254.0 L.T. Investments 199.0 218.0 218.0 218.0 Goodwill/Intang. 0.0 0.0 0.0 0.0 Goodwill 195.0 231.0 231.0 231.0 Total Other Assets 990.0 1213.0 1287.0 1385.0
Total Assets 4363.0 6230.1 8508.0 11117.3
LIABILITIES: Accounts Payable 1816.0 2396.4 2953.5 3490.6 Accrued Expense 716.0 798.8 984.5 1163.5 Unearned Revenue 0.0 0.0 0.0 0.0 Oth. Curr. Liab. 0.0 0.0 0.0 0.0 Curr.Port.LT Debt 0.0 0.0 0.0 0.0 Advertising 0.0 0.0 Total Current Liabs 2532.0 3195.2 3938.0 4654.1
Long Term Debt 1400.0 1538.0 1538.0 1538.0 Capital Leases 0.0 0.0 Total Long Term Debt 1400.0 1538.0 1538.0 1538.0
Total Liabilities 3932.0 4733.2 5476.0 6192.1
SHAREHOLDER EQUITY: Total Equity 431.0 1497.0 3032.0 4925.3
Liabilities + Equity 4363.0 6230.1 8508.0 11117.3
Source: Company reports and JPMorgan estimates.
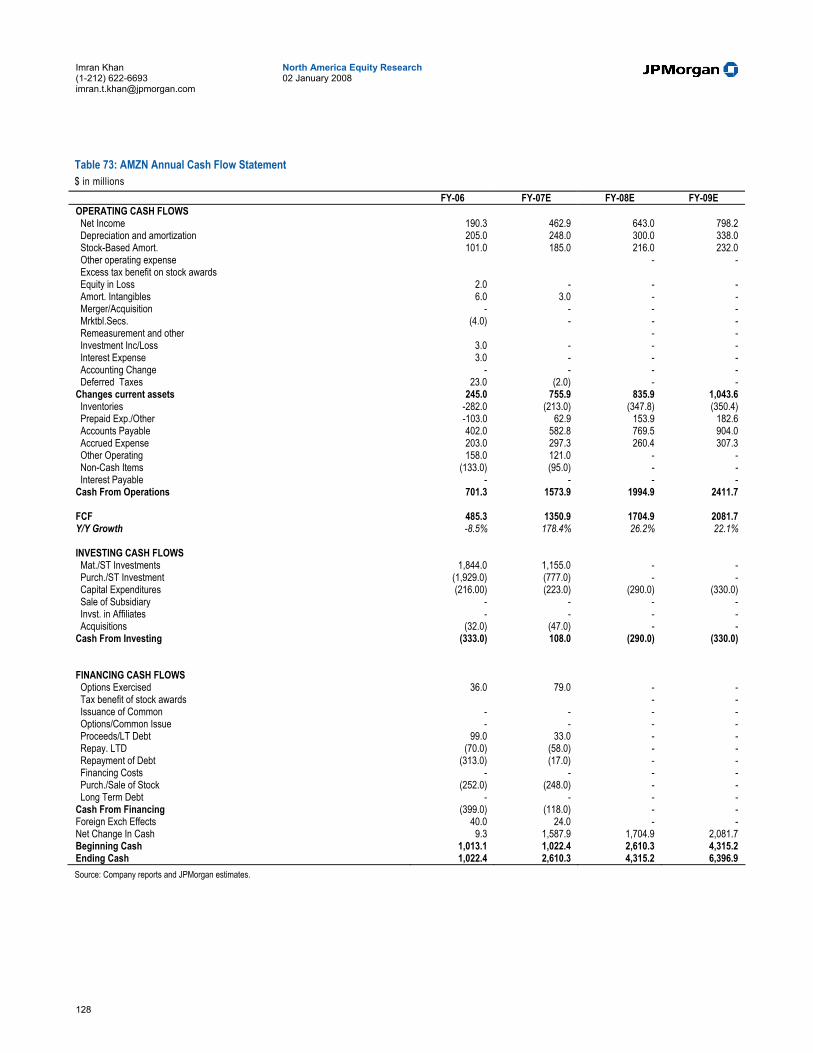
128
North America Equity Research 02 January 2008
Imran Khan (1-212) 622-6693 [email protected]
Table 73: AMZN Annual Cash Flow Statement $ in millions FY-06 FY-07E FY-08E FY-09E OPERATING CASH FLOWS Net Income 190.3 462.9 643.0 798.2 Depreciation and amortization 205.0 248.0 300.0 338.0 Stock-Based Amort. 101.0 185.0 216.0 232.0 Other operating expense - - Excess tax benefit on stock awards Equity in Loss 2.0 - - - Amort. Intangibles 6.0 3.0 - - Merger/Acquisition - - - - Mrktbl.Secs. (4.0) - - - Remeasurement and other - - Investment Inc/Loss 3.0 - - - Interest Expense 3.0 - - - Accounting Change - - - - Deferred Taxes 23.0 (2.0) - - Changes current assets 245.0 755.9 835.9 1,043.6 Inventories -282.0 (213.0) (347.8) (350.4) Prepaid Exp./Other -103.0 62.9 153.9 182.6 Accounts Payable 402.0 582.8 769.5 904.0 Accrued Expense 203.0 297.3 260.4 307.3 Other Operating 158.0 121.0 - - Non-Cash Items (133.0) (95.0) - - Interest Payable - - - - Cash From Operations 701.3 1573.9 1994.9 2411.7 FCF 485.3 1350.9 1704.9 2081.7 Y/Y Growth -8.5% 178.4% 26.2% 22.1% INVESTING CASH FLOWS Mat./ST Investments 1,844.0 1,155.0 - - Purch./ST Investment (1,929.0) (777.0) - - Capital Expenditures (216.00) (223.0) (290.0) (330.0) Sale of Subsidiary - - - - Invst. in Affiliates - - - - Acquisitions (32.0) (47.0) - - Cash From Investing (333.0) 108.0 (290.0) (330.0)
FINANCING CASH FLOWS Options Exercised 36.0 79.0 - - Tax benefit of stock awards - - Issuance of Common - - - - Options/Common Issue - - - - Proceeds/LT Debt 99.0 33.0 - - Repay. LTD (70.0) (58.0) - - Repayment of Debt (313.0) (17.0) - - Financing Costs - - - - Purch./Sale of Stock (252.0) (248.0) - - Long Term Debt - - - - Cash From Financing (399.0) (118.0) - - Foreign Exch Effects 40.0 24.0 - - Net Change In Cash 9.3 1,587.9 1,704.9 2,081.7 Beginning Cash 1,013.1 1,022.4 2,610.3 4,315.2 Ending Cash 1,022.4 2,610.3 4,315.2 6,396.9 Source: Company reports and JPMorgan estimates.
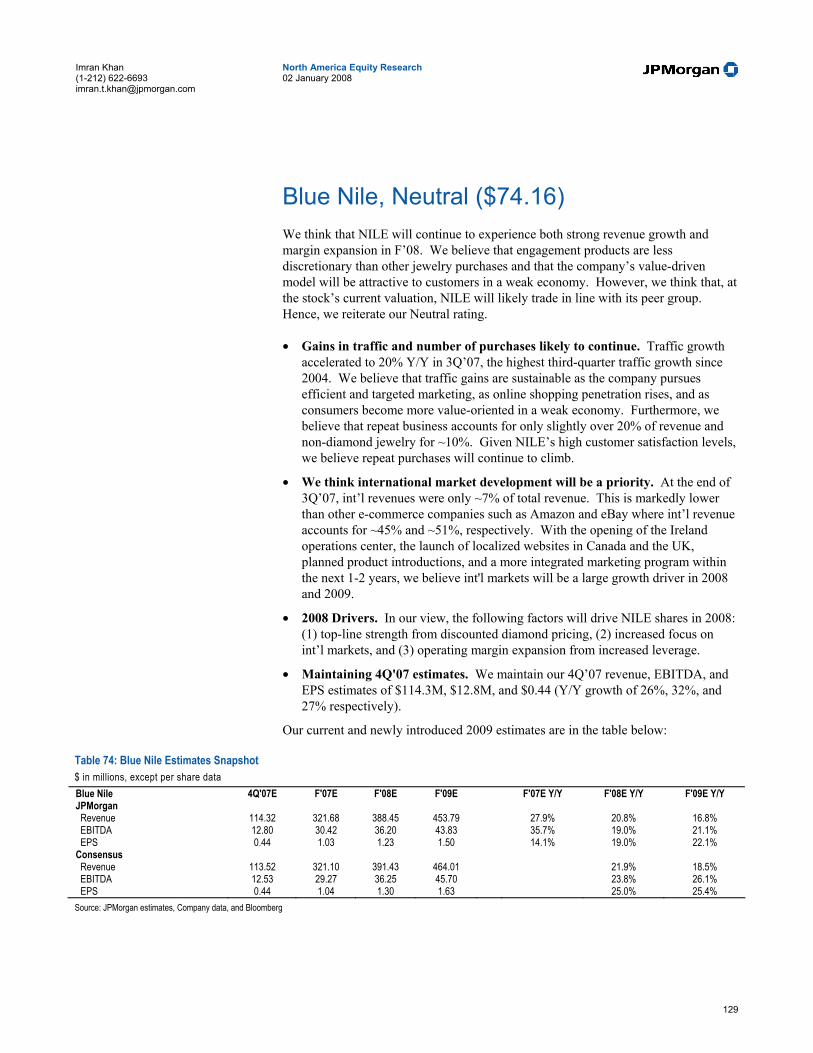
129
North America Equity Research 02 January 2008
Imran Khan (1-212) 622-6693 [email protected]
Blue Nile, Neutral ($74.16) We think that NILE will continue to experience both strong revenue growth and margin expansion in F’08. We believe that engagement products are less discretionary than other jewelry purchases and that the company’s value-driven model will be attractive to customers in a weak economy. However, we think that, at the stock’s current valuation, NILE will likely trade in line with its peer group. Hence, we reiterate our Neutral rating.
• Gains in traffic and number of purchases likely to continue. Traffic growth accelerated to 20% Y/Y in 3Q’07, the highest third-quarter traffic growth since 2004. We believe that traffic gains are sustainable as the company pursues efficient and targeted marketing, as online shopping penetration rises, and as consumers become more value-oriented in a weak economy. Furthermore, we believe that repeat business accounts for only slightly over 20% of revenue and non-diamond jewelry for ~10%. Given NILE’s high customer satisfaction levels, we believe repeat purchases will continue to climb.
• We think international market development will be a priority. At the end of 3Q’07, int’l revenues were only ~7% of total revenue. This is markedly lower than other e-commerce companies such as Amazon and eBay where int’l revenue accounts for ~45% and ~51%, respectively. With the opening of the Ireland operations center, the launch of localized websites in Canada and the UK, planned product introductions, and a more integrated marketing program within the next 1-2 years, we believe int'l markets will be a large growth driver in 2008 and 2009.
• 2008 Drivers. In our view, the following factors will drive NILE shares in 2008: (1) top-line strength from discounted diamond pricing, (2) increased focus on int’l markets, and (3) operating margin expansion from increased leverage.
• Maintaining 4Q'07 estimates. We maintain our 4Q’07 revenue, EBITDA, and EPS estimates of $114.3M, $12.8M, and $0.44 (Y/Y growth of 26%, 32%, and 27% respectively).
Our current and newly introduced 2009 estimates are in the table below:
Table 74: Blue Nile Estimates Snapshot $ in millions, except per share data Blue Nile 4Q'07E F'07E F'08E F'09E F'07E Y/Y F'08E Y/Y F'09E Y/Y JPMorgan Revenue 114.32 321.68 388.45 453.79 27.9% 20.8% 16.8% EBITDA 12.80 30.42 36.20 43.83 35.7% 19.0% 21.1% EPS 0.44 1.03 1.23 1.50 14.1% 19.0% 22.1% Consensus Revenue 113.52 321.10 391.43 464.01 21.9% 18.5% EBITDA 12.53 29.27 36.25 45.70 23.8% 26.1% EPS 0.44 1.04 1.30 1.63 25.0% 25.4% Source: JPMorgan estimates, Company data, and Bloomberg

130
North America Equity Research 02 January 2008
Imran Khan (1-212) 622-6693 [email protected]
Our Estimates and Outlook for 2008 Our updated 2008 estimates call for Y/Y revenue, EBITDA, and EPS growth of 20.8%, 19.0%, and 19.0%, respectively. Specifically, we are modeling 2008 revenues, EBITDA, and GAAP EPS of $388.5M, $36.2M, and $1.23 (from $384.0M, $36.8M, and $1.22).
We believe that the company will intensify its focus on international efforts in 2008, with an emphasis on its UK and Canadian websites. We believe that management has been encouraged with the early response to the sites and will now invest more heavily in growing these ventures. With the opening of the Ireland operations center, the launch of localized websites in Canada and the UK, planned product introductions, and a more integrated marketing program within the next 1-2 years, we believe int'l markets will be a more significant growth driver in 2008.
Our Estimates and Outlook for 2009 Our newly introduced 2009 estimates call for revenue, EBITDA, and EPS growth of 16.8%, 21.1%, and 22.1%, respectively. Specifically, we are modeling 2009 revenues, EBITDA, and GAAP EPS of $453.8M, $43.8M, and $1.50.
We expect top-line growth to continue to be driven by international expansion and believe that the company might start to look at markets outside the UK and Canada. In addition, we expect operating margins to continue to expand due to increased leverage as we believe many of the existing assets can be used to support international expansion.
Valuation and Rating Analysis On a P/E basis, NILE trades at 60.4x our F’08 GAAP EPS estimate of $1.22 vs. its e-commerce peers, which trade at 38.1x F’08 estimates. We do not think there is additional multiple expansion opportunity at this time and we maintain our Neutral rating.
Risks to Our Rating Blue Nile is highly dependent on its diamond and jewelry suppliers, and it would be difficult for the company’s business model to tolerate large price fluctuations in the price to acquire diamonds and jewelry. Blue Nile faces competition from both offline and online competitors, who operate in different spaces in the jewelry market. Online competitors include: diamond.com, amazon.com, walmart.com, mondera.com, and Ashford. Changes to Internet regulations regarding the collection of state and local taxes could negatively impact Blue Nile’s business, as consumers save a significant amount of money by purchasing jewelry over the Internet. A substantial number of Blue Nile’s shares are owned by insiders, giving NILE management significant voting leverage. Additionally, if the management decided to sell the stock then it could create selling pressure on the stock. If the company successfully executes its international business strategy or gains market share in the US from traditional retailers, our estimate could prove to be too conservative.

131
North America Equity Research 02 January 2008
Imran Khan (1-212) 622-6693 [email protected]
Table 75: NILE Annual Income Statement $ in millions, except per share data
2006 2007E 2008E 2009E
Total Revenue 251.6 321.7 388.4 453.8 Cost of Revenue 200.7 256.2 309.0 360.4 Pro forma FAS123R adjustment Pro forma Cost of Revs 200.7 256.2 309.0 360.4 Gross Profit (Rpt) 50.9 65.4 79.4 93.4 Gross Profit (Pforma) 50.9 65.4 79.4 93.4 Gross Margin (Rpt) 20.2% 20.3% 20.4% 20.6% Gross Margins (PF) 20.2% 20.3% 20.4% 20.6% SG&A 34.3 42.7 52.0 60.8 Restructuring - - FAS 123R Stock based compensation 4.0 5.9 6.3 7.1 Total Expenses 34.3 42.7 52.0 60.8 Total Recurring Expenses 30.3 36.8 45.7 53.7 Operating Profit (Reported) 16.6 22.7 27.4 32.6 Operating Profit (Pro Forma) 20.6 28.6 33.7 39.7 Operating Margin (Reported) 6.6% 7.1% 7.1% 7.2% Operating Margin (Pro Forma) 8.2% 8.9% 8.7% 8.8% EBITDA 22.4 30.4 36.2 43.8 EBITDA Margin 8.9% 9.5% 9.3% 9.7% Y/Y EBITDA Growth 13.4% 35.7% 19.0% 21.1% Other Income (Expense) 3.4 3.9 4.4 6.0 Total Other 3.4 3.9 4.4 6.0 Income Before Taxes (Reported) 20.0 26.6 31.8 38.6 Income Before Taxes (Pro Forma) 24.1 32.5 38.1 45.7 Income Taxes (Rpt) 6.9 9.3 11.2 13.6 Income Taxes (Pforma) 8.4 11.4 13.4 16.1 Tax Rate 34.5% 35.1% 35.2% 35.2% Pforma Tax Rate Inc From Ops After Taxes (Rpt) 13.1 17.3 20.6 25.0 Inc From Ops After Taxes (PF) 15.7 21.1 24.7 29.6 Extraordinary Item - - Reported Net Income 13.1 17.3 20.6 25.0 Pro Forma Net Income 15.7 21.1 24.7 29.6 Reported EPS 0.76 1.03 1.23 1.50 Pro Forma EPS 0.90 1.26 1.47 1.78 Diluted Shares 17.3 16.7 16.8 16.7 0.14 0.23 0.24 0.28 % of Total Revenue 15% 36% 19% 22% Cost of Revenue 79.8% 79.7% 79.6% 79.4% Gross Profit 20.2% 20.3% 20.4% 20.6% SG&A 13.6% 13.3% 13.4% 13.4% Y/Y Change Total Revenue 23.8% 27.9% 20.8% 16.8% Cost of Revenue 27.0% 27.6% 20.6% 16.6% SG&A 26.6% 24.5% 21.8% 16.9% Source: Company reports and JPMorgan estimates.
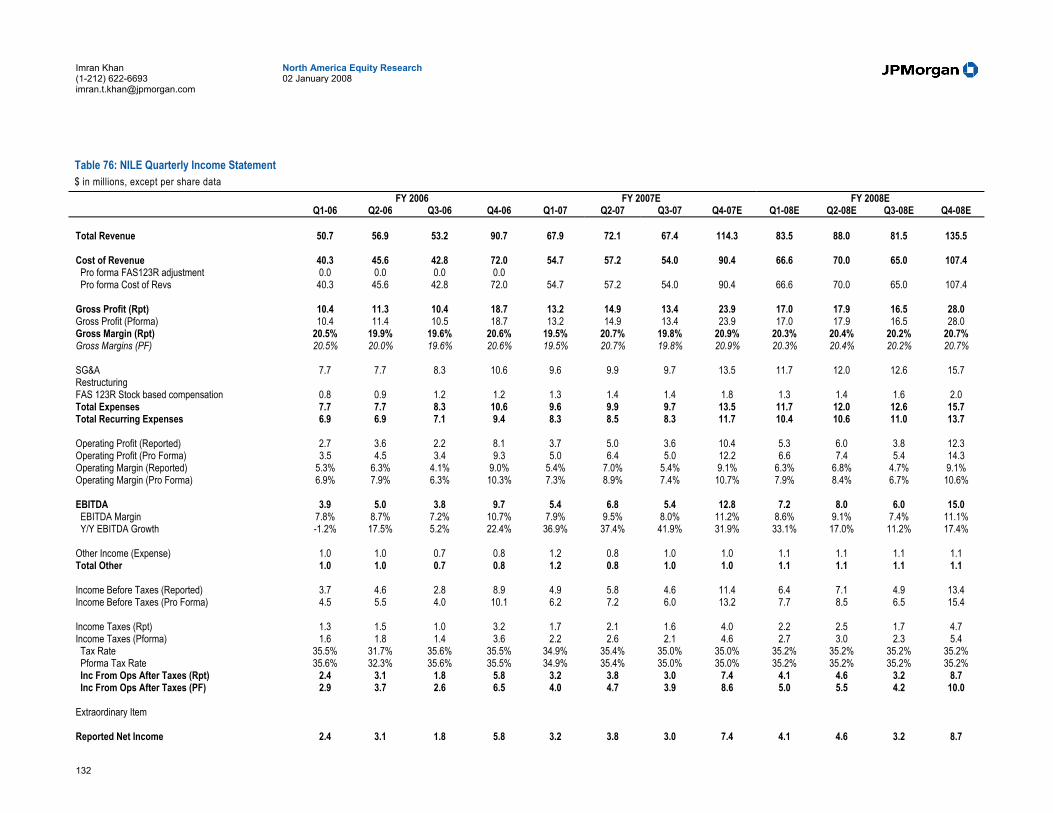
132
North America Equity Research 02 January 2008
Imran Khan (1-212) 622-6693 [email protected]
Table 76: NILE Quarterly Income Statement $ in millions, except per share data
FY 2006 FY 2007E FY 2008E Q1-06 Q2-06 Q3-06 Q4-06 Q1-07 Q2-07 Q3-07 Q4-07E Q1-08E Q2-08E Q3-08E Q4-08E
Total Revenue 50.7 56.9 53.2 90.7 67.9 72.1 67.4 114.3 83.5 88.0 81.5 135.5 Cost of Revenue 40.3 45.6 42.8 72.0 54.7 57.2 54.0 90.4 66.6 70.0 65.0 107.4 Pro forma FAS123R adjustment 0.0 0.0 0.0 0.0 Pro forma Cost of Revs 40.3 45.6 42.8 72.0 54.7 57.2 54.0 90.4 66.6 70.0 65.0 107.4 Gross Profit (Rpt) 10.4 11.3 10.4 18.7 13.2 14.9 13.4 23.9 17.0 17.9 16.5 28.0 Gross Profit (Pforma) 10.4 11.4 10.5 18.7 13.2 14.9 13.4 23.9 17.0 17.9 16.5 28.0 Gross Margin (Rpt) 20.5% 19.9% 19.6% 20.6% 19.5% 20.7% 19.8% 20.9% 20.3% 20.4% 20.2% 20.7% Gross Margins (PF) 20.5% 20.0% 19.6% 20.6% 19.5% 20.7% 19.8% 20.9% 20.3% 20.4% 20.2% 20.7% SG&A 7.7 7.7 8.3 10.6 9.6 9.9 9.7 13.5 11.7 12.0 12.6 15.7 Restructuring FAS 123R Stock based compensation 0.8 0.9 1.2 1.2 1.3 1.4 1.4 1.8 1.3 1.4 1.6 2.0 Total Expenses 7.7 7.7 8.3 10.6 9.6 9.9 9.7 13.5 11.7 12.0 12.6 15.7 Total Recurring Expenses 6.9 6.9 7.1 9.4 8.3 8.5 8.3 11.7 10.4 10.6 11.0 13.7 Operating Profit (Reported) 2.7 3.6 2.2 8.1 3.7 5.0 3.6 10.4 5.3 6.0 3.8 12.3 Operating Profit (Pro Forma) 3.5 4.5 3.4 9.3 5.0 6.4 5.0 12.2 6.6 7.4 5.4 14.3 Operating Margin (Reported) 5.3% 6.3% 4.1% 9.0% 5.4% 7.0% 5.4% 9.1% 6.3% 6.8% 4.7% 9.1% Operating Margin (Pro Forma) 6.9% 7.9% 6.3% 10.3% 7.3% 8.9% 7.4% 10.7% 7.9% 8.4% 6.7% 10.6% EBITDA 3.9 5.0 3.8 9.7 5.4 6.8 5.4 12.8 7.2 8.0 6.0 15.0 EBITDA Margin 7.8% 8.7% 7.2% 10.7% 7.9% 9.5% 8.0% 11.2% 8.6% 9.1% 7.4% 11.1% Y/Y EBITDA Growth -1.2% 17.5% 5.2% 22.4% 36.9% 37.4% 41.9% 31.9% 33.1% 17.0% 11.2% 17.4% Other Income (Expense) 1.0 1.0 0.7 0.8 1.2 0.8 1.0 1.0 1.1 1.1 1.1 1.1 Total Other 1.0 1.0 0.7 0.8 1.2 0.8 1.0 1.0 1.1 1.1 1.1 1.1 Income Before Taxes (Reported) 3.7 4.6 2.8 8.9 4.9 5.8 4.6 11.4 6.4 7.1 4.9 13.4 Income Before Taxes (Pro Forma) 4.5 5.5 4.0 10.1 6.2 7.2 6.0 13.2 7.7 8.5 6.5 15.4 Income Taxes (Rpt) 1.3 1.5 1.0 3.2 1.7 2.1 1.6 4.0 2.2 2.5 1.7 4.7 Income Taxes (Pforma) 1.6 1.8 1.4 3.6 2.2 2.6 2.1 4.6 2.7 3.0 2.3 5.4 Tax Rate 35.5% 31.7% 35.6% 35.5% 34.9% 35.4% 35.0% 35.0% 35.2% 35.2% 35.2% 35.2% Pforma Tax Rate 35.6% 32.3% 35.6% 35.5% 34.9% 35.4% 35.0% 35.0% 35.2% 35.2% 35.2% 35.2% Inc From Ops After Taxes (Rpt) 2.4 3.1 1.8 5.8 3.2 3.8 3.0 7.4 4.1 4.6 3.2 8.7 Inc From Ops After Taxes (PF) 2.9 3.7 2.6 6.5 4.0 4.7 3.9 8.6 5.0 5.5 4.2 10.0 Extraordinary Item Reported Net Income 2.4 3.1 1.8 5.8 3.2 3.8 3.0 7.4 4.1 4.6 3.2 8.7
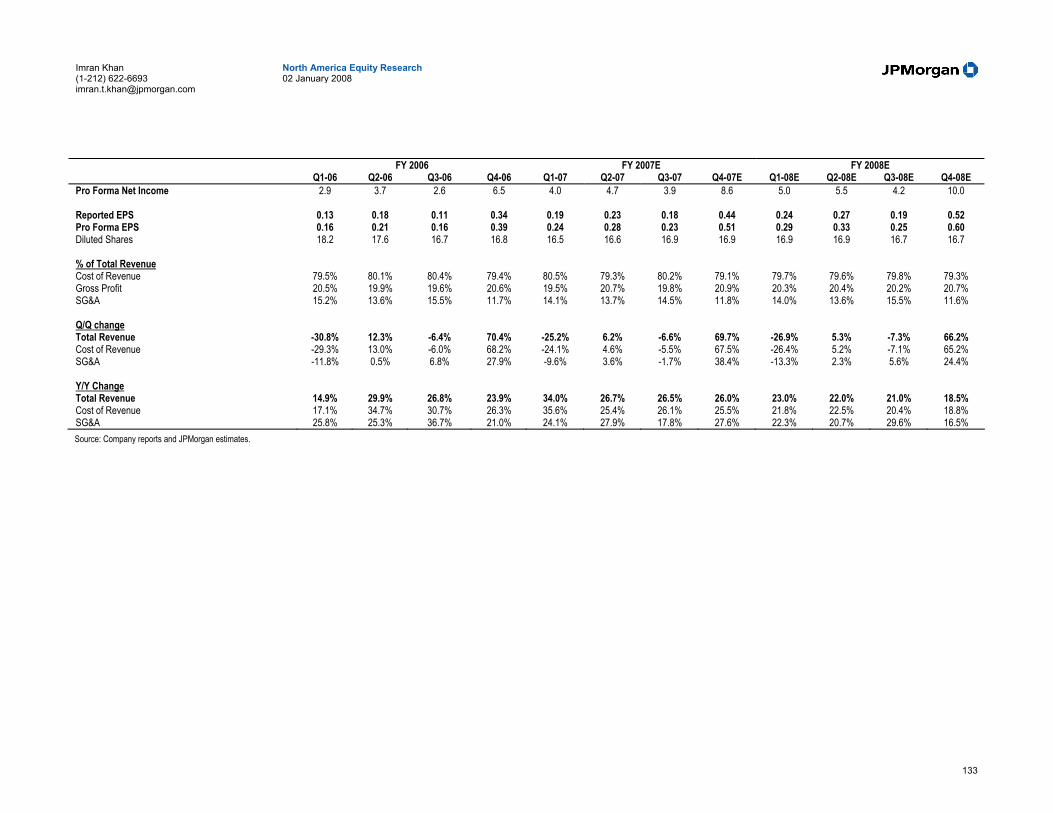
133
North America Equity Research 02 January 2008
Imran Khan (1-212) 622-6693 [email protected]
FY 2006 FY 2007E FY 2008E Q1-06 Q2-06 Q3-06 Q4-06 Q1-07 Q2-07 Q3-07 Q4-07E Q1-08E Q2-08E Q3-08E Q4-08E
Pro Forma Net Income 2.9 3.7 2.6 6.5 4.0 4.7 3.9 8.6 5.0 5.5 4.2 10.0 Reported EPS 0.13 0.18 0.11 0.34 0.19 0.23 0.18 0.44 0.24 0.27 0.19 0.52 Pro Forma EPS 0.16 0.21 0.16 0.39 0.24 0.28 0.23 0.51 0.29 0.33 0.25 0.60 Diluted Shares 18.2 17.6 16.7 16.8 16.5 16.6 16.9 16.9 16.9 16.9 16.7 16.7 % of Total Revenue Cost of Revenue 79.5% 80.1% 80.4% 79.4% 80.5% 79.3% 80.2% 79.1% 79.7% 79.6% 79.8% 79.3% Gross Profit 20.5% 19.9% 19.6% 20.6% 19.5% 20.7% 19.8% 20.9% 20.3% 20.4% 20.2% 20.7% SG&A 15.2% 13.6% 15.5% 11.7% 14.1% 13.7% 14.5% 11.8% 14.0% 13.6% 15.5% 11.6% Q/Q change Total Revenue -30.8% 12.3% -6.4% 70.4% -25.2% 6.2% -6.6% 69.7% -26.9% 5.3% -7.3% 66.2% Cost of Revenue -29.3% 13.0% -6.0% 68.2% -24.1% 4.6% -5.5% 67.5% -26.4% 5.2% -7.1% 65.2% SG&A -11.8% 0.5% 6.8% 27.9% -9.6% 3.6% -1.7% 38.4% -13.3% 2.3% 5.6% 24.4% Y/Y Change Total Revenue 14.9% 29.9% 26.8% 23.9% 34.0% 26.7% 26.5% 26.0% 23.0% 22.0% 21.0% 18.5% Cost of Revenue 17.1% 34.7% 30.7% 26.3% 35.6% 25.4% 26.1% 25.5% 21.8% 22.5% 20.4% 18.8% SG&A 25.8% 25.3% 36.7% 21.0% 24.1% 27.9% 17.8% 27.6% 22.3% 20.7% 29.6% 16.5% Source: Company reports and JPMorgan estimates.
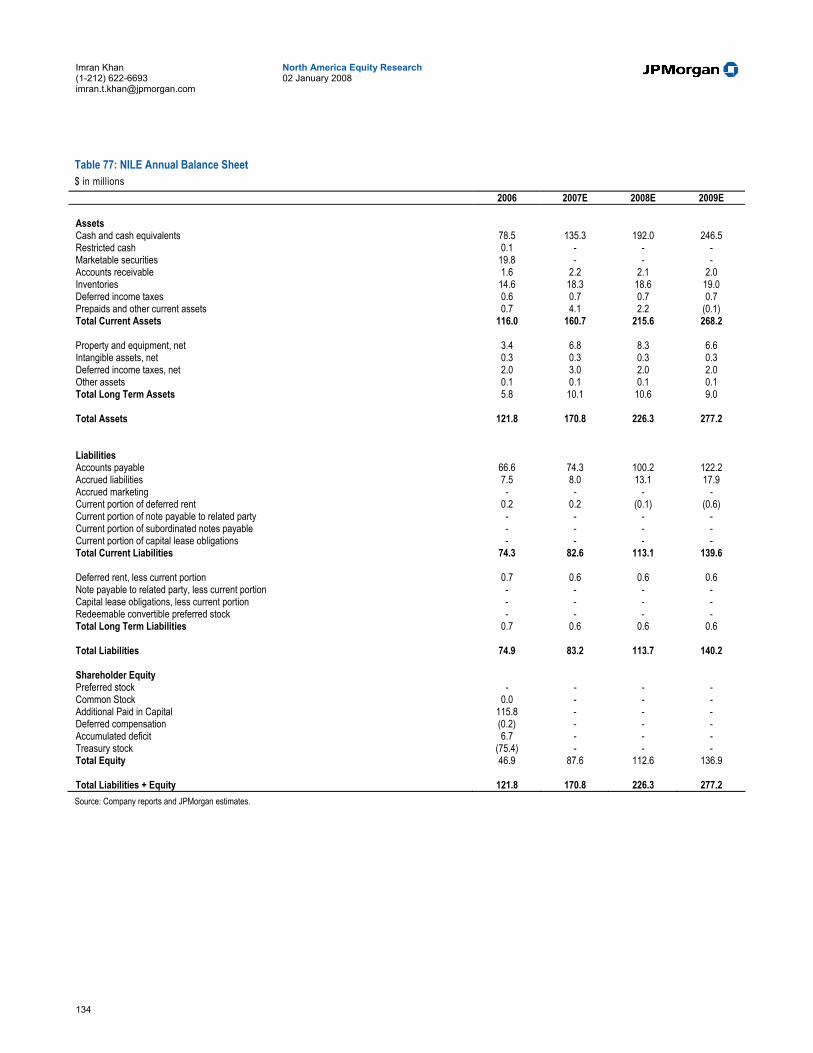
134
North America Equity Research 02 January 2008
Imran Khan (1-212) 622-6693 [email protected]
Table 77: NILE Annual Balance Sheet $ in millions
2006 2007E 2008E 2009E
Assets Cash and cash equivalents 78.5 135.3 192.0 246.5 Restricted cash 0.1 - - - Marketable securities 19.8 - - - Accounts receivable 1.6 2.2 2.1 2.0 Inventories 14.6 18.3 18.6 19.0 Deferred income taxes 0.6 0.7 0.7 0.7 Prepaids and other current assets 0.7 4.1 2.2 (0.1) Total Current Assets 116.0 160.7 215.6 268.2 Property and equipment, net 3.4 6.8 8.3 6.6 Intangible assets, net 0.3 0.3 0.3 0.3 Deferred income taxes, net 2.0 3.0 2.0 2.0 Other assets 0.1 0.1 0.1 0.1 Total Long Term Assets 5.8 10.1 10.6 9.0 Total Assets 121.8 170.8 226.3 277.2 Liabilities Accounts payable 66.6 74.3 100.2 122.2 Accrued liabilities 7.5 8.0 13.1 17.9 Accrued marketing - - - - Current portion of deferred rent 0.2 0.2 (0.1) (0.6) Current portion of note payable to related party - - - - Current portion of subordinated notes payable - - - - Current portion of capital lease obligations - - - - Total Current Liabilities 74.3 82.6 113.1 139.6 Deferred rent, less current portion 0.7 0.6 0.6 0.6 Note payable to related party, less current portion - - - - Capital lease obligations, less current portion - - - - Redeemable convertible preferred stock - - - - Total Long Term Liabilities 0.7 0.6 0.6 0.6 Total Liabilities 74.9 83.2 113.7 140.2 Shareholder Equity Preferred stock - - - - Common Stock 0.0 - - - Additional Paid in Capital 115.8 - - - Deferred compensation (0.2) - - - Accumulated deficit 6.7 - - - Treasury stock (75.4) - - - Total Equity 46.9 87.6 112.6 136.9 Total Liabilities + Equity 121.8 170.8 226.3 277.2 Source: Company reports and JPMorgan estimates.

135
North America Equity Research 02 January 2008
Imran Khan (1-212) 622-6693 [email protected]
Table 78: NILE Annual Cash Flow $ in millions
2006 2007E 2008E 2009E
Operating Cash Flows Net income 13.1 17.3 20.6 25.0 Depreciation and amortization 1.9 1.8 2.5 2.9 Loss on asset retirement 0.0 (0.0) - - Stock-based compensation expense 4.4 5.9 6.3 7.1 Warrant based interest expense - - - - Restructuring charges - - - - Deferred income taxes 2.7 (1.1) (1.0) (1.0) Tax benefit from exercise of stock options 2.7 6.2 - - Excess tax benefit from exercise of stock options (0.2) (1.6) - - Changes in working capital 15.9 20.0 32.2 28.5 Receivables, net 0.2 (0.6) 0.1 0.1 Inventories (2.9) (1.8) (0.3) (0.4) Prepaid expenses and other assets 0.1 (2.8) 1.9 2.3 Accounts payable 16.5 21.7 25.9 22.1 Accrued liabilities 2.2 3.5 5.1 4.9 Deferred rent (0.2) (0.1) (0.4) (0.5) Cash From Operations 40.5 48.5 60.7 62.5 FCF 38.6 43.5 56.7 54.5 27.8% 12.6% 30.4% -3.7% Investing Cash Flows Purchases of property and equipment (1.9) (5.1) (4.0) (8.0) Proceeds from sales of property and equipment 0.0 0.0 - - Transfers to restricted cash 0.0 0.1 - - Purchase/Sale of marketable securities 23.0 19.8 - - Cash From Investing 21.1 14.8 (4.0) (8.0) Financing Cash Flows Proceeds from sale of common stock, net of issuance costs - - - - Proceeds from sale of mandatorily redeemable convertible preferred stock, net of issuance costs
- - - -
Repurchase of restricted and common stock (57.4) (13.5) - - Proceeds from stock option exercises 2.3 5.4 - - Excess tax benefit from exercise of stock options 0.2 1.6 - - Net repayments on line of credit - - - - Payments on subordinated notes payable - - - - Payments on capital lease obligations 0 - - Payments on note payable to related party 0 - - Payment on note payable 0 - - Proceeds from warrant and stock option exercises 0 - - Cash From Financing (55.0) (6.6) - - Net Increase (decrease) in cash 6.6 56.8 56.7 54.5 Beginning Cash 72.0 78.6 135.3 192.0 Ending Cash 78.6 135.3 192.0 246.5 Source: Company reports and JPMorgan estimates.
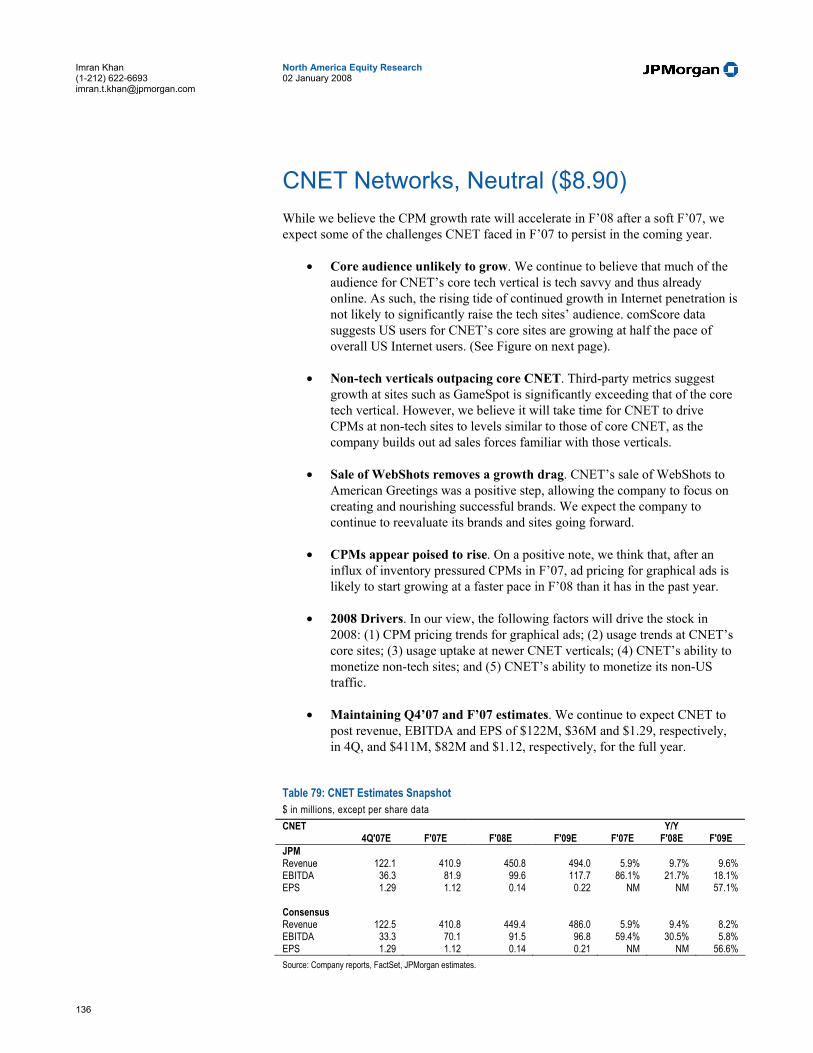
136
North America Equity Research 02 January 2008
Imran Khan (1-212) 622-6693 [email protected]
CNET Networks, Neutral ($8.90) While we believe the CPM growth rate will accelerate in F’08 after a soft F’07, we expect some of the challenges CNET faced in F’07 to persist in the coming year.
• Core audience unlikely to grow. We continue to believe that much of the audience for CNET’s core tech vertical is tech savvy and thus already online. As such, the rising tide of continued growth in Internet penetration is not likely to significantly raise the tech sites’ audience. comScore data suggests US users for CNET’s core sites are growing at half the pace of overall US Internet users. (See Figure on next page).
• Non-tech verticals outpacing core CNET. Third-party metrics suggest growth at sites such as GameSpot is significantly exceeding that of the core tech vertical. However, we believe it will take time for CNET to drive CPMs at non-tech sites to levels similar to those of core CNET, as the company builds out ad sales forces familiar with those verticals.
• Sale of WebShots removes a growth drag. CNET’s sale of WebShots to American Greetings was a positive step, allowing the company to focus on creating and nourishing successful brands. We expect the company to continue to reevaluate its brands and sites going forward.
• CPMs appear poised to rise. On a positive note, we think that, after an influx of inventory pressured CPMs in F’07, ad pricing for graphical ads is likely to start growing at a faster pace in F’08 than it has in the past year.
• 2008 Drivers. In our view, the following factors will drive the stock in 2008: (1) CPM pricing trends for graphical ads; (2) usage trends at CNET’s core sites; (3) usage uptake at newer CNET verticals; (4) CNET’s ability to monetize non-tech sites; and (5) CNET’s ability to monetize its non-US traffic.
• Maintaining Q4’07 and F’07 estimates. We continue to expect CNET to post revenue, EBITDA and EPS of $122M, $36M and $1.29, respectively, in 4Q, and $411M, $82M and $1.12, respectively, for the full year.
Table 79: CNET Estimates Snapshot $ in millions, except per share data CNET Y/Y 4Q'07E F'07E F'08E F'09E F'07E F'08E F'09E JPM Revenue 122.1 410.9 450.8 494.0 5.9% 9.7% 9.6% EBITDA 36.3 81.9 99.6 117.7 86.1% 21.7% 18.1% EPS 1.29 1.12 0.14 0.22 NM NM 57.1%
Consensus Revenue 122.5 410.8 449.4 486.0 5.9% 9.4% 8.2% EBITDA 33.3 70.1 91.5 96.8 59.4% 30.5% 5.8% EPS 1.29 1.12 0.14 0.21 NM NM 56.6% Source: Company reports, FactSet, JPMorgan estimates.
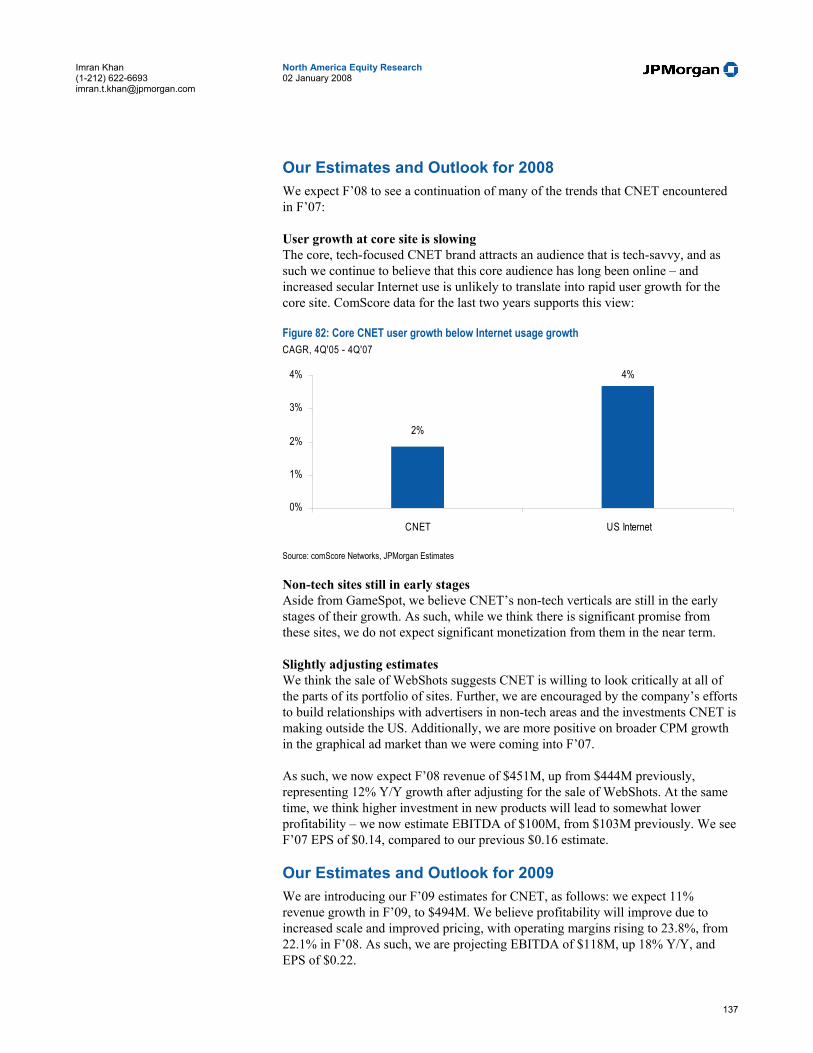
137
North America Equity Research 02 January 2008
Imran Khan (1-212) 622-6693 [email protected]
Our Estimates and Outlook for 2008 We expect F’08 to see a continuation of many of the trends that CNET encountered in F’07:
User growth at core site is slowing The core, tech-focused CNET brand attracts an audience that is tech-savvy, and as such we continue to believe that this core audience has long been online – and increased secular Internet use is unlikely to translate into rapid user growth for the core site. ComScore data for the last two years supports this view:
Figure 82: Core CNET user growth below Internet usage growth CAGR, 4Q'05 - 4Q'07
2%
4%
0%
1%
2%
3%
4%
CNET US Internet
Source: comScore Networks, JPMorgan Estimates Non-tech sites still in early stages Aside from GameSpot, we believe CNET’s non-tech verticals are still in the early stages of their growth. As such, while we think there is significant promise from these sites, we do not expect significant monetization from them in the near term.
Slightly adjusting estimates We think the sale of WebShots suggests CNET is willing to look critically at all of the parts of its portfolio of sites. Further, we are encouraged by the company’s efforts to build relationships with advertisers in non-tech areas and the investments CNET is making outside the US. Additionally, we are more positive on broader CPM growth in the graphical ad market than we were coming into F’07.
As such, we now expect F’08 revenue of $451M, up from $444M previously, representing 12% Y/Y growth after adjusting for the sale of WebShots. At the same time, we think higher investment in new products will lead to somewhat lower profitability – we now estimate EBITDA of $100M, from $103M previously. We see F’07 EPS of $0.14, compared to our previous $0.16 estimate.
Our Estimates and Outlook for 2009 We are introducing our F’09 estimates for CNET, as follows: we expect 11% revenue growth in F’09, to $494M. We believe profitability will improve due to increased scale and improved pricing, with operating margins rising to 23.8%, from 22.1% in F’08. As such, we are projecting EBITDA of $118M, up 18% Y/Y, and EPS of $0.22.
138
North America Equity Research 02 January 2008
Imran Khan (1-212) 622-6693 [email protected]
By F’09, we think some of CNET’s non-tech verticals will likely be able to contribute more meaningfully, although we think it is likely that there will be some misses in addition to the hits.
Further, as online advertising matures in markets outside the US and UK, we think F’09 could be the year when monetization at the company’s international sites improves, although we think it is unlikely to reach parity with US and UK monetization in the foreseeable future.
Valuation and Rating Analysis On an EV/EBITDA basis, CNET trades at 13.7x our F’08 EBITDA estimate of $99.6M, in line with a 12.1x for its peer group. Given the secular challenges, we think multiple expansion is unlikely, and as such, we maintain our Neutral rating.
Risks to Our Rating CNET is highly dependent on the performance of the online advertising industry. During the recent quarter, the majority of CNET’s revenues came from its Marketing Services business segment. The advertising industry is very susceptible to overarching economic conditions, making a large portion of CNET’s revenues vulnerable to general economic risk. Changes in the competitive landscape or new regulations could also significantly impact CNET’s main revenue stream, presenting a downside risk to our rating. On the contrary, should CNET grow at a faster rate than the online industry or further improve its contribution margins, our outlook could prove to be too conservative. Also, if the company further improves its operating margins, the stock could outperform its peers.

139
North America Equity Research 02 January 2008
Imran Khan (1-212) 622-6693 [email protected]
Table 80: CNET Annual Income Statement $ in millions, except per share data FY-06 FY-07E FY-08E FY-09E Marketing services 337.3 363.2 405.3 450.4 Licensing 50.3 47.6 45.5 43.7 Total Revenue 387.7 410.9 450.8 494.0 Cost of Revenue 162.2 166.0 170.9 180.5 Gross Profit 225.5 244.9 279.9 313.5 Gross Margin 58.2% 59.6% 62.1% 63.5% Sales and Marketing 94.7 106.2 117.7 126.7 General and Administrative 50.3 56.8 62.6 69.1 Unusual Inc./Expense 13.7 7.8 - - Depreciation 22.8 28.4 36.7 40.8 Amort.Intangibles 11.9 12.4 12.8 12.8 Asset Impairment 2.8 19.0 - - Stock Compensation 19.8 19.9 23.3 24.0 Total Expenses 216.1 250.4 253.1 273.4 Total Recurring Expenses 145.0 162.9 180.3 195.8 Operating Profit (Reported) 9.4 (5.6) 26.8 40.1 Operating Profit (Pro Forma) 80.5 81.9 99.6 117.7 Operating Margin (Reported) 2.4% -1.4% 6.0% 8.1% Operating Margin (Pro Forma) 20.8% 19.9% 22.1% 23.8% EBITDA 80.5 81.9 99.6 117.7 Realized gain on sale of investments 0.6 2.2 - - Interest Income 4.9 3.3 2.0 2.0 Interest Expense (5.0) (5.3) (5.6) (5.6) Other, Net (0.5) 2.4 - - Total Other, Reported (0.1) 2.7 (3.6) (3.6) Total Other, Pro Forma (0.6) 0.5 (3.6) (3.6) Income Before Taxes 9.3 (2.9) 23.2 36.5 Income Taxes 1.5 (175.8) 1.5 2.1 Tax Rate 15.7% nm 6.4% 5.7% Income After Taxes 7.9 172.9 21.7 34.4 Extraordinary Item (0.0) - - - Reported Net Income 7.8 172.9 21.7 34.4 Reported EPS 0.05 1.12 0.14 0.22 Diluted Shares 152.3 153.3 154.7 155.9 % of Total Revenue Marketing services 87.0% 88.4% 89.9% 91.2% Licensing 13.0% 11.6% 10.1% 8.8% Sales and Marketing 24.4% 25.8% 26.1% 25.7% G&A 13.0% 13.8% 13.9% 14.0% Q/Q change Marketing services Licensing G&A Y/Y Change Marketing services 8% 12% 11% Licensing -5% -4% -4% Total Revenue 15% 6% 10% 10% Sales and Marketing 21% 12% 11% 8% G&A 14% 13% 10% 10% Source: Company reports and JPMorgan estimates.
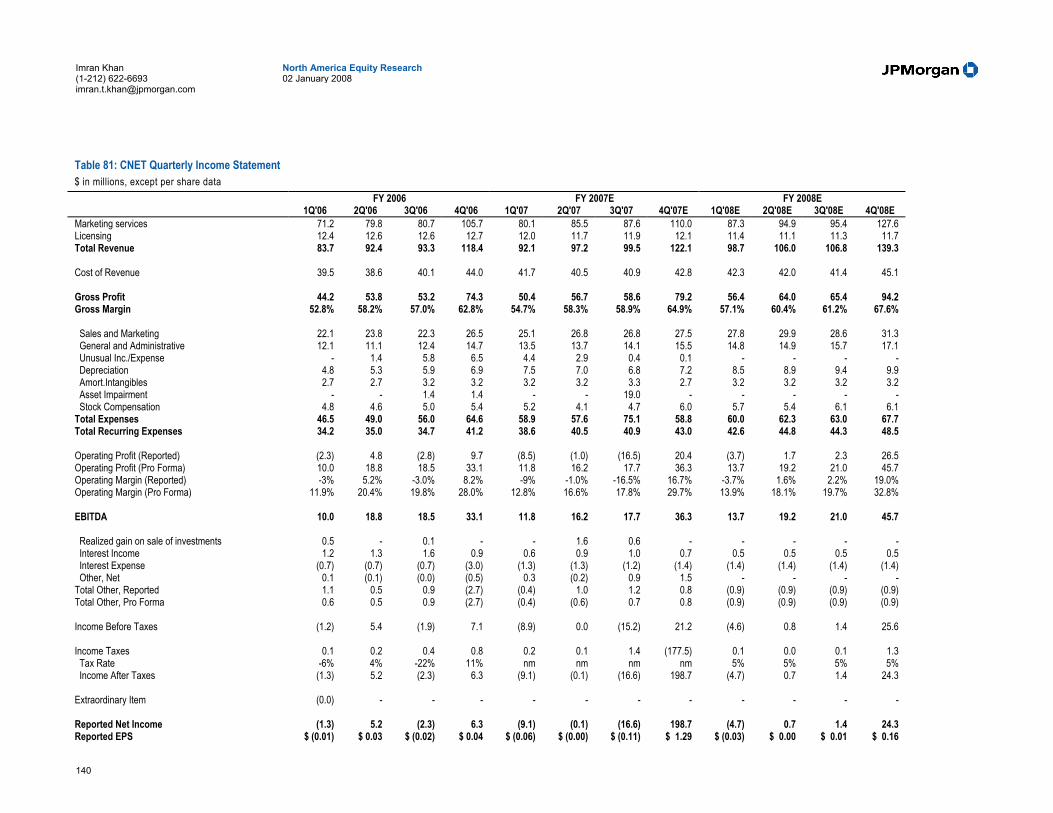
140
North America Equity Research 02 January 2008
Imran Khan (1-212) 622-6693 [email protected]
Table 81: CNET Quarterly Income Statement $ in millions, except per share data
FY 2006 FY 2007E FY 2008E 1Q'06 2Q'06 3Q'06 4Q'06 1Q'07 2Q'07 3Q'07 4Q'07E 1Q'08E 2Q'08E 3Q'08E 4Q'08E
Marketing services 71.2 79.8 80.7 105.7 80.1 85.5 87.6 110.0 87.3 94.9 95.4 127.6 Licensing 12.4 12.6 12.6 12.7 12.0 11.7 11.9 12.1 11.4 11.1 11.3 11.7 Total Revenue 83.7 92.4 93.3 118.4 92.1 97.2 99.5 122.1 98.7 106.0 106.8 139.3 Cost of Revenue 39.5 38.6 40.1 44.0 41.7 40.5 40.9 42.8 42.3 42.0 41.4 45.1 Gross Profit 44.2 53.8 53.2 74.3 50.4 56.7 58.6 79.2 56.4 64.0 65.4 94.2 Gross Margin 52.8% 58.2% 57.0% 62.8% 54.7% 58.3% 58.9% 64.9% 57.1% 60.4% 61.2% 67.6% Sales and Marketing 22.1 23.8 22.3 26.5 25.1 26.8 26.8 27.5 27.8 29.9 28.6 31.3 General and Administrative 12.1 11.1 12.4 14.7 13.5 13.7 14.1 15.5 14.8 14.9 15.7 17.1 Unusual Inc./Expense - 1.4 5.8 6.5 4.4 2.9 0.4 0.1 - - - - Depreciation 4.8 5.3 5.9 6.9 7.5 7.0 6.8 7.2 8.5 8.9 9.4 9.9 Amort.Intangibles 2.7 2.7 3.2 3.2 3.2 3.2 3.3 2.7 3.2 3.2 3.2 3.2 Asset Impairment - - 1.4 1.4 - - 19.0 - - - - - Stock Compensation 4.8 4.6 5.0 5.4 5.2 4.1 4.7 6.0 5.7 5.4 6.1 6.1 Total Expenses 46.5 49.0 56.0 64.6 58.9 57.6 75.1 58.8 60.0 62.3 63.0 67.7 Total Recurring Expenses 34.2 35.0 34.7 41.2 38.6 40.5 40.9 43.0 42.6 44.8 44.3 48.5 Operating Profit (Reported) (2.3) 4.8 (2.8) 9.7 (8.5) (1.0) (16.5) 20.4 (3.7) 1.7 2.3 26.5 Operating Profit (Pro Forma) 10.0 18.8 18.5 33.1 11.8 16.2 17.7 36.3 13.7 19.2 21.0 45.7 Operating Margin (Reported) -3% 5.2% -3.0% 8.2% -9% -1.0% -16.5% 16.7% -3.7% 1.6% 2.2% 19.0% Operating Margin (Pro Forma) 11.9% 20.4% 19.8% 28.0% 12.8% 16.6% 17.8% 29.7% 13.9% 18.1% 19.7% 32.8% EBITDA 10.0 18.8 18.5 33.1 11.8 16.2 17.7 36.3 13.7 19.2 21.0 45.7 Realized gain on sale of investments 0.5 - 0.1 - - 1.6 0.6 - - - - - Interest Income 1.2 1.3 1.6 0.9 0.6 0.9 1.0 0.7 0.5 0.5 0.5 0.5 Interest Expense (0.7) (0.7) (0.7) (3.0) (1.3) (1.3) (1.2) (1.4) (1.4) (1.4) (1.4) (1.4) Other, Net 0.1 (0.1) (0.0) (0.5) 0.3 (0.2) 0.9 1.5 - - - - Total Other, Reported 1.1 0.5 0.9 (2.7) (0.4) 1.0 1.2 0.8 (0.9) (0.9) (0.9) (0.9) Total Other, Pro Forma 0.6 0.5 0.9 (2.7) (0.4) (0.6) 0.7 0.8 (0.9) (0.9) (0.9) (0.9) Income Before Taxes (1.2) 5.4 (1.9) 7.1 (8.9) 0.0 (15.2) 21.2 (4.6) 0.8 1.4 25.6 Income Taxes 0.1 0.2 0.4 0.8 0.2 0.1 1.4 (177.5) 0.1 0.0 0.1 1.3 Tax Rate -6% 4% -22% 11% nm nm nm nm 5% 5% 5% 5% Income After Taxes (1.3) 5.2 (2.3) 6.3 (9.1) (0.1) (16.6) 198.7 (4.7) 0.7 1.4 24.3 Extraordinary Item (0.0) - - - - - - - - - - - Reported Net Income (1.3) 5.2 (2.3) 6.3 (9.1) (0.1) (16.6) 198.7 (4.7) 0.7 1.4 24.3 Reported EPS $ (0.01) $ 0.03 $ (0.02) $ 0.04 $ (0.06) $ (0.00) $ (0.11) $ 1.29 $ (0.03) $ 0.00 $ 0.01 $ 0.16
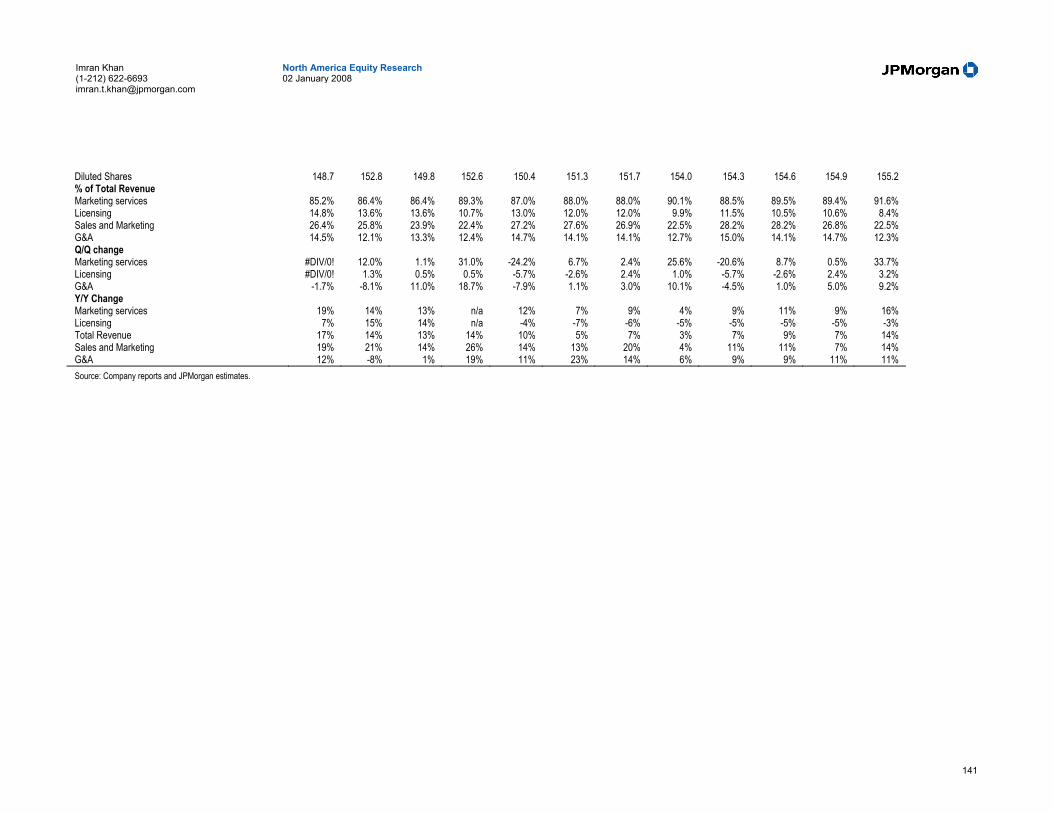
141
North America Equity Research 02 January 2008
Imran Khan (1-212) 622-6693 [email protected]
Diluted Shares 148.7 152.8 149.8 152.6 150.4 151.3 151.7 154.0 154.3 154.6 154.9 155.2 % of Total Revenue Marketing services 85.2% 86.4% 86.4% 89.3% 87.0% 88.0% 88.0% 90.1% 88.5% 89.5% 89.4% 91.6% Licensing 14.8% 13.6% 13.6% 10.7% 13.0% 12.0% 12.0% 9.9% 11.5% 10.5% 10.6% 8.4% Sales and Marketing 26.4% 25.8% 23.9% 22.4% 27.2% 27.6% 26.9% 22.5% 28.2% 28.2% 26.8% 22.5% G&A 14.5% 12.1% 13.3% 12.4% 14.7% 14.1% 14.1% 12.7% 15.0% 14.1% 14.7% 12.3% Q/Q change Marketing services #DIV/0! 12.0% 1.1% 31.0% -24.2% 6.7% 2.4% 25.6% -20.6% 8.7% 0.5% 33.7% Licensing #DIV/0! 1.3% 0.5% 0.5% -5.7% -2.6% 2.4% 1.0% -5.7% -2.6% 2.4% 3.2% G&A -1.7% -8.1% 11.0% 18.7% -7.9% 1.1% 3.0% 10.1% -4.5% 1.0% 5.0% 9.2% Y/Y Change Marketing services 19% 14% 13% n/a 12% 7% 9% 4% 9% 11% 9% 16% Licensing 7% 15% 14% n/a -4% -7% -6% -5% -5% -5% -5% -3% Total Revenue 17% 14% 13% 14% 10% 5% 7% 3% 7% 9% 7% 14% Sales and Marketing 19% 21% 14% 26% 14% 13% 20% 4% 11% 11% 7% 14% G&A 12% -8% 1% 19% 11% 23% 14% 6% 9% 9% 11% 11% Source: Company reports and JPMorgan estimates.
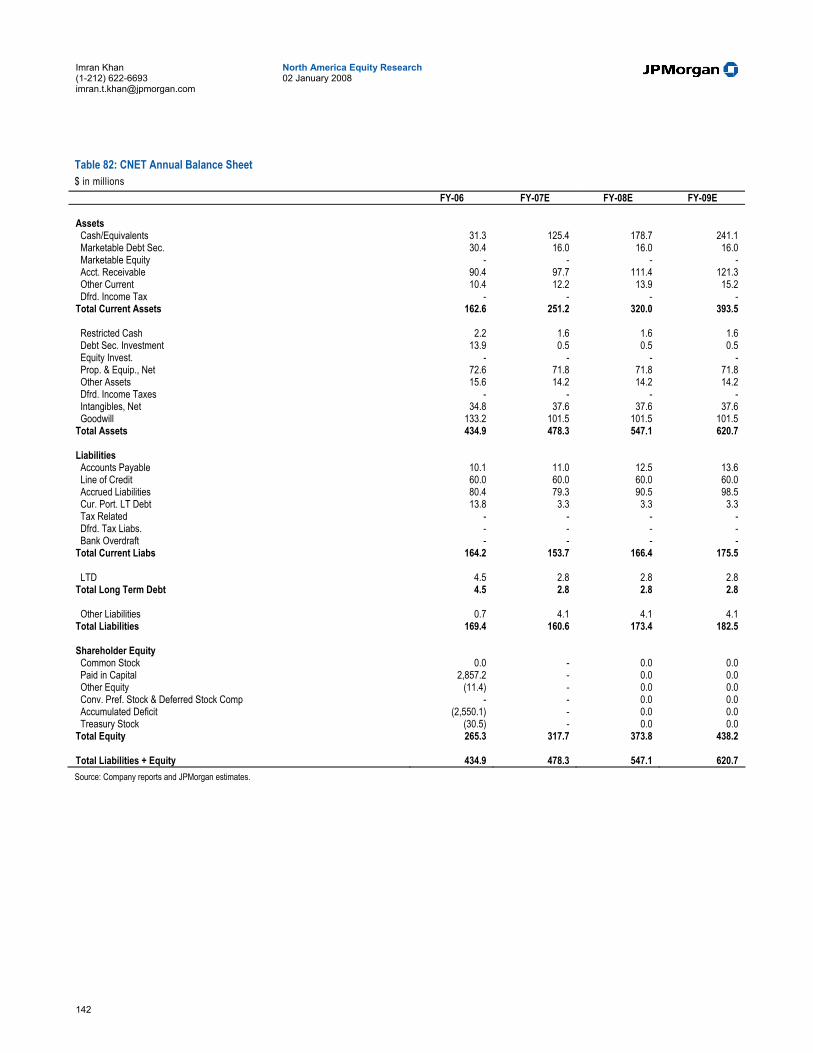
142
North America Equity Research 02 January 2008
Imran Khan (1-212) 622-6693 [email protected]
Table 82: CNET Annual Balance Sheet $ in millions
FY-06 FY-07E FY-08E FY-09E Assets Cash/Equivalents 31.3 125.4 178.7 241.1 Marketable Debt Sec. 30.4 16.0 16.0 16.0 Marketable Equity - - - - Acct. Receivable 90.4 97.7 111.4 121.3 Other Current 10.4 12.2 13.9 15.2 Dfrd. Income Tax - - - - Total Current Assets 162.6 251.2 320.0 393.5 Restricted Cash 2.2 1.6 1.6 1.6 Debt Sec. Investment 13.9 0.5 0.5 0.5 Equity Invest. - - - - Prop. & Equip., Net 72.6 71.8 71.8 71.8 Other Assets 15.6 14.2 14.2 14.2 Dfrd. Income Taxes - - - - Intangibles, Net 34.8 37.6 37.6 37.6 Goodwill 133.2 101.5 101.5 101.5 Total Assets 434.9 478.3 547.1 620.7 Liabilities Accounts Payable 10.1 11.0 12.5 13.6 Line of Credit 60.0 60.0 60.0 60.0 Accrued Liabilities 80.4 79.3 90.5 98.5 Cur. Port. LT Debt 13.8 3.3 3.3 3.3 Tax Related - - - - Dfrd. Tax Liabs. - - - - Bank Overdraft - - - - Total Current Liabs 164.2 153.7 166.4 175.5 LTD 4.5 2.8 2.8 2.8 Total Long Term Debt 4.5 2.8 2.8 2.8 Other Liabilities 0.7 4.1 4.1 4.1 Total Liabilities 169.4 160.6 173.4 182.5 Shareholder Equity Common Stock 0.0 - 0.0 0.0 Paid in Capital 2,857.2 - 0.0 0.0 Other Equity (11.4) - 0.0 0.0 Conv. Pref. Stock & Deferred Stock Comp - - 0.0 0.0 Accumulated Deficit (2,550.1) - 0.0 0.0 Treasury Stock (30.5) - 0.0 0.0 Total Equity 265.3 317.7 373.8 438.2 Total Liabilities + Equity 434.9 478.3 547.1 620.7 Source: Company reports and JPMorgan estimates.

143
North America Equity Research 02 January 2008
Imran Khan (1-212) 622-6693 [email protected]
Table 83: CNET Annual Cash Flow Statement $ in millions
FY-06 FY-07E FY-08E FY-09E
Operating Cash Flows Net Income 7.8 172.9 21.7 34.4 Depreciation & Amort 34.7 40.8 49.5 53.6 Stock compensation expense 19.8 19.9 23.3 24.0 Deferred Taxes - (177.5) - - Fair Value Remeasurement Non-Cash Items - (0.1) - - Noncash Interest (0.6) (0.1) - - Goodwill Impairment 2.8 19.0 - - Loss-Sale of Assets 0.3 - - - Debt Retirement - - - - Extraordinary Loss - - - - Doubtful Accounts 2.5 1.6 - - Gain on Sale of Business (0.3) - - - Investment Sales & Equity Loss (0.6) (2.2) - - Working Capital (4.6) 0.1 - - Cash From Operations 61.8 73.7 94.5 112.0 FCF 29.0 42.7 48.5 57.7 Investing Cash Flows Purch.-Mktbl. Secs. - - - - Purch.- Mktbl. Debt (45.5) (9.4) - - Proc. Mktbl. Debt 57.6 38.7 - - Proc. Mktbl. Equity - 1.6 - - Release of restrictions on cash 0.1 0.6 - - Other Investing 3.1 2.5 - - Capital Expenditures (32.8) (31.0) (46.0) (54.3) Cash Acq. & Asset Sales, Net (14.5) 5.4 - - Cash From Investing (32.1) 8.5 (46.0) (54.3) Financing Cash Flows Pmt from Sharehold notes - (0.0) - - Net borrowing on credit facility - (0.0) - - Pmt from Employee stk plan - - - - Purch./Sale of Stock - - - - Payments-Cap. Leases - - - - Debt, Net (62.9) - - - Common/Options/ESOP 7.3 11.7 4.7 4.7 Cash From Financing (55.7) 11.6 4.7 4.7 Net Increase (decrease) in cash (25.9) 93.8 53.3 62.5 Foreign Exch Effects 1.4 0.2 - - Beginning Cash 55.9 31.3 125.4 178.7 Ending Cash 31.3 125.4 178.7 186.5 Source: Company reports and JPMorgan estimates.

144
North America Equity Research 02 January 2008
Imran Khan (1-212) 622-6693 [email protected]
eBay, Overweight ($34.49) After Y/Y listings declines in the first nine months of F’07, 4Q’07 saw reaccelerated listings growth, and the company has made several incremental structure and pricing changes intended to strengthen the core site. We maintain our optimistic outlook as we see continued RPL and listings growth in F’08 and F’09, and believe the PayPal franchise’s increasing off-eBay penetration remains a growth driver for the company.
• PayPal is a catalyst for growth. PayPal is no longer just a lubricant for the eBay marketplace; in the first three quarters of ’07, 41.5% of PayPal TPV was off-eBay, a rise of over 650 bps Y/Y. We think this trend is likely to continue, and thus we are projecting PayPal revenue to grow 25% in F’08 and 23% in F’09, even as eBay GMV rises 10% in both years.
• Will eBay experiment with site structure? The company has made public statements suggesting alternative fee schedules for the core site may be considered, possibly shifting toward lower listing fees and higher final-value fees. We believe the ’06 shift in Stores listings has ensured that eBay will make changes very tentatively and after experimentation. Additionally, we expect revenue loss from the introduction of lower listing fees will be offset by higher final value fees and faster listings growth. As such, we expect neutral near-term impact from site structure changes.
• Strong growth from StubHub!, ad revenues and classifieds. We believe eBay’s businesses outside the core marketplace are poised for continued strength in F’08. We think the international expansion of StubHub! presents a significant growth opportunity, and we believe eBay is likely to start reaping increased rewards as its advertising deal with Google matures.
• 2008 Drivers. In our view, the following factors will drive the stock in 2008: (1) RPL improvements; (2) impact of promotions and price changes on marketplace ecosystem; (3) growth in non-GMV businesses; (4) improved int’l PayPal penetration; (5) growing PayPal presence off-eBay.
• Maintaining 4Q’07 and F’07 estimates. Our listings tracking and conversations with sellers give us confidence in our 4Q’07 revenue, EBITDA and pro forma EPS estimates of $2.19B, $726M and $0.40. For the full year, we expect $7.68B, $2.55B and $1.48, respectively.
Table 84: eBay Consensus Snapshot $ in millions, except per share data EBAY Y/Y 4Q'07E F'07E F'08E F'09E F'07E F'08E F'09E JPM Revenue 2,193 7,685 9,007 10,506 28.7% 17.2% 16.6% EBITDA 811 2,863 3,337 3,754 1.6% 17.7% 13.9% EPS 0.40 1.48 1.70 1.98 41.2% 14.6% 16.7%
Consensus Revenue 2,136 7,632 9,031 10,603 27.8% 18.3% 17.4% EBITDA 823 2,915 3,392 3,848 16.4% 16.4% 13.5% EPS 0.40 1.49 1.66 1.94 41.8% 11.6% 16.9% Source: Company reports, FactSet, JPMorgan estimates.
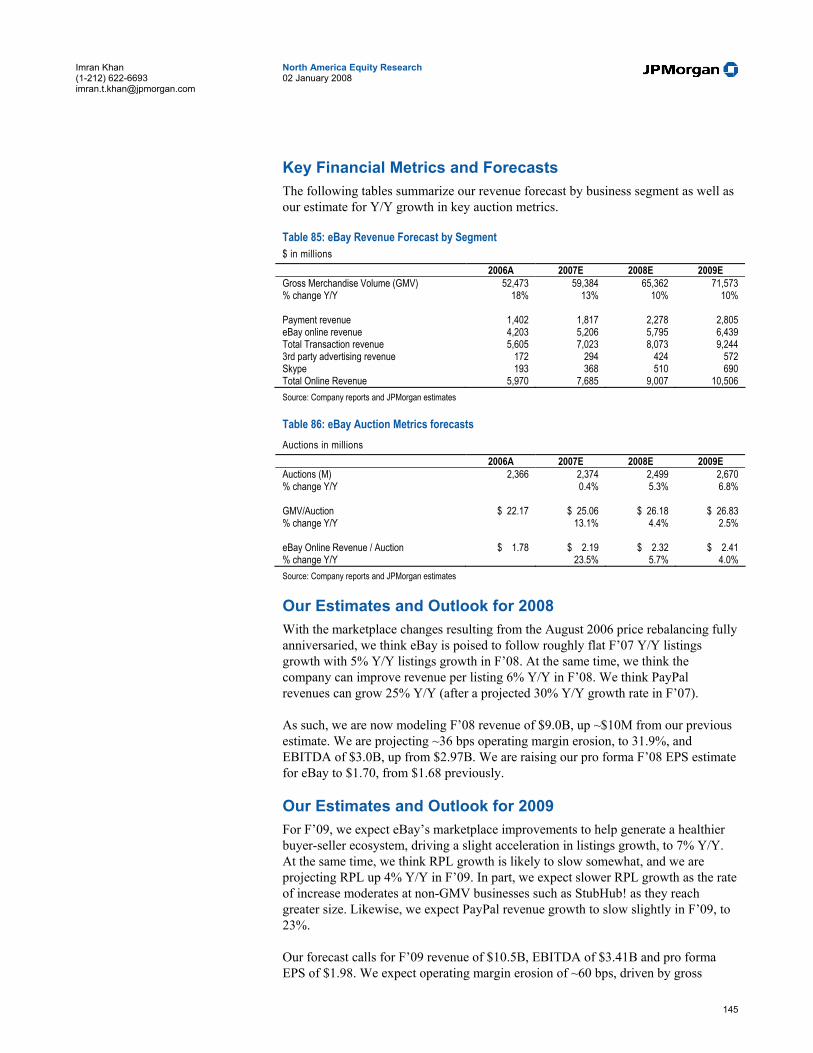
145
North America Equity Research 02 January 2008
Imran Khan (1-212) 622-6693 [email protected]
Key Financial Metrics and Forecasts The following tables summarize our revenue forecast by business segment as well as our estimate for Y/Y growth in key auction metrics.
Table 85: eBay Revenue Forecast by Segment $ in millions
2006A 2007E 2008E 2009E Gross Merchandise Volume (GMV) 52,473 59,384 65,362 71,573 % change Y/Y 18% 13% 10% 10%
Payment revenue 1,402 1,817 2,278 2,805 eBay online revenue 4,203 5,206 5,795 6,439 Total Transaction revenue 5,605 7,023 8,073 9,244 3rd party advertising revenue 172 294 424 572 Skype 193 368 510 690 Total Online Revenue 5,970 7,685 9,007 10,506 Source: Company reports and JPMorgan estimates Table 86: eBay Auction Metrics forecasts Auctions in millions
2006A 2007E 2008E 2009E Auctions (M) 2,366 2,374 2,499 2,670 % change Y/Y 0.4% 5.3% 6.8%
GMV/Auction $ 22.17 $ 25.06 $ 26.18 $ 26.83 % change Y/Y 13.1% 4.4% 2.5%
eBay Online Revenue / Auction $ 1.78 $ 2.19 $ 2.32 $ 2.41 % change Y/Y 23.5% 5.7% 4.0% Source: Company reports and JPMorgan estimates
Our Estimates and Outlook for 2008 With the marketplace changes resulting from the August 2006 price rebalancing fully anniversaried, we think eBay is poised to follow roughly flat F’07 Y/Y listings growth with 5% Y/Y listings growth in F’08. At the same time, we think the company can improve revenue per listing 6% Y/Y in F’08. We think PayPal revenues can grow 25% Y/Y (after a projected 30% Y/Y growth rate in F’07).
As such, we are now modeling F’08 revenue of $9.0B, up ~$10M from our previous estimate. We are projecting ~36 bps operating margin erosion, to 31.9%, and EBITDA of $3.0B, up from $2.97B. We are raising our pro forma F’08 EPS estimate for eBay to $1.70, from $1.68 previously.
Our Estimates and Outlook for 2009 For F’09, we expect eBay’s marketplace improvements to help generate a healthier buyer-seller ecosystem, driving a slight acceleration in listings growth, to 7% Y/Y. At the same time, we think RPL growth is likely to slow somewhat, and we are projecting RPL up 4% Y/Y in F’09. In part, we expect slower RPL growth as the rate of increase moderates at non-GMV businesses such as StubHub! as they reach greater size. Likewise, we expect PayPal revenue growth to slow slightly in F’09, to 23%.
Our forecast calls for F’09 revenue of $10.5B, EBITDA of $3.41B and pro forma EPS of $1.98. We expect operating margin erosion of ~60 bps, driven by gross

146
North America Equity Research 02 January 2008
Imran Khan (1-212) 622-6693 [email protected]
margin pressure from a revenue mix that tilts more heavily toward lower-gross-margin PayPal revenue.
Valuation and Rating Analysis On an EV/EBITDA basis, eBay trades 12.7x our F’08 estimate, compared to its peers at 18.0x F’08 estimates. We think such a discount is unwarranted.. We thus reiterate our Overweight rating.
Risks to Our Rating Risks associated with our Overweight rating include: barriers to international expansion, competition from sponsored search vendors, the company’s dependence on eBay Motors, competition from hardline retailers, risks associated with patent litigation, and valuation risks.
International expansion is a concrete part of eBay’s growth strategy. As the company continues to grow outside the U.S., it may face regulatory challenges and/or markets that make its business less profitable than it is in the U.S. or other countries where it is already established. Thus far, we believe eBay’s international expansion has been carried out in a strategic and timely manner.
eBay also faces risks from hardline retailers. Although the bulk of eBay’s revenues come from the beginning and end of the retail life cycle, with each passing quarter, the percentage of revenue it earns from the in-season retail and fixed price sales continues to increase. This puts the company in competition with traditional retailers and other e-tailers, including Amazon.com, Wal-Mart, BestBuy, and Home Depot. Failure to meet these challenges could lead to relative stock price underperformance.
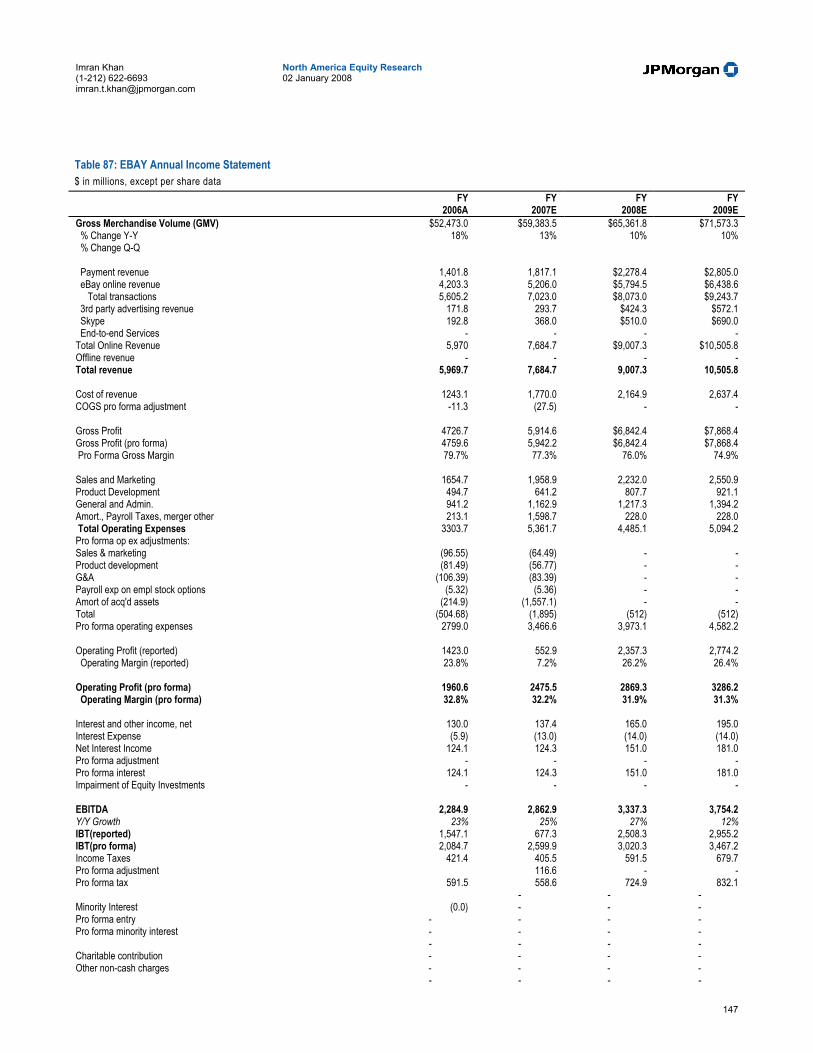
147
North America Equity Research 02 January 2008
Imran Khan (1-212) 622-6693 [email protected]
Table 87: EBAY Annual Income Statement $ in millions, except per share data
FY FY FY FY 2006A 2007E 2008E 2009E
Gross Merchandise Volume (GMV) $52,473.0 $59,383.5 $65,361.8 $71,573.3 % Change Y-Y 18% 13% 10% 10% % Change Q-Q Payment revenue 1,401.8 1,817.1 $2,278.4 $2,805.0 eBay online revenue 4,203.3 5,206.0 $5,794.5 $6,438.6 Total transactions 5,605.2 7,023.0 $8,073.0 $9,243.7 3rd party advertising revenue 171.8 293.7 $424.3 $572.1 Skype 192.8 368.0 $510.0 $690.0 End-to-end Services - - - - Total Online Revenue 5,970 7,684.7 $9,007.3 $10,505.8 Offline revenue - - - - Total revenue 5,969.7 7,684.7 9,007.3 10,505.8 Cost of revenue 1243.1 1,770.0 2,164.9 2,637.4 COGS pro forma adjustment -11.3 (27.5) - - Gross Profit 4726.7 5,914.6 $6,842.4 $7,868.4 Gross Profit (pro forma) 4759.6 5,942.2 $6,842.4 $7,868.4 Pro Forma Gross Margin 79.7% 77.3% 76.0% 74.9% Sales and Marketing 1654.7 1,958.9 2,232.0 2,550.9 Product Development 494.7 641.2 807.7 921.1 General and Admin. 941.2 1,162.9 1,217.3 1,394.2 Amort., Payroll Taxes, merger other 213.1 1,598.7 228.0 228.0 Total Operating Expenses 3303.7 5,361.7 4,485.1 5,094.2 Pro forma op ex adjustments: Sales & marketing (96.55) (64.49) - - Product development (81.49) (56.77) - - G&A (106.39) (83.39) - - Payroll exp on empl stock options (5.32) (5.36) - - Amort of acq'd assets (214.9) (1,557.1) - - Total (504.68) (1,895) (512) (512) Pro forma operating expenses 2799.0 3,466.6 3,973.1 4,582.2 Operating Profit (reported) 1423.0 552.9 2,357.3 2,774.2 Operating Margin (reported) 23.8% 7.2% 26.2% 26.4% Operating Profit (pro forma) 1960.6 2475.5 2869.3 3286.2 Operating Margin (pro forma) 32.8% 32.2% 31.9% 31.3% Interest and other income, net 130.0 137.4 165.0 195.0 Interest Expense (5.9) (13.0) (14.0) (14.0) Net Interest Income 124.1 124.3 151.0 181.0 Pro forma adjustment - - - - Pro forma interest 124.1 124.3 151.0 181.0 Impairment of Equity Investments - - - - EBITDA 2,284.9 2,862.9 3,337.3 3,754.2 Y/Y Growth 23% 25% 27% 12% IBT(reported) 1,547.1 677.3 2,508.3 2,955.2 IBT(pro forma) 2,084.7 2,599.9 3,020.3 3,467.2 Income Taxes 421.4 405.5 591.5 679.7 Pro forma adjustment 116.6 - - Pro forma tax 591.5 558.6 724.9 832.1 - - - Minority Interest (0.0) - - - Pro forma entry - - - - Pro forma minority interest - - - - - - - - Charitable contribution - - - - Other non-cash charges - - - - - - - -
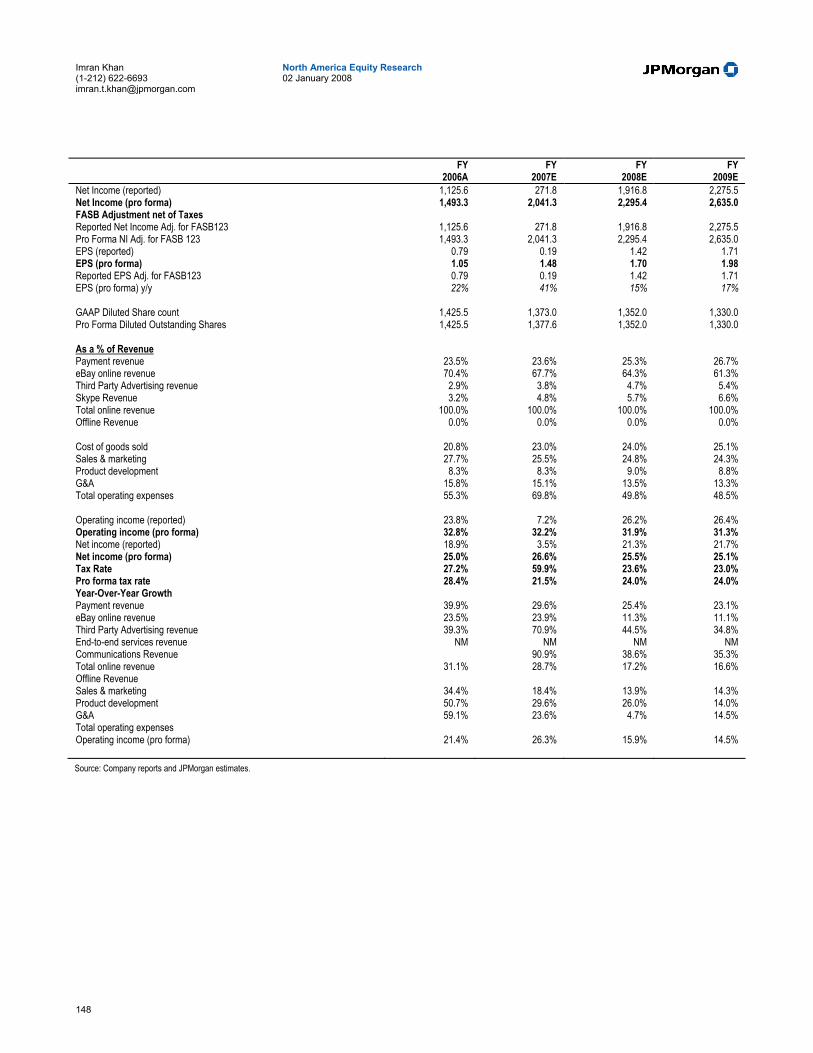
148
North America Equity Research 02 January 2008
Imran Khan (1-212) 622-6693 [email protected]
FY FY FY FY 2006A 2007E 2008E 2009E
Net Income (reported) 1,125.6 271.8 1,916.8 2,275.5 Net Income (pro forma) 1,493.3 2,041.3 2,295.4 2,635.0 FASB Adjustment net of Taxes Reported Net Income Adj. for FASB123 1,125.6 271.8 1,916.8 2,275.5 Pro Forma NI Adj. for FASB 123 1,493.3 2,041.3 2,295.4 2,635.0 EPS (reported) 0.79 0.19 1.42 1.71 EPS (pro forma) 1.05 1.48 1.70 1.98 Reported EPS Adj. for FASB123 0.79 0.19 1.42 1.71 EPS (pro forma) y/y 22% 41% 15% 17% GAAP Diluted Share count 1,425.5 1,373.0 1,352.0 1,330.0 Pro Forma Diluted Outstanding Shares 1,425.5 1,377.6 1,352.0 1,330.0 2 As a % of Revenue Payment revenue 23.5% 23.6% 25.3% 26.7% eBay online revenue 70.4% 67.7% 64.3% 61.3% Third Party Advertising revenue 2.9% 3.8% 4.7% 5.4% Skype Revenue 3.2% 4.8% 5.7% 6.6% Total online revenue 100.0% 100.0% 100.0% 100.0% Offline Revenue 0.0% 0.0% 0.0% 0.0% Cost of goods sold 20.8% 23.0% 24.0% 25.1% Sales & marketing 27.7% 25.5% 24.8% 24.3% Product development 8.3% 8.3% 9.0% 8.8% G&A 15.8% 15.1% 13.5% 13.3% Total operating expenses 55.3% 69.8% 49.8% 48.5% Operating income (reported) 23.8% 7.2% 26.2% 26.4% Operating income (pro forma) 32.8% 32.2% 31.9% 31.3% Net income (reported) 18.9% 3.5% 21.3% 21.7% Net income (pro forma) 25.0% 26.6% 25.5% 25.1% Tax Rate 27.2% 59.9% 23.6% 23.0% Pro forma tax rate 28.4% 21.5% 24.0% 24.0% Year-Over-Year Growth Payment revenue 39.9% 29.6% 25.4% 23.1% eBay online revenue 23.5% 23.9% 11.3% 11.1% Third Party Advertising revenue 39.3% 70.9% 44.5% 34.8% End-to-end services revenue NM NM NM NM Communications Revenue 90.9% 38.6% 35.3% Total online revenue 31.1% 28.7% 17.2% 16.6% Offline Revenue Sales & marketing 34.4% 18.4% 13.9% 14.3% Product development 50.7% 29.6% 26.0% 14.0% G&A 59.1% 23.6% 4.7% 14.5% Total operating expenses Operating income (pro forma) 21.4% 26.3% 15.9% 14.5% Source: Company reports and JPMorgan estimates.
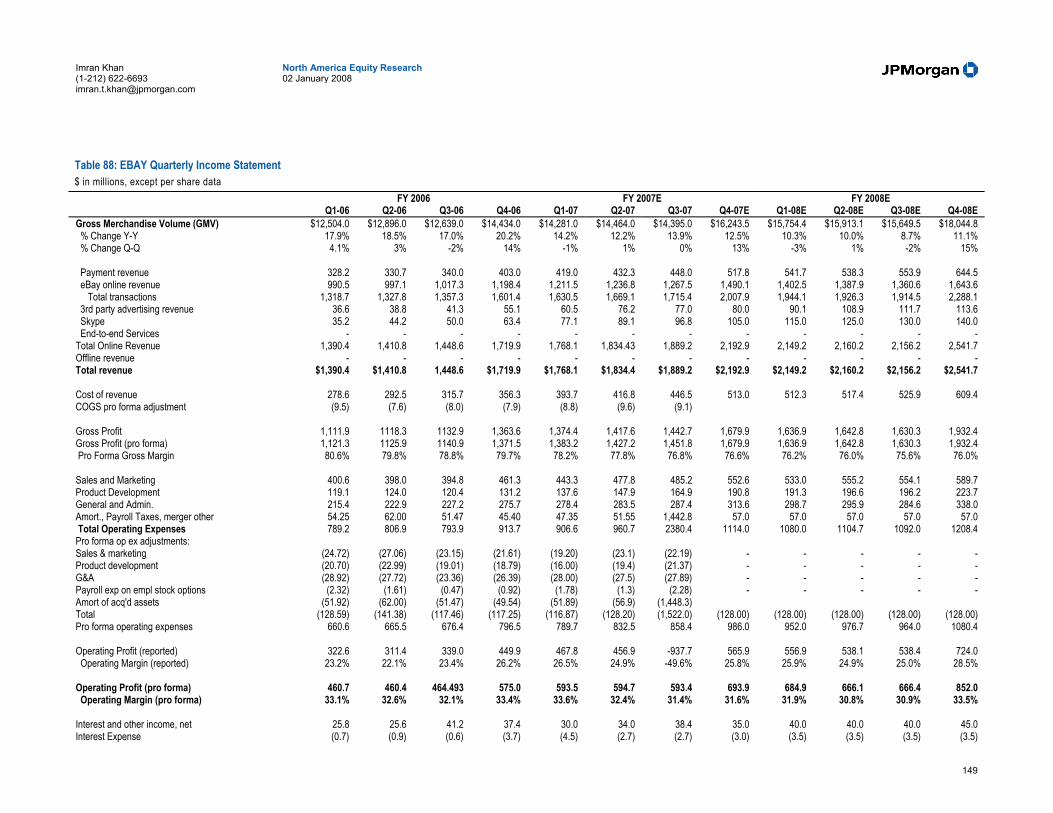
149
North America Equity Research 02 January 2008
Imran Khan (1-212) 622-6693 [email protected]
Table 88: EBAY Quarterly Income Statement $ in millions, except per share data
FY 2006 FY 2007E FY 2008E Q1-06 Q2-06 Q3-06 Q4-06 Q1-07 Q2-07 Q3-07 Q4-07E Q1-08E Q2-08E Q3-08E Q4-08E
Gross Merchandise Volume (GMV) $12,504.0 $12,896.0 $12,639.0 $14,434.0 $14,281.0 $14,464.0 $14,395.0 $16,243.5 $15,754.4 $15,913.1 $15,649.5 $18,044.8 % Change Y-Y 17.9% 18.5% 17.0% 20.2% 14.2% 12.2% 13.9% 12.5% 10.3% 10.0% 8.7% 11.1% % Change Q-Q 4.1% 3% -2% 14% -1% 1% 0% 13% -3% 1% -2% 15% Payment revenue 328.2 330.7 340.0 403.0 419.0 432.3 448.0 517.8 541.7 538.3 553.9 644.5 eBay online revenue 990.5 997.1 1,017.3 1,198.4 1,211.5 1,236.8 1,267.5 1,490.1 1,402.5 1,387.9 1,360.6 1,643.6 Total transactions 1,318.7 1,327.8 1,357.3 1,601.4 1,630.5 1,669.1 1,715.4 2,007.9 1,944.1 1,926.3 1,914.5 2,288.1 3rd party advertising revenue 36.6 38.8 41.3 55.1 60.5 76.2 77.0 80.0 90.1 108.9 111.7 113.6 Skype 35.2 44.2 50.0 63.4 77.1 89.1 96.8 105.0 115.0 125.0 130.0 140.0 End-to-end Services - - - - - - - - - - - - Total Online Revenue 1,390.4 1,410.8 1,448.6 1,719.9 1,768.1 1,834.43 1,889.2 2,192.9 2,149.2 2,160.2 2,156.2 2,541.7 Offline revenue - - - - - - - - - - - - Total revenue $1,390.4 $1,410.8 1,448.6 $1,719.9 $1,768.1 $1,834.4 $1,889.2 $2,192.9 $2,149.2 $2,160.2 $2,156.2 $2,541.7 Cost of revenue 278.6 292.5 315.7 356.3 393.7 416.8 446.5 513.0 512.3 517.4 525.9 609.4 COGS pro forma adjustment (9.5) (7.6) (8.0) (7.9) (8.8) (9.6) (9.1) Gross Profit 1,111.9 1118.3 1132.9 1,363.6 1,374.4 1,417.6 1,442.7 1,679.9 1,636.9 1,642.8 1,630.3 1,932.4 Gross Profit (pro forma) 1,121.3 1125.9 1140.9 1,371.5 1,383.2 1,427.2 1,451.8 1,679.9 1,636.9 1,642.8 1,630.3 1,932.4 Pro Forma Gross Margin 80.6% 79.8% 78.8% 79.7% 78.2% 77.8% 76.8% 76.6% 76.2% 76.0% 75.6% 76.0% Sales and Marketing 400.6 398.0 394.8 461.3 443.3 477.8 485.2 552.6 533.0 555.2 554.1 589.7 Product Development 119.1 124.0 120.4 131.2 137.6 147.9 164.9 190.8 191.3 196.6 196.2 223.7 General and Admin. 215.4 222.9 227.2 275.7 278.4 283.5 287.4 313.6 298.7 295.9 284.6 338.0 Amort., Payroll Taxes, merger other 54.25 62.00 51.47 45.40 47.35 51.55 1,442.8 57.0 57.0 57.0 57.0 57.0 Total Operating Expenses 789.2 806.9 793.9 913.7 906.6 960.7 2380.4 1114.0 1080.0 1104.7 1092.0 1208.4 Pro forma op ex adjustments: Sales & marketing (24.72) (27.06) (23.15) (21.61) (19.20) (23.1) (22.19) - - - - - Product development (20.70) (22.99) (19.01) (18.79) (16.00) (19.4) (21.37) - - - - - G&A (28.92) (27.72) (23.36) (26.39) (28.00) (27.5) (27.89) - - - - - Payroll exp on empl stock options (2.32) (1.61) (0.47) (0.92) (1.78) (1.3) (2.28) - - - - - Amort of acq'd assets (51.92) (62.00) (51.47) (49.54) (51.89) (56.9) (1,448.3) Total (128.59) (141.38) (117.46) (117.25) (116.87) (128.20) (1,522.0) (128.00) (128.00) (128.00) (128.00) (128.00) Pro forma operating expenses 660.6 665.5 676.4 796.5 789.7 832.5 858.4 986.0 952.0 976.7 964.0 1080.4 Operating Profit (reported) 322.6 311.4 339.0 449.9 467.8 456.9 -937.7 565.9 556.9 538.1 538.4 724.0 Operating Margin (reported) 23.2% 22.1% 23.4% 26.2% 26.5% 24.9% -49.6% 25.8% 25.9% 24.9% 25.0% 28.5% Operating Profit (pro forma) 460.7 460.4 464.493 575.0 593.5 594.7 593.4 693.9 684.9 666.1 666.4 852.0 Operating Margin (pro forma) 33.1% 32.6% 32.1% 33.4% 33.6% 32.4% 31.4% 31.6% 31.9% 30.8% 30.9% 33.5% Interest and other income, net 25.8 25.6 41.2 37.4 30.0 34.0 38.4 35.0 40.0 40.0 40.0 45.0 Interest Expense (0.7) (0.9) (0.6) (3.7) (4.5) (2.7) (2.7) (3.0) (3.5) (3.5) (3.5) (3.5)
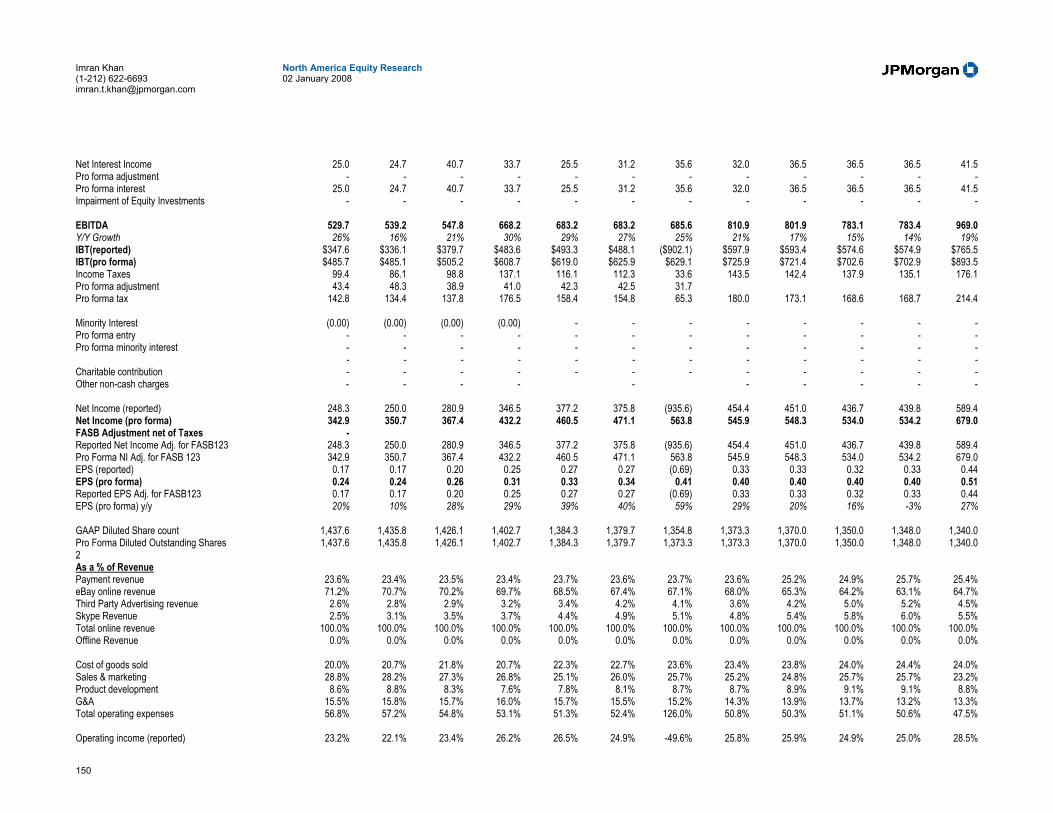
150
North America Equity Research 02 January 2008
Imran Khan (1-212) 622-6693 [email protected]
Net Interest Income 25.0 24.7 40.7 33.7 25.5 31.2 35.6 32.0 36.5 36.5 36.5 41.5 Pro forma adjustment - - - - - - - - - - - - Pro forma interest 25.0 24.7 40.7 33.7 25.5 31.2 35.6 32.0 36.5 36.5 36.5 41.5 Impairment of Equity Investments - - - - - - - - - - - - EBITDA 529.7 539.2 547.8 668.2 683.2 683.2 685.6 810.9 801.9 783.1 783.4 969.0 Y/Y Growth 26% 16% 21% 30% 29% 27% 25% 21% 17% 15% 14% 19% IBT(reported) $347.6 $336.1 $379.7 $483.6 $493.3 $488.1 ($902.1) $597.9 $593.4 $574.6 $574.9 $765.5 IBT(pro forma) $485.7 $485.1 $505.2 $608.7 $619.0 $625.9 $629.1 $725.9 $721.4 $702.6 $702.9 $893.5 Income Taxes 99.4 86.1 98.8 137.1 116.1 112.3 33.6 143.5 142.4 137.9 135.1 176.1 Pro forma adjustment 43.4 48.3 38.9 41.0 42.3 42.5 31.7 Pro forma tax 142.8 134.4 137.8 176.5 158.4 154.8 65.3 180.0 173.1 168.6 168.7 214.4 Minority Interest (0.00) (0.00) (0.00) (0.00) - - - - - - - - Pro forma entry - - - - - - - - - - - - Pro forma minority interest - - - - - - - - - - - - - - - - - - - - - - - - Charitable contribution - - - - - - - - - - - - Other non-cash charges - - - - - - - - - - Net Income (reported) 248.3 250.0 280.9 346.5 377.2 375.8 (935.6) 454.4 451.0 436.7 439.8 589.4 Net Income (pro forma) 342.9 350.7 367.4 432.2 460.5 471.1 563.8 545.9 548.3 534.0 534.2 679.0 FASB Adjustment net of Taxes - Reported Net Income Adj. for FASB123 248.3 250.0 280.9 346.5 377.2 375.8 (935.6) 454.4 451.0 436.7 439.8 589.4 Pro Forma NI Adj. for FASB 123 342.9 350.7 367.4 432.2 460.5 471.1 563.8 545.9 548.3 534.0 534.2 679.0 EPS (reported) 0.17 0.17 0.20 0.25 0.27 0.27 (0.69) 0.33 0.33 0.32 0.33 0.44 EPS (pro forma) 0.24 0.24 0.26 0.31 0.33 0.34 0.41 0.40 0.40 0.40 0.40 0.51 Reported EPS Adj. for FASB123 0.17 0.17 0.20 0.25 0.27 0.27 (0.69) 0.33 0.33 0.32 0.33 0.44 EPS (pro forma) y/y 20% 10% 28% 29% 39% 40% 59% 29% 20% 16% -3% 27% GAAP Diluted Share count 1,437.6 1,435.8 1,426.1 1,402.7 1,384.3 1,379.7 1,354.8 1,373.3 1,370.0 1,350.0 1,348.0 1,340.0 Pro Forma Diluted Outstanding Shares 1,437.6 1,435.8 1,426.1 1,402.7 1,384.3 1,379.7 1,373.3 1,373.3 1,370.0 1,350.0 1,348.0 1,340.0 2 As a % of Revenue Payment revenue 23.6% 23.4% 23.5% 23.4% 23.7% 23.6% 23.7% 23.6% 25.2% 24.9% 25.7% 25.4% eBay online revenue 71.2% 70.7% 70.2% 69.7% 68.5% 67.4% 67.1% 68.0% 65.3% 64.2% 63.1% 64.7% Third Party Advertising revenue 2.6% 2.8% 2.9% 3.2% 3.4% 4.2% 4.1% 3.6% 4.2% 5.0% 5.2% 4.5% Skype Revenue 2.5% 3.1% 3.5% 3.7% 4.4% 4.9% 5.1% 4.8% 5.4% 5.8% 6.0% 5.5% Total online revenue 100.0% 100.0% 100.0% 100.0% 100.0% 100.0% 100.0% 100.0% 100.0% 100.0% 100.0% 100.0% Offline Revenue 0.0% 0.0% 0.0% 0.0% 0.0% 0.0% 0.0% 0.0% 0.0% 0.0% 0.0% 0.0% Cost of goods sold 20.0% 20.7% 21.8% 20.7% 22.3% 22.7% 23.6% 23.4% 23.8% 24.0% 24.4% 24.0% Sales & marketing 28.8% 28.2% 27.3% 26.8% 25.1% 26.0% 25.7% 25.2% 24.8% 25.7% 25.7% 23.2% Product development 8.6% 8.8% 8.3% 7.6% 7.8% 8.1% 8.7% 8.7% 8.9% 9.1% 9.1% 8.8% G&A 15.5% 15.8% 15.7% 16.0% 15.7% 15.5% 15.2% 14.3% 13.9% 13.7% 13.2% 13.3% Total operating expenses 56.8% 57.2% 54.8% 53.1% 51.3% 52.4% 126.0% 50.8% 50.3% 51.1% 50.6% 47.5% Operating income (reported) 23.2% 22.1% 23.4% 26.2% 26.5% 24.9% -49.6% 25.8% 25.9% 24.9% 25.0% 28.5%

151
North America Equity Research 02 January 2008
Imran Khan (1-212) 622-6693 [email protected]
Operating income (pro forma) 33.1% 32.6% 32.1% 33.4% 33.6% 32.4% 31.4% 31.6% 31.9% 30.8% 30.9% 33.5% Net income (reported) 17.9% 17.7% 19.4% 20.1% 21.3% 20.5% -49.5% 20.7% 21.0% 20.2% 20.4% 23.2% Net income (pro forma) 24.7% 24.9% 25.4% 25.1% 26.0% 25.7% 29.8% 24.9% 25.5% 24.7% 24.8% 26.7% Tax Rate 28.6% 25.6% 26.0% 28.4% 23.5% 23.0% -3.7% 24.0% 24.0% 24.0% 23.5% 23.0% Pro forma tax rate 29.4% 27.7% 27.3% 29.0% 25.6% 24.7% 10.4% 24.8% 24.0% 24.0% 24.0% 24.0% Year-Over-Year Growth Payment revenue 44.5% 39.4% 41.7% 35.4% 27.7% 30.7% 31.7% 28.5% 29.3% 24.5% 23.7% 24.5% eBay online revenue 27.7% 21.6% 21.6% 23.6% 22.3% 24.0% 24.6% 24.3% 15.8% 12.2% 7.3% 10.3% Third Party Advertising revenue 27.5% 34.0% 43.6% 49.1% 65.3% 96.2% 86.5% 45.2% 49.0% 43.0% 45.0% 42.0% End-to-end services revenue Communications Revenue Total online revenue 34.8% 29.9% 31.0% 29.4% 27.2% 30.0% 30.4% 27.5% 21.6% 17.8% 14.1% 15.9% Offline Revenue NM NM NM NM NM NM NM NM NM NM NM NM Sales & marketing 47.6% 38.6% 34.4% 21.9% 10.7% 20.0% 22.9% 19.8% 20.2% 16.2% 14.2% 6.7% Product development 61.4% 73.1% 52.6% 26.3% 15.6% 19.3% 36.9% 45.4% 39.0% 32.9% 19.0% 17.2% G&A 57.9% 72.4% 57.5% 51.7% 29.3% 27.2% 26.5% 13.7% 7.3% 4.4% -1.0% 7.8% Total operating expenses NM NM NM NM NM NM NM NM NM NM NM NM Operating income (pro forma) 25.4% 13.3% 18.0% 28.3% 28.8% 29.2% 27.8% 20.7% 15.4% 12.0% 12.3% 22.8% Source: Company reports and JPMorgan estimates.

152
North America Equity Research 02 January 2008
Imran Khan (1-212) 622-6693 [email protected]
Table 89: EBAY Annual Balance Sheet $ in millions
FY FY FY FY 2006 2007E 2008E 2009E
Assets Cash and cash equivalents 2,662.8 3,927.5 6,939.4 10,330.7 ST investments in marketable securities 542.1 (453.9) (453.9) (453.9) Accounts receivable, net 393.2 482.4 559.2 649.7 Funds receivable 399.3 614.0 711.7 826.9 Other assets 973.2 1,396.4 1,396.4 1,396.4 Total current assets 4,970.6 5,966.5 9,152.8 12,749.9 Investments 277.9 455.3 455.3 455.3 Property and equipment, net 998.2 1,069.6 909.6 749.6 Intangible assets, net 7,227.3 6,822.9 6,822.9 6,822.9 Other assets, net 20.1 87.3 87.3 87.3 Total assets 13,494.0 14,401.6 17,427.9 20,865.0 Liabilities and stockholders' equity Accounts payable 83.4 131.6 152.5 177.2 Funds payable 1,160.0 1,535.1 1,779.2 2,067.3 Deferred Revenue 129.0 153.5 177.9 206.7 Short term debt - - - - Taxes payable 464.4 101.2 101.2 101.2 Other current liabilities 681.7 1,319.6 1,319.6 1,319.6 Total current liabilities 2,518.4 3,241.0 3,530.4 3,872.1 Debt - - - - Deferred taxes 31.8 592.4 592.4 592.4 Other long term 39.2 48.9 48.9 48.9 Total liabilities 2,589.4 3,882.2 4,171.7 4,513.3 - - - Stockholders' equity: - - - Common stock - - - Accumulated deficit - - - Other equity - - - Total stockholders' equity 10,904.6 10,519.3 13,256.2 16,351.6 Total L&S 13,494.0 14,401.6 17,427.9 20,865.0 Source: Company reports and JPMorgan estimates.

153
North America Equity Research 02 January 2008
Imran Khan (1-212) 622-6693 [email protected]
Table 90: EBAY Annual Cash Flow Statement $ in millions
FY FY FY FY 2006A 2007E 2008E 2009E
OPERATING CASH FLOWS Net Income 1,125.6 271.8 1,916.8 2,275.5 Depreciation 544.6 601.9 640.0 640.0 Amortization - - - - Stock based comp expense related to stock options and purchases 317.4 317.2 340.0 340.0 Tax Benefit 148.6 192.9 120.0 120.0 Excess tax benefit from stock-based compensation (161.4) Impairment - - - - Minority Interest 0.0 - - - Doubtful Accounts/Losses 227.2 257.7 200.0 200.0 Other - 1,390.9 - - Changes in Working Capital (23.2) (399.8) (34.9) (14.2) Accounts Receivable (169.8) (157.60) (76.73) (90.56) Fund Receivable (146.9) (212.32) (97.66) (115.26) Other (433.4) (516.08) - - Deferred Tax (181.1) (68.93) - - Accounts Payable 33.0 45.57 20.93 24.70 Funds Payable 575.1 358.72 94.14 138.14 Accrued Charges (31.0) 2.97 - - Deferred Revenue 47.9 24.80 24.41 28.81 Income Taxes 283.0 123.08 - - Cash From Operations 2,247.8 2,563.5 3,181.9 3,561.3 % Chg Y-Y 11.8% 14.0% 24.1% 11.9% FCF 1,732.3 2,067.5 2,611.9 3,001.3 % Chg Y-Y 3.6% 19.3% 26.3% 14.9%
INVESTING CASH FLOWS Capital Expenditures (515.4) (496.0) (570.0) (560.0) Net Investment 797.0 48.5 - - ST Investment Purch. - - - - ST Investments Mat. - - - - Acquisitions (43.9) (320.2) - - Purchase of intangibles and other non current assets (8.8) 5.5 - - Cash From Investing 228.9 (762.2) (570.0) (560.0) FINANCING CASH FLOWS Common Stock Issued 313.5 365.2 - - Excess tax benefit from stock-based compensation - - Shares Repurchased (1,666.5) (1,170.7) - - Payment of headquarters facility lease obligation - - - Long Term Debt - - - - Cash From Financing (1,260.7) (736.5) - - Foreign Exch Effects 133.3 199.9 - - Net Change In Cash 1,349.2 1,264.8 2,611.9 3,001.3 Cash at Beginning 1,313.5 2,662.7 3,927.5 6,539.4 Cash at End 2,662.7 3,927.5 6,539.4 9,540.7 Source: Company reports and JPMorgan estimates.
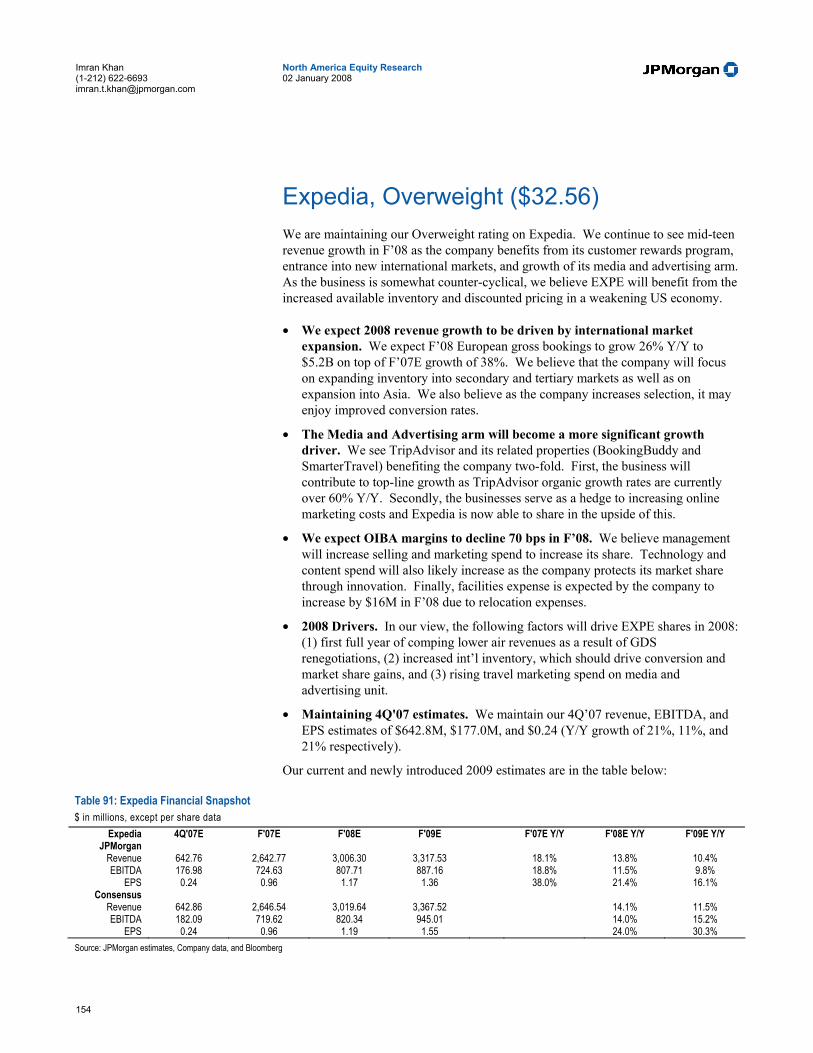
154
North America Equity Research 02 January 2008
Imran Khan (1-212) 622-6693 [email protected]
Expedia, Overweight ($32.56) We are maintaining our Overweight rating on Expedia. We continue to see mid-teen revenue growth in F’08 as the company benefits from its customer rewards program, entrance into new international markets, and growth of its media and advertising arm. As the business is somewhat counter-cyclical, we believe EXPE will benefit from the increased available inventory and discounted pricing in a weakening US economy.
• We expect 2008 revenue growth to be driven by international market expansion. We expect F’08 European gross bookings to grow 26% Y/Y to $5.2B on top of F’07E growth of 38%. We believe that the company will focus on expanding inventory into secondary and tertiary markets as well as on expansion into Asia. We also believe as the company increases selection, it may enjoy improved conversion rates.
• The Media and Advertising arm will become a more significant growth driver. We see TripAdvisor and its related properties (BookingBuddy and SmarterTravel) benefiting the company two-fold. First, the business will contribute to top-line growth as TripAdvisor organic growth rates are currently over 60% Y/Y. Secondly, the businesses serve as a hedge to increasing online marketing costs and Expedia is now able to share in the upside of this.
• We expect OIBA margins to decline 70 bps in F’08. We believe management will increase selling and marketing spend to increase its share. Technology and content spend will also likely increase as the company protects its market share through innovation. Finally, facilities expense is expected by the company to increase by $16M in F’08 due to relocation expenses.
• 2008 Drivers. In our view, the following factors will drive EXPE shares in 2008: (1) first full year of comping lower air revenues as a result of GDS renegotiations, (2) increased int’l inventory, which should drive conversion and market share gains, and (3) rising travel marketing spend on media and advertising unit.
• Maintaining 4Q'07 estimates. We maintain our 4Q’07 revenue, EBITDA, and EPS estimates of $642.8M, $177.0M, and $0.24 (Y/Y growth of 21%, 11%, and 21% respectively).
Our current and newly introduced 2009 estimates are in the table below:
Table 91: Expedia Financial Snapshot $ in millions, except per share data
Expedia 4Q'07E F'07E F'08E F'09E F'07E Y/Y F'08E Y/Y F'09E Y/Y JPMorgan Revenue 642.76 2,642.77 3,006.30 3,317.53 18.1% 13.8% 10.4% EBITDA 176.98 724.63 807.71 887.16 18.8% 11.5% 9.8%
EPS 0.24 0.96 1.17 1.36 38.0% 21.4% 16.1% Consensus
Revenue 642.86 2,646.54 3,019.64 3,367.52 14.1% 11.5% EBITDA 182.09 719.62 820.34 945.01 14.0% 15.2%
EPS 0.24 0.96 1.19 1.55 24.0% 30.3% Source: JPMorgan estimates, Company data, and Bloomberg

155
North America Equity Research 02 January 2008
Imran Khan (1-212) 622-6693 [email protected]
Our Estimates and Outlook for 2008 We are adjusting our F’08 revenue estimate to $3.01B and our full-year EPS estimate to $1.17, representing Y/Y revenue and EPS growth of 14% and 21%. We expect most of the revenue growth to be driven by the international market where we see gross bookings growth of 26% Y/Y. Furthermore, we note that this is the first year that the company is fully comping air revenue declines as a result of GDS renegotiations. Thus, the company faces easy domestic comparisons with 1H’07 gross bookings growth of only 4.5% Y/Y vs. 3Q’07 growth of 13.4%. We expect OIBA margins to decline 70 bps in F'08 due to increased selling and marketing and technology and content expenses and a one-time expense associated with relocation.
Figure 83: Domestic Unique Visitor Trends on EXPE Properties thousands
1,5006,500
11,50016,50021,500
Sep-2006
Oct-2006
Nov -2006
Dec-2006
Jan-2007
Feb-2007
Mar-2007
Apr-2007
May -2007
Jun-2007
Jul-2007
Aug-2007
Sep-2007
Oct-2007
Nov -2007
EXPEDIA.COM* Tripadv isor Sites
HOTELS.COM HOTWIRE.COM
Source: comScore and JPMorgan estimates
Our Estimates and Outlook for 2009 We are introducing F’09 revenue and EPS estimates of $3.32B and $1.36, which represents 10% and 16% Y/Y growth, respectively. Again, we expect much of the revenue growth to stem from European gross booking increases, which we model as slowing to 18% on a Y/Y basis due to maturation of the market and increased competition. Domestically, we expect Y/Y gross booking growth to slow to 5% from 8% in the prior year, due to lower growth in shifts from offline spend and increased competition. We expect OIBA margins to decrease another 10 bps Y/Y as selling and marketing expenses rise.
Valuation and Rating Analysis We believe Expedia is undervalued given the potential for international growth, signs of a successful domestic turnaround, and increased advertising revenue opportunities. On an EV/EBITDA basis, Expedia trades at 12.8x our F’08 EBITDA estimate of $808 million, versus its peers at 19.1x. As such, we rate the stock Overweight.
Risks to Our Rating The company’s shares could underperform if the company is unable to (1) withstand the competitive threat that the travel suppliers and travel search engines pose, (2) achieve a high ROI on selling and marketing investments, (3) successfully complete the turnaround of the core Expedia brand, and (4) achieve further expansion into international markets.

156
North America Equity Research 02 January 2008
Imran Khan (1-212) 622-6693 [email protected]
Table 92: EXPE Annual Income Statement $ in millions, except per share data INCOME STATEMENT 2006 2007E 2008E 2009E North America 12,737 13,814 14,887 15,632 Europe 3,001 4,130 5,205 6,163 Other 1,424 1,786 2,101 2,398 Total Gross Bookings 17,162 19,730 22,194 24,192 % North America 74% 70% 67% 65% % Europe 17% 21% 23% 25% % Other 8% 9% 9% 10% Y/Y Growth North America 5.6% 8.5% 7.8% 5.0% Europe 19.3% 37.6% 26.0% 18.4% Other 46.5% 25.4% 17.6% 14.1% Total GB 10.4% 15.0% 12.5% 9.0% Total Revenue 2,237.6 2,642.8 3,006.3 3,317.5 Revenue as a % GB 13.0% 13.4% 13.5% 13.7% Cost of Revenues 494.2 548.9 623.7 682.7 Gross Profit 1,743.3 2,093.9 2,382.6 2,634.8 Gross Margin 78% 79.2% 79.3% 79.4% Selling and Marketing expense 770.3 973.7 1,116.5 1,242.3 General and Administrative expense 252.8 293.3 331.3 360.9 Technology and Content 121.3 160.7 197.1 222.5 Amortization of non-cash distributing & mktg 9.6 - - - Amortization of non-cash compensation expense - - - - Amortization of intangibles 110.8 77.9 64.0 60.0 Stock Based Compensation 80.3 62.2 65.0 65.0 Depreciation expense 9.0 - - - Extraordinary Items 47.0 Total Operating Expenses 1,392.0 1,567.8 1,773.9 1,950.7 Total Operating Expenses (Pro forma) 1,144.3 1,427.6 1,644.9 1,825.7 Operating Profit 351.3 526.1 608.7 684.2 Operating Profit (Pro forma) 599.0 666.2 737.7 809.2 Operating Margin 15.7% 19.9% 20.2% 20.6% Operating Margin (Pro forma) 26.8% 25.2% 24.5% 24.4% EBITDA 609.8 724.6 807.7 887.2 OIBA 599.0 666.2 737.7 809.2 OIBA Margin 26.8% 25.2% 24.5% 24.4% Net Interest Income 14.8 (6.3) - - Write-off of long-term investment - - - - Other 18.8 (13.5) - - Equity Income of Unconsolidated Affiliates - - - - EBT (Earnings Before Taxes) 384.9 506.3 608.7 684.2 EBT (Earnings Before Taxes - Pro forma) 613.8 659.9 737.7 809.2 Minority Interest Income (0.5) 1.3 2.0 2.0 Income Tax Expense (139.5) (202.6) (243.5) (260.0) Tax Rate 35% 40% 40% 38% Net Income (Reported) 244.9 305.0 367.2 426.2 Net Income (Pro Forma) 388.5 395.6 442.6 501.7 EPS (Reported) 0.70 0.96 1.17 1.36 EPS (Pro Forma) 1.10 1.23 1.39 1.58 Sharecount 352.2 317.7 314.0 314.0 Source: Company reports and JPMorgan estimates.

157
North America Equity Research 02 January 2008
Imran Khan (1-212) 622-6693 [email protected]
Table 93: EXPE Quarterly Income Statement $ in millions, except per share data
1Q'06 2Q'06 3Q'06 4Q'06 1Q'07 2Q'07 3Q'07 4Q'07E 1Q'08E 2Q'08E 3Q'08E 4Q'08E North America 3,522 3,445 3,104 2,666 3,559 3,723 3,519 3,013 3,915 3,984 3,765 3,223 Europe 780 752 792 677 1,032 1,035 1,163 900 1,334 1,306 1,457 1,108 Other 347 368 365 344 425 466 465 430 507 550 545 499 Total Gross Bookings 4,649 4,565 4,261 3,687 5,016 5,224 5,147 4,343 5,756 5,840 5,768 4,830 % North America 76% 75% 73% 72% 71% 71% 68% 69% 68% 68% 65% 67% % Europe 17% 16% 19% 18% 21% 20% 23% 21% 23% 22% 25% 23% % Other 7% 8% 9% 9% 8% 9% 9% 10% 9% 9% 9% 10% Y/Y Growth North America 10.3% 7.5% 2.0% 1.6% 1.1% 8.1% 13.4% 13.0% 10.0% 7.0% 7.0% 7.0% Europe 12.7% 12.4% 23.0% 32.7% 32.3% 37.6% 46.8% 33.0% 29.3% 26.2% 25.3% 23.0% Other 72.6% 41.5% 46.6% 31.3% 22.5% 26.6% 27.4% 25.0% 19.2% 18.1% 17.3% 16.0% Total GB 13.8% 10.5% 8.2% 8.6% 7.9% 14.4% 20.8% 17.8% 14.8% 11.8% 12.1% 11.2% Total Revenue 493.9 598.5 613.9 531.3 550.5 689.9 759.6 642.8 644.7 782.6 859.4 719.6 Revenue as a % GB 10.6% 13.1% 14.4% 14.4% 11.0% 13.2% 14.8% 14.8% 11.2% 13.4% 14.9% 14.9% Cost of Revenues 116.1 126.9 131.3 120.0 120.4 143.0 150.5 135.0 141.2 161.2 170.2 151.1 Gross Profit 377.8 471.6 482.7 411.3 430.1 546.9 609.1 507.8 503.5 621.4 689.3 568.5 Gross Margin 76.5% 78.8% 78.6% 77.4% 78.1% 79.3% 80.2% 79.0% 78.1% 79.4% 80.2% 79.0% Selling and Marketing expense 195.8 195.2 212.1 167.2 219.0 253.1 276.6 225.0 256.6 287.2 313.7 259.1 General and Administrative expense 63.7 62.3 59.1 67.7 68.5 68.7 75.7 80.3 79.3 78.3 85.9 87.8 Technology and Content 29.8 29.9 31.4 30.2 38.2 38.0 44.0 40.5 48.3 47.0 55.0 46.8 Amortization of non-cash distributing & mktg 8.2 0.6 0.7 0.1 - - - - - - - - Amortization of non-cash compensation expense - - - - - - - - - - - - Amortization of intangibles 30.2 30.1 26.6 23.9 21.2 19.5 18.6 18.6 16.0 16.0 16.0 16.0 Stock Based Compensation 23.9 17.2 16.4 22.7 15.9 14.0 14.4 18.0 16.0 15.0 15.0 19.0 Depreciation expense 9.0 - - - - - - - - - - - Extraordinary Items - - 47.0 - - - - - - - - - Total Operating Expenses 351.6 335.3 393.4 311.7 362.8 393.3 429.3 382.4 416.2 443.4 485.6 428.6 Total Operating Expenses (Pro forma) 289.3 287.4 302.7 265.0 325.7 359.8 396.3 345.8 384.2 412.4 454.6 393.6 Operating Profit 26.2 136.3 89.3 99.5 67.3 153.6 179.8 125.4 87.3 177.9 203.6 139.9 Operating Profit (Pro forma) 88.5 184.2 180.0 146.2 104.4 187.1 212.8 162.0 119.3 208.9 234.6 174.9 Operating Margin 5.3% 22.8% 14.5% 18.7% 12.2% 22.3% 23.7% 19.5% 13.5% 22.7% 23.7% 19.4% Operating Margin (Pro forma) 17.9% 30.8% 29.3% 27.5% 19.0% 27.1% 28.0% 25.2% 18.5% 26.7% 27.3% 24.3% EBITDA 108.6 195.8 146.2 159.2 118.8 200.7 228.1 177.0 136.3 225.9 252.6 192.9 OIBA 88.5 184.2 180.0 146.2 104.4 187.1 212.8 162.0 119.3 208.9 234.6 174.9 OIBA Margin 17.9% 30.8% 29.3% 27.5% 19.0% 27.1% 28.0% 25.2% 18.5% 26.7% 27.3% 24.3% Net Interest Income 1.7 6.6 4.8 1.7 (3.9) 0.7 (1.1) (2.0) - - - - Write-off of long-term investment

158
North America Equity Research 02 January 2008
Imran Khan (1-212) 622-6693 [email protected]
1Q'06 2Q'06 3Q'06 4Q'06 1Q'07 2Q'07 3Q'07 4Q'07E 1Q'08E 2Q'08E 3Q'08E 4Q'08E
Other 3.7 10.5 2.9 1.7 (5.5) 5.9 (13.9) Equity Income of Unconsolidated Affiliates - - - - EBT (Earnings Before Taxes) 31.6 153.3 97.1 103.0 57.9 160.2 164.8 123.4 87.3 177.9 203.6 139.9 EBT (Earnings Before Taxes - Pro forma) 90.2 190.8 184.9 147.9 100.5 187.7 211.8 160.0 119.3 208.9 234.6 174.9 Minority Interest Income 1.4 (1.6) (0.4) 0.1 0.5 0.0 0.3 0.5 0.5 0.5 0.5 0.5 Income Tax Expense (9.7) (56.2) (37.7) (35.9) (23.6) (64.1) (65.5) (49.3) (34.9) (71.2) (81.5) (55.9) Tax Rate 31% 37% 39% 35% 41% 40% 40% 40% 40% 40% 40% 40% Net Income (Reported) 23.3 95.5 59.0 67.1 34.8 96.1 99.6 74.5 52.9 107.3 122.7 84.4 Net Income (Pro Forma) 57.0 118.2 117.2 96.2 59.3 114.0 123.1 99.2 71.6 125.4 140.8 104.9 EPS (Reported) 0.06 0.27 0.17 0.20 0.11 0.30 0.32 0.24 0.17 0.34 0.39 0.27 EPS (Pro Forma) 0.15 0.32 0.34 0.28 0.18 0.35 0.39 0.31 0.23 0.39 0.44 0.33 Sharecount 365.2 359.1 341.1 343.6 323.7 320.2 312.8 314.0 314.0 314.0 314.0 314.0 Source: JPMorgan estimates and Company report
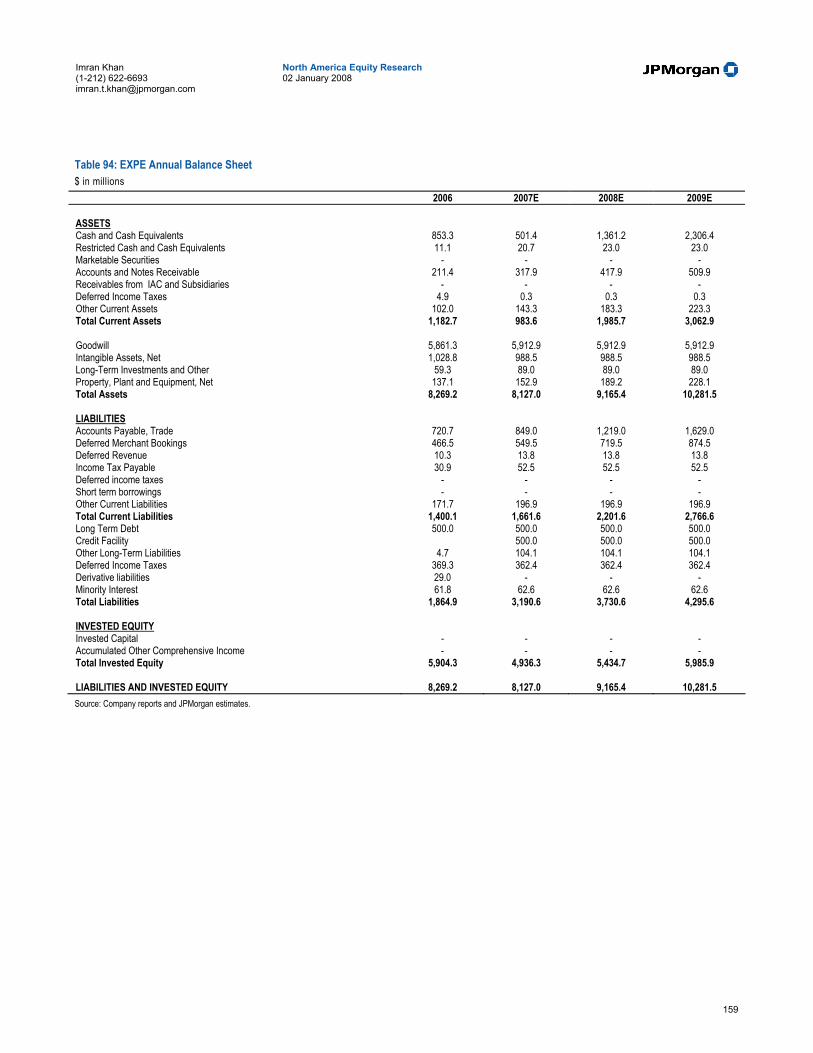
159
North America Equity Research 02 January 2008
Imran Khan (1-212) 622-6693 [email protected]
Table 94: EXPE Annual Balance Sheet $ in millions
2006 2007E 2008E 2009E
ASSETS Cash and Cash Equivalents 853.3 501.4 1,361.2 2,306.4 Restricted Cash and Cash Equivalents 11.1 20.7 23.0 23.0 Marketable Securities - - - - Accounts and Notes Receivable 211.4 317.9 417.9 509.9 Receivables from IAC and Subsidiaries - - - - Deferred Income Taxes 4.9 0.3 0.3 0.3 Other Current Assets 102.0 143.3 183.3 223.3 Total Current Assets 1,182.7 983.6 1,985.7 3,062.9 Goodwill 5,861.3 5,912.9 5,912.9 5,912.9 Intangible Assets, Net 1,028.8 988.5 988.5 988.5 Long-Term Investments and Other 59.3 89.0 89.0 89.0 Property, Plant and Equipment, Net 137.1 152.9 189.2 228.1 Total Assets 8,269.2 8,127.0 9,165.4 10,281.5 LIABILITIES Accounts Payable, Trade 720.7 849.0 1,219.0 1,629.0 Deferred Merchant Bookings 466.5 549.5 719.5 874.5 Deferred Revenue 10.3 13.8 13.8 13.8 Income Tax Payable 30.9 52.5 52.5 52.5 Deferred income taxes - - - - Short term borrowings - - - - Other Current Liabilities 171.7 196.9 196.9 196.9 Total Current Liabilities 1,400.1 1,661.6 2,201.6 2,766.6 Long Term Debt 500.0 500.0 500.0 500.0 Credit Facility 500.0 500.0 500.0 Other Long-Term Liabilities 4.7 104.1 104.1 104.1 Deferred Income Taxes 369.3 362.4 362.4 362.4 Derivative liabilities 29.0 - - - Minority Interest 61.8 62.6 62.6 62.6 Total Liabilities 1,864.9 3,190.6 3,730.6 4,295.6 INVESTED EQUITY Invested Capital - - - - Accumulated Other Comprehensive Income - - - - Total Invested Equity 5,904.3 4,936.3 5,434.7 5,985.9 LIABILITIES AND INVESTED EQUITY 8,269.2 8,127.0 9,165.4 10,281.5 Source: Company reports and JPMorgan estimates.
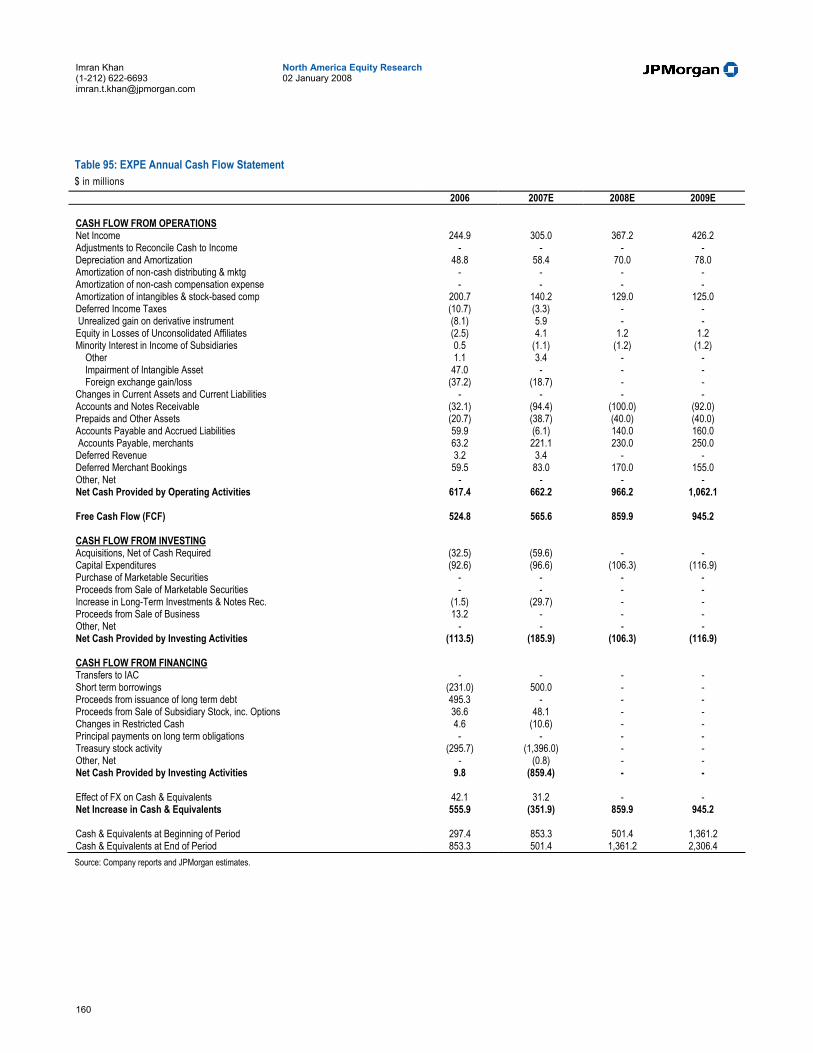
160
North America Equity Research 02 January 2008
Imran Khan (1-212) 622-6693 [email protected]
Table 95: EXPE Annual Cash Flow Statement $ in millions
2006 2007E 2008E 2009E
CASH FLOW FROM OPERATIONS Net Income 244.9 305.0 367.2 426.2 Adjustments to Reconcile Cash to Income - - - - Depreciation and Amortization 48.8 58.4 70.0 78.0 Amortization of non-cash distributing & mktg - - - - Amortization of non-cash compensation expense - - - - Amortization of intangibles & stock-based comp 200.7 140.2 129.0 125.0 Deferred Income Taxes (10.7) (3.3) - - Unrealized gain on derivative instrument (8.1) 5.9 - - Equity in Losses of Unconsolidated Affiliates (2.5) 4.1 1.2 1.2 Minority Interest in Income of Subsidiaries 0.5 (1.1) (1.2) (1.2) Other 1.1 3.4 - - Impairment of Intangible Asset 47.0 - - - Foreign exchange gain/loss (37.2) (18.7) - - Changes in Current Assets and Current Liabilities - - - - Accounts and Notes Receivable (32.1) (94.4) (100.0) (92.0) Prepaids and Other Assets (20.7) (38.7) (40.0) (40.0) Accounts Payable and Accrued Liabilities 59.9 (6.1) 140.0 160.0 Accounts Payable, merchants 63.2 221.1 230.0 250.0 Deferred Revenue 3.2 3.4 - - Deferred Merchant Bookings 59.5 83.0 170.0 155.0 Other, Net - - - - Net Cash Provided by Operating Activities 617.4 662.2 966.2 1,062.1 Free Cash Flow (FCF) 524.8 565.6 859.9 945.2 CASH FLOW FROM INVESTING Acquisitions, Net of Cash Required (32.5) (59.6) - - Capital Expenditures (92.6) (96.6) (106.3) (116.9) Purchase of Marketable Securities - - - - Proceeds from Sale of Marketable Securities - - - - Increase in Long-Term Investments & Notes Rec. (1.5) (29.7) - - Proceeds from Sale of Business 13.2 - - - Other, Net - - - - Net Cash Provided by Investing Activities (113.5) (185.9) (106.3) (116.9) CASH FLOW FROM FINANCING Transfers to IAC - - - - Short term borrowings (231.0) 500.0 - - Proceeds from issuance of long term debt 495.3 - - - Proceeds from Sale of Subsidiary Stock, inc. Options 36.6 48.1 - - Changes in Restricted Cash 4.6 (10.6) - - Principal payments on long term obligations - - - - Treasury stock activity (295.7) (1,396.0) - - Other, Net - (0.8) - - Net Cash Provided by Investing Activities 9.8 (859.4) - - Effect of FX on Cash & Equivalents 42.1 31.2 - - Net Increase in Cash & Equivalents 555.9 (351.9) 859.9 945.2 Cash & Equivalents at Beginning of Period 297.4 853.3 501.4 1,361.2 Cash & Equivalents at End of Period 853.3 501.4 1,361.2 2,306.4 Source: Company reports and JPMorgan estimates.

161
North America Equity Research 02 January 2008
Imran Khan (1-212) 622-6693 [email protected]
Google, Overweight ($710.84) We believe Google will continue to innovate at an industry-leading pace, which should spur continued market share gains. Additionally, international, which we are modeling to be up 42% in 2008, will continue to be an important theme. At 37.7x our F’08 GAAP EPS estimate of $18.94, we find Google’s valuation attractive. As such, we maintain our Overweight rating.
• Volume growth and market share gains are likely. We think that paid clicks will grow 30% Y/Y as search volume increases and as Google continues to take market share. In addition to market share gain, coverage is expected to be up slightly (~40 bps) and relevancy is expected to be up high single digits.
• International will be a more significant contributor in 2008. We believe Google’s vast international presence will enable the company to maintain industry-leading growth rates in 2008. We expect international gross revenues to reach almost 50% of total revenues in 2008, growing 42% Y/Y. We believe Western Europe will continue to outpace domestic growth. We believe monetization will be a key catalyst for international growth in 2008, as advertisers increasingly adopt paid search as a marketing vehicle.
• Google apps will begin to ramp. We think web-based cloud computing will become more widely adopted in F’08 as it gains more mainstream appeal. Additionally, Google's introduction of a complete services package, including word processing, spreadsheets, and presentation capabilities for free, will likely appeal to customers. We estimate that the office productivity software market is ~$10.3B. Even a 10% market share would mean an additional $1B in revenue to Google.
• 2008 Drivers. In our view, the following factors will drive GOOG shares in 2008: (1) continued monetization enhancements of search & contextual advertising platforms, (2) increased search market share, and (3) outsized growth in Western Europe and emerging markets.
• Maintaining 4Q'07 estimates. We maintain our 4Q’07 revenue, EBITDA, and EPS estimates of $3.45B, $2.01B, and $3.82 (Y/Y growth of 55%, 45%, and 16%, respectively).
Our current and newly introduced 2009 estimates are in the table below:
Table 96: GOOG Estimates Snapshot $ in millions, except per share data Google 4Q'07E F'07E F'08E F'09E F'07E Y/Y F'08E Y/Y F'09E Y/Y JPMorgan Revenue 3,447.35 11,718.63 16,957.04 22,332.26 60.6% 44.7% 31.7% EBITDA 2,013.12 6,957.86 9,917.13 12,646.53 50.9% 42.5% 27.5% EPS 3.82 13.33 18.94 24.38 34.0% 42.1% 28.7% Consensus Revenue 3,453.65 11,649.28 16,406.75 21,279.55 40.8% 29.7% EBITDA 2,039.15 6,997.77 9,684.73 12,522.79 38.4% 29.3% EPS 3.84 13.36 17.97 22.75 34.5% 26.6% Source: JPMorgan estimates, Company reports, and Bloomberg

162
North America Equity Research 02 January 2008
Imran Khan (1-212) 622-6693 [email protected]
Our Estimates and Outlook for 2008 We are raising our 2008 net revenue, EBITDA, and GAAP EPS estimates to $16.96B, $9.92B, and $18.94 from $16.30B, $9.58B, and $18.18. Our new estimates call for Y/Y revenue, EBITDA, and EPS growth of 45%, 43%, and 42%, respectively.
In 2008, we are expecting Google to continue to make progress on the international front, both through search volume growth and increasing advertiser demand. We are modeling international gross revenue growth of 42% Y/Y to $11.1B in 2008. As we believe international growth will outpace domestic growth, we see international revenues representing ~49.4% of gross revenues in 2008, up from ~47.6% of gross revenue in 2007. We believe usage will be the most meaningful catalyst for international growth in 2008, as consumers in emerging markets continue to leverage the Internet at an accelerating pace
Beyond international, we believe Google will generate above-average market share growth through continued volume share gains from its domestic competitors. We continue to believe that Google has the strongest brand in search. Google’s rapid innovation of new web offerings should lead to increased attention from consumers, which should contribute to sustained volume share growth in 2008. We think that paid clicks will grow 30% Y/Y as search volume increases and as Google continues to take market share.
We believe that Google’s attempts to show meaningful revenue diversification are starting to come to fruition. We think web-based cloud computing will become more widely adopted in F’08 as it gains more mainstream appeal. Additionally, Google's introduction of a complete services package, including word processing, spreadsheets, and presentation capabilities for free, will likely appeal to customers. The product has become even more marketable to enterprise clients through the acquisition of Postini, an on-demand security and compliance solution. We estimate that the office productivity software market is ~$10.3B. Even a 10% market share would mean an additional $1B in revenue to Google.
Our Estimates and Outlook for 2009 We are introducing above consensus 2009 estimates, which call for Y/Y revenue, EBITDA, and EPS growth of 32%, 27.5%, and 29%, respectively. Specifically, our F’09 revenue, EBITDA, and EPS estimates are $22.3B, $12.6B, and $24.38, respectively.
In 2009, we are expecting search revenues to continue to show strong growth, despite decelerating from 2008 levels. We are modeling Google.com search volumes to grow ~25% in 2009, with RPM growth contributing an additional 8%. We believe international search revenues will make up 51% of total company revenues in 2009.
Valuation and Rating Analysis We believe GOOG shares are fundamentally attractive due to secular industry growth trends, improving fundamentals in the international market, and expansion of new product categories, such as contextual ad and local search. Google remains an Overweight pick. Google trades at 21.4x its F’08E EBITDA vs. its large cap Internet
163
North America Equity Research 02 January 2008
Imran Khan (1-212) 622-6693 [email protected]
peers at 18.0x. Given Google's higher growth rate, we think it deserves a premium. Hence, our OW rating.
Risks to Our Rating Google has experienced very fast revenue growth over the past few years. Our Overweight rating is based on the assumption that Google will continue to be the market leader in the paid search space and will continue to enjoy strong revenue growth. If the content publishers like Yahoo! and Microsoft are able to gain market share through user defection from Google’s user base, then our rating could be too optimistic. However, we have not seen any trends that would support this argument thus far.
Our Overweight rating is also predicated on the company’s success in the international market. If the company cannot successfully build out a larger international advertising base, it will not be able to increase its monetization rate abroad. Additionally, as Google continues to expand its business internationally, it may face regulatory hurdles that make the business climate less hospitable and potentially less profitable than the markets in which it currently operates.
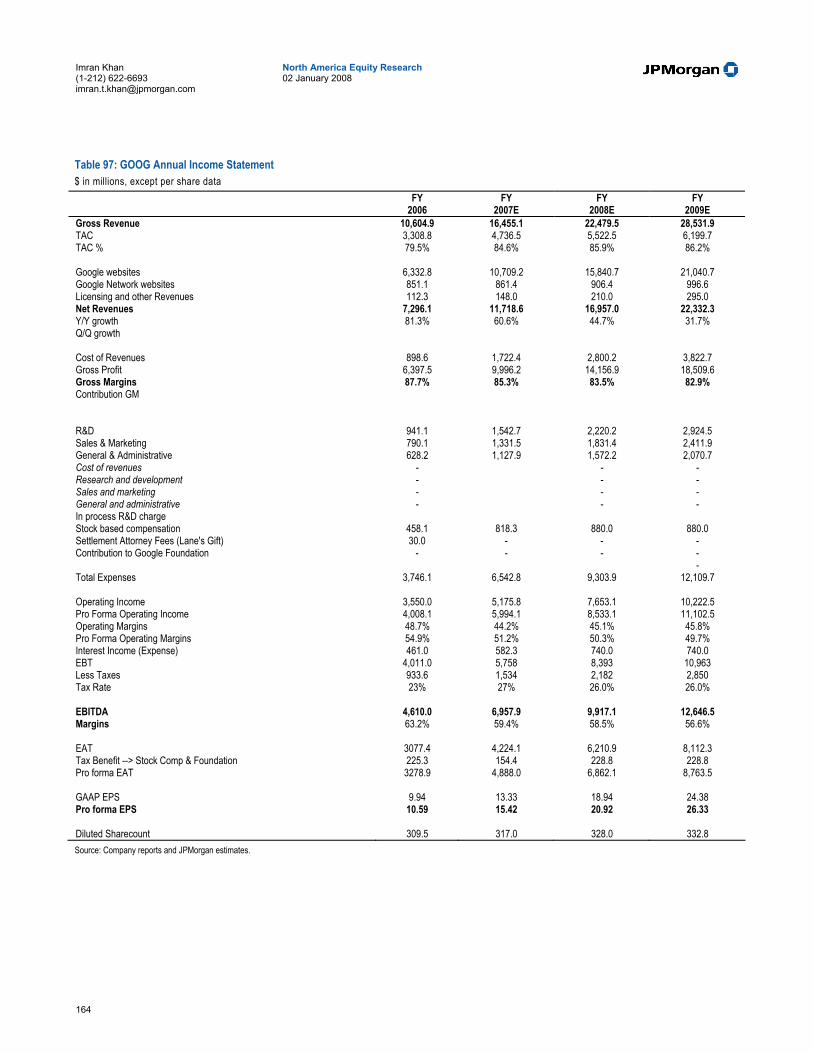
164
North America Equity Research 02 January 2008
Imran Khan (1-212) 622-6693 [email protected]
Table 97: GOOG Annual Income Statement $ in millions, except per share data
FY FY FY FY 2006 2007E 2008E 2009E
Gross Revenue 10,604.9 16,455.1 22,479.5 28,531.9 TAC 3,308.8 4,736.5 5,522.5 6,199.7 TAC % 79.5% 84.6% 85.9% 86.2% Google websites 6,332.8 10,709.2 15,840.7 21,040.7 Google Network websites 851.1 861.4 906.4 996.6 Licensing and other Revenues 112.3 148.0 210.0 295.0 Net Revenues 7,296.1 11,718.6 16,957.0 22,332.3 Y/Y growth 81.3% 60.6% 44.7% 31.7% Q/Q growth Cost of Revenues 898.6 1,722.4 2,800.2 3,822.7 Gross Profit 6,397.5 9,996.2 14,156.9 18,509.6 Gross Margins 87.7% 85.3% 83.5% 82.9% Contribution GM R&D 941.1 1,542.7 2,220.2 2,924.5 Sales & Marketing 790.1 1,331.5 1,831.4 2,411.9 General & Administrative 628.2 1,127.9 1,572.2 2,070.7 Cost of revenues - - - Research and development - - - Sales and marketing - - - General and administrative - - - In process R&D charge Stock based compensation 458.1 818.3 880.0 880.0 Settlement Attorney Fees (Lane's Gift) 30.0 - - - Contribution to Google Foundation - - - - - Total Expenses 3,746.1 6,542.8 9,303.9 12,109.7 Operating Income 3,550.0 5,175.8 7,653.1 10,222.5 Pro Forma Operating Income 4,008.1 5,994.1 8,533.1 11,102.5 Operating Margins 48.7% 44.2% 45.1% 45.8% Pro Forma Operating Margins 54.9% 51.2% 50.3% 49.7% Interest Income (Expense) 461.0 582.3 740.0 740.0 EBT 4,011.0 5,758 8,393 10,963 Less Taxes 933.6 1,534 2,182 2,850 Tax Rate 23% 27% 26.0% 26.0% EBITDA 4,610.0 6,957.9 9,917.1 12,646.5 Margins 63.2% 59.4% 58.5% 56.6% EAT 3077.4 4,224.1 6,210.9 8,112.3 Tax Benefit --> Stock Comp & Foundation 225.3 154.4 228.8 228.8 Pro forma EAT 3278.9 4,888.0 6,862.1 8,763.5 GAAP EPS 9.94 13.33 18.94 24.38 Pro forma EPS 10.59 15.42 20.92 26.33 Diluted Sharecount 309.5 317.0 328.0 332.8 Source: Company reports and JPMorgan estimates.
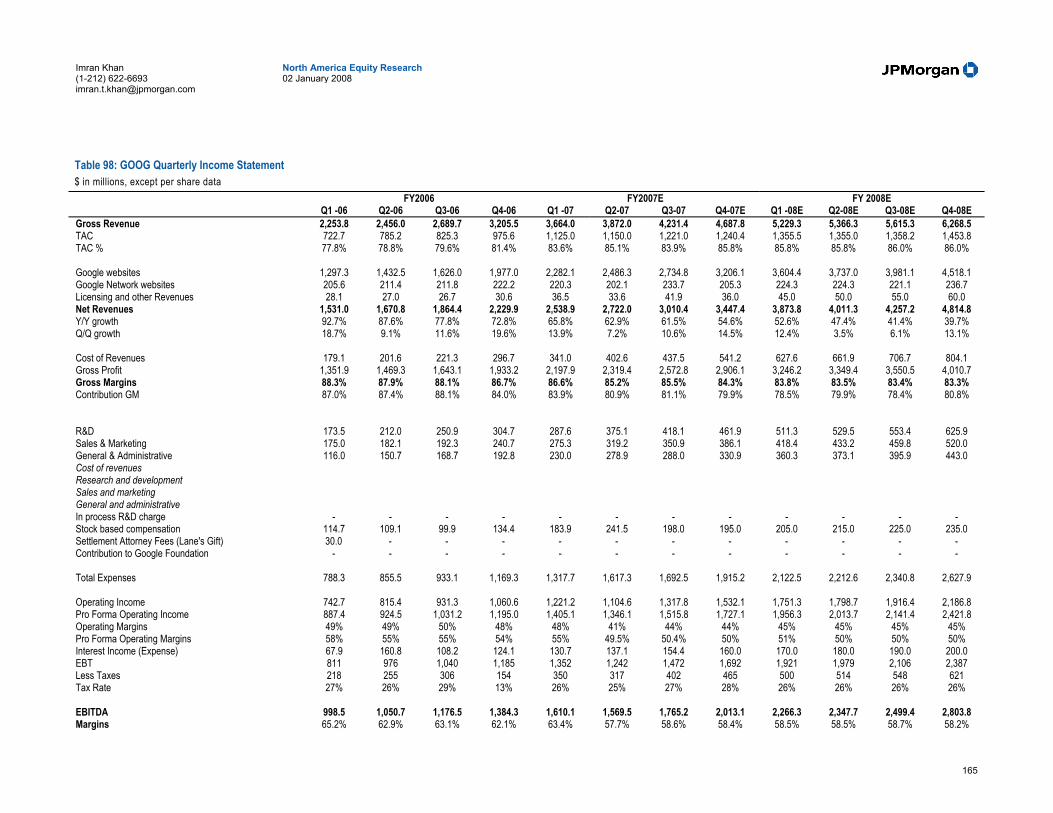
165
North America Equity Research 02 January 2008
Imran Khan (1-212) 622-6693 [email protected]
Table 98: GOOG Quarterly Income Statement $ in millions, except per share data
FY2006 FY2007E FY 2008E Q1 -06 Q2-06 Q3-06 Q4-06 Q1 -07 Q2-07 Q3-07 Q4-07E Q1 -08E Q2-08E Q3-08E Q4-08E
Gross Revenue 2,253.8 2,456.0 2,689.7 3,205.5 3,664.0 3,872.0 4,231.4 4,687.8 5,229.3 5,366.3 5,615.3 6,268.5 TAC 722.7 785.2 825.3 975.6 1,125.0 1,150.0 1,221.0 1,240.4 1,355.5 1,355.0 1,358.2 1,453.8 TAC % 77.8% 78.8% 79.6% 81.4% 83.6% 85.1% 83.9% 85.8% 85.8% 85.8% 86.0% 86.0% Google websites 1,297.3 1,432.5 1,626.0 1,977.0 2,282.1 2,486.3 2,734.8 3,206.1 3,604.4 3,737.0 3,981.1 4,518.1 Google Network websites 205.6 211.4 211.8 222.2 220.3 202.1 233.7 205.3 224.3 224.3 221.1 236.7 Licensing and other Revenues 28.1 27.0 26.7 30.6 36.5 33.6 41.9 36.0 45.0 50.0 55.0 60.0 Net Revenues 1,531.0 1,670.8 1,864.4 2,229.9 2,538.9 2,722.0 3,010.4 3,447.4 3,873.8 4,011.3 4,257.2 4,814.8 Y/Y growth 92.7% 87.6% 77.8% 72.8% 65.8% 62.9% 61.5% 54.6% 52.6% 47.4% 41.4% 39.7% Q/Q growth 18.7% 9.1% 11.6% 19.6% 13.9% 7.2% 10.6% 14.5% 12.4% 3.5% 6.1% 13.1% Cost of Revenues 179.1 201.6 221.3 296.7 341.0 402.6 437.5 541.2 627.6 661.9 706.7 804.1 Gross Profit 1,351.9 1,469.3 1,643.1 1,933.2 2,197.9 2,319.4 2,572.8 2,906.1 3,246.2 3,349.4 3,550.5 4,010.7 Gross Margins 88.3% 87.9% 88.1% 86.7% 86.6% 85.2% 85.5% 84.3% 83.8% 83.5% 83.4% 83.3% Contribution GM 87.0% 87.4% 88.1% 84.0% 83.9% 80.9% 81.1% 79.9% 78.5% 79.9% 78.4% 80.8% R&D 173.5 212.0 250.9 304.7 287.6 375.1 418.1 461.9 511.3 529.5 553.4 625.9 Sales & Marketing 175.0 182.1 192.3 240.7 275.3 319.2 350.9 386.1 418.4 433.2 459.8 520.0 General & Administrative 116.0 150.7 168.7 192.8 230.0 278.9 288.0 330.9 360.3 373.1 395.9 443.0 Cost of revenues Research and development Sales and marketing General and administrative In process R&D charge - - - - - - - - - - - - Stock based compensation 114.7 109.1 99.9 134.4 183.9 241.5 198.0 195.0 205.0 215.0 225.0 235.0 Settlement Attorney Fees (Lane's Gift) 30.0 - - - - - - - - - - - Contribution to Google Foundation - - - - - - - - - - - - Total Expenses 788.3 855.5 933.1 1,169.3 1,317.7 1,617.3 1,692.5 1,915.2 2,122.5 2,212.6 2,340.8 2,627.9 Operating Income 742.7 815.4 931.3 1,060.6 1,221.2 1,104.6 1,317.8 1,532.1 1,751.3 1,798.7 1,916.4 2,186.8 Pro Forma Operating Income 887.4 924.5 1,031.2 1,195.0 1,405.1 1,346.1 1,515.8 1,727.1 1,956.3 2,013.7 2,141.4 2,421.8 Operating Margins 49% 49% 50% 48% 48% 41% 44% 44% 45% 45% 45% 45% Pro Forma Operating Margins 58% 55% 55% 54% 55% 49.5% 50.4% 50% 51% 50% 50% 50% Interest Income (Expense) 67.9 160.8 108.2 124.1 130.7 137.1 154.4 160.0 170.0 180.0 190.0 200.0 EBT 811 976 1,040 1,185 1,352 1,242 1,472 1,692 1,921 1,979 2,106 2,387 Less Taxes 218 255 306 154 350 317 402 465 500 514 548 621 Tax Rate 27% 26% 29% 13% 26% 25% 27% 28% 26% 26% 26% 26% EBITDA 998.5 1,050.7 1,176.5 1,384.3 1,610.1 1,569.5 1,765.2 2,013.1 2,266.3 2,347.7 2,499.4 2,803.8 Margins 65.2% 62.9% 63.1% 62.1% 63.4% 57.7% 58.6% 58.4% 58.5% 58.5% 58.7% 58.2%
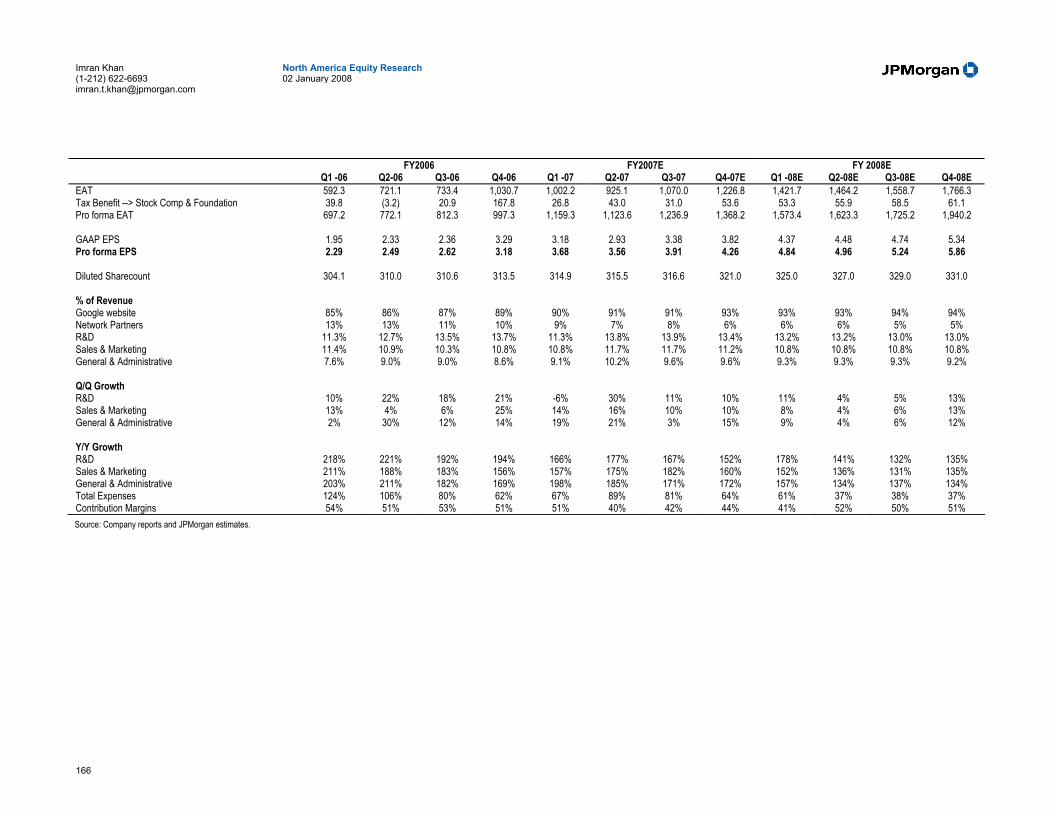
166
North America Equity Research 02 January 2008
Imran Khan (1-212) 622-6693 [email protected]
FY2006 FY2007E FY 2008E Q1 -06 Q2-06 Q3-06 Q4-06 Q1 -07 Q2-07 Q3-07 Q4-07E Q1 -08E Q2-08E Q3-08E Q4-08E
EAT 592.3 721.1 733.4 1,030.7 1,002.2 925.1 1,070.0 1,226.8 1,421.7 1,464.2 1,558.7 1,766.3 Tax Benefit --> Stock Comp & Foundation 39.8 (3.2) 20.9 167.8 26.8 43.0 31.0 53.6 53.3 55.9 58.5 61.1 Pro forma EAT 697.2 772.1 812.3 997.3 1,159.3 1,123.6 1,236.9 1,368.2 1,573.4 1,623.3 1,725.2 1,940.2 GAAP EPS 1.95 2.33 2.36 3.29 3.18 2.93 3.38 3.82 4.37 4.48 4.74 5.34 Pro forma EPS 2.29 2.49 2.62 3.18 3.68 3.56 3.91 4.26 4.84 4.96 5.24 5.86 Diluted Sharecount 304.1 310.0 310.6 313.5 314.9 315.5 316.6 321.0 325.0 327.0 329.0 331.0 % of Revenue Google website 85% 86% 87% 89% 90% 91% 91% 93% 93% 93% 94% 94% Network Partners 13% 13% 11% 10% 9% 7% 8% 6% 6% 6% 5% 5% R&D 11.3% 12.7% 13.5% 13.7% 11.3% 13.8% 13.9% 13.4% 13.2% 13.2% 13.0% 13.0% Sales & Marketing 11.4% 10.9% 10.3% 10.8% 10.8% 11.7% 11.7% 11.2% 10.8% 10.8% 10.8% 10.8% General & Administrative 7.6% 9.0% 9.0% 8.6% 9.1% 10.2% 9.6% 9.6% 9.3% 9.3% 9.3% 9.2% Q/Q Growth R&D 10% 22% 18% 21% -6% 30% 11% 10% 11% 4% 5% 13% Sales & Marketing 13% 4% 6% 25% 14% 16% 10% 10% 8% 4% 6% 13% General & Administrative 2% 30% 12% 14% 19% 21% 3% 15% 9% 4% 6% 12% Y/Y Growth R&D 218% 221% 192% 194% 166% 177% 167% 152% 178% 141% 132% 135% Sales & Marketing 211% 188% 183% 156% 157% 175% 182% 160% 152% 136% 131% 135% General & Administrative 203% 211% 182% 169% 198% 185% 171% 172% 157% 134% 137% 134% Total Expenses 124% 106% 80% 62% 67% 89% 81% 64% 61% 37% 38% 37% Contribution Margins 54% 51% 53% 51% 51% 40% 42% 44% 41% 52% 50% 51% Source: Company reports and JPMorgan estimates.
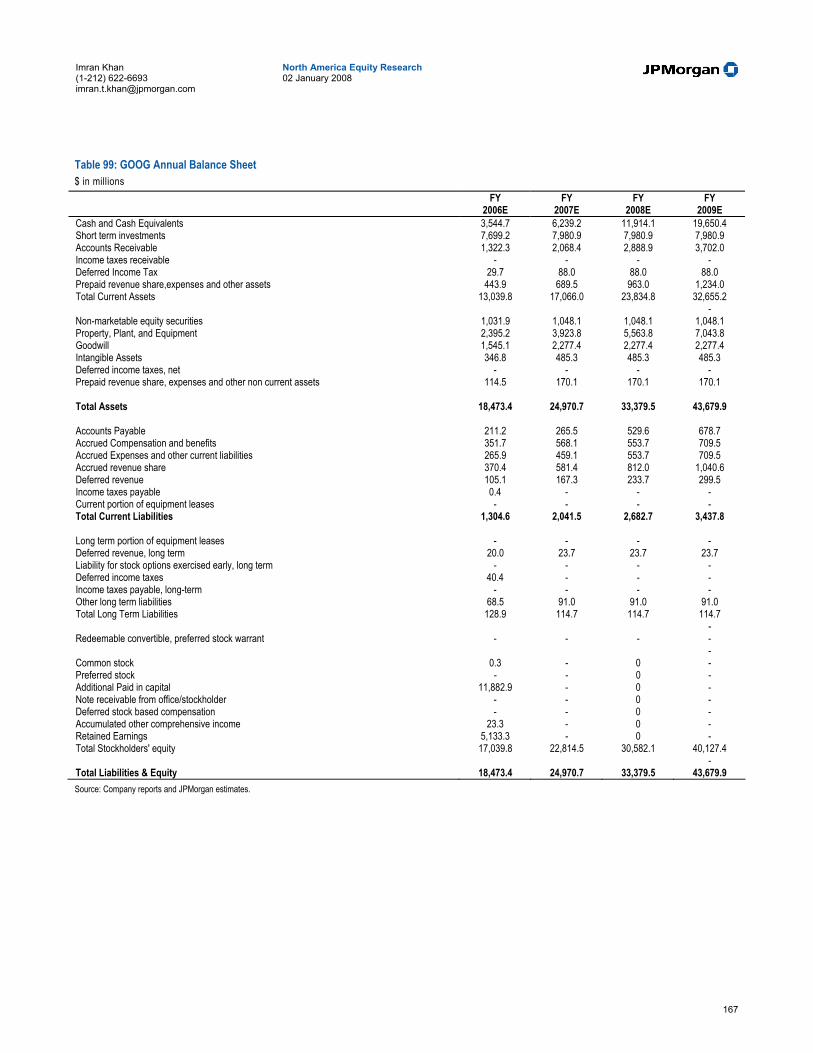
167
North America Equity Research 02 January 2008
Imran Khan (1-212) 622-6693 [email protected]
Table 99: GOOG Annual Balance Sheet $ in millions
FY FY FY FY 2006E 2007E 2008E 2009E
Cash and Cash Equivalents 3,544.7 6,239.2 11,914.1 19,650.4 Short term investments 7,699.2 7,980.9 7,980.9 7,980.9 Accounts Receivable 1,322.3 2,068.4 2,888.9 3,702.0 Income taxes receivable - - - - Deferred Income Tax 29.7 88.0 88.0 88.0 Prepaid revenue share,expenses and other assets 443.9 689.5 963.0 1,234.0 Total Current Assets 13,039.8 17,066.0 23,834.8 32,655.2 - Non-marketable equity securities 1,031.9 1,048.1 1,048.1 1,048.1 Property, Plant, and Equipment 2,395.2 3,923.8 5,563.8 7,043.8 Goodwill 1,545.1 2,277.4 2,277.4 2,277.4 Intangible Assets 346.8 485.3 485.3 485.3 Deferred income taxes, net - - - - Prepaid revenue share, expenses and other non current assets 114.5 170.1 170.1 170.1 Total Assets 18,473.4 24,970.7 33,379.5 43,679.9 Accounts Payable 211.2 265.5 529.6 678.7 Accrued Compensation and benefits 351.7 568.1 553.7 709.5 Accrued Expenses and other current liabilities 265.9 459.1 553.7 709.5 Accrued revenue share 370.4 581.4 812.0 1,040.6 Deferred revenue 105.1 167.3 233.7 299.5 Income taxes payable 0.4 - - - Current portion of equipment leases - - - - Total Current Liabilities 1,304.6 2,041.5 2,682.7 3,437.8 Long term portion of equipment leases - - - - Deferred revenue, long term 20.0 23.7 23.7 23.7 Liability for stock options exercised early, long term - - - - Deferred income taxes 40.4 - - - Income taxes payable, long-term - - - - Other long term liabilities 68.5 91.0 91.0 91.0 Total Long Term Liabilities 128.9 114.7 114.7 114.7 - Redeemable convertible, preferred stock warrant - - - - - Common stock 0.3 - 0 - Preferred stock - - 0 - Additional Paid in capital 11,882.9 - 0 - Note receivable from office/stockholder - - 0 - Deferred stock based compensation - - 0 - Accumulated other comprehensive income 23.3 - 0 - Retained Earnings 5,133.3 - 0 - Total Stockholders' equity 17,039.8 22,814.5 30,582.1 40,127.4 - Total Liabilities & Equity 18,473.4 24,970.7 33,379.5 43,679.9 Source: Company reports and JPMorgan estimates.
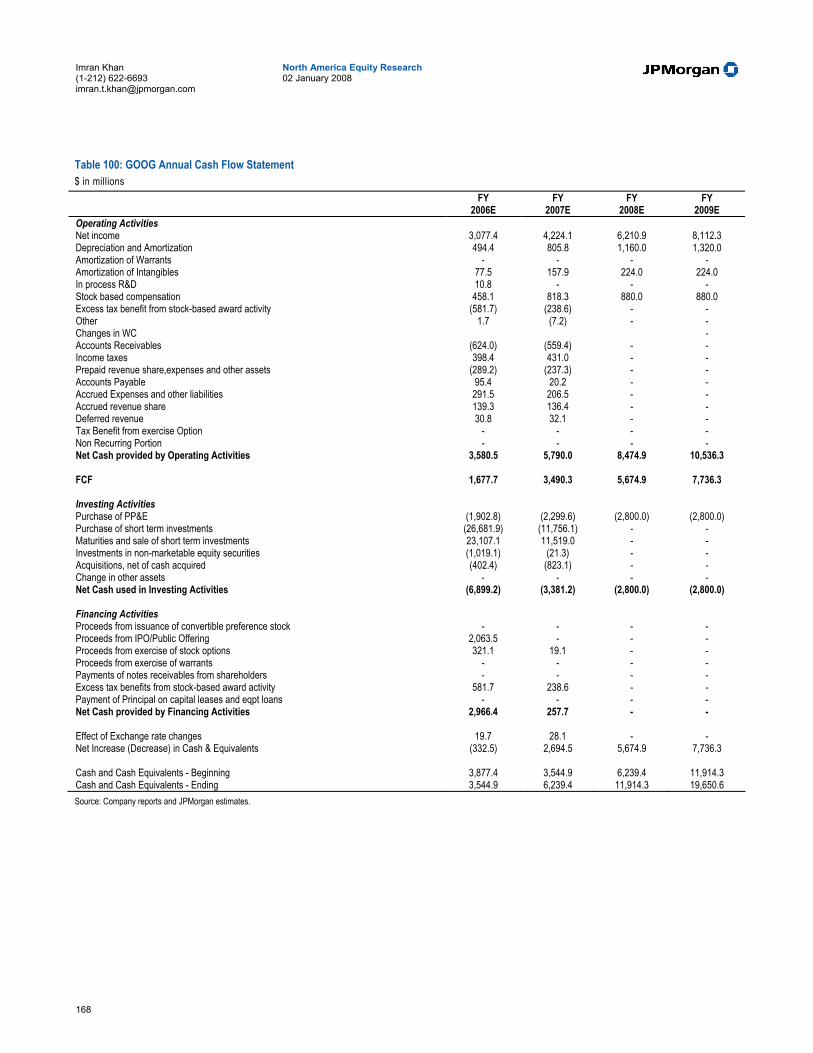
168
North America Equity Research 02 January 2008
Imran Khan (1-212) 622-6693 [email protected]
Table 100: GOOG Annual Cash Flow Statement $ in millions
FY FY FY FY 2006E 2007E 2008E 2009E
Operating Activities Net income 3,077.4 4,224.1 6,210.9 8,112.3 Depreciation and Amortization 494.4 805.8 1,160.0 1,320.0 Amortization of Warrants - - - - Amortization of Intangibles 77.5 157.9 224.0 224.0 In process R&D 10.8 - - - Stock based compensation 458.1 818.3 880.0 880.0 Excess tax benefit from stock-based award activity (581.7) (238.6) - - Other 1.7 (7.2) - - Changes in WC - Accounts Receivables (624.0) (559.4) - - Income taxes 398.4 431.0 - - Prepaid revenue share,expenses and other assets (289.2) (237.3) - - Accounts Payable 95.4 20.2 - - Accrued Expenses and other liabilities 291.5 206.5 - - Accrued revenue share 139.3 136.4 - - Deferred revenue 30.8 32.1 - - Tax Benefit from exercise Option - - - - Non Recurring Portion - - - - Net Cash provided by Operating Activities 3,580.5 5,790.0 8,474.9 10,536.3 FCF 1,677.7 3,490.3 5,674.9 7,736.3 Investing Activities Purchase of PP&E (1,902.8) (2,299.6) (2,800.0) (2,800.0) Purchase of short term investments (26,681.9) (11,756.1) - - Maturities and sale of short term investments 23,107.1 11,519.0 - - Investments in non-marketable equity securities (1,019.1) (21.3) - - Acquisitions, net of cash acquired (402.4) (823.1) - - Change in other assets - - - - Net Cash used in Investing Activities (6,899.2) (3,381.2) (2,800.0) (2,800.0) Financing Activities Proceeds from issuance of convertible preference stock - - - - Proceeds from IPO/Public Offering 2,063.5 - - - Proceeds from exercise of stock options 321.1 19.1 - - Proceeds from exercise of warrants - - - - Payments of notes receivables from shareholders - - - - Excess tax benefits from stock-based award activity 581.7 238.6 - - Payment of Principal on capital leases and eqpt loans - - - - Net Cash provided by Financing Activities 2,966.4 257.7 - - Effect of Exchange rate changes 19.7 28.1 - - Net Increase (Decrease) in Cash & Equivalents (332.5) 2,694.5 5,674.9 7,736.3 Cash and Cash Equivalents - Beginning 3,877.4 3,544.9 6,239.4 11,914.3 Cash and Cash Equivalents - Ending 3,544.9 6,239.4 11,914.3 19,650.6 Source: Company reports and JPMorgan estimates.
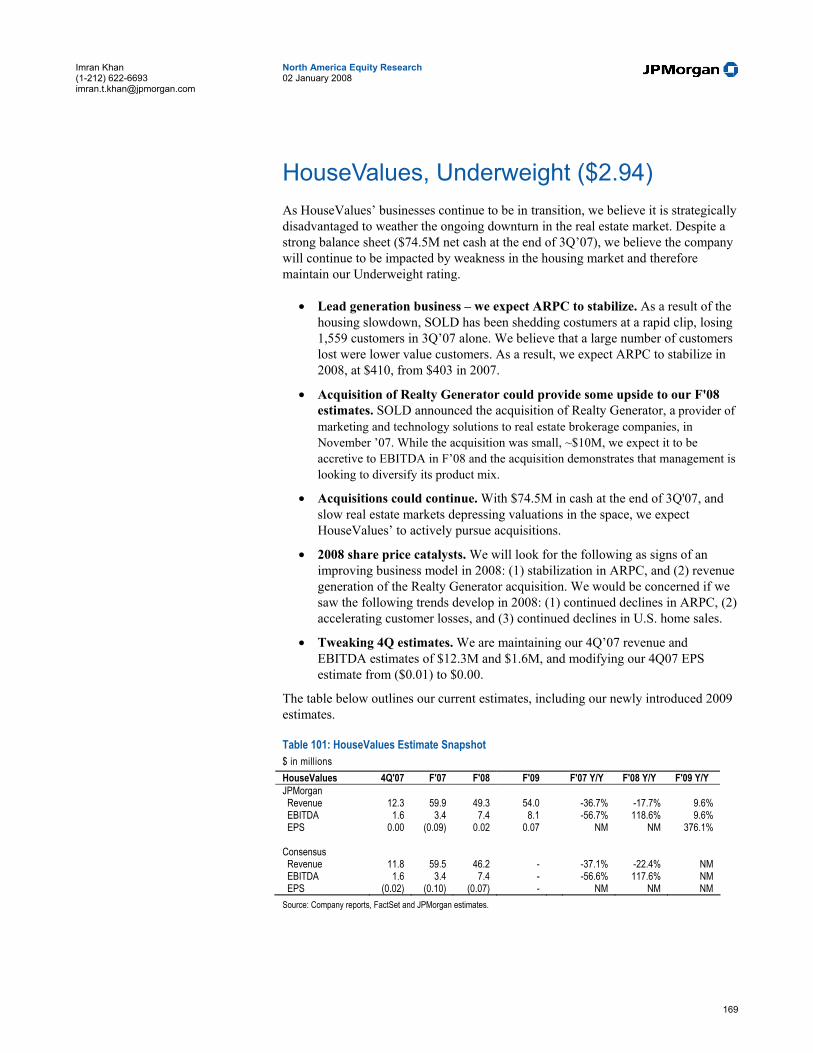
169
North America Equity Research 02 January 2008
Imran Khan (1-212) 622-6693 [email protected]
HouseValues, Underweight ($2.94) As HouseValues’ businesses continue to be in transition, we believe it is strategically disadvantaged to weather the ongoing downturn in the real estate market. Despite a strong balance sheet ($74.5M net cash at the end of 3Q’07), we believe the company will continue to be impacted by weakness in the housing market and therefore maintain our Underweight rating.
• Lead generation business – we expect ARPC to stabilize. As a result of the housing slowdown, SOLD has been shedding costumers at a rapid clip, losing 1,559 customers in 3Q’07 alone. We believe that a large number of customers lost were lower value customers. As a result, we expect ARPC to stabilize in 2008, at $410, from $403 in 2007.
• Acquisition of Realty Generator could provide some upside to our F'08 estimates. SOLD announced the acquisition of Realty Generator, a provider of marketing and technology solutions to real estate brokerage companies, in November ’07. While the acquisition was small, ~$10M, we expect it to be accretive to EBITDA in F’08 and the acquisition demonstrates that management is looking to diversify its product mix.
• Acquisitions could continue. With $74.5M in cash at the end of 3Q'07, and slow real estate markets depressing valuations in the space, we expect HouseValues’ to actively pursue acquisitions.
• 2008 share price catalysts. We will look for the following as signs of an improving business model in 2008: (1) stabilization in ARPC, and (2) revenue generation of the Realty Generator acquisition. We would be concerned if we saw the following trends develop in 2008: (1) continued declines in ARPC, (2) accelerating customer losses, and (3) continued declines in U.S. home sales.
• Tweaking 4Q estimates. We are maintaining our 4Q’07 revenue and EBITDA estimates of $12.3M and $1.6M, and modifying our 4Q07 EPS estimate from ($0.01) to $0.00.
The table below outlines our current estimates, including our newly introduced 2009 estimates.
Table 101: HouseValues Estimate Snapshot $ in millions HouseValues 4Q'07 F'07 F'08 F'09 F'07 Y/Y F'08 Y/Y F'09 Y/Y JPMorgan Revenue 12.3 59.9 49.3 54.0 -36.7% -17.7% 9.6% EBITDA 1.6 3.4 7.4 8.1 -56.7% 118.6% 9.6% EPS 0.00 (0.09) 0.02 0.07 NM NM 376.1% Consensus Revenue 11.8 59.5 46.2 - -37.1% -22.4% NM EBITDA 1.6 3.4 7.4 - -56.6% 117.6% NM EPS (0.02) (0.10) (0.07) - NM NM NM Source: Company reports, FactSet and JPMorgan estimates.
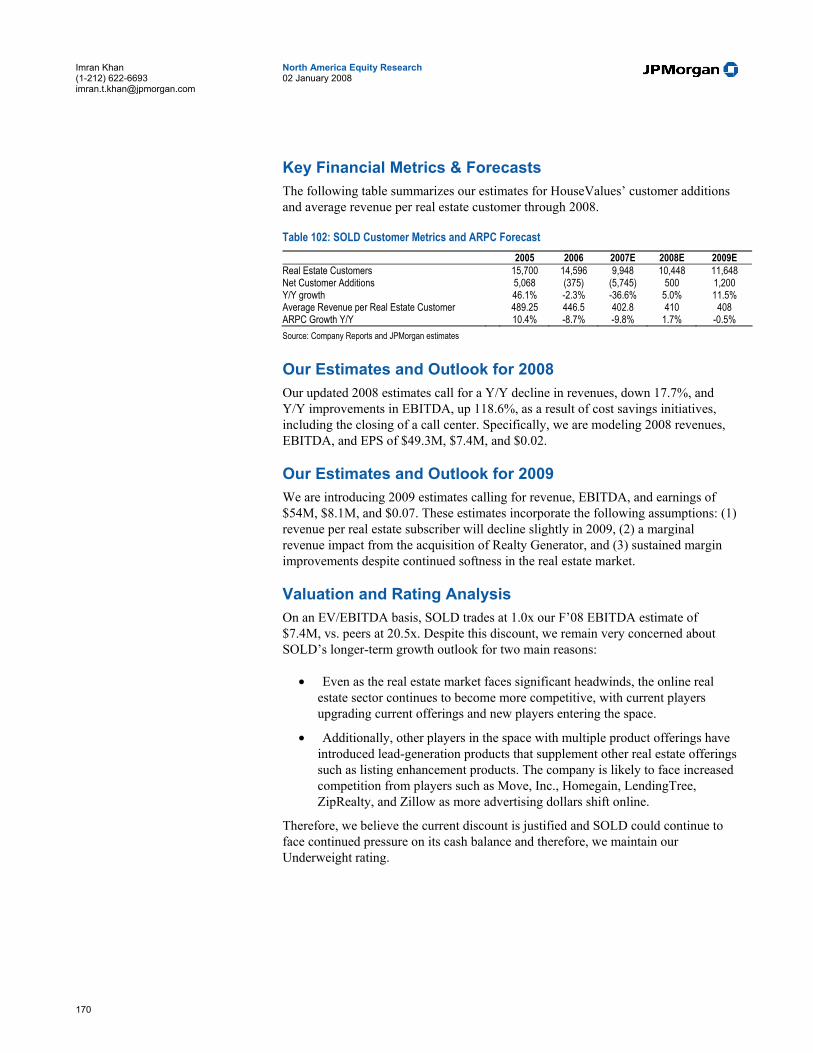
170
North America Equity Research 02 January 2008
Imran Khan (1-212) 622-6693 [email protected]
Key Financial Metrics & Forecasts The following table summarizes our estimates for HouseValues’ customer additions and average revenue per real estate customer through 2008.
Table 102: SOLD Customer Metrics and ARPC Forecast 2005 2006 2007E 2008E 2009E Real Estate Customers 15,700 14,596 9,948 10,448 11,648 Net Customer Additions 5,068 (375) (5,745) 500 1,200 Y/Y growth 46.1% -2.3% -36.6% 5.0% 11.5% Average Revenue per Real Estate Customer 489.25 446.5 402.8 410 408 ARPC Growth Y/Y 10.4% -8.7% -9.8% 1.7% -0.5% Source: Company Reports and JPMorgan estimates
Our Estimates and Outlook for 2008 Our updated 2008 estimates call for a Y/Y decline in revenues, down 17.7%, and Y/Y improvements in EBITDA, up 118.6%, as a result of cost savings initiatives, including the closing of a call center. Specifically, we are modeling 2008 revenues, EBITDA, and EPS of $49.3M, $7.4M, and $0.02.
Our Estimates and Outlook for 2009 We are introducing 2009 estimates calling for revenue, EBITDA, and earnings of $54M, $8.1M, and $0.07. These estimates incorporate the following assumptions: (1) revenue per real estate subscriber will decline slightly in 2009, (2) a marginal revenue impact from the acquisition of Realty Generator, and (3) sustained margin improvements despite continued softness in the real estate market.
Valuation and Rating Analysis On an EV/EBITDA basis, SOLD trades at 1.0x our F’08 EBITDA estimate of $7.4M, vs. peers at 20.5x. Despite this discount, we remain very concerned about SOLD’s longer-term growth outlook for two main reasons:
• Even as the real estate market faces significant headwinds, the online real estate sector continues to become more competitive, with current players upgrading current offerings and new players entering the space.
• Additionally, other players in the space with multiple product offerings have introduced lead-generation products that supplement other real estate offerings such as listing enhancement products. The company is likely to face increased competition from players such as Move, Inc., Homegain, LendingTree, ZipRealty, and Zillow as more advertising dollars shift online.
Therefore, we believe the current discount is justified and SOLD could continue to face continued pressure on its cash balance and therefore, we maintain our Underweight rating.

171
North America Equity Research 02 January 2008
Imran Khan (1-212) 622-6693 [email protected]
Risks to Our Rating Our current estimates are based on the assumption that difficult real estate market conditions will persist during 2007 and 2008, which could impact HouseValue’s top and bottom lines. Inherent in our assumptions are continued customer churn and limited upside potential in revenue per customer. Should market conditions improve sooner than we anticipate, our estimates could prove to be too conservative.

172
North America Equity Research 02 January 2008
Imran Khan (1-212) 622-6693 [email protected]
Table 103: SOLD Annual Income Statement $ in millions, except per share data
FY FY FY FY 2006 2007E 2008E 2009E
Revenues 94.6 59.9 49.3 54.0 House Values/Just Listed 62.2 59.9 49.3 54.0 Other 12.3 - - -
Sales & Marketing 61.8 38.7 30.3 33.2 Technology and Product Development 13.0 8.7 6.0 6.6 General & Admin 12.0 9.1 5.5 6.1 Restruc. / Impair't of goodwill + intang. assts Depreciation 5.2 5.3 6.0 3.6 Amortization 1.1 0.7 1.6 2.0 Stock based compensation 4.0 3.2 2.1 3.2 Total Expenses 97.0 67.0 51.6 54.6 Total Recurring Expenses 86.8 56.5 41.9 45.9
Income from Operations (2.4) (7.1) (2.3) (0.6) Pro Forma Operating Income 7.8 3.4 7.4 8.1 Operating Margins -2.6% -11.8% -4.6% -1.1% Pro Forma Operating Margins 8.3% 5.7% 15.1% 15.1%
EBITDA 7.8 3.4 7.4 8.1 EBITDA Margins 8.3% 5.7% 15.1% 15.1% Y/Y EBITDA Growth -67.5% -56.7% 118.6% 9.6%
Interest Income, Net 2.7 2.9 2.8 3.1
EBT (6.0) (4.2) 0.5 2.5 Tax (3.1) (1.8) 0.1 0.6 EAT (Continuing Operations) (2.9) (2.3) 0.4 1.9 Pro Forma EAT (excludes FAS) 6.8 4.1 6.6 7.3
Income/loss from Discontinued Ops (0.4) 0.2 - - Income tax benefit from discontinued (0.1) 0.1 - - Loss on discontinued ops (0.3) 0.2 - - Net income - adj for discontinued (3.1) (2.2) 0.4 1.9
Weighted Average No of shares (diluted) 26.1 24.5 25.7 25.8
Pro Forma EPS 0.25 0.17 0.26 0.28 GAAP EPS (0.14) (0.09) 0.02 0.07 Source: Company reports and JPMorgan estimates.
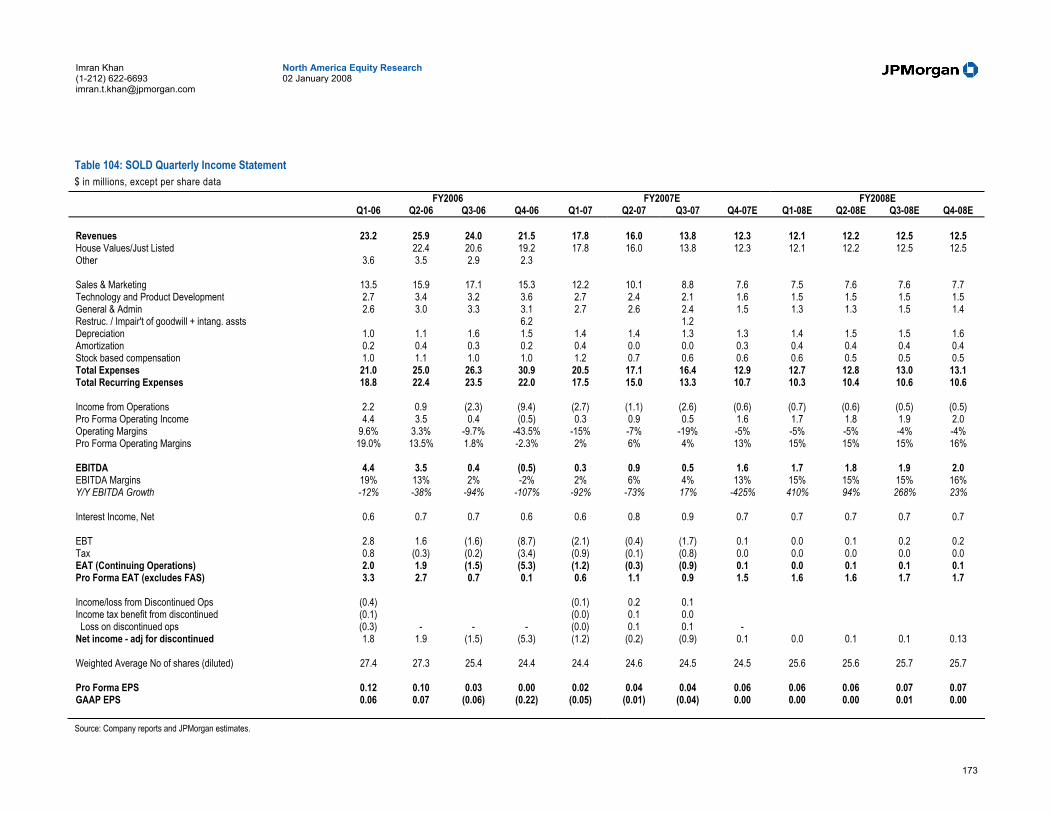
173
North America Equity Research 02 January 2008
Imran Khan (1-212) 622-6693 [email protected]
Table 104: SOLD Quarterly Income Statement $ in millions, except per share data
FY2006 FY2007E FY2008E Q1-06 Q2-06 Q3-06 Q4-06 Q1-07 Q2-07 Q3-07 Q4-07E Q1-08E Q2-08E Q3-08E Q4-08E
Revenues 23.2 25.9 24.0 21.5 17.8 16.0 13.8 12.3 12.1 12.2 12.5 12.5 House Values/Just Listed 22.4 20.6 19.2 17.8 16.0 13.8 12.3 12.1 12.2 12.5 12.5 Other 3.6 3.5 2.9 2.3
Sales & Marketing 13.5 15.9 17.1 15.3 12.2 10.1 8.8 7.6 7.5 7.6 7.6 7.7 Technology and Product Development 2.7 3.4 3.2 3.6 2.7 2.4 2.1 1.6 1.5 1.5 1.5 1.5 General & Admin 2.6 3.0 3.3 3.1 2.7 2.6 2.4 1.5 1.3 1.3 1.5 1.4 Restruc. / Impair't of goodwill + intang. assts 6.2 1.2 Depreciation 1.0 1.1 1.6 1.5 1.4 1.4 1.3 1.3 1.4 1.5 1.5 1.6 Amortization 0.2 0.4 0.3 0.2 0.4 0.0 0.0 0.3 0.4 0.4 0.4 0.4 Stock based compensation 1.0 1.1 1.0 1.0 1.2 0.7 0.6 0.6 0.6 0.5 0.5 0.5 Total Expenses 21.0 25.0 26.3 30.9 20.5 17.1 16.4 12.9 12.7 12.8 13.0 13.1 Total Recurring Expenses 18.8 22.4 23.5 22.0 17.5 15.0 13.3 10.7 10.3 10.4 10.6 10.6
Income from Operations 2.2 0.9 (2.3) (9.4) (2.7) (1.1) (2.6) (0.6) (0.7) (0.6) (0.5) (0.5) Pro Forma Operating Income 4.4 3.5 0.4 (0.5) 0.3 0.9 0.5 1.6 1.7 1.8 1.9 2.0 Operating Margins 9.6% 3.3% -9.7% -43.5% -15% -7% -19% -5% -5% -5% -4% -4% Pro Forma Operating Margins 19.0% 13.5% 1.8% -2.3% 2% 6% 4% 13% 15% 15% 15% 16%
EBITDA 4.4 3.5 0.4 (0.5) 0.3 0.9 0.5 1.6 1.7 1.8 1.9 2.0 EBITDA Margins 19% 13% 2% -2% 2% 6% 4% 13% 15% 15% 15% 16% Y/Y EBITDA Growth -12% -38% -94% -107% -92% -73% 17% -425% 410% 94% 268% 23%
Interest Income, Net 0.6 0.7 0.7 0.6 0.6 0.8 0.9 0.7 0.7 0.7 0.7 0.7
EBT 2.8 1.6 (1.6) (8.7) (2.1) (0.4) (1.7) 0.1 0.0 0.1 0.2 0.2 Tax 0.8 (0.3) (0.2) (3.4) (0.9) (0.1) (0.8) 0.0 0.0 0.0 0.0 0.0 EAT (Continuing Operations) 2.0 1.9 (1.5) (5.3) (1.2) (0.3) (0.9) 0.1 0.0 0.1 0.1 0.1 Pro Forma EAT (excludes FAS) 3.3 2.7 0.7 0.1 0.6 1.1 0.9 1.5 1.6 1.6 1.7 1.7
Income/loss from Discontinued Ops (0.4) (0.1) 0.2 0.1 Income tax benefit from discontinued (0.1) (0.0) 0.1 0.0 Loss on discontinued ops (0.3) - - - (0.0) 0.1 0.1 - Net income - adj for discontinued 1.8 1.9 (1.5) (5.3) (1.2) (0.2) (0.9) 0.1 0.0 0.1 0.1 0.13
Weighted Average No of shares (diluted) 27.4 27.3 25.4 24.4 24.4 24.6 24.5 24.5 25.6 25.6 25.7 25.7
Pro Forma EPS 0.12 0.10 0.03 0.00 0.02 0.04 0.04 0.06 0.06 0.06 0.07 0.07 GAAP EPS 0.06 0.07 (0.06) (0.22) (0.05) (0.01) (0.04) 0.00 0.00 0.00 0.01 0.00
Source: Company reports and JPMorgan estimates.
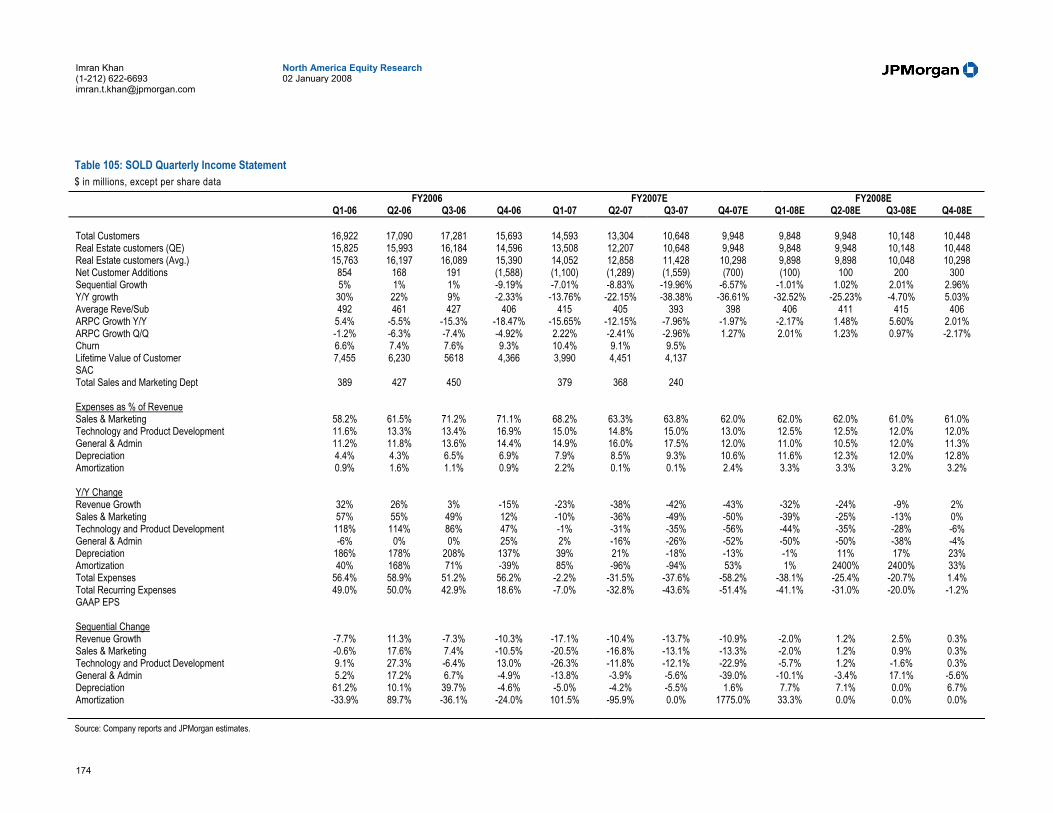
174
North America Equity Research 02 January 2008
Imran Khan (1-212) 622-6693 [email protected]
Table 105: SOLD Quarterly Income Statement $ in millions, except per share data
FY2006 FY2007E FY2008E Q1-06 Q2-06 Q3-06 Q4-06 Q1-07 Q2-07 Q3-07 Q4-07E Q1-08E Q2-08E Q3-08E Q4-08E
Total Customers 16,922 17,090 17,281 15,693 14,593 13,304 10,648 9,948 9,848 9,948 10,148 10,448 Real Estate customers (QE) 15,825 15,993 16,184 14,596 13,508 12,207 10,648 9,948 9,848 9,948 10,148 10,448 Real Estate customers (Avg.) 15,763 16,197 16,089 15,390 14,052 12,858 11,428 10,298 9,898 9,898 10,048 10,298 Net Customer Additions 854 168 191 (1,588) (1,100) (1,289) (1,559) (700) (100) 100 200 300 Sequential Growth 5% 1% 1% -9.19% -7.01% -8.83% -19.96% -6.57% -1.01% 1.02% 2.01% 2.96% Y/Y growth 30% 22% 9% -2.33% -13.76% -22.15% -38.38% -36.61% -32.52% -25.23% -4.70% 5.03% Average Reve/Sub 492 461 427 406 415 405 393 398 406 411 415 406 ARPC Growth Y/Y 5.4% -5.5% -15.3% -18.47% -15.65% -12.15% -7.96% -1.97% -2.17% 1.48% 5.60% 2.01% ARPC Growth Q/Q -1.2% -6.3% -7.4% -4.92% 2.22% -2.41% -2.96% 1.27% 2.01% 1.23% 0.97% -2.17% Churn 6.6% 7.4% 7.6% 9.3% 10.4% 9.1% 9.5% Lifetime Value of Customer 7,455 6,230 5618 4,366 3,990 4,451 4,137 SAC Total Sales and Marketing Dept 389 427 450 379 368 240
Expenses as % of Revenue Sales & Marketing 58.2% 61.5% 71.2% 71.1% 68.2% 63.3% 63.8% 62.0% 62.0% 62.0% 61.0% 61.0% Technology and Product Development 11.6% 13.3% 13.4% 16.9% 15.0% 14.8% 15.0% 13.0% 12.5% 12.5% 12.0% 12.0% General & Admin 11.2% 11.8% 13.6% 14.4% 14.9% 16.0% 17.5% 12.0% 11.0% 10.5% 12.0% 11.3% Depreciation 4.4% 4.3% 6.5% 6.9% 7.9% 8.5% 9.3% 10.6% 11.6% 12.3% 12.0% 12.8% Amortization 0.9% 1.6% 1.1% 0.9% 2.2% 0.1% 0.1% 2.4% 3.3% 3.3% 3.2% 3.2%
Y/Y Change Revenue Growth 32% 26% 3% -15% -23% -38% -42% -43% -32% -24% -9% 2% Sales & Marketing 57% 55% 49% 12% -10% -36% -49% -50% -39% -25% -13% 0% Technology and Product Development 118% 114% 86% 47% -1% -31% -35% -56% -44% -35% -28% -6% General & Admin -6% 0% 0% 25% 2% -16% -26% -52% -50% -50% -38% -4% Depreciation 186% 178% 208% 137% 39% 21% -18% -13% -1% 11% 17% 23% Amortization 40% 168% 71% -39% 85% -96% -94% 53% 1% 2400% 2400% 33% Total Expenses 56.4% 58.9% 51.2% 56.2% -2.2% -31.5% -37.6% -58.2% -38.1% -25.4% -20.7% 1.4% Total Recurring Expenses 49.0% 50.0% 42.9% 18.6% -7.0% -32.8% -43.6% -51.4% -41.1% -31.0% -20.0% -1.2% GAAP EPS
Sequential Change Revenue Growth -7.7% 11.3% -7.3% -10.3% -17.1% -10.4% -13.7% -10.9% -2.0% 1.2% 2.5% 0.3% Sales & Marketing -0.6% 17.6% 7.4% -10.5% -20.5% -16.8% -13.1% -13.3% -2.0% 1.2% 0.9% 0.3% Technology and Product Development 9.1% 27.3% -6.4% 13.0% -26.3% -11.8% -12.1% -22.9% -5.7% 1.2% -1.6% 0.3% General & Admin 5.2% 17.2% 6.7% -4.9% -13.8% -3.9% -5.6% -39.0% -10.1% -3.4% 17.1% -5.6% Depreciation 61.2% 10.1% 39.7% -4.6% -5.0% -4.2% -5.5% 1.6% 7.7% 7.1% 0.0% 6.7% Amortization -33.9% 89.7% -36.1% -24.0% 101.5% -95.9% 0.0% 1775.0% 33.3% 0.0% 0.0% 0.0% Source: Company reports and JPMorgan estimates.

175
North America Equity Research 02 January 2008
Imran Khan (1-212) 622-6693 [email protected]
Table 106: SOLD Annual Balance Sheet $ in millions
FY FY FY FY 2006 2007E 2008E 2009E
ASSETS Current assets: Cash and cash equivalents 49.4 26.4 34.6 42.9 Short-term investments 28.4 40.3 40.3 40.3 Accounts receivable, net 0.4 0.0 0.0 0.0 Income taxes Receivable - - - - Prepaid advertising - - - - Prepaid expenses and other assets 1.7 1.9 1.4 1.4 Deferred income taxes 1.6 2.0 1.9 1.9 Prepaid income taxes 2.3 0.9 0.9 0.9 Other current assets - - - - Total current assets 83.8 71.4 79.1 87.4 Property and equipment, net 11.5 8.0 6.4 5.3 Goodwill 3.6 3.6 3.6 3.6 Intangible assets, net 0.6 0.2 0.2 0.2 Restricted cash - - - - Other assets 1.8 2.6 2.6 2.6 Deferred income taxes - - - - Total assets 101.4 85.9 91.9 99.1 LIABILITIES AND SHAREHOLDERS' EQUITY Current Liabilities: Accounts payable 3.2 1.0 0.8 0.8 Accrued compensation and benefits 3.2 1.9 2.4 2.4 Accrued expenses and other current liabilities 5.1 2.5 3.5 3.5 Deferred rent, current portion 0.3 0.3 0.3 Deferred revenue 1.1 0.8 0.9 0.9 Income taxes payable - - - - Total Current Liabilities 12.9 6.5 7.9 7.9 Deferred income taxes - - - - Deferred rent, less current portion 1.1 0.8 0.8 0.8 Note payable 1.7 1.8 1.8 1.8 Redeemable convertible preferred Series A - - - - Redeemable convertible preferred Series B - - - - Total Liabilities 15.7 9.1 10.5 10.5 Shareholders Equity: Common stock 63.2 56.5 60.7 66.1 Deferred stock-based compensation - - - - Notes receivable from officers/shareholders - - - - Retained earnings 22.4 20.3 20.7 22.5 Total shareholders equity 85.7 76.8 81.4 88.6 Total Liabilities and shareholders equity 101.4 85.9 91.9 99.1 Source: Company reports and JPMorgan estimates.
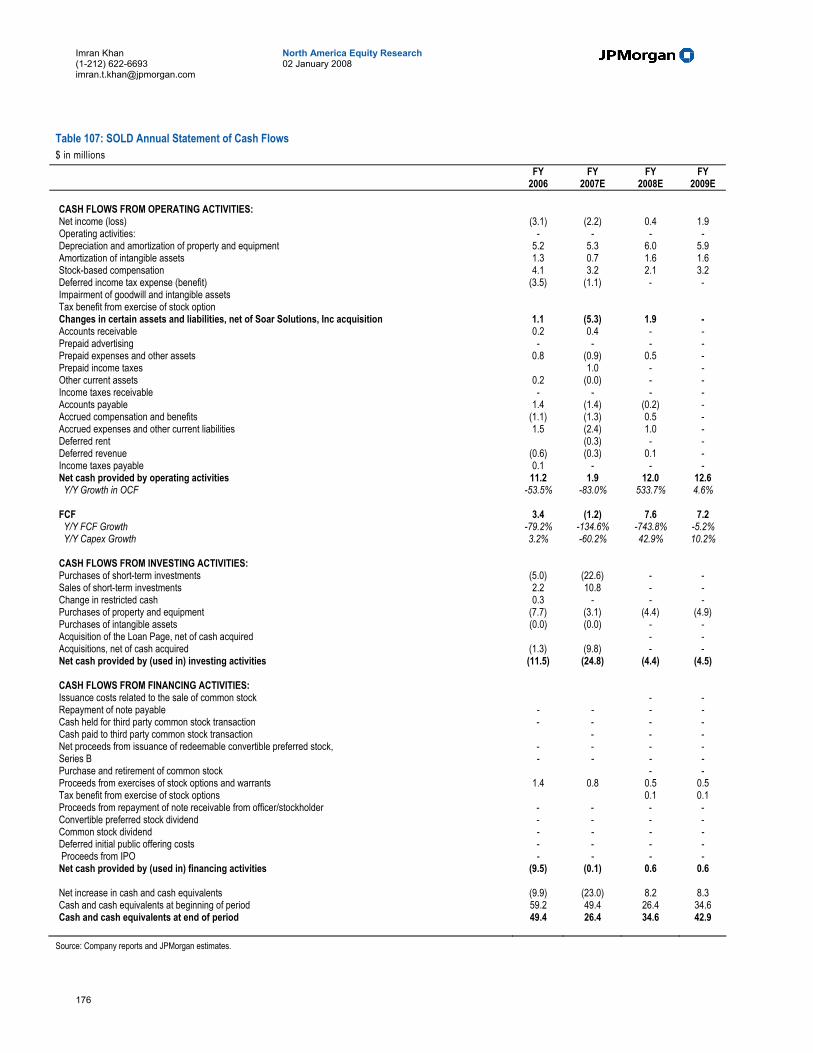
176
North America Equity Research 02 January 2008
Imran Khan (1-212) 622-6693 [email protected]
Table 107: SOLD Annual Statement of Cash Flows $ in millions
FY FY FY FY 2006 2007E 2008E 2009E
CASH FLOWS FROM OPERATING ACTIVITIES: Net income (loss) (3.1) (2.2) 0.4 1.9 Operating activities: - - - - Depreciation and amortization of property and equipment 5.2 5.3 6.0 5.9 Amortization of intangible assets 1.3 0.7 1.6 1.6 Stock-based compensation 4.1 3.2 2.1 3.2 Deferred income tax expense (benefit) (3.5) (1.1) - - Impairment of goodwill and intangible assets Tax benefit from exercise of stock option Changes in certain assets and liabilities, net of Soar Solutions, Inc acquisition 1.1 (5.3) 1.9 - Accounts receivable 0.2 0.4 - - Prepaid advertising - - - - Prepaid expenses and other assets 0.8 (0.9) 0.5 - Prepaid income taxes 1.0 - - Other current assets 0.2 (0.0) - - Income taxes receivable - - - - Accounts payable 1.4 (1.4) (0.2) - Accrued compensation and benefits (1.1) (1.3) 0.5 - Accrued expenses and other current liabilities 1.5 (2.4) 1.0 - Deferred rent (0.3) - - Deferred revenue (0.6) (0.3) 0.1 - Income taxes payable 0.1 - - - Net cash provided by operating activities 11.2 1.9 12.0 12.6 Y/Y Growth in OCF -53.5% -83.0% 533.7% 4.6%
FCF 3.4 (1.2) 7.6 7.2 Y/Y FCF Growth -79.2% -134.6% -743.8% -5.2% Y/Y Capex Growth 3.2% -60.2% 42.9% 10.2%
CASH FLOWS FROM INVESTING ACTIVITIES: Purchases of short-term investments (5.0) (22.6) - - Sales of short-term investments 2.2 10.8 - - Change in restricted cash 0.3 - - - Purchases of property and equipment (7.7) (3.1) (4.4) (4.9) Purchases of intangible assets (0.0) (0.0) - - Acquisition of the Loan Page, net of cash acquired - - Acquisitions, net of cash acquired (1.3) (9.8) - - Net cash provided by (used in) investing activities (11.5) (24.8) (4.4) (4.5)
CASH FLOWS FROM FINANCING ACTIVITIES: Issuance costs related to the sale of common stock - - Repayment of note payable - - - - Cash held for third party common stock transaction - - - - Cash paid to third party common stock transaction - - - Net proceeds from issuance of redeemable convertible preferred stock, - - - - Series B - - - - Purchase and retirement of common stock - - Proceeds from exercises of stock options and warrants 1.4 0.8 0.5 0.5 Tax benefit from exercise of stock options 0.1 0.1 Proceeds from repayment of note receivable from officer/stockholder - - - - Convertible preferred stock dividend - - - - Common stock dividend - - - - Deferred initial public offering costs - - - - Proceeds from IPO - - - - Net cash provided by (used in) financing activities (9.5) (0.1) 0.6 0.6
Net increase in cash and cash equivalents (9.9) (23.0) 8.2 8.3 Cash and cash equivalents at beginning of period 59.2 49.4 26.4 34.6 Cash and cash equivalents at end of period 49.4 26.4 34.6 42.9 Source: Company reports and JPMorgan estimates.

177
North America Equity Research 02 January 2008
Imran Khan (1-212) 622-6693 [email protected]
InfoSpace, Neutral ($18.96) As a second-tier player in the online search business, we believe InfoSpace will continue to lose market share to the larger players. As such, we believe there is little opportunity to accelerate its anemic growth, and thus maintain our Neutral rating.
• Sale of directory and mobile businesses allows INSP to capture value NOLs. With declining earnings, InfoSpace turned to selling its online directory, for $225M, and mobile services businesses, for $135M, in order to capture the value of $380M in NOLs the company was carrying. As a result of the sales, INSP plans to return $300M, or $9 per share, to shareholders in the form of a special dividend in Jan. ’08.
• Search Share Dwindling. According to our estimates, InfoSpace will see its query volumes decline in 2007, as larger players continue to gain market share. We now believe InfoSpace controls less than 0.5% of the US search market, down from 1.4% just three years ago. Slowing RPS growth has also had a negative impact on earnings, and we do not expect a material improvement in 2008.
• 2008 Drivers. In our view, the following factors will drive the stock in 2008: (1) search market share declines, (2) the return of cash to shareholders from the divesture of the mobile business in January 2008, and (3) improving EBITDA margins as a result of the divesture of the mobile businesses.
• Maintaining 4Q’07 Estimates. We are maintaining our 4Q revenue, EBITDA and EPS estimates of $34.3M, $0.9M and ($0.24), respectively However, we believe there is the potential for some additional upside to margins following the divesture of its lower-margin mobile business.
Our current and newly introduced 2009 estimates are in the table below.
Table 108: InfoSpace Estimate Highlights $ in millions InfoSpace 4Q'07 F'07 F'08 F'09 F'07 Y/Y F'08 Y/Y F'09 Y/Y JPMorgan Revenue 34.3 240.2 138.9 140.6 -35.4% -42.2% 1.3% EBITDA 0.9 (9.4) (15.5) 18.1 NM NM NM EPS (0.24) (1.49) (0.88) 0.11 NM NM NM
Consensus Revenue 34.5 240.4 137.8 143.9 -35.3% -42.7% 4.4% EBITDA 1.7 NA 17.7 21.2 NM NM NM EPS 0.17 (1.44) (0.27) (0.58) NM NM NM Source: Company reports, FactSet and JPMorgan estimates.
Our Estimates and Outlook for 2008 In order to account for the $300M special dividend, we are adjusting our F’08 revenue, EBITDA and EPS estimates to $138.9M, ($15.5M), and ($0.88), from $138.9M, $16.6M and $0.07, respectively.
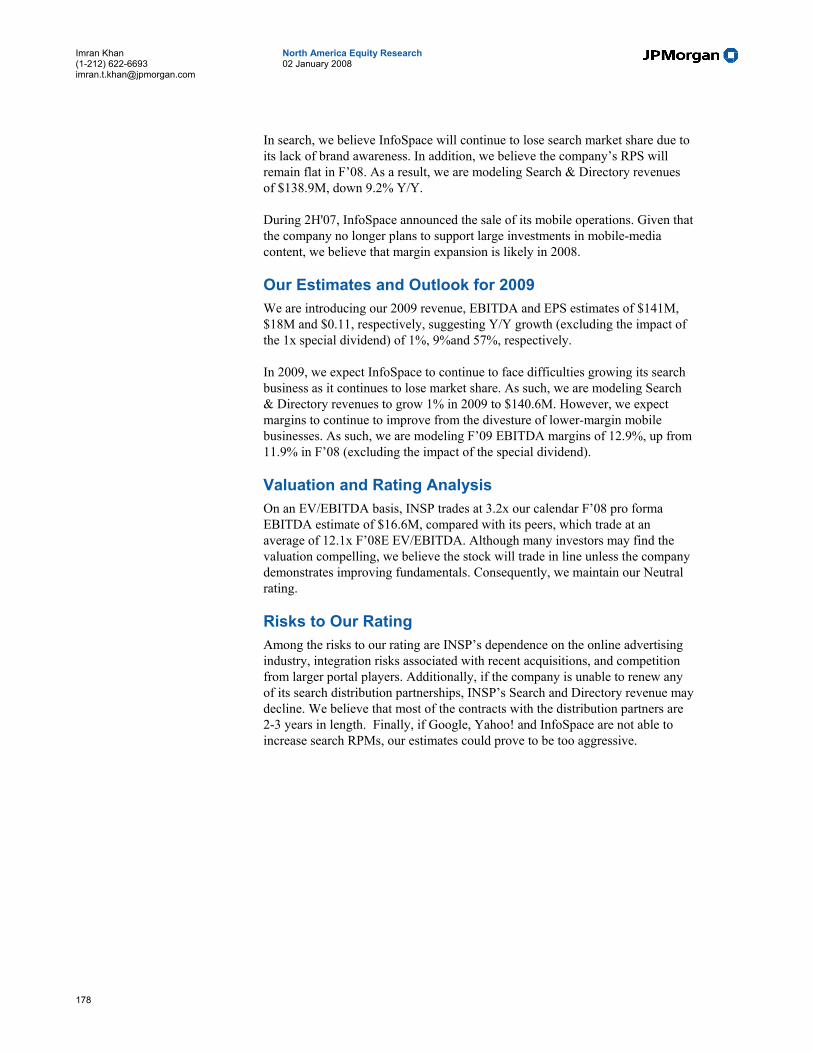
178
North America Equity Research 02 January 2008
Imran Khan (1-212) 622-6693 [email protected]
In search, we believe InfoSpace will continue to lose search market share due to its lack of brand awareness. In addition, we believe the company’s RPS will remain flat in F’08. As a result, we are modeling Search & Directory revenues of $138.9M, down 9.2% Y/Y.
During 2H'07, InfoSpace announced the sale of its mobile operations. Given that the company no longer plans to support large investments in mobile-media content, we believe that margin expansion is likely in 2008.
Our Estimates and Outlook for 2009 We are introducing our 2009 revenue, EBITDA and EPS estimates of $141M, $18M and $0.11, respectively, suggesting Y/Y growth (excluding the impact of the 1x special dividend) of 1%, 9%and 57%, respectively.
In 2009, we expect InfoSpace to continue to face difficulties growing its search business as it continues to lose market share. As such, we are modeling Search & Directory revenues to grow 1% in 2009 to $140.6M. However, we expect margins to continue to improve from the divesture of lower-margin mobile businesses. As such, we are modeling F’09 EBITDA margins of 12.9%, up from 11.9% in F’08 (excluding the impact of the special dividend).
Valuation and Rating Analysis On an EV/EBITDA basis, INSP trades at 3.2x our calendar F’08 pro forma EBITDA estimate of $16.6M, compared with its peers, which trade at an average of 12.1x F’08E EV/EBITDA. Although many investors may find the valuation compelling, we believe the stock will trade in line unless the company demonstrates improving fundamentals. Consequently, we maintain our Neutral rating.
Risks to Our Rating Among the risks to our rating are INSP’s dependence on the online advertising industry, integration risks associated with recent acquisitions, and competition from larger portal players. Additionally, if the company is unable to renew any of its search distribution partnerships, INSP’s Search and Directory revenue may decline. We believe that most of the contracts with the distribution partners are 2-3 years in length. Finally, if Google, Yahoo! and InfoSpace are not able to increase search RPMs, our estimates could prove to be too aggressive.
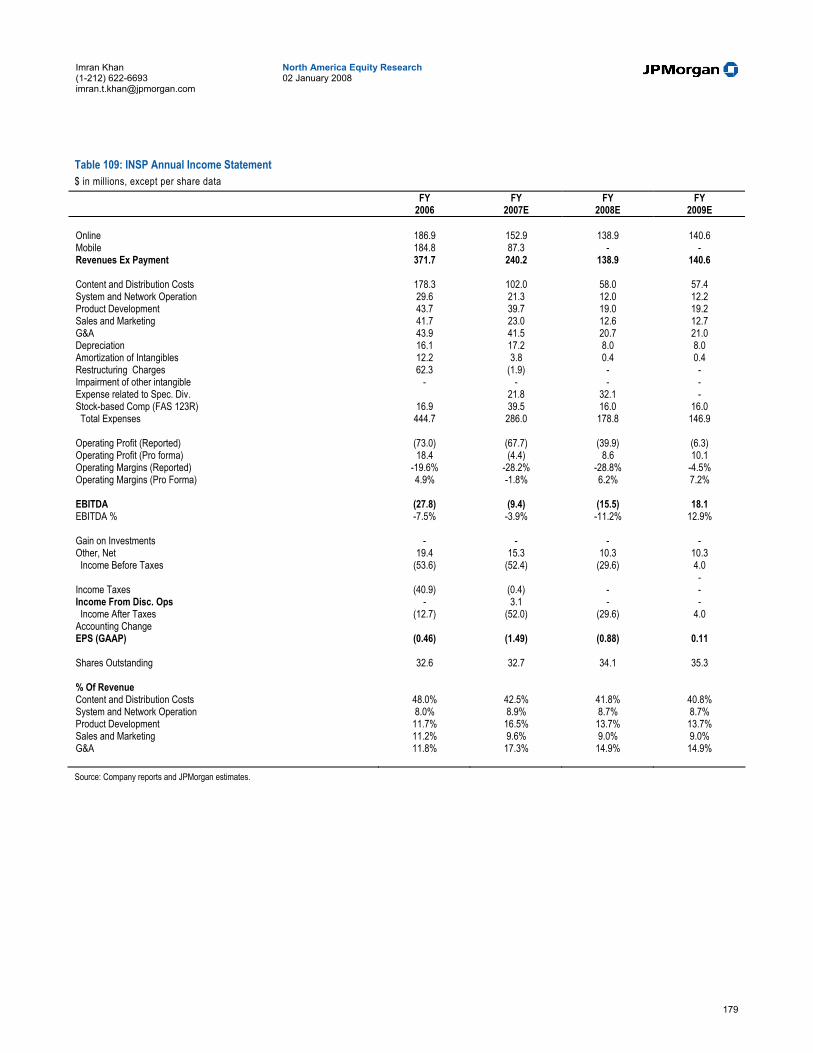
179
North America Equity Research 02 January 2008
Imran Khan (1-212) 622-6693 [email protected]
Table 109: INSP Annual Income Statement $ in millions, except per share data
FY FY FY FY 2006 2007E 2008E 2009E
Online 186.9 152.9 138.9 140.6 Mobile 184.8 87.3 - - Revenues Ex Payment 371.7 240.2 138.9 140.6
Content and Distribution Costs 178.3 102.0 58.0 57.4 System and Network Operation 29.6 21.3 12.0 12.2 Product Development 43.7 39.7 19.0 19.2 Sales and Marketing 41.7 23.0 12.6 12.7 G&A 43.9 41.5 20.7 21.0 Depreciation 16.1 17.2 8.0 8.0 Amortization of Intangibles 12.2 3.8 0.4 0.4 Restructuring Charges 62.3 (1.9) - - Impairment of other intangible - - - - Expense related to Spec. Div. 21.8 32.1 - Stock-based Comp (FAS 123R) 16.9 39.5 16.0 16.0 Total Expenses 444.7 286.0 178.8 146.9
Operating Profit (Reported) (73.0) (67.7) (39.9) (6.3) Operating Profit (Pro forma) 18.4 (4.4) 8.6 10.1 Operating Margins (Reported) -19.6% -28.2% -28.8% -4.5% Operating Margins (Pro Forma) 4.9% -1.8% 6.2% 7.2%
EBITDA (27.8) (9.4) (15.5) 18.1 EBITDA % -7.5% -3.9% -11.2% 12.9%
Gain on Investments - - - - Other, Net 19.4 15.3 10.3 10.3 Income Before Taxes (53.6) (52.4) (29.6) 4.0
- Income Taxes (40.9) (0.4) - - Income From Disc. Ops - 3.1 - - Income After Taxes (12.7) (52.0) (29.6) 4.0 Accounting Change EPS (GAAP) (0.46) (1.49) (0.88) 0.11
Shares Outstanding 32.6 32.7 34.1 35.3
% Of Revenue Content and Distribution Costs 48.0% 42.5% 41.8% 40.8% System and Network Operation 8.0% 8.9% 8.7% 8.7% Product Development 11.7% 16.5% 13.7% 13.7% Sales and Marketing 11.2% 9.6% 9.0% 9.0% G&A 11.8% 17.3% 14.9% 14.9% Source: Company reports and JPMorgan estimates.
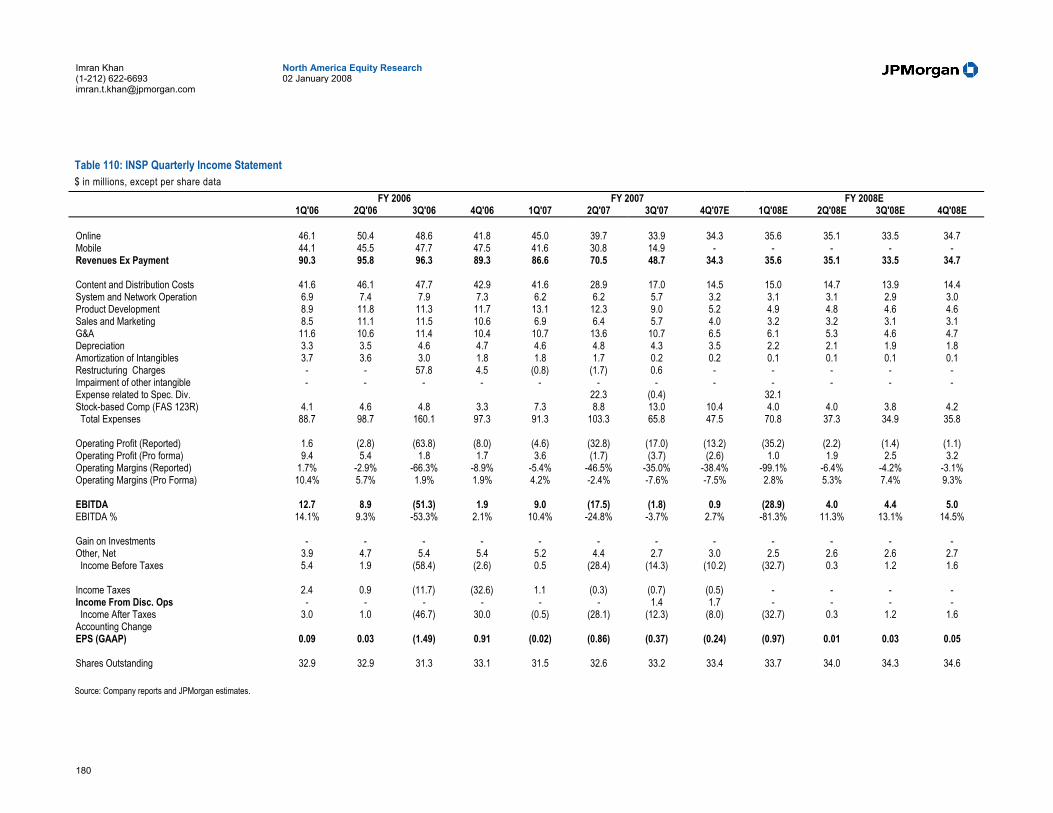
180
North America Equity Research 02 January 2008
Imran Khan (1-212) 622-6693 [email protected]
Table 110: INSP Quarterly Income Statement $ in millions, except per share data
FY 2006 FY 2007 FY 2008E 1Q'06 2Q'06 3Q'06 4Q'06 1Q'07 2Q'07 3Q'07 4Q'07E 1Q'08E 2Q'08E 3Q'08E 4Q'08E
Online 46.1 50.4 48.6 41.8 45.0 39.7 33.9 34.3 35.6 35.1 33.5 34.7 Mobile 44.1 45.5 47.7 47.5 41.6 30.8 14.9 - - - - - Revenues Ex Payment 90.3 95.8 96.3 89.3 86.6 70.5 48.7 34.3 35.6 35.1 33.5 34.7
Content and Distribution Costs 41.6 46.1 47.7 42.9 41.6 28.9 17.0 14.5 15.0 14.7 13.9 14.4 System and Network Operation 6.9 7.4 7.9 7.3 6.2 6.2 5.7 3.2 3.1 3.1 2.9 3.0 Product Development 8.9 11.8 11.3 11.7 13.1 12.3 9.0 5.2 4.9 4.8 4.6 4.6 Sales and Marketing 8.5 11.1 11.5 10.6 6.9 6.4 5.7 4.0 3.2 3.2 3.1 3.1 G&A 11.6 10.6 11.4 10.4 10.7 13.6 10.7 6.5 6.1 5.3 4.6 4.7 Depreciation 3.3 3.5 4.6 4.7 4.6 4.8 4.3 3.5 2.2 2.1 1.9 1.8 Amortization of Intangibles 3.7 3.6 3.0 1.8 1.8 1.7 0.2 0.2 0.1 0.1 0.1 0.1 Restructuring Charges - - 57.8 4.5 (0.8) (1.7) 0.6 - - - - - Impairment of other intangible - - - - - - - - - - - - Expense related to Spec. Div. 22.3 (0.4) 32.1 Stock-based Comp (FAS 123R) 4.1 4.6 4.8 3.3 7.3 8.8 13.0 10.4 4.0 4.0 3.8 4.2 Total Expenses 88.7 98.7 160.1 97.3 91.3 103.3 65.8 47.5 70.8 37.3 34.9 35.8
Operating Profit (Reported) 1.6 (2.8) (63.8) (8.0) (4.6) (32.8) (17.0) (13.2) (35.2) (2.2) (1.4) (1.1) Operating Profit (Pro forma) 9.4 5.4 1.8 1.7 3.6 (1.7) (3.7) (2.6) 1.0 1.9 2.5 3.2 Operating Margins (Reported) 1.7% -2.9% -66.3% -8.9% -5.4% -46.5% -35.0% -38.4% -99.1% -6.4% -4.2% -3.1% Operating Margins (Pro Forma) 10.4% 5.7% 1.9% 1.9% 4.2% -2.4% -7.6% -7.5% 2.8% 5.3% 7.4% 9.3%
EBITDA 12.7 8.9 (51.3) 1.9 9.0 (17.5) (1.8) 0.9 (28.9) 4.0 4.4 5.0 EBITDA % 14.1% 9.3% -53.3% 2.1% 10.4% -24.8% -3.7% 2.7% -81.3% 11.3% 13.1% 14.5%
Gain on Investments - - - - - - - - - - - - Other, Net 3.9 4.7 5.4 5.4 5.2 4.4 2.7 3.0 2.5 2.6 2.6 2.7 Income Before Taxes 5.4 1.9 (58.4) (2.6) 0.5 (28.4) (14.3) (10.2) (32.7) 0.3 1.2 1.6
Income Taxes 2.4 0.9 (11.7) (32.6) 1.1 (0.3) (0.7) (0.5) - - - - Income From Disc. Ops - - - - - - 1.4 1.7 - - - - Income After Taxes 3.0 1.0 (46.7) 30.0 (0.5) (28.1) (12.3) (8.0) (32.7) 0.3 1.2 1.6 Accounting Change EPS (GAAP) 0.09 0.03 (1.49) 0.91 (0.02) (0.86) (0.37) (0.24) (0.97) 0.01 0.03 0.05
Shares Outstanding 32.9 32.9 31.3 33.1 31.5 32.6 33.2 33.4 33.7 34.0 34.3 34.6
Source: Company reports and JPMorgan estimates.
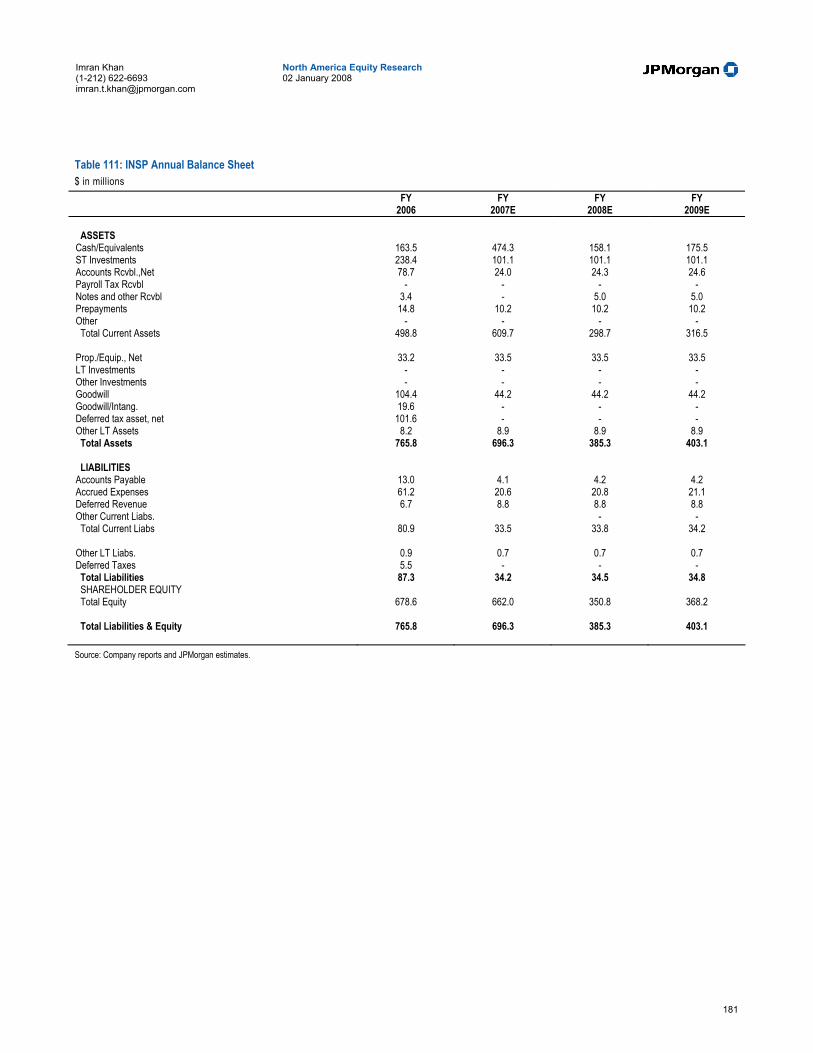
181
North America Equity Research 02 January 2008
Imran Khan (1-212) 622-6693 [email protected]
Table 111: INSP Annual Balance Sheet $ in millions
FY FY FY FY 2006 2007E 2008E 2009E
ASSETS Cash/Equivalents 163.5 474.3 158.1 175.5 ST Investments 238.4 101.1 101.1 101.1 Accounts Rcvbl.,Net 78.7 24.0 24.3 24.6 Payroll Tax Rcvbl - - - - Notes and other Rcvbl 3.4 - 5.0 5.0 Prepayments 14.8 10.2 10.2 10.2 Other - - - - Total Current Assets 498.8 609.7 298.7 316.5
Prop./Equip., Net 33.2 33.5 33.5 33.5 LT Investments - - - - Other Investments - - - - Goodwill 104.4 44.2 44.2 44.2 Goodwill/Intang. 19.6 - - - Deferred tax asset, net 101.6 - - - Other LT Assets 8.2 8.9 8.9 8.9 Total Assets 765.8 696.3 385.3 403.1
LIABILITIES Accounts Payable 13.0 4.1 4.2 4.2 Accrued Expenses 61.2 20.6 20.8 21.1 Deferred Revenue 6.7 8.8 8.8 8.8 Other Current Liabs. - - Total Current Liabs 80.9 33.5 33.8 34.2
Other LT Liabs. 0.9 0.7 0.7 0.7 Deferred Taxes 5.5 - - - Total Liabilities 87.3 34.2 34.5 34.8 SHAREHOLDER EQUITY Total Equity 678.6 662.0 350.8 368.2
Total Liabilities & Equity 765.8 696.3 385.3 403.1 Source: Company reports and JPMorgan estimates.

182
North America Equity Research 02 January 2008
Imran Khan (1-212) 622-6693 [email protected]
Table 112: INSP Annual Statement of Cash Flows $ in millions
FY FY FY FY 2006 2007E 2008E 2009E
OPERATING CF's Net Income (12.7) (48.9) (29.6) 4.0 D&A 28.3 19.8 8.4 8.4 Impair. of Intang. - - - - Warrant Income - - - - Income from discontinued ops - (6.2) - - Warrants Expense - - - - Stock-based Compen. 16.9 38.5 16.0 16.0 Option Tax Benefits - - - - Bad Debt Expense 0.2 - - - Gain on Investments - (3.1) - - Other Charges 62.3 1.6 - - Minority Interest - - - - Non-Cash Items - - - - Deferred Taxes (41.3) 0.4 - - Changes in Working Capital (10.2) 13.2 - - Amort. Trademark - - - - Write-off R&D - - - - Cash From Operations 43.5 15.2 (5.2) 28.4
FCF 20.9 (10.7) (16.2) 17.4
INVESTING CF's Capital Expenditures (22.6) (26.0) (11.0) (11.0) Business Acquisition - - - - Increase in other long-term assets - - - Asset Sale Proceeds 0.0 3.0 - - Proceeds from sale of disc. Ops - 360.0 - - Other Investing (15.6) 135.4 - - Purchase Intangible (0.3) - - - Cash From Investing (38.5) 472.4 (11.0) (11.0)
FINANCING CF's Proceeds from IPO - - - - Issuance of Common - - - - Stock to Employees 1.8 1.4 - - Exercise of Options 3.6 12.9 - - Debt, Net - - - - Purch./Sale of Stock - - - - Other Financing - (208.2) (300.0) - Repayment of Notes - - - - Cash From Financing 5.4 (193.9) (300.0) -
Discontinued Operations Net cash provided by disc. Ops - 17.3 - - Net cash used by disc. Ops - (0.3) - - Net cash provided - 17.1 - -
Foreign Exch/Other Adj - - - - Net Change In Cash 10.5 310.8 (316.2) 17.4
Beginning Cash 153.0 163.5 474.3 158.1 Ending Cash 163.5 474.3 158.1 175.5 Source: Company reports and JPMorgan estimates.
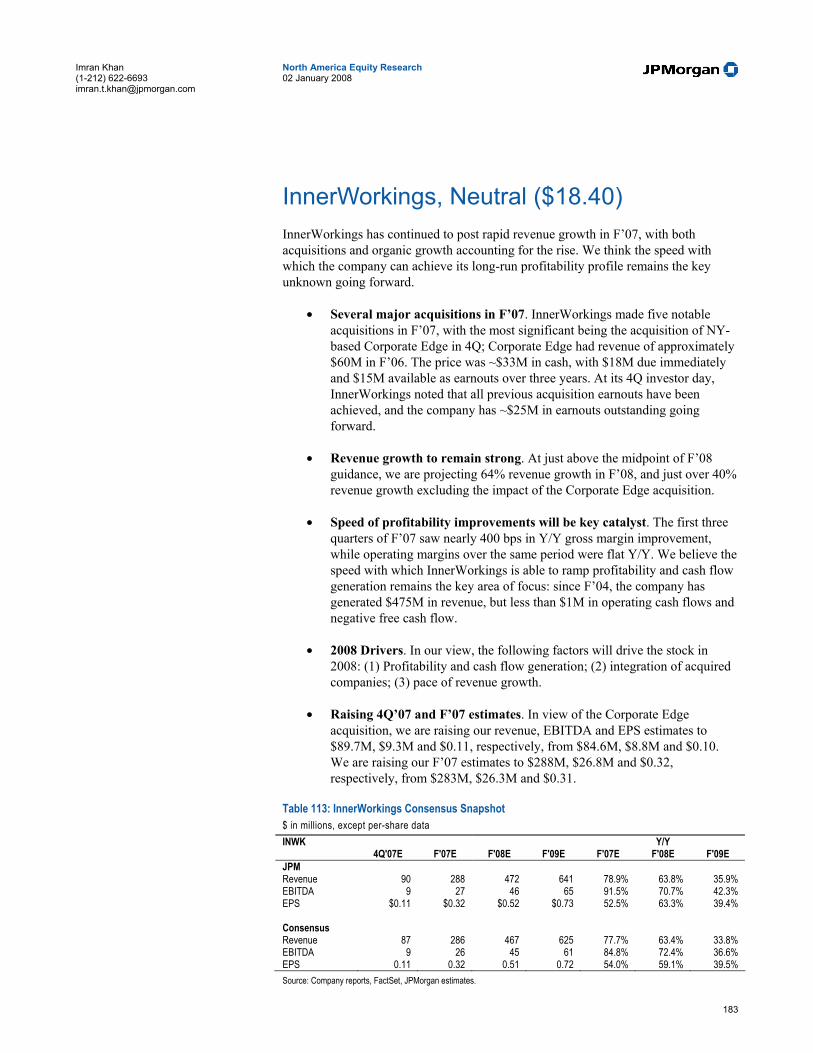
183
North America Equity Research 02 January 2008
Imran Khan (1-212) 622-6693 [email protected]
InnerWorkings, Neutral ($18.40) InnerWorkings has continued to post rapid revenue growth in F’07, with both acquisitions and organic growth accounting for the rise. We think the speed with which the company can achieve its long-run profitability profile remains the key unknown going forward.
• Several major acquisitions in F’07. InnerWorkings made five notable acquisitions in F’07, with the most significant being the acquisition of NY-based Corporate Edge in 4Q; Corporate Edge had revenue of approximately $60M in F’06. The price was ~$33M in cash, with $18M due immediately and $15M available as earnouts over three years. At its 4Q investor day, InnerWorkings noted that all previous acquisition earnouts have been achieved, and the company has ~$25M in earnouts outstanding going forward.
• Revenue growth to remain strong. At just above the midpoint of F’08 guidance, we are projecting 64% revenue growth in F’08, and just over 40% revenue growth excluding the impact of the Corporate Edge acquisition.
• Speed of profitability improvements will be key catalyst. The first three quarters of F’07 saw nearly 400 bps in Y/Y gross margin improvement, while operating margins over the same period were flat Y/Y. We believe the speed with which InnerWorkings is able to ramp profitability and cash flow generation remains the key area of focus: since F’04, the company has generated $475M in revenue, but less than $1M in operating cash flows and negative free cash flow.
• 2008 Drivers. In our view, the following factors will drive the stock in 2008: (1) Profitability and cash flow generation; (2) integration of acquired companies; (3) pace of revenue growth.
• Raising 4Q’07 and F’07 estimates. In view of the Corporate Edge acquisition, we are raising our revenue, EBITDA and EPS estimates to $89.7M, $9.3M and $0.11, respectively, from $84.6M, $8.8M and $0.10. We are raising our F’07 estimates to $288M, $26.8M and $0.32, respectively, from $283M, $26.3M and $0.31.
Table 113: InnerWorkings Consensus Snapshot $ in millions, except per-share data INWK Y/Y 4Q'07E F'07E F'08E F'09E F'07E F'08E F'09E JPM Revenue 90 288 472 641 78.9% 63.8% 35.9% EBITDA 9 27 46 65 91.5% 70.7% 42.3% EPS $0.11 $0.32 $0.52 $0.73 52.5% 63.3% 39.4%
Consensus Revenue 87 286 467 625 77.7% 63.4% 33.8% EBITDA 9 26 45 61 84.8% 72.4% 36.6% EPS 0.11 0.32 0.51 0.72 54.0% 59.1% 39.5% Source: Company reports, FactSet, JPMorgan estimates.

184
North America Equity Research 02 January 2008
Imran Khan (1-212) 622-6693 [email protected]
Our Estimates and Outlook for 2008 Taking into account the Corporate Edge acquisition, we now project InnerWorkings to achieve F’08 revenue of $472M, just above the midpoint of company guidance. We note that any further significant acquisitions may push F’08 revenue higher. We now expect F’08 EBITDA of $45.8M, and EPS of $0.52.
The company has stated it expects to grow operating margins ~50-60 bps per year, and our F’08 projections imply a Y/Y 55 bps improvement in operating margin Y/Y. Previously, we had modeled revenue, EBITDA and EPS of $414M, $40.9M and $0.50, respectively.
Our Estimates and Outlook for 2009 We think the company can draw a slightly higher percentage of business from Enterprise clients in F’09, at 64.3%, up from 61.6% in F’08. We are modeling 36% Y/Y revenue growth, to $641M, and projecting ~50 bps operating margin expansion, leading to $65.1M in EBITDA and EPS of $0.73.
Valuation and Rating Analysis INWK is trading at a 18.6x EV/EBITDA multiple based on our F’08 estimate, a premium to the peer group avg. of 19.1x. While INWK is growing revenue at a faster rate than peers, we believe that multiple expansion is unlikely. As a result, we are maintaining our Neutral rating.
Risks to Our Rating The company may outperform our expectations if it is able to grow its sales force organically or through acquisitions faster than expected, if operational leverage is higher than modeled, or if it is able to negotiate better gross margins with its clients.
The company may underperform our expectations as revenue generation is currently concentrated among a few key clients. Additionally, concentration among a group of key suppliers means that a loss of any of these printers from the supplier network could have a significant impact on the depth of printing orders offered, the ability to fulfill orders, the cost savings obtained, and margins. Finally, margin expansion, sales force growth, and client penetration may be slower than expected if competition increases, skilled salesman are difficult to obtain and train, or no viable acquisitions are available.

185
North America Equity Research 02 January 2008
Imran Khan (1-212) 622-6693 [email protected]
Table 114: INWK Annual Income Statement $ in millions, except per share data
FY FY FY FY 2006 2007E 2008E 2009E
Revenue 160.5 288.1 471.8 641.0 Cost of goods sold 124.0 214.9 350.8 475.5 Gross profit 36.5 73.2 121.0 165.5 Gross margin 22.8% 25.4% 25.6% 25.8% Y/Y Improvement (bps) 248 264 24 17 Operating Expenses Commission expense 8.8 17.9 30.0 40.1 General and Administrative Expense 13.3 28.5 45.3 60.3 Stock-based compensation 0.6 1.0 1.4 2.1 Depreciation and amortization 1.0 2.3 3.3 4.3 Total operating expenses 23.7 49.7 79.9 106.7 Income from operations 12.8 23.5 41.1 58.8 Operating Margin 8.0% 8.2% 8.7% 9.2% Y/Y Improvement (bps) 201 16 55 47 EBITDA 14.4 26.8 45.8 65.1 Other income Interest income 0.9 2.5 2.0 2.4 Interest expense (0.1) (0.0) (0.0) (0.0) Minority interest - - - - Other, net (0.0) 0.4 0.6 0.6 Total other income 0.8 2.9 2.6 3.0 Income before taxes 13.6 26.4 43.6 61.8 Income tax expense (5.3) (10.3) (17.0) (24.0) Tax Rate 39.2% 39.1% 38.9% 38.9% Net income 8.3 16.0 26.6 37.7 Dividends on preferred shares - - - - Net income applicable to common shareholders 8.3 16.0 26.6 37.7 Pro Forma Net Income 8.3 16.0 26.6 37.7 Diluted EPS $0.20 $0.32 $0.52 $0.73 Pro Forma Diluted EPS $0.20 $0.32 $0.52 $0.73 Shares outstanding 39.5 50.0 50.9 51.7 % Y/Y growth Revenue 108.8% 79.5% 63.8% 35.9% EBITDA 184.2% 85.8% 70.7% 42.3% Operating income 178.9% 83.0% 74.8% 43.2% EPS 221.4% 59.2% 63.3% 39.4% % of Revenue COGS 77.2% 74.6% 74.4% 74.2% Commission expense 5.5% 6.2% 6.4% 6.3% General and Administrative 8.3% 9.9% 9.6% 9.4% Stock Based compensation 0.3% 0.4% 0.3% 0.3% Source: Company reports and JPMorgan estimates.

186
North America Equity Research 02 January 2008
Imran Khan (1-212) 622-6693 [email protected]
Table 115: INWK Quarterly Income Statement $ in millions, except per share data
FY06 FY07E FY08E 1Q06 2Q06 3Q06 4Q06 1Q07 2Q07 3Q07 4Q07E 1Q08E 2Q08E 3Q08E 4Q08E
Revenue 22.4 35.1 41.8 61.2 58.9 67.3 72.1 89.7 95.8 110.2 119.7 146.1 Cost of goods sold 17.9 28.1 32.2 45.7 44.5 50.1 53.8 66.5 71.3 82.2 89.1 108.2 Gross profit 4.5 7.1 9.5 15.4 14.4 17.2 18.3 23.2 24.4 28.0 30.7 37.9 Gross margin 20.1% 20.1% 22.8% 25.2% 24.4% 25.6% 25.4% 25.9% 25.5% 25.4% 25.6% 25.9% Y/Y Improvement (bps) (16) (94) 240 573 433 546 258 68 108 (16) 18 3 Operating Expenses Commission expense 0.9 1.7 2.3 3.9 3.9 4.2 4.0 5.8 6.2 6.9 7.5 9.5 General and Administrative Expense 2.1 2.3 3.2 5.8 6.0 6.7 7.6 8.2 9.5 10.5 11.7 13.6 Stock-based compensation - 0.1 0.2 0.3 0.3 0.2 0.2 0.3 0.3 0.3 0.4 0.4 Depreciation and amortization 0.1 0.2 0.2 0.5 0.4 0.5 0.6 0.7 0.8 0.8 0.8 0.9 Total operating expenses 3.1 4.3 5.9 10.4 10.6 11.6 12.5 14.9 16.7 18.5 20.4 24.4 Income from operations 1.4 2.8 3.6 5.1 3.8 5.6 5.8 8.3 7.7 9.6 10.3 13.5 Operating Margin 6.1% 7.9% 8.7% 8.3% 6.4% 8.3% 8.1% 9.3% 8.1% 8.7% 8.6% 9.2% Y/Y Improvement (bps) 161 180 191 239 34 37 (64) 100 166 37 51 (2) EBITDA 1.5 3.1 4.1 5.8 4.5 6.3 6.7 9.3 8.8 10.7 11.5 14.8 Other income Interest income 0.1 0.1 0.3 0.4 0.6 0.6 0.6 0.7 0.5 0.5 0.5 0.5 Interest expense (0.1) (0.0) (0.1) - - (0.0) (0.0) (0.0) (0.0) (0.0) (0.0) (0.0) Minority interest - - - - - - - - - - - Other, net (0.0) 0.0 (0.0) (0.0) (0.0) 0.1 0.1 0.1 0.1 0.1 0.1 0.1 Total other income 0.0 0.0 0.2 0.4 0.6 0.7 0.8 0.8 0.6 0.6 0.6 0.6 Income before taxes 1.4 2.8 3.9 5.5 4.3 6.3 6.6 9.1 8.4 10.2 10.9 14.1 Income tax expense (0.6) (1.1) (1.5) (2.1) (1.7) (2.5) (2.6) (3.6) (3.2) (4.0) (4.3) (5.5) Tax Rate 41.4% 39.2% 39.1% 38.6% 38.6% 39.1% 39.0% 39.5% 38.6% 39.0% 39.0% 39.0% Net income 0.8 1.7 2.4 3.4 2.7 3.8 4.0 5.5 5.1 6.2 6.7 8.6 Dividends on preferred shares - - - - - - - - - - - Net income applicable to common shareholders 0.8 1.7 2.4 3.4 2.7 3.8 4.0 5.5 5.1 6.2 6.7 8.6 Pro Forma Net Income 0.8 1.7 2.4 3.4 2.7 3.8 4.0 5.5 5.1 6.2 6.7 8.6 Diluted EPS $0.02 $0.05 $0.05 $0.07 $0.05 $0.08 $0.08 $0.11 $0.10 $0.12 $0.13 $0.17 Pro Forma Diluted EPS $0.02 $0.05 $0.05 $0.07 $0.05 $0.08 $0.08 $0.11 $0.10 $0.12 $0.13 $0.17 Shares outstanding 33.1 33.1 43.6 48.1 49.3 50.1 50.2 50.4 50.6 50.8 51.0 51.2 % Q/Q growth Revenue 0.9% 56.6% 18.9% 46.4% -3.6% 14.2% 7.2% 24.3% 6.8% 15.0% 8.7% 22.0% EBITDA 5.2% 104.1% 32.2% 41.2% -22.0% 40.8% 6.1% 38.1% -5.2% 21.5% 7.4% 29.1% Operating income 4.6% 104.0% 30.7% 38.8% -25.1% 47.6% 4.3% 42.5% -6.7% 23.4% 7.6% 31.4%

187
North America Equity Research 02 January 2008
Imran Khan (1-212) 622-6693 [email protected]
EPS % Y/Y growth Revenue 80.6% 87.5% 78.1% 174.9% 162.7% 91.5% 72.7% 46.6% 62.5% 63.7% 66.0% 62.9% EBITDA 127.4% 141.7% 139.8% 300.6% 197.3% 105.1% 64.7% 61.1% 95.7% 68.8% 70.8% 59.7% Operating income 145.9% 142.5% 128.2% 287.2% 177.2% 100.5% 60.0% 64.3% 104.6% 71.0% 76.3% 62.6% EPS % of Revenue COGS 79.9% 79.9% 77.2% 74.8% 75.6% 74.4% 74.6% 74.1% 74.5% 74.6% 74.4% 74.1% Commission expense 4.0% 4.9% 5.5% 6.4% 6.6% 6.3% 5.5% 6.4% 6.4% 6.2% 6.2% 6.5% General and Administrative 9.3% 6.5% 7.6% 9.4% 10.2% 9.9% 10.6% 9.1% 9.9% 9.5% 9.8% 9.3% Stock Based compensation 0.0% 0.3% 0.5% 0.4% 0.5% 0.4% 0.3% 0.3% 0.3% 0.3% 0.3% 0.3% Source: Company reports and JPMorgan estimates.

188
North America Equity Research 02 January 2008
Imran Khan (1-212) 622-6693 [email protected]
Table 116: INWK Annual Balance Sheet $ in millions
FY FY FY FY 2006 2007E 2008E 2009E
Assets Current Assets: Cash and cash equivalents 20.6 26.2 35.6 61.4 Marketable securities 10.0 16.0 16.0 16.0 Accounts receivable 45.0 69.7 113.5 148.3 Unbilled revenue 4.7 9.8 9.8 9.8 Inventories 2.1 Prepaid expenses 5.5 4.3 4.3 4.3 Advances to related parties 0.1 0.1 0.1 0.1 Deferred income taxes 0.3 0.8 0.8 0.8 Other current assets 1.3 2.0 2.0 2.0 Total current assets 89.5 128.8 182.0 242.6 - - - - Property and equipment, net 2.8 3.6 3.6 3.6 - - - - Intangibles and other assets: - - - - Goodwill 9.7 15.6 15.6 15.6 Intangible assets 6.5 8.0 8.0 8.0 Deposits 0.2 0.2 0.2 0.2 Investment 0.1 0.1 0.1 0.1 Deferred income taxes 4.5 4.1 4.1 4.1 Other assets 0.0 0.0 0.0 0.0 Total intangibles and other assets 21.2 28.1 28.1 28.1 - - - - Total assets 113.5 160.5 213.7 274.3 - - - - Liabilities and stockholders' deficit/members equity - - - - Current liabilities: - - - - Accounts payable - trade 24.0 38.2 62.2 81.0 Advances from related parties 0.2 - - - Due to seller 1.6 0.6 0.6 0.6 Distribution payable - - - - Outstanding line of credit - - - - Current maturities of capital lease obligations 0.1 0.1 0.1 0.1 Customer deposits 1.9 2.3 2.3 2.3 Other liabilities 0.8 1.2 1.2 1.2 Deferred revenue 0.2 - - - Accrued expenses 3.0 3.5 3.5 3.5 Total current liabilities 31.8 45.9 70.0 88.8 Capital lease obligations, less current maturities 0.2 0.2 0.2 0.2 Mandatorily redeemable preferred stock - Class D - 0.0 0.0 0.0 Total liabilities 32.1 46.1 70.1 88.9 - - - - Class C, Convertible redeemable preferred shares - - - - Class D, Convertible redeemable preferred shares - - - - Class E, Convertible redeemable preferred shares - - - - - - - - Stockholders' deficit/member's equity: - - - - Total stockholders' equity 81.5 114.4 143.6 185.3 - - - - Total liabilities and stockholders' deficit/members' equity 113.5 160.5 213.7 274.3 Source: Company reports and JPMorgan estimates.
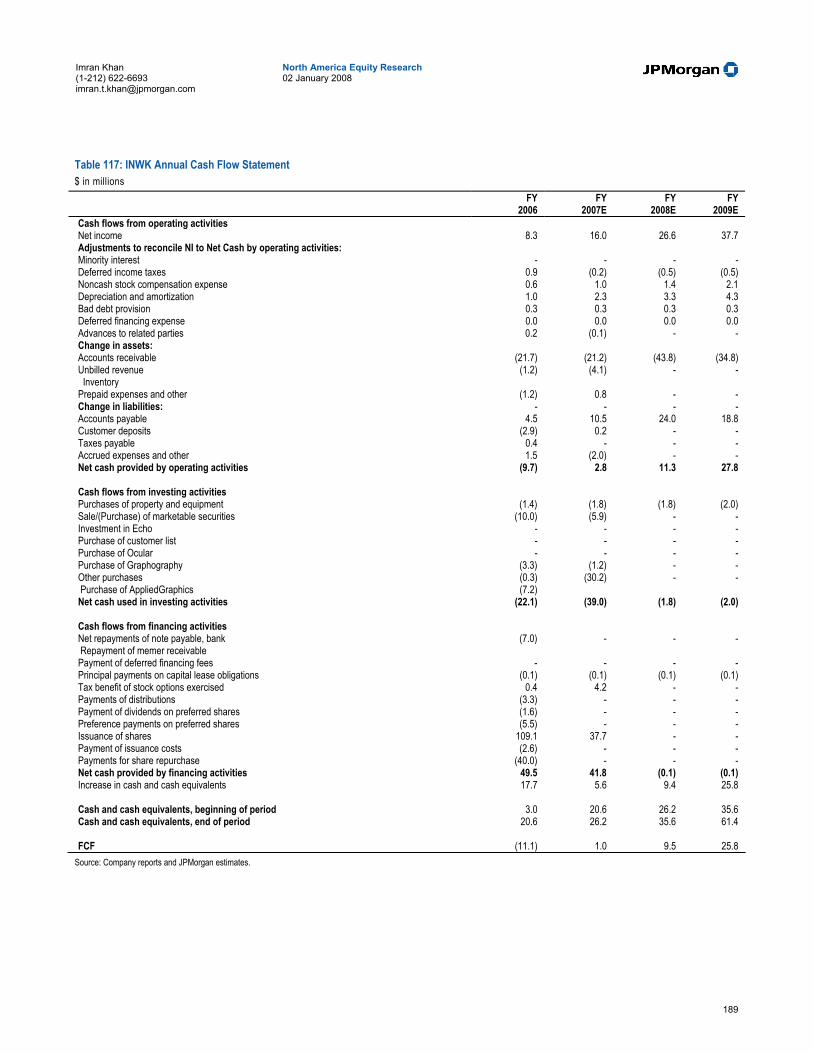
189
North America Equity Research 02 January 2008
Imran Khan (1-212) 622-6693 [email protected]
Table 117: INWK Annual Cash Flow Statement $ in millions
FY FY FY FY 2006 2007E 2008E 2009E
Cash flows from operating activities Net income 8.3 16.0 26.6 37.7 Adjustments to reconcile NI to Net Cash by operating activities: Minority interest - - - - Deferred income taxes 0.9 (0.2) (0.5) (0.5) Noncash stock compensation expense 0.6 1.0 1.4 2.1 Depreciation and amortization 1.0 2.3 3.3 4.3 Bad debt provision 0.3 0.3 0.3 0.3 Deferred financing expense 0.0 0.0 0.0 0.0 Advances to related parties 0.2 (0.1) - - Change in assets: Accounts receivable (21.7) (21.2) (43.8) (34.8) Unbilled revenue (1.2) (4.1) - - Inventory Prepaid expenses and other (1.2) 0.8 - - Change in liabilities: - - - - Accounts payable 4.5 10.5 24.0 18.8 Customer deposits (2.9) 0.2 - - Taxes payable 0.4 - - - Accrued expenses and other 1.5 (2.0) - - Net cash provided by operating activities (9.7) 2.8 11.3 27.8 Cash flows from investing activities Purchases of property and equipment (1.4) (1.8) (1.8) (2.0) Sale/(Purchase) of marketable securities (10.0) (5.9) - - Investment in Echo - - - - Purchase of customer list - - - - Purchase of Ocular - - - - Purchase of Graphography (3.3) (1.2) - - Other purchases (0.3) (30.2) - - Purchase of AppliedGraphics (7.2) Net cash used in investing activities (22.1) (39.0) (1.8) (2.0) Cash flows from financing activities Net repayments of note payable, bank (7.0) - - - Repayment of memer receivable Payment of deferred financing fees - - - - Principal payments on capital lease obligations (0.1) (0.1) (0.1) (0.1) Tax benefit of stock options exercised 0.4 4.2 - - Payments of distributions (3.3) - - - Payment of dividends on preferred shares (1.6) - - - Preference payments on preferred shares (5.5) - - - Issuance of shares 109.1 37.7 - - Payment of issuance costs (2.6) - - - Payments for share repurchase (40.0) - - - Net cash provided by financing activities 49.5 41.8 (0.1) (0.1) Increase in cash and cash equivalents 17.7 5.6 9.4 25.8 Cash and cash equivalents, beginning of period 3.0 20.6 26.2 35.6 Cash and cash equivalents, end of period 20.6 26.2 35.6 61.4 FCF (11.1) 1.0 9.5 25.8 Source: Company reports and JPMorgan estimates.

190
North America Equity Research 02 January 2008
Imran Khan (1-212) 622-6693 [email protected]
Liberty Interactive, Neutral ($19.79) We are maintaining our Neutral rating on the Liberty Interactive tracking stock because we believe that the company will face challenging growth in F’08 as the domestic arm of QVC faces a difficult retail environment in a tightening economy and as turnaround efforts at QVC Germany may last longer. Additionally, we note that QVC Japan will not completely comp health and beauty declines until 4Q'08.
• Domestic QVC growth slowing amongst increased competition and a tightening economy. We are modeling F’08 Y/Y growth of 3% following F'07E's growth of 4%. We are concerned with recent domestic performance weakness due to slowing consumer spending and see this continuing as the consumer weathers the sub-prime lending fallout. We also believe that competition for nationally branded merchandise has become stiffer with HSN’s re-merchandising strategy and that this may further pressure margins.
• We believe int’l expansion efforts will be put on hold until current problems are addressed. At the beginning of 2007, the int'l markets could not have looked brighter with QVC Japan revenues growing 20% Y/Y in F'06, total int'l revenue growth of 12%, and the company positioning itself for entry into the China market. However, this year we expect F’08 int'l revenue growth of only 1% as the company struggles to perfect its merchandising strategy in Germany and as Japan health and beauty sales (~21% of business a year ago) plummet due to increased regulatory scrutiny. We now think that the company will put further expansion efforts on hold until these weaknesses are addressed.
• QVC margin pressure likely. We expect int’l margins to continue to be pressured as investments are made to drive the Germany and Japan turnarounds. Furthermore, we believe domestic margins might be pressured due to possible inventory buildup in the slowing sales economy and pricing pressure from increased HSN competition. As such, we are modeling F’08 QVC operating cash flow margins as remaining roughly flat with F’07E's depressed levels.
• 2008 Drivers. In our view, the following factors will drive LINTA shares in 2008: (1) clearance of old inventory in Germany, (2) comping Japan health and beauty losses, and (3) improved US economic conditions.
• Maintaining 4Q'07 estimates. We maintain our 4Q’07 revenue, EBITDA, and EPS estimates of $2.40B, $569M, and $0.32 (Y/Y growth of 3.8%, 0.7%, and (26%) respectively).
Our current and newly introduced 2009 estimates are in the table below:
Table 118: Liberty Interactive Financial Snapshot $ in millions, except per share data Liberty Interactive 4Q'07E F'07E F'08E F'09E F'07E Y/Y F'08E Y/Y F'09E Y/Y JPMorgan Revenue 2,398.82 7,720.82 8,094.31 8,583.14 5.39% 4.84% 6.04% EBITDA 569.09 1,707.09 1,765.73 1,871.07 1.61% 3.43% 5.97% EPS 0.32 0.74 0.80 0.89 0.91% 8.57% 11.52% Consensus Revenue 2,417.00 7,734.00 8,156.00 8,727.00 5.46% 7.00% EBITDA 575.00 1,667.00 1,775.00 1,952.00 6.48% 9.97% EPS 0.30 0.72 0.79 1.02 9.72% 29.11% Source: JPMorgan estimates, Company data, and Factset
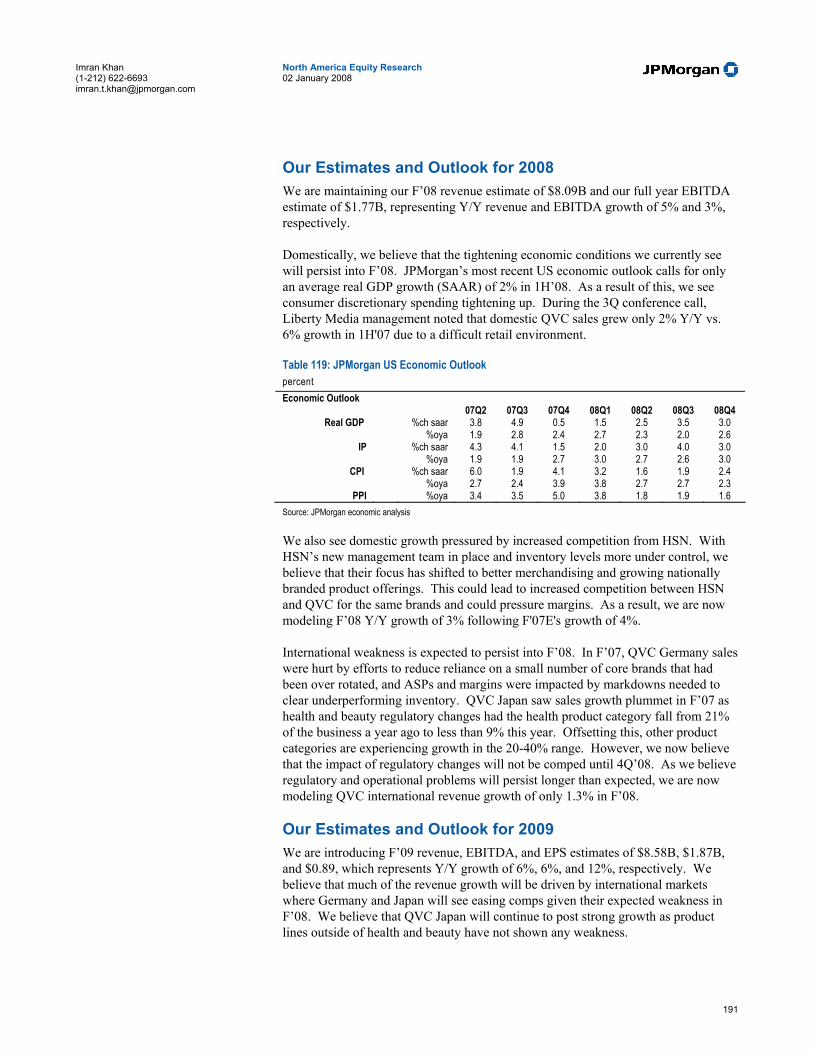
191
North America Equity Research 02 January 2008
Imran Khan (1-212) 622-6693 [email protected]
Our Estimates and Outlook for 2008 We are maintaining our F’08 revenue estimate of $8.09B and our full year EBITDA estimate of $1.77B, representing Y/Y revenue and EBITDA growth of 5% and 3%, respectively.
Domestically, we believe that the tightening economic conditions we currently see will persist into F’08. JPMorgan’s most recent US economic outlook calls for only an average real GDP growth (SAAR) of 2% in 1H’08. As a result of this, we see consumer discretionary spending tightening up. During the 3Q conference call, Liberty Media management noted that domestic QVC sales grew only 2% Y/Y vs. 6% growth in 1H'07 due to a difficult retail environment.
Table 119: JPMorgan US Economic Outlook percent Economic Outlook
07Q2 07Q3 07Q4 08Q1 08Q2 08Q3 08Q4 Real GDP %ch saar 3.8 4.9 0.5 1.5 2.5 3.5 3.0
%oya 1.9 2.8 2.4 2.7 2.3 2.0 2.6 IP %ch saar 4.3 4.1 1.5 2.0 3.0 4.0 3.0
%oya 1.9 1.9 2.7 3.0 2.7 2.6 3.0 CPI %ch saar 6.0 1.9 4.1 3.2 1.6 1.9 2.4
%oya 2.7 2.4 3.9 3.8 2.7 2.7 2.3 PPI %oya 3.4 3.5 5.0 3.8 1.8 1.9 1.6
Source: JPMorgan economic analysis We also see domestic growth pressured by increased competition from HSN. With HSN’s new management team in place and inventory levels more under control, we believe that their focus has shifted to better merchandising and growing nationally branded product offerings. This could lead to increased competition between HSN and QVC for the same brands and could pressure margins. As a result, we are now modeling F’08 Y/Y growth of 3% following F'07E's growth of 4%.
International weakness is expected to persist into F’08. In F’07, QVC Germany sales were hurt by efforts to reduce reliance on a small number of core brands that had been over rotated, and ASPs and margins were impacted by markdowns needed to clear underperforming inventory. QVC Japan saw sales growth plummet in F’07 as health and beauty regulatory changes had the health product category fall from 21% of the business a year ago to less than 9% this year. Offsetting this, other product categories are experiencing growth in the 20-40% range. However, we now believe that the impact of regulatory changes will not be comped until 4Q’08. As we believe regulatory and operational problems will persist longer than expected, we are now modeling QVC international revenue growth of only 1.3% in F’08.
Our Estimates and Outlook for 2009 We are introducing F’09 revenue, EBITDA, and EPS estimates of $8.58B, $1.87B, and $0.89, which represents Y/Y growth of 6%, 6%, and 12%, respectively. We believe that much of the revenue growth will be driven by international markets where Germany and Japan will see easing comps given their expected weakness in F’08. We believe that QVC Japan will continue to post strong growth as product lines outside of health and beauty have not shown any weakness.

192
North America Equity Research 02 January 2008
Imran Khan (1-212) 622-6693 [email protected]
Valuation and Rating Analysis LINTA is trading at a 10x EV/EBITDA multiple on our F’08 EBITDA estimate of $1.77B, which is a discount to the peer group average of 19x EBITDA in F’08E. Given that we expect F’08 EBITDA growth of only 3% vs. the peer group average of 36%, we believe that this discount is justified and that the stock will trade in line with its peers.
Risks to Our Rating QVC could outperform our estimates if German operational difficulties are turned around faster than expected, the Japan regulatory environment shifts, or domestic economic conditions recover. Outperformance might also occur if strategic acquisitions are made in the e-commerce space.
QVC growth could slow if increased competition from HSN and Shop NBC decreases domestic market share, weakness in jewelry persists, or if increased programming costs hinder margin growth. Furthermore, QVC Japan could encounter additional difficulties if more product lines come under regulatory scrutiny.
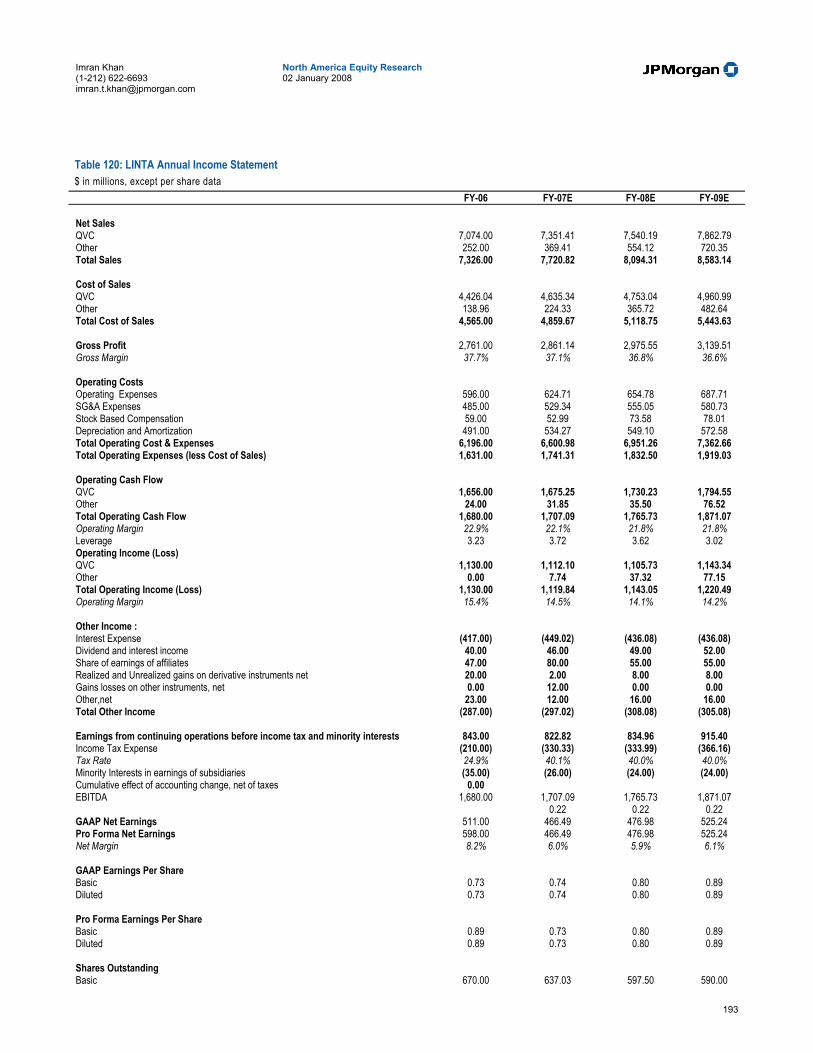
193
North America Equity Research 02 January 2008
Imran Khan (1-212) 622-6693 [email protected]
Table 120: LINTA Annual Income Statement $ in millions, except per share data
FY-06 FY-07E FY-08E FY-09E
Net Sales QVC 7,074.00 7,351.41 7,540.19 7,862.79 Other 252.00 369.41 554.12 720.35 Total Sales 7,326.00 7,720.82 8,094.31 8,583.14
Cost of Sales QVC 4,426.04 4,635.34 4,753.04 4,960.99 Other 138.96 224.33 365.72 482.64 Total Cost of Sales 4,565.00 4,859.67 5,118.75 5,443.63
Gross Profit 2,761.00 2,861.14 2,975.55 3,139.51 Gross Margin 37.7% 37.1% 36.8% 36.6%
Operating Costs Operating Expenses 596.00 624.71 654.78 687.71 SG&A Expenses 485.00 529.34 555.05 580.73 Stock Based Compensation 59.00 52.99 73.58 78.01 Depreciation and Amortization 491.00 534.27 549.10 572.58 Total Operating Cost & Expenses 6,196.00 6,600.98 6,951.26 7,362.66 Total Operating Expenses (less Cost of Sales) 1,631.00 1,741.31 1,832.50 1,919.03
Operating Cash Flow QVC 1,656.00 1,675.25 1,730.23 1,794.55 Other 24.00 31.85 35.50 76.52 Total Operating Cash Flow 1,680.00 1,707.09 1,765.73 1,871.07 Operating Margin 22.9% 22.1% 21.8% 21.8% Leverage 3.23 3.72 3.62 3.02 Operating Income (Loss) QVC 1,130.00 1,112.10 1,105.73 1,143.34 Other 0.00 7.74 37.32 77.15 Total Operating Income (Loss) 1,130.00 1,119.84 1,143.05 1,220.49 Operating Margin 15.4% 14.5% 14.1% 14.2%
Other Income : Interest Expense (417.00) (449.02) (436.08) (436.08) Dividend and interest income 40.00 46.00 49.00 52.00 Share of earnings of affiliates 47.00 80.00 55.00 55.00 Realized and Unrealized gains on derivative instruments net 20.00 2.00 8.00 8.00 Gains losses on other instruments, net 0.00 12.00 0.00 0.00 Other,net 23.00 12.00 16.00 16.00 Total Other Income (287.00) (297.02) (308.08) (305.08)
Earnings from continuing operations before income tax and minority interests 843.00 822.82 834.96 915.40 Income Tax Expense (210.00) (330.33) (333.99) (366.16) Tax Rate 24.9% 40.1% 40.0% 40.0% Minority Interests in earnings of subsidiaries (35.00) (26.00) (24.00) (24.00) Cumulative effect of accounting change, net of taxes 0.00 EBITDA 1,680.00 1,707.09 1,765.73 1,871.07 0.22 0.22 0.22 GAAP Net Earnings 511.00 466.49 476.98 525.24 Pro Forma Net Earnings 598.00 466.49 476.98 525.24 Net Margin 8.2% 6.0% 5.9% 6.1% GAAP Earnings Per Share Basic 0.73 0.74 0.80 0.89 Diluted 0.73 0.74 0.80 0.89 Pro Forma Earnings Per Share Basic 0.89 0.73 0.80 0.89 Diluted 0.89 0.73 0.80 0.89 Shares Outstanding Basic 670.00 637.03 597.50 590.00

194
North America Equity Research 02 January 2008
Imran Khan (1-212) 622-6693 [email protected]
FY-06 FY-07E FY-08E FY-09E Diluted 670.00 638.28 597.50 590.00 As a % of Net Sales Other Cost of Sales Cost of Sales 62.3% 62.9% 63.2% 63.4% Operating Expenses 8.1% 8.1% 8.1% 8.0% SG&A Expenses 6.6% 6.9% 6.9% 6.8% Y/Y Change Net Sales 12.7% 5.4% 4.8% 6.0% QVC Sales 8.8% 3.9% 2.6% 4.3% Other Sales 46.6% 50.0% 30.0% Cost of Sales 11.0% 6.5% 5.3% 6.3% SG&A Expenses 20.6% 9.1% 4.9% 4.6% Depreciation and Amortization 844.2% 8.8% 2.8% 4.3% Stock Based Compensation -86.9% -10.2% 38.9% 6.0% Operating Cash Flow 18.7% 1.6% 3.4% 6.0% Operating Income 23.4% -0.9% 2.1% 6.8% Source: Company reports and JPMorgan estimates.
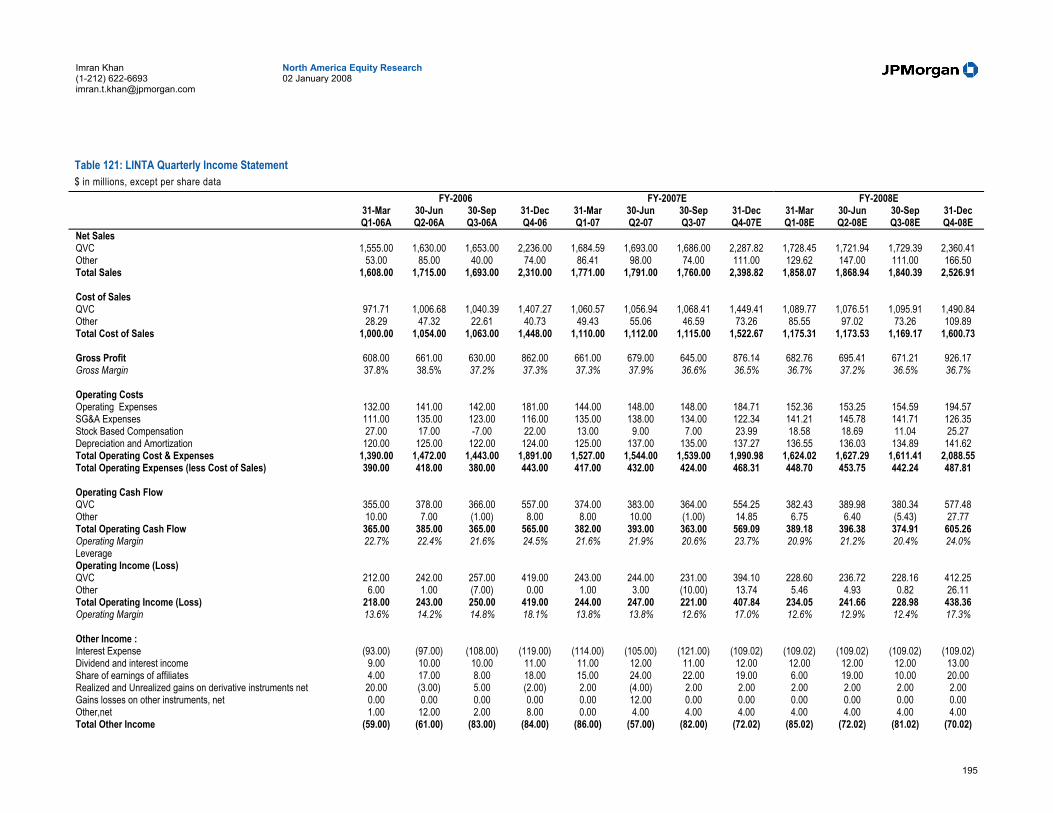
195
North America Equity Research 02 January 2008
Imran Khan (1-212) 622-6693 [email protected]
Table 121: LINTA Quarterly Income Statement $ in millions, except per share data
FY-2006 FY-2007E FY-2008E 31-Mar 30-Jun 30-Sep 31-Dec 31-Mar 30-Jun 30-Sep 31-Dec 31-Mar 30-Jun 30-Sep 31-Dec Q1-06A Q2-06A Q3-06A Q4-06 Q1-07 Q2-07 Q3-07 Q4-07E Q1-08E Q2-08E Q3-08E Q4-08E
Net Sales QVC 1,555.00 1,630.00 1,653.00 2,236.00 1,684.59 1,693.00 1,686.00 2,287.82 1,728.45 1,721.94 1,729.39 2,360.41 Other 53.00 85.00 40.00 74.00 86.41 98.00 74.00 111.00 129.62 147.00 111.00 166.50 Total Sales 1,608.00 1,715.00 1,693.00 2,310.00 1,771.00 1,791.00 1,760.00 2,398.82 1,858.07 1,868.94 1,840.39 2,526.91
Cost of Sales QVC 971.71 1,006.68 1,040.39 1,407.27 1,060.57 1,056.94 1,068.41 1,449.41 1,089.77 1,076.51 1,095.91 1,490.84 Other 28.29 47.32 22.61 40.73 49.43 55.06 46.59 73.26 85.55 97.02 73.26 109.89 Total Cost of Sales 1,000.00 1,054.00 1,063.00 1,448.00 1,110.00 1,112.00 1,115.00 1,522.67 1,175.31 1,173.53 1,169.17 1,600.73
Gross Profit 608.00 661.00 630.00 862.00 661.00 679.00 645.00 876.14 682.76 695.41 671.21 926.17 Gross Margin 37.8% 38.5% 37.2% 37.3% 37.3% 37.9% 36.6% 36.5% 36.7% 37.2% 36.5% 36.7%
Operating Costs Operating Expenses 132.00 141.00 142.00 181.00 144.00 148.00 148.00 184.71 152.36 153.25 154.59 194.57 SG&A Expenses 111.00 135.00 123.00 116.00 135.00 138.00 134.00 122.34 141.21 145.78 141.71 126.35 Stock Based Compensation 27.00 17.00 -7.00 22.00 13.00 9.00 7.00 23.99 18.58 18.69 11.04 25.27 Depreciation and Amortization 120.00 125.00 122.00 124.00 125.00 137.00 135.00 137.27 136.55 136.03 134.89 141.62 Total Operating Cost & Expenses 1,390.00 1,472.00 1,443.00 1,891.00 1,527.00 1,544.00 1,539.00 1,990.98 1,624.02 1,627.29 1,611.41 2,088.55 Total Operating Expenses (less Cost of Sales) 390.00 418.00 380.00 443.00 417.00 432.00 424.00 468.31 448.70 453.75 442.24 487.81
Operating Cash Flow QVC 355.00 378.00 366.00 557.00 374.00 383.00 364.00 554.25 382.43 389.98 380.34 577.48 Other 10.00 7.00 (1.00) 8.00 8.00 10.00 (1.00) 14.85 6.75 6.40 (5.43) 27.77 Total Operating Cash Flow 365.00 385.00 365.00 565.00 382.00 393.00 363.00 569.09 389.18 396.38 374.91 605.26 Operating Margin 22.7% 22.4% 21.6% 24.5% 21.6% 21.9% 20.6% 23.7% 20.9% 21.2% 20.4% 24.0% Leverage Operating Income (Loss) QVC 212.00 242.00 257.00 419.00 243.00 244.00 231.00 394.10 228.60 236.72 228.16 412.25 Other 6.00 1.00 (7.00) 0.00 1.00 3.00 (10.00) 13.74 5.46 4.93 0.82 26.11 Total Operating Income (Loss) 218.00 243.00 250.00 419.00 244.00 247.00 221.00 407.84 234.05 241.66 228.98 438.36 Operating Margin 13.6% 14.2% 14.8% 18.1% 13.8% 13.8% 12.6% 17.0% 12.6% 12.9% 12.4% 17.3%
Other Income : Interest Expense (93.00) (97.00) (108.00) (119.00) (114.00) (105.00) (121.00) (109.02) (109.02) (109.02) (109.02) (109.02) Dividend and interest income 9.00 10.00 10.00 11.00 11.00 12.00 11.00 12.00 12.00 12.00 12.00 13.00 Share of earnings of affiliates 4.00 17.00 8.00 18.00 15.00 24.00 22.00 19.00 6.00 19.00 10.00 20.00 Realized and Unrealized gains on derivative instruments net 20.00 (3.00) 5.00 (2.00) 2.00 (4.00) 2.00 2.00 2.00 2.00 2.00 2.00 Gains losses on other instruments, net 0.00 0.00 0.00 0.00 0.00 12.00 0.00 0.00 0.00 0.00 0.00 0.00 Other,net 1.00 12.00 2.00 8.00 0.00 4.00 4.00 4.00 4.00 4.00 4.00 4.00 Total Other Income (59.00) (61.00) (83.00) (84.00) (86.00) (57.00) (82.00) (72.02) (85.02) (72.02) (81.02) (70.02)
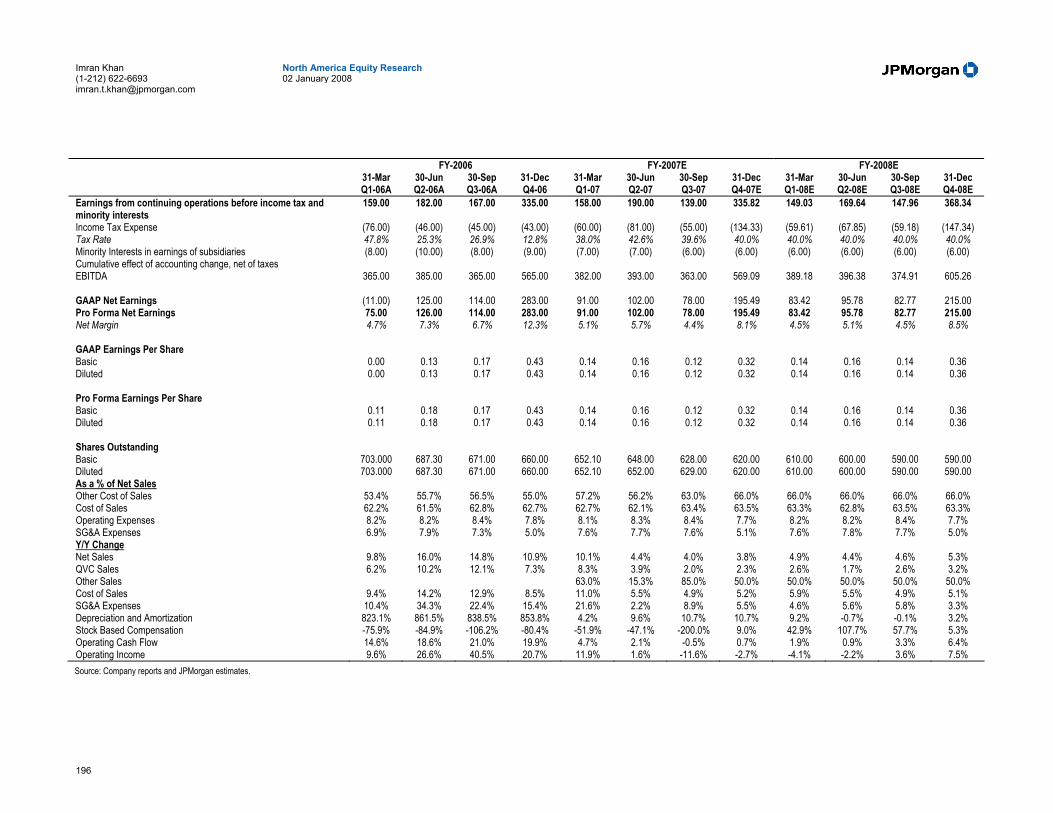
196
North America Equity Research 02 January 2008
Imran Khan (1-212) 622-6693 [email protected]
FY-2006 FY-2007E FY-2008E 31-Mar 30-Jun 30-Sep 31-Dec 31-Mar 30-Jun 30-Sep 31-Dec 31-Mar 30-Jun 30-Sep 31-Dec Q1-06A Q2-06A Q3-06A Q4-06 Q1-07 Q2-07 Q3-07 Q4-07E Q1-08E Q2-08E Q3-08E Q4-08E
Earnings from continuing operations before income tax and minority interests
159.00 182.00 167.00 335.00 158.00 190.00 139.00 335.82 149.03 169.64 147.96 368.34
Income Tax Expense (76.00) (46.00) (45.00) (43.00) (60.00) (81.00) (55.00) (134.33) (59.61) (67.85) (59.18) (147.34) Tax Rate 47.8% 25.3% 26.9% 12.8% 38.0% 42.6% 39.6% 40.0% 40.0% 40.0% 40.0% 40.0% Minority Interests in earnings of subsidiaries (8.00) (10.00) (8.00) (9.00) (7.00) (7.00) (6.00) (6.00) (6.00) (6.00) (6.00) (6.00) Cumulative effect of accounting change, net of taxes EBITDA 365.00 385.00 365.00 565.00 382.00 393.00 363.00 569.09 389.18 396.38 374.91 605.26 GAAP Net Earnings (11.00) 125.00 114.00 283.00 91.00 102.00 78.00 195.49 83.42 95.78 82.77 215.00 Pro Forma Net Earnings 75.00 126.00 114.00 283.00 91.00 102.00 78.00 195.49 83.42 95.78 82.77 215.00 Net Margin 4.7% 7.3% 6.7% 12.3% 5.1% 5.7% 4.4% 8.1% 4.5% 5.1% 4.5% 8.5% GAAP Earnings Per Share Basic 0.00 0.13 0.17 0.43 0.14 0.16 0.12 0.32 0.14 0.16 0.14 0.36 Diluted 0.00 0.13 0.17 0.43 0.14 0.16 0.12 0.32 0.14 0.16 0.14 0.36 Pro Forma Earnings Per Share Basic 0.11 0.18 0.17 0.43 0.14 0.16 0.12 0.32 0.14 0.16 0.14 0.36 Diluted 0.11 0.18 0.17 0.43 0.14 0.16 0.12 0.32 0.14 0.16 0.14 0.36 Shares Outstanding Basic 703.000 687.30 671.00 660.00 652.10 648.00 628.00 620.00 610.00 600.00 590.00 590.00 Diluted 703.000 687.30 671.00 660.00 652.10 652.00 629.00 620.00 610.00 600.00 590.00 590.00 As a % of Net Sales Other Cost of Sales 53.4% 55.7% 56.5% 55.0% 57.2% 56.2% 63.0% 66.0% 66.0% 66.0% 66.0% 66.0% Cost of Sales 62.2% 61.5% 62.8% 62.7% 62.7% 62.1% 63.4% 63.5% 63.3% 62.8% 63.5% 63.3% Operating Expenses 8.2% 8.2% 8.4% 7.8% 8.1% 8.3% 8.4% 7.7% 8.2% 8.2% 8.4% 7.7% SG&A Expenses 6.9% 7.9% 7.3% 5.0% 7.6% 7.7% 7.6% 5.1% 7.6% 7.8% 7.7% 5.0% Y/Y Change Net Sales 9.8% 16.0% 14.8% 10.9% 10.1% 4.4% 4.0% 3.8% 4.9% 4.4% 4.6% 5.3% QVC Sales 6.2% 10.2% 12.1% 7.3% 8.3% 3.9% 2.0% 2.3% 2.6% 1.7% 2.6% 3.2% Other Sales 63.0% 15.3% 85.0% 50.0% 50.0% 50.0% 50.0% 50.0% Cost of Sales 9.4% 14.2% 12.9% 8.5% 11.0% 5.5% 4.9% 5.2% 5.9% 5.5% 4.9% 5.1% SG&A Expenses 10.4% 34.3% 22.4% 15.4% 21.6% 2.2% 8.9% 5.5% 4.6% 5.6% 5.8% 3.3% Depreciation and Amortization 823.1% 861.5% 838.5% 853.8% 4.2% 9.6% 10.7% 10.7% 9.2% -0.7% -0.1% 3.2% Stock Based Compensation -75.9% -84.9% -106.2% -80.4% -51.9% -47.1% -200.0% 9.0% 42.9% 107.7% 57.7% 5.3% Operating Cash Flow 14.6% 18.6% 21.0% 19.9% 4.7% 2.1% -0.5% 0.7% 1.9% 0.9% 3.3% 6.4% Operating Income 9.6% 26.6% 40.5% 20.7% 11.9% 1.6% -11.6% -2.7% -4.1% -2.2% 3.6% 7.5% Source: Company reports and JPMorgan estimates.
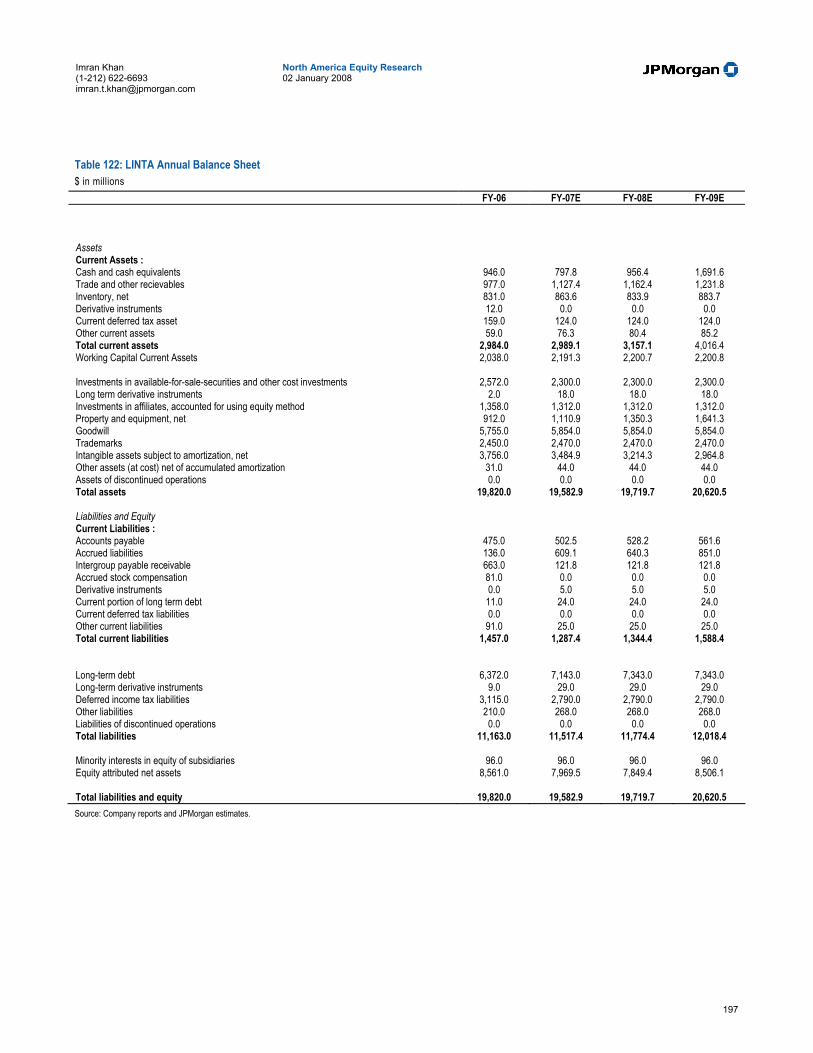
197
North America Equity Research 02 January 2008
Imran Khan (1-212) 622-6693 [email protected]
Table 122: LINTA Annual Balance Sheet $ in millions
FY-06 FY-07E FY-08E FY-09E
Assets Current Assets : Cash and cash equivalents 946.0 797.8 956.4 1,691.6 Trade and other recievables 977.0 1,127.4 1,162.4 1,231.8 Inventory, net 831.0 863.6 833.9 883.7 Derivative instruments 12.0 0.0 0.0 0.0 Current deferred tax asset 159.0 124.0 124.0 124.0 Other current assets 59.0 76.3 80.4 85.2 Total current assets 2,984.0 2,989.1 3,157.1 4,016.4 Working Capital Current Assets 2,038.0 2,191.3 2,200.7 2,200.8
Investments in available-for-sale-securities and other cost investments 2,572.0 2,300.0 2,300.0 2,300.0 Long term derivative instruments 2.0 18.0 18.0 18.0 Investments in affiliates, accounted for using equity method 1,358.0 1,312.0 1,312.0 1,312.0 Property and equipment, net 912.0 1,110.9 1,350.3 1,641.3 Goodwill 5,755.0 5,854.0 5,854.0 5,854.0 Trademarks 2,450.0 2,470.0 2,470.0 2,470.0 Intangible assets subject to amortization, net 3,756.0 3,484.9 3,214.3 2,964.8 Other assets (at cost) net of accumulated amortization 31.0 44.0 44.0 44.0 Assets of discontinued operations 0.0 0.0 0.0 0.0 Total assets 19,820.0 19,582.9 19,719.7 20,620.5
Liabilities and Equity Current Liabilities : Accounts payable 475.0 502.5 528.2 561.6 Accrued liabilities 136.0 609.1 640.3 851.0 Intergroup payable receivable 663.0 121.8 121.8 121.8 Accrued stock compensation 81.0 0.0 0.0 0.0 Derivative instruments 0.0 5.0 5.0 5.0 Current portion of long term debt 11.0 24.0 24.0 24.0 Current deferred tax liabilities 0.0 0.0 0.0 0.0 Other current liabilities 91.0 25.0 25.0 25.0 Total current liabilities 1,457.0 1,287.4 1,344.4 1,588.4
Long-term debt 6,372.0 7,143.0 7,343.0 7,343.0 Long-term derivative instruments 9.0 29.0 29.0 29.0 Deferred income tax liabilities 3,115.0 2,790.0 2,790.0 2,790.0 Other liabilities 210.0 268.0 268.0 268.0 Liabilities of discontinued operations 0.0 0.0 0.0 0.0 Total liabilities 11,163.0 11,517.4 11,774.4 12,018.4
Minority interests in equity of subsidiaries 96.0 96.0 96.0 96.0 Equity attributed net assets 8,561.0 7,969.5 7,849.4 8,506.1
Total liabilities and equity 19,820.0 19,582.9 19,719.7 20,620.5 Source: Company reports and JPMorgan estimates.
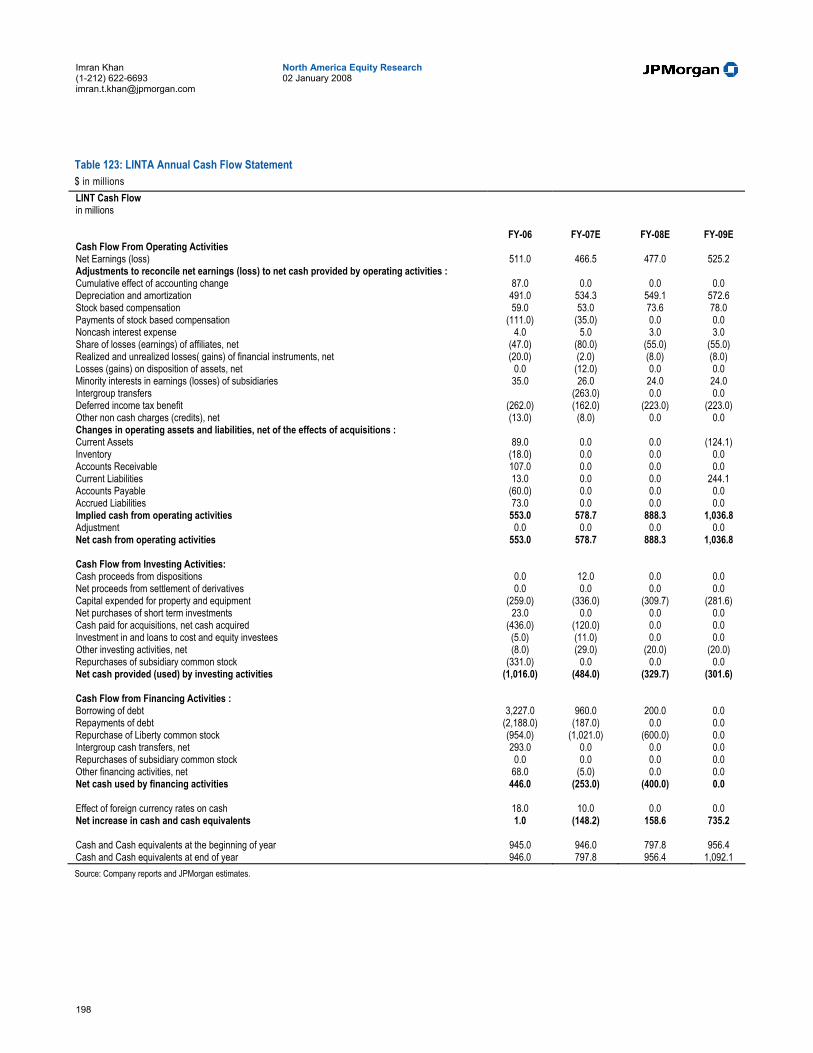
198
North America Equity Research 02 January 2008
Imran Khan (1-212) 622-6693 [email protected]
Table 123: LINTA Annual Cash Flow Statement $ in millions LINT Cash Flow in millions
FY-06 FY-07E FY-08E FY-09E
Cash Flow From Operating Activities Net Earnings (loss) 511.0 466.5 477.0 525.2 Adjustments to reconcile net earnings (loss) to net cash provided by operating activities : Cumulative effect of accounting change 87.0 0.0 0.0 0.0 Depreciation and amortization 491.0 534.3 549.1 572.6 Stock based compensation 59.0 53.0 73.6 78.0 Payments of stock based compensation (111.0) (35.0) 0.0 0.0 Noncash interest expense 4.0 5.0 3.0 3.0 Share of losses (earnings) of affiliates, net (47.0) (80.0) (55.0) (55.0) Realized and unrealized losses( gains) of financial instruments, net (20.0) (2.0) (8.0) (8.0) Losses (gains) on disposition of assets, net 0.0 (12.0) 0.0 0.0 Minority interests in earnings (losses) of subsidiaries 35.0 26.0 24.0 24.0 Intergroup transfers (263.0) 0.0 0.0 Deferred income tax benefit (262.0) (162.0) (223.0) (223.0) Other non cash charges (credits), net (13.0) (8.0) 0.0 0.0 Changes in operating assets and liabilities, net of the effects of acquisitions : Current Assets 89.0 0.0 0.0 (124.1) Inventory (18.0) 0.0 0.0 0.0 Accounts Receivable 107.0 0.0 0.0 0.0 Current Liabilities 13.0 0.0 0.0 244.1 Accounts Payable (60.0) 0.0 0.0 0.0 Accrued Liabilities 73.0 0.0 0.0 0.0 Implied cash from operating activities 553.0 578.7 888.3 1,036.8 Adjustment 0.0 0.0 0.0 0.0 Net cash from operating activities 553.0 578.7 888.3 1,036.8
Cash Flow from Investing Activities: Cash proceeds from dispositions 0.0 12.0 0.0 0.0 Net proceeds from settlement of derivatives 0.0 0.0 0.0 0.0 Capital expended for property and equipment (259.0) (336.0) (309.7) (281.6) Net purchases of short term investments 23.0 0.0 0.0 0.0 Cash paid for acquisitions, net cash acquired (436.0) (120.0) 0.0 0.0 Investment in and loans to cost and equity investees (5.0) (11.0) 0.0 0.0 Other investing activities, net (8.0) (29.0) (20.0) (20.0) Repurchases of subsidiary common stock (331.0) 0.0 0.0 0.0 Net cash provided (used) by investing activities (1,016.0) (484.0) (329.7) (301.6)
Cash Flow from Financing Activities : Borrowing of debt 3,227.0 960.0 200.0 0.0 Repayments of debt (2,188.0) (187.0) 0.0 0.0 Repurchase of Liberty common stock (954.0) (1,021.0) (600.0) 0.0 Intergroup cash transfers, net 293.0 0.0 0.0 0.0 Repurchases of subsidiary common stock 0.0 0.0 0.0 0.0 Other financing activities, net 68.0 (5.0) 0.0 0.0 Net cash used by financing activities 446.0 (253.0) (400.0) 0.0
Effect of foreign currency rates on cash 18.0 10.0 0.0 0.0 Net increase in cash and cash equivalents 1.0 (148.2) 158.6 735.2
Cash and Cash equivalents at the beginning of year 945.0 946.0 797.8 956.4 Cash and Cash equivalents at end of year 946.0 797.8 956.4 1,092.1 Source: Company reports and JPMorgan estimates.
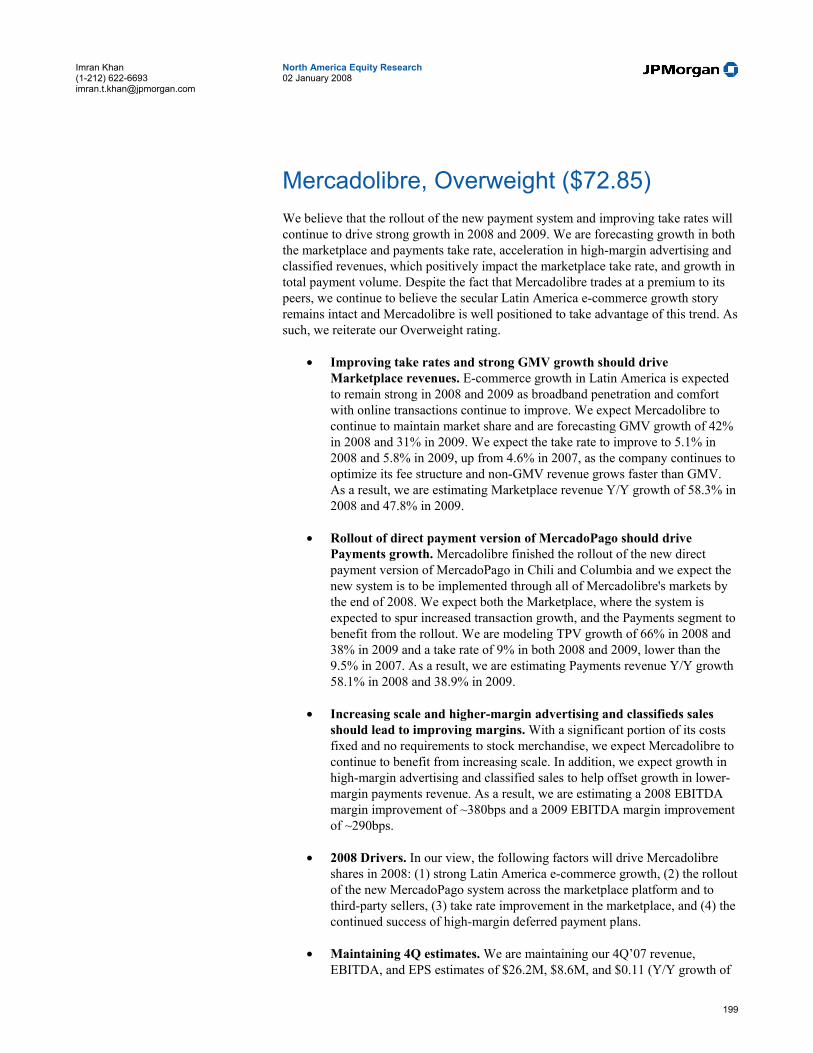
199
North America Equity Research 02 January 2008
Imran Khan (1-212) 622-6693 [email protected]
Mercadolibre, Overweight ($72.85) We believe that the rollout of the new payment system and improving take rates will continue to drive strong growth in 2008 and 2009. We are forecasting growth in both the marketplace and payments take rate, acceleration in high-margin advertising and classified revenues, which positively impact the marketplace take rate, and growth in total payment volume. Despite the fact that Mercadolibre trades at a premium to its peers, we continue to believe the secular Latin America e-commerce growth story remains intact and Mercadolibre is well positioned to take advantage of this trend. As such, we reiterate our Overweight rating.
• Improving take rates and strong GMV growth should drive Marketplace revenues. E-commerce growth in Latin America is expected to remain strong in 2008 and 2009 as broadband penetration and comfort with online transactions continue to improve. We expect Mercadolibre to continue to maintain market share and are forecasting GMV growth of 42% in 2008 and 31% in 2009. We expect the take rate to improve to 5.1% in 2008 and 5.8% in 2009, up from 4.6% in 2007, as the company continues to optimize its fee structure and non-GMV revenue grows faster than GMV. As a result, we are estimating Marketplace revenue Y/Y growth of 58.3% in 2008 and 47.8% in 2009.
• Rollout of direct payment version of MercadoPago should drive Payments growth. Mercadolibre finished the rollout of the new direct payment version of MercadoPago in Chili and Columbia and we expect the new system is to be implemented through all of Mercadolibre's markets by the end of 2008. We expect both the Marketplace, where the system is expected to spur increased transaction growth, and the Payments segment to benefit from the rollout. We are modeling TPV growth of 66% in 2008 and 38% in 2009 and a take rate of 9% in both 2008 and 2009, lower than the 9.5% in 2007. As a result, we are estimating Payments revenue Y/Y growth 58.1% in 2008 and 38.9% in 2009.
• Increasing scale and higher-margin advertising and classifieds sales should lead to improving margins. With a significant portion of its costs fixed and no requirements to stock merchandise, we expect Mercadolibre to continue to benefit from increasing scale. In addition, we expect growth in high-margin advertising and classified sales to help offset growth in lower-margin payments revenue. As a result, we are estimating a 2008 EBITDA margin improvement of ~380bps and a 2009 EBITDA margin improvement of ~290bps.
• 2008 Drivers. In our view, the following factors will drive Mercadolibre shares in 2008: (1) strong Latin America e-commerce growth, (2) the rollout of the new MercadoPago system across the marketplace platform and to third-party sellers, (3) take rate improvement in the marketplace, and (4) the continued success of high-margin deferred payment plans.
• Maintaining 4Q estimates. We are maintaining our 4Q’07 revenue, EBITDA, and EPS estimates of $26.2M, $8.6M, and $0.11 (Y/Y growth of
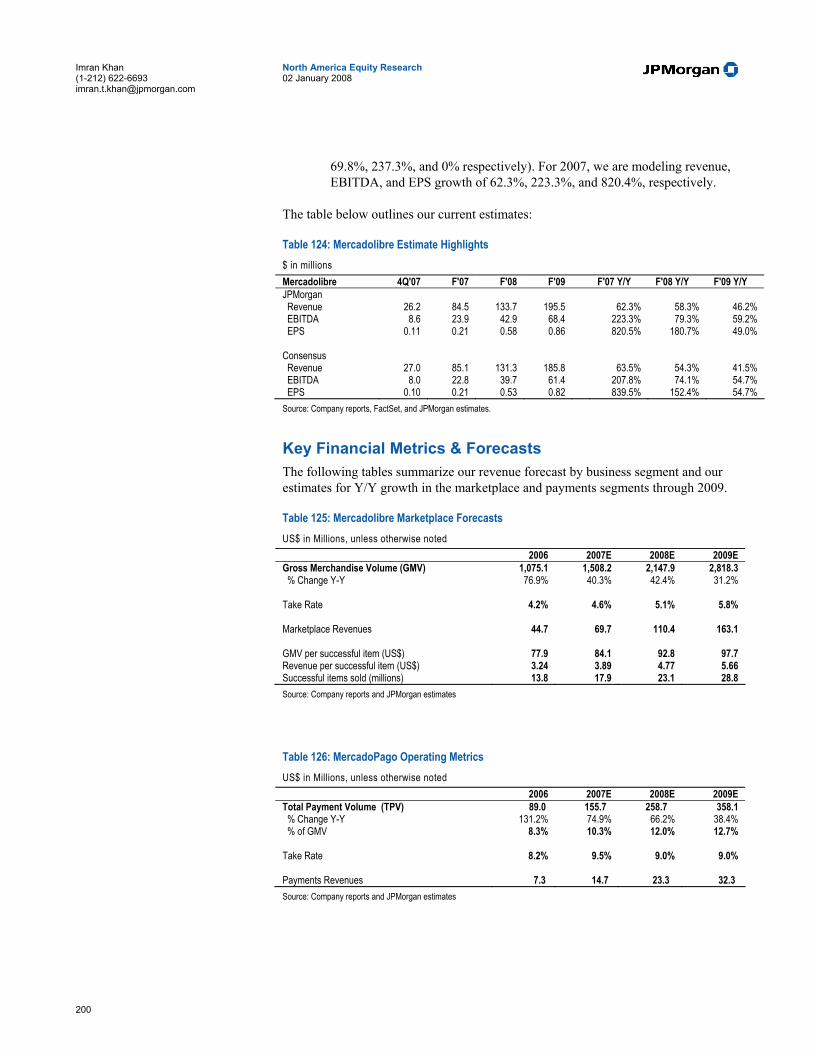
200
North America Equity Research 02 January 2008
Imran Khan (1-212) 622-6693 [email protected]
69.8%, 237.3%, and 0% respectively). For 2007, we are modeling revenue, EBITDA, and EPS growth of 62.3%, 223.3%, and 820.4%, respectively.
The table below outlines our current estimates:
Table 124: Mercadolibre Estimate Highlights $ in millions Mercadolibre 4Q'07 F'07 F'08 F'09 F'07 Y/Y F'08 Y/Y F'09 Y/Y JPMorgan Revenue 26.2 84.5 133.7 195.5 62.3% 58.3% 46.2% EBITDA 8.6 23.9 42.9 68.4 223.3% 79.3% 59.2% EPS 0.11 0.21 0.58 0.86 820.5% 180.7% 49.0%
Consensus Revenue 27.0 85.1 131.3 185.8 63.5% 54.3% 41.5% EBITDA 8.0 22.8 39.7 61.4 207.8% 74.1% 54.7% EPS 0.10 0.21 0.53 0.82 839.5% 152.4% 54.7% Source: Company reports, FactSet, and JPMorgan estimates.
Key Financial Metrics & Forecasts The following tables summarize our revenue forecast by business segment and our estimates for Y/Y growth in the marketplace and payments segments through 2009.
Table 125: Mercadolibre Marketplace Forecasts US$ in Millions, unless otherwise noted 2006 2007E 2008E 2009E Gross Merchandise Volume (GMV) 1,075.1 1,508.2 2,147.9 2,818.3 % Change Y-Y 76.9% 40.3% 42.4% 31.2% Take Rate 4.2% 4.6% 5.1% 5.8% Marketplace Revenues 44.7 69.7 110.4 163.1 GMV per successful item (US$) 77.9 84.1 92.8 97.7 Revenue per successful item (US$) 3.24 3.89 4.77 5.66 Successful items sold (millions) 13.8 17.9 23.1 28.8 Source: Company reports and JPMorgan estimates
Table 126: MercadoPago Operating Metrics US$ in Millions, unless otherwise noted 2006 2007E 2008E 2009E Total Payment Volume (TPV) 89.0 155.7 258.7 358.1 % Change Y-Y 131.2% 74.9% 66.2% 38.4% % of GMV 8.3% 10.3% 12.0% 12.7% Take Rate 8.2% 9.5% 9.0% 9.0% Payments Revenues 7.3 14.7 23.3 32.3 Source: Company reports and JPMorgan estimates
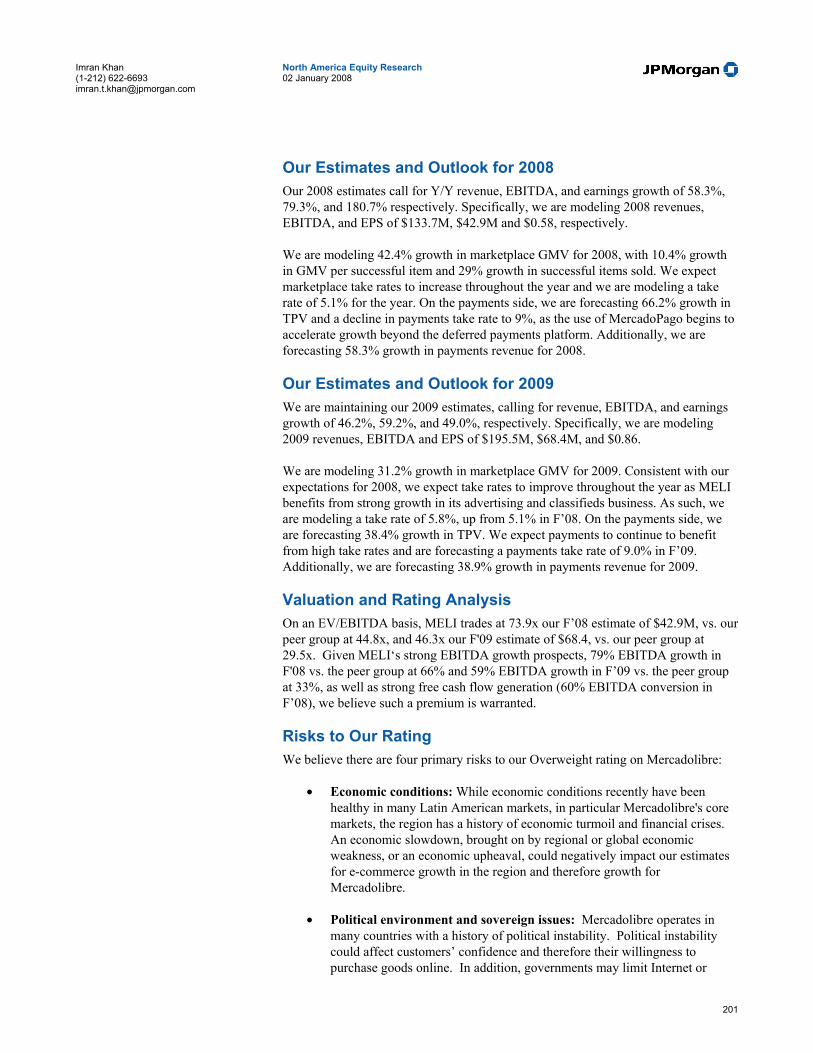
201
North America Equity Research 02 January 2008
Imran Khan (1-212) 622-6693 [email protected]
Our Estimates and Outlook for 2008 Our 2008 estimates call for Y/Y revenue, EBITDA, and earnings growth of 58.3%, 79.3%, and 180.7% respectively. Specifically, we are modeling 2008 revenues, EBITDA, and EPS of $133.7M, $42.9M and $0.58, respectively.
We are modeling 42.4% growth in marketplace GMV for 2008, with 10.4% growth in GMV per successful item and 29% growth in successful items sold. We expect marketplace take rates to increase throughout the year and we are modeling a take rate of 5.1% for the year. On the payments side, we are forecasting 66.2% growth in TPV and a decline in payments take rate to 9%, as the use of MercadoPago begins to accelerate growth beyond the deferred payments platform. Additionally, we are forecasting 58.3% growth in payments revenue for 2008.
Our Estimates and Outlook for 2009 We are maintaining our 2009 estimates, calling for revenue, EBITDA, and earnings growth of 46.2%, 59.2%, and 49.0%, respectively. Specifically, we are modeling 2009 revenues, EBITDA and EPS of $195.5M, $68.4M, and $0.86.
We are modeling 31.2% growth in marketplace GMV for 2009. Consistent with our expectations for 2008, we expect take rates to improve throughout the year as MELI benefits from strong growth in its advertising and classifieds business. As such, we are modeling a take rate of 5.8%, up from 5.1% in F’08. On the payments side, we are forecasting 38.4% growth in TPV. We expect payments to continue to benefit from high take rates and are forecasting a payments take rate of 9.0% in F’09. Additionally, we are forecasting 38.9% growth in payments revenue for 2009.
Valuation and Rating Analysis On an EV/EBITDA basis, MELI trades at 73.9x our F’08 estimate of $42.9M, vs. our peer group at 44.8x, and 46.3x our F'09 estimate of $68.4, vs. our peer group at 29.5x. Given MELI‘s strong EBITDA growth prospects, 79% EBITDA growth in F'08 vs. the peer group at 66% and 59% EBITDA growth in F’09 vs. the peer group at 33%, as well as strong free cash flow generation (60% EBITDA conversion in F’08), we believe such a premium is warranted.
Risks to Our Rating We believe there are four primary risks to our Overweight rating on Mercadolibre:
• Economic conditions: While economic conditions recently have been healthy in many Latin American markets, in particular Mercadolibre's core markets, the region has a history of economic turmoil and financial crises. An economic slowdown, brought on by regional or global economic weakness, or an economic upheaval, could negatively impact our estimates for e-commerce growth in the region and therefore growth for Mercadolibre.
• Political environment and sovereign issues: Mercadolibre operates in many countries with a history of political instability. Political instability could affect customers’ confidence and therefore their willingness to purchase goods online. In addition, governments may limit Internet or
202
North America Equity Research 02 January 2008
Imran Khan (1-212) 622-6693 [email protected]
commerce activities. We believe that Mercadolibre’s close work with local governments to monitor sales practices and the ability to track cash flows with MercadoPago mitigate some of this risk.
• Expansion plans could stress resources: Mercadolibre has grown through a number of acquisitions since its inception in 1999. As MELI looks to grow into new product offerings and markets, it may look to acquire other companies or be forced to spend substantial cash to develop its own products. Either event could stress the company's financial resources.
• Low cost of entry business model. Creating an online marketplace requires little capital, since the owner does not need to stock merchandise and fulfill orders. In addition, if Latin American e-commerce growth proves to be as attractive as some projections estimate, it might attract the interest of larger players, such as eBay, Google and Yahoo, who have greater resources available to them than Mercadolibre. However, we believe that the first-mover advantage and marketplace scale that Mercadolibre has achieved act as barriers to entry for even deep-pocketed competitors.
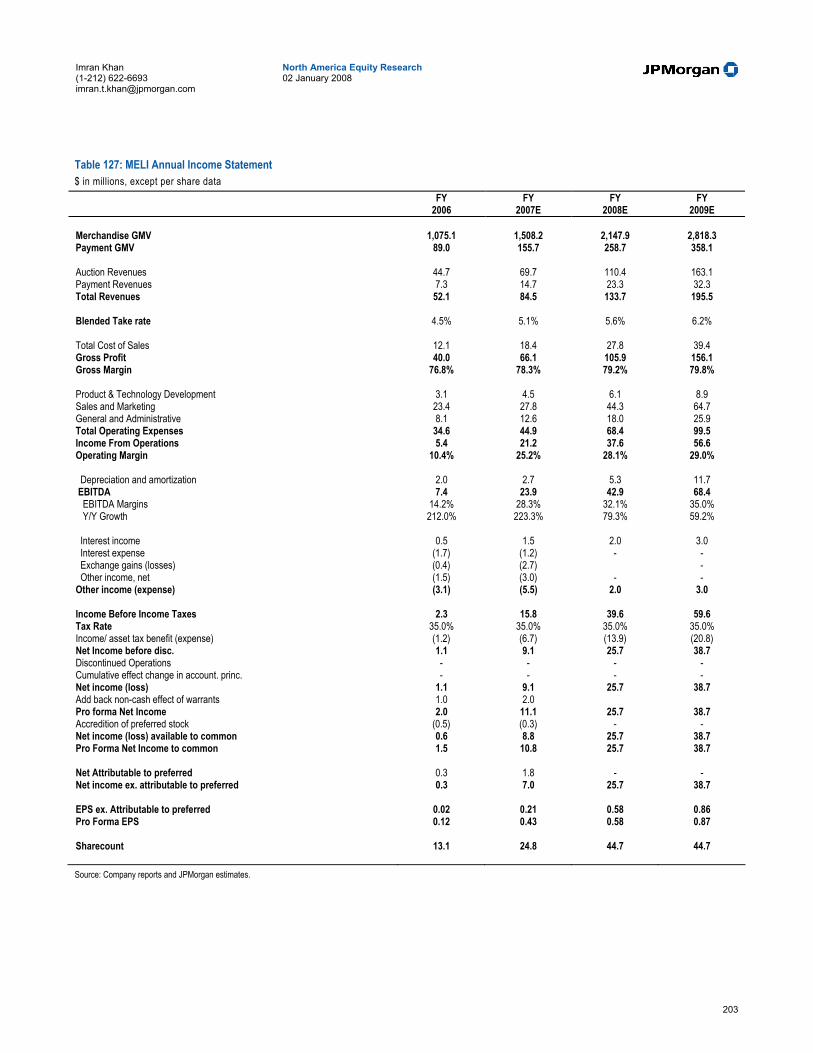
203
North America Equity Research 02 January 2008
Imran Khan (1-212) 622-6693 [email protected]
Table 127: MELI Annual Income Statement $ in millions, except per share data
FY FY FY FY 2006 2007E 2008E 2009E
Merchandise GMV 1,075.1 1,508.2 2,147.9 2,818.3 Payment GMV 89.0 155.7 258.7 358.1
Auction Revenues 44.7 69.7 110.4 163.1 Payment Revenues 7.3 14.7 23.3 32.3 Total Revenues 52.1 84.5 133.7 195.5
Blended Take rate 4.5% 5.1% 5.6% 6.2%
Total Cost of Sales 12.1 18.4 27.8 39.4 Gross Profit 40.0 66.1 105.9 156.1 Gross Margin 76.8% 78.3% 79.2% 79.8%
Product & Technology Development 3.1 4.5 6.1 8.9 Sales and Marketing 23.4 27.8 44.3 64.7 General and Administrative 8.1 12.6 18.0 25.9 Total Operating Expenses 34.6 44.9 68.4 99.5 Income From Operations 5.4 21.2 37.6 56.6 Operating Margin 10.4% 25.2% 28.1% 29.0%
Depreciation and amortization 2.0 2.7 5.3 11.7 EBITDA 7.4 23.9 42.9 68.4 EBITDA Margins 14.2% 28.3% 32.1% 35.0% Y/Y Growth 212.0% 223.3% 79.3% 59.2%
Interest income 0.5 1.5 2.0 3.0 Interest expense (1.7) (1.2) - - Exchange gains (losses) (0.4) (2.7) - Other income, net (1.5) (3.0) - - Other income (expense) (3.1) (5.5) 2.0 3.0
Income Before Income Taxes 2.3 15.8 39.6 59.6 Tax Rate 35.0% 35.0% 35.0% 35.0% Income/ asset tax benefit (expense) (1.2) (6.7) (13.9) (20.8) Net Income before disc. 1.1 9.1 25.7 38.7 Discontinued Operations - - - - Cumulative effect change in account. princ. - - - - Net income (loss) 1.1 9.1 25.7 38.7 Add back non-cash effect of warrants 1.0 2.0 Pro forma Net Income 2.0 11.1 25.7 38.7 Accredition of preferred stock (0.5) (0.3) - - Net income (loss) available to common 0.6 8.8 25.7 38.7 Pro Forma Net Income to common 1.5 10.8 25.7 38.7
Net Attributable to preferred 0.3 1.8 - - Net income ex. attributable to preferred 0.3 7.0 25.7 38.7
EPS ex. Attributable to preferred 0.02 0.21 0.58 0.86 Pro Forma EPS 0.12 0.43 0.58 0.87
Sharecount 13.1 24.8 44.7 44.7 Source: Company reports and JPMorgan estimates.

204
North America Equity Research 02 January 2008
Imran Khan (1-212) 622-6693 [email protected]
Table 128: MELI Quarterly Income Statement $ in millions, except per share data
FY06 FY07E FY08E 1Q'06 2Q'06 3Q'06 4Q'06 1Q'07 2Q'07 3Q'07 4Q'07E 1Q'08E 2Q'08E 3Q'08E 4Q'08E
Merchandise GMV 217.8 244.8 283.7 328.8 312.6 343.0 394.9 457.6 425.2 466.8 576.6 679.3 Payment GMV 16.5 19.1 23.1 30.4 26.4 31.0 43.6 54.7 46.1 54.2 76.3 82.1
Auction Revenues 9.6 10.8 11.3 13.1 14.2 16.1 18.1 21.3 20.8 24.3 30.0 35.3 Payment Revenues 1.4 1.6 1.9 2.4 2.3 2.9 4.7 4.9 4.2 4.9 6.9 7.4 Total Revenues 11.0 12.4 13.2 15.5 16.5 19.0 22.8 26.2 25.0 29.2 36.8 42.7
Blended Take rate 4.7% 4.7% 4.3% 4.3% 4.9% 5.1% 5.2% 5.1% 5.3% 5.6% 5.6% 5.6%
Total Cost of Sales 2.5 2.7 3.2 3.7 3.6 4.1 5.2 5.5 5.2 6.0 7.8 8.8 Gross Profit 8.5 9.6 10.1 11.8 12.9 14.9 17.6 20.7 19.8 23.2 29.0 34.0 Gross Margin 77.1% 77.8% 76.1% 76.4% 78.3% 78.5% 77.2% 79.0% 79.2% 79.4% 78.8% 79.5%
Product & Technology Development 0.7 0.8 0.8 0.8 1.0 1.0 1.2 1.3 1.2 1.4 1.7 1.9 Sales and Marketing 5.1 5.5 6.1 6.7 6.3 6.3 7.0 8.1 8.5 9.9 11.8 14.1 General and Administrative 1.9 1.9 2.1 2.2 2.7 2.8 3.5 3.6 3.7 4.0 5.1 5.1 Total Operating Expenses 7.7 8.2 8.9 9.8 10.0 10.2 11.6 13.1 13.4 15.3 18.5 21.1 Income From Operations 0.8 1.4 1.1 2.0 2.9 4.7 6.0 7.6 6.4 7.8 10.5 12.8 Operating Margin 7.2% 11.6% 8.7% 13.1% 17.7% 24.9% 26.3% 29.0% 25.6% 26.9% 28.5% 30.0%
Depreciation and amortization 0.5 0.5 0.5 0.5 0.5 0.6 0.6 1.0 1.0 1.2 1.5 1.7 EBITDA 1.3 1.9 1.7 2.6 3.5 5.3 6.6 8.6 7.4 9.0 12.0 14.5 EBITDA Margins 11.4% 15.7% 12.5% 16.5% 21.0% 28.0% 28.8% 32.8% 29.6% 30.9% 32.5% 34.0% Y/Y Growth NM 645.1% 98.1% 44.7% 175.2% 172.8% 297.7% 237.3% 114.1% 70.0% 82.6% 68.6%
Interest income 0.0 0.1 0.1 0.3 0.1 0.4 0.4 0.6 0.4 0.5 0.5 0.6 Interest expense (0.4) (0.4) (0.5) (0.5) (0.4) (0.4) (0.4) Exchange gains (losses) 0.1 (0.2) (0.1) (0.3) (0.4) (0.6) (0.8) (0.9) Other income, net (0.1) (1.0) (0.2) (0.1) (0.3) (1.8) (1.0) - - - - - Other income (expense) (0.3) (1.6) (0.7) (0.5) (1.0) (2.3) (1.8) (0.3) 0.4 0.5 0.5 0.6
Income Before Income Taxes 0.5 (0.1) 0.5 1.5 1.9 2.4 4.2 7.3 6.8 8.3 11.0 13.4 Tax Rate 76.1% -688.2% 92.0% -23.4% 47.1% 75.5% 33.5% 35.0% 35.0% 35.0% 35.0% 35.0% Income/ asset tax benefit (expense) (0.4) (0.8) (0.4) 0.4 (0.9) (1.8) (1.4) (2.6) (2.4) (2.9) (3.9) (4.7) Net Income before disc. 0.1 (0.9) 0.0 1.9 1.0 0.6 2.8 4.8 4.4 5.4 7.2 8.7 Discontinued Operations - - - - - - - - - - - - Cumulative effect change in account. princ. Net income (loss) 0.1 (0.9) 0.0 1.9 1.0 0.6 2.8 4.8 4.4 5.4 7.2 8.7 Add back non-cash effect of warrants 0.1 0.7 0.2 0.1 0.2 1.1 0.6 Pro forma Net Income 0.2 (0.3) 0.2 1.9 1.2 1.7 3.4 4.8 4.4 5.4 7.2 8.7 Accredition of preferred stock (0.1) (0.1) (0.1) (0.1) (0.1) (0.1) (0.1) Net income (loss) available to common (0.0) (1.0) (0.1) 1.7 0.9 0.5 2.7 4.8 4.4 5.4 7.2 8.7
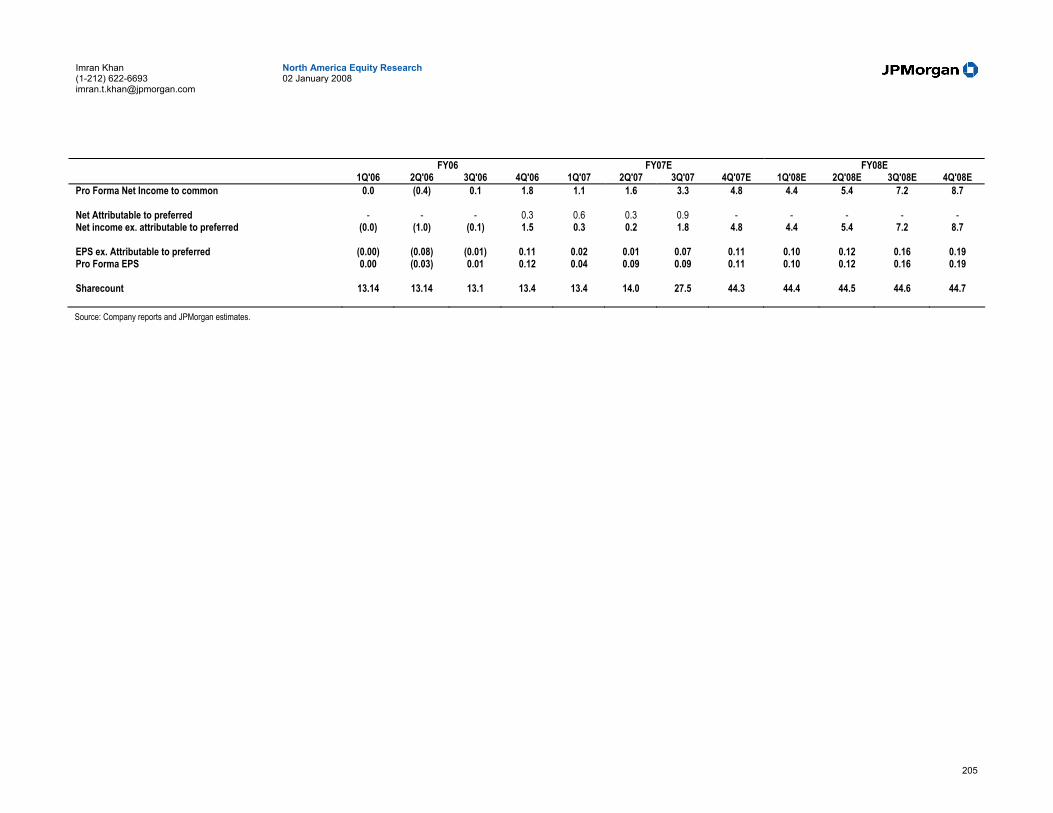
205
North America Equity Research 02 January 2008
Imran Khan (1-212) 622-6693 [email protected]
FY06 FY07E FY08E 1Q'06 2Q'06 3Q'06 4Q'06 1Q'07 2Q'07 3Q'07 4Q'07E 1Q'08E 2Q'08E 3Q'08E 4Q'08E
Pro Forma Net Income to common 0.0 (0.4) 0.1 1.8 1.1 1.6 3.3 4.8 4.4 5.4 7.2 8.7
Net Attributable to preferred - - - 0.3 0.6 0.3 0.9 - - - - - Net income ex. attributable to preferred (0.0) (1.0) (0.1) 1.5 0.3 0.2 1.8 4.8 4.4 5.4 7.2 8.7
EPS ex. Attributable to preferred (0.00) (0.08) (0.01) 0.11 0.02 0.01 0.07 0.11 0.10 0.12 0.16 0.19 Pro Forma EPS 0.00 (0.03) 0.01 0.12 0.04 0.09 0.09 0.11 0.10 0.12 0.16 0.19
Sharecount 13.14 13.14 13.1 13.4 13.4 14.0 27.5 44.3 44.4 44.5 44.6 44.7 Source: Company reports and JPMorgan estimates.

206
North America Equity Research 02 January 2008
Imran Khan (1-212) 622-6693 [email protected]
Table 129: MELI Annual Balance Sheet $ in millions
FY FY FY FY 2006 2007E 2008E 2009E
Assets Current assets Cash and cash equivalents 7.1 20.2 45.9 88.6 Short-term investments 6.3 48.4 48.4 48.4 Accounts receivable 2.0 2.6 3.0 3.7 Funds receivable from customers 10.2 18.4 29.9 41.7 Prepaid expenses 0.3 0.8 1.3 1.8 Deferred tax assets 2.9 4.7 7.7 11.0 Other current assets 0.2 0.5 0.9 1.2 Total Current Assets 29.1 95.6 137.0 196.4 Non-current assets Long-term investments - 1.5 1.5 1.5 Property & equipment, net 2.9 4.4 5.2 6.0 Gooodwill & intangibles, net 21.3 23.0 23.0 23.0 Deferred tax assets 0.4 0.6 0.6 0.6 Other assets 0.0 0.2 0.2 0.2 Total Non-Current Assets 24.7 29.6 30.4 31.2 Total Assets 53.8 125.2 167.4 227.6
Current liabilities Accounts payable and accrued expenses 5.7 9.4 16.2 23.3 Funds payable to customers 9.1 13.9 23.9 34.9 Social security payable 2.7 3.9 6.3 9.0 Taxes payable 1.7 2.4 3.8 5.4 Loans payable 0.1 3.1 3.1 3.1 Other liabilities Provisions 0.3 0.0 0.0 0.0 Total Current Liabilities 19.7 32.7 53.4 75.8 Non-current liabilities Loans payable 9.0 - - - Other liabilities 1.8 1.2 2.4 3.6 Total non-current liabilities 10.8 1.2 2.4 3.6 Total Liabilities 30.5 34.0 55.8 79.4
Mandatorily Redeemable conv. preferred stock 64.1 - - -
Shareholders equity Common stock 0.1 0.0 0.0 0.0 Additional paid-in capital 2.7 122.9 117.5 115.4 Accumulated deficit (44.1) (35.0) (9.3) 29.5 Accumulated other comprehensive income 0.5 3.2 3.2 3.2 Total shareholders' equity (deficit) (40.7) 91.2 111.5 148.2 Total Liabilities and shareholders' equity 53.8 125.2 167.4 227.6 Source: Company reports and JPMorgan estimates.
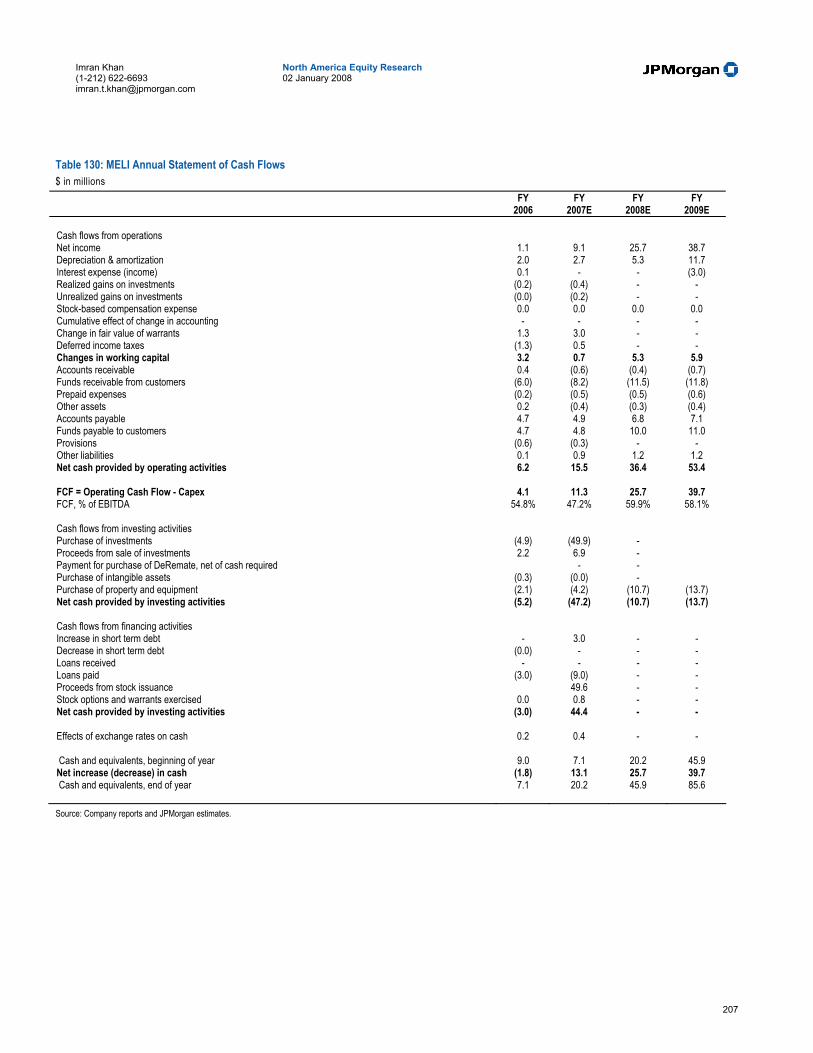
207
North America Equity Research 02 January 2008
Imran Khan (1-212) 622-6693 [email protected]
Table 130: MELI Annual Statement of Cash Flows $ in millions
FY FY FY FY 2006 2007E 2008E 2009E
Cash flows from operations Net income 1.1 9.1 25.7 38.7 Depreciation & amortization 2.0 2.7 5.3 11.7 Interest expense (income) 0.1 - - (3.0) Realized gains on investments (0.2) (0.4) - - Unrealized gains on investments (0.0) (0.2) - - Stock-based compensation expense 0.0 0.0 0.0 0.0 Cumulative effect of change in accounting - - - - Change in fair value of warrants 1.3 3.0 - - Deferred income taxes (1.3) 0.5 - - Changes in working capital 3.2 0.7 5.3 5.9 Accounts receivable 0.4 (0.6) (0.4) (0.7) Funds receivable from customers (6.0) (8.2) (11.5) (11.8) Prepaid expenses (0.2) (0.5) (0.5) (0.6) Other assets 0.2 (0.4) (0.3) (0.4) Accounts payable 4.7 4.9 6.8 7.1 Funds payable to customers 4.7 4.8 10.0 11.0 Provisions (0.6) (0.3) - - Other liabilities 0.1 0.9 1.2 1.2 Net cash provided by operating activities 6.2 15.5 36.4 53.4
FCF = Operating Cash Flow - Capex 4.1 11.3 25.7 39.7 FCF, % of EBITDA 54.8% 47.2% 59.9% 58.1%
Cash flows from investing activities Purchase of investments (4.9) (49.9) - Proceeds from sale of investments 2.2 6.9 - Payment for purchase of DeRemate, net of cash required - - Purchase of intangible assets (0.3) (0.0) - Purchase of property and equipment (2.1) (4.2) (10.7) (13.7) Net cash provided by investing activities (5.2) (47.2) (10.7) (13.7)
Cash flows from financing activities Increase in short term debt - 3.0 - - Decrease in short term debt (0.0) - - - Loans received - - - - Loans paid (3.0) (9.0) - - Proceeds from stock issuance 49.6 - - Stock options and warrants exercised 0.0 0.8 - - Net cash provided by investing activities (3.0) 44.4 - -
Effects of exchange rates on cash 0.2 0.4 - -
Cash and equivalents, beginning of year 9.0 7.1 20.2 45.9 Net increase (decrease) in cash (1.8) 13.1 25.7 39.7 Cash and equivalents, end of year 7.1 20.2 45.9 85.6 Source: Company reports and JPMorgan estimates.
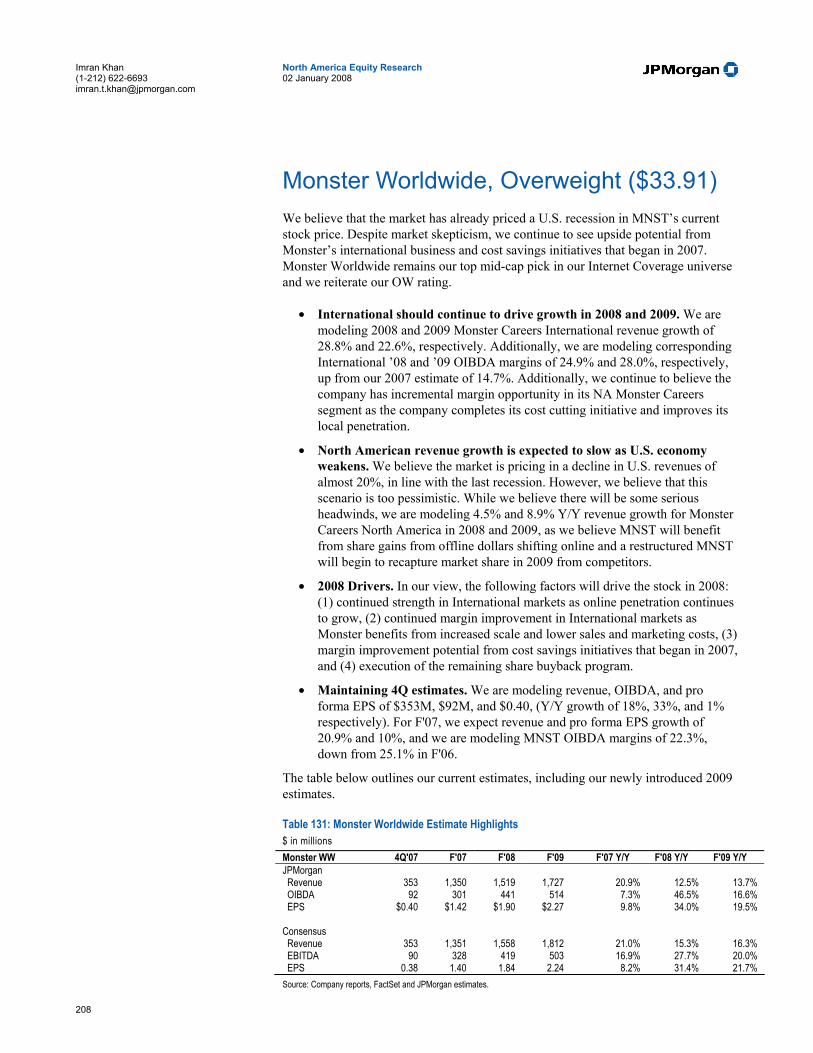
208
North America Equity Research 02 January 2008
Imran Khan (1-212) 622-6693 [email protected]
Monster Worldwide, Overweight ($33.91) We believe that the market has already priced a U.S. recession in MNST’s current stock price. Despite market skepticism, we continue to see upside potential from Monster’s international business and cost savings initiatives that began in 2007. Monster Worldwide remains our top mid-cap pick in our Internet Coverage universe and we reiterate our OW rating.
• International should continue to drive growth in 2008 and 2009. We are modeling 2008 and 2009 Monster Careers International revenue growth of 28.8% and 22.6%, respectively. Additionally, we are modeling corresponding International ’08 and ’09 OIBDA margins of 24.9% and 28.0%, respectively, up from our 2007 estimate of 14.7%. Additionally, we continue to believe the company has incremental margin opportunity in its NA Monster Careers segment as the company completes its cost cutting initiative and improves its local penetration.
• North American revenue growth is expected to slow as U.S. economy weakens. We believe the market is pricing in a decline in U.S. revenues of almost 20%, in line with the last recession. However, we believe that this scenario is too pessimistic. While we believe there will be some serious headwinds, we are modeling 4.5% and 8.9% Y/Y revenue growth for Monster Careers North America in 2008 and 2009, as we believe MNST will benefit from share gains from offline dollars shifting online and a restructured MNST will begin to recapture market share in 2009 from competitors.
• 2008 Drivers. In our view, the following factors will drive the stock in 2008: (1) continued strength in International markets as online penetration continues to grow, (2) continued margin improvement in International markets as Monster benefits from increased scale and lower sales and marketing costs, (3) margin improvement potential from cost savings initiatives that began in 2007, and (4) execution of the remaining share buyback program.
• Maintaining 4Q estimates. We are modeling revenue, OIBDA, and pro forma EPS of $353M, $92M, and $0.40, (Y/Y growth of 18%, 33%, and 1% respectively). For F'07, we expect revenue and pro forma EPS growth of 20.9% and 10%, and we are modeling MNST OIBDA margins of 22.3%, down from 25.1% in F'06.
The table below outlines our current estimates, including our newly introduced 2009 estimates.
Table 131: Monster Worldwide Estimate Highlights $ in millions Monster WW 4Q'07 F'07 F'08 F'09 F'07 Y/Y F'08 Y/Y F'09 Y/Y JPMorgan Revenue 353 1,350 1,519 1,727 20.9% 12.5% 13.7% OIBDA 92 301 441 514 7.3% 46.5% 16.6% EPS $0.40 $1.42 $1.90 $2.27 9.8% 34.0% 19.5%
Consensus Revenue 353 1,351 1,558 1,812 21.0% 15.3% 16.3% EBITDA 90 328 419 503 16.9% 27.7% 20.0% EPS 0.38 1.40 1.84 2.24 8.2% 31.4% 21.7% Source: Company reports, FactSet and JPMorgan estimates.
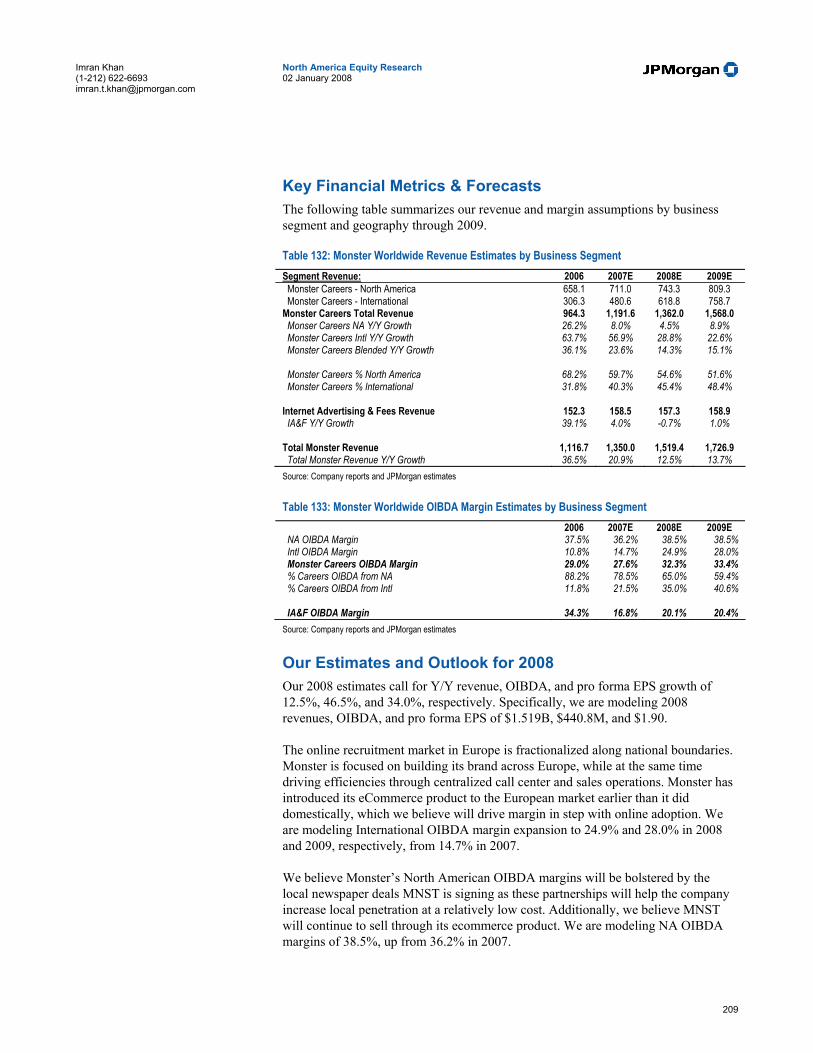
209
North America Equity Research 02 January 2008
Imran Khan (1-212) 622-6693 [email protected]
Key Financial Metrics & Forecasts The following table summarizes our revenue and margin assumptions by business segment and geography through 2009.
Table 132: Monster Worldwide Revenue Estimates by Business Segment Segment Revenue: 2006 2007E 2008E 2009E Monster Careers - North America 658.1 711.0 743.3 809.3 Monster Careers - International 306.3 480.6 618.8 758.7 Monster Careers Total Revenue 964.3 1,191.6 1,362.0 1,568.0 Monser Careers NA Y/Y Growth 26.2% 8.0% 4.5% 8.9% Monster Careers Intl Y/Y Growth 63.7% 56.9% 28.8% 22.6% Monster Careers Blended Y/Y Growth 36.1% 23.6% 14.3% 15.1% Monster Careers % North America 68.2% 59.7% 54.6% 51.6% Monster Careers % International 31.8% 40.3% 45.4% 48.4% Internet Advertising & Fees Revenue 152.3 158.5 157.3 158.9 IA&F Y/Y Growth 39.1% 4.0% -0.7% 1.0% Total Monster Revenue 1,116.7 1,350.0 1,519.4 1,726.9 Total Monster Revenue Y/Y Growth 36.5% 20.9% 12.5% 13.7% Source: Company reports and JPMorgan estimates
Table 133: Monster Worldwide OIBDA Margin Estimates by Business Segment 2006 2007E 2008E 2009E NA OIBDA Margin 37.5% 36.2% 38.5% 38.5% Intl OIBDA Margin 10.8% 14.7% 24.9% 28.0% Monster Careers OIBDA Margin 29.0% 27.6% 32.3% 33.4% % Careers OIBDA from NA 88.2% 78.5% 65.0% 59.4% % Careers OIBDA from Intl 11.8% 21.5% 35.0% 40.6% IA&F OIBDA Margin 34.3% 16.8% 20.1% 20.4% Source: Company reports and JPMorgan estimates
Our Estimates and Outlook for 2008 Our 2008 estimates call for Y/Y revenue, OIBDA, and pro forma EPS growth of 12.5%, 46.5%, and 34.0%, respectively. Specifically, we are modeling 2008 revenues, OIBDA, and pro forma EPS of $1.519B, $440.8M, and $1.90.
The online recruitment market in Europe is fractionalized along national boundaries. Monster is focused on building its brand across Europe, while at the same time driving efficiencies through centralized call center and sales operations. Monster has introduced its eCommerce product to the European market earlier than it did domestically, which we believe will drive margin in step with online adoption. We are modeling International OIBDA margin expansion to 24.9% and 28.0% in 2008 and 2009, respectively, from 14.7% in 2007.
We believe Monster’s North American OIBDA margins will be bolstered by the local newspaper deals MNST is signing as these partnerships will help the company increase local penetration at a relatively low cost. Additionally, we believe MNST will continue to sell through its ecommerce product. We are modeling NA OIBDA margins of 38.5%, up from 36.2% in 2007.
210
North America Equity Research 02 January 2008
Imran Khan (1-212) 622-6693 [email protected]
We expect IA&F revenues to decline in 2008 as MNST focuses on revamping its site and removes lower quality advertisers. For F’08, we are modeling IA&F revenues of $157M, down from $159M in F’07.
Our Estimates and Outlook for 2009 We are introducing 2009 estimates calling for Y/Y revenue, OIBDA, and pro forma EPS growth of 13.7%, 16.6%, and 19%, respectively. Specifically, we are modeling 2009 revenues, OIBDA, and pro forma EPS of $1.727B, $514M, and $2.27.
By 2009, we expect weakness in the U.S. recruiting markets to subside. In addition, we expect the company to benefit from an increased focus on its customers' experience and efforts to recapture market share from CareerBuilder. As such, we expect Monster Careers- North America to see revenue growth accelerate to 8.9% in F’09, up from 4.5% in F’08.
We expect the strong International growth trends to continue, as we expect MNST to benefit from the continued shift of recruiting dollars online, since we believe online penetration in International markets still remains below that of the U.S., and stronger employment markets. In addition, we expect MNST to continue to focus on improving its International operations and margins.
Valuation and Rating Analysis On a P/E basis, MNST trades 17.8x our F’08 pro-forma EPS estimate of $1.90, vs. ecommerce peers at 30.8x, a 42% discount. In addition, on an EV/EBITDA basis, Monster trades 8.6x our 2008 EBITDA estimate of $441M, vs. its ecommerce peers which trade at 19.2x 2008 estimates, a 55% discount. Despite current US macro conditions, we believe such a discount is unwarranted. We reiterate our Overweight rating.
Risks to Our Rating Monster Worldwide’s business model is highly dependent on the macroeconomic environment, as well as trends in the labor market. As a result, material negative changes in the overall economy could have an impact on our revenue and earnings estimates and could cause shares to underperform its peer group.
Our Overweight rating is largely predicated on the continued shift of classified advertising dollars from offline media to online. As such, should this shift not materialize to the extent we are forecasting, our estimates could be impacted to the downside.

211
North America Equity Research 02 January 2008
Imran Khan (1-212) 622-6693 [email protected]
Table 134: MNST Annual Income Statement $ in millions, except per share data
FY FY FY FY 2006 2007E 2008E 2009E
Revenues: Monster Careers 964.3 1,191.6 1,362.0 1,568.0 Internet Advertising & Fees 152.3 158.5 157.3 158.9 Total Revenues 1,116.7 1,350.0 1,519.4 1,726.9 Q/Q Revenue Growth Y/Y Revenue Growth 36.5% 20.9% 12.5% 13.7%
Salaries and Costs 401.0 501.0 550.7 626.0 Office and General 161.7 230.4 199.3 211.5 Marketing and Promotion 273.5 306.5 328.5 375.6 Unusual Inc./Expense - 11.2 - - Amort./Intangibles 8.9 5.2 - - Depreciation 30.9 41.0 57.0 57.0 Non-cash stock option expense Amortization of stock based comp 10.8 27.0 32.0 32.0 Total Operating Expenses 886.8 1,122.6 1,167.6 1,302.1 Pro Forma Operating Expenses 867.1 1,079.0 1,135.6 1,270.1
Operating Profit (Reported) 229.9 227.4 351.8 424.8 OIBDA 280.5 300.9 440.8 513.8 Adj Segment OIBDA 332.3 355.1 471.9 556.5 Operating Margins (Reported) 20.6% 16.8% 23.2% 24.6% OIBDA Margins 25.1% 22.3% 29.0% 29.8%
OIBDA Growth Y/Y 48.6% 7.3% 46.5% 16.6%
Interest and Other Income 22.91 26.2 28.7 29.6 Pretax Income 252.8 253.6 380.5 454.4 Tax Benefit (Exp) (87.7) (90.0) (133.2) (159.0) Losses in equity interest (9.5) (10.2) (4.0) (4.0) Minority Interest Income from Continuing Operations 155.6 153.4 243.3 291.4 Income from Discontinued Oper'ns (116.5) (0.5) - - Net Income--Inc. Discon'd Business 39.1 152.9 243.3 291.4 Cumulative effect of accounting change, net of tax benefit 1x time legal / Severance Net Income - Reported 39.1 152.9 243.3 291.4 Pro Forma Net Income 169.7 186.4 243.3 291.4
GAAP EPS $0.30 $1.17 $1.90 $2.27 Pro Forma EPS $1.29 $1.42 $1.90 $2.27
Diluted Shares Outstanding 131.2 131.3 127.8 127.5
Source: Company reports and JPMorgan estimates.
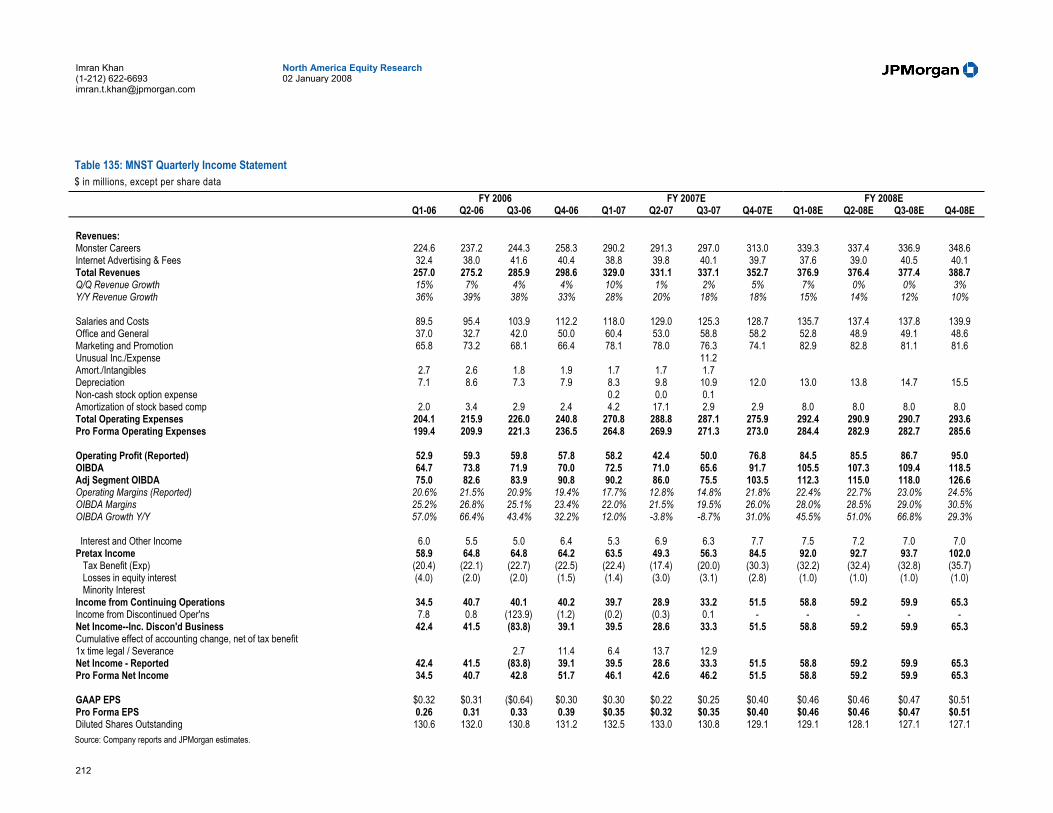
212
North America Equity Research 02 January 2008
Imran Khan (1-212) 622-6693 [email protected]
Table 135: MNST Quarterly Income Statement $ in millions, except per share data
FY 2006 FY 2007E FY 2008E Q1-06 Q2-06 Q3-06 Q4-06 Q1-07 Q2-07 Q3-07 Q4-07E Q1-08E Q2-08E Q3-08E Q4-08E
Revenues: Monster Careers 224.6 237.2 244.3 258.3 290.2 291.3 297.0 313.0 339.3 337.4 336.9 348.6 Internet Advertising & Fees 32.4 38.0 41.6 40.4 38.8 39.8 40.1 39.7 37.6 39.0 40.5 40.1 Total Revenues 257.0 275.2 285.9 298.6 329.0 331.1 337.1 352.7 376.9 376.4 377.4 388.7 Q/Q Revenue Growth 15% 7% 4% 4% 10% 1% 2% 5% 7% 0% 0% 3% Y/Y Revenue Growth 36% 39% 38% 33% 28% 20% 18% 18% 15% 14% 12% 10%
Salaries and Costs 89.5 95.4 103.9 112.2 118.0 129.0 125.3 128.7 135.7 137.4 137.8 139.9 Office and General 37.0 32.7 42.0 50.0 60.4 53.0 58.8 58.2 52.8 48.9 49.1 48.6 Marketing and Promotion 65.8 73.2 68.1 66.4 78.1 78.0 76.3 74.1 82.9 82.8 81.1 81.6 Unusual Inc./Expense 11.2 Amort./Intangibles 2.7 2.6 1.8 1.9 1.7 1.7 1.7 Depreciation 7.1 8.6 7.3 7.9 8.3 9.8 10.9 12.0 13.0 13.8 14.7 15.5 Non-cash stock option expense 0.2 0.0 0.1 Amortization of stock based comp 2.0 3.4 2.9 2.4 4.2 17.1 2.9 2.9 8.0 8.0 8.0 8.0 Total Operating Expenses 204.1 215.9 226.0 240.8 270.8 288.8 287.1 275.9 292.4 290.9 290.7 293.6 Pro Forma Operating Expenses 199.4 209.9 221.3 236.5 264.8 269.9 271.3 273.0 284.4 282.9 282.7 285.6
Operating Profit (Reported) 52.9 59.3 59.8 57.8 58.2 42.4 50.0 76.8 84.5 85.5 86.7 95.0 OIBDA 64.7 73.8 71.9 70.0 72.5 71.0 65.6 91.7 105.5 107.3 109.4 118.5 Adj Segment OIBDA 75.0 82.6 83.9 90.8 90.2 86.0 75.5 103.5 112.3 115.0 118.0 126.6 Operating Margins (Reported) 20.6% 21.5% 20.9% 19.4% 17.7% 12.8% 14.8% 21.8% 22.4% 22.7% 23.0% 24.5% OIBDA Margins 25.2% 26.8% 25.1% 23.4% 22.0% 21.5% 19.5% 26.0% 28.0% 28.5% 29.0% 30.5% OIBDA Growth Y/Y 57.0% 66.4% 43.4% 32.2% 12.0% -3.8% -8.7% 31.0% 45.5% 51.0% 66.8% 29.3%
Interest and Other Income 6.0 5.5 5.0 6.4 5.3 6.9 6.3 7.7 7.5 7.2 7.0 7.0 Pretax Income 58.9 64.8 64.8 64.2 63.5 49.3 56.3 84.5 92.0 92.7 93.7 102.0 Tax Benefit (Exp) (20.4) (22.1) (22.7) (22.5) (22.4) (17.4) (20.0) (30.3) (32.2) (32.4) (32.8) (35.7) Losses in equity interest (4.0) (2.0) (2.0) (1.5) (1.4) (3.0) (3.1) (2.8) (1.0) (1.0) (1.0) (1.0) Minority Interest Income from Continuing Operations 34.5 40.7 40.1 40.2 39.7 28.9 33.2 51.5 58.8 59.2 59.9 65.3 Income from Discontinued Oper'ns 7.8 0.8 (123.9) (1.2) (0.2) (0.3) 0.1 - - - - - Net Income--Inc. Discon'd Business 42.4 41.5 (83.8) 39.1 39.5 28.6 33.3 51.5 58.8 59.2 59.9 65.3 Cumulative effect of accounting change, net of tax benefit 1x time legal / Severance 2.7 11.4 6.4 13.7 12.9 Net Income - Reported 42.4 41.5 (83.8) 39.1 39.5 28.6 33.3 51.5 58.8 59.2 59.9 65.3 Pro Forma Net Income 34.5 40.7 42.8 51.7 46.1 42.6 46.2 51.5 58.8 59.2 59.9 65.3
GAAP EPS $0.32 $0.31 ($0.64) $0.30 $0.30 $0.22 $0.25 $0.40 $0.46 $0.46 $0.47 $0.51 Pro Forma EPS 0.26 0.31 0.33 0.39 $0.35 $0.32 $0.35 $0.40 $0.46 $0.46 $0.47 $0.51 Diluted Shares Outstanding 130.6 132.0 130.8 131.2 132.5 133.0 130.8 129.1 129.1 128.1 127.1 127.1 Source: Company reports and JPMorgan estimates.

213
North America Equity Research 02 January 2008
Imran Khan (1-212) 622-6693 [email protected]
Table 136: MNST Annual Balance Sheet $ in millions
FY FY FY FY 2006 2007E 2008E 2009E
Assets Cash/Equivalents 58.7 54.2 113.0 415.7 Marketable securities 537.9 511.7 511.7 511.7 Accounts Receivable 444.7 493.8 544.1 617.9 Prepaids/Others 82.5 - - - Assets Discont. Ops. - - - - Work in Progress - - - - Total current assets 1,123.8 1,059.8 1,168.9 1,545.3
Prop. & Equip., Net 102.4 115.8 98.1 81.3 Goodwill 589.0 662.7 662.7 662.7 Intangibles, Net 51.7 - Investment in unconsolidated affiliate - Other Assets 43.2 206.2 206.2 206.2 Assets Discont. Ops. - - - - Total assets 1,969.8 2,044.5 2,135.9 2,495.5
- Liabilities and stockholders' equity - Accounts Payable and accrued expenses 358.9 299.8 326.5 364.1 Deferred Revenues 444.1 511.4 563.6 640.0 Cur.Port.LT Debt 23.2 - - - Current liabilities of discontinued operations - - - Oth. Curr. Liab. - - - - Total current liabilities 826.2 811.3 890.1 1,004.1
Long term debt, less current portion 0.4 1.9 1.9 1.9 Deferred income taxes - - Other LT Liabs. 33.5 124.2 124.2 124.2 Long term liabilities of discontinued operations - - - Total Long Term Liabilities 33.9 126.2 126.2 126.2
Minority Interests - - - -
Total Liabilities 860.1 937.4 1,016.2 1,130.3
Stockholders' equity: - - - - Common Stock 0.1 0.1 0.1 0.1 Other Equity - - - - Paid in Capital 1,636.0 1,455.4 1,224.7 1,178.9 Accumulated other comprehensive income 87.6 115.8 115.8 115.8 Unamortized stock based compensation - - - Treasury Stock - - - - Accummulated Deficit (614.1) (464.3) (221.0) 70.4 Total stockholders' equity 1,109.7 1,107.0 1,119.7 1,200.7 Total L&S 1,969.8 2,044.5 2,135.9 2,261.9 Source: Company reports and JPMorgan estimates.
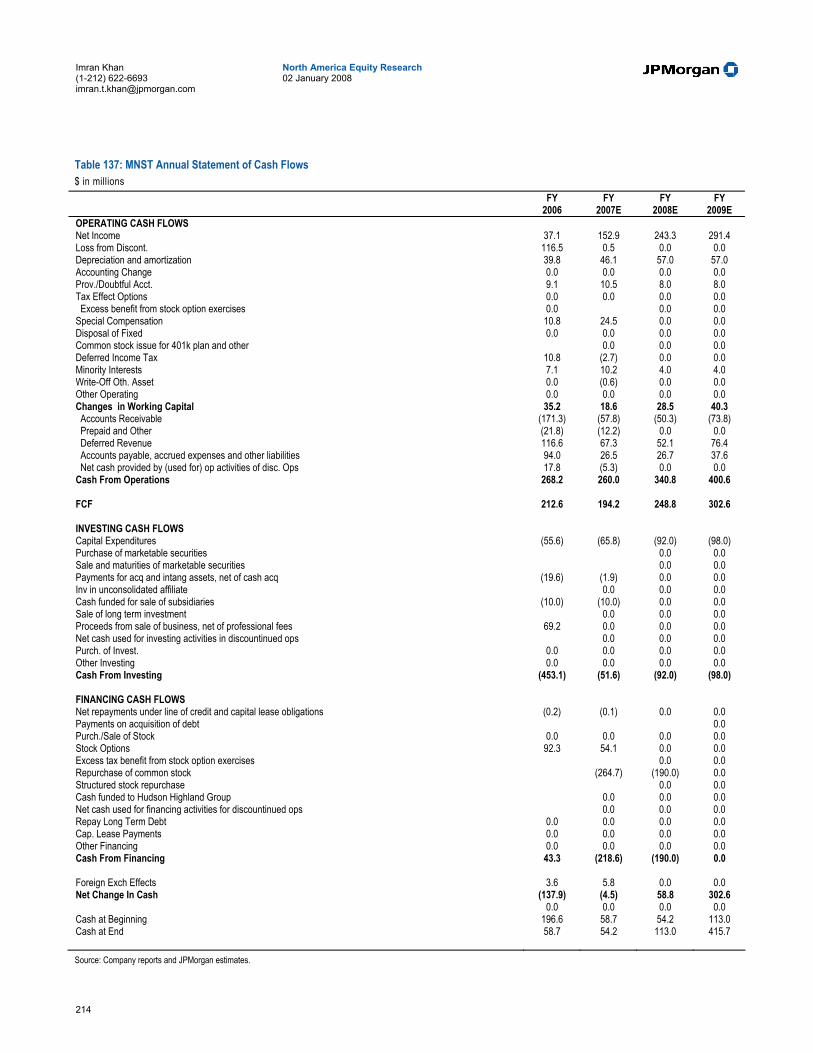
214
North America Equity Research 02 January 2008
Imran Khan (1-212) 622-6693 [email protected]
Table 137: MNST Annual Statement of Cash Flows $ in millions
FY FY FY FY 2006 2007E 2008E 2009E
OPERATING CASH FLOWS Net Income 37.1 152.9 243.3 291.4 Loss from Discont. 116.5 0.5 0.0 0.0 Depreciation and amortization 39.8 46.1 57.0 57.0 Accounting Change 0.0 0.0 0.0 0.0 Prov./Doubtful Acct. 9.1 10.5 8.0 8.0 Tax Effect Options 0.0 0.0 0.0 0.0 Excess benefit from stock option exercises 0.0 0.0 0.0 Special Compensation 10.8 24.5 0.0 0.0 Disposal of Fixed 0.0 0.0 0.0 0.0 Common stock issue for 401k plan and other 0.0 0.0 0.0 Deferred Income Tax 10.8 (2.7) 0.0 0.0 Minority Interests 7.1 10.2 4.0 4.0 Write-Off Oth. Asset 0.0 (0.6) 0.0 0.0 Other Operating 0.0 0.0 0.0 0.0 Changes in Working Capital 35.2 18.6 28.5 40.3 Accounts Receivable (171.3) (57.8) (50.3) (73.8) Prepaid and Other (21.8) (12.2) 0.0 0.0 Deferred Revenue 116.6 67.3 52.1 76.4 Accounts payable, accrued expenses and other liabilities 94.0 26.5 26.7 37.6 Net cash provided by (used for) op activities of disc. Ops 17.8 (5.3) 0.0 0.0 Cash From Operations 268.2 260.0 340.8 400.6
FCF 212.6 194.2 248.8 302.6
INVESTING CASH FLOWS Capital Expenditures (55.6) (65.8) (92.0) (98.0) Purchase of marketable securities 0.0 0.0 Sale and maturities of marketable securities 0.0 0.0 Payments for acq and intang assets, net of cash acq (19.6) (1.9) 0.0 0.0 Inv in unconsolidated affiliate 0.0 0.0 0.0 Cash funded for sale of subsidiaries (10.0) (10.0) 0.0 0.0 Sale of long term investment 0.0 0.0 0.0 Proceeds from sale of business, net of professional fees 69.2 0.0 0.0 0.0 Net cash used for investing activities in discountinued ops 0.0 0.0 0.0 Purch. of Invest. 0.0 0.0 0.0 0.0 Other Investing 0.0 0.0 0.0 0.0 Cash From Investing (453.1) (51.6) (92.0) (98.0)
FINANCING CASH FLOWS Net repayments under line of credit and capital lease obligations (0.2) (0.1) 0.0 0.0 Payments on acquisition of debt 0.0 Purch./Sale of Stock 0.0 0.0 0.0 0.0 Stock Options 92.3 54.1 0.0 0.0 Excess tax benefit from stock option exercises 0.0 0.0 Repurchase of common stock (264.7) (190.0) 0.0 Structured stock repurchase 0.0 0.0 Cash funded to Hudson Highland Group 0.0 0.0 0.0 Net cash used for financing activities for discountinued ops 0.0 0.0 0.0 Repay Long Term Debt 0.0 0.0 0.0 0.0 Cap. Lease Payments 0.0 0.0 0.0 0.0 Other Financing 0.0 0.0 0.0 0.0 Cash From Financing 43.3 (218.6) (190.0) 0.0
Foreign Exch Effects 3.6 5.8 0.0 0.0 Net Change In Cash (137.9) (4.5) 58.8 302.6
0.0 0.0 0.0 0.0 Cash at Beginning 196.6 58.7 54.2 113.0 Cash at End 58.7 54.2 113.0 415.7 Source: Company reports and JPMorgan estimates.
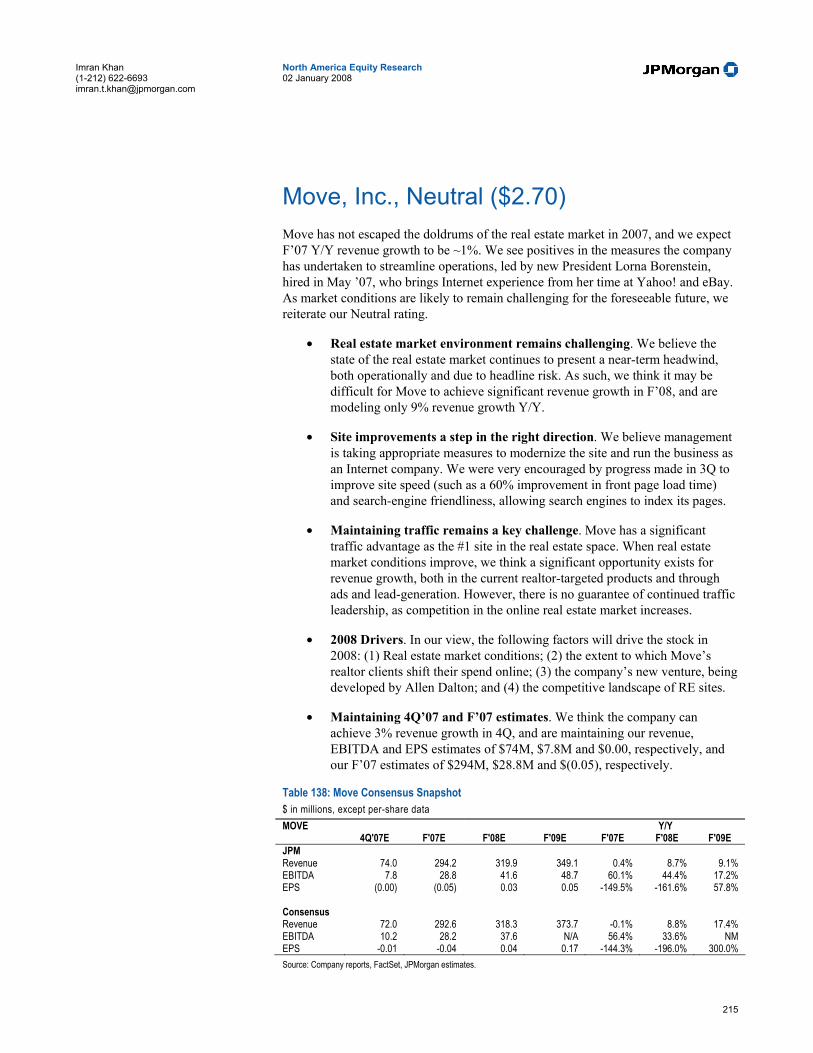
215
North America Equity Research 02 January 2008
Imran Khan (1-212) 622-6693 [email protected]
Move, Inc., Neutral ($2.70) Move has not escaped the doldrums of the real estate market in 2007, and we expect F’07 Y/Y revenue growth to be ~1%. We see positives in the measures the company has undertaken to streamline operations, led by new President Lorna Borenstein, hired in May ’07, who brings Internet experience from her time at Yahoo! and eBay. As market conditions are likely to remain challenging for the foreseeable future, we reiterate our Neutral rating.
• Real estate market environment remains challenging. We believe the state of the real estate market continues to present a near-term headwind, both operationally and due to headline risk. As such, we think it may be difficult for Move to achieve significant revenue growth in F’08, and are modeling only 9% revenue growth Y/Y.
• Site improvements a step in the right direction. We believe management is taking appropriate measures to modernize the site and run the business as an Internet company. We were very encouraged by progress made in 3Q to improve site speed (such as a 60% improvement in front page load time) and search-engine friendliness, allowing search engines to index its pages.
• Maintaining traffic remains a key challenge. Move has a significant traffic advantage as the #1 site in the real estate space. When real estate market conditions improve, we think a significant opportunity exists for revenue growth, both in the current realtor-targeted products and through ads and lead-generation. However, there is no guarantee of continued traffic leadership, as competition in the online real estate market increases.
• 2008 Drivers. In our view, the following factors will drive the stock in 2008: (1) Real estate market conditions; (2) the extent to which Move’s realtor clients shift their spend online; (3) the company’s new venture, being developed by Allen Dalton; and (4) the competitive landscape of RE sites.
• Maintaining 4Q’07 and F’07 estimates. We think the company can achieve 3% revenue growth in 4Q, and are maintaining our revenue, EBITDA and EPS estimates of $74M, $7.8M and $0.00, respectively, and our F’07 estimates of $294M, $28.8M and $(0.05), respectively.
Table 138: Move Consensus Snapshot $ in millions, except per-share data MOVE Y/Y 4Q'07E F'07E F'08E F'09E F'07E F'08E F'09E JPM Revenue 74.0 294.2 319.9 349.1 0.4% 8.7% 9.1% EBITDA 7.8 28.8 41.6 48.7 60.1% 44.4% 17.2% EPS (0.00) (0.05) 0.03 0.05 -149.5% -161.6% 57.8%
Consensus Revenue 72.0 292.6 318.3 373.7 -0.1% 8.8% 17.4% EBITDA 10.2 28.2 37.6 N/A 56.4% 33.6% NM EPS -0.01 -0.04 0.04 0.17 -144.3% -196.0% 300.0% Source: Company reports, FactSet, JPMorgan estimates.

216
North America Equity Research 02 January 2008
Imran Khan (1-212) 622-6693 [email protected]
Our Estimates and Outlook for 2008 Although we think real estate market conditions are likely to remain challenging in F’08, we expect a slight improvement to Move’s operating results in the coming year, as we think initiatives the company is undertaking to make the site more efficient may start to pay off.
As such, we are maintaining our F’08 revenue, EBITDA and EPS estimates of $320M, $41.6M and $0.03. Our revenue forecast implies 9% Y/Y growth, coming on the heels of projected 1% revenue growth in F’07. We think Realtor.com revenue can grow 10% Y/Y, and are forecasting Welcome Wagon revenue growth of 2% in F’08.
Our Estimates and Outlook for 2009 We do not, alas, have a crystal ball to predict whether F’09 will see a significant turnaround in the fortunes of the US real estate market. At the same time, we think that, independent of the timing of such a turnaround, the challenging conditions we are currently seeing are likely to force the industry to more critically evaluate its approaches to marketing. We believe such a re-examination can only benefit a company like Move, the current traffic leader in the online real estate space. As such we think our F’09 projection of a second consecutive year of 9% revenue growth is fairly conservative.
For F’09, our projections call for revenue of $349M, EBITDA of $48.7M and EPS of $0.05. We note that neither our F’08 nor our F’09 projections include any impact from the project, thus far kept under tight wraps by the company, spearheaded by Allen Dalton. While we think it’s likely the project will not have an immediate material impact, near-term profitability may be affected if the project requires significant up-front investment.
Valuation and Rating Analysis On an EV/EBITDA basis, MOVE trades 5.6x our F’08 EBITDA estimate of $42M, versus the Internet real estate group at 5.5x. We believe that current real estate market conditions make significant multiple expansion unlikely at this time.
Risks to Our Rating Move’s revenues and earnings are highly dependent on the health of the real estate market, which is impacted by macroeconomic conditions outside of Move’s immediate control. If the real estate market rebounds sooner than we are estimating, there could be upside to our current estimates. If it takes MOVE longer to realign the Welcome Wagon business than we are estimating, or the real estate market deteriorates beyond current expectations, there could be downside to our current estimates.
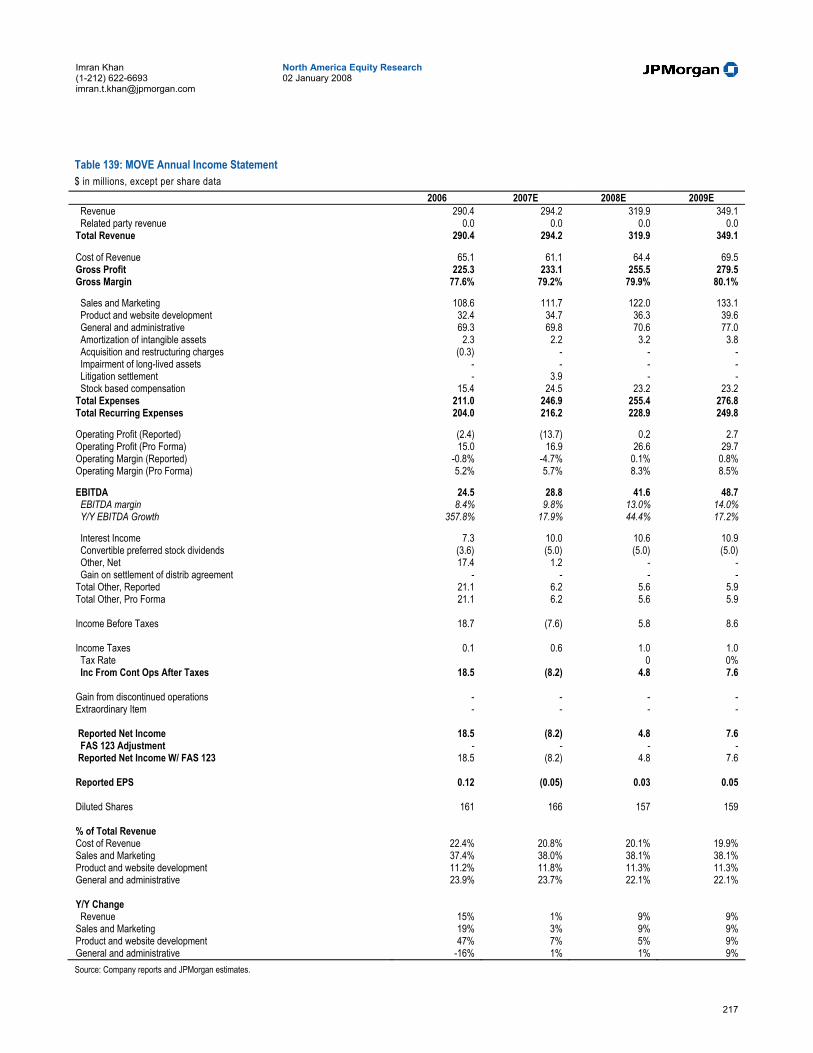
217
North America Equity Research 02 January 2008
Imran Khan (1-212) 622-6693 [email protected]
Table 139: MOVE Annual Income Statement $ in millions, except per share data
2006 2007E 2008E 2009E Revenue 290.4 294.2 319.9 349.1 Related party revenue 0.0 0.0 0.0 0.0 Total Revenue 290.4 294.2 319.9 349.1 Cost of Revenue 65.1 61.1 64.4 69.5 Gross Profit 225.3 233.1 255.5 279.5 Gross Margin 77.6% 79.2% 79.9% 80.1% Sales and Marketing 108.6 111.7 122.0 133.1 Product and website development 32.4 34.7 36.3 39.6 General and administrative 69.3 69.8 70.6 77.0 Amortization of intangible assets 2.3 2.2 3.2 3.8 Acquisition and restructuring charges (0.3) - - - Impairment of long-lived assets - - - - Litigation settlement - 3.9 - - Stock based compensation 15.4 24.5 23.2 23.2 Total Expenses 211.0 246.9 255.4 276.8 Total Recurring Expenses 204.0 216.2 228.9 249.8 Operating Profit (Reported) (2.4) (13.7) 0.2 2.7 Operating Profit (Pro Forma) 15.0 16.9 26.6 29.7 Operating Margin (Reported) -0.8% -4.7% 0.1% 0.8% Operating Margin (Pro Forma) 5.2% 5.7% 8.3% 8.5% EBITDA 24.5 28.8 41.6 48.7 EBITDA margin 8.4% 9.8% 13.0% 14.0% Y/Y EBITDA Growth 357.8% 17.9% 44.4% 17.2% Interest Income 7.3 10.0 10.6 10.9 Convertible preferred stock dividends (3.6) (5.0) (5.0) (5.0) Other, Net 17.4 1.2 - - Gain on settlement of distrib agreement - - - - Total Other, Reported 21.1 6.2 5.6 5.9 Total Other, Pro Forma 21.1 6.2 5.6 5.9 Income Before Taxes 18.7 (7.6) 5.8 8.6 Income Taxes 0.1 0.6 1.0 1.0 Tax Rate 0 0% Inc From Cont Ops After Taxes 18.5 (8.2) 4.8 7.6 Gain from discontinued operations - - - - Extraordinary Item - - - - Reported Net Income 18.5 (8.2) 4.8 7.6 FAS 123 Adjustment - - - - Reported Net Income W/ FAS 123 18.5 (8.2) 4.8 7.6 Reported EPS 0.12 (0.05) 0.03 0.05 Diluted Shares 161 166 157 159 % of Total Revenue Cost of Revenue 22.4% 20.8% 20.1% 19.9% Sales and Marketing 37.4% 38.0% 38.1% 38.1% Product and website development 11.2% 11.8% 11.3% 11.3% General and administrative 23.9% 23.7% 22.1% 22.1% Y/Y Change Revenue 15% 1% 9% 9% Sales and Marketing 19% 3% 9% 9% Product and website development 47% 7% 5% 9% General and administrative -16% 1% 1% 9% Source: Company reports and JPMorgan estimates.

218
North America Equity Research 02 January 2008
Imran Khan (1-212) 622-6693 [email protected]
Table 140: MOVE Quarterly Income Statement $ in millions, except per share data
FY 2006 FY 2007E FY 2008E Q1-06 Q2-06 Q3-06 Q4-06 Q1-07 Q2-07 Q3-07 Q4-07E Q1-08E Q2-08E Q3-08E Q4-08E
Revenue 69.0 73.9 75.7 71.8 71.0 73.6 75.6 74.0 76.0 81.1 82.5 80.4 Related party revenue - - - - - - - - - - Total Revenue 69.0 73.9 75.7 71.8 71.0 73.6 75.6 74.0 76.0 81.1 82.5 80.4 Cost of Revenue 16.3 16.4 16.9 15.5 14.7 15.3 16.0 15.2 15.2 16.5 16.7 16.1 Gross Profit 52.7 57.5 58.7 56.4 56.4 58.4 59.6 58.8 60.8 64.6 65.8 64.3 Gross Margin 76.4% 77.8% 77.6% 78.5% 79.4% 79.3% 78.9% 79.4% 80.0% 79.7% 79.8% 80.0% Sales and Marketing 24.9 28.0 28.6 27.1 27.4 27.3 28.3 28.8 29.3 31.2 31.3 30.2 Product and website development 7.9 8.5 8.2 7.9 8.5 9.0 8.3 8.8 8.9 9.3 9.2 8.8 General and administrative 18.7 17.5 17.3 15.7 16.1 17.9 19.1 16.7 17.2 18.3 18.1 17.1 Amortization of intangible assets 0.7 0.6 0.5 0.5 0.5 0.5 0.5 0.7 0.8 0.8 0.8 0.8 Acquisition and restructuring charges - - (0.3) - 0.0 0.0 0.0 0.0 0.0 0.0 0.0 0.0 Impairment of long-lived assets - - - - 0.0 0.0 0.0 0.0 0.0 0.0 0.0 0.0 Litigation settlement - - - - 0.0 0.0 3.9 0.0 0.0 0.0 0.0 0.0 Stock based compensation 3.4 2.5 4.2 5.3 5.4 7.8 5.9 5.3 5.6 5.6 5.7 6.3 Total Expenses 55.5 57.1 58.6 56.5 58.0 62.6 66.0 60.3 61.8 65.2 65.1 63.2 Total Recurring Expenses 51.4 54.0 54.2 50.7 52.0 54.3 55.7 54.3 55.4 58.8 58.6 56.1 Operating Profit (Reported) (2.8) 0.4 0.2 (0.1) (1.6) (4.2) (6.4) (1.5) (1.0) (0.6) 0.7 1.2 Operating Profit (Pro Forma) 1.3 3.5 4.5 5.7 4.3 4.1 3.9 4.5 5.4 5.8 7.2 8.3 Operating Margin (Reported) -4.1% 0.5% 0.2% -0.2% -2.2% -5.7% -8.5% -2.1% -1.4% -0.8% 0.8% 1.5% Operating Margin (Pro Forma) 1.8% 4.8% 6.0% 7.9% 6.1% 5.6% 5.2% 6.1% 7.1% 7.1% 8.7% 10.3% EBITDA 3.9 4.7 7.4 8.5 7.1 6.9 7.0 7.8 8.9 9.3 11.2 12.3 EBITDA margin 5.6% 6.4% 9.8% 11.8% 10.0% 9.4% 9.2% 10.6% 11.7% 11.4% 13.5% 15.3% Y/Y EBITDA Growth 57.7% 64.4% 160.0% NA 84.7% 46.5% -6.2% -7.5% 24.8% 33.8% 60.4% 57.2% Interest Income 1.6 1.8 1.9 1.9 2.3 2.5 2.6 2.6 2.6 2.6 2.7 2.7 Convertible preferred stock dividends (0.9) (0.9) (0.9) (0.9) (1.2) (1.2) (1.2) (1.2) (1.2) (1.2) (1.2) (1.2) Other, Net 0.1 0.4 0.1 16.8 0.8 (0.4) 0.7 0.1 - - - - Gain on settlement of distrib agreement - - - - - - - - - - - Total Other, Reported 0.8 1.3 1.1 17.9 1.8 0.9 2.0 1.4 1.4 1.4 1.4 1.4 Total Other, Pro Forma 0.8 1.3 1.1 17.9 1.8 0.9 2.0 1.4 1.4 1.4 1.4 1.4 Income Before Taxes (2.0) 1.7 1.3 17.7 0.2 (3.3) (4.4) (0.1) 0.3 0.8 2.1 2.6 Income Taxes - - - 0.1 0.1 0.2 0.2 0.2 0.3 0.2 0.2 0.3 Tax Rate 0% 0% 0% 0% 0% 0% 0% 0% 0% 0% 0% Inc From Cont Ops After Taxes (2.0) 1.7 1.3 17.6 0.2 (3.5) (4.6) -0.3 (0.0) 0.6 1.9 2.4 Gain from discontinued operations - - - - - - - - - - - - Extraordinary Item - - - - - - - - - - - -
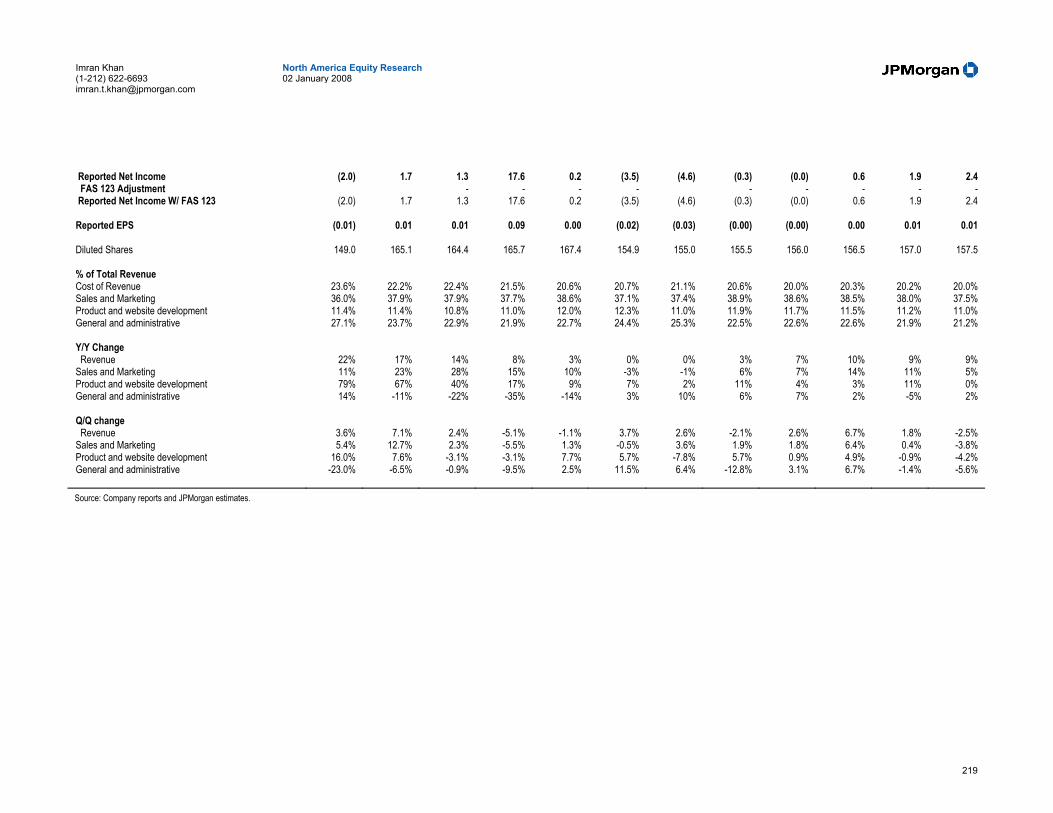
219
North America Equity Research 02 January 2008
Imran Khan (1-212) 622-6693 [email protected]
Reported Net Income (2.0) 1.7 1.3 17.6 0.2 (3.5) (4.6) (0.3) (0.0) 0.6 1.9 2.4 FAS 123 Adjustment - - - - - - - - - Reported Net Income W/ FAS 123 (2.0) 1.7 1.3 17.6 0.2 (3.5) (4.6) (0.3) (0.0) 0.6 1.9 2.4 Reported EPS (0.01) 0.01 0.01 0.09 0.00 (0.02) (0.03) (0.00) (0.00) 0.00 0.01 0.01 Diluted Shares 149.0 165.1 164.4 165.7 167.4 154.9 155.0 155.5 156.0 156.5 157.0 157.5 % of Total Revenue Cost of Revenue 23.6% 22.2% 22.4% 21.5% 20.6% 20.7% 21.1% 20.6% 20.0% 20.3% 20.2% 20.0% Sales and Marketing 36.0% 37.9% 37.9% 37.7% 38.6% 37.1% 37.4% 38.9% 38.6% 38.5% 38.0% 37.5% Product and website development 11.4% 11.4% 10.8% 11.0% 12.0% 12.3% 11.0% 11.9% 11.7% 11.5% 11.2% 11.0% General and administrative 27.1% 23.7% 22.9% 21.9% 22.7% 24.4% 25.3% 22.5% 22.6% 22.6% 21.9% 21.2% Y/Y Change Revenue 22% 17% 14% 8% 3% 0% 0% 3% 7% 10% 9% 9% Sales and Marketing 11% 23% 28% 15% 10% -3% -1% 6% 7% 14% 11% 5% Product and website development 79% 67% 40% 17% 9% 7% 2% 11% 4% 3% 11% 0% General and administrative 14% -11% -22% -35% -14% 3% 10% 6% 7% 2% -5% 2% Q/Q change Revenue 3.6% 7.1% 2.4% -5.1% -1.1% 3.7% 2.6% -2.1% 2.6% 6.7% 1.8% -2.5% Sales and Marketing 5.4% 12.7% 2.3% -5.5% 1.3% -0.5% 3.6% 1.9% 1.8% 6.4% 0.4% -3.8% Product and website development 16.0% 7.6% -3.1% -3.1% 7.7% 5.7% -7.8% 5.7% 0.9% 4.9% -0.9% -4.2% General and administrative -23.0% -6.5% -0.9% -9.5% 2.5% 11.5% 6.4% -12.8% 3.1% 6.7% -1.4% -5.6% Source: Company reports and JPMorgan estimates.

220
North America Equity Research 02 January 2008
Imran Khan (1-212) 622-6693 [email protected]
Table 141: MOVE Annual Balance Sheet $ in millions
FY-06E FY-07E FY-08E FY-09E
Assets Cash and cash equivalents 14.9 28.1 63.3 104.9 Restricted cash - - - - Short term investments 143.0 165.1 165.1 165.1 Marketable securities - - Accounts receivable, net 18.3 18.5 20.1 22.0 Current portion of distribution expense - - - - Assets of discontinued operations - - - - Other current assets 34.5 18.5 20.1 22.0 Total Current Assets 210.6 230.2 268.6 313.9 - - - Prepaid distribution expense, net of current portion - - - - Property and equipment, net 29.2 36.2 34.2 31.6 Goodwill, net 23.9 23.9 23.9 23.9 Intangible assets, net 16.7 15.8 15.8 15.8 Restricted cash 4.3 3.3 3.3 3.3 Other assets 1.2 1.6 1.6 1.6 Total Long Term Assets 75.4 80.8 78.8 76.2 - - - Total Assets 285.9 311.0 347.4 390.1 - - - - - - Liabilities - - - Accounts payable 4.9 5.2 5.6 6.2 Accrued expenses 26.7 25.9 28.2 30.8 Accrued litigation settlement - - - - Accrued distribution obligation - - - - Obligation under capital leases 1.9 2.0 2.0 2.0 Deferred revenue 50.1 51.8 56.3 61.5 Deferred revenue from related parties - - - - Liabilities of discontinued operations - - - - Total Current Liabilities 83.6 84.9 92.1 100.4 - - - Distribution obligation, net of current portion - - - - Obligation under capital leases 2.2 0.7 0.7 0.7 Deferred revenue - - - - Deferred revenue from related parties - - - - Other non-current liabilities 2.5 1.9 1.9 1.9 Total Long Term Liabilities 4.7 2.5 2.5 2.5 - - - Total Liabilities 88.3 87.4 94.6 102.9 - - - Convertible preferred stock 96.2 99.9 99.9 99.9 - - - Shareholder Equity - - - Total Equity 101.5 123.7 152.8 187.2 - - - Total Liabilities + Equity 285.9 311.0 347.4 390.1 Source: Company reports and JPMorgan estimates.
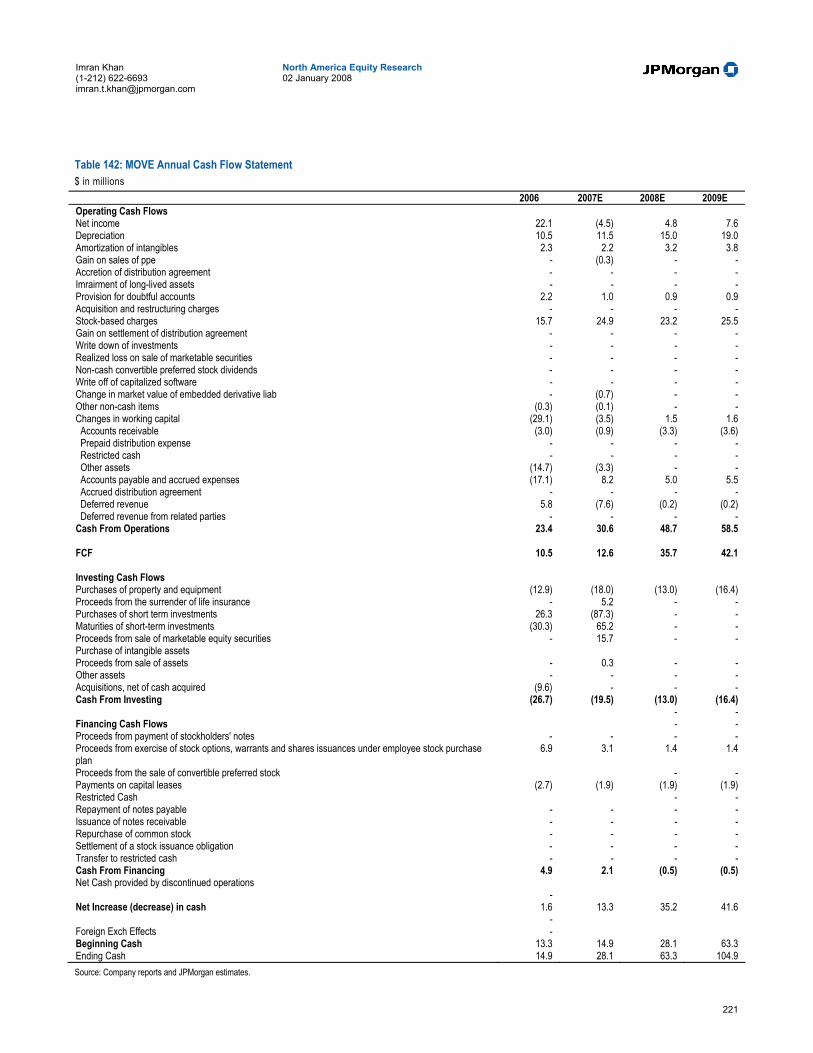
221
North America Equity Research 02 January 2008
Imran Khan (1-212) 622-6693 [email protected]
Table 142: MOVE Annual Cash Flow Statement $ in millions
2006 2007E 2008E 2009E Operating Cash Flows Net income 22.1 (4.5) 4.8 7.6 Depreciation 10.5 11.5 15.0 19.0 Amortization of intangibles 2.3 2.2 3.2 3.8 Gain on sales of ppe - (0.3) - - Accretion of distribution agreement - - - - Imrairment of long-lived assets - - - - Provision for doubtful accounts 2.2 1.0 0.9 0.9 Acquisition and restructuring charges - - - - Stock-based charges 15.7 24.9 23.2 25.5 Gain on settlement of distribution agreement - - - - Write down of investments - - - - Realized loss on sale of marketable securities - - - - Non-cash convertible preferred stock dividends - - - - Write off of capitalized software - - - - Change in market value of embedded derivative liab - (0.7) - - Other non-cash items (0.3) (0.1) - - Changes in working capital (29.1) (3.5) 1.5 1.6 Accounts receivable (3.0) (0.9) (3.3) (3.6) Prepaid distribution expense - - - - Restricted cash - - - - Other assets (14.7) (3.3) - - Accounts payable and accrued expenses (17.1) 8.2 5.0 5.5 Accrued distribution agreement - - - - Deferred revenue 5.8 (7.6) (0.2) (0.2) Deferred revenue from related parties - - - - Cash From Operations 23.4 30.6 48.7 58.5 FCF 10.5 12.6 35.7 42.1 Investing Cash Flows Purchases of property and equipment (12.9) (18.0) (13.0) (16.4) Proceeds from the surrender of life insurance - 5.2 - - Purchases of short term investments 26.3 (87.3) - - Maturities of short-term investments (30.3) 65.2 - - Proceeds from sale of marketable equity securities - 15.7 - - Purchase of intangible assets Proceeds from sale of assets - 0.3 - - Other assets - - - - Acquisitions, net of cash acquired (9.6) - - - Cash From Investing (26.7) (19.5) (13.0) (16.4) - - Financing Cash Flows - - Proceeds from payment of stockholders' notes - - - - Proceeds from exercise of stock options, warrants and shares issuances under employee stock purchase plan
6.9 3.1 1.4 1.4
Proceeds from the sale of convertible preferred stock - - Payments on capital leases (2.7) (1.9) (1.9) (1.9) Restricted Cash - - Repayment of notes payable - - - - Issuance of notes receivable - - - - Repurchase of common stock - - - - Settlement of a stock issuance obligation - - - - Transfer to restricted cash - - - - Cash From Financing 4.9 2.1 (0.5) (0.5) Net Cash provided by discontinued operations - Net Increase (decrease) in cash 1.6 13.3 35.2 41.6 - Foreign Exch Effects - Beginning Cash 13.3 14.9 28.1 63.3 Ending Cash 14.9 28.1 63.3 104.9 Source: Company reports and JPMorgan estimates.
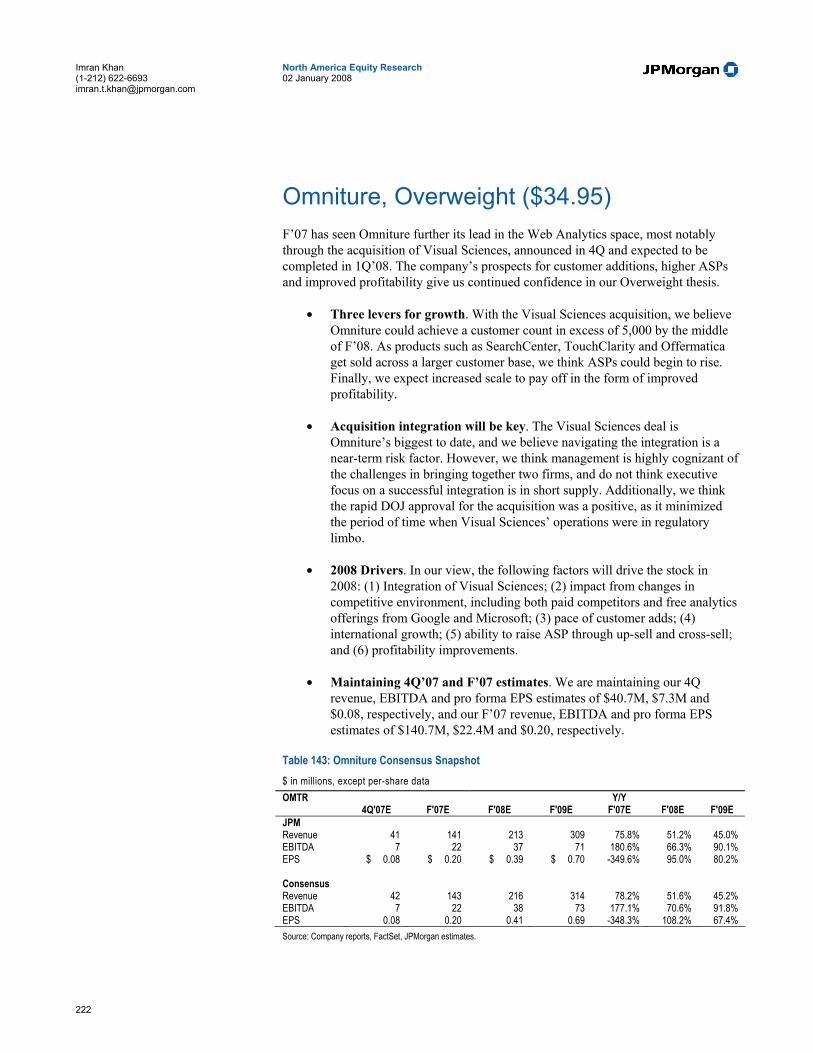
222
North America Equity Research 02 January 2008
Imran Khan (1-212) 622-6693 [email protected]
Omniture, Overweight ($34.95) F’07 has seen Omniture further its lead in the Web Analytics space, most notably through the acquisition of Visual Sciences, announced in 4Q and expected to be completed in 1Q’08. The company’s prospects for customer additions, higher ASPs and improved profitability give us continued confidence in our Overweight thesis.
• Three levers for growth. With the Visual Sciences acquisition, we believe Omniture could achieve a customer count in excess of 5,000 by the middle of F’08. As products such as SearchCenter, TouchClarity and Offermatica get sold across a larger customer base, we think ASPs could begin to rise. Finally, we expect increased scale to pay off in the form of improved profitability.
• Acquisition integration will be key. The Visual Sciences deal is Omniture’s biggest to date, and we believe navigating the integration is a near-term risk factor. However, we think management is highly cognizant of the challenges in bringing together two firms, and do not think executive focus on a successful integration is in short supply. Additionally, we think the rapid DOJ approval for the acquisition was a positive, as it minimized the period of time when Visual Sciences’ operations were in regulatory limbo.
• 2008 Drivers. In our view, the following factors will drive the stock in 2008: (1) Integration of Visual Sciences; (2) impact from changes in competitive environment, including both paid competitors and free analytics offerings from Google and Microsoft; (3) pace of customer adds; (4) international growth; (5) ability to raise ASP through up-sell and cross-sell; and (6) profitability improvements.
• Maintaining 4Q’07 and F’07 estimates. We are maintaining our 4Q revenue, EBITDA and pro forma EPS estimates of $40.7M, $7.3M and $0.08, respectively, and our F’07 revenue, EBITDA and pro forma EPS estimates of $140.7M, $22.4M and $0.20, respectively.
Table 143: Omniture Consensus Snapshot $ in millions, except per-share data OMTR Y/Y 4Q'07E F'07E F'08E F'09E F'07E F'08E F'09E JPM Revenue 41 141 213 309 75.8% 51.2% 45.0% EBITDA 7 22 37 71 180.6% 66.3% 90.1% EPS $ 0.08 $ 0.20 $ 0.39 $ 0.70 -349.6% 95.0% 80.2%
Consensus Revenue 42 143 216 314 78.2% 51.6% 45.2% EBITDA 7 22 38 73 177.1% 70.6% 91.8% EPS 0.08 0.20 0.41 0.69 -348.3% 108.2% 67.4% Source: Company reports, FactSet, JPMorgan estimates.

223
North America Equity Research 02 January 2008
Imran Khan (1-212) 622-6693 [email protected]
The Growth Trajectory Our Overweight thesis for Omniture is based on three key points:
• Customer additions. The company estimates that, even after the Visual Sciences acquisition is completed, its penetration among the top 10,000 Internet sites will be just north of 10%. As such, there remains significant room for customer growth, with much of the customer base still a greenfield opportunity.
• ASP growth. Omniture had made two acquisitions, TouchClarity and Offermatica, which gave it access to products with higher ASPs than the core SiteCatalyst product. The two acquired companies did not have the sales force scale that Omniture has. As such, we believe adding such products gives Omniture’s sales force a significant opportunity to sell these high-ASP products across a much wider customer base. We note that SearchCenter, another higher-ASP product, has reached ~18%-20% penetration among the company’s customer base, less than two years after its initial introduction. We believe the availability of additional products for cross-selling gives Omniture the ability to drive higher ASPs going forward:
Table 144: TouchClarity and Offermatica ASP, compared to SiteCatalyst Announced Completion ASP estimate
TouchClarity 2/14/2007 3/1/2007 1x-2x SiteCatalyst ASP Offermatica 9/7/2007 12/13/07 .75x-1x SiteCatalyst ASP Source: Company Reports, JPMorgan estimates
• Scale to drive profitability. As the company scales its technology and sales force, we believe improved efficiencies are likely to drive profitability. The company has noted it expects to expand non-GAAP operating margins roughly 1% per quarter in F’08.
Our Estimates and Outlook for 2008 As the Visual Sciences acquisition has not yet been finalized, we note that our projections for F’08 and F’09 do not include any impact from that acquisition.
We are maintaining our F’08 revenue, EBITDA and pro forma EPS estimates of $213M, $37.3M and $0.39. We expect subscription revenue per customer to begin rising on a Y/Y basis in the second half of the year as product cross-selling gains momentum.
Our Estimates and Outlook for 2009 We expect Omniture to grow revenue 45% Y/Y in F’09, to $309M. We are modeling $70.9M in EBITDA, implying 5.5% Y/Y EBITDA margin improvement, and $0.70 pro forma EPS.
Valuation and Rating Analysis Given Omniture’s continued market share gains and strong operating leverage, we are maintaining our Overweight rating. On an EV/EBITDA basis, Omniture trades at 60.8x our F’08 EBITDA estimate of $37M, vs. its peers at 39.8x F’08 estimates. However, we believe Omniture’s rapid growth deserves a higher premium.

224
North America Equity Research 02 January 2008
Imran Khan (1-212) 622-6693 [email protected]
Risks to Our Rating Omniture derives more than 90% of its revenue from subscription revenues. If the company undergoes a precipitous rise in churn rates, the company’s revenue growth could be impacted. The web analytics space is extremely competitive with over 20 companies providing analytics solutions. Should Omniture’s proposed acquisition of Visual Sciences not go through, or go through slower than expected, the stock could underperform. Google’s acquisition of Urchin and subsequent announcement of free analytics may entice some mid-market customers to discontinue paying for web analytics, or may pressure Omniture’s existing pricing dynamics. Also, if Omniture fails to gain market share as we anticipate, our revenue estimates could prove optimistic. Omniture’s numerous enterprise customers could choose to build analytics solutions in-house, which could negatively impact the company’s growth rates. Finally, should recent acquisitions be more difficult to integrate than we expect, Omniture’s future performance could suffer as a result.

225
North America Equity Research 02 January 2008
Imran Khan (1-212) 622-6693 [email protected]
Table 145: OMTR Annual Income Statement $ in millions, except per share data
2006 2007E 2008E 2009E Subscription 74.6 129.8 198.1 288.3 Professional services and other 5.2 10.9 14.6 20.3 Total Revenues 79.7 140.7 212.8 308.6 Cost of Revenues 31.8 51.6 71.7 95.3 Gross Profit 47.9 89.0 141.1 213.3 Gross Margin 60.1% 63.3% 66.3% 69.1% Sales & marketing 35.2 61.5 96.4 125.3 Research & development 8.7 16.5 22.2 29.1 General and administrative 12.1 23.1 24.7 30.4 Litigation settlement - - - - Total Operating Expenses 56.1 101.1 143.3 184.7 Operating Profit (Loss) (8.1) (12.0) (2.3) 28.5 Operating Margin -10.2% -8.6% -1.1% 9.2% EBITDA 8.0 22.4 37.3 70.9 EBITDA Margin 10.1% 16.0% 17.5% 23.0%
179.0% 66.3% 90.1% Other Income (Expense) 0.6 3.7 4.1 5.1 Profit (Loss) before provision for income taxes (7.5) (8.4) 1.8 33.6 Provision for income taxes 0.2 0.3 0.4 11.8 Net Income (Loss) - GAAP (7.7) (8.7) 1.4 21.9 Net Income (Loss) - Pro forma (2.4) 12.4 25.6 47.3 EPS - GAAP (w/FAS123R) $ (0.45) $ (0.17) $ 0.02 $ 0.36 EPS - Pro forma (ex-FAS123R) $ (0.22) $ 0.20 $ 0.39 $ 0.70 Basic Shares Outstanding 35.8 53.4 59.3 60.9 Diluted Shares Outstanding 39.8 59.9 65.7 67.3
% of Revenue Sales & marketing 44.2% 43.7% 45.3% 40.6% Research & development 10.9% 11.7% 10.4% 9.4% General and administrative 15.2% 16.4% 11.6% 9.8% Growth Y/Y Subscription 81.6% 74.0% 52.7% 45.5% Professional services and other 197.4% 110.3% 34.5% 38.9% Total Revenues 86.3% 76.4% 51.2% 45.0% Sales & marketing 45.2% 74.5% 56.8% 30.0% Research & development 31.4% 88.5% 34.9% 31.1% General and administrative 94.6% 91.0% 7.0% 22.7% Total Expenses 41.1% 80.3% 41.8% 28.9% Source: Company reports and JPMorgan estimates.

226
North America Equity Research 02 January 2008
Imran Khan (1-212) 622-6693 [email protected]
Table 146: OMTR Quarterly Income Statement $ in millions, except per share data
FY 2006 FY 2007 FY 2008 1Q'06 2Q'06 3Q'06 4Q'06 1Q'07 2Q'07 3Q'07 4Q'07E 1Q'08E 2Q'08E 3Q'08E 4Q'08E
Subscription 15.5 17.6 19.5 21.9 27.3 30.6 34.4 37.5 43.9 46.8 51.8 55.7 Professional services and other 0.9 1.2 1.5 1.6 1.8 2.9 3.0 3.1 3.2 3.6 3.8 4.0 Total Revenues 16.4 18.8 21.0 23.5 29.2 33.5 37.4 40.7 47.2 50.4 55.5 59.7 Cost of Revenues 6.8 7.6 8.5 9.0 10.7 12.7 13.8 14.3 16.4 17.1 18.8 19.4 Gross Profit 9.7 11.3 12.5 14.5 18.4 20.7 23.5 26.3 30.8 33.3 36.8 40.3 Gross Margin 58.8% 59.8% 59.6% 61.7% 63.2% 61.9% 63.0% 64.8% 65.2% 66.0% 66.2% 67.5%
Sales & marketing 8.2 8.6 8.8 9.6 13.3 15.3 15.7 17.1 21.7 23.0 25.1 26.6 Research & development 2.0 2.1 2.3 2.4 3.1 4.0 4.7 4.7 5.3 5.3 5.7 6.0 General and administrative 2.9 2.6 3.1 3.6 4.4 5.9 6.4 6.5 5.9 5.9 6.4 6.6 Litigation settlement - - - - - - - - - - - - Total Operating Expenses 13.0 13.2 14.2 15.6 20.9 25.2 26.8 28.3 32.9 34.2 37.1 39.1 Operating Profit (Loss) (3.3) (2.0) (1.7) (1.1) (2.4) (4.5) (3.2) (1.9) (2.2) (0.9) (0.3) 1.1 Operating Margin -20.4% -10.6% -8.0% -4.8% -8.4% -13.3% -8.6% -4.7% -4.6% -1.8% -0.6% 1.9% EBITDA (0.1) 1.8 2.7 3.5 4.0 5.1 6.1 7.3 7.4 8.9 9.7 11.3 EBITDA Margin -0.3% 9.8% 13.0% 15.1% 13.6% 15.1% 16.4% 17.9% 15.7% 17.6% 17.4% 19.0% Other Income (Expense) (0.0) (0.3) 0.5 0.4 0.0 0.5 2.2 1.0 0.9 1.0 1.0 1.1 Profit (Loss) before provision for income taxes (3.4) (2.3) (1.2) (0.7) (2.4) (4.0) (1.0) (1.0) (1.2) 0.1 0.7 2.3 Provision for income taxes 0.0 0.0 0.1 0.1 0.0 0.1 0.1 0.1 0.1 0.1 0.1 0.1 Net Income (Loss) - GAAP (3.4) (2.3) (1.3) (0.8) (2.4) (4.1) (1.1) (1.1) (1.3) 0.0 0.6 2.2 Net Income (Loss) - Pro forma (2.4) (1.0) 0.2 0.9 0.9 1.9 4.4 5.2 4.6 6.0 6.7 8.4 EPS - GAAP (w/FAS123R) $ (0.24) $ (0.16) $ (0.03) $ (0.02) $ (0.05) $ (0.08) $ (0.02) $ (0.02) $ (0.02) $ 0.00 $ 0.01 $ 0.04 EPS - Pro forma (ex-FAS123R) $ (0.17) $ (0.07) $ 0.00 $ 0.02 $ 0.02 $ 0.03 $ 0.07 $ 0.08 $ 0.07 $ 0.09 $ 0.10 $ 0.13 Basic Shares Outstanding 14.0 14.2 45.9 47.3 47.8 49.8 57.9 58.3 58.7 59.1 59.5 59.9 Diluted Shares Outstanding 14.0 14.2 52.1 53.0 54.4 56.1 64.3 64.7 65.1 65.5 65.9 66.3 % of Revenue Sales & marketing 49.8% 45.7% 42.1% 40.9% 45.7% 45.8% 42.0% 42.1% 46.1% 45.6% 45.1% 44.6% Research & development 12.0% 11.0% 10.9% 10.2% 10.8% 11.9% 12.5% 11.6% 11.2% 10.5% 10.2% 10.0% General and administrative 17.3% 13.6% 14.6% 15.4% 15.0% 17.5% 17.1% 16.0% 12.5% 11.7% 11.5% 11.0%
Growth Y/Y Subscription 100.2% 91.0% 75.4% 69.1% 75.8% 73.9% 75.9% 71.3% 60.8% 52.9% 50.7% 48.3% Professional services and other 223.5% 322.8% 295.0% 96.0% 104.6% 134.5% 102.5% 101.9% 77.2% 24.8% 24.9% 27.7% Total Revenues 104.4% 98.1% 82.6% 70.7% 77.4% 77.9% 77.8% 73.3% 61.8% 50.5% 48.6% 46.7% Sales & marketing 69.1% 44.9% 35.2% 38.2% 62.9% 78.3% 77.6% 78.2% 63.2% 49.7% 59.4% 55.6% Research & development 71.2% 28.8% 13.8% 27.9% 59.4% 91.2% 103.9% 95.7% 68.1% 33.3% 21.7% 27.0% General and administrative 198.4% 79.3% 67.2% 81.3% 53.9% 128.7% 107.4% 79.6% 34.4% 0.4% 0.1% 1.2% Total Expenses 87.3% 47.5% 36.8% 16.3% 60.4% 90.1% 88.3% 81.2% 57.9% 35.6% 38.7% 38.4% Source: Company reports and JPMorgan estimates.

227
North America Equity Research 02 January 2008
Imran Khan (1-212) 622-6693 [email protected]
Table 147: OMTR Annual Balance Sheet $ in millions
2006 2007E 2008E 2009E ASSETS Cash & cash equivalents 68.3 61.8 87.0 131.1 Short-term investments - 117.0 123.0 129.2 Accounts receivable, net 24.1 38.6 56.7 81.8 Prepaid expenses & other current assets 1.6 3.8 4.2 6.0 Total Current Assets 94.0 221.2 270.8 348.2 Property and equipment, net 31.1 32.5 41.7 57.2 Intangible assets, net 9.8 32.2 25.8 19.4 Goodwill - 48.0 48.0 48.0 Other assets 0.3 0.6 0.9 1.3 Total Non-Current Assets 41.2 113.4 116.4 126.0 Total Assets 135.2 334.6 387.1 474.1 LIABILITIES Accounts Payable 2.6 8.0 11.7 16.9 Accrued Liabilities 11.4 15.2 22.4 32.3 Deferred Revenues 21.9 37.8 53.7 77.5 Current notes payable, capital lease obligations 6.1 4.7 6.9 10.0 Deferred Consideration related to business acq - - - - Total Current Liabilities 42.0 65.8 94.7 136.7
Deferred revenues, less current 2.2 1.4 2.1 2.5 Notes payable, less current portion 4.1 2.1 3.1 4.5 Capital lease obligations, less current portion 0.0 0.2 0.4 0.5 Other liabilities 0.5 6.8 10.0 14.4 Total LT Liabilities 6.8 10.6 15.6 22.5 Total Liabilities 48.8 76.4 110.3 159.2 Convertible preferred stock - - - - STOCKHOLDERS' DEFICIT Common Stock 0.1 0.1 - - Additional paid-in capital 263.1 593.9 - - Deferred stock-based compensation (10.3) (3.1) - - Accumulated other comprehensive income 0.0 (0.6) - - Accumulated Deficit (148.2) (91.8) - - Total Stockholders Equity 86.4 258.2 276.9 315.0 Total Liabilities & Owners Equity 135.2 334.6 387.1 474.1 Source: Company reports and JPMorgan estimates.

228
North America Equity Research 02 January 2008
Imran Khan (1-212) 622-6693 [email protected]
Table 148: OMTR Annual Cash Flow Statement $ in millions
2006 2007E 2008E 2009E
OPERATING ACTIVITIES Net Income (Loss) (7.7) (8.7) 1.4 21.9 Depreciation 11.4 13.4 15.4 17.0 Amortization 1.6 5.7 6.4 6.4 Stock-based compensation 3.2 13.4 17.8 19.0 Loss on disposal of property and equipment - (0.0) - - Patent license and litigation settlement costs - - - - Loss on foreign currency forward contract - 0.2 - - Changes in Working Capital Accounts receivable, net (11.8) (12.8) (18.0) (25.1) Prepaid expenses and other assets (1.0) (0.6) (0.7) (2.3) Account payable (1.5) 5.0 3.7 5.2 Accrued and other liabilities 1.1 2.1 7.1 9.9 Deferred revenue 9.9 12.0 16.6 24.7 Deferred gain on extinguishment of debt - - - - Net Cash Provided by Operating Activities 5.2 29.8 49.7 76.7 Free Cash Flow (FCF) (9.7) 15.9 25.2 44.1 INVESTING ACTIVITIES Purchases of short-term investments, net - (114.8) - - Purchases of property and equipment (CAPX) (14.9) (13.9) (24.5) (32.6) Purchase of intangible assets (7.9) (3.6) - - Payment related to foreign currency forward contract - (0.3) - - Business acquisitions, net of cash - (44.2) - - Net Cash Provided by Investing Activities (22.8) (176.8) (24.5) (32.6) FINANCING ACTIVITIES Proceeds from exercise of stock options 0.2 2.6 - - Proceeds from employee SPP - 0.2 - - Proceeds from issuance of preferred stock, net - - - - Repurchase of preferred stock - - - - Repurchase of preferred warrants - - - - Proceeds from issuance of notes payable, capital leases 9.6 - - - Issuance of common stock through IPO 59.2 142.2 - - Principal payments on notes payable, capital leases (5.4) (4.6) - - Net Cash Provided by Financing Activities 63.7 140.4 - - Effect of FX on Cash & Equivalents Net Increase in Cash & Equivalents 46.1 (6.5) 25.2 44.1 Cash & Equivalents at Beginning of Period 22.2 68.3 61.8 87.0 Cash & Equivalents at End of Period 68.3 61.8 87.0 131.1 Source: Company reports and JPMorgan estimates.
229
North America Equity Research 02 January 2008
Imran Khan (1-212) 622-6693 [email protected]
Priceline, Overweight ($118.23) We are upgrading PCLN to Overweight from Neutral
• Current Street models don’t appreciate the growth available internationally. Ownership of Active Hotels and Bookings gives PCLN revenue opportunities through international sales, cross selling with the domestic market, and through affiliate partnerships. International performance accounts for ~57% of gross bookings, one-third of revenue and almost two-thirds (64%) of gross profit, thereby limiting the impact of GDS negotiations and airline revenue tightening. We expect international gross bookings to contribute $1.6B or 88% of growth in FY’08.
• Priceline appears well positioned to take domestic market share. We believe that domestic top-line growth will remain strong with the positive customer response to the removal of airline booking fees and momentum in merchant products. We expect this momentum in higher-margin merchant revenue to continue in F'08 as we see more inventory becoming available in a weak economy and as consumers become more price conscious. We are modeling Y/Y merchant gross bookings growth of 7.7% and total domestic gross bookings growth of 10.6% for F’08 (9.0% and 8.2% in F’07E).
• Margin expansion is likely given leverage and expense control. We believe that the company operates a highly scalable business model that allows for international expansion with few additional costs. Additionally, the domestic business is benefiting from expense discipline programs implemented approximately a year ago that have given the US business even more operating leverage than the European business. We are modeling 210 bps of pro forma operating margin expansion to 16.8%in F’08, which we note is still well below Expedia's pro forma F'08E margin of 24.5%.
• 2008 Drivers. In our view, the following factors will drive PCLN shares in 2008: (1) comping the airline no booking fee policy, (2) expanding international business to new markets, and (3) benefiting from the Agoda acquisition and synergy opportunities.
• Maintaining 4Q'07 estimates. We maintain our 4Q’07 revenue, EBITDA, and EPS estimates of $327.4M, $48.4M, and $0.59 (Y/Y growth of 26%, 85%, and 68% respectively).
Our current and newly introduced 2009 estimates are in the table below:
Table 149: Priceline Financial Snapshot $ in millions, except per share data
Priceline 4Q'07E F'07E F'08E F'09E F'07E Y/Y F'08E Y/Y F'09E Y/Y JPMorgan Revenue 327.43 1,401.99 1,709.79 2,026.34 24.83% 21.95% 18.51% EBITDA 48.36 161.41 296.46 407.63 50.77% 83.67% 37.50%
EPS 0.59 3.22 3.92 5.10 98.33% 21.90% 29.94% Consensus
Revenue 324.29 1388.98 1689.9 1889.47 21.66% 11.81% EBITDA 49.07 218.14 299.02 364.23 37.08% 21.81%
EPS 0.56 3.21 3.92 4.82 22.12% 22.96% Source: JPMorgan estimates, Company data, and Bloomberg

230
North America Equity Research 02 January 2008
Imran Khan (1-212) 622-6693 [email protected]
Our Estimates and Outlook for 2008 We are adjusting our F’08 revenue estimate to $1.71B and our full-year EBITDA estimate to $296.5M, representing Y/Y revenue and EBITDA growth of 22% and 84%, respectively.
Current Street models don’t appreciate the growth available internationally. We expect international revenue to grow 62% Y/Y in F’08 as a result of the following factors:
Expansion into new regions Priceline has significant opportunities to expand throughout Europe. Many European countries are earlier in the online retailing adoption process thereby offering growth not only through increasing market share but also from a growing market size. The company estimates that Europe Internet penetration is only at 38.9% of the population vs. 69.9% in the US.. Additionally, the introduction of offices in Ireland, Vienna, and Portugal further rolls out the supply and distribution function to new European locations, providing both long- (Eastern Europe) and short-term (Western Europe) opportunities.
Figure 84: Geographic Presence
Source: Company Reports In 3Q’07, Priceline announced its acquisition of Bangkok-and Singapore-based Agoda. The company is an OTA specializing in merchant hotel discount bookings throughout Asia. We believe that this is a valuable acquisition for entry into a developing market and that clear synergies can be achieved operationally and with inventory. We estimate that Agoda will contribute ~$76M to gross bookings in F’08 and be slightly accretive to pro forma earnings.
Cross-sales with the domestic market Access to the more than 24,000 hotel options available at Active Hotels and Bookings has allowed Priceline to create European vacation packages and hotel opportunities on the domestic website, further driving international revenues and differentiating itself from competitors with its broad overseas offering.
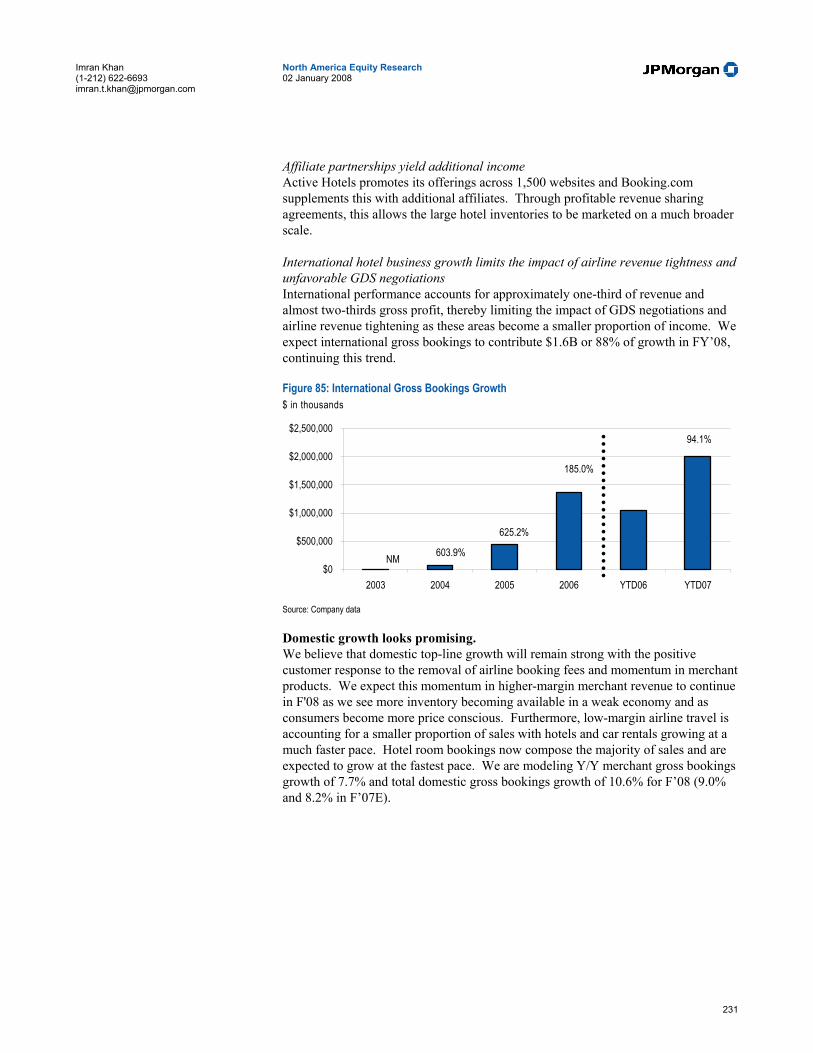
231
North America Equity Research 02 January 2008
Imran Khan (1-212) 622-6693 [email protected]
Affiliate partnerships yield additional income Active Hotels promotes its offerings across 1,500 websites and Booking.com supplements this with additional affiliates. Through profitable revenue sharing agreements, this allows the large hotel inventories to be marketed on a much broader scale.
International hotel business growth limits the impact of airline revenue tightness and unfavorable GDS negotiations International performance accounts for approximately one-third of revenue and almost two-thirds gross profit, thereby limiting the impact of GDS negotiations and airline revenue tightening as these areas become a smaller proportion of income. We expect international gross bookings to contribute $1.6B or 88% of growth in FY’08, continuing this trend.
Figure 85: International Gross Bookings Growth $ in thousands
$0
$500,000
$1,000,000
$1,500,000
$2,000,000
$2,500,000
2003 2004 2005 2006 YTD06 YTD07
NM 603.9%
625.2%
185.0%
94.1%
Source: Company data Domestic growth looks promising. We believe that domestic top-line growth will remain strong with the positive customer response to the removal of airline booking fees and momentum in merchant products. We expect this momentum in higher-margin merchant revenue to continue in F'08 as we see more inventory becoming available in a weak economy and as consumers become more price conscious. Furthermore, low-margin airline travel is accounting for a smaller proportion of sales with hotels and car rentals growing at a much faster pace. Hotel room bookings now compose the majority of sales and are expected to grow at the fastest pace. We are modeling Y/Y merchant gross bookings growth of 7.7% and total domestic gross bookings growth of 10.6% for F’08 (9.0% and 8.2% in F’07E).
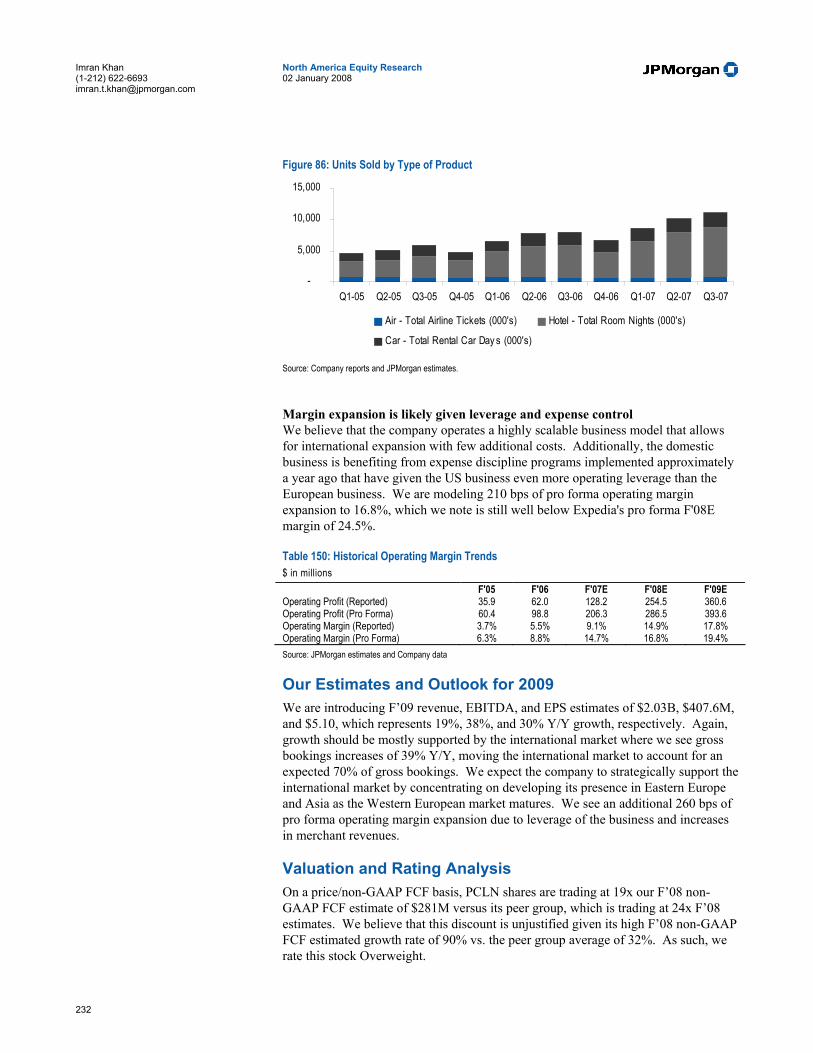
232
North America Equity Research 02 January 2008
Imran Khan (1-212) 622-6693 [email protected]
Figure 86: Units Sold by Type of Product
-
5,000
10,000
15,000
Q1-05 Q2-05 Q3-05 Q4-05 Q1-06 Q2-06 Q3-06 Q4-06 Q1-07 Q2-07 Q3-07
Air - Total Airline Tickets (000's) Hotel - Total Room Nights (000's)
Car - Total Rental Car Day s (000's)
Source: Company reports and JPMorgan estimates.
Margin expansion is likely given leverage and expense control We believe that the company operates a highly scalable business model that allows for international expansion with few additional costs. Additionally, the domestic business is benefiting from expense discipline programs implemented approximately a year ago that have given the US business even more operating leverage than the European business. We are modeling 210 bps of pro forma operating margin expansion to 16.8%, which we note is still well below Expedia's pro forma F'08E margin of 24.5%.
Table 150: Historical Operating Margin Trends $ in millions
F'05 F'06 F'07E F'08E F'09E Operating Profit (Reported) 35.9 62.0 128.2 254.5 360.6 Operating Profit (Pro Forma) 60.4 98.8 206.3 286.5 393.6 Operating Margin (Reported) 3.7% 5.5% 9.1% 14.9% 17.8% Operating Margin (Pro Forma) 6.3% 8.8% 14.7% 16.8% 19.4% Source: JPMorgan estimates and Company data
Our Estimates and Outlook for 2009 We are introducing F’09 revenue, EBITDA, and EPS estimates of $2.03B, $407.6M, and $5.10, which represents 19%, 38%, and 30% Y/Y growth, respectively. Again, growth should be mostly supported by the international market where we see gross bookings increases of 39% Y/Y, moving the international market to account for an expected 70% of gross bookings. We expect the company to strategically support the international market by concentrating on developing its presence in Eastern Europe and Asia as the Western European market matures. We see an additional 260 bps of pro forma operating margin expansion due to leverage of the business and increases in merchant revenues.
Valuation and Rating Analysis On a price/non-GAAP FCF basis, PCLN shares are trading at 19x our F’08 non-GAAP FCF estimate of $281M versus its peer group, which is trading at 24x F’08 estimates. We believe that this discount is unjustified given its high F’08 non-GAAP FCF estimated growth rate of 90% vs. the peer group average of 32%. As such, we rate this stock Overweight.

233
North America Equity Research 02 January 2008
Imran Khan (1-212) 622-6693 [email protected]
Risks to Our Rating Priceline shares could underperform other companies in our coverage universe if its domestic growth is pressured by competition from other OTA's or suppliers, if it has difficulty obtaining merchant inventory, if it experiences increased competition in the international market, or if sales and marketing and technology expenses increase significantly.
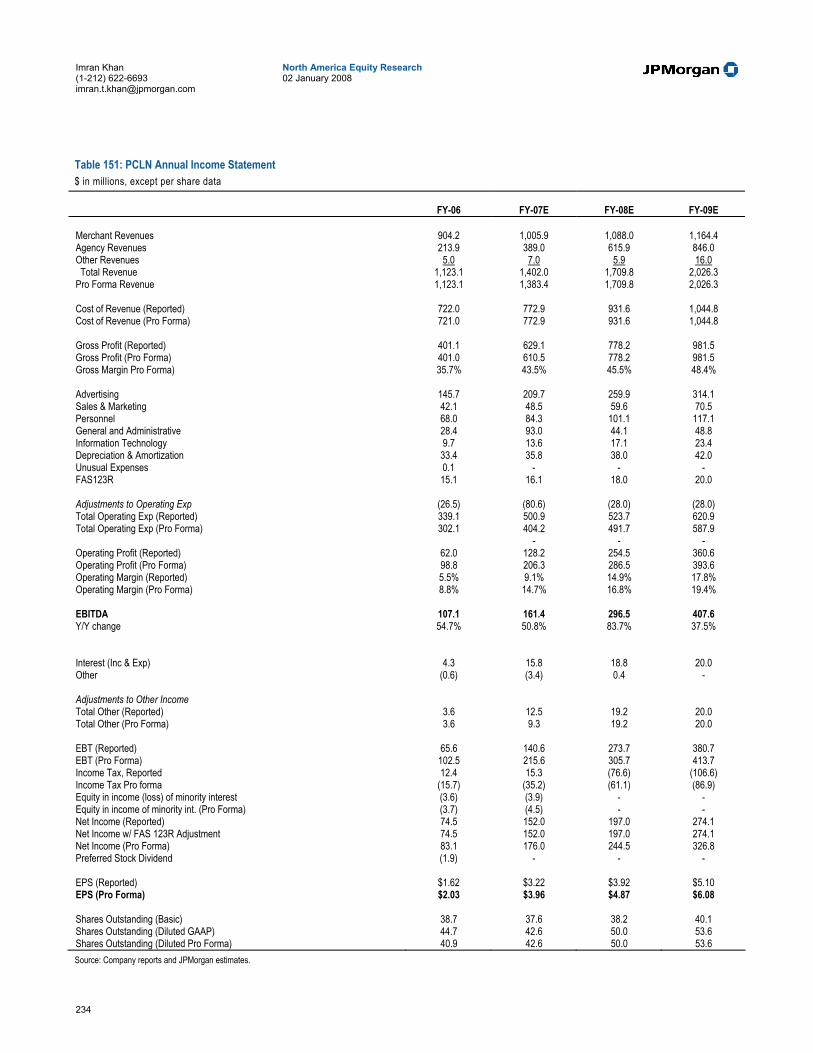
234
North America Equity Research 02 January 2008
Imran Khan (1-212) 622-6693 [email protected]
Table 151: PCLN Annual Income Statement $ in millions, except per share data
FY-06 FY-07E FY-08E FY-09E
Merchant Revenues 904.2 1,005.9 1,088.0 1,164.4 Agency Revenues 213.9 389.0 615.9 846.0 Other Revenues 5.0 7.0 5.9 16.0 Total Revenue 1,123.1 1,402.0 1,709.8 2,026.3 Pro Forma Revenue 1,123.1 1,383.4 1,709.8 2,026.3 Cost of Revenue (Reported) 722.0 772.9 931.6 1,044.8 Cost of Revenue (Pro Forma) 721.0 772.9 931.6 1,044.8 Gross Profit (Reported) 401.1 629.1 778.2 981.5 Gross Profit (Pro Forma) 401.0 610.5 778.2 981.5 Gross Margin Pro Forma) 35.7% 43.5% 45.5% 48.4% Advertising 145.7 209.7 259.9 314.1 Sales & Marketing 42.1 48.5 59.6 70.5 Personnel 68.0 84.3 101.1 117.1 General and Administrative 28.4 93.0 44.1 48.8 Information Technology 9.7 13.6 17.1 23.4 Depreciation & Amortization 33.4 35.8 38.0 42.0 Unusual Expenses 0.1 - - - FAS123R 15.1 16.1 18.0 20.0 Adjustments to Operating Exp (26.5) (80.6) (28.0) (28.0) Total Operating Exp (Reported) 339.1 500.9 523.7 620.9 Total Operating Exp (Pro Forma) 302.1 404.2 491.7 587.9 - - - Operating Profit (Reported) 62.0 128.2 254.5 360.6 Operating Profit (Pro Forma) 98.8 206.3 286.5 393.6 Operating Margin (Reported) 5.5% 9.1% 14.9% 17.8% Operating Margin (Pro Forma) 8.8% 14.7% 16.8% 19.4% EBITDA 107.1 161.4 296.5 407.6 Y/Y change 54.7% 50.8% 83.7% 37.5% Interest (Inc & Exp) 4.3 15.8 18.8 20.0 Other (0.6) (3.4) 0.4 - Adjustments to Other Income Total Other (Reported) 3.6 12.5 19.2 20.0 Total Other (Pro Forma) 3.6 9.3 19.2 20.0 EBT (Reported) 65.6 140.6 273.7 380.7 EBT (Pro Forma) 102.5 215.6 305.7 413.7 Income Tax, Reported 12.4 15.3 (76.6) (106.6) Income Tax Pro forma (15.7) (35.2) (61.1) (86.9) Equity in income (loss) of minority interest (3.6) (3.9) - - Equity in income of minority int. (Pro Forma) (3.7) (4.5) - - Net Income (Reported) 74.5 152.0 197.0 274.1 Net Income w/ FAS 123R Adjustment 74.5 152.0 197.0 274.1 Net Income (Pro Forma) 83.1 176.0 244.5 326.8 Preferred Stock Dividend (1.9) - - - EPS (Reported) $1.62 $3.22 $3.92 $5.10 EPS (Pro Forma) $2.03 $3.96 $4.87 $6.08 Shares Outstanding (Basic) 38.7 37.6 38.2 40.1 Shares Outstanding (Diluted GAAP) 44.7 42.6 50.0 53.6 Shares Outstanding (Diluted Pro Forma) 40.9 42.6 50.0 53.6 Source: Company reports and JPMorgan estimates.

235
North America Equity Research 02 January 2008
Imran Khan (1-212) 622-6693 [email protected]
Table 152: PCLN Quarterly Income Statement $ in millions, except per share data
FY-2006 FY-2007E FY-2008E Q1-06 Q2-06 Q3-06 Q4-06 Q1-07 Q2-07 Q3-07 Q4-07E Q1-08E Q2-08E Q3-08E Q4-08E
Merchant Revenues 210.4 250.5 238.6 204.6 246.0 254.9 275.2 229.8 264.4 278.7 297.2 247.7 Agency Revenues 30.4 55.9 73.3 54.3 54.5 98.3 139.6 96.5 95.7 168.8 206.3 145.1 Other Revenues 1.1 1.2 1.6 1.1 0.9 2.6 2.5 1.1 1.1 2.6 1.1 1.1 Total Revenue 241.9 307.7 313.5 260.1 301.4 355.9 417.3 327.4 361.2 450.1 504.6 393.9 Pro Forma Revenue 241.9 307.7 313.5 260.1 285.5 353.6 416.9 327.4 361.2 450.1 504.6 393.9 Cost of Revenue (Reported) 169.7 201.8 189.9 160.6 181.7 198.7 215.0 177.6 225.8 241.2 253.7 210.8 Cost of Revenue (Pro Forma) 169.3 201.5 189.5 160.6 181.7 198.7 215.0 177.6 225.8 241.2 253.7 210.8
Gross Profit (Reported) 72.2 105.8 123.5 99.5 119.7 157.2 202.3 149.8 135.4 208.8 250.8 183.1 Gross Profit (Pro Forma) 72.6 106.1 122.3 99.9 103.8 154.9 201.9 149.8 135.4 208.8 250.8 183.1 Gross Margin Pro Forma) 30.0% 34.5% 39.0% 38.4% 36.4% 43.8% 48.4% 45.8% 37.5% 46.4% 49.7% 46.5%
Advertising 31.3 39.4 41.2 33.8 43.3 52.8 62.3 51.4 54.9 68.4 76.7 59.9 Sales & Marketing 9.6 10.7 11.2 10.6 11.4 11.5 13.1 12.4 14.1 14.9 15.6 15.0 Personnel 13.4 15.0 21.7 17.9 18.3 20.0 23.1 22.9 22.8 25.0 27.8 25.6 General and Administrative 5.6 7.1 6.6 9.0 63.9 9.7 9.0 10.5 8.7 10.8 11.6 13.0 Information Technology 2.3 2.3 2.6 2.6 2.9 3.2 3.3 4.2 3.6 4.5 5.0 3.9 Depreciation & Amortization 7.9 8.4 8.7 8.5 8.5 9.0 9.1 9.1 9.5 9.5 9.5 9.5 Unusual Expenses 0.1 FAS123R 3.1 3.8 3.5 4.7 3.2 3.6 4.4 5.0 4.0 4.0 5.0 5.0
Adjustments to Operating Exp -5.7 -5.8 (4.4) (10.6) (61.2) (6.2) (6.2) (7.0) (7.0) (7.0) (7.0) (7.0) Total Operating Exp (Reported) 73.5 86.8 91.9 86.9 151.5 109.6 124.2 115.6 117.5 133.0 146.2 126.9 Total Operating Exp (Pro Forma) 64.7 77.1 84.0 76.3 87.1 99.9 113.6 103.6 106.5 126.0 139.2 119.9 Operating Profit (Reported) -1.2 19.0 31.6 12.6 (31.7) 47.6 78.1 34.2 17.9 75.8 104.6 56.2 Operating Profit (Pro Forma) 7.9 29.0 38.3 23.6 16.8 55.0 88.3 46.2 28.9 82.8 111.6 63.2 Operating Margin (Reported) -0.5% 6.2% 10.1% 4.8% -10.5% 13.4% 18.7% 10.5% 4.9% 16.8% 20.7% 14.3% Operating Margin (Pro Forma) 3.3% 9.4% 12.2% 9.1% 5.6% 15.5% 21.2% 14.1% 8.0% 18.4% 22.1% 16.0%
EBITDA 10.3 31.6 39.0 26.1 -35.9 57.8 91.2 48.4 31.4 85.3 114.1 65.7 Y/Y change 69.6% -449.0% 83.0% 133.5% 85.1% -187.2% 47.5% 25.2% 35.9%
Interest (Inc & Exp) 0.1 0.6 1.08 2.53 5.73 3.63 3.46 3.00 3.72 3.16 4.79 7.09 Other 0.1 -0.6 0.35 -0.45 -0.21 -0.33 -1.32 -1.50 0.11 0.11 0.11 0.11 Adjustments to Other Income -2.79 -0.26 -0.08 Total Other (Reported) 0.2 (0.06) 1.43 2.08 5.52 3.30 2.14 1.50 3.83 3.27 4.90 7.20 Total Other (Pro Forma) 0.2 (0.06) 1.43 2.08 2.73 3.03 2.06 1.50 3.83 3.27 4.90 7.20
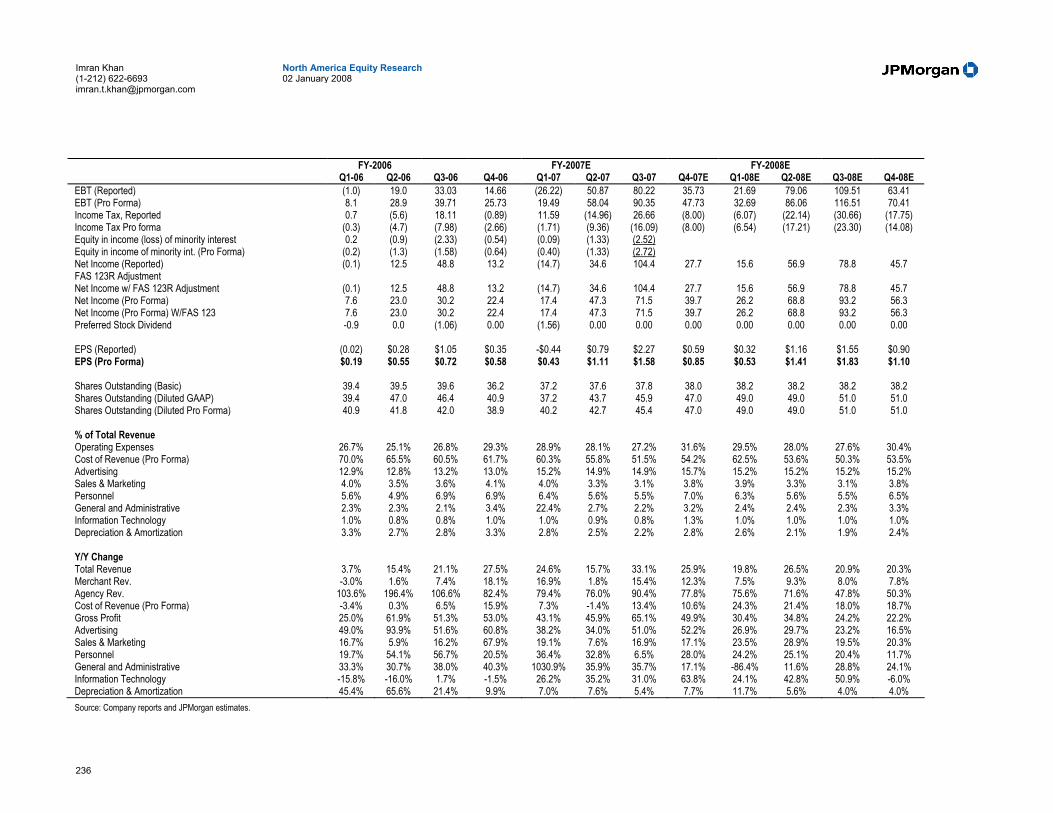
236
North America Equity Research 02 January 2008
Imran Khan (1-212) 622-6693 [email protected]
FY-2006 FY-2007E FY-2008E Q1-06 Q2-06 Q3-06 Q4-06 Q1-07 Q2-07 Q3-07 Q4-07E Q1-08E Q2-08E Q3-08E Q4-08E
EBT (Reported) (1.0) 19.0 33.03 14.66 (26.22) 50.87 80.22 35.73 21.69 79.06 109.51 63.41 EBT (Pro Forma) 8.1 28.9 39.71 25.73 19.49 58.04 90.35 47.73 32.69 86.06 116.51 70.41 Income Tax, Reported 0.7 (5.6) 18.11 (0.89) 11.59 (14.96) 26.66 (8.00) (6.07) (22.14) (30.66) (17.75) Income Tax Pro forma (0.3) (4.7) (7.98) (2.66) (1.71) (9.36) (16.09) (8.00) (6.54) (17.21) (23.30) (14.08) Equity in income (loss) of minority interest 0.2 (0.9) (2.33) (0.54) (0.09) (1.33) (2.52) Equity in income of minority int. (Pro Forma) (0.2) (1.3) (1.58) (0.64) (0.40) (1.33) (2.72) Net Income (Reported) (0.1) 12.5 48.8 13.2 (14.7) 34.6 104.4 27.7 15.6 56.9 78.8 45.7 FAS 123R Adjustment Net Income w/ FAS 123R Adjustment (0.1) 12.5 48.8 13.2 (14.7) 34.6 104.4 27.7 15.6 56.9 78.8 45.7 Net Income (Pro Forma) 7.6 23.0 30.2 22.4 17.4 47.3 71.5 39.7 26.2 68.8 93.2 56.3 Net Income (Pro Forma) W/FAS 123 7.6 23.0 30.2 22.4 17.4 47.3 71.5 39.7 26.2 68.8 93.2 56.3 Preferred Stock Dividend -0.9 0.0 (1.06) 0.00 (1.56) 0.00 0.00 0.00 0.00 0.00 0.00 0.00
EPS (Reported) (0.02) $0.28 $1.05 $0.35 -$0.44 $0.79 $2.27 $0.59 $0.32 $1.16 $1.55 $0.90 EPS (Pro Forma) $0.19 $0.55 $0.72 $0.58 $0.43 $1.11 $1.58 $0.85 $0.53 $1.41 $1.83 $1.10
Shares Outstanding (Basic) 39.4 39.5 39.6 36.2 37.2 37.6 37.8 38.0 38.2 38.2 38.2 38.2 Shares Outstanding (Diluted GAAP) 39.4 47.0 46.4 40.9 37.2 43.7 45.9 47.0 49.0 49.0 51.0 51.0 Shares Outstanding (Diluted Pro Forma) 40.9 41.8 42.0 38.9 40.2 42.7 45.4 47.0 49.0 49.0 51.0 51.0
% of Total Revenue Operating Expenses 26.7% 25.1% 26.8% 29.3% 28.9% 28.1% 27.2% 31.6% 29.5% 28.0% 27.6% 30.4% Cost of Revenue (Pro Forma) 70.0% 65.5% 60.5% 61.7% 60.3% 55.8% 51.5% 54.2% 62.5% 53.6% 50.3% 53.5% Advertising 12.9% 12.8% 13.2% 13.0% 15.2% 14.9% 14.9% 15.7% 15.2% 15.2% 15.2% 15.2% Sales & Marketing 4.0% 3.5% 3.6% 4.1% 4.0% 3.3% 3.1% 3.8% 3.9% 3.3% 3.1% 3.8% Personnel 5.6% 4.9% 6.9% 6.9% 6.4% 5.6% 5.5% 7.0% 6.3% 5.6% 5.5% 6.5% General and Administrative 2.3% 2.3% 2.1% 3.4% 22.4% 2.7% 2.2% 3.2% 2.4% 2.4% 2.3% 3.3% Information Technology 1.0% 0.8% 0.8% 1.0% 1.0% 0.9% 0.8% 1.3% 1.0% 1.0% 1.0% 1.0% Depreciation & Amortization 3.3% 2.7% 2.8% 3.3% 2.8% 2.5% 2.2% 2.8% 2.6% 2.1% 1.9% 2.4%
Y/Y Change Total Revenue 3.7% 15.4% 21.1% 27.5% 24.6% 15.7% 33.1% 25.9% 19.8% 26.5% 20.9% 20.3% Merchant Rev. -3.0% 1.6% 7.4% 18.1% 16.9% 1.8% 15.4% 12.3% 7.5% 9.3% 8.0% 7.8% Agency Rev. 103.6% 196.4% 106.6% 82.4% 79.4% 76.0% 90.4% 77.8% 75.6% 71.6% 47.8% 50.3% Cost of Revenue (Pro Forma) -3.4% 0.3% 6.5% 15.9% 7.3% -1.4% 13.4% 10.6% 24.3% 21.4% 18.0% 18.7% Gross Profit 25.0% 61.9% 51.3% 53.0% 43.1% 45.9% 65.1% 49.9% 30.4% 34.8% 24.2% 22.2% Advertising 49.0% 93.9% 51.6% 60.8% 38.2% 34.0% 51.0% 52.2% 26.9% 29.7% 23.2% 16.5% Sales & Marketing 16.7% 5.9% 16.2% 67.9% 19.1% 7.6% 16.9% 17.1% 23.5% 28.9% 19.5% 20.3% Personnel 19.7% 54.1% 56.7% 20.5% 36.4% 32.8% 6.5% 28.0% 24.2% 25.1% 20.4% 11.7% General and Administrative 33.3% 30.7% 38.0% 40.3% 1030.9% 35.9% 35.7% 17.1% -86.4% 11.6% 28.8% 24.1% Information Technology -15.8% -16.0% 1.7% -1.5% 26.2% 35.2% 31.0% 63.8% 24.1% 42.8% 50.9% -6.0% Depreciation & Amortization 45.4% 65.6% 21.4% 9.9% 7.0% 7.6% 5.4% 7.7% 11.7% 5.6% 4.0% 4.0% Source: Company reports and JPMorgan estimates.

237
North America Equity Research 02 January 2008
Imran Khan (1-212) 622-6693 [email protected]
Table 153: PCLN Annual Balance Sheet $ in millions
FY-06 FY-07E FY-08E FY-09E
Cash and cash equivalents 423.6 438.1 674.9 983.8 Restricted cash 2.5 2.7 2.7 2.7 Short-term investments 8.0 73.0 73.0 73.0 Accounts receivable 48.5 62.2 91.2 124.3 Prepaid expenses and other current assets 20.5 26.2 26.2 28.9 Total current assets 503.1 602.3 868.1 1,212.8 Property and equipment, net 21.7 28.0 31.6 35.6 Intangible assets, net 152.9 182.4 182.4 182.4 Goodwill 226.7 270.8 270.8 270.8 Deferred Taxes 179.4 222.8 222.8 222.8 Other assets 21.8 39.8 39.8 39.8 Total assets 1,105.6 1,346.1 1,615.5 1,964.2
Accounts payable 49.0 58.9 78.9 98.9 Accrued expenses 46.9 58.9 58.9 58.9 Deferred merchant bookings 4.8 7.7 7.7 7.7 Other current liabilities 0.0 569.5 569.5 569.5 Total current liabilities 100.7 695.0 715.0 735.0 Deferred Taxes 39.7 47.2 47.2 47.2 Other long-term liabilities 11.9 12.5 12.5 12.5 Minority Interest 22.5 15.1 15.1 15.1 Long-term debt 568.9 0.0 0.0 0.0 Total liabilities 743.6 769.8 789.8 809.8
Series B Mandatorily Redeemable Preferred Stock 13.5 0.0 0.0 0.0
0.0 0.0 0.0 0.0 Common stock, $0.008 par value per share, 0.3 0.3 0.3 0.3 Treasury stock, 2,496,326 shares and 2,496,326 (486.5) (488.7) (488.7) (488.7) Additional paid-in capital 2,070.4 2,154.4 2,403.8 2,732.5 Deferred compensation 0.0 0.0 0.0 0.0 Accumulated deficit (1,262.0) (1,139.4) (1,139.4) (1,139.4) Accumulated other comprehensive income 26.3 49.6 49.6 49.6 Total stockholders equity 348.6 576.3 825.7 1,154.4
Total liabilities and stockholders equity 1,105.6 1,346.1 1,615.5 1,964.2 Source: Company reports and JPMorgan estimates.
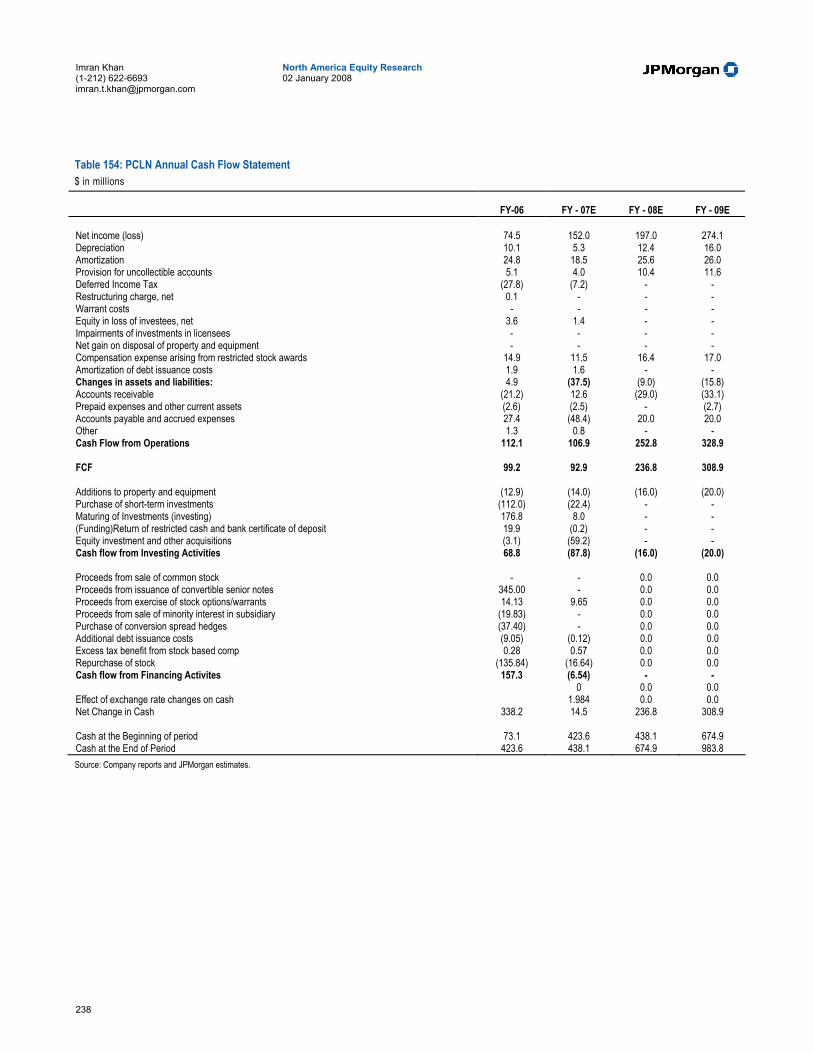
238
North America Equity Research 02 January 2008
Imran Khan (1-212) 622-6693 [email protected]
Table 154: PCLN Annual Cash Flow Statement $ in millions
FY-06 FY - 07E FY - 08E FY - 09E
Net income (loss) 74.5 152.0 197.0 274.1 Depreciation 10.1 5.3 12.4 16.0 Amortization 24.8 18.5 25.6 26.0 Provision for uncollectible accounts 5.1 4.0 10.4 11.6 Deferred Income Tax (27.8) (7.2) - - Restructuring charge, net 0.1 - - - Warrant costs - - - - Equity in loss of investees, net 3.6 1.4 - - Impairments of investments in licensees - - - - Net gain on disposal of property and equipment - - - - Compensation expense arising from restricted stock awards 14.9 11.5 16.4 17.0 Amortization of debt issuance costs 1.9 1.6 - - Changes in assets and liabilities: 4.9 (37.5) (9.0) (15.8) Accounts receivable (21.2) 12.6 (29.0) (33.1) Prepaid expenses and other current assets (2.6) (2.5) - (2.7) Accounts payable and accrued expenses 27.4 (48.4) 20.0 20.0 Other 1.3 0.8 - - Cash Flow from Operations 112.1 106.9 252.8 328.9
FCF 99.2 92.9 236.8 308.9
Additions to property and equipment (12.9) (14.0) (16.0) (20.0) Purchase of short-term investments (112.0) (22.4) - - Maturing of Investments (investing) 176.8 8.0 - - (Funding)Return of restricted cash and bank certificate of deposit 19.9 (0.2) - - Equity investment and other acquisitions (3.1) (59.2) - - Cash flow from Investing Activities 68.8 (87.8) (16.0) (20.0)
Proceeds from sale of common stock - - 0.0 0.0 Proceeds from issuance of convertible senior notes 345.00 - 0.0 0.0 Proceeds from exercise of stock options/warrants 14.13 9.65 0.0 0.0 Proceeds from sale of minority interest in subsidiary (19.83) - 0.0 0.0 Purchase of conversion spread hedges (37.40) - 0.0 0.0 Additional debt issuance costs (9.05) (0.12) 0.0 0.0 Excess tax benefit from stock based comp 0.28 0.57 0.0 0.0 Repurchase of stock (135.84) (16.64) 0.0 0.0 Cash flow from Financing Activites 157.3 (6.54) - -
0 0.0 0.0 Effect of exchange rate changes on cash 1.984 0.0 0.0 Net Change in Cash 338.2 14.5 236.8 308.9
Cash at the Beginning of period 73.1 423.6 438.1 674.9 Cash at the End of Period 423.6 438.1 674.9 983.8 Source: Company reports and JPMorgan estimates.
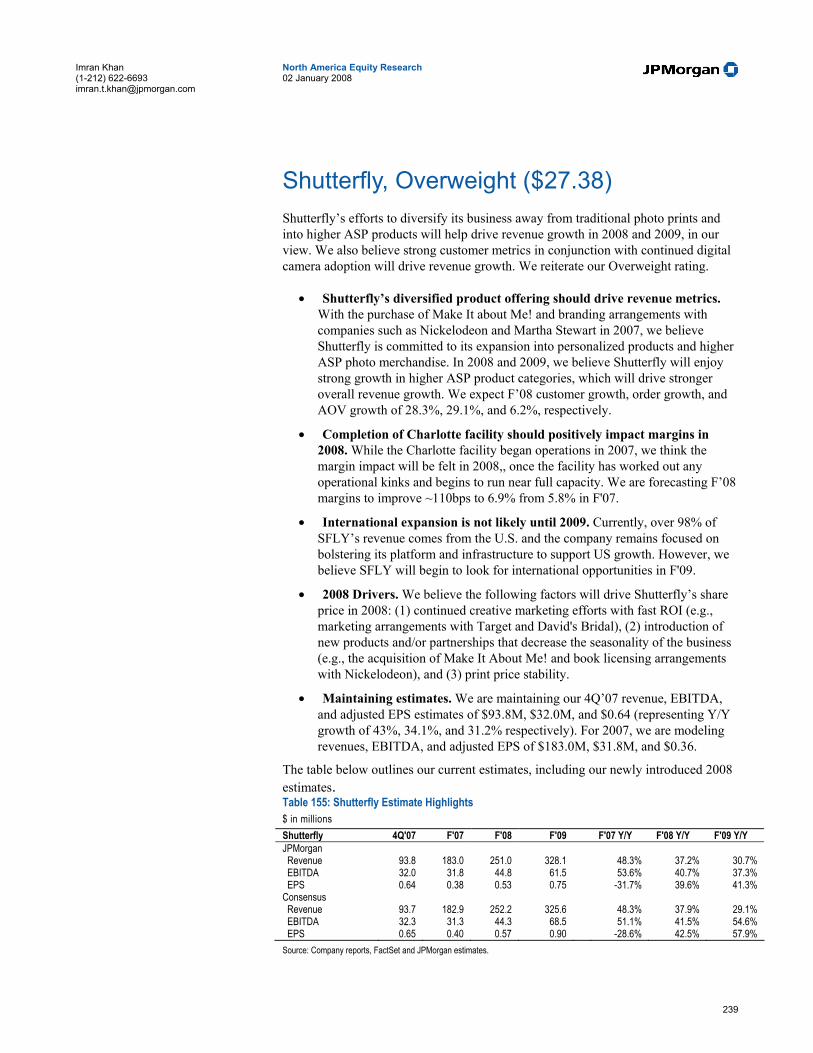
239
North America Equity Research 02 January 2008
Imran Khan (1-212) 622-6693 [email protected]
Shutterfly, Overweight ($27.38) Shutterfly’s efforts to diversify its business away from traditional photo prints and into higher ASP products will help drive revenue growth in 2008 and 2009, in our view. We also believe strong customer metrics in conjunction with continued digital camera adoption will drive revenue growth. We reiterate our Overweight rating.
• Shutterfly’s diversified product offering should drive revenue metrics. With the purchase of Make It about Me! and branding arrangements with companies such as Nickelodeon and Martha Stewart in 2007, we believe Shutterfly is committed to its expansion into personalized products and higher ASP photo merchandise. In 2008 and 2009, we believe Shutterfly will enjoy strong growth in higher ASP product categories, which will drive stronger overall revenue growth. We expect F’08 customer growth, order growth, and AOV growth of 28.3%, 29.1%, and 6.2%, respectively.
• Completion of Charlotte facility should positively impact margins in 2008. While the Charlotte facility began operations in 2007, we think the margin impact will be felt in 2008,, once the facility has worked out any operational kinks and begins to run near full capacity. We are forecasting F’08 margins to improve ~110bps to 6.9% from 5.8% in F'07.
• International expansion is not likely until 2009. Currently, over 98% of SFLY’s revenue comes from the U.S. and the company remains focused on bolstering its platform and infrastructure to support US growth. However, we believe SFLY will begin to look for international opportunities in F'09.
• 2008 Drivers. We believe the following factors will drive Shutterfly’s share price in 2008: (1) continued creative marketing efforts with fast ROI (e.g., marketing arrangements with Target and David's Bridal), (2) introduction of new products and/or partnerships that decrease the seasonality of the business (e.g., the acquisition of Make It About Me! and book licensing arrangements with Nickelodeon), and (3) print price stability.
• Maintaining estimates. We are maintaining our 4Q’07 revenue, EBITDA, and adjusted EPS estimates of $93.8M, $32.0M, and $0.64 (representing Y/Y growth of 43%, 34.1%, and 31.2% respectively). For 2007, we are modeling revenues, EBITDA, and adjusted EPS of $183.0M, $31.8M, and $0.36.
The table below outlines our current estimates, including our newly introduced 2008 estimates. Table 155: Shutterfly Estimate Highlights $ in millions Shutterfly 4Q'07 F'07 F'08 F'09 F'07 Y/Y F'08 Y/Y F'09 Y/Y JPMorgan Revenue 93.8 183.0 251.0 328.1 48.3% 37.2% 30.7% EBITDA 32.0 31.8 44.8 61.5 53.6% 40.7% 37.3% EPS 0.64 0.38 0.53 0.75 -31.7% 39.6% 41.3% Consensus Revenue 93.7 182.9 252.2 325.6 48.3% 37.9% 29.1% EBITDA 32.3 31.3 44.3 68.5 51.1% 41.5% 54.6% EPS 0.65 0.40 0.57 0.90 -28.6% 42.5% 57.9% Source: Company reports, FactSet and JPMorgan estimates.
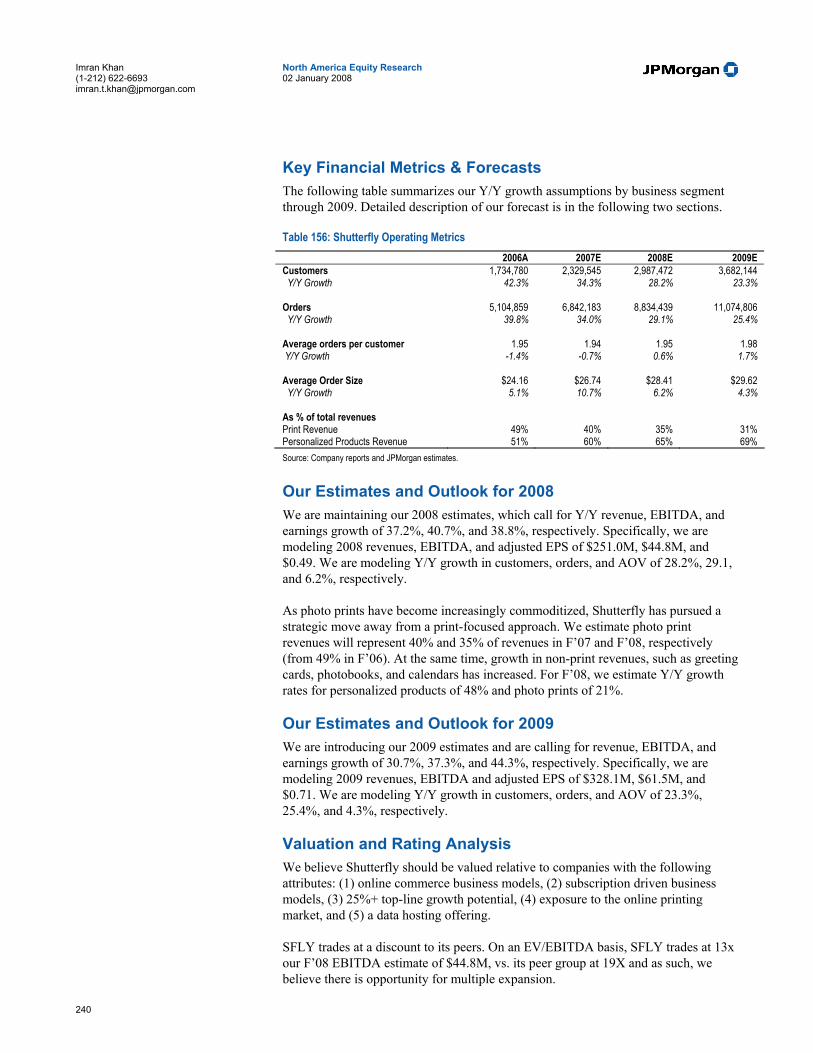
240
North America Equity Research 02 January 2008
Imran Khan (1-212) 622-6693 [email protected]
Key Financial Metrics & Forecasts The following table summarizes our Y/Y growth assumptions by business segment through 2009. Detailed description of our forecast is in the following two sections.
Table 156: Shutterfly Operating Metrics 2006A 2007E 2008E 2009E
Customers 1,734,780 2,329,545 2,987,472 3,682,144 Y/Y Growth 42.3% 34.3% 28.2% 23.3%
Orders 5,104,859 6,842,183 8,834,439 11,074,806 Y/Y Growth 39.8% 34.0% 29.1% 25.4%
Average orders per customer 1.95 1.94 1.95 1.98 Y/Y Growth -1.4% -0.7% 0.6% 1.7%
Average Order Size $24.16 $26.74 $28.41 $29.62 Y/Y Growth 5.1% 10.7% 6.2% 4.3%
As % of total revenues Print Revenue 49% 40% 35% 31% Personalized Products Revenue 51% 60% 65% 69% Source: Company reports and JPMorgan estimates.
Our Estimates and Outlook for 2008 We are maintaining our 2008 estimates, which call for Y/Y revenue, EBITDA, and earnings growth of 37.2%, 40.7%, and 38.8%, respectively. Specifically, we are modeling 2008 revenues, EBITDA, and adjusted EPS of $251.0M, $44.8M, and $0.49. We are modeling Y/Y growth in customers, orders, and AOV of 28.2%, 29.1, and 6.2%, respectively.
As photo prints have become increasingly commoditized, Shutterfly has pursued a strategic move away from a print-focused approach. We estimate photo print revenues will represent 40% and 35% of revenues in F’07 and F’08, respectively (from 49% in F’06). At the same time, growth in non-print revenues, such as greeting cards, photobooks, and calendars has increased. For F’08, we estimate Y/Y growth rates for personalized products of 48% and photo prints of 21%.
Our Estimates and Outlook for 2009 We are introducing our 2009 estimates and are calling for revenue, EBITDA, and earnings growth of 30.7%, 37.3%, and 44.3%, respectively. Specifically, we are modeling 2009 revenues, EBITDA and adjusted EPS of $328.1M, $61.5M, and $0.71. We are modeling Y/Y growth in customers, orders, and AOV of 23.3%, 25.4%, and 4.3%, respectively.
Valuation and Rating Analysis We believe Shutterfly should be valued relative to companies with the following attributes: (1) online commerce business models, (2) subscription driven business models, (3) 25%+ top-line growth potential, (4) exposure to the online printing market, and (5) a data hosting offering.
SFLY trades at a discount to its peers. On an EV/EBITDA basis, SFLY trades at 13x our F’08 EBITDA estimate of $44.8M, vs. its peer group at 19X and as such, we believe there is opportunity for multiple expansion.

241
North America Equity Research 02 January 2008
Imran Khan (1-212) 622-6693 [email protected]
Risks to Our Rating We believe there are three primary risks to our Overweight rating on Shutterfly:
• Seasonality: Currently, Shutterfly’s business is very seasonal, with approximately 50% of revenues earned in the fourth quarter. If the company is unable to deliver customer orders during the holiday season, there would be downside risk to our rating.
• Product pricing: Pricing on 4X6 prints has come down over the last few years, causing the company to look for growth in other product segments. Should other product segments experience similar pricing pressure, our Overweight rating could be at risk.
• Paper costs: Shutterfly purchases paper from Fuji Film, with whom it also competes in this space. This contract is up for renewal in September 2007, and should renewal terms be less favorable than its current contract, the company could see margin pressure.
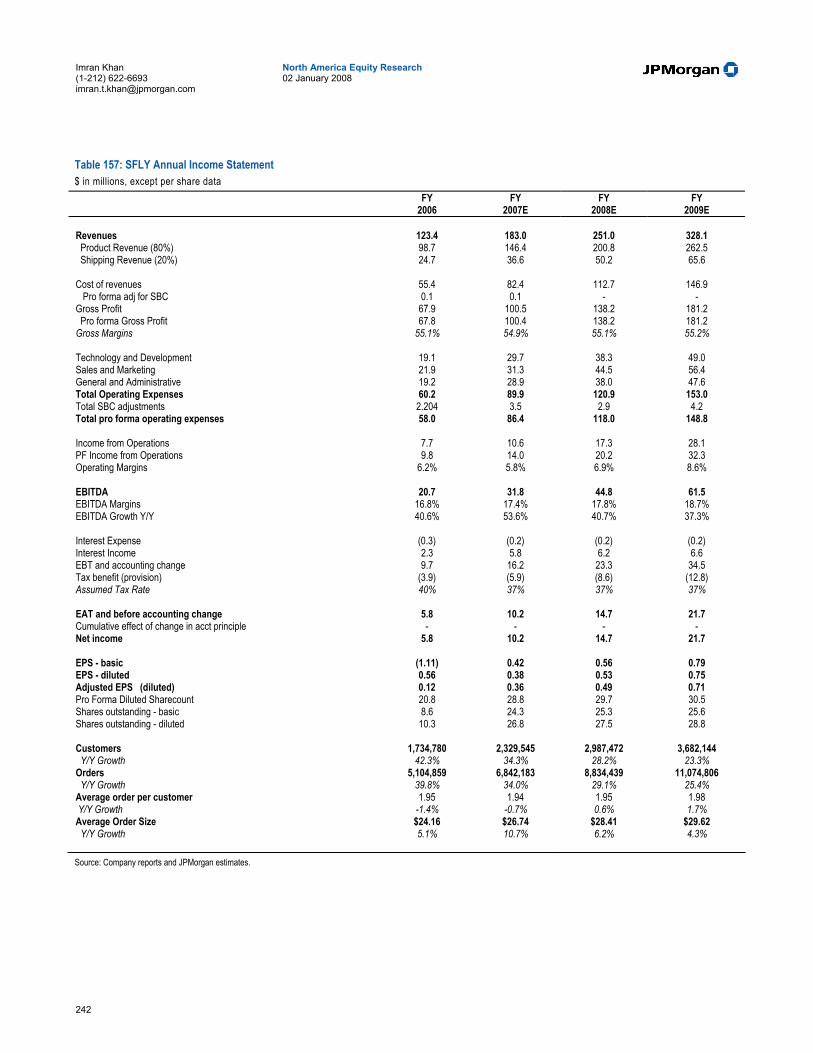
242
North America Equity Research 02 January 2008
Imran Khan (1-212) 622-6693 [email protected]
Table 157: SFLY Annual Income Statement $ in millions, except per share data
FY FY FY FY 2006 2007E 2008E 2009E
Revenues 123.4 183.0 251.0 328.1 Product Revenue (80%) 98.7 146.4 200.8 262.5 Shipping Revenue (20%) 24.7 36.6 50.2 65.6
Cost of revenues 55.4 82.4 112.7 146.9 Pro forma adj for SBC 0.1 0.1 - - Gross Profit 67.9 100.5 138.2 181.2 Pro forma Gross Profit 67.8 100.4 138.2 181.2 Gross Margins 55.1% 54.9% 55.1% 55.2%
Technology and Development 19.1 29.7 38.3 49.0 Sales and Marketing 21.9 31.3 44.5 56.4 General and Administrative 19.2 28.9 38.0 47.6 Total Operating Expenses 60.2 89.9 120.9 153.0 Total SBC adjustments 2.204 3.5 2.9 4.2 Total pro forma operating expenses 58.0 86.4 118.0 148.8
Income from Operations 7.7 10.6 17.3 28.1 PF Income from Operations 9.8 14.0 20.2 32.3 Operating Margins 6.2% 5.8% 6.9% 8.6%
EBITDA 20.7 31.8 44.8 61.5 EBITDA Margins 16.8% 17.4% 17.8% 18.7% EBITDA Growth Y/Y 40.6% 53.6% 40.7% 37.3%
Interest Expense (0.3) (0.2) (0.2) (0.2) Interest Income 2.3 5.8 6.2 6.6 EBT and accounting change 9.7 16.2 23.3 34.5 Tax benefit (provision) (3.9) (5.9) (8.6) (12.8) Assumed Tax Rate 40% 37% 37% 37%
EAT and before accounting change 5.8 10.2 14.7 21.7 Cumulative effect of change in acct principle - - - - Net income 5.8 10.2 14.7 21.7
EPS - basic (1.11) 0.42 0.56 0.79 EPS - diluted 0.56 0.38 0.53 0.75 Adjusted EPS (diluted) 0.12 0.36 0.49 0.71 Pro Forma Diluted Sharecount 20.8 28.8 29.7 30.5 Shares outstanding - basic 8.6 24.3 25.3 25.6 Shares outstanding - diluted 10.3 26.8 27.5 28.8
Customers 1,734,780 2,329,545 2,987,472 3,682,144 Y/Y Growth 42.3% 34.3% 28.2% 23.3% Orders 5,104,859 6,842,183 8,834,439 11,074,806 Y/Y Growth 39.8% 34.0% 29.1% 25.4% Average order per customer 1.95 1.94 1.95 1.98 Y/Y Growth -1.4% -0.7% 0.6% 1.7% Average Order Size $24.16 $26.74 $28.41 $29.62 Y/Y Growth 5.1% 10.7% 6.2% 4.3% Source: Company reports and JPMorgan estimates.
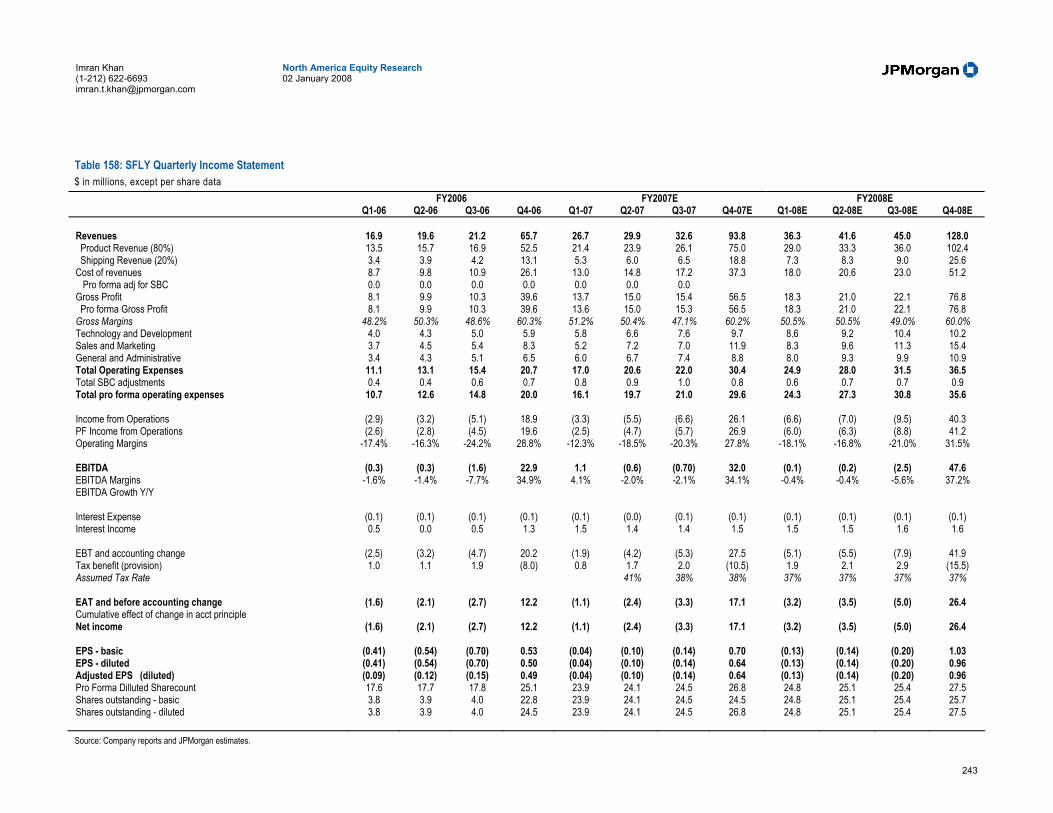
243
North America Equity Research 02 January 2008
Imran Khan (1-212) 622-6693 [email protected]
Table 158: SFLY Quarterly Income Statement $ in millions, except per share data
FY2006 FY2007E FY2008E Q1-06 Q2-06 Q3-06 Q4-06 Q1-07 Q2-07 Q3-07 Q4-07E Q1-08E Q2-08E Q3-08E Q4-08E
Revenues 16.9 19.6 21.2 65.7 26.7 29.9 32.6 93.8 36.3 41.6 45.0 128.0 Product Revenue (80%) 13.5 15.7 16.9 52.5 21.4 23.9 26.1 75.0 29.0 33.3 36.0 102.4 Shipping Revenue (20%) 3.4 3.9 4.2 13.1 5.3 6.0 6.5 18.8 7.3 8.3 9.0 25.6 Cost of revenues 8.7 9.8 10.9 26.1 13.0 14.8 17.2 37.3 18.0 20.6 23.0 51.2 Pro forma adj for SBC 0.0 0.0 0.0 0.0 0.0 0.0 0.0 Gross Profit 8.1 9.9 10.3 39.6 13.7 15.0 15.4 56.5 18.3 21.0 22.1 76.8 Pro forma Gross Profit 8.1 9.9 10.3 39.6 13.6 15.0 15.3 56.5 18.3 21.0 22.1 76.8 Gross Margins 48.2% 50.3% 48.6% 60.3% 51.2% 50.4% 47.1% 60.2% 50.5% 50.5% 49.0% 60.0% Technology and Development 4.0 4.3 5.0 5.9 5.8 6.6 7.6 9.7 8.6 9.2 10.4 10.2 Sales and Marketing 3.7 4.5 5.4 8.3 5.2 7.2 7.0 11.9 8.3 9.6 11.3 15.4 General and Administrative 3.4 4.3 5.1 6.5 6.0 6.7 7.4 8.8 8.0 9.3 9.9 10.9 Total Operating Expenses 11.1 13.1 15.4 20.7 17.0 20.6 22.0 30.4 24.9 28.0 31.5 36.5 Total SBC adjustments 0.4 0.4 0.6 0.7 0.8 0.9 1.0 0.8 0.6 0.7 0.7 0.9 Total pro forma operating expenses 10.7 12.6 14.8 20.0 16.1 19.7 21.0 29.6 24.3 27.3 30.8 35.6
Income from Operations (2.9) (3.2) (5.1) 18.9 (3.3) (5.5) (6.6) 26.1 (6.6) (7.0) (9.5) 40.3 PF Income from Operations (2.6) (2.8) (4.5) 19.6 (2.5) (4.7) (5.7) 26.9 (6.0) (6.3) (8.8) 41.2 Operating Margins -17.4% -16.3% -24.2% 28.8% -12.3% -18.5% -20.3% 27.8% -18.1% -16.8% -21.0% 31.5%
EBITDA (0.3) (0.3) (1.6) 22.9 1.1 (0.6) (0.70) 32.0 (0.1) (0.2) (2.5) 47.6 EBITDA Margins -1.6% -1.4% -7.7% 34.9% 4.1% -2.0% -2.1% 34.1% -0.4% -0.4% -5.6% 37.2% EBITDA Growth Y/Y
Interest Expense (0.1) (0.1) (0.1) (0.1) (0.1) (0.0) (0.1) (0.1) (0.1) (0.1) (0.1) (0.1) Interest Income 0.5 0.0 0.5 1.3 1.5 1.4 1.4 1.5 1.5 1.5 1.6 1.6
EBT and accounting change (2.5) (3.2) (4.7) 20.2 (1.9) (4.2) (5.3) 27.5 (5.1) (5.5) (7.9) 41.9 Tax benefit (provision) 1.0 1.1 1.9 (8.0) 0.8 1.7 2.0 (10.5) 1.9 2.1 2.9 (15.5) Assumed Tax Rate 41% 38% 38% 37% 37% 37% 37%
EAT and before accounting change (1.6) (2.1) (2.7) 12.2 (1.1) (2.4) (3.3) 17.1 (3.2) (3.5) (5.0) 26.4 Cumulative effect of change in acct principle Net income (1.6) (2.1) (2.7) 12.2 (1.1) (2.4) (3.3) 17.1 (3.2) (3.5) (5.0) 26.4
EPS - basic (0.41) (0.54) (0.70) 0.53 (0.04) (0.10) (0.14) 0.70 (0.13) (0.14) (0.20) 1.03 EPS - diluted (0.41) (0.54) (0.70) 0.50 (0.04) (0.10) (0.14) 0.64 (0.13) (0.14) (0.20) 0.96 Adjusted EPS (diluted) (0.09) (0.12) (0.15) 0.49 (0.04) (0.10) (0.14) 0.64 (0.13) (0.14) (0.20) 0.96 Pro Forma Dilluted Sharecount 17.6 17.7 17.8 25.1 23.9 24.1 24.5 26.8 24.8 25.1 25.4 27.5 Shares outstanding - basic 3.8 3.9 4.0 22.8 23.9 24.1 24.5 24.5 24.8 25.1 25.4 25.7 Shares outstanding - diluted 3.8 3.9 4.0 24.5 23.9 24.1 24.5 26.8 24.8 25.1 25.4 27.5 Source: Company reports and JPMorgan estimates.

244
North America Equity Research 02 January 2008
Imran Khan (1-212) 622-6693 [email protected]
Table 159: SFLY Quarterly Income Statement $ in millions, except per share data
FY2006 FY2007E FY2008E Q1-06 Q2-06 Q3-06 Q4-06 Q1-07 Q2-07 Q3-07 Q4-07E Q1-08E Q2-08E Q3-08E Q4-08E
Customers 523,896 517,518 623,000 955,104 693,092 731,384 844,400 1,260,737 901,020 943,485 1,080,832 1,601,136 Y/Y Growth 40.6% 35.5% 39.6% 47.4% 32.3% 41.3% 35.5% 32.0% 30.0% 29.0% 28.0% 27.0% Orders 980,798 1,041,129 1,244,000 1,838,932 1,288,471 1,461,804 1,660,840 2,431,068 1,675,012 1,885,727 2,142,484 3,131,216 Y/Y Growth 33.7% 33.9% 42.5% 45.3% 31.4% 40.4% 33.5% 32.2% 30.0% 29.0% 29.0% 28.8% Average order per customer 1.87 2.01 2.00 1.93 1.86 2.00 1.97 1.93 1.86 2.00 1.98 1.96 Y/Y Growth -4.9% -1.2% 2.1% -1.5% -0.7% -0.7% -1.5% 0.2% 0.0% 0.0% 0.8% 1.4% Average Order Size $17.21 $18.86 $17.00 $35.72 $20.73 $20.44 $19.63 $38.58 $21.66 $22.08 $21.00 $40.89 Y/Y Growth -4.1% 3.9% -5.2% 10.2% 20.5% 8.4% 15.5% 8.0% 4.5% 8.0% 7.0% 6.0%
Print Revenue (% of total revenue) 62% 58% 61% 40% 51% 48% 51% 30% 45% 43% 45% 26% Non-Print Revenue (% of total revenue) 38% 42% 39% 60% 49% 52% 49% 70% 55% 57% 55% 74% Print Revenue 10.5 11.4 12.9 26.1 13.6 14.3 16.6 28.1 16.3 17.9 20.3 33.3 Non-print revenue 6.4 8.2 8.3 39.5 13.1 15.5 16.0 65.6 20.0 23.7 24.8 94.8
Expenses as % of Revenue Cost of revenues 51.8% 49.7% 51.4% 39.7% 48.8% 49.9% 51.1% 39.8% 49.5% 49.5% 51.0% 40.0% Technology and Development 23.6% 21.7% 23.4% 8.9% 21.8% 22.2% 23.2% 10.3% 23.6% 22.0% 23.0% 8.0% Sales and Marketing 21.9% 22.9% 25.5% 12.7% 19.4% 24.1% 21.6% 12.7% 23.0% 23.0% 25.0% 12.0% General and Administrative 20.1% 21.9% 23.9% 9.8% 22.3% 22.6% 22.6% 9.4% 22.0% 22.3% 22.0% 8.5%
Y/Y Change Revenue Growth 28% 39% 36% 60% 58% 52% 54% 43% 36% 39% 38% 37% Cost of revenues 36% 43% 60% 54% 49% 52% 59% 43% 38% 39% 33% 37% Technology and Development 72% 55% 34% 34% 46% 55% 53% 64% 47% 38% 37% 6% Sales and Marketing 62% 56% 44% 32% 40% 60% 30% 43% 61% 33% 60% 29% General and Administrative 21% 81% 80% 14% 76% 57% 45% 36% 34% 38% 35% 23%
Sequential Change Revenue Growth -58.8% 16.3% 7.7% 210.5% -59.3% 11.9% 9.1% 187.7% -61.3% 14.7% 8.1% 184.5%
Cost of revenues -48.2% 11.5% 11.4% 139.9% -50.0% 13.8% 16.2% 116.5% -51.9% 14.7% 11.4% 123.2% Technology and Development -9.0% 7.2% 16.1% 18.5% -1.0% 14.2% 14.1% 27.5% -11.4% 6.9% 13.0% -1.0% Sales and Marketing -41.8% 22.0% 19.9% 54.6% -37.9% 39.0% -2.2% 69.1% -29.9% 14.7% 17.5% 36.6% General and Administrative -40.0% 26.6% 17.6% 27.8% -7.7% 13.0% 9.1% 19.9% -9.4% 16.3% 6.6% 9.9% Source: Company reports and JPMorgan estimates.
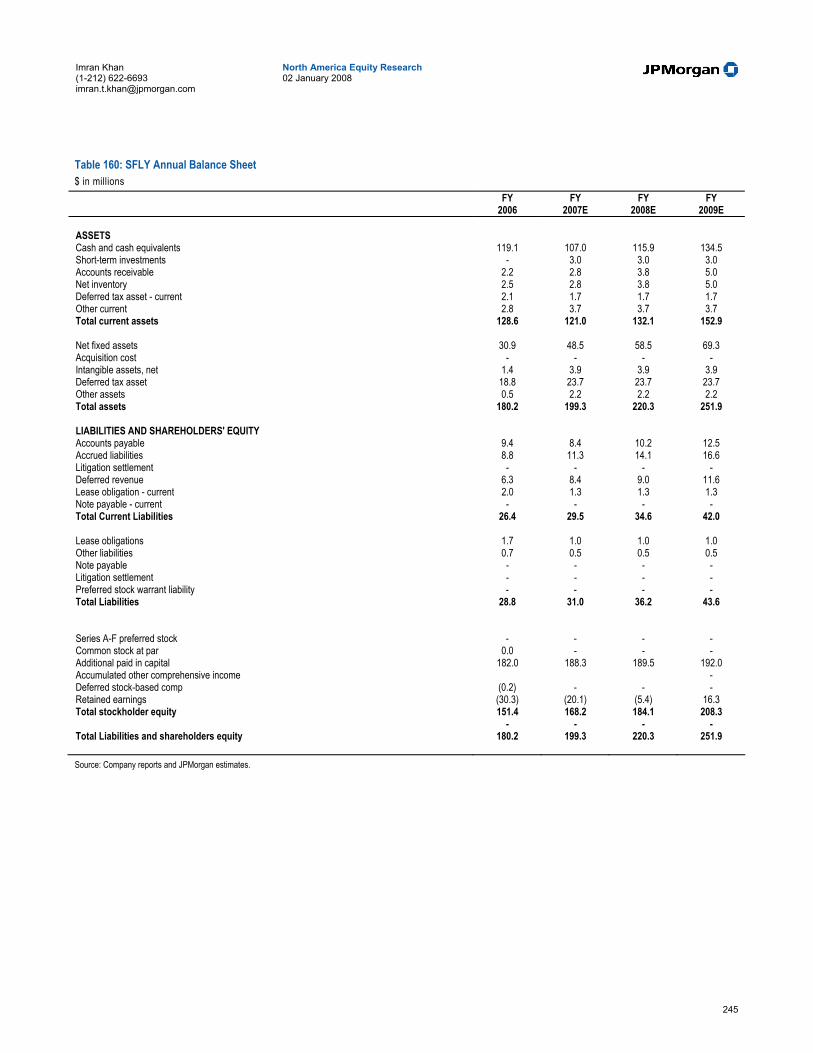
245
North America Equity Research 02 January 2008
Imran Khan (1-212) 622-6693 [email protected]
Table 160: SFLY Annual Balance Sheet $ in millions
FY FY FY FY 2006 2007E 2008E 2009E
ASSETS Cash and cash equivalents 119.1 107.0 115.9 134.5 Short-term investments - 3.0 3.0 3.0 Accounts receivable 2.2 2.8 3.8 5.0 Net inventory 2.5 2.8 3.8 5.0 Deferred tax asset - current 2.1 1.7 1.7 1.7 Other current 2.8 3.7 3.7 3.7 Total current assets 128.6 121.0 132.1 152.9 Net fixed assets 30.9 48.5 58.5 69.3 Acquisition cost - - - - Intangible assets, net 1.4 3.9 3.9 3.9 Deferred tax asset 18.8 23.7 23.7 23.7 Other assets 0.5 2.2 2.2 2.2 Total assets 180.2 199.3 220.3 251.9 LIABILITIES AND SHAREHOLDERS' EQUITY Accounts payable 9.4 8.4 10.2 12.5 Accrued liabilities 8.8 11.3 14.1 16.6 Litigation settlement - - - - Deferred revenue 6.3 8.4 9.0 11.6 Lease obligation - current 2.0 1.3 1.3 1.3 Note payable - current - - - - Total Current Liabilities 26.4 29.5 34.6 42.0 Lease obligations 1.7 1.0 1.0 1.0 Other liabilities 0.7 0.5 0.5 0.5 Note payable - - - - Litigation settlement - - - - Preferred stock warrant liability - - - - Total Liabilities 28.8 31.0 36.2 43.6 Series A-F preferred stock - - - - Common stock at par 0.0 - - - Additional paid in capital 182.0 188.3 189.5 192.0 Accumulated other comprehensive income - Deferred stock-based comp (0.2) - - - Retained earnings (30.3) (20.1) (5.4) 16.3 Total stockholder equity 151.4 168.2 184.1 208.3 - - - - Total Liabilities and shareholders equity 180.2 199.3 220.3 251.9 Source: Company reports and JPMorgan estimates.

246
North America Equity Research 02 January 2008
Imran Khan (1-212) 622-6693 [email protected]
Table 161: SFLY Annual Statement of Cash Flows $ in millions
FY FY FY FY 2006 2007E 2008E 2009E
OPERATING ACTIVITIES: Net income (loss) 5.8 10.2 14.7 21.7 Depreciation and amortization 10.6 17.2 24.0 28.6 Amortization of intangible assets 0.2 0.4 0.6 0.6 Amortization of stock-based compensation, net of cancellation 2.3 3.6 2.9 4.2 Amortization of warrants (0.2) - - - Change in carrying value of preferred stock warrant liability - Gain/loss on disposal of fixed assets (0.0) 0.2 - - Deferred income taxes 3.2 (4.5) - - Charitable contribution expense for shares issued to charitable foundation - Changes in operating assets and liabilities: (0.5) 0.4 3.1 5.1 Inventories (1.4) (0.3) (1.0) (1.1) Accounts receivable (1.2) (0.6) (1.0) (1.1) Prepaid expenses & other current assets (1.2) (0.9) - - Deferred tax asset - - - - Other assets (0.1) (1.7) - - Accounts payable 5.5 (0.9) 1.8 2.2 Accrued liabilities (3.8) 2.8 2.8 2.5 Preferred stock warrant liability - - - - Deferred revenue 1.7 2.2 0.5 2.7 Deferred rent - - - - Net cash provided by operating activities 22.3 27.5 45.2 60.2
FCF 1.6 (7.4) 11.2 20.8
INVESTING ACTIVITIES: Purchase of property & equipment (20.7) (34.9) (34.0) (39.4) Cash acquired from acquisition of business Proceeds from sale of property and equipment - (3.0) - - Net cash provided by (used in) investing activities (20.7) (40.6) (34.0) (39.4)
- - - - FINANCING ACTIVITIES: - - - - Principal payments of capital lease obligation (1.3) (2.4) (2.3) (2.3) Proceeds from loan from a related party - - - - Repayment of loan from a related party - Proceeds from loan - - - - Repayment of loan - - - - Principal payment of note payable obligation - - - - Proceeds from issuance of redeemable conv. pref stock, net of issuance cost - 3.4 - - Payment of IPO related costs - Proceeds from issuance of common stock 80.2 - - - Proceeds from exercise of unvested options - - - - Other - Repurchase of common stock (0.0) - - - Net cash provided by (used in) financing activities 78.3 1.0 (2.3) (2.3)
Net change in cash and cash equivalents 79.9 (12.1) 9.0 18.6 Cash and cash equivalents at beginning of period 39.2 119.1 107.0 115.9 Cash and cash equivalents at end of period 119.1 107.0 115.9 134.5 Source: Company reports and JPMorgan estimates.

247
North America Equity Research 02 January 2008
Imran Khan (1-212) 622-6693 [email protected]
ValueClick, Overweight ($23.39) We are maintaining our Overweight rating on VCLK. We believe that 2008 prospects for growth look good given rising online advertising trends. We also see meaningful margin expansion opportunities in 2008 from the acquisition of MeziMedia. Finally, we think that the Street overreacted to the promotional lead-gen investigation given settlement agreements of comparable investigations. VCLK is trading at an EV/EBITDA multiple of 11.0x our F'08 EBITDA estimate vs. the peer group average of 14.4x, as such, we rate the stock Overweight.
• MeziMedia will likely boost top- and bottom-line growth. We expect MeziMedia to grow 59% Y/Y organically in 2008, bringing total comparison shopping growth to 109% Y/Y. Furthermore, we believe that the SEO technology of MeziMedia is a strong margin driver that can also be leveraged by the Pricerunner platform. Thus, we are modeling EBITDA margins expanding 20 bps Y/Y in F’08.
• Upside to lead gen estimates possible. Since the announcement of the promotional lead-gen investigation, Adteractive, a close promotional lead-gen competitor, settled its FTC investigation with a $650,000 fine and an agreement to conspicuously disclose payments or obligations of consumers to obtain gifts and prizes. Although we are still modeling F'08 promotional lead-gen revenues disappearing to be conservative, we think that there may be upside to this estimate if the FTC allows the business to continue with disclosures.
• 2008 Drivers. In our view, the following factors will drive VCLK shares in 2008: (1) settlement of the FTC investigation, (2) leverage of MeziMedia technology by other business lines, and (3) affiliate marketing strength from increased online ad spend and market share gains.
• Maintaining 4Q'07 estimates. We maintain our 4Q’07 revenue, EBITDA, and EPS estimates of $176.3M, $44.0M, and $0.18 (Y/Y growth of 10%, (5%), and (14%) respectively).
Our current and newly introduced 2009 estimates are in the table below:
Table 162: ValueClick Financial Snapshot $ in millions, except per share data ValueClick 4Q'07E F'07E F'08E F'09E F'07E Y/Y F'08E Y/Y F'09E Y/Y JPMorgan Revenue 176.25 638.75 735.00 858.97 17.1% 15.1% 16.9% EBITDA 44.00 163.80 189.65 220.26 13.0% 15.8% 16.1% EPS 0.18 0.71 0.84 1.01 15.4% 18.9% 19.8% Consensus Revenue 175.98 639.25 740.77 856.30 15.9% 15.6% EBITDA 43.68 164.10 191.31 227.09 16.6% 18.7% EPS 0.18 0.71 0.82 1.06 15.5% 29.3% Source: JPMorgan estimates, Company data, and Bloomberg

248
North America Equity Research 02 January 2008
Imran Khan (1-212) 622-6693 [email protected]
Our Estimates and Outlook for 2008 We are revising our F’08 revenue estimate to $735M and our full-year EPS estimate to $0.84 (from $731M and $0.83), representing Y/Y revenue and EPS growth of 15% and 19%, respectively.
We expect the media segment to contribute $352M of revenue, representing an 8% Y/Y decline in growth. We believe that lead-gen losses will drive down growth levels until the losses begin to be comped in 2Q’08. However, we are very tentatively optimistic that there may be upside to our modeled losses if the FTC settlement allows for the continuation of the business with disclosures. We expect the display advertising business to remain strong as money shifts from lead-gen to display and as dollars shift to the online graphical ad market.
We expect comparison shopping to contribute $187M of revenue, representing 109% Y/Y growth. Much of this growth, we believe, will be driven by the MeziMedia acquisition, which we see growing ~59% organically Y/Y. Furthermore, we believe that the SEO technology of MeziMedia is a strong margin driver that can also be leveraged by the Pricerunner platform. Thus, we are modeling EBITDA margins expanding 20 bps Y/Y in F’08.
We see affiliate marketing achieving revenues of $162M, representing 18% Y/Y growth, a very modest deceleration from F’07E’s 22% Y/Y growth. We believe that this segment will continue to benefit from shifts towards online spending and will continue to gain market share as the leading affiliate network.
We believe that the technology segment will experience 13% Y/Y growth, yielding revenues of $36.8M, a significant deceleration from F’07E’s 26% Y/Y growth. We believe that growth will be hindered by increased competition from MSN due to its recent acquisition of aQuantive and Google with its planned DoubleClick acquisition.
Our Estimates and Outlook for 2009 We are introducing F’09 revenue and EPS estimates of $859M and $1.01, which represent 17% and 20% Y/Y growth, respectively. While revenue is effectively in line with consensus of $856M, our EPS estimate is lower than consensus of $1.06 as we believe that shifts to display advertisements from lead-gen business and increased pricing pressure from competition will begin to offset margin gains from MeziMedia. We are modeling a 20 bp Y/Y decline in EBITDA margin.
We believe that much of the growth will be driven by international revenue across all segments and that domestic growth will be supported by further shifts toward online advertising and the demand for increased customer targeting and rich media services. However, we believe that competition will intensify as large, capital-rich Internet companies are attracted to the growing market.
Valuation and Rating Analysis On an EV/EBITDA basis, ValueClick trades at 11.0x our F' 08 EBITDA estimate of $189.6M, vs. its peers which trade at 14.4x. We believe that the market has over-reacted to the announced FTC investigation and market conditions. Hence, our Overweight rating.
249
North America Equity Research 02 January 2008
Imran Khan (1-212) 622-6693 [email protected]
Risks to Our Rating ValueClick shares may underperform other companies in our coverage universe if 1) the online advertising market weakens and advertisers limit their expenditures to top-tier properties/networks, such as Google, Yahoo! and MSN, 2) the company loses share to large online networks, such as Google, Yahoo and MSN, or if smaller online advertising players create stronger offerings, 3) the company is unable to increase its presence in international markets, including Europe and China and 4) if FTC investigations have a larger-than-projected impact on growth.
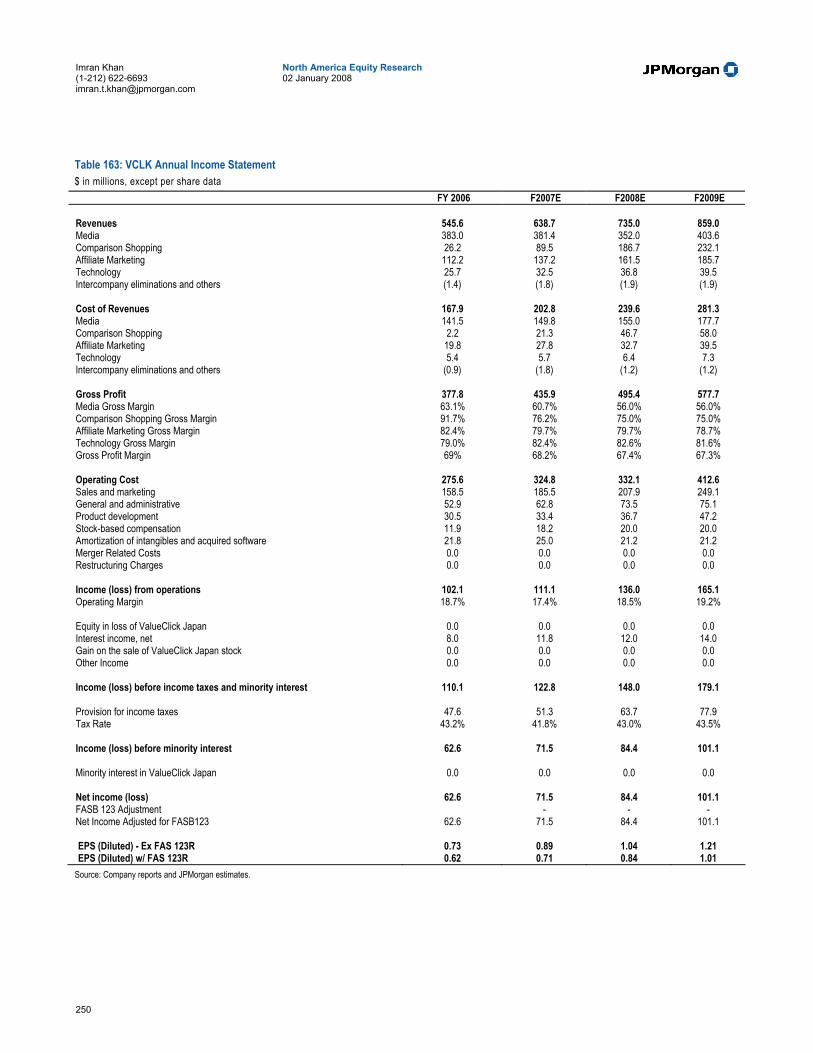
250
North America Equity Research 02 January 2008
Imran Khan (1-212) 622-6693 [email protected]
Table 163: VCLK Annual Income Statement $ in millions, except per share data
FY 2006 F2007E F2008E F2009E
Revenues 545.6 638.7 735.0 859.0 Media 383.0 381.4 352.0 403.6 Comparison Shopping 26.2 89.5 186.7 232.1 Affiliate Marketing 112.2 137.2 161.5 185.7 Technology 25.7 32.5 36.8 39.5 Intercompany eliminations and others (1.4) (1.8) (1.9) (1.9)
Cost of Revenues 167.9 202.8 239.6 281.3 Media 141.5 149.8 155.0 177.7 Comparison Shopping 2.2 21.3 46.7 58.0 Affiliate Marketing 19.8 27.8 32.7 39.5 Technology 5.4 5.7 6.4 7.3 Intercompany eliminations and others (0.9) (1.8) (1.2) (1.2) Gross Profit 377.8 435.9 495.4 577.7 Media Gross Margin 63.1% 60.7% 56.0% 56.0% Comparison Shopping Gross Margin 91.7% 76.2% 75.0% 75.0% Affiliate Marketing Gross Margin 82.4% 79.7% 79.7% 78.7% Technology Gross Margin 79.0% 82.4% 82.6% 81.6% Gross Profit Margin 69% 68.2% 67.4% 67.3%
Operating Cost 275.6 324.8 332.1 412.6 Sales and marketing 158.5 185.5 207.9 249.1 General and administrative 52.9 62.8 73.5 75.1 Product development 30.5 33.4 36.7 47.2 Stock-based compensation 11.9 18.2 20.0 20.0 Amortization of intangibles and acquired software 21.8 25.0 21.2 21.2 Merger Related Costs 0.0 0.0 0.0 0.0 Restructuring Charges 0.0 0.0 0.0 0.0
Income (loss) from operations 102.1 111.1 136.0 165.1 Operating Margin 18.7% 17.4% 18.5% 19.2%
Equity in loss of ValueClick Japan 0.0 0.0 0.0 0.0 Interest income, net 8.0 11.8 12.0 14.0 Gain on the sale of ValueClick Japan stock 0.0 0.0 0.0 0.0 Other Income 0.0 0.0 0.0 0.0
Income (loss) before income taxes and minority interest 110.1 122.8 148.0 179.1
Provision for income taxes 47.6 51.3 63.7 77.9 Tax Rate 43.2% 41.8% 43.0% 43.5%
Income (loss) before minority interest 62.6 71.5 84.4 101.1
Minority interest in ValueClick Japan 0.0 0.0 0.0 0.0
Net income (loss) 62.6 71.5 84.4 101.1 FASB 123 Adjustment - - - Net Income Adjusted for FASB123 62.6 71.5 84.4 101.1
EPS (Diluted) - Ex FAS 123R 0.73 0.89 1.04 1.21 EPS (Diluted) w/ FAS 123R 0.62 0.71 0.84 1.01 Source: Company reports and JPMorgan estimates.
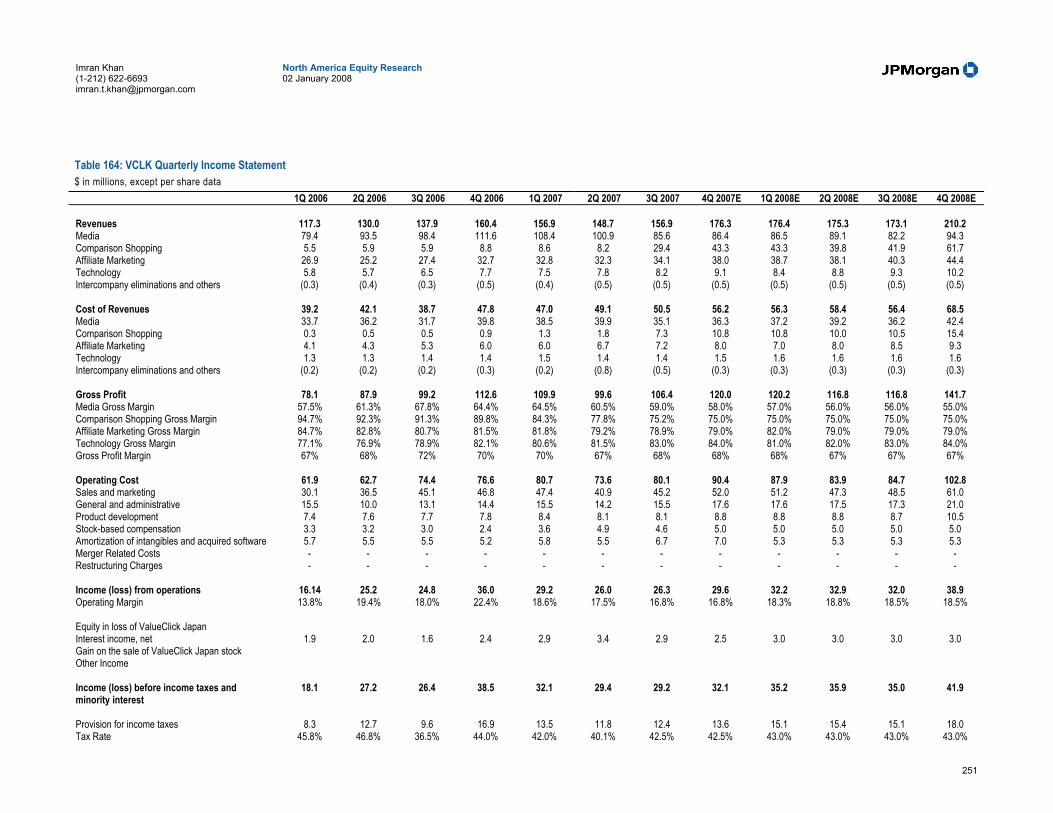
251
North America Equity Research 02 January 2008
Imran Khan (1-212) 622-6693 [email protected]
Table 164: VCLK Quarterly Income Statement $ in millions, except per share data
1Q 2006 2Q 2006 3Q 2006 4Q 2006 1Q 2007 2Q 2007 3Q 2007 4Q 2007E 1Q 2008E 2Q 2008E 3Q 2008E 4Q 2008E
Revenues 117.3 130.0 137.9 160.4 156.9 148.7 156.9 176.3 176.4 175.3 173.1 210.2 Media 79.4 93.5 98.4 111.6 108.4 100.9 85.6 86.4 86.5 89.1 82.2 94.3 Comparison Shopping 5.5 5.9 5.9 8.8 8.6 8.2 29.4 43.3 43.3 39.8 41.9 61.7 Affiliate Marketing 26.9 25.2 27.4 32.7 32.8 32.3 34.1 38.0 38.7 38.1 40.3 44.4 Technology 5.8 5.7 6.5 7.7 7.5 7.8 8.2 9.1 8.4 8.8 9.3 10.2 Intercompany eliminations and others (0.3) (0.4) (0.3) (0.5) (0.4) (0.5) (0.5) (0.5) (0.5) (0.5) (0.5) (0.5)
Cost of Revenues 39.2 42.1 38.7 47.8 47.0 49.1 50.5 56.2 56.3 58.4 56.4 68.5 Media 33.7 36.2 31.7 39.8 38.5 39.9 35.1 36.3 37.2 39.2 36.2 42.4 Comparison Shopping 0.3 0.5 0.5 0.9 1.3 1.8 7.3 10.8 10.8 10.0 10.5 15.4 Affiliate Marketing 4.1 4.3 5.3 6.0 6.0 6.7 7.2 8.0 7.0 8.0 8.5 9.3 Technology 1.3 1.3 1.4 1.4 1.5 1.4 1.4 1.5 1.6 1.6 1.6 1.6 Intercompany eliminations and others (0.2) (0.2) (0.2) (0.3) (0.2) (0.8) (0.5) (0.3) (0.3) (0.3) (0.3) (0.3) Gross Profit 78.1 87.9 99.2 112.6 109.9 99.6 106.4 120.0 120.2 116.8 116.8 141.7 Media Gross Margin 57.5% 61.3% 67.8% 64.4% 64.5% 60.5% 59.0% 58.0% 57.0% 56.0% 56.0% 55.0% Comparison Shopping Gross Margin 94.7% 92.3% 91.3% 89.8% 84.3% 77.8% 75.2% 75.0% 75.0% 75.0% 75.0% 75.0% Affiliate Marketing Gross Margin 84.7% 82.8% 80.7% 81.5% 81.8% 79.2% 78.9% 79.0% 82.0% 79.0% 79.0% 79.0% Technology Gross Margin 77.1% 76.9% 78.9% 82.1% 80.6% 81.5% 83.0% 84.0% 81.0% 82.0% 83.0% 84.0% Gross Profit Margin 67% 68% 72% 70% 70% 67% 68% 68% 68% 67% 67% 67%
Operating Cost 61.9 62.7 74.4 76.6 80.7 73.6 80.1 90.4 87.9 83.9 84.7 102.8 Sales and marketing 30.1 36.5 45.1 46.8 47.4 40.9 45.2 52.0 51.2 47.3 48.5 61.0 General and administrative 15.5 10.0 13.1 14.4 15.5 14.2 15.5 17.6 17.6 17.5 17.3 21.0 Product development 7.4 7.6 7.7 7.8 8.4 8.1 8.1 8.8 8.8 8.8 8.7 10.5 Stock-based compensation 3.3 3.2 3.0 2.4 3.6 4.9 4.6 5.0 5.0 5.0 5.0 5.0 Amortization of intangibles and acquired software 5.7 5.5 5.5 5.2 5.8 5.5 6.7 7.0 5.3 5.3 5.3 5.3 Merger Related Costs - - - - - - - - - - - - Restructuring Charges - - - - - - - - - - - -
Income (loss) from operations 16.14 25.2 24.8 36.0 29.2 26.0 26.3 29.6 32.2 32.9 32.0 38.9 Operating Margin 13.8% 19.4% 18.0% 22.4% 18.6% 17.5% 16.8% 16.8% 18.3% 18.8% 18.5% 18.5%
Equity in loss of ValueClick Japan Interest income, net 1.9 2.0 1.6 2.4 2.9 3.4 2.9 2.5 3.0 3.0 3.0 3.0 Gain on the sale of ValueClick Japan stock Other Income
Income (loss) before income taxes and minority interest
18.1 27.2 26.4 38.5 32.1 29.4 29.2 32.1 35.2 35.9 35.0 41.9
Provision for income taxes 8.3 12.7 9.6 16.9 13.5 11.8 12.4 13.6 15.1 15.4 15.1 18.0 Tax Rate 45.8% 46.8% 36.5% 44.0% 42.0% 40.1% 42.5% 42.5% 43.0% 43.0% 43.0% 43.0%
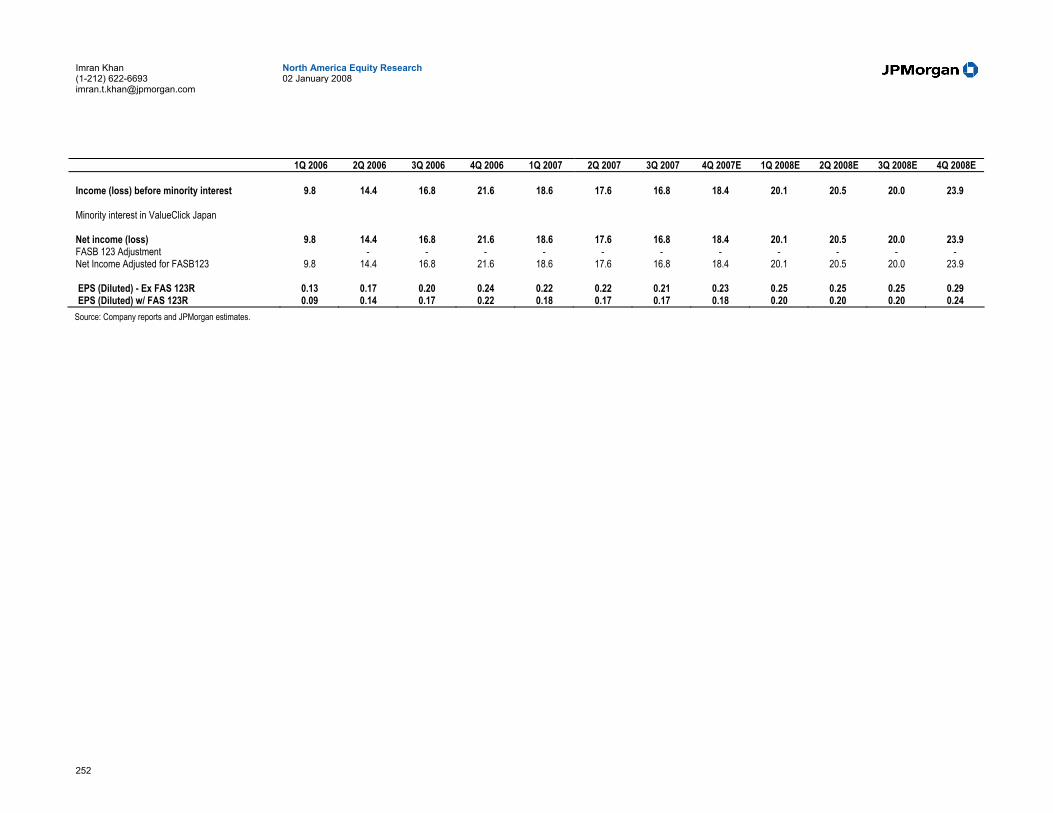
252
North America Equity Research 02 January 2008
Imran Khan (1-212) 622-6693 [email protected]
1Q 2006 2Q 2006 3Q 2006 4Q 2006 1Q 2007 2Q 2007 3Q 2007 4Q 2007E 1Q 2008E 2Q 2008E 3Q 2008E 4Q 2008E
Income (loss) before minority interest 9.8 14.4 16.8 21.6 18.6 17.6 16.8 18.4 20.1 20.5 20.0 23.9
Minority interest in ValueClick Japan
Net income (loss) 9.8 14.4 16.8 21.6 18.6 17.6 16.8 18.4 20.1 20.5 20.0 23.9 FASB 123 Adjustment - - - - - - - - - - - Net Income Adjusted for FASB123 9.8 14.4 16.8 21.6 18.6 17.6 16.8 18.4 20.1 20.5 20.0 23.9
EPS (Diluted) - Ex FAS 123R 0.13 0.17 0.20 0.24 0.22 0.22 0.21 0.23 0.25 0.25 0.25 0.29 EPS (Diluted) w/ FAS 123R 0.09 0.14 0.17 0.22 0.18 0.17 0.17 0.18 0.20 0.20 0.20 0.24 Source: Company reports and JPMorgan estimates.

253
North America Equity Research 02 January 2008
Imran Khan (1-212) 622-6693 [email protected]
Table 165: VCLK Annual Balance Sheet $ in millions
FY 2006 FY 2007E FY 2008E FY 2009E
Cash and cash equivalents 76.8 151.1 301.9 482.6 Investment in marketable securities, at market value 204.8 188.4 192.2 196.1 Pledged marketable securites, at fair value - - - - Accounts receivable, net 107.8 111.8 111.8 111.8 Inventories 2.6 1.6 1.6 1.6 Prepaid expenses and other current assets 4.3 9.0 9.0 9.0 Deferred tax assets 6.6 - - - IPO proceeds receivable - - - - Income taxes receivable - - - - Total Current Assets 403.0 461.9 616.5 801.1
Property and equipment, net 19.0 18.0 19.6 22.4 Marketable Securities, at fair value 0.0 4.0 4.0 4.0 Intangibles, net 91.4 63.9 63.9 63.9 Goodwill 278.1 273.0 273.0 273.0 Deferred income taxes 0.5 0.0 0.0 0.0 Other assets 1.4 1.5 1.5 1.5
Total Assets 793.3 822.3 978.5 1165.9
Accounts payable and accrued expenses 83.8 54.0 54.0 54.0 Income taxes payable 2.5 3.2 3.2 3.2 Deferred revenue 1.1 0.5 0.5 0.5 Short-term debt 0.0 0.0 0.0 0.0 Other current liabilities 0.0 0.2 0.2 0.2 Total current liabilities 87.4 58.0 58.0 58.0
Capital lease obligation, less current portions 0.0 0.1 0.1 0.1 Income taxes payable, less current portion 44.5 Deferred Tax Liabilities 14.4 2.9 2.9 2.9 Other non-current long-term liabilities 3.3 1.2 1.2 1.2
0.0 0.0 0.0 Total Liabilities 149.6 62.2 62.2 62.2
Minority Interest In Valueclick Japan 0.0 0.0 0.0 0.0 Preferred stock 0.0 0.0 0.0 0.0 Common stock 0.1 0.1 0.1 0.1 Additional paid-in capital 632.9 630.0 630.0 630.0 Treasury stock, at cost 0.0 0.0 0.0 0.0 Deferred stock compensation 0.0 3.8 0.0 0.0 Retained Earnings/Accumulated deficit 5.5 127.5 283.4 470.8 Accumulated other comprehensive loss 5.2 2.7 3.0 3.0 Total stockholders' equity 643.7 760.1 916.3 1103.7
Total Liabilities and Stockholders' Equity 793.3 822.3 978.5 1165.9 Source: Company reports and JPMorgan estimates.
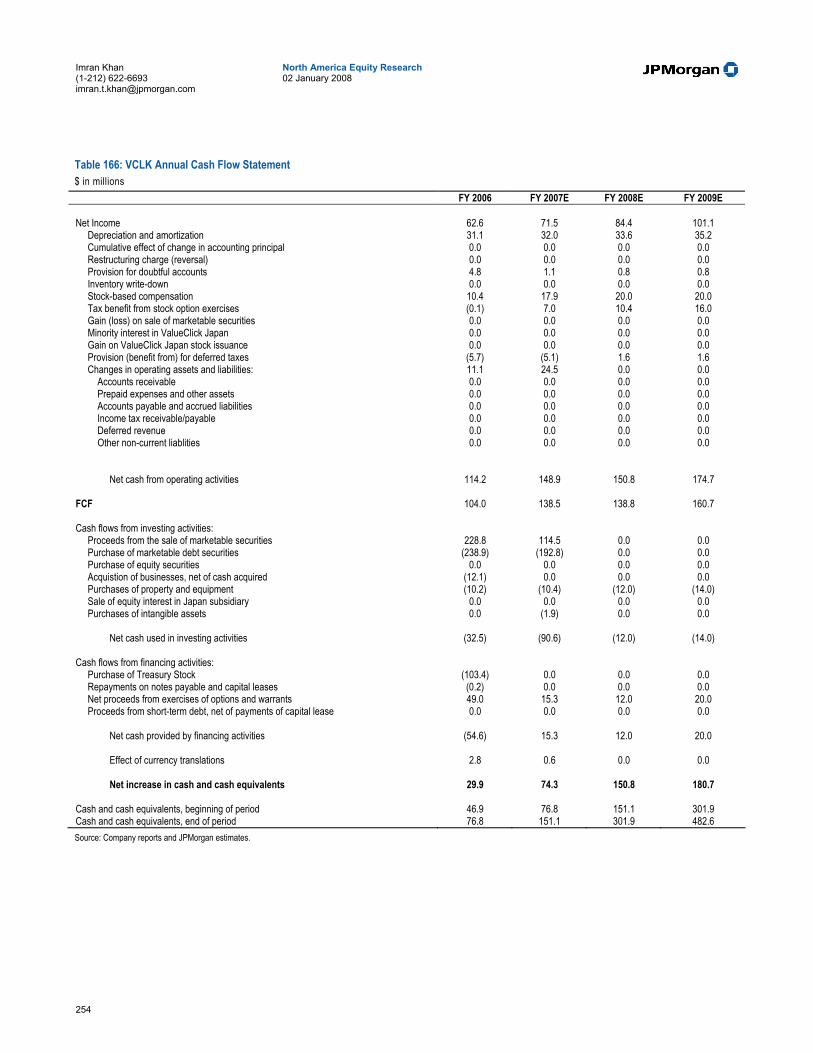
254
North America Equity Research 02 January 2008
Imran Khan (1-212) 622-6693 [email protected]
Table 166: VCLK Annual Cash Flow Statement $ in millions
FY 2006 FY 2007E FY 2008E FY 2009E
Net Income 62.6 71.5 84.4 101.1 Depreciation and amortization 31.1 32.0 33.6 35.2 Cumulative effect of change in accounting principal 0.0 0.0 0.0 0.0 Restructuring charge (reversal) 0.0 0.0 0.0 0.0 Provision for doubtful accounts 4.8 1.1 0.8 0.8 Inventory write-down 0.0 0.0 0.0 0.0 Stock-based compensation 10.4 17.9 20.0 20.0 Tax benefit from stock option exercises (0.1) 7.0 10.4 16.0 Gain (loss) on sale of marketable securities 0.0 0.0 0.0 0.0 Minority interest in ValueClick Japan 0.0 0.0 0.0 0.0 Gain on ValueClick Japan stock issuance 0.0 0.0 0.0 0.0 Provision (benefit from) for deferred taxes (5.7) (5.1) 1.6 1.6 Changes in operating assets and liabilities: 11.1 24.5 0.0 0.0 Accounts receivable 0.0 0.0 0.0 0.0 Prepaid expenses and other assets 0.0 0.0 0.0 0.0 Accounts payable and accrued liabilities 0.0 0.0 0.0 0.0 Income tax receivable/payable 0.0 0.0 0.0 0.0 Deferred revenue 0.0 0.0 0.0 0.0 Other non-current liablities 0.0 0.0 0.0 0.0
Net cash from operating activities 114.2 148.9 150.8 174.7
FCF 104.0 138.5 138.8 160.7
Cash flows from investing activities: Proceeds from the sale of marketable securities 228.8 114.5 0.0 0.0 Purchase of marketable debt securities (238.9) (192.8) 0.0 0.0 Purchase of equity securities 0.0 0.0 0.0 0.0 Acquistion of businesses, net of cash acquired (12.1) 0.0 0.0 0.0 Purchases of property and equipment (10.2) (10.4) (12.0) (14.0) Sale of equity interest in Japan subsidiary 0.0 0.0 0.0 0.0 Purchases of intangible assets 0.0 (1.9) 0.0 0.0
Net cash used in investing activities (32.5) (90.6) (12.0) (14.0)
Cash flows from financing activities: Purchase of Treasury Stock (103.4) 0.0 0.0 0.0 Repayments on notes payable and capital leases (0.2) 0.0 0.0 0.0 Net proceeds from exercises of options and warrants 49.0 15.3 12.0 20.0 Proceeds from short-term debt, net of payments of capital lease 0.0 0.0 0.0 0.0
Net cash provided by financing activities (54.6) 15.3 12.0 20.0
Effect of currency translations 2.8 0.6 0.0 0.0
Net increase in cash and cash equivalents 29.9 74.3 150.8 180.7
Cash and cash equivalents, beginning of period 46.9 76.8 151.1 301.9 Cash and cash equivalents, end of period 76.8 151.1 301.9 482.6 Source: Company reports and JPMorgan estimates.
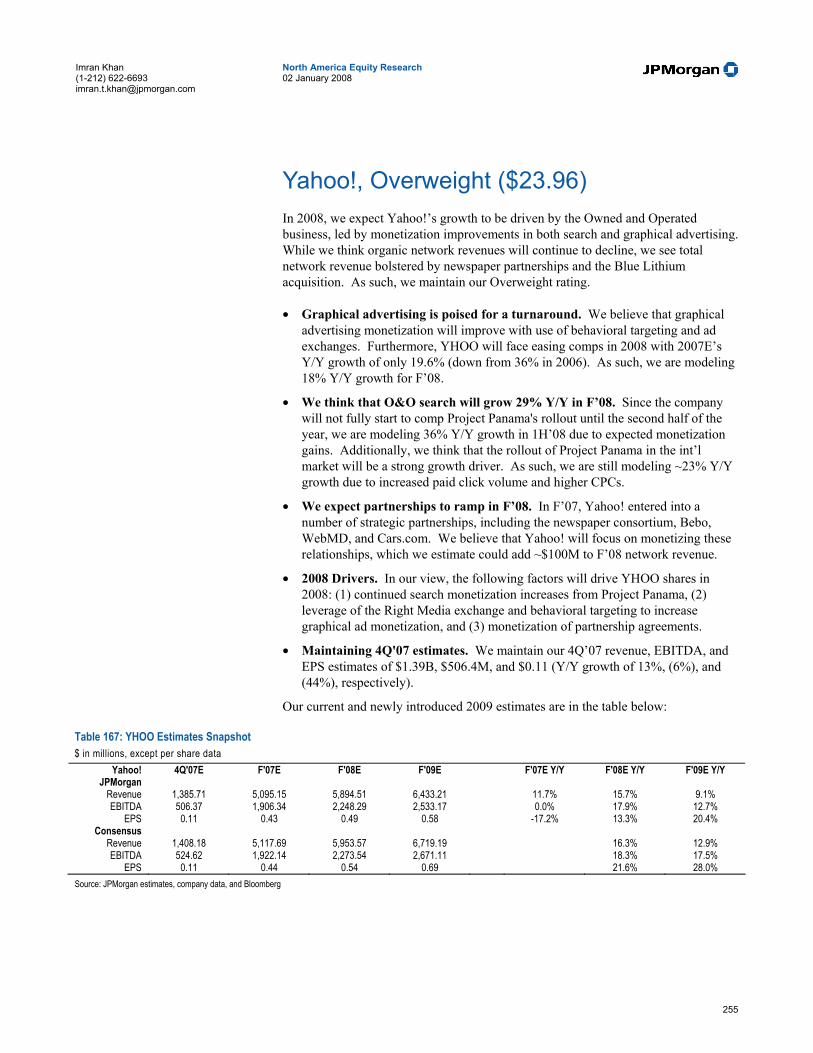
255
North America Equity Research 02 January 2008
Imran Khan (1-212) 622-6693 [email protected]
Yahoo!, Overweight ($23.96) In 2008, we expect Yahoo!’s growth to be driven by the Owned and Operated business, led by monetization improvements in both search and graphical advertising. While we think organic network revenues will continue to decline, we see total network revenue bolstered by newspaper partnerships and the Blue Lithium acquisition. As such, we maintain our Overweight rating.
• Graphical advertising is poised for a turnaround. We believe that graphical advertising monetization will improve with use of behavioral targeting and ad exchanges. Furthermore, YHOO will face easing comps in 2008 with 2007E’s Y/Y growth of only 19.6% (down from 36% in 2006). As such, we are modeling 18% Y/Y growth for F’08.
• We think that O&O search will grow 29% Y/Y in F’08. Since the company will not fully start to comp Project Panama's rollout until the second half of the year, we are modeling 36% Y/Y growth in 1H’08 due to expected monetization gains. Additionally, we think that the rollout of Project Panama in the int’l market will be a strong growth driver. As such, we are still modeling ~23% Y/Y growth due to increased paid click volume and higher CPCs.
• We expect partnerships to ramp in F’08. In F’07, Yahoo! entered into a number of strategic partnerships, including the newspaper consortium, Bebo, WebMD, and Cars.com. We believe that Yahoo! will focus on monetizing these relationships, which we estimate could add ~$100M to F’08 network revenue.
• 2008 Drivers. In our view, the following factors will drive YHOO shares in 2008: (1) continued search monetization increases from Project Panama, (2) leverage of the Right Media exchange and behavioral targeting to increase graphical ad monetization, and (3) monetization of partnership agreements.
• Maintaining 4Q'07 estimates. We maintain our 4Q’07 revenue, EBITDA, and EPS estimates of $1.39B, $506.4M, and $0.11 (Y/Y growth of 13%, (6%), and (44%), respectively).
Our current and newly introduced 2009 estimates are in the table below:
Table 167: YHOO Estimates Snapshot $ in millions, except per share data
Yahoo! 4Q'07E F'07E F'08E F'09E F'07E Y/Y F'08E Y/Y F'09E Y/Y JPMorgan Revenue 1,385.71 5,095.15 5,894.51 6,433.21 11.7% 15.7% 9.1% EBITDA 506.37 1,906.34 2,248.29 2,533.17 0.0% 17.9% 12.7%
EPS 0.11 0.43 0.49 0.58 -17.2% 13.3% 20.4% Consensus
Revenue 1,408.18 5,117.69 5,953.57 6,719.19 16.3% 12.9% EBITDA 524.62 1,922.14 2,273.54 2,671.11 18.3% 17.5%
EPS 0.11 0.44 0.54 0.69 21.6% 28.0% Source: JPMorgan estimates, company data, and Bloomberg

256
North America Equity Research 02 January 2008
Imran Khan (1-212) 622-6693 [email protected]
Our Estimates and Outlook for 2008 We are maintaining our F’08 revenue and GAAP EPS estimates of $5.89B and $0.49, which represent Y/Y growth of 16% and 13%, respectively.
In 2008, we are expecting a turnaround of the graphical advertising segments, which we believe will play out via improved CPM growth and demand. We believe that blended CPM growth will track close to mid-single digits as behavioral targeting and ad exchanges better monetize the channel. Furthermore, we see increased demand for the advertising form as presidential campaign volume and the writers strike drive marketing dollars from TV to display advertising. As such, we are modeling graphical advertising Y/Y growth of 18% to $2.0B.
We believe that Yahoo! will continue to benefit materially through higher search monetization as a result of Project Panama. The company began to roll out the new search platform in 1Q'07, with much of the international rollout occurring during 2H'07. Thus, we think that O&O search growth rates will accelerate to 29% Y/Y from 27% in F'07E.
Another key component of Yahoo!’s 2008 performance will be its ability to monetize its graphical affiliate partnerships. In 2007, Yahoo! was able to sign numerous partnerships, including the newspaper consortium, Bebo, Cars.com, and WebMD. In 2008, we look for the company to begin to generate revenue from these relationships, which we think can approach ~$100M.

257
North America Equity Research 02 January 2008
Imran Khan (1-212) 622-6693 [email protected]
Table 168: Yahoo! Partnership Estimates $ in millions
Company Category Partership Date
Ave. Monthly Unique Users
(TTM)
PV (last 12 Months
through Nov.)
Estimated Incremental
YHOO Revenue
Bebo Social Network 9/12/2007 3.6 28,469 5.6 Comcast Cable,
entertainment 4/30/2007 20.7 39,890 31.9
The McClatchy Company
Newspapers 4/16/2007 6.5 1,524 1.2
Calkins Media, Inc.
Newspapers 4/16/2007 NA NA NA
Media General, Inc.
Newspapers 4/16/2007 2.0 298 0.2
Morris Communication
s, Inc.
Newspapers 4/16/2007 NA NA NA
Paddock Publications,
Inc.
Newspapers 4/16/2007 NA NA NA
Belo Corp Newspapers 11/20/2006 4.4 1,057 0.8 Cox
Newspapers Newspapers 11/20/2006 3.4 1,088 0.9
The E.W. Scripps
Company
Newspapers 11/20/2006 16.7 5,049 4.0
Hearst Newspapers
Newspapers 11/20/2006 6.4 105 0.1
Journal Register Company
Newspapers 11/20/2006 1.1 110 0.1
Lee Enterprises Newspapers 11/20/2006 5.3 1,137 0.9 MediaNews Group, Inc.
Newspapers 11/20/2006 3.5 624 0.5
eBay Online auctions site
5/25/2006 80.2 112,806 53.6
Total 99.9 Source: comScore and JPMorgan estimates
Our Estimates and Outlook for 2009 We are introducing 2009 revenue, EBITDA, and EPS estimates of $6.43B, $2.53B, and $0.58. Our newly introduced F’09 revenue, EBITDA, and EPS estimates call for Y/Y growth of 9%, 13%, and 20%, respectively.
We expect roughly sustained graphical advertising growth of 17% Y/Y as we believe targeting capabilities will drive both monetization and demands. We expect O&O search growth to decline to the high teens from the high twenties as the company monetizes its gains and as we believe that it will continue to lose market share to Google. Finally, we think network revenue will decline 3% as the company focuses on it O&O businesses.
Valuation and Rating Analysis Given our belief that the company has begun to address softness in the graphical advertising market, that there is further upside potential to Project Panama than currently expected, and that asset value limits downside, we rate the stock Overweight. On an EV/EBITDA basis, Yahoo! trades at 11.4x our F’08 EBITDA estimate of $2.25B vs. its peers at 18.0x F’08 estimates.
258
North America Equity Research 02 January 2008
Imran Khan (1-212) 622-6693 [email protected]
Risks to Our Rating Yahoo! is heavily dependent on the performance of the online advertising industry. Yahoo! generates the majority of its net revenues from its Marketing Services revenue unit. The advertising industry is susceptible to overarching economic conditions, making a large portion of Yahoo!’s revenues vulnerable to general economic risk. Changes in competition (e.g., mergers/acquisitions) and new regulations could also impact Yahoo!’s main revenue stream.
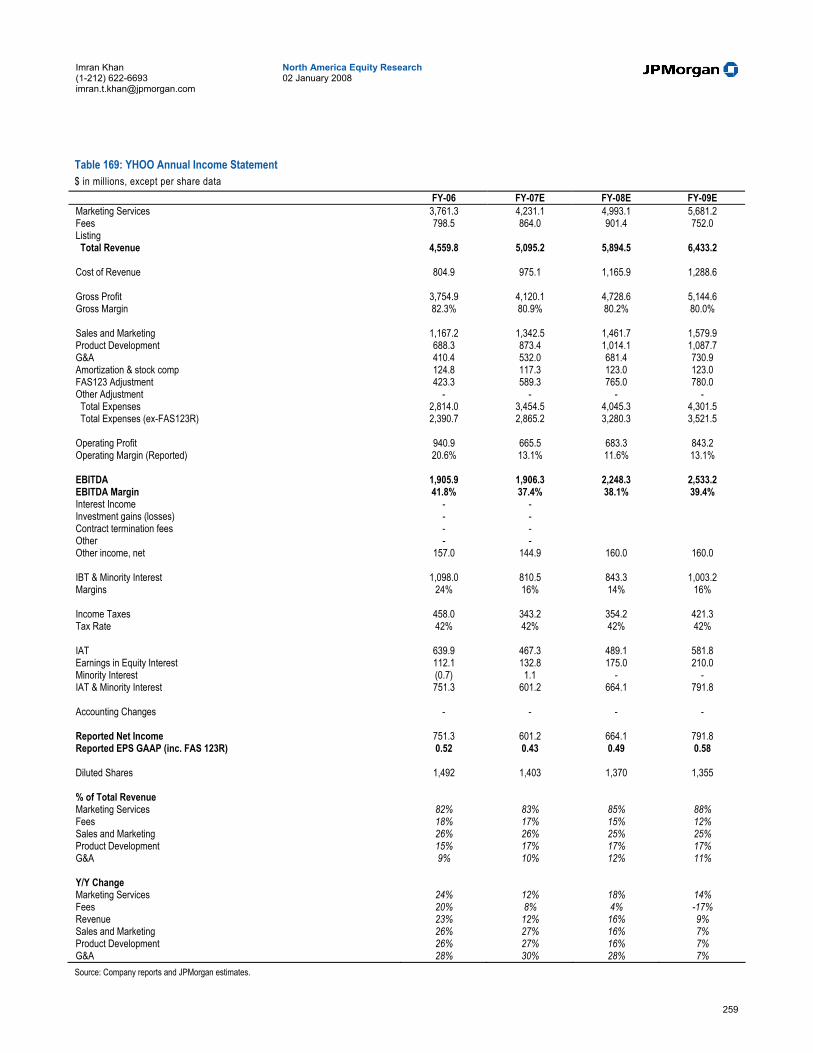
259
North America Equity Research 02 January 2008
Imran Khan (1-212) 622-6693 [email protected]
Table 169: YHOO Annual Income Statement $ in millions, except per share data
FY-06 FY-07E FY-08E FY-09E Marketing Services 3,761.3 4,231.1 4,993.1 5,681.2 Fees 798.5 864.0 901.4 752.0 Listing Total Revenue 4,559.8 5,095.2 5,894.5 6,433.2
Cost of Revenue 804.9 975.1 1,165.9 1,288.6
Gross Profit 3,754.9 4,120.1 4,728.6 5,144.6 Gross Margin 82.3% 80.9% 80.2% 80.0%
Sales and Marketing 1,167.2 1,342.5 1,461.7 1,579.9 Product Development 688.3 873.4 1,014.1 1,087.7 G&A 410.4 532.0 681.4 730.9 Amortization & stock comp 124.8 117.3 123.0 123.0 FAS123 Adjustment 423.3 589.3 765.0 780.0 Other Adjustment - - - - Total Expenses 2,814.0 3,454.5 4,045.3 4,301.5 Total Expenses (ex-FAS123R) 2,390.7 2,865.2 3,280.3 3,521.5 Operating Profit 940.9 665.5 683.3 843.2 Operating Margin (Reported) 20.6% 13.1% 11.6% 13.1%
EBITDA 1,905.9 1,906.3 2,248.3 2,533.2 EBITDA Margin 41.8% 37.4% 38.1% 39.4% Interest Income - - Investment gains (losses) - - Contract termination fees - - Other - - Other income, net 157.0 144.9 160.0 160.0
IBT & Minority Interest 1,098.0 810.5 843.3 1,003.2 Margins 24% 16% 14% 16%
Income Taxes 458.0 343.2 354.2 421.3 Tax Rate 42% 42% 42% 42%
IAT 639.9 467.3 489.1 581.8 Earnings in Equity Interest 112.1 132.8 175.0 210.0 Minority Interest (0.7) 1.1 - - IAT & Minority Interest 751.3 601.2 664.1 791.8
Accounting Changes - - - -
Reported Net Income 751.3 601.2 664.1 791.8 Reported EPS GAAP (inc. FAS 123R) 0.52 0.43 0.49 0.58
Diluted Shares 1,492 1,403 1,370 1,355
% of Total Revenue Marketing Services 82% 83% 85% 88% Fees 18% 17% 15% 12% Sales and Marketing 26% 26% 25% 25% Product Development 15% 17% 17% 17% G&A 9% 10% 12% 11%
Y/Y Change Marketing Services 24% 12% 18% 14% Fees 20% 8% 4% -17% Revenue 23% 12% 16% 9% Sales and Marketing 26% 27% 16% 7% Product Development 26% 27% 16% 7% G&A 28% 30% 28% 7% Source: Company reports and JPMorgan estimates.

260
North America Equity Research 02 January 2008
Imran Khan (1-212) 622-6693 [email protected]
Table 170: YHOO Quarterly Income Statement $ in millions, except per share data
FY-2006 FY-2007E FY 2008E Q1-06 Q2-06 Q3-06 Q4-06 Q1-07 Q2-07 Q3-07 Q4-07E Q1-08E Q2-08E Q3-08E Q4-08E
Marketing Services 901.5 933.0 911.5 1,015.2 979.8 1,031.9 1,058.7 1,160.7 1,146.1 1,229.3 1,267.9 1,349.7 Fees 186.2 189.6 209.9 212.7 203.2 211.9 223.9 225.0 221.2 226.3 227.0 227.0 Listing Total Revenue 1,087.7 1,122.7 1,121.5 1,227.9 1,183.1 1,243.8 1,282.6 1,385.7 1,367.3 1,455.6 1,494.9 1,576.7
Cost of Revenue 178.6 191.0 220.6 214.7 222.9 226.5 252.7 273.0 269.4 283.8 299.0 313.8
Gross Profit 909.1 931.7 900.9 1013.2 960.2 1017.3 1029.9 1112.7 1097.9 1171.7 1196.0 1263.0 Gross Margin 83.6% 83.0% 80.3% 82.5% 81.2% 81.8% 80.3% 80.3% 80.3% 80.5% 80.0% 80.1%
Sales and Marketing 292.3 287.4 288.6 299.0 317.2 338.3 340.6 346.4 348.7 362.4 372.2 378.4 Product Development 179.9 172.6 163.8 172.1 191.2 216.6 223.1 242.5 252.9 254.7 254.1 252.3 G&A 97.9 108.4 91.9 112.1 115.7 123.4 140.5 152.4 161.3 171.8 174.9 173.4 Amortization & stock comp 30.9 34.0 32.8 27.2 27.1 25.2 30.0 35.0 30.0 30.0 31.0 32.0 FAS123 Adjustment 107.0 99.7 121.5 95.1 140.0 128.8 145.5 175.0 185.0 190.0 195.0 195.0 Other Adjustment Total Expenses 707.9 702.1 698.6 705.4 791.2 832.3 879.7 951.4 977.9 1008.9 1027.3 1031.1 Total Expenses (ex-FAS123R) 600.9 602.4 577.1 610.3 651.2 703.5 734.1 776.4 792.9 818.9 832.3 836.1 Operating Profit 201.2 229.6 202.3 307.8 169.0 185.0 150.2 161.4 120.0 162.8 168.7 231.8 Operating Margin (Reported) 18.5% 20.5% 18.0% 25.1% 14.3% 14.9% 11.7% 11.6% 8.8% 11.2% 11.3% 14.7%
EBITDA 434.9 456.9 473.7 540.4 460.0 473.6 466.3 506.4 490.0 547.8 568.7 641.8 EBITDA Margin 40.0% 40.7% 42.2% 44.0% 38.9% 38.1% 36.4% 36.5% 35.8% 37.6% 38.0% 40.7% Interest Income Investment gains (losses) - - - - - - - - Contract termination fees - - - - - - - - Other - - - - - - - - Other income, net 35.4 36.1 50.3 35.2 35.5 30.7 43.7 35.0 40.0 40.0 40.0 40.0
IBT & Minority Interest 236.6 265.7 252.6 343.1 204.5 215.7 193.9 196.4 160.0 202.8 208.7 271.8 Margins 22% 24% 23% 28% 17% 17% 15% 14% 12% 14% 14% 17%
Income Taxes 102.9 122.7 124.4 108.0 92.4 87.7 78.7 84.4 67.2 85.2 87.6 114.2 Tax Rate 44% 46% 49% 31% 45% 41% 41% 43% 42% 42% 42% 42%
IAT 133.7 143.0 128.2 235.1 112.1 128.0 115.3 111.9 92.8 117.6 121.0 157.7 Earnings in Equity Interest 26.4 21.6 30.2 33.9 29.1 32.1 36.5 35.0 40.0 42.0 45.0 48.0 Minority Interest (0.3) (0.3) 0.1 (0.2) 1.2 0.5 (0.5) - - - - - IAT & Minority Interest 159.8 164.3 158.5 268.7 142.4 160.6 151.3 146.9 132.8 159.6 166.0 205.7
Accounting Changes - - - - - - - - - - - -
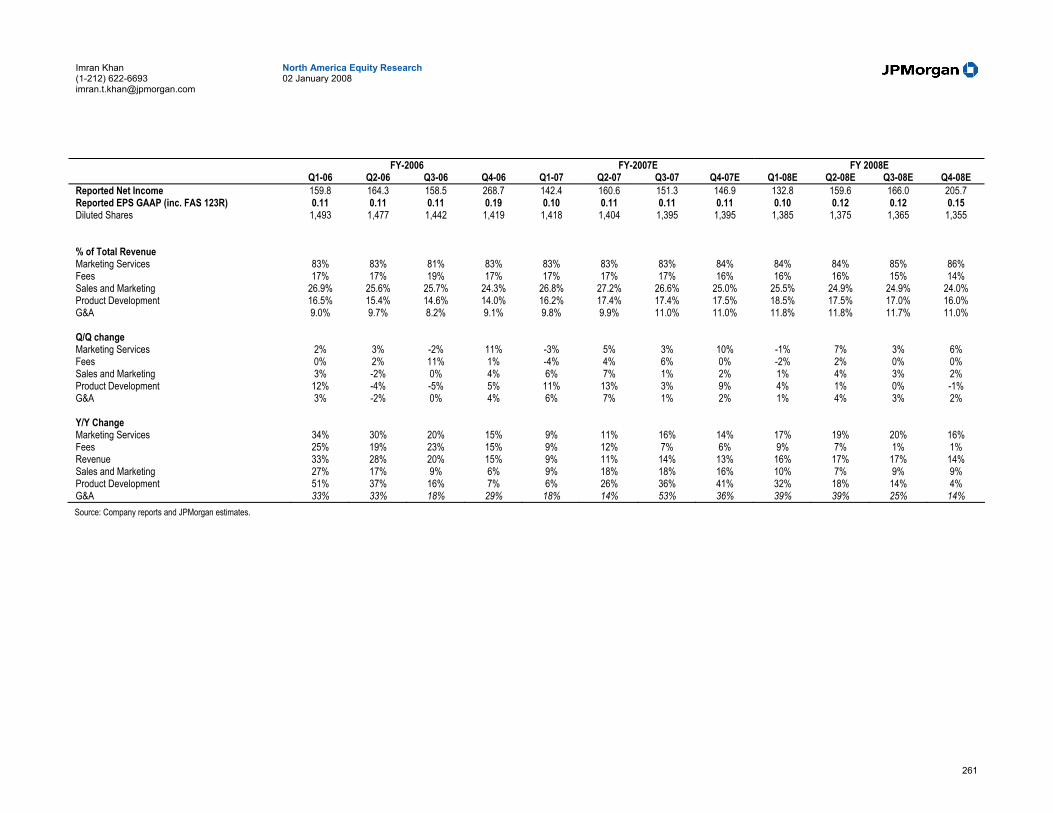
261
North America Equity Research 02 January 2008
Imran Khan (1-212) 622-6693 [email protected]
FY-2006 FY-2007E FY 2008E Q1-06 Q2-06 Q3-06 Q4-06 Q1-07 Q2-07 Q3-07 Q4-07E Q1-08E Q2-08E Q3-08E Q4-08E
Reported Net Income 159.8 164.3 158.5 268.7 142.4 160.6 151.3 146.9 132.8 159.6 166.0 205.7 Reported EPS GAAP (inc. FAS 123R) 0.11 0.11 0.11 0.19 0.10 0.11 0.11 0.11 0.10 0.12 0.12 0.15 Diluted Shares 1,493 1,477 1,442 1,419 1,418 1,404 1,395 1,395 1,385 1,375 1,365 1,355
% of Total Revenue Marketing Services 83% 83% 81% 83% 83% 83% 83% 84% 84% 84% 85% 86% Fees 17% 17% 19% 17% 17% 17% 17% 16% 16% 16% 15% 14% Sales and Marketing 26.9% 25.6% 25.7% 24.3% 26.8% 27.2% 26.6% 25.0% 25.5% 24.9% 24.9% 24.0% Product Development 16.5% 15.4% 14.6% 14.0% 16.2% 17.4% 17.4% 17.5% 18.5% 17.5% 17.0% 16.0% G&A 9.0% 9.7% 8.2% 9.1% 9.8% 9.9% 11.0% 11.0% 11.8% 11.8% 11.7% 11.0%
Q/Q change Marketing Services 2% 3% -2% 11% -3% 5% 3% 10% -1% 7% 3% 6% Fees 0% 2% 11% 1% -4% 4% 6% 0% -2% 2% 0% 0% Sales and Marketing 3% -2% 0% 4% 6% 7% 1% 2% 1% 4% 3% 2% Product Development 12% -4% -5% 5% 11% 13% 3% 9% 4% 1% 0% -1% G&A 3% -2% 0% 4% 6% 7% 1% 2% 1% 4% 3% 2%
Y/Y Change Marketing Services 34% 30% 20% 15% 9% 11% 16% 14% 17% 19% 20% 16% Fees 25% 19% 23% 15% 9% 12% 7% 6% 9% 7% 1% 1% Revenue 33% 28% 20% 15% 9% 11% 14% 13% 16% 17% 17% 14% Sales and Marketing 27% 17% 9% 6% 9% 18% 18% 16% 10% 7% 9% 9% Product Development 51% 37% 16% 7% 6% 26% 36% 41% 32% 18% 14% 4% G&A 33% 33% 18% 29% 18% 14% 53% 36% 39% 39% 25% 14% Source: Company reports and JPMorgan estimates.
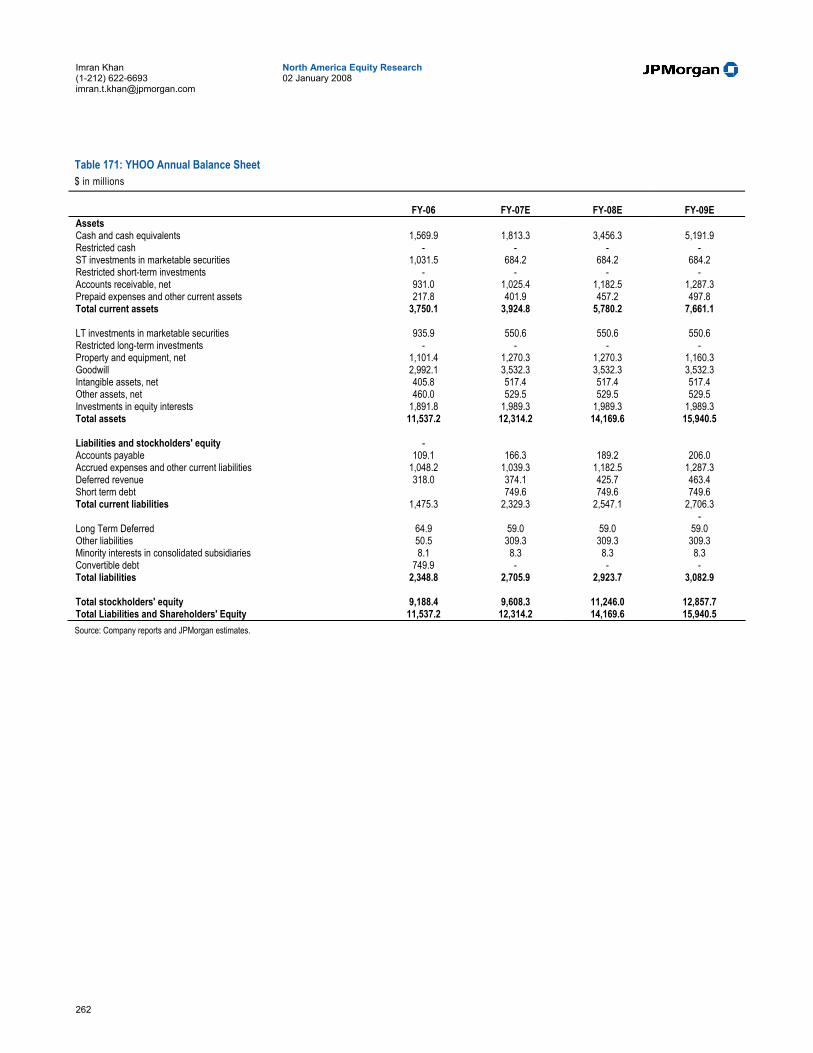
262
North America Equity Research 02 January 2008
Imran Khan (1-212) 622-6693 [email protected]
Table 171: YHOO Annual Balance Sheet $ in millions
FY-06 FY-07E FY-08E FY-09E
Assets Cash and cash equivalents 1,569.9 1,813.3 3,456.3 5,191.9 Restricted cash - - - - ST investments in marketable securities 1,031.5 684.2 684.2 684.2 Restricted short-term investments - - - - Accounts receivable, net 931.0 1,025.4 1,182.5 1,287.3 Prepaid expenses and other current assets 217.8 401.9 457.2 497.8 Total current assets 3,750.1 3,924.8 5,780.2 7,661.1
LT investments in marketable securities 935.9 550.6 550.6 550.6 Restricted long-term investments - - - - Property and equipment, net 1,101.4 1,270.3 1,270.3 1,160.3 Goodwill 2,992.1 3,532.3 3,532.3 3,532.3 Intangible assets, net 405.8 517.4 517.4 517.4 Other assets, net 460.0 529.5 529.5 529.5 Investments in equity interests 1,891.8 1,989.3 1,989.3 1,989.3 Total assets 11,537.2 12,314.2 14,169.6 15,940.5
Liabilities and stockholders' equity - Accounts payable 109.1 166.3 189.2 206.0 Accrued expenses and other current liabilities 1,048.2 1,039.3 1,182.5 1,287.3 Deferred revenue 318.0 374.1 425.7 463.4 Short term debt 749.6 749.6 749.6 Total current liabilities 1,475.3 2,329.3 2,547.1 2,706.3
- Long Term Deferred 64.9 59.0 59.0 59.0 Other liabilities 50.5 309.3 309.3 309.3 Minority interests in consolidated subsidiaries 8.1 8.3 8.3 8.3 Convertible debt 749.9 - - - Total liabilities 2,348.8 2,705.9 2,923.7 3,082.9
Total stockholders' equity 9,188.4 9,608.3 11,246.0 12,857.7 Total Liabilities and Shareholders' Equity 11,537.2 12,314.2 14,169.6 15,940.5 Source: Company reports and JPMorgan estimates.

263
North America Equity Research 02 January 2008
Imran Khan (1-212) 622-6693 [email protected]
Table 172: YHOO Cash Flow Statement $ in millions
FY-06 FY-07E FY-08E FY-09E
Net Income 751.3 601.2 664.1 791.8 D&A 540.0 651.5 800.0 910.0 Tax Benefit 529.7 103.3 360.0 200.0 Excess Tax Benefit from SBC - Equity (112.1) (134.3) (146.2) (146.2) Minority Interests 6.3 14.0 - - Stock Based Compensation 424.9 589.3 765.0 780.0 Other Non-Cash Items (7.8) (56.5) - - Changes in Working Capital (163.7) 148.4 - - Accounts Receivable - - - - Prepaid Expenses - - - - Accounts Payable - - - - Accrued Charges - - - - Deferred Revenue - - - - Other Operating - - - - Cash From Operations 1,431.4 1,668.9 2,442.9 2,535.7
FCF 1,279.5 1,307.0 1,642.9 1,735.7
INVESTING CASH FLOWS Capital Expenditures (689.1) (609.8) (800.0) (800.0) Net Investment 536.8 246.0 - - ST Investment Purch. (334.8) (112.0) - - ST Investments Mat. 436.0 510.7 - - Acquisitions (142.6) (355.5) - - Cash From Investing (193.7) (320.7) (800.0) (800.0)
FINANCING CASH FLOWS Common Stock Issued 318.1 243.9 - - Shares Repurchased (1,782.1) (1,363.2) - - Structured stock repurchase (227.7) (250.0) - - Excess Tax Benefit from SBC 537.3 247.9 - - Other financing activities, net - (15.9) - - Long Term Debt - - - - Cash From Financing (1,154.5) (1,137.3) - -
Foreign Exch Effects 56.9 32.5 - - Net Change In Cash 140.1 243.5 1,642.9 1,735.7
Cash at Beginning 1,429.8 1,569.9 1,813.3 3,456.3 Cash at End 1,569.9 1,813.4 3,456.3 5,191.9 Source: Company reports and JPMorgan estimates.

China C
ompany Preview
s


267
North America Equity Research 02 January 2008
Imran Khan (1-212) 622-6693 [email protected]
Baidu, Overweight ($399.67) We maintain our Overweight rating on Baidu, the dominant market leader in China's online search market, which is still in an early high-growth stage. We expect the paid search market in China to experience ~55% CAGR over 2007-2012, driven by: (1) rising Internet penetration in China, (2) significant growth in websites and pages, (3) higher search usage, and (4) increased SME search marketing due to relatively higher ROI. Baidu’s search market share is around 60%-70% (as per different market research firms) and it also now has the top Internet traffic in China (as per Alexa).
• Baidu’s fundamentals continue to remain strong. In 3Q07, active online marketing customers were ~143K, up 12% Q/Q and up 40% Y/Y. Revenue per online marketing customer was Rmb3,469 (~US$467), up 11% Q/Q and up 49%Y/Y. Going forward, we expect customer numbers to grow at a faster rate than revenue per customer. Also, by end-3Q07, customer deposits were at Rmb 229M, up 27% Q/Q; we believe the good customer deposit growth sets a good stage for future revenue growth.
• We expect Baidu to maintain its leading search engine position in China due to: (1) its products are tailored better to local needs (eg. music search and Baidu Knows - community Q&A site), (2) its strong local brand name, (3) good relationship with the Chinese government, and (4) its good Chinese search technology.
• Baidu also has one of the widest distribution networks in China (a key to driving sales), and remains well ahead of competitors in this regard. As per management, the company has 60 first-level/large distributors; we believe there are also more than a thousand second-tier distributors / agents across China. A wide distribution network remains crucial as the paid search market in China is still in an early phase of development, and many SME advertisers still need advice and services from ad agencies.
• In our view, positive share price drivers include: (1) potential upside from new revenue sources, such as display ads and Baidu TV, as a majority of its current traffic is now on non-search properties; (2) continued strong fundamentals in paid search (still in early high-growth stage), including margin expansion; (3) potential from long-term strategic investments, such as the Japanese site and C2C e-commerce platform; and (4) QDII funds showing strong interest in leading US-listed Chinese names.
• For 4Q07, we estimate total revenue of US$76.2M, up 15% Q/Q and 119% Y/Y, and GAAP-diluted EPS of US$0.60, down 14% Q/Q and up 33% Y/Y, with the Shenzhen distributor transition and Internet Data Center shut-down issues leading to slightly slower growth in the quarter (we believe these are short-lived issues, while the longer-term fundamental outlook remains strong).

268
North America Equity Research 02 January 2008
Imran Khan (1-212) 622-6693 [email protected]
Table 173: Baidu Financial Snapshot US$ millions, except per share data 4Q07E 3Q07A 4Q06A Y/Y Q/Q F'07E F'08E F'09E F'07E Y/Y F'08E Y/Y F'09E Y/YJPMorgan Revenue 76.2 66.3 34.8 119% 15% 230.1 451.0 716.5 118% 96% 59% EBITDA 29.0 29.2 16.9 72% -1% 96.1 196.9 315.7 100% 105% 60% EPS (GAAP) 0.60 0.70 0.45 33% -14% 2.15 4.42 6.99 99% 106% 58% EPS (Adj.) * 0.66 0.72 0.48 37% -9% 2.31 4.65 7.21 83% 101% 55% Consensus Revenue 76.0 66.3 34.8 119% 15% 226.7 418.1 666.0 115% 84% 59% EBITDA - 29.2 16.9 EPS (GAAP) 0.72 0.70 0.45 59% 3% 2.30 4.07 6.33 112% 77% 56% Source: JPMorgan, First Call estimates. *Note: Adjusted EPS excludes share-based compensation expense.
Our Estimates and Outlook for 2008 We forecast 2008 total revenue at US$451M, up 96% Y/Y, and GAAP-diluted EPS of US$4.42, up 106% Y/Y. We expect active online marketing customers to grow at ~42% Y/Y in 2008 to reach ~220K in 4Q08, and revenue per customer to reach Rmb 4,811 in 4Q08, up 31% Y/Y. In respect of margins, we forecast gross margin at 63.9% for 2008, or relatively stable vs. 63.7% for 2007; adjusted operating margin (ex-share-based expense) of 35.2% for 2008, up from 32.1% for 2007 (due to better leverage in SG&A expenses), and adjusted net margin (ex-share-based expense) of 36.7% for 2008, up from 35% for 2007.
Also, Baidu’s Japan search service is set to launch in 4Q07 (with full-year 2007 expense of ~US$15M); however, revenue will likely not come in until late 2008 or 2009. In respect of C2C e-commerce, the business model will be similar to C2C market leader Taobao (keyword ranking with free store front offered) and is scheduled to launch in 2008. The company expects spending on the C2C service will be significantly less than the Japan investment. We are not modeling any revenue contribution as yet. Also, we do not expect any significant negative revenue impact from Baidu’s C2C competitors (Taobao and eBay Eachnet), which are still Baidu’s customers.
Our Estimates and Outlook for 2009 For 2009, we forecast total revenue at US$716.5M, up 59% Y/Y, and GAAP-diluted EPS of US$6.99, up 58% Y/Y. We forecast active online marketing customers to reach ~282K in 4Q09, up 28% Y/Y, and revenue per customer to reach Rmb 5,556 in 4Q09, up 15% Y/Y. We forecast gross margin at 62.7% for 2009 (slightly lower Y/Y); adjusted operating margin (ex-share-based expense) of 35.3% (stable from prior year) and adjusted net margin (ex-share-based expense) of 36.4% (stable).
269
North America Equity Research 02 January 2008
Imran Khan (1-212) 622-6693 [email protected]
Rating and Price Target We maintain our OW rating on Baidu. Our Dec-08 price target is US$400, based on a PEG ratio of 1.9x (based on 2009E PE, divided by 2011 estimated earnings growth), or 1.1x (based on 2009E PE, divided by 2010E earnings growth), largely in line with valuation on China’s Internet names. The PT implies 90.5x 2008E, 57.2x 2009E, and 38.1x 2010E diluted GAAP P/E (or 86.1x 2008E, 55.5x 2009E, and 37.3x 2010E diluted adjusted P/E).
We believe Baidu’s current valuation can be sustained at least until end-2008 due to: (1) Internet growth outlook will likely remain unchanged, and Internet penetration in China is still below 20% vs. the US level of 65%+; also, the number of SMEs using search is still low, roughly 240k out of around 4 million relatively larger SMEs in China. (2) Potential pickup in eCommerce after 2008. (3) New revenue sources, such as Baidu TV and display ads, to provide upside surprise. (4) Investments from domestic Chinese investors.
In addition, we believe that earnings upside could come from the expansion in Japan, Baidu TV, banner advertising, C2C e-commerce services and potential margin expansion.
As with other growth stocks, we believe Baidu’s shares may continue to be volatile. However, from a 12-month perspective, we expect Baidu to further consolidate its leading position and increase its monetization rate from growing traffic.
Risks to Our Rating and Price Target Downside risks to our rating and price target include: (1) Slower-than-expected online search spending. (2) Large infrastructure-related (servers and bandwidth) spending. (3) Near-term distributor transition (Baidu is transitioning its sales channel from distributor sales to direct sales in Shenzhen). (4) Unsuccessful Japan and e-commerce initiatives. (5) Potential margin decline (from bandwidth cost increases, tax rate increases and significant labor cost increases).
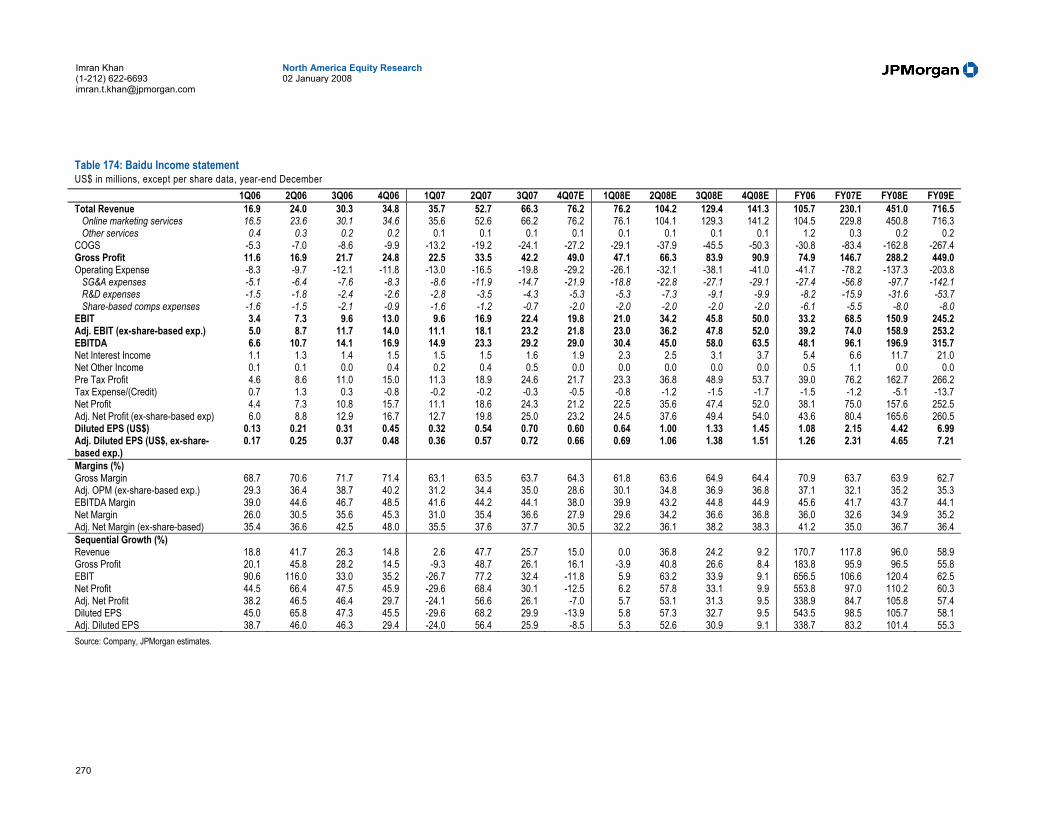
270
North America Equity Research 02 January 2008
Imran Khan (1-212) 622-6693 [email protected]
Table 174: Baidu Income statement US$ in millions, except per share data, year-end December
1Q06 2Q06 3Q06 4Q06 1Q07 2Q07 3Q07 4Q07E 1Q08E 2Q08E 3Q08E 4Q08E FY06 FY07E FY08E FY09E Total Revenue 16.9 24.0 30.3 34.8 35.7 52.7 66.3 76.2 76.2 104.2 129.4 141.3 105.7 230.1 451.0 716.5 Online marketing services 16.5 23.6 30.1 34.6 35.6 52.6 66.2 76.2 76.1 104.1 129.3 141.2 104.5 229.8 450.8 716.3 Other services 0.4 0.3 0.2 0.2 0.1 0.1 0.1 0.1 0.1 0.1 0.1 0.1 1.2 0.3 0.2 0.2 COGS -5.3 -7.0 -8.6 -9.9 -13.2 -19.2 -24.1 -27.2 -29.1 -37.9 -45.5 -50.3 -30.8 -83.4 -162.8 -267.4 Gross Profit 11.6 16.9 21.7 24.8 22.5 33.5 42.2 49.0 47.1 66.3 83.9 90.9 74.9 146.7 288.2 449.0 Operating Expense -8.3 -9.7 -12.1 -11.8 -13.0 -16.5 -19.8 -29.2 -26.1 -32.1 -38.1 -41.0 -41.7 -78.2 -137.3 -203.8 SG&A expenses -5.1 -6.4 -7.6 -8.3 -8.6 -11.9 -14.7 -21.9 -18.8 -22.8 -27.1 -29.1 -27.4 -56.8 -97.7 -142.1 R&D expenses -1.5 -1.8 -2.4 -2.6 -2.8 -3.5 -4.3 -5.3 -5.3 -7.3 -9.1 -9.9 -8.2 -15.9 -31.6 -53.7 Share-based comps expenses -1.6 -1.5 -2.1 -0.9 -1.6 -1.2 -0.7 -2.0 -2.0 -2.0 -2.0 -2.0 -6.1 -5.5 -8.0 -8.0 EBIT 3.4 7.3 9.6 13.0 9.6 16.9 22.4 19.8 21.0 34.2 45.8 50.0 33.2 68.5 150.9 245.2 Adj. EBIT (ex-share-based exp.) 5.0 8.7 11.7 14.0 11.1 18.1 23.2 21.8 23.0 36.2 47.8 52.0 39.2 74.0 158.9 253.2 EBITDA 6.6 10.7 14.1 16.9 14.9 23.3 29.2 29.0 30.4 45.0 58.0 63.5 48.1 96.1 196.9 315.7 Net Interest Income 1.1 1.3 1.4 1.5 1.5 1.5 1.6 1.9 2.3 2.5 3.1 3.7 5.4 6.6 11.7 21.0 Net Other Income 0.1 0.1 0.0 0.4 0.2 0.4 0.5 0.0 0.0 0.0 0.0 0.0 0.5 1.1 0.0 0.0 Pre Tax Profit 4.6 8.6 11.0 15.0 11.3 18.9 24.6 21.7 23.3 36.8 48.9 53.7 39.0 76.2 162.7 266.2 Tax Expense/(Credit) 0.7 1.3 0.3 -0.8 -0.2 -0.2 -0.3 -0.5 -0.8 -1.2 -1.5 -1.7 -1.5 -1.2 -5.1 -13.7 Net Profit 4.4 7.3 10.8 15.7 11.1 18.6 24.3 21.2 22.5 35.6 47.4 52.0 38.1 75.0 157.6 252.5 Adj. Net Profit (ex-share-based exp) 6.0 8.8 12.9 16.7 12.7 19.8 25.0 23.2 24.5 37.6 49.4 54.0 43.6 80.4 165.6 260.5 Diluted EPS (US$) 0.13 0.21 0.31 0.45 0.32 0.54 0.70 0.60 0.64 1.00 1.33 1.45 1.08 2.15 4.42 6.99 Adj. Diluted EPS (US$, ex-share-based exp.)
0.17 0.25 0.37 0.48 0.36 0.57 0.72 0.66 0.69 1.06 1.38 1.51 1.26 2.31 4.65 7.21
Margins (%) Gross Margin 68.7 70.6 71.7 71.4 63.1 63.5 63.7 64.3 61.8 63.6 64.9 64.4 70.9 63.7 63.9 62.7 Adj. OPM (ex-share-based exp.) 29.3 36.4 38.7 40.2 31.2 34.4 35.0 28.6 30.1 34.8 36.9 36.8 37.1 32.1 35.2 35.3 EBITDA Margin 39.0 44.6 46.7 48.5 41.6 44.2 44.1 38.0 39.9 43.2 44.8 44.9 45.6 41.7 43.7 44.1 Net Margin 26.0 30.5 35.6 45.3 31.0 35.4 36.6 27.9 29.6 34.2 36.6 36.8 36.0 32.6 34.9 35.2 Adj. Net Margin (ex-share-based) 35.4 36.6 42.5 48.0 35.5 37.6 37.7 30.5 32.2 36.1 38.2 38.3 41.2 35.0 36.7 36.4 Sequential Growth (%) Revenue 18.8 41.7 26.3 14.8 2.6 47.7 25.7 15.0 0.0 36.8 24.2 9.2 170.7 117.8 96.0 58.9 Gross Profit 20.1 45.8 28.2 14.5 -9.3 48.7 26.1 16.1 -3.9 40.8 26.6 8.4 183.8 95.9 96.5 55.8 EBIT 90.6 116.0 33.0 35.2 -26.7 77.2 32.4 -11.8 5.9 63.2 33.9 9.1 656.5 106.6 120.4 62.5 Net Profit 44.5 66.4 47.5 45.9 -29.6 68.4 30.1 -12.5 6.2 57.8 33.1 9.9 553.8 97.0 110.2 60.3 Adj. Net Profit 38.2 46.5 46.4 29.7 -24.1 56.6 26.1 -7.0 5.7 53.1 31.3 9.5 338.9 84.7 105.8 57.4 Diluted EPS 45.0 65.8 47.3 45.5 -29.6 68.2 29.9 -13.9 5.8 57.3 32.7 9.5 543.5 98.5 105.7 58.1 Adj. Diluted EPS 38.7 46.0 46.3 29.4 -24.0 56.4 25.9 -8.5 5.3 52.6 30.9 9.1 338.7 83.2 101.4 55.3 Source: Company, JPMorgan estimates.
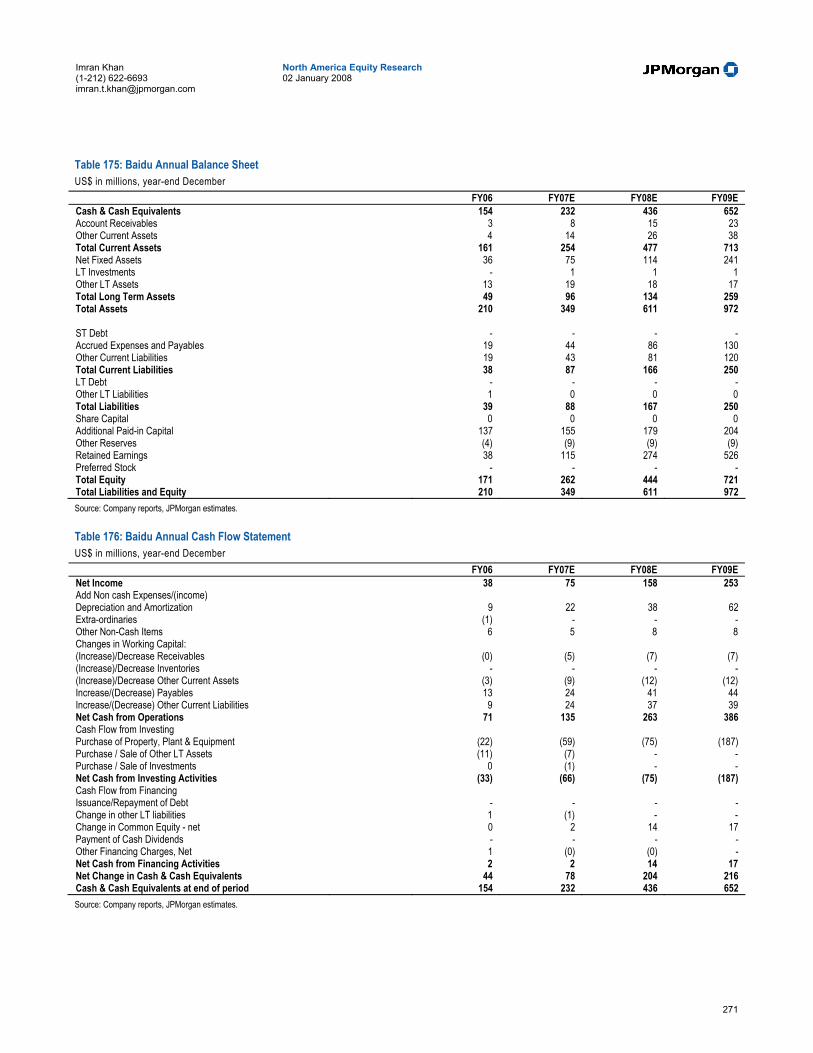
271
North America Equity Research 02 January 2008
Imran Khan (1-212) 622-6693 [email protected]
Table 175: Baidu Annual Balance Sheet US$ in millions, year-end December FY06 FY07E FY08E FY09E Cash & Cash Equivalents 154 232 436 652 Account Receivables 3 8 15 23 Other Current Assets 4 14 26 38 Total Current Assets 161 254 477 713 Net Fixed Assets 36 75 114 241 LT Investments - 1 1 1 Other LT Assets 13 19 18 17 Total Long Term Assets 49 96 134 259 Total Assets 210 349 611 972 ST Debt - - - - Accrued Expenses and Payables 19 44 86 130 Other Current Liabilities 19 43 81 120 Total Current Liabilities 38 87 166 250 LT Debt - - - - Other LT Liabilities 1 0 0 0 Total Liabilities 39 88 167 250 Share Capital 0 0 0 0 Additional Paid-in Capital 137 155 179 204 Other Reserves (4) (9) (9) (9) Retained Earnings 38 115 274 526 Preferred Stock - - - - Total Equity 171 262 444 721 Total Liabilities and Equity 210 349 611 972 Source: Company reports, JPMorgan estimates.
Table 176: Baidu Annual Cash Flow Statement US$ in millions, year-end December FY06 FY07E FY08E FY09E Net Income 38 75 158 253 Add Non cash Expenses/(income) Depreciation and Amortization 9 22 38 62 Extra-ordinaries (1) - - - Other Non-Cash Items 6 5 8 8 Changes in Working Capital: (Increase)/Decrease Receivables (0) (5) (7) (7) (Increase)/Decrease Inventories - - - - (Increase)/Decrease Other Current Assets (3) (9) (12) (12) Increase/(Decrease) Payables 13 24 41 44 Increase/(Decrease) Other Current Liabilities 9 24 37 39 Net Cash from Operations 71 135 263 386 Cash Flow from Investing Purchase of Property, Plant & Equipment (22) (59) (75) (187) Purchase / Sale of Other LT Assets (11) (7) - - Purchase / Sale of Investments 0 (1) - - Net Cash from Investing Activities (33) (66) (75) (187) Cash Flow from Financing Issuance/Repayment of Debt - - - - Change in other LT liabilities 1 (1) - - Change in Common Equity - net 0 2 14 17 Payment of Cash Dividends - - - - Other Financing Charges, Net 1 (0) (0) - Net Cash from Financing Activities 2 2 14 17 Net Change in Cash & Cash Equivalents 44 78 204 216 Cash & Cash Equivalents at end of period 154 232 436 652 Source: Company reports, JPMorgan estimates.

272
North America Equity Research 02 January 2008
Imran Khan (1-212) 622-6693 [email protected]
China Finance Online, Overweight ($23.75) We maintain our Overweight rating on China Finance Online (JRJC). We remain positive on the current management team's execution capability, and expect continued business momentum through a significant scaling up of the company’s core subscriptions business in 2008 and beyond.
• JRJC’s execution capability has significantly improved over the last year, particularly in its core individual subscription business, where the company has delivered four back-to-back quarters of record cash inflows. In 3Q07, individual subscriber cash inflows were a record-high US$11.06M, up 35% Q/Q and 465% Y/Y; deferred revenue reached US$18.8M, up 31% Q/Q and 563% Y/Y. Signaling greater business confidence, JRJC also raised its 2008 guidance at the 3Q07 results announcement. JRJC now expects 2008 revenue of US$50-$60M (up 113% Y/Y at the mid-point) and adj. net income of US$22-$28M (up 150% Y/Y at the mid-point), driven by continuing strength in its core subscription business.
• Although a prolonged downturn (lasting for several quarters) in China’s domestic stock market may have an adverse effect on demand for JRJC’s offerings, we believe the company is now significantly better positioned than in the past to continue on a strong growth path. JRJC has expanded its tele-sales force from ~90 at the end of 2006 to around 260 as of 3Q07, and is preparing for a 500-seat call center by mid-2008; we expect this to be a key component of the company’s subscriber acquisition / up-selling strategy, which should help to drive significant scaling up of revenues and earnings. Also, the company’s fundamental analysis product series ‘Value Engine’ remains a differentiated offering for consumers.
• We believe the key share price drivers include: (1) continued strong performance in its core subscriptions business, (2) further strategic acquisitions to expand its core business, and (3) potentially acquiring an A-share brokerage license, after having acquired a small HK broker. The key downside risk remains: a prolonged slow-down in domestic stock market activities.
• For 4Q07, we estimate net revenues at US$8.8M, up 20% Q/Q and 249% Y/Y, and GAAP EPS of US$0.11, up 36% Q/Q (and vs. loss of US$0.08 in 4Q06). Our top-line estimate is 2% above the mid-point of company guidance (US$8.2-$9.0M). With the projected strong top-line growth, we expect adjusted operating margin (ex-share-based expense) to expand to 38.5% in 4Q07, up from 34.5% in 3Q07.

273
North America Equity Research 02 January 2008
Imran Khan (1-212) 622-6693 [email protected]
Table 177: JRJC Financial Snapshot US$ millions, except per share data 4Q07E 3Q07A 4Q06A Y/Y Q/Q F'07E F'08E F'09E F'07E Y/Y F'08E Y/Y F'09E Y/YJPMorgan Revenue 8.8 7.3 2.5 249% 20% 25.8 56.5 106.9 262% 119% 89% EBITDA 3.7 2.8 -0.3 n.m. 33% 9.3 28.4 55.2 1006% 206% 94% EPS (GAAP) 0.11 0.08 -0.08 n.m. 36% 0.32 0.92 1.82 n.m. 189% 98% EPS (Adj.) * 0.16 0.13 -0.01 n.m. 22% 0.46 1.11 2.01 1529% 139% 81% Consensus Revenue 8.6 7.3 2.5 241% 18% 25.7 56.5 106.0 261% 120% 88% EBITDA - 2.8 -0.3 - - - - - - - - EPS (GAAP) 0.11 0.08 -0.08 n.m. 30% 0.32 0.92 1.82 n.m. 188% 98% Source: JPMorgan, First Call estimates. *Note: Adjusted EPS excludes share-based compensation expense.
Our Estimates and Outlook for 2008 We forecast 2008 net revenue at US$56.5M, up 119% Y/Y, and GAAP-diluted EPS of US$0.92, up 189% Y/Y, or adjusted EPS (ex-share-based expense) of US$1.11, up 139% Y/Y. We expect JRJC’s core subscription business to remain the key driver on the back of continued solid execution, particularly with the planned tripling of its tele-sales team by mid-08 (to reach ~760). In respect of margins, we forecast gross margin at 83.4% for 2008, up slightly from 82.6% for 2007; adjusted operating margin (ex-share-based expense) of 46.9% for 2008, expanding from 32.2% for 2007 (due to better leverage in operating expenses), and adjusted net margin (ex-share-based expense) of 44.8% for 2008, up from 38.8% for 2007.
Our Estimates and Outlook for 2009 For 2009, we forecast net revenue at US$106.9M, up 89% Y/Y, and GAAP-diluted EPS of US$1.82, up 98% Y/Y, or adjusted EPS (ex-share-based expense) of US$2.01, up 81% Y/Y. We forecast gross margin at 84.0% for 2009 (up slightly Y/Y); adjusted operating margin (ex-share-based expense) of 48.2% (slight expansion) and adjusted net margin (ex-share-based expense) of 43.2% (down slightly due to slightly higher tax rate assumption).
Rating and Price Target We maintain our Overweight rating on JRJC. Our Dec-08 price target is US$36, which implies ’08 / ’09 PE of 32x / 18x on our adjusted diluted EPS estimates (or GAAP PE of 39x /20x), on the back of ’08E / ’09E / ‘10E adjusted diluted EPS growth of 139% / 81% / 22%. The price target is slightly above our DCF valuation of ~US$33 (based on WACC of 14% & terminal growth of 0%) due to the strong growth prospects.
Risks to Our Rating and Price Target Downside risks to our rating and price target are: (1) prolonged slowdown in domestic stock market activities (which have historically impacted demand for JRJC’s products), (2) increased competition in financial analysis software, (3) management bandwidth in managing the expanding business scale (core business) and wider portfolio (institutional subscriptions, HK brokerage, advertising).
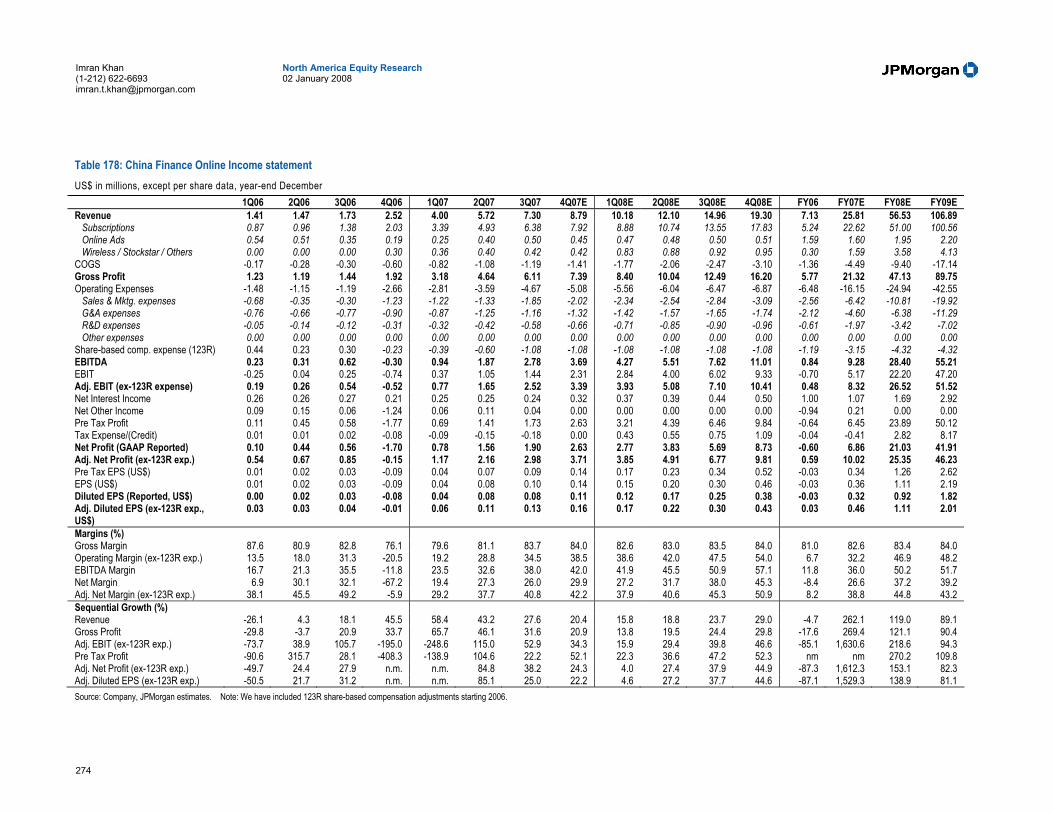
274
North America Equity Research 02 January 2008
Imran Khan (1-212) 622-6693 [email protected]
Table 178: China Finance Online Income statement US$ in millions, except per share data, year-end December
1Q06 2Q06 3Q06 4Q06 1Q07 2Q07 3Q07 4Q07E 1Q08E 2Q08E 3Q08E 4Q08E FY06 FY07E FY08E FY09E Revenue 1.41 1.47 1.73 2.52 4.00 5.72 7.30 8.79 10.18 12.10 14.96 19.30 7.13 25.81 56.53 106.89 Subscriptions 0.87 0.96 1.38 2.03 3.39 4.93 6.38 7.92 8.88 10.74 13.55 17.83 5.24 22.62 51.00 100.56 Online Ads 0.54 0.51 0.35 0.19 0.25 0.40 0.50 0.45 0.47 0.48 0.50 0.51 1.59 1.60 1.95 2.20 Wireless / Stockstar / Others 0.00 0.00 0.00 0.30 0.36 0.40 0.42 0.42 0.83 0.88 0.92 0.95 0.30 1.59 3.58 4.13 COGS -0.17 -0.28 -0.30 -0.60 -0.82 -1.08 -1.19 -1.41 -1.77 -2.06 -2.47 -3.10 -1.36 -4.49 -9.40 -17.14 Gross Profit 1.23 1.19 1.44 1.92 3.18 4.64 6.11 7.39 8.40 10.04 12.49 16.20 5.77 21.32 47.13 89.75 Operating Expenses -1.48 -1.15 -1.19 -2.66 -2.81 -3.59 -4.67 -5.08 -5.56 -6.04 -6.47 -6.87 -6.48 -16.15 -24.94 -42.55 Sales & Mktg. expenses -0.68 -0.35 -0.30 -1.23 -1.22 -1.33 -1.85 -2.02 -2.34 -2.54 -2.84 -3.09 -2.56 -6.42 -10.81 -19.92 G&A expenses -0.76 -0.66 -0.77 -0.90 -0.87 -1.25 -1.16 -1.32 -1.42 -1.57 -1.65 -1.74 -2.12 -4.60 -6.38 -11.29 R&D expenses -0.05 -0.14 -0.12 -0.31 -0.32 -0.42 -0.58 -0.66 -0.71 -0.85 -0.90 -0.96 -0.61 -1.97 -3.42 -7.02 Other expenses 0.00 0.00 0.00 0.00 0.00 0.00 0.00 0.00 0.00 0.00 0.00 0.00 0.00 0.00 0.00 0.00 Share-based comp. expense (123R) 0.44 0.23 0.30 -0.23 -0.39 -0.60 -1.08 -1.08 -1.08 -1.08 -1.08 -1.08 -1.19 -3.15 -4.32 -4.32 EBITDA 0.23 0.31 0.62 -0.30 0.94 1.87 2.78 3.69 4.27 5.51 7.62 11.01 0.84 9.28 28.40 55.21 EBIT -0.25 0.04 0.25 -0.74 0.37 1.05 1.44 2.31 2.84 4.00 6.02 9.33 -0.70 5.17 22.20 47.20 Adj. EBIT (ex-123R expense) 0.19 0.26 0.54 -0.52 0.77 1.65 2.52 3.39 3.93 5.08 7.10 10.41 0.48 8.32 26.52 51.52 Net Interest Income 0.26 0.26 0.27 0.21 0.25 0.25 0.24 0.32 0.37 0.39 0.44 0.50 1.00 1.07 1.69 2.92 Net Other Income 0.09 0.15 0.06 -1.24 0.06 0.11 0.04 0.00 0.00 0.00 0.00 0.00 -0.94 0.21 0.00 0.00 Pre Tax Profit 0.11 0.45 0.58 -1.77 0.69 1.41 1.73 2.63 3.21 4.39 6.46 9.84 -0.64 6.45 23.89 50.12 Tax Expense/(Credit) 0.01 0.01 0.02 -0.08 -0.09 -0.15 -0.18 0.00 0.43 0.55 0.75 1.09 -0.04 -0.41 2.82 8.17 Net Profit (GAAP Reported) 0.10 0.44 0.56 -1.70 0.78 1.56 1.90 2.63 2.77 3.83 5.69 8.73 -0.60 6.86 21.03 41.91 Adj. Net Profit (ex-123R exp.) 0.54 0.67 0.85 -0.15 1.17 2.16 2.98 3.71 3.85 4.91 6.77 9.81 0.59 10.02 25.35 46.23 Pre Tax EPS (US$) 0.01 0.02 0.03 -0.09 0.04 0.07 0.09 0.14 0.17 0.23 0.34 0.52 -0.03 0.34 1.26 2.62 EPS (US$) 0.01 0.02 0.03 -0.09 0.04 0.08 0.10 0.14 0.15 0.20 0.30 0.46 -0.03 0.36 1.11 2.19 Diluted EPS (Reported, US$) 0.00 0.02 0.03 -0.08 0.04 0.08 0.08 0.11 0.12 0.17 0.25 0.38 -0.03 0.32 0.92 1.82 Adj. Diluted EPS (ex-123R exp., US$)
0.03 0.03 0.04 -0.01 0.06 0.11 0.13 0.16 0.17 0.22 0.30 0.43 0.03 0.46 1.11 2.01
Margins (%) Gross Margin 87.6 80.9 82.8 76.1 79.6 81.1 83.7 84.0 82.6 83.0 83.5 84.0 81.0 82.6 83.4 84.0 Operating Margin (ex-123R exp.) 13.5 18.0 31.3 -20.5 19.2 28.8 34.5 38.5 38.6 42.0 47.5 54.0 6.7 32.2 46.9 48.2 EBITDA Margin 16.7 21.3 35.5 -11.8 23.5 32.6 38.0 42.0 41.9 45.5 50.9 57.1 11.8 36.0 50.2 51.7 Net Margin 6.9 30.1 32.1 -67.2 19.4 27.3 26.0 29.9 27.2 31.7 38.0 45.3 -8.4 26.6 37.2 39.2 Adj. Net Margin (ex-123R exp.) 38.1 45.5 49.2 -5.9 29.2 37.7 40.8 42.2 37.9 40.6 45.3 50.9 8.2 38.8 44.8 43.2 Sequential Growth (%) Revenue -26.1 4.3 18.1 45.5 58.4 43.2 27.6 20.4 15.8 18.8 23.7 29.0 -4.7 262.1 119.0 89.1 Gross Profit -29.8 -3.7 20.9 33.7 65.7 46.1 31.6 20.9 13.8 19.5 24.4 29.8 -17.6 269.4 121.1 90.4 Adj. EBIT (ex-123R exp.) -73.7 38.9 105.7 -195.0 -248.6 115.0 52.9 34.3 15.9 29.4 39.8 46.6 -85.1 1,630.6 218.6 94.3 Pre Tax Profit -90.6 315.7 28.1 -408.3 -138.9 104.6 22.2 52.1 22.3 36.6 47.2 52.3 nm nm 270.2 109.8 Adj. Net Profit (ex-123R exp.) -49.7 24.4 27.9 n.m. n.m. 84.8 38.2 24.3 4.0 27.4 37.9 44.9 -87.3 1,612.3 153.1 82.3 Adj. Diluted EPS (ex-123R exp.) -50.5 21.7 31.2 n.m. n.m. 85.1 25.0 22.2 4.6 27.2 37.7 44.6 -87.1 1,529.3 138.9 81.1 Source: Company, JPMorgan estimates. Note: We have included 123R share-based compensation adjustments starting 2006.

275
North America Equity Research 02 January 2008
Imran Khan (1-212) 622-6693 [email protected]
Table 179: JRJC Annual Balance Sheet US$ in millions, year-end December FY06 FY07E FY08E FY09E Cash & Cash Equivalents 45.0 66.8 108.4 163.9 Accounts Receivable 0.5 1.7 3.8 5.5 Inventory - - - - Total Other Current Assets 1.1 2.9 6.0 11.3 Total Current Assets 46.5 71.4 118.2 180.8 Gross Fixed Assets 2.3 5.4 12.2 25.1 Accumulated Depreciation (0.6) (1.3) (2.9) (6.3) Net Fixed Assets 1.7 4.2 9.4 18.8 Other Long Term Assets 10.3 13.6 13.6 13.6 Long Term Investments and Associates 12.6 12.6 12.6 12.6 Total Long Term Assets 24.6 30.4 35.6 45.0 Total Assets 71.1 101.9 153.8 225.8 ST Debt and Current Portion of LT Debt - - - - Accounts Payable (Accrued expenses, etc.) 2.1 3.8 8.4 11.2 Other Current Liabilities 6.4 17.6 30.9 44.9 Total Current Liabilities 8.5 21.4 39.3 56.1 Long Term Debt - - - - Other Long Term Liabilities 0.1 2.1 1.5 1.0 Total Long Term Liabilities 0.1 2.1 1.5 1.0 Share Capital 0.0 0.0 0.0 0.0 Share Premium 52.6 59.7 73.4 87.1 Other Reserves 1.6 3.5 3.5 3.5 Retained Earnings 8.2 15.1 36.1 78.0 Preferred Stock - - - - Total Equity 62.5 78.3 113.0 168.6 Total Liabilities and Equity 71.1 101.9 153.8 225.8 Source: Company reports, JPMorgan estimates.
Table 180: JRJC Annual Cash Flow Statement US$ in millions, year-end December FY06 FY07E FY08E FY09E Net Income (0.6) 6.9 21.0 41.9 Non cash Expenses/(income) - - - - Depreciation and Amortization 0.4 1.0 1.9 3.7 Extraordinaries - - 0.0 0.0 Other Non-Cash Items 1.2 3.2 4.3 4.3 Changes in Working Capital: (Increase)/Decrease Receivables (0.3) (1.3) (2.1) (1.7) (Increase)/Decrease Inventories - - - - (Increase)/Decrease Other Current Assets 0.1 (1.8) (3.1) (5.3) Increase/(Decrease) Payables 1.7 1.8 4.6 2.8 Increase/(Decrease) Other Current Liabilities 4.5 11.2 13.3 14.0 Net Cash from Operations 6.9 20.8 40.0 59.7 Purchase of Property, Plant & Equipment (1.4) (3.1) (6.8) (12.8) Purchase/Sale of Other LT assets (10.3) (3.6) (0.3) (0.3) Purchase/Sale of Investments 2.4 (0.0) - - Net Cash from Investing Activities (9.3) (6.8) (7.1) (13.1) Issuance/Repayment of Debt - - - - Change in other LT liabilities 0.1 2.0 (0.6) (0.4) Change in Common Equity - net 1.0 5.8 9.4 9.4 Payment of Cash Dividends - - - - Other Financing Charges, Net 0.0 (0.0) (0.0) (0.0) Net Cash from Financing Activities 1.2 7.8 8.7 8.9 Net Effect of Exchange Rate Changes - - - - Net Change in Cash and Cash Equivalents (1.2) 21.8 41.6 55.5 Cash & CE at End of Period 45.0 66.8 108.4 163.9 Source: Company reports, JPMorgan estimates.

276
North America Equity Research 02 January 2008
Imran Khan (1-212) 622-6693 [email protected]
NetEase, Neutral ($19.33) We maintain our Neutral rating on NetEase. Although the stock’s valuation is relatively low, we believe NetEase still lacks revenue drivers in the near to medium term, or the next big game to drive earnings growth. While WWJ3 has commercialized, and the results are respectable, we believe investors will wait for the next games: we expect TianXia 2 and Datang free-model to launch in 2Q08. However, we believe investors will not get excited easily (or pay high valuation), given limited success in the first versions of Datang and TianXia2.
• NetEase remains in a period of transition in its online games business, in our view. While we expect its online game revenue to register ~7% growth in 4Q07 (with WWJ3 to offset the decline in WWJ2), NetEase currently lacks a successful new game for sustainable growth. TianXia2 launch in 1Q08 is closed-beta, with commercialization at the very earliest in mid-2Q08. Datang’s item-based model launch is also delayed to around mid-08.
• In respect of Fantasy WWJ (still the flagship game), we expect the game to see flattish growth in 4Q07, due to seasonally flat Q4. We expect FWJ to peak out in 3Q08; and to observe a single-digit quarterly decline going forward.
• Despite the near-term transition, we remain positive on NetEase in the long run. As a leading online game developer in China, with proven game operating capability, we believe the company is well positioned to capture growth in China’s online games industry in the long run. In addition, NetEase has the largest free email user base in China. We believe NetEase can leverage this user base and its portal traffic to monetize through online advertising and search services.
• The share price drivers over the next six months include: (1) news on WWJ3 progress, (2) FWJ anniversary activities in Jan, and (3) TianXia2 closed beta in 1Q08. Upside risks include: upside from future licensed games or existing games, better-than-expected advertising growth. Downside risks include: future delay in game launches, unsuccessful new licensed games.
• For 4Q07, we estimate net revenue of US$78.0M, up 7% Q/Q and up 17% Y/Y, and GAAP diluted EPS of US$0.30, up 12% Q/Q as well as Y/Y. For online games, we expect net revenue of US$64.6M, up 7% Q/Q and 15% Y/Y, with flattish growth for FWJ and WWJ3 offsetting the decline in WWJ2.
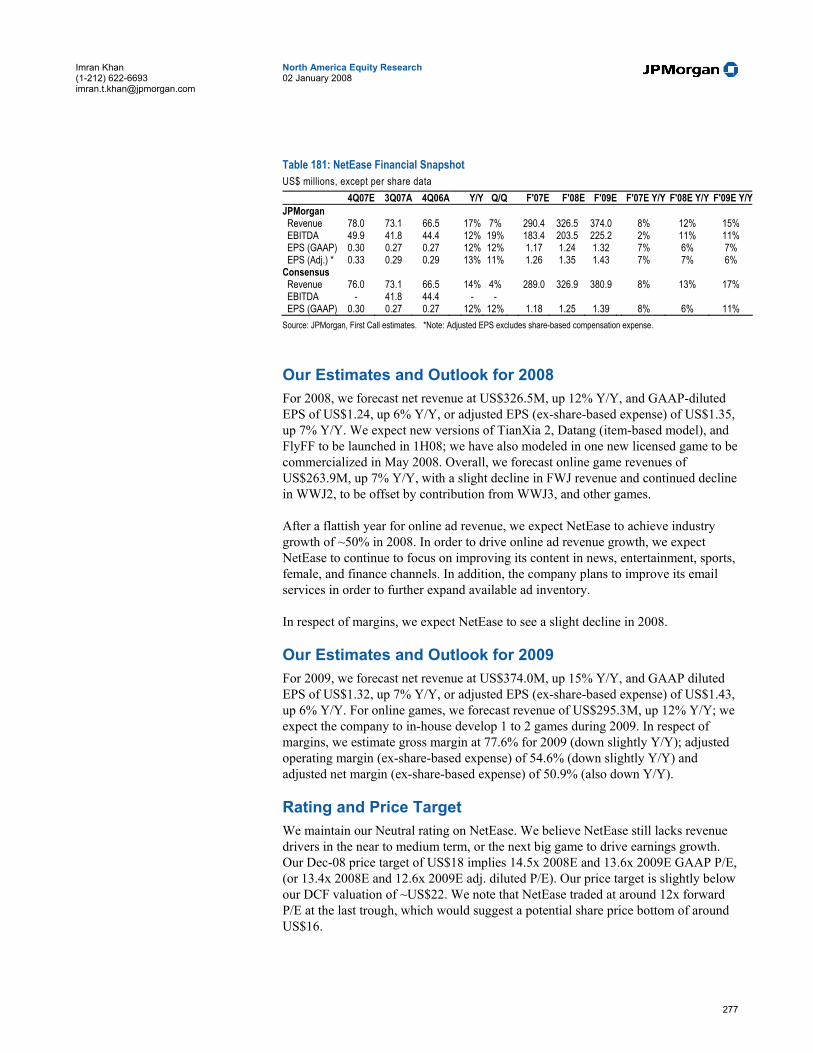
277
North America Equity Research 02 January 2008
Imran Khan (1-212) 622-6693 [email protected]
Table 181: NetEase Financial Snapshot US$ millions, except per share data 4Q07E 3Q07A 4Q06A Y/Y Q/Q F'07E F'08E F'09E F'07E Y/Y F'08E Y/Y F'09E Y/YJPMorgan Revenue 78.0 73.1 66.5 17% 7% 290.4 326.5 374.0 8% 12% 15% EBITDA 49.9 41.8 44.4 12% 19% 183.4 203.5 225.2 2% 11% 11% EPS (GAAP) 0.30 0.27 0.27 12% 12% 1.17 1.24 1.32 7% 6% 7% EPS (Adj.) * 0.33 0.29 0.29 13% 11% 1.26 1.35 1.43 7% 7% 6% Consensus Revenue 76.0 73.1 66.5 14% 4% 289.0 326.9 380.9 8% 13% 17% EBITDA - 41.8 44.4 - - EPS (GAAP) 0.30 0.27 0.27 12% 12% 1.18 1.25 1.39 8% 6% 11% Source: JPMorgan, First Call estimates. *Note: Adjusted EPS excludes share-based compensation expense.
Our Estimates and Outlook for 2008 For 2008, we forecast net revenue at US$326.5M, up 12% Y/Y, and GAAP-diluted EPS of US$1.24, up 6% Y/Y, or adjusted EPS (ex-share-based expense) of US$1.35, up 7% Y/Y. We expect new versions of TianXia 2, Datang (item-based model), and FlyFF to be launched in 1H08; we have also modeled in one new licensed game to be commercialized in May 2008. Overall, we forecast online game revenues of US$263.9M, up 7% Y/Y, with a slight decline in FWJ revenue and continued decline in WWJ2, to be offset by contribution from WWJ3, and other games.
After a flattish year for online ad revenue, we expect NetEase to achieve industry growth of ~50% in 2008. In order to drive online ad revenue growth, we expect NetEase to continue to focus on improving its content in news, entertainment, sports, female, and finance channels. In addition, the company plans to improve its email services in order to further expand available ad inventory.
In respect of margins, we expect NetEase to see a slight decline in 2008.
Our Estimates and Outlook for 2009 For 2009, we forecast net revenue at US$374.0M, up 15% Y/Y, and GAAP diluted EPS of US$1.32, up 7% Y/Y, or adjusted EPS (ex-share-based expense) of US$1.43, up 6% Y/Y. For online games, we forecast revenue of US$295.3M, up 12% Y/Y; we expect the company to in-house develop 1 to 2 games during 2009. In respect of margins, we estimate gross margin at 77.6% for 2009 (down slightly Y/Y); adjusted operating margin (ex-share-based expense) of 54.6% (down slightly Y/Y) and adjusted net margin (ex-share-based expense) of 50.9% (also down Y/Y).
Rating and Price Target We maintain our Neutral rating on NetEase. We believe NetEase still lacks revenue drivers in the near to medium term, or the next big game to drive earnings growth. Our Dec-08 price target of US$18 implies 14.5x 2008E and 13.6x 2009E GAAP P/E, (or 13.4x 2008E and 12.6x 2009E adj. diluted P/E). Our price target is slightly below our DCF valuation of ~US$22. We note that NetEase traded at around 12x forward P/E at the last trough, which would suggest a potential share price bottom of around US$16.

278
North America Equity Research 02 January 2008
Imran Khan (1-212) 622-6693 [email protected]
Risks to Our Rating and Price Target Downside risks to our rating and price target include: intense competition resulting in negative industry environment, hacking or pirated server issues limiting user growth, delays in game launches, and significant increase in R&D expenses. Upside risks include: better-than-expected acceptance of its new games, extended life cycle of existing games on the back of new upgrade packs, and upside in online advertising.
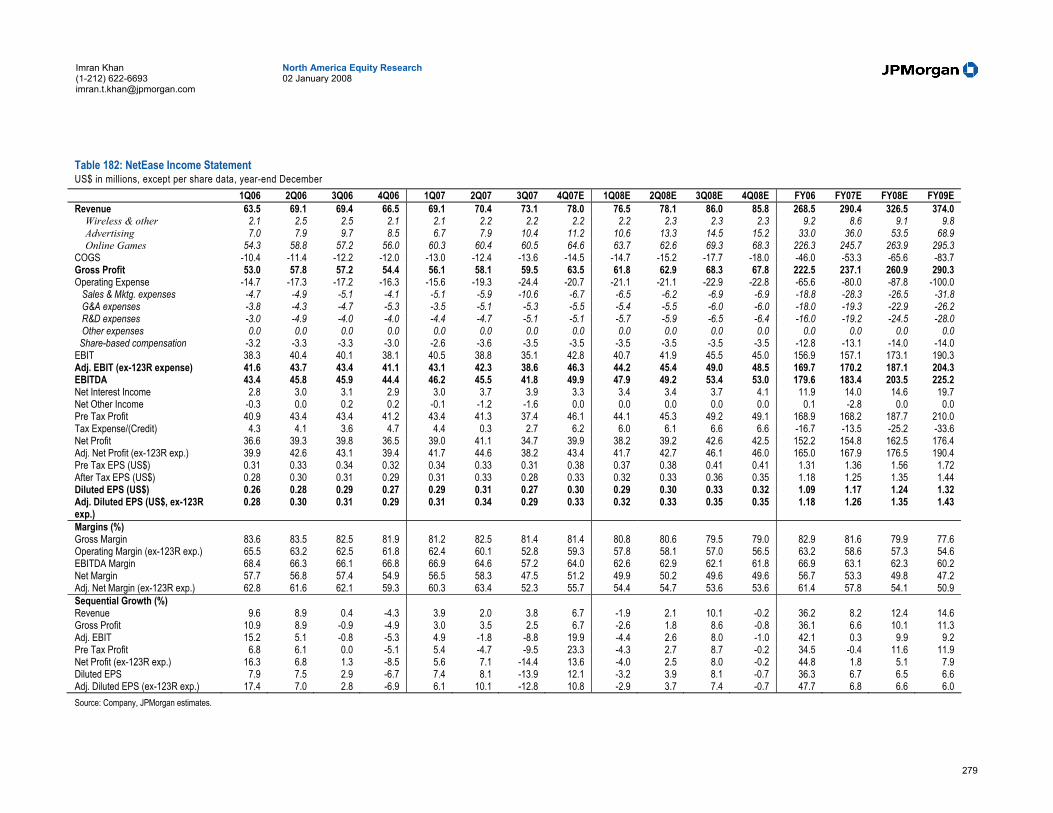
279
North America Equity Research 02 January 2008
Imran Khan (1-212) 622-6693 [email protected]
Table 182: NetEase Income Statement US$ in millions, except per share data, year-end December
1Q06 2Q06 3Q06 4Q06 1Q07 2Q07 3Q07 4Q07E 1Q08E 2Q08E 3Q08E 4Q08E FY06 FY07E FY08E FY09E Revenue 63.5 69.1 69.4 66.5 69.1 70.4 73.1 78.0 76.5 78.1 86.0 85.8 268.5 290.4 326.5 374.0 Wireless & other 2.1 2.5 2.5 2.1 2.1 2.2 2.2 2.2 2.2 2.3 2.3 2.3 9.2 8.6 9.1 9.8 Advertising 7.0 7.9 9.7 8.5 6.7 7.9 10.4 11.2 10.6 13.3 14.5 15.2 33.0 36.0 53.5 68.9 Online Games 54.3 58.8 57.2 56.0 60.3 60.4 60.5 64.6 63.7 62.6 69.3 68.3 226.3 245.7 263.9 295.3 COGS -10.4 -11.4 -12.2 -12.0 -13.0 -12.4 -13.6 -14.5 -14.7 -15.2 -17.7 -18.0 -46.0 -53.3 -65.6 -83.7 Gross Profit 53.0 57.8 57.2 54.4 56.1 58.1 59.5 63.5 61.8 62.9 68.3 67.8 222.5 237.1 260.9 290.3 Operating Expense -14.7 -17.3 -17.2 -16.3 -15.6 -19.3 -24.4 -20.7 -21.1 -21.1 -22.9 -22.8 -65.6 -80.0 -87.8 -100.0 Sales & Mktg. expenses -4.7 -4.9 -5.1 -4.1 -5.1 -5.9 -10.6 -6.7 -6.5 -6.2 -6.9 -6.9 -18.8 -28.3 -26.5 -31.8 G&A expenses -3.8 -4.3 -4.7 -5.3 -3.5 -5.1 -5.3 -5.5 -5.4 -5.5 -6.0 -6.0 -18.0 -19.3 -22.9 -26.2 R&D expenses -3.0 -4.9 -4.0 -4.0 -4.4 -4.7 -5.1 -5.1 -5.7 -5.9 -6.5 -6.4 -16.0 -19.2 -24.5 -28.0 Other expenses 0.0 0.0 0.0 0.0 0.0 0.0 0.0 0.0 0.0 0.0 0.0 0.0 0.0 0.0 0.0 0.0 Share-based compensation -3.2 -3.3 -3.3 -3.0 -2.6 -3.6 -3.5 -3.5 -3.5 -3.5 -3.5 -3.5 -12.8 -13.1 -14.0 -14.0 EBIT 38.3 40.4 40.1 38.1 40.5 38.8 35.1 42.8 40.7 41.9 45.5 45.0 156.9 157.1 173.1 190.3 Adj. EBIT (ex-123R expense) 41.6 43.7 43.4 41.1 43.1 42.3 38.6 46.3 44.2 45.4 49.0 48.5 169.7 170.2 187.1 204.3 EBITDA 43.4 45.8 45.9 44.4 46.2 45.5 41.8 49.9 47.9 49.2 53.4 53.0 179.6 183.4 203.5 225.2 Net Interest Income 2.8 3.0 3.1 2.9 3.0 3.7 3.9 3.3 3.4 3.4 3.7 4.1 11.9 14.0 14.6 19.7 Net Other Income -0.3 0.0 0.2 0.2 -0.1 -1.2 -1.6 0.0 0.0 0.0 0.0 0.0 0.1 -2.8 0.0 0.0 Pre Tax Profit 40.9 43.4 43.4 41.2 43.4 41.3 37.4 46.1 44.1 45.3 49.2 49.1 168.9 168.2 187.7 210.0 Tax Expense/(Credit) 4.3 4.1 3.6 4.7 4.4 0.3 2.7 6.2 6.0 6.1 6.6 6.6 -16.7 -13.5 -25.2 -33.6 Net Profit 36.6 39.3 39.8 36.5 39.0 41.1 34.7 39.9 38.2 39.2 42.6 42.5 152.2 154.8 162.5 176.4 Adj. Net Profit (ex-123R exp.) 39.9 42.6 43.1 39.4 41.7 44.6 38.2 43.4 41.7 42.7 46.1 46.0 165.0 167.9 176.5 190.4 Pre Tax EPS (US$) 0.31 0.33 0.34 0.32 0.34 0.33 0.31 0.38 0.37 0.38 0.41 0.41 1.31 1.36 1.56 1.72 After Tax EPS (US$) 0.28 0.30 0.31 0.29 0.31 0.33 0.28 0.33 0.32 0.33 0.36 0.35 1.18 1.25 1.35 1.44 Diluted EPS (US$) 0.26 0.28 0.29 0.27 0.29 0.31 0.27 0.30 0.29 0.30 0.33 0.32 1.09 1.17 1.24 1.32 Adj. Diluted EPS (US$, ex-123R exp.)
0.28 0.30 0.31 0.29 0.31 0.34 0.29 0.33 0.32 0.33 0.35 0.35 1.18 1.26 1.35 1.43
Margins (%) Gross Margin 83.6 83.5 82.5 81.9 81.2 82.5 81.4 81.4 80.8 80.6 79.5 79.0 82.9 81.6 79.9 77.6 Operating Margin (ex-123R exp.) 65.5 63.2 62.5 61.8 62.4 60.1 52.8 59.3 57.8 58.1 57.0 56.5 63.2 58.6 57.3 54.6 EBITDA Margin 68.4 66.3 66.1 66.8 66.9 64.6 57.2 64.0 62.6 62.9 62.1 61.8 66.9 63.1 62.3 60.2 Net Margin 57.7 56.8 57.4 54.9 56.5 58.3 47.5 51.2 49.9 50.2 49.6 49.6 56.7 53.3 49.8 47.2 Adj. Net Margin (ex-123R exp.) 62.8 61.6 62.1 59.3 60.3 63.4 52.3 55.7 54.4 54.7 53.6 53.6 61.4 57.8 54.1 50.9 Sequential Growth (%) Revenue 9.6 8.9 0.4 -4.3 3.9 2.0 3.8 6.7 -1.9 2.1 10.1 -0.2 36.2 8.2 12.4 14.6 Gross Profit 10.9 8.9 -0.9 -4.9 3.0 3.5 2.5 6.7 -2.6 1.8 8.6 -0.8 36.1 6.6 10.1 11.3 Adj. EBIT 15.2 5.1 -0.8 -5.3 4.9 -1.8 -8.8 19.9 -4.4 2.6 8.0 -1.0 42.1 0.3 9.9 9.2 Pre Tax Profit 6.8 6.1 0.0 -5.1 5.4 -4.7 -9.5 23.3 -4.3 2.7 8.7 -0.2 34.5 -0.4 11.6 11.9 Net Profit (ex-123R exp.) 16.3 6.8 1.3 -8.5 5.6 7.1 -14.4 13.6 -4.0 2.5 8.0 -0.2 44.8 1.8 5.1 7.9 Diluted EPS 7.9 7.5 2.9 -6.7 7.4 8.1 -13.9 12.1 -3.2 3.9 8.1 -0.7 36.3 6.7 6.5 6.6 Adj. Diluted EPS (ex-123R exp.) 17.4 7.0 2.8 -6.9 6.1 10.1 -12.8 10.8 -2.9 3.7 7.4 -0.7 47.7 6.8 6.6 6.0 Source: Company, JPMorgan estimates.
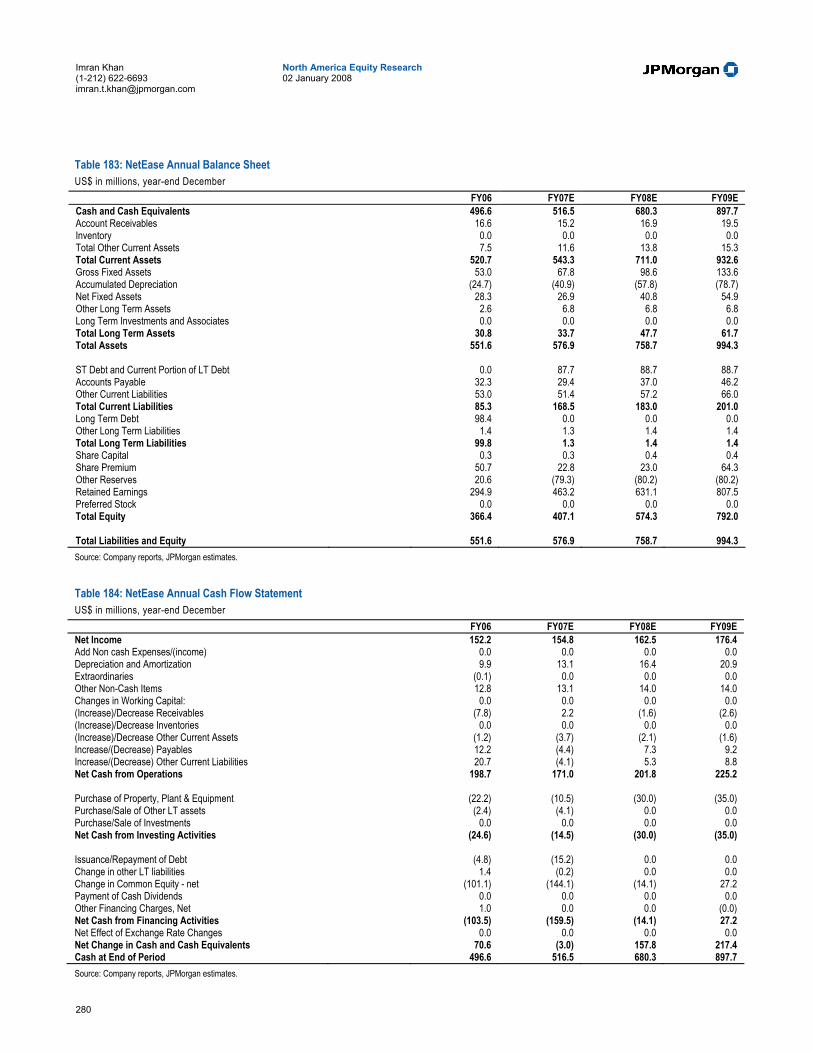
280
North America Equity Research 02 January 2008
Imran Khan (1-212) 622-6693 [email protected]
Table 183: NetEase Annual Balance Sheet US$ in millions, year-end December FY06 FY07E FY08E FY09E Cash and Cash Equivalents 496.6 516.5 680.3 897.7 Account Receivables 16.6 15.2 16.9 19.5 Inventory 0.0 0.0 0.0 0.0 Total Other Current Assets 7.5 11.6 13.8 15.3 Total Current Assets 520.7 543.3 711.0 932.6 Gross Fixed Assets 53.0 67.8 98.6 133.6 Accumulated Depreciation (24.7) (40.9) (57.8) (78.7) Net Fixed Assets 28.3 26.9 40.8 54.9 Other Long Term Assets 2.6 6.8 6.8 6.8 Long Term Investments and Associates 0.0 0.0 0.0 0.0 Total Long Term Assets 30.8 33.7 47.7 61.7 Total Assets 551.6 576.9 758.7 994.3 ST Debt and Current Portion of LT Debt 0.0 87.7 88.7 88.7 Accounts Payable 32.3 29.4 37.0 46.2 Other Current Liabilities 53.0 51.4 57.2 66.0 Total Current Liabilities 85.3 168.5 183.0 201.0 Long Term Debt 98.4 0.0 0.0 0.0 Other Long Term Liabilities 1.4 1.3 1.4 1.4 Total Long Term Liabilities 99.8 1.3 1.4 1.4 Share Capital 0.3 0.3 0.4 0.4 Share Premium 50.7 22.8 23.0 64.3 Other Reserves 20.6 (79.3) (80.2) (80.2) Retained Earnings 294.9 463.2 631.1 807.5 Preferred Stock 0.0 0.0 0.0 0.0 Total Equity 366.4 407.1 574.3 792.0 Total Liabilities and Equity 551.6 576.9 758.7 994.3 Source: Company reports, JPMorgan estimates.
Table 184: NetEase Annual Cash Flow Statement US$ in millions, year-end December FY06 FY07E FY08E FY09E Net Income 152.2 154.8 162.5 176.4 Add Non cash Expenses/(income) 0.0 0.0 0.0 0.0 Depreciation and Amortization 9.9 13.1 16.4 20.9 Extraordinaries (0.1) 0.0 0.0 0.0 Other Non-Cash Items 12.8 13.1 14.0 14.0 Changes in Working Capital: 0.0 0.0 0.0 0.0 (Increase)/Decrease Receivables (7.8) 2.2 (1.6) (2.6) (Increase)/Decrease Inventories 0.0 0.0 0.0 0.0 (Increase)/Decrease Other Current Assets (1.2) (3.7) (2.1) (1.6) Increase/(Decrease) Payables 12.2 (4.4) 7.3 9.2 Increase/(Decrease) Other Current Liabilities 20.7 (4.1) 5.3 8.8 Net Cash from Operations 198.7 171.0 201.8 225.2 Purchase of Property, Plant & Equipment (22.2) (10.5) (30.0) (35.0) Purchase/Sale of Other LT assets (2.4) (4.1) 0.0 0.0 Purchase/Sale of Investments 0.0 0.0 0.0 0.0 Net Cash from Investing Activities (24.6) (14.5) (30.0) (35.0) Issuance/Repayment of Debt (4.8) (15.2) 0.0 0.0 Change in other LT liabilities 1.4 (0.2) 0.0 0.0 Change in Common Equity - net (101.1) (144.1) (14.1) 27.2 Payment of Cash Dividends 0.0 0.0 0.0 0.0 Other Financing Charges, Net 1.0 0.0 0.0 (0.0) Net Cash from Financing Activities (103.5) (159.5) (14.1) 27.2 Net Effect of Exchange Rate Changes 0.0 0.0 0.0 0.0 Net Change in Cash and Cash Equivalents 70.6 (3.0) 157.8 217.4 Cash at End of Period 496.6 516.5 680.3 897.7 Source: Company reports, JPMorgan estimates.
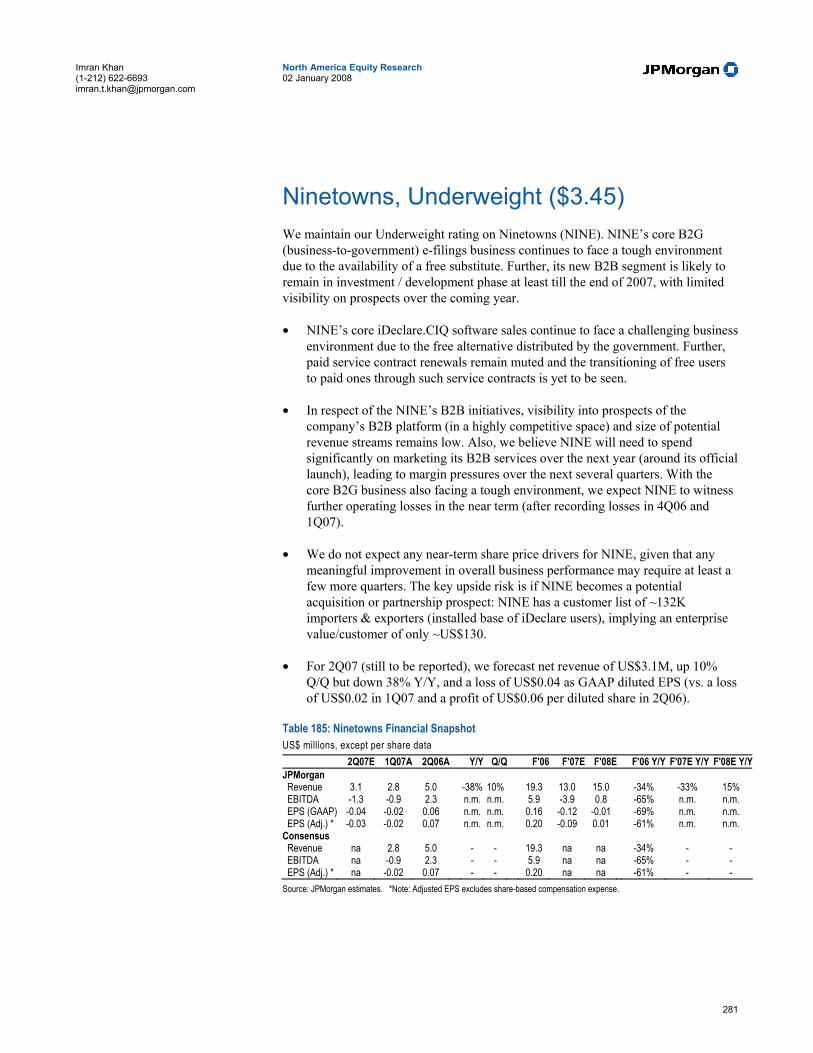
281
North America Equity Research 02 January 2008
Imran Khan (1-212) 622-6693 [email protected]
Ninetowns, Underweight ($3.45) We maintain our Underweight rating on Ninetowns (NINE). NINE’s core B2G (business-to-government) e-filings business continues to face a tough environment due to the availability of a free substitute. Further, its new B2B segment is likely to remain in investment / development phase at least till the end of 2007, with limited visibility on prospects over the coming year.
• NINE’s core iDeclare.CIQ software sales continue to face a challenging business environment due to the free alternative distributed by the government. Further, paid service contract renewals remain muted and the transitioning of free users to paid ones through such service contracts is yet to be seen.
• In respect of the NINE’s B2B initiatives, visibility into prospects of the company’s B2B platform (in a highly competitive space) and size of potential revenue streams remains low. Also, we believe NINE will need to spend significantly on marketing its B2B services over the next year (around its official launch), leading to margin pressures over the next several quarters. With the core B2G business also facing a tough environment, we expect NINE to witness further operating losses in the near term (after recording losses in 4Q06 and 1Q07).
• We do not expect any near-term share price drivers for NINE, given that any meaningful improvement in overall business performance may require at least a few more quarters. The key upside risk is if NINE becomes a potential acquisition or partnership prospect: NINE has a customer list of ~132K importers & exporters (installed base of iDeclare users), implying an enterprise value/customer of only ~US$130.
• For 2Q07 (still to be reported), we forecast net revenue of US$3.1M, up 10% Q/Q but down 38% Y/Y, and a loss of US$0.04 as GAAP diluted EPS (vs. a loss of US$0.02 in 1Q07 and a profit of US$0.06 per diluted share in 2Q06).
Table 185: Ninetowns Financial Snapshot US$ millions, except per share data 2Q07E 1Q07A 2Q06A Y/Y Q/Q F'06 F'07E F'08E F'06 Y/Y F'07E Y/Y F'08E Y/YJPMorgan Revenue 3.1 2.8 5.0 -38% 10% 19.3 13.0 15.0 -34% -33% 15% EBITDA -1.3 -0.9 2.3 n.m. n.m. 5.9 -3.9 0.8 -65% n.m. n.m. EPS (GAAP) -0.04 -0.02 0.06 n.m. n.m. 0.16 -0.12 -0.01 -69% n.m. n.m. EPS (Adj.) * -0.03 -0.02 0.07 n.m. n.m. 0.20 -0.09 0.01 -61% n.m. n.m. Consensus Revenue na 2.8 5.0 - - 19.3 na na -34% - - EBITDA na -0.9 2.3 - - 5.9 na na -65% - - EPS (Adj.) * na -0.02 0.07 - - 0.20 na na -61% - - Source: JPMorgan estimates. *Note: Adjusted EPS excludes share-based compensation expense.

282
North America Equity Research 02 January 2008
Imran Khan (1-212) 622-6693 [email protected]
Our Estimates and Outlook for 2008 For 2008, we forecast net revenues of US$15.0M, up 15% Y/Y, and a GAAP loss of US$0.01 per share (vs. GAAP loss of US$0.12 per share for 2007), or adjusted EPS (ex-share-based expense) of US$0.01 (vs. GAAP loss of US$0.09 per share for 2007). In respect of margins, we forecast gross margin at 87.5% for 2008, down slightly from 89.0% for 2007; adjusted operating loss margin (ex-share-based expense) of 10.5% (operating loss) for 2008, narrowing from operating loss margin of 44.3% for 2007, and adjusted net margin (ex-share-based expense) of 3.0% for 2008, vs. net loss margin of 25.3% for 2007.
Our top-line estimate calls for 7% Y/Y increase in enterprise software revenue (74% of total revenues in 2008E) and 26% Y/Y increase in software development service revenue (22% of total revenues). We also forecast the B2B business to begin contributing to revenues, although very modestly (4% of total revenues). We believe the potential for upside surprise in company performance would be dependent on NINE’s success in its B2B initiatives and the company's execution on paid service contracts (new and renewal contracts) in the B2G segment.
Rating and Price Target We maintain our Underweight rating on NINE, given: (1) NINE’s core iDeclare.CIQ software sales remain challenged due to availability of a free alternative (from the government); (2) Paid service contract renewals remain muted and the transitioning of free software users to paid ones through such service contracts is yet to be seen; (3) Visibility on the prospects of NINE's B2B platform remains low; (4) NINE will incur significant operating expenses on its B2B services (marketing, etc.) leading to margin pressures over the next several quarters.
Our DCF-based Dec-07 price target is US$3.2, which implies 251x on our 2008E adjusted EPS. (The implied EV at our target price is ~US$26M)
Overall, we believe a turnaround for the company is still at least a few quarters away, and the share price performance is likely to remain weak in the interim. (We also expect the total cash balance to be down to ~US$2.5 per share at end-4Q07, compared to US$3.3 per share as of 1Q07).
Risks to Our Rating and Price Target Upside risks to our rating and price target include: 1) Possibility of NINE becoming a target for acquisition or strategic partnership (with current EV/customer of only ~US$130); 2) Earlier-than-expected progress on business transition to B2B; 3) Significant conversions from free e-filing software to NINE’s paid software / service contracts. Downside risks to our estimates include: 1) Accelerated decline in existing core revenue base; 2) Larger-than-expected investments in the new B2B business; 3) Disruption in the working relationship between the PRC Inspections Administration and the company.

283
North America Equity Research 02 January 2008
Imran Khan (1-212) 622-6693 [email protected]
Table 186: Ninetowns Income Statement US$ in millions, except per share data, year-end December
1Q06 2Q06 3Q06 4Q06 1Q07 2Q07E 3Q07E 4Q07E 1Q08E 2Q08E 3Q08E 4Q08E FY05 FY06 FY07E FY08E Revenue 6.1 5.0 3.7 4.5 2.8 3.1 3.5 3.6 3.7 3.7 3.8 3.8 29.3 19.3 13.0 15.0 Enterprise software 5.0 4.0 3.2 2.5 2.4 2.6 2.7 2.7 2.7 2.7 2.8 2.8 24.9 14.7 10.3 11.0 Software development service 1.1 1.0 0.5 2.0 0.5 0.5 0.8 0.8 0.8 0.8 0.8 0.8 4.4 4.6 2.7 3.4 Other 0.0 0.0 0.0 0.0 0.0 0.0 0.0 0.0 0.1 0.1 0.1 0.2 0.1 0.0 0.0 0.6 COGS -0.3 -0.4 -0.2 -1.3 -0.3 -0.3 -0.4 -0.4 -0.5 -0.5 -0.5 -0.5 -2.3 -2.1 -1.4 -1.9 Gross profit 5.8 4.6 3.5 3.2 2.5 2.8 3.1 3.2 3.2 3.3 3.3 3.3 27.0 17.2 11.6 13.1 Operating expense -3.3 -2.9 -2.8 -4.7 -4.0 -4.8 -4.8 -4.6 -4.2 -3.9 -3.7 -3.7 -10.6 -13.7 -18.1 -15.5 Sales & mktg. expenses -0.9 -0.3 -0.2 -0.3 -1.0 -1.5 -1.8 -1.8 -1.5 -1.2 -1.1 -1.0 -3.2 -1.7 -6.0 -4.7 G&A expenses -1.9 -1.9 -1.7 -2.7 -2.1 -2.4 -2.1 -2.0 -2.0 -2.0 -1.9 -1.9 -6.0 -8.3 -8.6 -7.8 R&D expenses -0.6 -0.6 -0.9 -1.7 -1.0 -1.0 -0.9 -0.8 -0.7 -0.7 -0.8 -0.8 -1.4 -3.8 -3.6 -3.0 Other expenses 0.0 0.0 0.1 0.0 0.0 0.0 0.0 0.0 0.0 0.0 0.0 0.0 -0.1 1.4 0.8 0.8 Share-based compensation -0.5 -0.3 -0.3 -0.3 -0.2 -0.2 -0.2 -0.2 -0.2 -0.2 -0.2 -0.2 0.0 -1.3 -0.8 -0.8 EBIT 2.4 1.8 0.8 -1.5 -1.5 -2.0 -1.7 -1.4 -1.0 -0.6 -0.4 -0.3 16.4 3.5 -6.6 -2.4 Adj. EBIT (ex-123R expense) 2.9 2.0 1.1 -1.3 -1.3 -1.8 -1.5 -1.2 -0.8 -0.4 -0.2 -0.1 16.4 4.8 -5.8 -1.6 EBITDA 3.1 2.3 1.4 -1.0 -0.9 -1.3 -1.0 -0.7 -0.2 0.1 0.4 0.5 17.1 5.9 -3.9 0.8 Net interest income 0.6 0.6 0.6 0.7 0.6 0.7 0.5 0.4 0.5 0.5 0.5 0.5 2.2 2.4 2.3 2.0 Net other income 0.0 0.0 0.0 0.0 0.1 0.0 0.0 0.0 0.0 0.0 0.0 0.0 0.1 0.0 0.1 0.0 Pre-tax profit 3.0 2.3 1.4 -0.8 -0.8 -1.3 -1.1 -1.0 -0.4 -0.1 0.1 0.2 18.6 5.9 -4.2 -0.3 Tax expense/(credit) 0.1 0.1 0.0 -0.1 0.0 -0.1 0.0 0.0 0.0 0.0 0.0 0.0 -0.1 -0.1 0.1 0.0 Net profit 2.9 2.3 1.4 -0.8 -0.8 -1.2 -1.1 -1.0 -0.4 -0.1 0.0 0.2 18.5 5.8 -4.1 -0.3 Adj. Net profit (ex-123R exp.) 3.3 2.6 1.7 -0.5 -0.6 -1.0 -0.9 -0.8 -0.2 0.1 0.2 0.4 18.5 7.1 -3.3 0.5 Pre-tax EPS (US$) 0.08 0.07 0.04 -0.02 -0.02 -0.04 -0.03 -0.03 -0.01 0.00 0.00 0.00 0.54 0.17 -0.12 -0.01 After-tax EPS (US$) 0.08 0.07 0.04 -0.02 -0.02 -0.04 -0.03 -0.03 -0.01 0.00 0.00 0.00 0.53 0.17 -0.12 -0.01 Diluted EPS (US$) 0.08 0.06 0.04 -0.02 -0.02 -0.04 -0.03 -0.03 -0.01 0.00 0.00 0.00 0.52 0.16 -0.12 -0.01 Adj. Diluted EPS (ex-123R exp., US$) 0.09 0.07 0.05 -0.01 -0.02 -0.03 -0.03 -0.02 -0.01 0.00 0.01 0.01 0.52 0.20 -0.09 0.01 Margins (%) GPM 94.6 92.4 95.1 72.0 88.3 91.7 88.0 88.2 87.4 87.4 87.5 87.5 92.0 88.9 89.0 87.5 OPM (ex-123R exp.) 47.1 40.7 28.6 -27.9 -45.0 -57.3 -42.0 -34.8 -20.6 -11.6 -6.5 -3.5 55.9 24.7 -44.3 -10.5 EBITDA margin 50.8 45.9 36.6 -21.3 -30.3 -43.0 -28.4 -20.6 -6.1 3.7 9.4 13.1 58.1 30.7 -30.2 5.1 Net margin 47.1 45.3 37.2 -17.5 -28.4 -39.9 -30.8 -27.0 -11.6 -3.2 1.3 4.0 63.2 30.0 -31.4 -2.3 Adj. Net margin (ex-123R exp.) 54.6 50.9 45.3 -11.6 -21.3 -33.4 -25.1 -21.4 -6.2 2.1 6.6 9.2 63.2 36.7 -25.3 3.0 Sequential growth (%) Revenue -6.4 -17.3 -26.6 21.6 -37.1 10.1 12.8 2.0 3.1 1.1 1.1 1.0 20.5 -34.1 -32.7 15.2 Gross profit -3.9 -19.3 -24.5 -8.0 -22.9 14.3 8.3 2.2 2.1 1.1 1.1 1.1 13.4 -36.3 -32.6 13.2 Adj. EBIT 9.7 -28.5 -48.5 -218.5 1.5 40.4 -17.3 -15.6 -38.9 -43.3 -43.1 -46.2 -2.7 -70.9 n.m. n.m. Pre-tax profit -12.5 -20.8 -40.5 -160.3 -7.0 65.2 -12.9 -10.8 -56.1 -73.8 -154.5 171.4 6.5 -68.2 n.m. n.m. Net profit (ex-123R exp.) -1.3 -22.9 -34.7 -131.1 15.2 73.1 -15.2 -13.1 -70.0 -134.6 213.3 41.1 14.6 -61.8 n.m. n.m. Diluted EPS -15.0 -20.1 -39.8 -157.4 3.4 54.1 -12.9 -10.8 -55.6 -72.1 -141.5 205.2 -9.4 -68.6 n.m. n.m. Adj. Diluted EPS (ex-123R exp.) -1.6 -22.6 -34.6 -131.2 17.0 72.4 -15.3 -13.3 -70.0 -134.5 212.7 40.9 -61.4 n.m. n.m. Source: Company, JPMorgan estimates.

284
North America Equity Research 02 January 2008
Imran Khan (1-212) 622-6693 [email protected]
Table 187: Ninetowns Annual Balance Sheet US$ in millions, year-end December FY05 FY06 FY07E FY08E Cash, cash equivalents and term deposits 114.8 114.2 86.3 82.9 Account receivables 5.8 2.8 3.9 4.2 Inventory 0.9 0.9 1.0 1.0 Total other current assets 5.4 7.0 4.4 5.0 Total current assets 126.8 124.8 95.6 93.2 Gross fixed assets 5.0 7.5 11.7 15.9 Accumulated depreciation (0.9) (1.6) (2.8) (4.4) Net fixed assets 4.1 5.9 8.9 11.4 Other long term assets 33.6 41.4 70.0 70.0 Long term investments and associates - - - - Total long term assets 37.7 47.3 78.8 81.4 Total assets 164.6 172.2 174.5 174.5 ST debt and current portion of LT debt Accounts payable 3.8 4.3 2.7 0.8 Other current liabilities 8.3 3.3 4.1 4.3 Total current liabilities 12.1 7.6 6.8 5.2 Long term debt - - - - Other long term liabilities 0.1 - 0.2 0.2 Total long term liabilities 0.1 - 0.2 0.2 Share capital 0.1 0.1 0.1 0.1 Share premium 104.3 109.8 114.4 116.5 Other reserves - - - - Retained earnings 48.0 54.7 52.9 52.6 Preferred stock - - - - Total equity 152.4 164.6 167.5 169.2 Total liabilities and equity 164.6 172.2 174.5 174.5 Source: Company reports, JPMorgan estimates.
Table 188: Ninetowns Annual Cash Flow Statement US$ in millions, year-end December FY05 FY06 FY07E FY08E Net income 18.5 5.8 (4.1) (0.3) Add non cash expenses/(income) - - - - Depreciation and amortization 0.6 1.2 1.8 2.3 Extraordinaries - - - - Other non-cash items 0.1 1.2 0.8 0.8 Changes in working capital: - - - - (Increase)/decrease receivables 2.6 3.8 (1.1) (0.3) (Increase)/decrease inventories 0.0 0.1 (0.1) (0.1) (Increase)/decrease other current assets (0.8) (1.6) 2.8 (0.6) Increase/(decrease) payables (0.9) 0.0 (1.7) (1.9) Increase/(decrease) other current liabilities (2.4) (5.4) 0.7 0.3 Net cash from operations 17.9 5.1 (0.8) 0.2 Purchase of property, plant & equipment (6.7) (2.5) (3.9) (4.1) Purchase/sale of other LT assets - (2.2) (28.1) (0.7) Purchase/sale of investments (6.9) (17.5) - - Net cash from investing activities (13.6) (22.3) (32.1) (4.9) - - - - Issuance/repayment of debt Change in other LT liabilities (0.7) (0.1) 0.2 - Change in common equity - net 0.9 0.9 0.9 1.3 Payment of cash dividends - - - - Other financing charges, net - - 0.8 0.0 Net cash from financing activities 0.2 0.8 1.9 1.3 Net effect of exchange rate changes (0.4) (0.4) - - Net change in cash and cash equivalents 4.2 (16.8) (30.9) (3.4) Net change in term deposits 6.9 12.6 - - Total cash balance at beginning of period 102.4 114.8 114.2 86.3 Total cash balance at end of period 114.8 114.2 86.3 82.9 Source: Company reports, JPMorgan estimates.

285
North America Equity Research 02 January 2008
Imran Khan (1-212) 622-6693 [email protected]
Shanda, Overweight ($34.39) We maintain our Overweight rating on Shanda, which also remains our top pick in the China online games sector. We maintain our view that: (1) Industry-wide online gamers shift from pay-to-play paying model to free-to-play (item sales) paying model will benefit Shanda, the largest free-to-play online game operator in China. (2) Shanda’s strong marketing capability and operating platform should enable it to further monetize its aging, but very well known games Mir2 and Woool.
• Shanda continues to execute in a consistently solid vein. In 3Q07, the strong execution drove record-high active paying accounts (APA) of 3.08 million (in the MMORPG segment), up 13%Q/Q; growth came mainly from existing game titles (such as Woool and Mir2), with small contributions from new game Feng Yun Online (acquired in July). The solid 3Q07 result again gives us confidence that Shanda can maintain good growth on its existing games by providing quality upgrades and ongoing promotions through its game platform. Further, we believe the company’s focus on expanding APA (as against ARPU) should be positive for Shanda in the long run.
• We also maintain our view that Shanda’s strong marketing capability and proven operating platform should enable it to further monetize its aging, but still popular games Mir2 and Woool. We believe new gamers in lower-tier cities are likely to continue adopting them (due to their famous brand name); further, upgrade packs should continue to draw old gamers back.
• Shanda currently operates around 20 games, and also has a very healthy game pipeline with around 9 MMOGS (including several 2.75D / 3D games) and 9 casual games for 4Q07/2008. Shanda targets launching 1 or 2 big hit titles each year, and we expect the next big game to be Changchun Online – to be launched in 1H08.
• In our view, share price drivers in the near to medium term include: (1) operating results of new games such as Changchun Online (testing) and DDO in 4Q07; (2) continued good execution likely to lead to earnings upside.
• For 4Q07, we forecast net revenue at US$92.3M, up 6% Q/Q and 53% Y/Y, and GAAP diluted EPS of US$0.44, down 1% Q/Q but up 41% Y/Y, or adjusted EPS (ex-share-based expense) of US$0.46, down 1% Q/Q but up 41% Y/Y. Sequential revenue growth is in the mid-range of company guidance of 4% - 7% Q/Q growth. We expect MMORGP revenue to be up ~6.5% Q/Q, on the back of momentum of new game Feng Yun Online and other game updates. For casual games, we forecast revenue growth of ~3.4% QoQ (on weak 4Q seasonality).

286
North America Equity Research 02 January 2008
Imran Khan (1-212) 622-6693 [email protected]
Table 189: Shanda Financial Snapshot US$ millions, except per share data 4Q07E 3Q07A 4Q06A Y/Y Q/Q F'07E F'08E F'09E F'07E Y/Y F'08E Y/Y F'09E Y/YJPMorgan Revenue 92.3 87.4 60.3 53% 6% 322.2 399.9 483.6 54% 24% 21% EBITDA 45.3 44.1 25.9 75% 3% 164.3 197.3 242.1 133% 20% 23% EPS (GAAP) 0.44 0.44 0.31 41% -1% 1.66 1.76 2.12 80% 6% 20% EPS (Adj.) * 0.46 0.46 0.33 41% -1% 1.76 1.85 2.21 101% 5% 19% Consensus Revenue 89.1 87.4 60.3 48% 2% 318.9 393.3 447.6 53% 23% 14% EBITDA - 44.1 25.9 - - - - - - - - EPS (GAAP) 0.46 0.44 0.31 48% 5% 1.77 1.93 2.26 92% 9% 17% Source: JPMorgan, First Call estimates. *Note: Adjusted EPS excludes share-based compensation expense. 4Q06A EPS figures also exclude gain from sale of Sina shares.
Our Estimates and Outlook for 2008 We forecast 2008 net revenue of US$399.9M, up 24% Y/Y, and GAAP-diluted EPS of US$1.76, up 6% Y/Y, or adjusted EPS (ex-share-based expense) of US$1.85, up 5% Y/Y (lower earnings growth on account of higher operating expenses and higher tax rate assumption) . We expect the top line to be driven by 27% Y/Y growth in MMORPG revenue (~85% of total revenues) and 13% Y/Y growth in casual games revenue. In respect of the new in-game advertising business, we believe it is still in the phase of technology development for ad placement solutions; some revenue contribution may start in mid-2008, probably around the Olympics with ads on sports casual games.
On margins, we forecast gross margin at 66.3% for 2008, down modestly from 67.6% for 2007; adjusted operating margin (ex-share-based expense) of 39.0% for 2008, down from 42.9% for 2007 (due to higher SG&A and R&D expenses), and adjusted net margin (ex-share-based expense) of 35.0% for 2008, down from 40.2% for 2007 (partially due to slightly higher tax rate assumption for 2008).
Our Estimates and Outlook for 2009 For 2009, we forecast net revenue at US$483.6M, up 21% Y/Y, and GAAP diluted EPS of US$2.12, up 20% Y/Y, or adjusted EPS (ex-share-based expense) of US$2.21, up 19% Y/Y. We forecast 21% Y/Y revenue growth for MMORPG and 20% Y/Y growth for casual games. We forecast gross margin at 65.7% for 2009 (stable Y/Y); adjusted operating margin (ex-share-based expense) of 39.1% (stable Y/Y) and adjusted net margin of 34.8% (also stable).
Rating and Price Target We maintain our Overweight stance on Shanda, on the back of: (1) Industry-wide online gamers shift to free-to-play (item sales) model will benefit Shanda, the largest free-to-play online game operator in China. (2) Shanda’s strong marketing capability and operating platform will enable it to further monetize its aging, but very well known games Mir2 and Woool, (3) consistent solid execution, and (4) Shanda continues to expand its game pipeline and diversifies game-specific risks.
Our Dec-08 price target is US$43, which implies 24.4x 2008E and 20.3x 2009E diluted GAAP EPS, or 23.2x 2008E and 19.5x 2009E adjusted diluted EPS (ex-

287
North America Equity Research 02 January 2008
Imran Khan (1-212) 622-6693 [email protected]
share-based expense). The price target is in line with our DCF valuation of ~US$45 (12% WACC, 0% terminal growth).
Risks to Our Rating and Price Target Upside risks include: (1) New games such as DDO and Changchun attracting greater-than-expected user traction; (2) better-than-expected casual game revenue in 2008; and (3) in-game advertising ahead of our expectations in 2008. On the other hand, key downside risks include: (1) Existing games seeing a significant decline from lack of new content or promotion; (2) new big titles in MMORPG seeing lower-than-expected gamer interest.

288
North America Equity Research 02 January 2008
Imran Khan (1-212) 622-6693 [email protected]
Table 190: Shanda Income Statement US$ in millions, except per share data, year-end December
1Q06 2Q06 3Q06 4Q06 1Q07 2Q07 3Q07 4Q07E 1Q08E 2Q08E 3Q08E 4Q08E FY06 FY07E FY08E FY09E Revenue 42.6 50.7 55.2 60.3 68.8 74.1 87.4 92.3 95.9 98.6 101.4 103.9 208.6 322.2 399.9 483.6 MMORPG 28.1 38.1 42.0 48.4 53.5 62.1 73.4 78.2 81.3 83.6 85.8 87.9 156.3 266.8 338.6 410.4 Casual games 10.5 8.7 9.7 9.2 11.8 9.3 10.9 11.3 11.8 12.0 12.4 12.8 38.2 43.3 49.0 59.0 EZ hardware 1.4 1.1 0.9 0.0 0.9 0.0 0.1 0.1 0.1 0.1 0.1 0.1 3.5 1.1 0.2 0.3 EZ subscription 0.0 0.0 0.0 0.0 0.0 0.0 0.0 0.0 0.0 0.0 0.0 0.0 0.0 0.0 0.0 0.0 Others 2.6 2.8 2.6 2.6 2.6 2.7 3.0 2.7 2.7 3.0 3.2 3.2 10.6 11.0 12.1 13.9 COGS -18.4 -22.1 -24.2 -22.3 -24.0 -24.3 -26.4 -29.9 -31.2 -32.9 -35.1 -35.7 -87.0 -104.5 -134.9 -166.1 Gross Profit 24.2 28.7 31.0 37.9 44.9 49.8 61.0 62.3 64.7 65.7 66.4 68.2 121.6 217.7 265.0 317.5 Operating Expense -21.9 -17.2 -16.8 -18.1 -15.8 -17.8 -26.6 -26.8 -27.8 -28.6 -29.4 -30.1 -74.0 -86.8 -116.0 -135.4 Sales & Mktg. expenses -8.0 -4.9 -4.0 -5.8 -3.8 -5.0 -8.1 -7.4 -7.7 -7.9 -8.1 -8.3 -22.8 -24.2 -32.0 -38.7 G&A expenses -7.3 -6.5 -8.2 -8.1 -8.4 -8.7 -11.9 -12.0 -12.5 -12.8 -13.2 -13.5 -30.0 -41.0 -52.0 -58.0 R&D expenses -6.6 -5.9 -4.5 -4.1 -3.6 -4.0 -6.6 -7.4 -7.7 -7.9 -8.1 -8.3 -21.2 -21.6 -32.0 -38.7 Other expenses 0.0 0.0 0.0 0.0 0.0 0.0 0.0 0.0 0.0 0.0 0.0 0.0 0.0 0.0 0.0 0.0 123R share-based comps. -1.5 -0.8 -1.4 -1.4 -1.5 -2.0 -2.0 -1.7 -1.7 -1.7 -1.7 -1.7 -5.0 -7.2 -6.9 -6.9 EBIT 2.3 11.4 14.2 19.9 29.0 32.1 34.3 35.6 36.9 37.1 36.9 38.1 47.6 130.9 149.0 182.1 Adj. EBIT (ex-123R expense) 3.8 12.2 15.6 21.3 30.5 34.1 36.3 37.3 38.6 38.8 38.7 39.8 52.6 138.1 156.0 189.0 EBITDA 8.6 16.3 20.0 25.9 36.0 39.4 44.1 45.3 47.1 48.6 50.2 51.5 70.5 164.3 197.3 242.1 Net Interest Income 0.1 0.1 0.2 0.5 0.9 1.1 2.0 3.6 1.9 2.2 2.4 2.7 0.9 7.6 9.2 13.8 Net Other Income 1.4 6.3 6.1 12.4 33.3 26.4 2.7 0.9 1.0 1.0 1.0 1.0 26.0 64.0 4.0 4.8 Pre Tax Profit 3.7 17.9 20.5 32.8 63.2 59.6 39.1 40.1 39.8 40.3 40.4 41.8 74.5 202.4 162.2 200.7 Tax Expense/(Credit) 1.1 0.3 2.0 1.3 3.1 5.0 6.4 6.3 6.2 6.3 6.3 6.5 -4.6 -20.7 -25.4 -31.1 Net Profit (Reported) 1.5 16.7 18.1 30.8 58.0 54.6 31.8 32.8 32.5 33.0 33.1 34.3 66.7 177.8 132.9 161.6 Adj. Net Profit (ex-123R exp.) * 3.0 17.5 19.5 23.6 27.8 33.3 33.8 34.5 34.3 34.7 34.8 36.0 63.3 129.3 139.8 168.5 Pre Tax EPS (US$) 0.05 0.25 0.29 0.46 0.88 0.84 0.55 0.55 0.55 0.56 0.56 0.58 1.05 2.82 2.25 2.76 After Tax EPS (US$) 0.02 0.23 0.25 0.43 0.81 0.76 0.44 0.45 0.45 0.46 0.46 0.47 0.94 2.48 1.84 2.22 Diluted EPS (Reported, US$) 0.02 0.23 0.25 0.42 0.79 0.74 0.44 0.44 0.43 0.44 0.44 0.45 0.92 2.42 1.76 2.12 Adj. Diluted EPS (US$, ex-123R) 0.04 0.24 0.27 0.33 0.38 0.46 0.46 0.46 0.46 0.46 0.46 0.48 0.88 1.76 1.85 2.21 Margins (%) Gross Margin 56.8 56.5 56.2 62.9 65.2 67.2 69.8 67.6 67.5 66.6 65.4 65.6 58.3 67.6 66.3 65.7 Operating Margin (ex-123R exp.) 8.9 24.0 28.3 35.3 44.3 46.0 41.6 40.4 40.3 39.4 38.1 38.3 25.2 42.9 39.0 39.1 EBITDA Margin 20.1 32.1 36.2 43.0 52.3 53.2 50.5 49.1 49.1 49.3 49.4 49.6 33.8 51.0 49.3 50.1 Net Margin 3.5 32.9 32.9 51.1 84.3 73.7 36.4 35.5 33.9 33.4 32.6 33.0 32.0 55.2 33.2 33.4 Adj. Net Margin (ex-123R exp.) 7.0 34.4 35.4 39.2 40.5 44.9 38.7 37.4 35.7 35.2 34.3 34.7 30.4 40.2 35.0 34.8 Sequential Growth (%) Revenue -4.7 19.1 8.8 9.1 14.2 7.7 17.9 5.6 4.0 2.8 2.9 2.5 -10.1 54.5 24.1 20.9 Gross Profit -9.7 18.6 8.2 22.2 18.3 11.1 22.3 2.2 3.8 1.5 1.0 2.8 -22.4 79.0 21.8 19.8 Adj. EBIT n.m. 221.0 28.2 36.2 43.3 11.7 6.7 2.6 3.6 0.6 -0.5 3.0 -30.8 162.3 12.9 21.2 Pre Tax Profit 56.6 377.4 14.6 59.9 92.7 -5.7 -34.4 2.4 -0.7 1.3 0.3 3.6 -23.9 171.6 -19.9 23.7 Net Profit (ex-123R exp.) n.m. 489.0 11.8 21.0 17.9 19.5 1.6 2.1 -0.7 1.3 0.3 3.5 213.4 104.2 8.1 20.5 Diluted EPS n.m. 1,036.0 8.2 69.0 87.5 -5.7 -40.5 -1.0 -0.6 1.0 0.0 3.4 232.0 161.8 -27.1 20.2 Adj. Diluted EPS (ex-123R exp.) n.m. 489.1 11.4 20.6 17.2 19.8 1.1 -0.7 -0.5 1.0 0.0 3.2 215.2 100.7 5.4 19.2 Source: Company, JPMorgan estimates. * Note: Adjusted net profit for 4Q06, 1Q07 and 2Q07 also excludes gain from Sina stake sale.
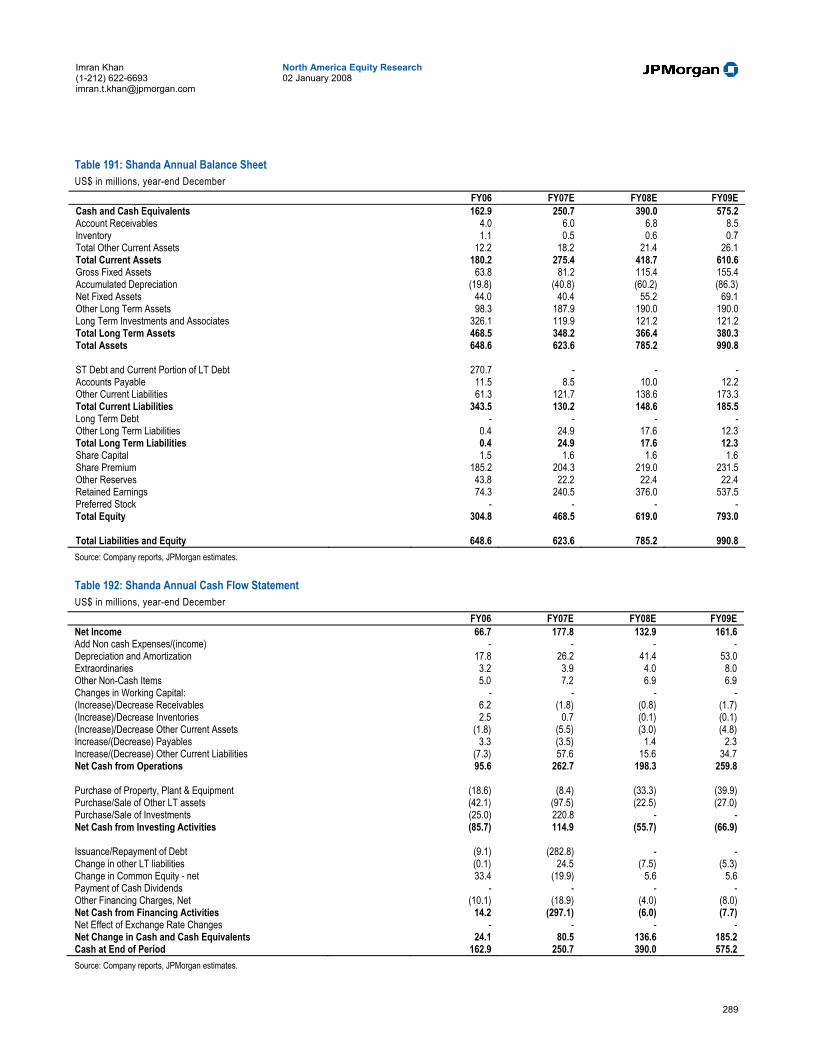
289
North America Equity Research 02 January 2008
Imran Khan (1-212) 622-6693 [email protected]
Table 191: Shanda Annual Balance Sheet US$ in millions, year-end December FY06 FY07E FY08E FY09E Cash and Cash Equivalents 162.9 250.7 390.0 575.2 Account Receivables 4.0 6.0 6.8 8.5 Inventory 1.1 0.5 0.6 0.7 Total Other Current Assets 12.2 18.2 21.4 26.1 Total Current Assets 180.2 275.4 418.7 610.6 Gross Fixed Assets 63.8 81.2 115.4 155.4 Accumulated Depreciation (19.8) (40.8) (60.2) (86.3) Net Fixed Assets 44.0 40.4 55.2 69.1 Other Long Term Assets 98.3 187.9 190.0 190.0 Long Term Investments and Associates 326.1 119.9 121.2 121.2 Total Long Term Assets 468.5 348.2 366.4 380.3 Total Assets 648.6 623.6 785.2 990.8 ST Debt and Current Portion of LT Debt 270.7 - - - Accounts Payable 11.5 8.5 10.0 12.2 Other Current Liabilities 61.3 121.7 138.6 173.3 Total Current Liabilities 343.5 130.2 148.6 185.5 Long Term Debt - - - - Other Long Term Liabilities 0.4 24.9 17.6 12.3 Total Long Term Liabilities 0.4 24.9 17.6 12.3 Share Capital 1.5 1.6 1.6 1.6 Share Premium 185.2 204.3 219.0 231.5 Other Reserves 43.8 22.2 22.4 22.4 Retained Earnings 74.3 240.5 376.0 537.5 Preferred Stock - - - - Total Equity 304.8 468.5 619.0 793.0 Total Liabilities and Equity 648.6 623.6 785.2 990.8 Source: Company reports, JPMorgan estimates.
Table 192: Shanda Annual Cash Flow Statement US$ in millions, year-end December FY06 FY07E FY08E FY09E Net Income 66.7 177.8 132.9 161.6 Add Non cash Expenses/(income) - - - - Depreciation and Amortization 17.8 26.2 41.4 53.0 Extraordinaries 3.2 3.9 4.0 8.0 Other Non-Cash Items 5.0 7.2 6.9 6.9 Changes in Working Capital: - - - - (Increase)/Decrease Receivables 6.2 (1.8) (0.8) (1.7) (Increase)/Decrease Inventories 2.5 0.7 (0.1) (0.1) (Increase)/Decrease Other Current Assets (1.8) (5.5) (3.0) (4.8) Increase/(Decrease) Payables 3.3 (3.5) 1.4 2.3 Increase/(Decrease) Other Current Liabilities (7.3) 57.6 15.6 34.7 Net Cash from Operations 95.6 262.7 198.3 259.8 Purchase of Property, Plant & Equipment (18.6) (8.4) (33.3) (39.9) Purchase/Sale of Other LT assets (42.1) (97.5) (22.5) (27.0) Purchase/Sale of Investments (25.0) 220.8 - - Net Cash from Investing Activities (85.7) 114.9 (55.7) (66.9) Issuance/Repayment of Debt (9.1) (282.8) - - Change in other LT liabilities (0.1) 24.5 (7.5) (5.3) Change in Common Equity - net 33.4 (19.9) 5.6 5.6 Payment of Cash Dividends - - - - Other Financing Charges, Net (10.1) (18.9) (4.0) (8.0) Net Cash from Financing Activities 14.2 (297.1) (6.0) (7.7) Net Effect of Exchange Rate Changes - - - - Net Change in Cash and Cash Equivalents 24.1 80.5 136.6 185.2 Cash at End of Period 162.9 250.7 390.0 575.2 Source: Company reports, JPMorgan estimates.
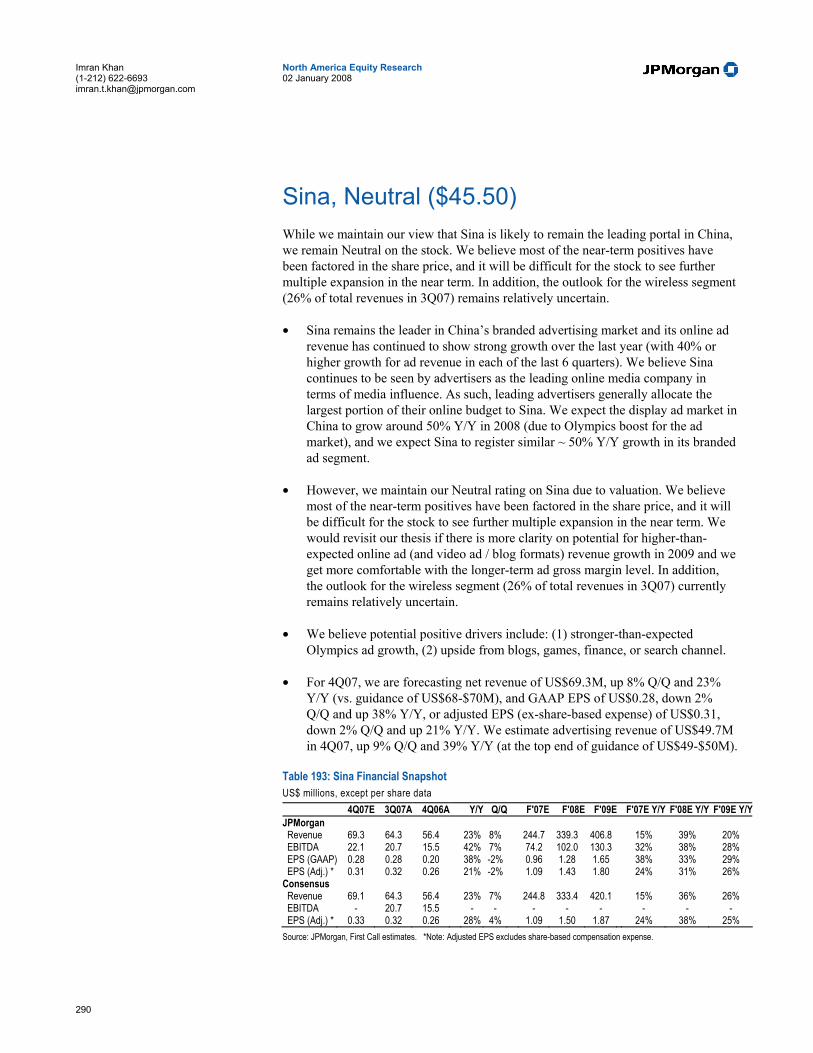
290
North America Equity Research 02 January 2008
Imran Khan (1-212) 622-6693 [email protected]
Sina, Neutral ($45.50) While we maintain our view that Sina is likely to remain the leading portal in China, we remain Neutral on the stock. We believe most of the near-term positives have been factored in the share price, and it will be difficult for the stock to see further multiple expansion in the near term. In addition, the outlook for the wireless segment (26% of total revenues in 3Q07) remains relatively uncertain.
• Sina remains the leader in China’s branded advertising market and its online ad revenue has continued to show strong growth over the last year (with 40% or higher growth for ad revenue in each of the last 6 quarters). We believe Sina continues to be seen by advertisers as the leading online media company in terms of media influence. As such, leading advertisers generally allocate the largest portion of their online budget to Sina. We expect the display ad market in China to grow around 50% Y/Y in 2008 (due to Olympics boost for the ad market), and we expect Sina to register similar ~ 50% Y/Y growth in its branded ad segment.
• However, we maintain our Neutral rating on Sina due to valuation. We believe most of the near-term positives have been factored in the share price, and it will be difficult for the stock to see further multiple expansion in the near term. We would revisit our thesis if there is more clarity on potential for higher-than-expected online ad (and video ad / blog formats) revenue growth in 2009 and we get more comfortable with the longer-term ad gross margin level. In addition, the outlook for the wireless segment (26% of total revenues in 3Q07) currently remains relatively uncertain.
• We believe potential positive drivers include: (1) stronger-than-expected Olympics ad growth, (2) upside from blogs, games, finance, or search channel.
• For 4Q07, we are forecasting net revenue of US$69.3M, up 8% Q/Q and 23% Y/Y (vs. guidance of US$68-$70M), and GAAP EPS of US$0.28, down 2% Q/Q and up 38% Y/Y, or adjusted EPS (ex-share-based expense) of US$0.31, down 2% Q/Q and up 21% Y/Y. We estimate advertising revenue of US$49.7M in 4Q07, up 9% Q/Q and 39% Y/Y (at the top end of guidance of US$49-$50M).
Table 193: Sina Financial Snapshot US$ millions, except per share data 4Q07E 3Q07A 4Q06A Y/Y Q/Q F'07E F'08E F'09E F'07E Y/Y F'08E Y/Y F'09E Y/YJPMorgan Revenue 69.3 64.3 56.4 23% 8% 244.7 339.3 406.8 15% 39% 20% EBITDA 22.1 20.7 15.5 42% 7% 74.2 102.0 130.3 32% 38% 28% EPS (GAAP) 0.28 0.28 0.20 38% -2% 0.96 1.28 1.65 38% 33% 29% EPS (Adj.) * 0.31 0.32 0.26 21% -2% 1.09 1.43 1.80 24% 31% 26% Consensus Revenue 69.1 64.3 56.4 23% 7% 244.8 333.4 420.1 15% 36% 26% EBITDA - 20.7 15.5 - - - - - - - - EPS (Adj.) * 0.33 0.32 0.26 28% 4% 1.09 1.50 1.87 24% 38% 25% Source: JPMorgan, First Call estimates. *Note: Adjusted EPS excludes share-based compensation expense.
291
North America Equity Research 02 January 2008
Imran Khan (1-212) 622-6693 [email protected]
Our Estimates and Outlook for 2008 We forecast 2008 net revenue at US$339.3M, up 39% Y/Y, and GAAP diluted EPS of US$1.28, up 33% Y/Y, or adjusted EPS (ex-share-based expense) of US$1.43, up 31% Y/Y. We expect the top line to be driven by 50% Y/Y growth in advertising segment revenues (74% of total 2008E revenues), with an expected Olympics boost for the ad market in China. In terms of major advertising sectors, automobiles, real estate and IT should remain among the largest, while the financial industry (banks, insurance companies, etc.) could become one of the top 3 largest ad sectors by mid-2008. For the wireless related segment (22% of total 2008E revenues), we are modeling a modest 7% Y/Y (following a 20% decline in 2007). Among other revenue (~4% of total 2008E revenues), we currently expect ~US$9M in Google-search revenue in 2008.
In terms of margins, we forecast gross margin at 61.9% for 2008, stable from 62.1% for 2007; adjusted operating margin (ex-share-based expense) of 24.5% for 2008, also flattish from 24.2% for 2007, and adjusted net margin (ex-share-based expense) of 25.4% for 2008, slightly lower than 26.7% for 2007.
Our Estimates and Outlook for 2009 For 2009, we forecast net revenue at US$406.8M, up 20% Y/Y, and GAAP-diluted EPS of US$1.65, up 29% Y/Y, or adjusted EPS (ex-share-based expense) of US$1.80, up 26% Y/Y. We forecast 23% Y/Y growth in advertising segment (76% of total 2009E revenues) and 11% growth in wireless segment (20% of total 2009E revenues). We forecast gross margin at 62.2% for 2009 (stable); adjusted operating margin (ex-share-based expense) of 26.1% (slight expansion) and adjusted net margin of 26.8% (slight expansion).
Rating and Price Target We maintain our Neutral rating on Sina, with a Dec-08 price target of US$48, which implies 38x 2008E and 29x 2009E GAAP PE, or 34x 2008E and 27x 2009 adjusted P/E. This is above our DCF valuation of US$32. We believe Sina can trade at this valuation, given its longer-term earnings growth of around 30% and historical trading range of 25x-40x forward PE. Our sum-of-the-parts valuation points to a range of US$44 – US$53; our price target is close to the mid-point of the estimates.
We believe at the current level, the stock may find it difficult to see further multiple expansion. We would revisit our thesis if we get more clarity on potential for higher-than-expected online ad (and video ad / blog formats) revenue growth in 2009, and get more comfortable with longer-term ad gross margin level.
Risks to Our Rating and Price Target Upside risks to our rating and price target include: better-than-expected online advertising growth, further partnerships formed, and upside from Google-Sina search partnership. Downside risks include: decline in online ad gross margin, slowdown in advertising spending in China, competition with other Internet portals, and changes in regulations in wireless value-added space, as well as further decline in wireless-related revenue due to strong competition.
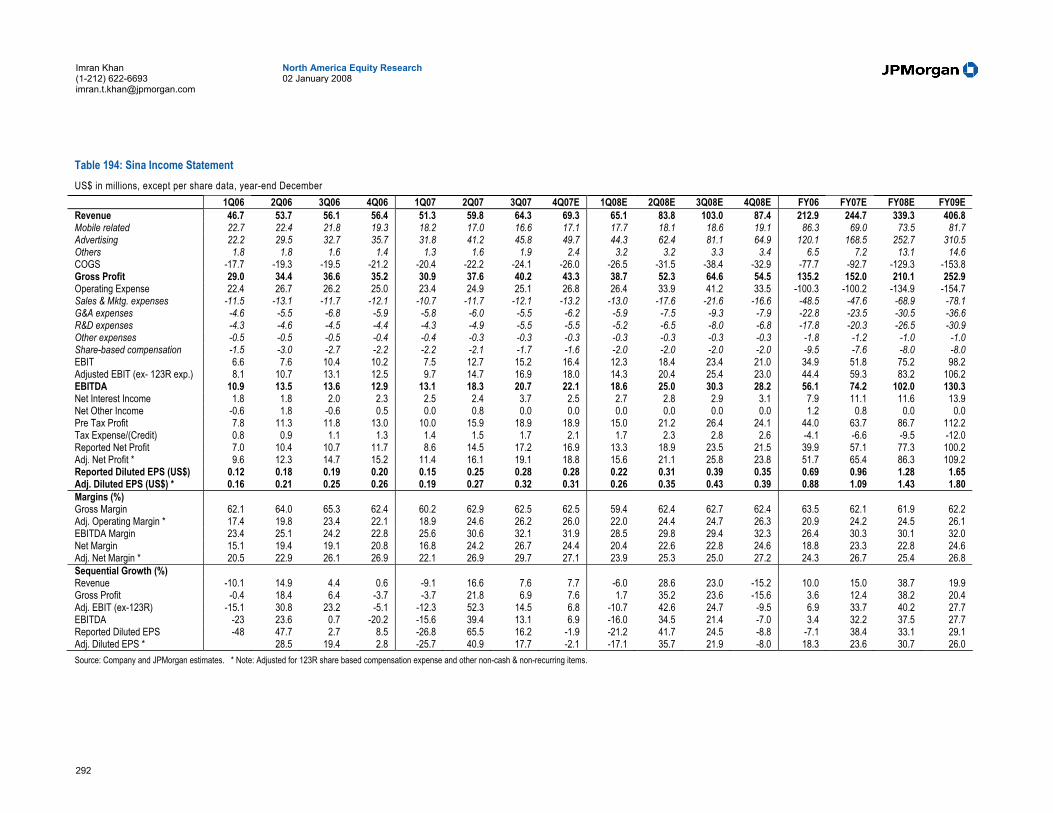
292
North America Equity Research 02 January 2008
Imran Khan (1-212) 622-6693 [email protected]
Table 194: Sina Income Statement US$ in millions, except per share data, year-end December 1Q06 2Q06 3Q06 4Q06 1Q07 2Q07 3Q07 4Q07E 1Q08E 2Q08E 3Q08E 4Q08E FY06 FY07E FY08E FY09E Revenue 46.7 53.7 56.1 56.4 51.3 59.8 64.3 69.3 65.1 83.8 103.0 87.4 212.9 244.7 339.3 406.8 Mobile related 22.7 22.4 21.8 19.3 18.2 17.0 16.6 17.1 17.7 18.1 18.6 19.1 86.3 69.0 73.5 81.7 Advertising 22.2 29.5 32.7 35.7 31.8 41.2 45.8 49.7 44.3 62.4 81.1 64.9 120.1 168.5 252.7 310.5 Others 1.8 1.8 1.6 1.4 1.3 1.6 1.9 2.4 3.2 3.2 3.3 3.4 6.5 7.2 13.1 14.6 COGS -17.7 -19.3 -19.5 -21.2 -20.4 -22.2 -24.1 -26.0 -26.5 -31.5 -38.4 -32.9 -77.7 -92.7 -129.3 -153.8 Gross Profit 29.0 34.4 36.6 35.2 30.9 37.6 40.2 43.3 38.7 52.3 64.6 54.5 135.2 152.0 210.1 252.9 Operating Expense 22.4 26.7 26.2 25.0 23.4 24.9 25.1 26.8 26.4 33.9 41.2 33.5 -100.3 -100.2 -134.9 -154.7 Sales & Mktg. expenses -11.5 -13.1 -11.7 -12.1 -10.7 -11.7 -12.1 -13.2 -13.0 -17.6 -21.6 -16.6 -48.5 -47.6 -68.9 -78.1 G&A expenses -4.6 -5.5 -6.8 -5.9 -5.8 -6.0 -5.5 -6.2 -5.9 -7.5 -9.3 -7.9 -22.8 -23.5 -30.5 -36.6 R&D expenses -4.3 -4.6 -4.5 -4.4 -4.3 -4.9 -5.5 -5.5 -5.2 -6.5 -8.0 -6.8 -17.8 -20.3 -26.5 -30.9 Other expenses -0.5 -0.5 -0.5 -0.4 -0.4 -0.3 -0.3 -0.3 -0.3 -0.3 -0.3 -0.3 -1.8 -1.2 -1.0 -1.0 Share-based compensation -1.5 -3.0 -2.7 -2.2 -2.2 -2.1 -1.7 -1.6 -2.0 -2.0 -2.0 -2.0 -9.5 -7.6 -8.0 -8.0 EBIT 6.6 7.6 10.4 10.2 7.5 12.7 15.2 16.4 12.3 18.4 23.4 21.0 34.9 51.8 75.2 98.2 Adjusted EBIT (ex- 123R exp.) 8.1 10.7 13.1 12.5 9.7 14.7 16.9 18.0 14.3 20.4 25.4 23.0 44.4 59.3 83.2 106.2 EBITDA 10.9 13.5 13.6 12.9 13.1 18.3 20.7 22.1 18.6 25.0 30.3 28.2 56.1 74.2 102.0 130.3 Net Interest Income 1.8 1.8 2.0 2.3 2.5 2.4 3.7 2.5 2.7 2.8 2.9 3.1 7.9 11.1 11.6 13.9 Net Other Income -0.6 1.8 -0.6 0.5 0.0 0.8 0.0 0.0 0.0 0.0 0.0 0.0 1.2 0.8 0.0 0.0 Pre Tax Profit 7.8 11.3 11.8 13.0 10.0 15.9 18.9 18.9 15.0 21.2 26.4 24.1 44.0 63.7 86.7 112.2 Tax Expense/(Credit) 0.8 0.9 1.1 1.3 1.4 1.5 1.7 2.1 1.7 2.3 2.8 2.6 -4.1 -6.6 -9.5 -12.0 Reported Net Profit 7.0 10.4 10.7 11.7 8.6 14.5 17.2 16.9 13.3 18.9 23.5 21.5 39.9 57.1 77.3 100.2 Adj. Net Profit * 9.6 12.3 14.7 15.2 11.4 16.1 19.1 18.8 15.6 21.1 25.8 23.8 51.7 65.4 86.3 109.2 Reported Diluted EPS (US$) 0.12 0.18 0.19 0.20 0.15 0.25 0.28 0.28 0.22 0.31 0.39 0.35 0.69 0.96 1.28 1.65 Adj. Diluted EPS (US$) * 0.16 0.21 0.25 0.26 0.19 0.27 0.32 0.31 0.26 0.35 0.43 0.39 0.88 1.09 1.43 1.80 Margins (%) Gross Margin 62.1 64.0 65.3 62.4 60.2 62.9 62.5 62.5 59.4 62.4 62.7 62.4 63.5 62.1 61.9 62.2 Adj. Operating Margin * 17.4 19.8 23.4 22.1 18.9 24.6 26.2 26.0 22.0 24.4 24.7 26.3 20.9 24.2 24.5 26.1 EBITDA Margin 23.4 25.1 24.2 22.8 25.6 30.6 32.1 31.9 28.5 29.8 29.4 32.3 26.4 30.3 30.1 32.0 Net Margin 15.1 19.4 19.1 20.8 16.8 24.2 26.7 24.4 20.4 22.6 22.8 24.6 18.8 23.3 22.8 24.6 Adj. Net Margin * 20.5 22.9 26.1 26.9 22.1 26.9 29.7 27.1 23.9 25.3 25.0 27.2 24.3 26.7 25.4 26.8 Sequential Growth (%) Revenue -10.1 14.9 4.4 0.6 -9.1 16.6 7.6 7.7 -6.0 28.6 23.0 -15.2 10.0 15.0 38.7 19.9 Gross Profit -0.4 18.4 6.4 -3.7 -3.7 21.8 6.9 7.6 1.7 35.2 23.6 -15.6 3.6 12.4 38.2 20.4 Adj. EBIT (ex-123R) -15.1 30.8 23.2 -5.1 -12.3 52.3 14.5 6.8 -10.7 42.6 24.7 -9.5 6.9 33.7 40.2 27.7 EBITDA -23 23.6 0.7 -20.2 -15.6 39.4 13.1 6.9 -16.0 34.5 21.4 -7.0 3.4 32.2 37.5 27.7 Reported Diluted EPS -48 47.7 2.7 8.5 -26.8 65.5 16.2 -1.9 -21.2 41.7 24.5 -8.8 -7.1 38.4 33.1 29.1 Adj. Diluted EPS * 28.5 19.4 2.8 -25.7 40.9 17.7 -2.1 -17.1 35.7 21.9 -8.0 18.3 23.6 30.7 26.0 Source: Company and JPMorgan estimates. * Note: Adjusted for 123R share based compensation expense and other non-cash & non-recurring items.

293
North America Equity Research 02 January 2008
Imran Khan (1-212) 622-6693 [email protected]
Table 195: Sina Annual Balance Sheet US$ in millions, year-end December FY06 FY07E FY08E FY09E Cash and Cash Equivalents 163.2 234.2 320.8 431.8 Account Receivables 45.0 41.8 52.7 68.3 Inventory 199.6 199.6 199.6 199.6 Total Other Current Assets 10.3 18.5 23.3 30.2 Total Current Assets 418.1 494.0 596.4 730.0 Gross Fixed Assets 64.0 84.0 110.0 140.0 Accumulated Depreciation -36.9 -53.1 -71.0 -94.0 Net Fixed Assets 27.1 30.9 39.1 46.0 Other Long Term Assets 92.4 91.2 90.2 89.1 Long Term Investments and Associates 1.2 1.2 1.2 1.2 Total Long Term Assets 120.7 123.3 130.4 136.4 Total Assets 538.8 617.3 726.8 866.3 ST Debt and Current Portion of LT Debt 0.0 0.0 0.0 0.0 Accounts Payable 1.6 3.7 4.6 5.9 Other Current Liabilities 49.4 52.3 66.0 85.5 Total Current Liabilities 51.0 55.9 70.6 91.4 Long Term Debt 100.0 100.0 100.0 100.0 Other Long Term Liabilities 0.0 0.0 0.0 0.0 Total Long Term Liabilities 100.0 100.0 100.0 100.0 Share Capital 7.2 7.3 7.3 7.4 Share Premium 303.9 320.2 337.9 356.3 Other Reserves 0.0 0.0 0.0 0.0 Retained Earnings 76.7 133.8 211.1 311.2 Preferred Stock 0.0 0.0 0.0 0.0 Total Equity 387.8 461.3 556.3 674.9 Total Liabilities and Equity 538.8 617.3 726.8 866.3 Source: Company reports, JPMorgan estimates.
Table 196: Sina Annual Cash Flow Statement US$ in millions, year-end December FY06 FY07E FY08E FY09E Net Income 39.9 57.1 77.3 100.2 Add Non cash Expenses/(income) Depreciation and Amortization 11.7 14.9 18.9 24.1 Extraordinaries 0.0 0.0 0.0 0.0 Other Non-Cash Items 9.5 7.6 8.0 8.0 Changes in Working Capital: (Increase)/Decrease Receivables -11.1 3.3 -10.9 -15.6 (Increase)/Decrease Inventories 0.0 0.0 0.0 0.0 (Increase)/Decrease Other Current Assets 2.1 -8.1 -4.8 -6.9 Increase/(Decrease) Payables 0.0 2.0 0.9 1.3 Increase/(Decrease) Other Current Liabilities 1.9 2.9 13.7 19.6 Net Cash from Operations 54.0 79.6 103.0 130.5 Purchase of Property, Plant & Equipment -14.8 -17.4 -26.0 -30.0 Purchase/Sale of Other LT assets 1.3 0.0 0.0 0.0 Purchase/Sale of Investments 15.5 0.0 0.0 0.0 Net Cash from Investing Activities 2.0 -17.4 -26.0 -30.0 Issuance/Repayment of Debt 0.0 0.0 0.0 0.0 Change in other LT liabilities 0.0 0.0 0.0 0.0 Change in Common Equity - net 10.0 8.9 9.7 10.5 Payment of Cash Dividends 0.0 0.0 0.0 0.0 Other Financing Charges, Net 8.8 0.0 0.0 0.0 Net Cash from Financing Activities 18.8 8.9 9.7 10.5 Net Effect of Exchange Rate Changes Net Change in Cash and Cash Equivalents 74.8 71.0 86.6 111.0 Cash at End of Period 163.2 234.2 320.8 431.8 Source: Company reports, JPMorgan estimates.

294
North America Equity Research 02 January 2008
Imran Khan (1-212) 622-6693 [email protected]
Sohu, Overweight ($56.58) We maintain our Overweight rating on Sohu, which also remains our top pick in the brand advertising sector in China. With strong secular growth of online advertising in China, benefits from Olympics (near term on content due to official Internet sponsorship, longer term on brand awareness and improved execution), and bonus from online gaming, we maintain Sohu as our top pick.
• As the official 2008 Beijing Olympics Internet content sponsor, Sohu’s brand awareness continues to strengthen among Internet users, advertisers and also the government. Sohu is also a strategic partner for China Interactive Sports (Sohu builds and hosts their sports site; most of China’s athletes belong to CI Sports and will host their blogs on Sohu) and an exclusive sponsor for China’s National Team, or ‘Team China’ (athletes in China’s national teams in international events such as the Olympics belong to Team China). Through such sponsorships, Sohu will have access to first interview rights to Chinese athletes after each Olympics event, and can carry official news for the athletes, during and around the Olympics time. We expect this to help drive traffic before / during the Olympics. On the back of such content strength and consistent execution, we forecast Sohu's branded ad revenue to grow at ~48% Y/Y in 2008 (after 40% Y/Y in 2007) and ~15% in 2009 (conservative estimate).
• Sohu’s success in online gaming with its game ‘TLBB’ (launched in May-07) is an added bonus (for revenues and margins) going forward. In 3Q07, the game saw average paying accounts of 690K, up from 209K in 2Q07; while peak concurrent users hit 500K in November. We expect TLBB to see sustained growth in 2008 as well. We believe the strong TLBB result is due to the team’s deep experience and good understanding of Chinese gamers, and TLBB's strong brand name. Sohu has also signed another game naming right from TLBB’s novelist, Jinyong: “The Duke of Mount Deer” will likely be the title of Sohu’s next in-house game (likely to be launched in late 2008).
• Positive share price drivers include: 1) As the Olympics draw nearer, Sohu is likely to benefit from Olympics-related advertising and stronger branding effects; (2) positive revenue/margin impact from its successful game TLBB; (3) potential upside from next game “The Duke of Mount Deer” to be launched in late-08; (4) strong growth in video-related traffic should provide benefit from increasing ad rates, offsetting higher content costs; and (5) potential upside from monetization of its social networks.
• For 4Q07, our revenue forecast is US$55.9M, up 8% Q/Q and 63% Y/Y, and GAAP EPS of US$0.30, up 20% Q/Q and 89% Y/Y, or adjusted EPS (ex-share-based expense) of US$0.35, up 15% Q/Q and 66% Y/Y. (Note: Sohu has increased its 4Q07 revenue guidance to US$55.5–$57.5M, up $2M vs. prior guidance US$53.5-$55.5M, due to strength in online game TLBB. Adjusted EPS guidance is US$0.36-$0.38, vs. prior US$0.33-$0.35. We are reviewing our numbers. )
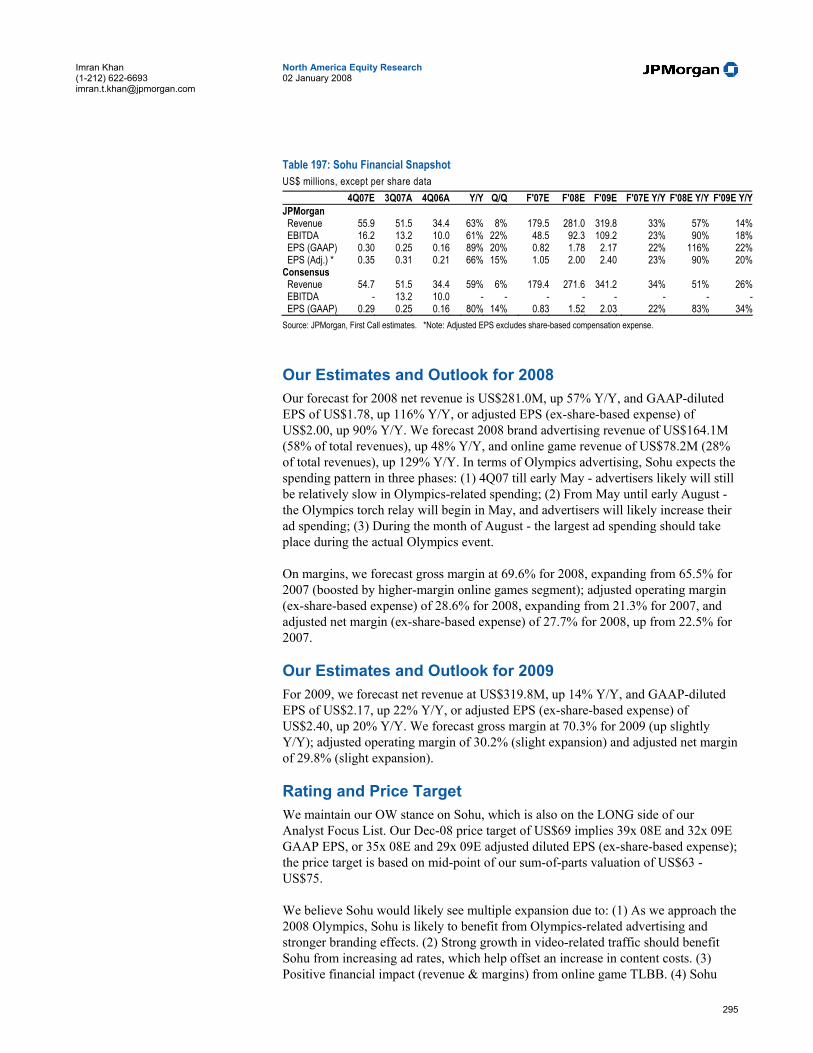
295
North America Equity Research 02 January 2008
Imran Khan (1-212) 622-6693 [email protected]
Table 197: Sohu Financial Snapshot US$ millions, except per share data 4Q07E 3Q07A 4Q06A Y/Y Q/Q F'07E F'08E F'09E F'07E Y/Y F'08E Y/Y F'09E Y/YJPMorgan Revenue 55.9 51.5 34.4 63% 8% 179.5 281.0 319.8 33% 57% 14% EBITDA 16.2 13.2 10.0 61% 22% 48.5 92.3 109.2 23% 90% 18% EPS (GAAP) 0.30 0.25 0.16 89% 20% 0.82 1.78 2.17 22% 116% 22% EPS (Adj.) * 0.35 0.31 0.21 66% 15% 1.05 2.00 2.40 23% 90% 20%Consensus Revenue 54.7 51.5 34.4 59% 6% 179.4 271.6 341.2 34% 51% 26% EBITDA - 13.2 10.0 - - - - - - - - EPS (GAAP) 0.29 0.25 0.16 80% 14% 0.83 1.52 2.03 22% 83% 34%Source: JPMorgan, First Call estimates. *Note: Adjusted EPS excludes share-based compensation expense.
Our Estimates and Outlook for 2008 Our forecast for 2008 net revenue is US$281.0M, up 57% Y/Y, and GAAP-diluted EPS of US$1.78, up 116% Y/Y, or adjusted EPS (ex-share-based expense) of US$2.00, up 90% Y/Y. We forecast 2008 brand advertising revenue of US$164.1M (58% of total revenues), up 48% Y/Y, and online game revenue of US$78.2M (28% of total revenues), up 129% Y/Y. In terms of Olympics advertising, Sohu expects the spending pattern in three phases: (1) 4Q07 till early May - advertisers likely will still be relatively slow in Olympics-related spending; (2) From May until early August - the Olympics torch relay will begin in May, and advertisers will likely increase their ad spending; (3) During the month of August - the largest ad spending should take place during the actual Olympics event.
On margins, we forecast gross margin at 69.6% for 2008, expanding from 65.5% for 2007 (boosted by higher-margin online games segment); adjusted operating margin (ex-share-based expense) of 28.6% for 2008, expanding from 21.3% for 2007, and adjusted net margin (ex-share-based expense) of 27.7% for 2008, up from 22.5% for 2007.
Our Estimates and Outlook for 2009 For 2009, we forecast net revenue at US$319.8M, up 14% Y/Y, and GAAP-diluted EPS of US$2.17, up 22% Y/Y, or adjusted EPS (ex-share-based expense) of US$2.40, up 20% Y/Y. We forecast gross margin at 70.3% for 2009 (up slightly Y/Y); adjusted operating margin of 30.2% (slight expansion) and adjusted net margin of 29.8% (slight expansion).
Rating and Price Target We maintain our OW stance on Sohu, which is also on the LONG side of our Analyst Focus List. Our Dec-08 price target of US$69 implies 39x 08E and 32x 09E GAAP EPS, or 35x 08E and 29x 09E adjusted diluted EPS (ex-share-based expense); the price target is based on mid-point of our sum-of-parts valuation of US$63 - US$75.
We believe Sohu would likely see multiple expansion due to: (1) As we approach the 2008 Olympics, Sohu is likely to benefit from Olympics-related advertising and stronger branding effects. (2) Strong growth in video-related traffic should benefit Sohu from increasing ad rates, which help offset an increase in content costs. (3) Positive financial impact (revenue & margins) from online game TLBB. (4) Sohu

296
North America Equity Research 02 January 2008
Imran Khan (1-212) 622-6693 [email protected]
may begin to see meaningful monetization from its social networks (China Ren alumni site, bulletin boards, etc.).
Risks to Our Rating and Price Target Risks to our price target include a slowdown in the Chinese economy that could result in lower online advertising revenue growth, significant market share loss in online advertising to other portals, and uncertainty in wireless revenue due to policy change by mobile operators.

297
North America Equity Research 02 January 2008
Imran Khan (1-212) 622-6693 [email protected]
Table 198: Sohu Income Statement US$ in millions, except per share data, year-end December 1Q06 2Q06 3Q06 4Q06 1Q07 2Q07 3Q07 4Q07E 1Q08E 2Q08E 3Q08E 4Q08E FY06 FY07E FY08E FY09E Revenue 31.3 34.1 35.4 34.4 33.1 39.0 51.5 55.9 59.4 73.9 79.6 68.1 135.1 179.5 281.0 319.8 Advertising 20.1 22.8 23.9 24.9 25.6 28.4 31.5 32.3 33.9 46.8 51.3 39.0 91.8 117.9 171.0 195.8 Brand advertising 16.7 19.3 21.0 22.0 23.5 26.6 29.8 30.7 32.2 45.1 49.6 37.2 79.0 110.6 164.1 188.1 Paid search 3.5 3.5 2.9 2.9 2.1 1.7 1.7 1.7 1.7 1.7 1.7 1.8 12.8 7.2 6.8 7.7 Mobile related 8.0 9.0 8.8 6.8 5.6 6.6 6.8 7.5 7.6 7.8 8.0 8.1 32.6 26.5 31.5 34.3 Online games (breakout from 1Q07) 1.6 3.8 12.7 16.0 17.8 19.2 20.2 21.0 34.1 78.2 89.4 Others 3.1 2.3 2.7 2.7 0.3 0.2 0.5 0.1 0.1 0.1 0.1 0.1 10.7 1.0 0.3 0.3 COGS -10.5 -12.2 -12.0 -12.1 -12.8 -14.9 -16.8 -17.4 -18.3 -22.5 -24.2 -20.4 -46.8 -61.9 -85.3 -95.0 Gross Profit 20.8 21.9 23.4 22.2 20.2 24.1 34.8 38.5 41.1 51.4 55.4 47.8 88.3 117.6 195.6 224.8 Operating Expense -14.7 -15.3 -17.3 -16.5 -16.2 -19.1 -25.9 -26.9 -27.1 -33.0 -34.0 -29.5 -63.9 -88.1 -123.7 -137.4 Sales & Mktg. expenses -6.1 -6.7 -6.8 -7.4 -6.8 -9.0 -13.2 -14.2 -13.4 -16.6 -16.7 -14.3 -27.1 -43.3 -61.0 -67.2 G&A expenses -2.7 -2.9 -3.5 -2.1 -2.6 -2.7 -4.3 -3.6 -4.2 -5.2 -5.6 -4.8 -11.2 -13.1 -19.7 -22.4 R&D expenses -3.8 -3.9 -4.5 -4.4 -3.9 -4.8 -6.2 -6.7 -7.1 -8.9 -9.6 -8.2 -16.7 -21.6 -33.7 -38.4 Other expenses -0.5 -0.5 -0.5 -0.5 -0.4 -0.3 -0.2 -0.4 -0.4 -0.3 -0.1 -0.1 -2.0 -1.3 -0.9 -0.3 Share-based compensation -1.7 -1.3 -1.9 -2.0 -2.5 -2.4 -2.0 -1.9 -2.1 -2.1 -2.1 -2.1 -6.9 -8.8 -8.4 -9.2 EBIT 6.0 6.6 6.1 5.7 4.1 4.9 8.8 11.6 13.9 18.4 21.4 18.3 24.4 29.5 72.0 87.4 Adj. EBIT (ex- 123R expense) 7.8 7.8 8.0 7.7 6.6 7.3 10.8 13.5 16.0 20.5 23.5 20.4 31.4 38.3 80.4 96.6 EBITDA 9.6 9.7 10.0 10.0 9.1 9.6 13.2 16.2 18.8 23.7 26.7 23.2 39.3 48.5 92.3 109.2 Net Interest Income 0.5 0.8 1.0 0.9 0.8 1.1 0.6 0.5 0.6 0.7 0.9 1.1 3.2 2.9 3.3 6.0 Net Other Income -0.1 0.1 -0.1 -0.1 -0.1 -0.1 0.6 0.0 0.0 0.0 0.0 0.0 -0.2 0.3 0.0 0.0 Pre Tax Profit 6.5 7.5 7.0 6.5 4.7 5.9 10.0 12.1 14.5 19.1 22.3 19.4 27.5 32.7 75.3 93.4 Tax Expense/(Credit) 0.4 0.3 0.4 0.5 0.3 0.2 0.3 0.4 1.2 1.5 1.7 1.5 -1.6 -1.2 -5.9 -7.2 Net Profit (after MI) 6.0 7.2 6.6 6.1 4.5 5.7 9.7 11.7 13.4 17.6 20.6 17.9 25.9 31.5 69.4 86.2 Adj. Net Profit (ex- 123R exp.) 7.8 8.4 8.5 8.1 7.0 8.1 11.7 13.6 15.5 19.7 22.7 20.0 32.8 40.3 77.8 95.4 Diluted EPS (US$) 0.16 0.19 0.17 0.16 0.12 0.15 0.25 0.30 0.35 0.45 0.53 0.46 0.68 0.82 1.78 2.17 Adj. Diluted EPS (US$, ex- 123R exp.)
0.20 0.22 0.22 0.21 0.18 0.21 0.31 0.35 0.40 0.51 0.58 0.51 0.86 1.05 2.00 2.40
Margins (%) Gross Margin 66.4 64.3 66.1 64.7 61.2 61.7 67.5 68.9 69.1 69.6 69.6 70.1 65.4 65.5 69.6 70.3 Operating Margin (ex- 123R exp.) 24.8 23.0 22.7 22.6 19.8 18.8 21.0 24.2 27.0 27.7 29.5 30.0 23.2 21.3 28.6 30.2 EBITDA Margin 30.6 28.5 28.4 29.2 27.6 24.6 25.7 29.0 31.6 32.0 33.6 34.0 29.1 27.0 32.9 34.2 Net Margin 19.3 21.0 18.6 17.7 13.5 14.6 18.8 20.9 22.5 23.8 25.8 26.3 19.2 17.6 24.7 27.0 Adj. Net Margin (ex- 123R exp.) 24.9 24.8 24.1 23.5 21.0 20.8 22.7 24.3 26.0 26.7 28.5 29.3 24.3 22.5 27.7 29.8 Sequential Growth (%) Revenue 2.6 9.0 3.9 -3.0 -3.7 17.8 32.1 8.4 6.3 24.4 7.8 -14.4 24.7 32.9 56.6 13.8 Gross Profit 3.5 5.6 6.8 -5.1 -8.9 18.9 44.5 10.8 6.6 25.2 7.8 -13.8 22.6 33.1 66.4 14.9 EBIT 33.4 1.1 2.6 -3.7 -15.3 11.7 47.9 24.9 18.4 27.6 14.8 -13.1 25.9 22.0 110.0 20.2 EBITDA 32.8 1.7 3.3 -0.2 -9.1 5.1 32.4 22.4 16.1 25.9 12.9 -13.3 24.0 23.3 90.4 18.3 Diluted EPS -32.2 18.9 -7.0 -6.9 -27.1 26.6 70.9 19.6 13.8 30.7 16.2 -13.4 -11.9 21.6 116.3 21.5 Adj. Diluted EPS -13.4 9.1 2.1 -4.6 -14.8 15.9 46.1 15.1 13.3 26.5 14.5 -12.3 11.1 22.9 90.0 20.0 Source: Company and JPMorgan estimates. * Adjustments: excluding share-based compensation expense.

298
North America Equity Research 02 January 2008
Imran Khan (1-212) 622-6693 [email protected]
Table 199: Sohu Annual Balance Sheet US$ in millions, year-end December FY06 FY07E FY08E FY09E Cash and Cash Equivalents 124.8 80.3 165.2 264.3 Account Receivables 23.8 33.7 41.1 52.4 Inventory 0.0 0.0 0.0 0.0 Total Other Current Assets 10.9 22.3 27.3 34.8 Total Current Assets 159.5 136.4 233.6 351.4 Gross Fixed Assets 41.4 91.9 111.9 137.9 Accumulated Depreciation -19.9 -28.9 -40.0 -52.3 Net Fixed Assets 21.5 63.0 71.9 85.6 Other Long Term Assets 71.4 69.5 68.6 68.3 Long Term Investments and Associates 1.3 0.0 0.0 0.0 Total Long Term Assets 94.1 132.5 140.5 153.9 Total Assets 253.6 268.9 374.1 505.3 ST Debt and Current Portion of LT Debt 59.8 0.0 0.0 0.0 Accounts Payable 1.2 2.0 2.3 3.0 Other Current Liabilities 36.6 55.9 68.1 86.9 Total Current Liabilities 97.6 57.9 70.5 89.9 Long Term Debt 0.0 1.3 1.3 1.3 Other Long Term Liabilities 0.1 0.0 0.0 0.0 Total Long Term Liabilities 0.1 1.3 1.3 1.3 Share Capital 0.0 0.0 0.0 0.0 Share Premium 111.4 133.7 156.9 182.5 Other Reserves 0.0 0.0 0.0 0.0 Retained Earnings 44.5 76.0 145.4 231.6 Preferred Stock 0.0 0.0 0.0 0.0 Total Equity 156.0 209.8 302.4 414.2 Total Liabilities and Equity 253.6 268.9 374.1 505.3 Source: Company reports, JPMorgan estimates.
Table 200: Sohu Annual Cash Flow Statement US$ in millions, year-end December FY06 FY07E FY08E FY09E Net Income 25.9 31.5 69.4 86.2 Add Non cash Expenses/(income) Depreciation and Amortization 8.0 10.2 12.0 12.6 Extraordinaries 0.0 0.0 0.0 0.0 Other Non-Cash Items 6.9 8.8 8.4 9.2 Changes in Working Capital: 0.0 0.0 0.0 0.0 (Increase)/Decrease Receivables -4.5 -9.8 -7.4 -11.3 (Increase)/Decrease Inventories 0.0 0.0 0.0 0.0 (Increase)/Decrease Other Current Assets 2.7 -11.4 -4.9 -7.5 Increase/(Decrease) Payables -0.5 0.8 0.3 0.6 Increase/(Decrease) Other Current Liabilities 3.2 19.2 12.3 18.8 Net Cash from Operations 41.7 49.3 90.1 108.6 Purchase of Property, Plant & Equipment -11.7 -50.5 -20.0 -26.0 Purchase/Sale of Other LT assets -7.5 0.6 0.0 0.0 Purchase/Sale of Investments 4.7 1.3 0.0 0.0 Net Cash from Investing Activities -14.4 -48.6 -20.0 -26.0 Issuance/Repayment of Debt -15.0 -58.5 0.0 0.0 Change in other LT liabilities 0.1 -0.1 0.0 0.0 Change in Common Equity - net -6.7 13.5 14.8 16.4 Payment of Cash Dividends 0.0 0.0 0.0 0.0 Other Financing Charges, Net 0.0 0.0 0.0 0.0 Net Cash from Financing Activities -21.6 -45.1 14.8 16.4 Net Change in Cash and Cash Equivalents 5.7 -44.4 84.9 99.0 Cash at End of Period 124.8 80.3 165.2 264.3 Source: Company reports, JPMorgan estimates.
299
North America Equity Research 02 January 2008
Imran Khan (1-212) 622-6693 [email protected]
The9, Overweight ($23.50) We maintain Overweight on The9, as the company has one of the most diversified game pipelines, and we believe the risk is on the upside for the company to operate these games well, despite muted success in the recent two game launches. In addition, the company is trading at a relatively lower valuation compared with other online game companies. However, shares could trade flattish in the near term, on the back of increasing costs and uncertainties (timing, upfront fee, royalty payment) in WoW (World of Warcraft) renewal terms.
• We expect WoW to see solid revenue growth in 4Q07 (full quarter impact of Burning Crusade expansion pack launch) and continue with healthy growth over the next few quarters, driven by further penetration to lower-tier cities (as more PCs in lower-tier cities are upgraded with more 3D games in the market). However, The9 may continue to see more margin pressure going forward, mainly due to: (1) Loose control on marketing spending in recent times; (2) year-end bonus and professional fees; (3) The9 may see a slightly higher tax rate in 2008 and beyond; and (4) second-term WoW license renewal (current license expires in June 2009) will likely cause reduction in gross margin (from both amortization of upfront licensing fee and increased ongoing royalty).
• The9 still has one of the most diversified game pipelines in China online gaming: 3D games GE and Guild Wars (likely commercialization 1Q08), EA’s casual soccer game FIFA Online (likely commercialization 3Q08), Hellgate: London (likely commercialization 1H08) and several others likely in 2H08 (in-house games FM Online and MJSG, dancing game Audition 2, first-person-shooting game Huxley). We believe the risk is on the upside for the company to operate these games well, despite muted success in the last two game launches (SUN commercialization and Guild Wars beta testing).
• We believe positive share price drivers could come around mid-2008 with: (1) FIFA Online launch; and (2) confirmation of WoW license renewal (current license expires in June 2009). We do note that with a new corporate structure at Activision-Blizzard (following the recent merger announcement), there could be delays in the license renewal process. As such, this could be a drag on The9's share price. However, we maintain that The9 is the most likely candidate for the renewal contract, as it has already invested more than US$60 million in WoW servers - a high entry barrier for other potential licensees.
• For 4Q07, we forecast net revenue of US$50.9M, up 21% Q/Q and 40% Y/Y, and GAAP EPS of US$0.18, up 6% Q/Q and down 67% Y/Y, or adjusted EPS (ex-share-based expense) of US$0.27, up 7% Q/Q and down 54% Y/Y. In addition to a full quarter of Burning Crusade revenue impact, WoW plans to launch version 2.3 upgrade during 4Q07 and also launch a new fee-based character transfer feature that should lead to additional monetization (we expect these drivers to lead to 4Q07 WoW ACU of 417k and PCU of 910k). However, margins will likely remain under pressure on higher operating expenses.
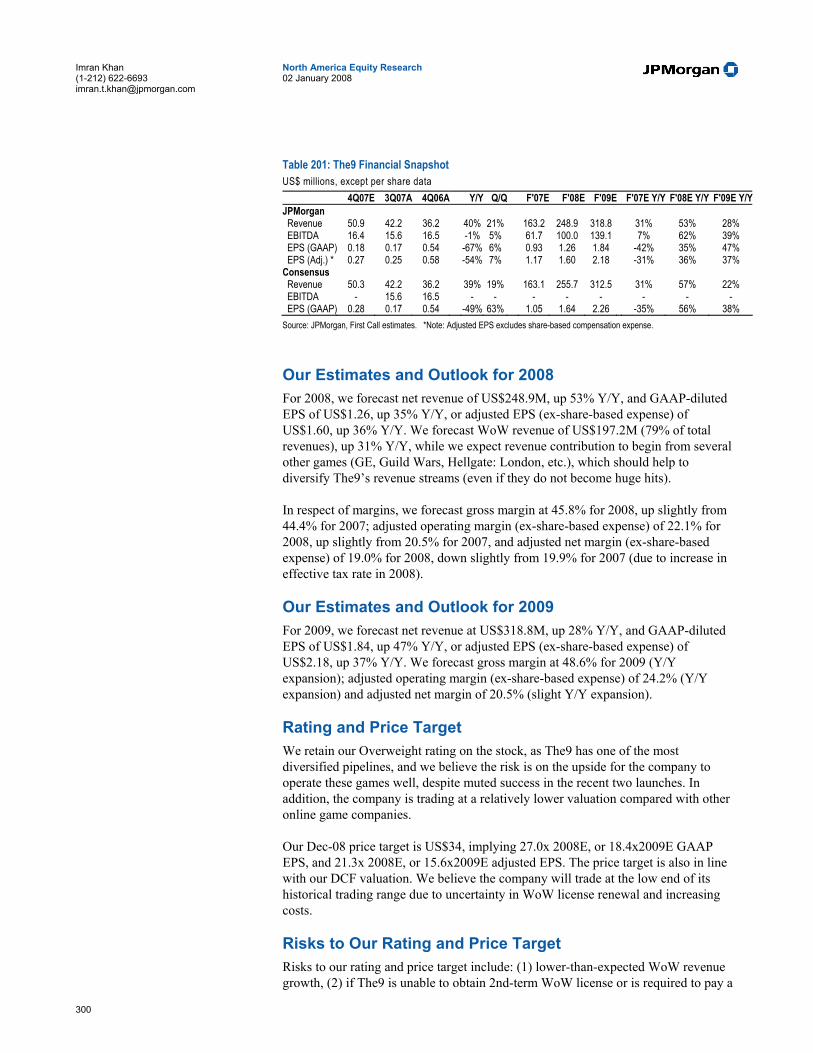
300
North America Equity Research 02 January 2008
Imran Khan (1-212) 622-6693 [email protected]
Table 201: The9 Financial Snapshot US$ millions, except per share data 4Q07E 3Q07A 4Q06A Y/Y Q/Q F'07E F'08E F'09E F'07E Y/Y F'08E Y/Y F'09E Y/YJPMorgan Revenue 50.9 42.2 36.2 40% 21% 163.2 248.9 318.8 31% 53% 28% EBITDA 16.4 15.6 16.5 -1% 5% 61.7 100.0 139.1 7% 62% 39% EPS (GAAP) 0.18 0.17 0.54 -67% 6% 0.93 1.26 1.84 -42% 35% 47% EPS (Adj.) * 0.27 0.25 0.58 -54% 7% 1.17 1.60 2.18 -31% 36% 37% Consensus Revenue 50.3 42.2 36.2 39% 19% 163.1 255.7 312.5 31% 57% 22% EBITDA - 15.6 16.5 - - - - - - - - EPS (GAAP) 0.28 0.17 0.54 -49% 63% 1.05 1.64 2.26 -35% 56% 38% Source: JPMorgan, First Call estimates. *Note: Adjusted EPS excludes share-based compensation expense.
Our Estimates and Outlook for 2008 For 2008, we forecast net revenue of US$248.9M, up 53% Y/Y, and GAAP-diluted EPS of US$1.26, up 35% Y/Y, or adjusted EPS (ex-share-based expense) of US$1.60, up 36% Y/Y. We forecast WoW revenue of US$197.2M (79% of total revenues), up 31% Y/Y, while we expect revenue contribution to begin from several other games (GE, Guild Wars, Hellgate: London, etc.), which should help to diversify The9’s revenue streams (even if they do not become huge hits).
In respect of margins, we forecast gross margin at 45.8% for 2008, up slightly from 44.4% for 2007; adjusted operating margin (ex-share-based expense) of 22.1% for 2008, up slightly from 20.5% for 2007, and adjusted net margin (ex-share-based expense) of 19.0% for 2008, down slightly from 19.9% for 2007 (due to increase in effective tax rate in 2008).
Our Estimates and Outlook for 2009 For 2009, we forecast net revenue at US$318.8M, up 28% Y/Y, and GAAP-diluted EPS of US$1.84, up 47% Y/Y, or adjusted EPS (ex-share-based expense) of US$2.18, up 37% Y/Y. We forecast gross margin at 48.6% for 2009 (Y/Y expansion); adjusted operating margin (ex-share-based expense) of 24.2% (Y/Y expansion) and adjusted net margin of 20.5% (slight Y/Y expansion).
Rating and Price Target We retain our Overweight rating on the stock, as The9 has one of the most diversified pipelines, and we believe the risk is on the upside for the company to operate these games well, despite muted success in the recent two launches. In addition, the company is trading at a relatively lower valuation compared with other online game companies.
Our Dec-08 price target is US$34, implying 27.0x 2008E, or 18.4x2009E GAAP EPS, and 21.3x 2008E, or 15.6x2009E adjusted EPS. The price target is also in line with our DCF valuation. We believe the company will trade at the low end of its historical trading range due to uncertainty in WoW license renewal and increasing costs.
Risks to Our Rating and Price Target Risks to our rating and price target include: (1) lower-than-expected WoW revenue growth, (2) if The9 is unable to obtain 2nd-term WoW license or is required to pay a

301
North America Equity Research 02 January 2008
Imran Khan (1-212) 622-6693 [email protected]
significant fee, (3) loose control on marketing spending, and (4) lower-than-expected acceptance in upcoming titles. Positive risks to our target price are additional license games to The9’s pipeline.

302
North America Equity Research 02 January 2008
Imran Khan (1-212) 622-6693 [email protected]
Table 202: The9—Income statement US$ in millions, except per share data, year-end December
1Q06 2Q06 3Q06 4Q06 1Q07 2Q07 3Q07 4Q07E 1Q08E 2Q08E 3Q08E 4Q08E FY06 FY07E FY08E FY09E Revenue 26.5 32.2 29.5 36.2 35.0 35.5 42.2 50.9 53.2 57.3 65.8 72.7 124.3 163.2 248.9 318.8 Online games services 26.1 32.0 29.0 36.1 34.5 34.5 41.5 50.7 53.1 57.2 65.7 72.6 123.2 161.2 248.5 318.4 Game operation support 0.1 0.1 0.3 0.1 0.3 0.9 0.3 0.0 0.0 0.0 0.0 0.0 0.6 1.5 0.1 0.0 SMS services 0.0 0.0 0.0 0.0 0.0 0.0 0.0 0.0 0.0 0.0 0.0 0.0 0.0 0.0 0.0 0.0 Other revenue 0.2 0.1 0.2 0.1 0.1 0.1 1.2 0.1 0.1 0.1 0.1 0.1 0.6 1.5 0.3 0.4 COGS -14.6 -16.7 -15.9 -19.0 -18.1 -20.4 -24.5 -27.8 -30.0 -31.9 -35.4 -37.6 -66.1 -90.7 -134.8 -163.9 Gross Profit 11.9 15.5 13.6 17.3 16.9 15.1 17.6 23.0 23.2 25.4 30.4 35.1 58.2 72.5 114.1 154.9 Operating Expenses -4.8 -6.8 -5.6 -7.0 -7.5 -9.8 -11.8 -16.8 -14.9 -16.0 -18.1 -20.0 -24.2 -45.8 -69.0 -87.7 Sales & Mktg. expenses -1.4 -2.4 -1.5 -2.3 -2.1 -3.0 -4.3 -6.4 -5.3 -5.7 -6.6 -7.3 -7.5 -15.6 -24.9 -31.9 G&A expenses -2.3 -3.3 -3.2 -4.0 -4.2 -5.3 -6.5 -8.6 -8.0 -8.6 -9.9 -10.9 -12.8 -24.6 -37.3 -47.8 R&D expenses -1.1 -1.1 -1.0 -0.7 -1.2 -1.5 -1.1 -1.8 -1.6 -1.7 -1.6 -1.8 -3.9 -5.6 -6.8 -8.0 Other expenses 0.0 0.0 0.0 0.0 0.0 0.0 0.0 0.0 0.0 0.0 0.0 0.0 0.0 0.0 0.0 0.0 Share-based compensation (123R) -0.6 -0.6 -0.6 -0.8 -0.8 -1.2 -2.3 -2.5 -2.5 -2.5 -2.5 -2.5 -2.5 -6.8 -10.0 -10.0 EBIT 7.1 8.8 8.0 10.3 9.3 5.3 5.8 6.2 8.3 9.4 12.3 15.1 34.1 26.7 45.1 67.2 Adj. EBIT (ex-123R expense) 7.7 9.4 8.6 11.1 10.1 6.5 8.1 8.7 10.8 11.9 14.8 17.6 36.6 33.5 55.1 77.2 EBITDA 12.8 14.5 13.9 16.5 15.8 14.0 15.6 16.4 20.3 22.0 26.9 30.8 57.6 61.7 100.0 139.1 Equity earnings in affiliates 0.1 0.0 -0.2 -0.1 -0.2 -0.3 -0.1 -0.1 -0.1 -0.1 -0.1 -0.1 -0.1 -0.7 -0.5 -0.5 Net Other Income 0.1 1.7 0.2 2.8 0.5 1.8 0.3 0.4 0.3 0.2 0.1 -0.1 4.7 2.9 0.4 -0.1 Pre Tax Profit 7.3 10.5 8.0 12.9 9.6 6.8 6.0 6.5 8.5 9.4 12.2 14.9 38.7 29.0 45.1 66.7 Tax Expense/(Credit) 0.0 -0.1 -0.1 -0.1 1.0 0.1 0.9 1.1 1.4 1.6 2.1 2.5 -0.3 3.2 7.7 11.3 Net Profit 7.3 10.5 8.1 13.5 8.6 6.6 5.1 5.4 7.0 7.8 10.2 12.4 39.4 25.8 37.4 55.3 Adj. Net Profit (ex-123R exp.) 7.9 11.1 8.7 14.3 9.4 7.9 7.4 7.9 9.5 10.3 12.7 14.9 41.9 32.5 47.4 65.3 Pre Tax EPS (US$) 0.29 0.41 0.33 0.53 0.39 0.26 0.20 0.22 0.29 0.32 0.42 0.51 1.58 1.05 1.53 2.26 After Tax EPS (US$) 0.29 0.42 0.33 0.55 0.35 0.25 0.17 0.18 0.24 0.27 0.35 0.42 1.61 0.94 1.27 1.88 Diluted EPS (US$) 0.30 0.43 0.33 0.54 0.34 0.25 0.17 0.18 0.24 0.26 0.34 0.41 1.60 0.93 1.26 1.84 Adj. Diluted EPS (US$, ex-123R) 0.33 0.45 0.35 0.58 0.37 0.29 0.25 0.27 0.32 0.35 0.43 0.50 1.71 1.17 1.60 2.18 Margins (%) Gross Margin 44.8 48.2 46.2 47.7 48.2 42.4 41.8 45.2 43.7 44.4 46.2 48.2 46.8 44.4 45.8 48.6 Operating Margin (ex-123R exp.) 28.9 29.0 29.1 30.5 29.0 18.3 19.3 17.2 20.4 20.7 22.5 24.2 29.4 20.5 22.1 24.2 EBITDA Margin 48.2 45.0 47.0 45.6 45.1 39.3 37.0 32.2 38.2 38.3 40.9 42.4 46.3 37.8 40.2 43.6 Net Margin 27.7 32.7 27.6 37.2 24.5 18.7 12.1 10.6 13.2 13.7 15.4 17.0 31.7 15.8 15.0 17.4 Adj. Net Margin (ex-123R exp.) 29.9 34.6 29.5 39.4 26.8 22.2 17.5 15.5 17.9 18.1 19.2 20.4 33.7 19.9 19.0 20.5 Sequential Growth (%) Revenue 0.0 21.4 -9.4 22.7 -3.5 1.5 18.9 20.6 4.6 7.7 14.9 10.5 118.8 31.3 52.5 28.1 Gross Profit -2.2 30.5 -13.1 26.5 -2.3 -10.7 17.2 30.4 0.9 9.5 19.6 15.3 112.2 24.5 57.4 35.8 Adj. EBIT 16.6 21.8 -9.3 28.9 -8.3 -36.1 25.5 7.3 24.1 9.7 24.7 18.7 401.6 -8.5 64.5 40.2 Pre Tax Profit -3.7 42.6 -24.0 61.1 -25.8 -29.2 -11.6 8.0 30.8 11.3 29.7 21.6 349.3 -25.2 55.6 47.9 Net Profit -13.9 43.3 -23.7 65.4 -36.4 -22.3 -23.3 5.6 30.8 11.3 29.7 21.6 345.0 -34.6 45.2 47.9 Diluted EPS -14.2 41.3 -23.6 64.8 -37.1 -27.2 -31.0 5.9 30.5 11.1 29.4 21.3 339.2 -42.0 35.4 46.5 Adj. Diluted EPS (ex-123R exp.) -7.6 38.7 -22.6 63.1 -35.1 -21.4 -15.3 6.9 20.8 8.1 22.2 17.0 367.4 -31.2 35.9 36.5 Source: Company and JPMorgan estimates. Note: We have included 123R share-based compensation adjustments starting 2006.

303
North America Equity Research 02 January 2008
Imran Khan (1-212) 622-6693 [email protected]
Table 203: The9 Annual Balance Sheet US$ in millions, year-end December FY06 FY07E FY08E FY09E Cash and Cash Equivalents 118.3 263.2 293.0 357.9 Account Receivables 1.3 3.9 5.6 6.3 Inventory 14.1 11.0 15.9 18.0 Total Other Current Assets 3.5 13.3 13.4 13.4 Total Current Assets 137.1 291.4 327.9 395.6 Gross Fixed Assets 44.8 94.8 146.0 206.0 Accumulated Depreciation (16.2) (33.8) (62.4) (105.7) Net Fixed Assets 28.7 61.0 83.6 100.3 Other Long Term Assets 34.6 40.9 51.0 40.6 Long Term Investments and Associates 4.5 19.7 19.4 19.0 Total Long Term Assets 67.8 121.5 154.0 159.8 Total Assets 204.9 412.9 482.0 555.4 ST Debt and Current Portion of LT Debt 4.6 - - - Accounts Payable 25.1 27.5 39.8 45.0 Other Current Liabilities 6.6 8.0 11.6 13.1 Total Current Liabilities 36.4 35.6 51.5 58.2 Long Term Debt - - - - Other Long Term Liabilities - - - - Total Long Term Liabilities - - - - Share Capital 0.3 0.3 0.3 0.3 Share Premium 118.8 299.5 314.4 325.8 Other Reserves 2.6 2.7 2.8 2.8 Retained Earnings 46.9 74.8 113.0 168.4 Preferred Stock - - - - Total Equity 168.5 377.3 430.5 497.3 Total Liabilities and Equity 204.9 412.9 482.0 555.4 Source: Company reports, JPMorgan estimates.
Table 204: The9 Annual Cash Flow Statement US$ in millions, year-end December FY06 FY07E FY08E FY09E Net Income 39.4 25.8 37.4 55.3 Add Non cash Expenses/(income) Depreciation and Amortization 21.0 28.2 44.9 61.9 Extraordinaries (0.4) - - - Other Non-Cash Items 2.5 6.8 10.0 10.0 Changes in Working Capital: - - - - (Increase)/Decrease Receivables 1.6 (2.5) (1.7) (0.7) (Increase)/Decrease Inventories (6.9) 3.7 (4.8) (2.1) (Increase)/Decrease Other Current Assets 1.9 (9.6) - - Increase/(Decrease) Payables 7.7 1.2 12.0 5.2 Increase/(Decrease) Other Current Liabilities (6.8) 1.1 3.5 1.5 Net Cash from Operations 60.1 54.7 101.3 131.1 Purchase of Property, Plant & Equipment (9.1) (47.5) (50.1) (60.0) Purchase/Sale of Other LT assets (5.7) (16.3) (26.4) (8.1) Purchase/Sale of Investments 2.1 (15.0) 0.5 0.5 Net Cash from Investing Activities (12.8) (78.8) (76.0) (67.6) Issuance/Repayment of Debt 1.2 (4.8) - - Change in other LT liabilities - - - - Change in Common Equity - net 10.4 168.5 1.4 1.4 Payment of Cash Dividends - - - - Other Financing Charges, Net (2.2) 0.0 0.0 0.0 Net Cash from Financing Activities 9.3 163.7 1.4 1.4 Net Change in Cash and Cash Equivalents 56.7 139.5 26.7 64.9 Cash at End of Period 118.3 263.2 293.0 357.9 Source: Company reports, JPMorgan estimates.

Appendix


307
North America Equity Research 02 January 2008
Imran Khan (1-212) 622-6693 [email protected]
Table 205: M&A Activity in the Internet Space, 2007 Ticker Date Target Acquirer Seller Announced
Total Payment
Type Deal
Status AMZN 5/14/2007 www.Dpreview.Com Amazon.com Inc NA Undisclosed Complete AMZN 5/23/2007 Brilliance Audio Inc Amazon.com Inc NA Cash Complete CNET 10/25/2007 Webshots American Greetings Corp Cnet Networks Inc 45 Cash Complete CNET 11/5/2007 Findarticles.Com CNET Neworks Looksmart 20.5 Cash Pending DRIV 9/5/2007 Netgiro Systems Ab Digital River Inc Netgiro International Ab 27 Cash Complete EBAY 1/10/2007 Stubhub eBay 310 Cash Complete EBAY 2/27/2007 Beijing Union Mobile Pay Ltd eBay 105 Cash Pending EBAY 5/3/2007 Gittigidiyor.Com eBay NA Cash Complete EBAY 5/30/2007 Stumbleupon Inc eBay 75 Cash Complete EBAY 10/4/2007 Via-Online Gmbh eBay NA Cash Complete EBAY 12/20/2007 Tom Online Inc eBay NA Undisclosed Pending ELNK 3/7/2007 Wifi Network Earth Link City Of Corpus Christi Tx NA Cash Pending EXPE 12/8/2006 Expedia Inc Expedia Inc Shareholders 660 Complete EXPE 2/28/2007 Smarter Travel Media Llc Expedia Inc NA Undisclosed Complete EXPE 5/23/2007 Independent Traveler Inc Expedia Inc NA Undisclosed Complete EXPE 6/19/2007 Expedia Inc Expedia Inc Shareholders 725 Complete GOOG 10/31/2006 Jotspot Inc Google NA Undisclosed Complete GOOG 1/4/2007 Shenzen Xunlei Netwk Tech Google NA Undisclosed Complete GOOG 3/16/2007 Adscape Media Inc Google NA Undisclosed Complete GOOG 4/13/2007 Doubleclick Google Multiple Sellers 3100 Cash Pending GOOG 4/17/2007 Tonic Systems Google NA Undisclosed Complete GOOG 4/20/2007 Video Conf. Software Google Marratech Ab NA Cash Complete GOOG 5/29/2007 Greenborder Tech Ltd Google NA Undisclosed Complete GOOG 5/31/2007 Panoramio.Com Google 7 Cash Pending GOOG 6/1/2007 Feedburner Inc Google NA Undisclosed Complete GOOG 6/6/2007 Peakstream Inc Google NA Undisclosed Complete GOOG 6/20/2007 Zenter Google NA Undisclosed Complete GOOG 7/2/2007 Grandcentral Communicat. Google NA Undisclosed Complete GOOG 7/9/2007 Postini Google 625 Cash Pending GOOG 7/19/2007 Beijing Feixiangren Informat Google NA Undisclosed Complete GOOG 9/28/2007 Zingku Google NA Undisclosed Complete GOOG 10/9/2007 Jaiku Ltd Google NA Undisclosed Complete GOOG 10/26/2007 Web Search Patent Google Invenda Corp Reg 2 Cash Pending GOOG 12/18/2007 Endoxon Google NA Undisclosed Complete IACI 12/20/2006 Ilike.Com IAC/ Interactive corp NA Complete IACI 2/27/2007 Edodo.Com IAC/ Interactive corp NA Complete IACI 2/27/2007 Netclub IAC/ Interactive corp NA Complete IACI 3/1/2007 Insider Pages IAC/ Interactive corp NA Pending IACI 3/19/2007 Echomusic IAC/ Interactive corp NA Complete IACI 4/19/2007 Rqi Holdings Ltd IAC/ Interactive corp Gaylord Entertainment Co 109.12 Complete IACI 5/9/2007 Home Shopping Eur. Gmbh Arcandor AG Iac/ Interactive Corp 196.47 Complete IACI 5/17/2007 Front Line Mgmt IAC/ Interactive corp NA Complete IACI 5/24/2007 Emma Enterntainment Hold IAC/ Interactive corp NA Complete IACI 7/2/2007 Paciolon IAC/ Interactive corp NA Pending INCX 7/19/2007 Permierguide Inc LOCAL.COM Corp 2 Cash Complete INSP 1/25/2007 Atlas Mobile Inc Twistbox Entertainment Inc Infospace Inc NA Undisclosed Pending INSP 9/17/2007 Switchboard.Com Idearc Inc Infospace Inc 225 Cash Pending INSP 10/15/2007 Mobile Services Business Motricity Inc Infospace Inc 135 Cash Pending INWK 10/11/2006 About Applied Graphics Inc Innerworkings Inc NA Undisclosed Complete INWK 3/8/2007 Spectrum Printing Systems Innerworkings Inc 3.35 Cash Complete INWK 7/9/2007 Brown Partners Innerworkings Inc NA Undisclosed Complete INWK 11/12/2007 Data Flow Media Sys, LP Innerworkings Inc NA Undisclosed Complete INWK 11/12/2007 Graphic Resource Group Innerworkings Inc NA Undisclosed Complete JUPM 12/28/2006 Justtechjobs.Com Jupiter Media Corp NA Cash Complete JUPM 1/18/2007 Studiocutz.Com Jupiter Media Corp Mediatone Music Inc NA Cash Complete JUPM 1/30/2007 Ispcon Trade Shows Jupiter Media Corp Golden Group Inc NA Cash Complete JUPM 1/30/2007 Inbox Trade Shows Jupiter Media Corp Golden Group Inc NA Cash Complete JUPM 6/6/2007 Multiple Targets Jupiter Media Corp NA Cash Complete JUPM 7/18/2007 Mediabistro.Com Inc Jupiter Media Corp 20 Cash Complete LINTA 12/22/2006 News Corp Cl A News Corp L A Liberty Media Interactive A 550 Cash Pending LINTA 2/13/2007 Unnamed Target Liberty Media Interactive A Cbs Corp Class B 68.09 Stock Complete LINTA 5/9/2007 Liberty Media Interactive A Liberty Media Interactive A Shareholders 484.47 Complete LINTA 5/11/2007 Backcountry.Com Liberty Media Interactive A NA Cash Pending LINTA 8/15/2007 Borba Llc Liberty Media Interactive A NA Undisclosed Complete

308
North America Equity Research 02 January 2008
Imran Khan (1-212) 622-6693 [email protected]
MCHX 8/9/2007 Voicestar Marchex INC CLASS B 21.82 Cash & Stock Complete MELI 10/1/2001 Ibazar Com Br Ltda MercadoLibre Inc Ebay Inc NA Stock Complete MELI 11/13/2005 Deremate.Com MercadoLibre Inc NA Undisclosed Complete MNST 1/17/2007 Arbeidskamerater As Monster Worldwide NA Undisclosed Complete MSFT 5/18/2007 Aquantive Microsoft 5460.65 Cash Complete MSFT 8/30/2007 Screentonic Microsoft NA Undisclosed Complete MSFT 10/3/2007 Jellyfish.Com Microsoft NA Undisclosed Complete MSFT 10/7/2007 Newsvine Inc MULTIPLE ACQUIRERS NA Undisclosed Complete MSFT 10/24/2007 Facebook Inc Microsoft 240 Cash Pending MSFT 11/12/2007 Musicwave Microsoft Openwave Systems 50 Cash Pending OMTR 1/18/2007 Instadia Omniture Inc 14.41 Cash Complete OMTR 2/14/2007 Touch Clarity Omniture Inc 48.5 Cash Pending OMTR 9/7/2007 Offermatica Omniture Inc 65 Cash & Stock Pending OMTR 10/25/2007 Visual Sciences Inc Omniture Inc 390.27 Cash & Stock Pending OSTK 4/25/2007 Otravel.Com Inc MULTIPLE ACQUIRERS Overstock.Com Inc 17 Cash Complete PCLN 11/8/2007 Agoda Co Priceline.com Inc NA Cash Complete RNWK 5/16/2007 Sony Netservices Gmbh Real Networks Inc Sony Corp NA Undisclosed Pending RNWK 8/21/2007 Viacom Inc Class B Real Networks Inc NA Undisclosed Pending RNWK 9/27/2007 Game Trust Inc Real Networks Inc NA Undisclosed Pending SFLY 6/27/2007 Make It About Me! Shutterfly NA Undisclosed Complete SOLD 11/5/2007 Realty Generator Housevalues NA Undisclosed Complete TFSM 5/17/2007 24/7 Real Media Inc WPP Group PLC 580.67 Cash Complete TOMO 3/12/2007 Tom Online Inc Tom Group Online 283.94 Cash Complete TOMO 12/20/2007 Tom Online Inc eBay NA Undisclosed Pending VCLK 12/4/2006 Shopping.Net ValueClick Inc 26.28 Cash Complete VCLK 7/16/2007 Mezimedia Inc ValueClick Inc 100 Cash Pending YHOO 1/9/2007 Mybloglog Yahoo! Inc Complete YHOO 4/24/2007 Overture Kk YAHOO! JAPAN CORP Yahoo! Inc NA Undisclosed Pending YHOO 4/30/2007 Right Media Inc Yahoo! Inc 340 Cash & Stock Complete YHOO 6/21/2007 Rivals.Com Yahoo! Inc NA Undisclosed Pending YHOO 9/4/2007 Bluelithium Inc Yahoo! Inc 300 Cash Complete YHOO 9/12/2007 Speedcast Holdings Ltd Asia Satellite Telecom Hldg Multiple Sellers 2.96 Cash Complete YHOO 9/14/2007 Buzztracker.Com Yahoo! Inc Participate Media NA Cash Complete YHOO 9/17/2007 Zimra Inc Yahoo! Inc 350 Undisclosed Pending Source: Bloomberg, company reports, news reports.
309
North America Equity Research 02 January 2008
Imran Khan (1-212) 622-6693 [email protected]
Analyst Certification: The research analyst(s) denoted by an “AC” on the cover of this report certifies (or, where multiple research analysts are primarily responsible for this report, the research analyst denoted by an “AC” on the cover or within the document individually certifies, with respect to each security or issuer that the research analyst covers in this research) that: (1) all of the views expressed in this report accurately reflect his or her personal views about any and all of the subject securities or issuers; and (2) no part of any of the research analyst’s compensation was, is, or will be directly or indirectly related to the specific recommendations or views expressed by the research analyst(s) in this report.
Important Disclosures for Asian Companies
• Market Maker: JPMSI makes a market in the stock of Baidu.com, China Finance Online, Netease, Ninetowns Internet Technology Group Co. Ltd., Shanda Interactive Entertainment Ltd, Sina Corp, Sohu.Com, The9 Limited.
• Market Maker/ Liquidity Provider: JPMSL and/or an affiliate is a market maker and/or liquidity provider in Sina Corp, Sohu.Com.
• Lead or Co-manager: JPMSI or its affiliates acted as lead or co-manager in a public offering of equity and/or debt securities for Ninetowns Internet Technology Group Co. Ltd. within the past 12 months.
• Client of the Firm: China Finance Online is or was in the past 12 months a client of JPMSI. Netease is or was in the past 12 months a client of JPMSI. Ninetowns Internet Technology Group Co. Ltd. is or was in the past 12 months a client of JPMSI; during the past 12 months, JPMSI provided to the company investment banking services. Shanda Interactive Entertainment Ltd is or was in the past 12 months a client of JPMSI. Sohu.Com is or was in the past 12 months a client of JPMSI; during the past 12 months, JPMSI provided to the company non-investment banking securities-related service and non-securities-related services.
• Investment Banking (past 12 months): JPMSI or its affiliates received in the past 12 months compensation for investment banking services from Ninetowns Internet Technology Group Co. Ltd..
• Investment Banking (next 3 months): JPMSI or its affiliates expect to receive, or intend to seek, compensation for investment banking services in the next three months from China Finance Online, Ninetowns Internet Technology Group Co. Ltd..
• Non-Investment Banking Compensation: JPMSI has received compensation in the past 12 months for products or services other than investment banking from Sohu.Com. An affiliate of JPMSI has received compensation in the past 12 months for products or services other than investment banking from China Finance Online, Ninetowns Internet Technology Group Co. Ltd., Shanda Interactive Entertainment Ltd, Sohu.Com.
Important Disclosures for US Equity Research Compendium Reports: Important disclosures, including price charts for all companies under coverage for at least one year, are available through the search function on JP Morgan’s website https://mm.jpmorgan.com/disclosures/company or by calling this U.S. toll-free number (1-800-477-0406).
Explanation of Equity Research Ratings and Analyst(s) Coverage Universe: JPMorgan uses the following rating system: Overweight [Over the next six to twelve months, we expect this stock will outperform the average total return of the stocks in the analyst’s (or the analyst’s team’s) coverage universe.] Neutral [Over the next six to twelve months, we expect this stock will perform in line with the average total return of the stocks in the analyst’s (or the analyst’s team’s) coverage universe.] Underweight [Over the next six to twelve months, we expect this stock will underperform the average total return of the stocks in the analyst’s (or the analyst’s team’s) coverage universe.] The analyst or analyst’s team’s coverage universe is the sector and/or country shown on the cover of each publication. See below for the specific stocks in the certifying analyst(s) coverage universe.
Coverage Universe: Imran Khan: Amazon.com (AMZN), Blue Nile (NILE), CNET Networks (CNET), Dice Holdings, Inc. (DHX), Expedia, Inc. (EXPE), Google (GOOG), HouseValues, Inc (SOLD), InfoSpace Inc (INSP), InnerWorkings (INWK), InterActiveCorp (IACI), Liberty Interactive (LINTA), Mercadolibre, Inc. (MELI), Monster Worldwide Inc (MNST), Move (MOVE), News Corporation, Inc. (NWSa), Omniture, Inc. (OMTR), Orbitz Worldwide, Inc. (OWW), Priceline.com (PCLN), Shutterfly, Inc. (SFLY), The Walt Disney Co. (DIS), Time Warner (TWX), ValueClick (VCLK), Viacom Inc (VIAb), Xinhua Finance Media (XFML), Yahoo Inc (YHOO), eBay, Inc (EBAY)
Dick Wei: Baidu.com (BIDU), China Finance Online (JRJC), Netease (NTES), Ninetowns Internet Technology Group Co. Ltd. (NINE), Shanda Interactive Entertainment Ltd (SNDA), Sina Corp (SINA), Sohu.Com (SOHU), The9 Limited (NCTY)

310
North America Equity Research 02 January 2008
Imran Khan (1-212) 622-6693 [email protected]
JPMorgan Equity Research Ratings Distribution, as of September 28, 2007
Overweight (buy)
Neutral (hold)
Underweight (sell)
JPM Global Equity Research Coverage 46% 40% 14% IB clients* 51% 50% 38% JPMSI Equity Research Coverage 42% 46% 12% IB clients* 70% 63% 49%
*Percentage of investment banking clients in each rating category. For purposes only of NASD/NYSE ratings distribution rules, our Overweight rating falls into a buy rating category; our Neutral rating falls into a hold rating category; and our Underweight rating falls into a sell rating category.
Valuation and Risks: Please see the most recent company-specific research report for an analysis of valuation methodology and risks on any securities recommended herein. Research is available at http://www.morganmarkets.com , or you can contact the analyst named on the front of this note or your JPMorgan representative.
Analysts’ Compensation: The equity research analysts responsible for the preparation of this report receive compensation based upon various factors, including the quality and accuracy of research, client feedback, competitive factors, and overall firm revenues, which include revenues from, among other business units, Institutional Equities and Investment Banking.
Other Disclosures
Options related research: If the information contained herein regards options related research, such information is available only to persons who have received the proper option risk disclosure documents. For a copy of the Option Clearing Corporation’s Characteristics and Risks of Standardized Options, please contact your JPMorgan Representative or visit the OCC’s website at http://www.optionsclearing.com/publications/risks/riskstoc.pdf.
Legal Entities Disclosures U.S.: JPMSI is a member of NYSE, FINRA and SIPC. J.P. Morgan Futures Inc. is a member of the NFA. JPMorgan Chase Bank, N.A. is a member of FDIC and is authorized and regulated in the UK by the Financial Services Authority. U.K.: J.P. Morgan Securities Ltd. (JPMSL) is a member of the London Stock Exchange and is authorised and regulated by the Financial Services Authority. Registered in England & Wales No. 2711006. Registered Office 125 London Wall, London EC2Y 5AJ. South Africa: J.P. Morgan Equities Limited is a member of the Johannesburg Securities Exchange and is regulated by the FSB. Hong Kong: J.P. Morgan Securities (Asia Pacific) Limited (CE number AAJ321) is regulated by the Hong Kong Monetary Authority and the Securities and Futures Commission in Hong Kong. Korea: J.P. Morgan Securities (Far East) Ltd, Seoul branch, is regulated by the Korea Financial Supervisory Service. Australia: J.P. Morgan Australia Limited (ABN 52 002 888 011/AFS Licence No: 238188) is regulated by ASIC and J.P. Morgan Securities Australia Limited (ABN 61 003 245 234/AFS Licence No: 238066) is a Market Participant with the ASX and regulated by ASIC. Taiwan: J.P.Morgan Securities (Taiwan) Limited is a participant of the Taiwan Stock Exchange (company-type) and regulated by the Taiwan Securities and Futures Bureau. India: J.P. Morgan India Private Limited is a member of the National Stock Exchange of India Limited and The Stock Exchange, Mumbai and is regulated by the Securities and Exchange Board of India. Thailand: JPMorgan Securities (Thailand) Limited is a member of the Stock Exchange of Thailand and is regulated by the Ministry of Finance and the Securities and Exchange Commission. Indonesia: PT J.P. Morgan Securities Indonesia is a member of the Jakarta Stock Exchange and Surabaya Stock Exchange and is regulated by the BAPEPAM. Philippines: J.P. Morgan Securities Philippines Inc. is a member of the Philippine Stock Exchange and is regulated by the Securities and Exchange Commission. Brazil: Banco J.P. Morgan S.A. is regulated by the Comissao de Valores Mobiliarios (CVM) and by the Central Bank of Brazil. Mexico: J.P. Morgan Casa de Bolsa, S.A. de C.V., J.P. Morgan Grupo Financiero is a member of the Mexican Stock Exchange and authorized to act as a broker dealer by the National Banking and Securities Exchange Commission. Singapore: This material is issued and distributed in Singapore by J.P. Morgan Securities Singapore Private Limited (JPMSS) [mica (p) 030/09/2007 and Co. Reg. No.: 199405335R] which is a member of the Singapore Exchange Securities Trading Limited and is regulated by the Monetary Authority of Singapore (MAS) and/or JPMorgan Chase Bank, N.A., Singapore branch (JPMCB Singapore) which is regulated by the MAS. Malaysia: This material is issued and distributed in Malaysia by JPMorgan Securities (Malaysia) Sdn Bhd (18146-x) which is a Participating Organization of Bursa Malaysia Securities Bhd and is licensed as a dealer by the Securities Commission in Malaysia. Pakistan: J. P. Morgan Pakistan Broking (Pvt.) Ltd is a member of the Karachi Stock Exchange and regulated by the Securities and Exchange Commission of Pakistan.
Country and Region Specific Disclosures U.K. and European Economic Area (EEA): Issued and approved for distribution in the U.K. and the EEA by JPMSL. Investment research issued by JPMSL has been prepared in accordance with JPMSL’s Policies for Managing Conflicts of Interest in Connection with Investment Research which outline the effective organisational and administrative arrangements set up within JPMSL for the prevention and avoidance of conflicts of interest with respect to research recommendations, including information barriers, and can be found at http://www.jpmorgan.com/pdfdoc/research/ConflictManagementPolicy.pdf. This report has been issued in the U.K. only to persons of a kind described in Article 19 (5), 38, 47 and 49 of the Financial Services and Markets Act 2000 (Financial Promotion) Order 2005 (all such persons being referred to as "relevant persons"). This document must not be acted on or relied on by persons who are not relevant persons. Any investment or investment activity to which this document relates is only available to relevant persons and will be engaged in only with relevant persons. In other EEA countries, the report has been issued to persons regarded as professional investors (or equivalent) in their home jurisdiction Germany:

311
North America Equity Research 02 January 2008
Imran Khan (1-212) 622-6693 [email protected]
This material is distributed in Germany by J.P. Morgan Securities Ltd. Frankfurt Branch and JPMorgan Chase Bank, N.A., Frankfurt Branch who are regulated by the Bundesanstalt für Finanzdienstleistungsaufsicht. Australia: This material is issued and distributed by JPMSAL in Australia to “wholesale clients” only. JPMSAL does not issue or distribute this material to “retail clients.” The recipient of this material must not distribute it to any third party or outside Australia without the prior written consent of JPMSAL. For the purposes of this paragraph the terms “wholesale client” and “retail client” have the meanings given to them in section 761G of the Corporations Act 2001. Hong Kong: The 1% ownership disclosure as of the previous month end satisfies the requirements under Paragraph 16.5(a) of the Hong Kong Code of Conduct for persons licensed by or registered with the Securities and Futures Commission. (For research published within the first ten days of the month, the disclosure may be based on the month end data from two months’ prior.) J.P. Morgan Broking (Hong Kong) Limited is the liquidity provider for derivative warrants issued by J.P. Morgan International Derivatives Ltd and listed on The Stock Exchange of Hong Kong Limited. An updated list can be found on HKEx website: http://www.hkex.com.hk/prod/dw/Lp.htm. Japan: There is a risk that a loss may occur due to a change in the price of the shares in the case of share trading, and that a loss may occur due to the exchange rate in the case of foreign share trading. In the case of share trading, JPMorgan Securities Japan Co., Ltd., will be receiving a brokerage fee and consumption tax (shouhizei) calculated by multiplying the executed price by the commission rate which was individually agreed between JPMorgan Securities Japan Co., Ltd., and the customer in advance. Financial Instruments Firms: JPMorgan Securities Japan Co., Ltd., Kanto Local Finance Bureau (kinsho) No. [82] Participating Association / Japan Securities Dealers Association, The Financial Futures Association of Japan. Korea: This report may have been edited or contributed to from time to time by affiliates of J.P. Morgan Securities (Far East) Ltd, Seoul branch. Singapore: JPMSI and/or its affiliates may have a holding in any of the securities discussed in this report; for securities where the holding is 1% or greater, the specific holding is disclosed in the Legal Disclosures section above. India: For private circulation only not for sale. Pakistan: For private circulation only not for sale. New Zealand: This material is issued and distributed by JPMSAL in New Zealand only to persons whose principal business is the investment of money or who, in the course of and for the purposes of their business, habitually invest money. JPMSAL does not issue or distribute this material to members of "the public" as determined in accordance with section 3 of the Securities Act 1978. The recipient of this material must not distribute it to any third party or outside New Zealand without the prior written consent of JPMSAL.
General: Additional information is available upon request. Information has been obtained from sources believed to be reliable but JPMorgan Chase & Co. or its affiliates and/or subsidiaries (collectively JPMorgan) do not warrant its completeness or accuracy except with respect to any disclosures relative to JPMSI and/or its affiliates and the analyst’s involvement with the issuer that is the subject of the research. All pricing is as of the close of market for the securities discussed, unless otherwise stated. Opinions and estimates constitute our judgment as of the date of this material and are subject to change without notice. Past performance is not indicative of future results. This material is not intended as an offer or solicitation for the purchase or sale of any financial instrument. The opinions and recommendations herein do not take into account individual client circumstances, objectives, or needs and are not intended as recommendations of particular securities, financial instruments or strategies to particular clients. The recipient of this report must make its own independent decisions regarding any securities or financial instruments mentioned herein. JPMSI distributes in the U.S. research published by non-U.S. affiliates and accepts responsibility for its contents. Periodic updates may be provided on companies/industries based on company specific developments or announcements, market conditions or any other publicly available information. Clients should contact analysts and execute transactions through a JPMorgan subsidiary or affiliate in their home jurisdiction unless governing law permits otherwise.
“Other Disclosures” last revised December 10, 2007.
Copyright 2007 JPMorgan Chase & Co. All rights reserved. This report or any portion hereof may not be reprinted, sold or redistributed without the written consent of JPMorgan.

Imran Khan (1-212) 622-6693 [email protected]
North America Equity Research 02 January 2008
Imran Khan and the JPMorgan Internet, Media and Entertainment team Imran Khan Imran Khan is a Managing Director and the Senior Internet, Media and Entertainment Analyst at JPMorgan. Mr. Khan ranked #2 for Internet in the Institutional Investor All America Research Poll in 2005, 2006, and 2007. Additionally, he has been consistently recognized as one of the top Internet analysts in the Greenwich Research Poll since 2005. Mr. Khan has authored several widely read research reports, including past editions of the Nothing But Net report, as well as “The Rise of Ad Networks” and “Large Cap Courtship and Consolidation”. Mr. Khan is a sought-after speaker and has presented at leading industry conferences such as Ad-Tech, Red Herring, AlwaysOn, and Young & Rubicam Digital Day. Mr. Khan has also received invitations as a guest speaker at multiple universities.
Mr. Khan came to JPMorgan in 2004 after three years at Fulcrum Global Partners, where he was a Managing Director in Equity Research covering Internet and Software. Prior to Fulcrum, Mr. Khan worked as an investment banker at ING, covering Telecom. Before ING, he worked for Wild Blue, a satellite start-up company.
Bridget Weishaar Bridget Weishaar joined the JPMorgan Internet, Media and Entertainment team in 2006. Prior to JPMorgan, Ms. Weishaar was a member of the Retail team at Bear Stearns, which ranked #1 in the Institutional Investor All America Research Poll in 2005. Ms. Weishaar obtained her MBA at the Wharton School, University of Pennsylvania, and holds a B.S. from the University of Notre Dame.
Joseph Boushelle Joe Boushelle joined the JPMorgan Internet, Media and Entertainment team in 2007. Previously, Mr. Boushelle covered the oil and gas sector for a credit trading group. Mr. Boushelle is a CFA charterholder, and received an M.B.A. with distinction from Cornell University and a B.A. in Economics from the University of Chicago.
Lev Polinsky Lev Polinsky joined the JPMorgan Internet, Media and Entertainment team in 2006. Prior to JPMorgan, Mr. Polinsky was a trader at Susquehanna Investment Group, covering a variety of industries. Mr. Polinsky is a CFA charterholder, and received an A.B. in Economics from Harvard University.
Vasily Karasyov Vasily Karasyov joined the JPMorgan Internet, Media and Entertainment team in 2006, focusing on Media and Entertainment companies. Prior to JPMorgan, he was an Executive Director, Corporate Development at Sony Pictures, where he worked on M&A and financing transactions, as well as strategic planning in film, television, home entertainment and new media. Mr. Karasyov holds an MBA from INSEAD.
Dick Wei Dick Wei’s primary research focus is on China Internet. In addition, he is also responsible for global technology research. Prior to joining JPMorgan in 2002, Mr. Wei worked with Merrill Lynch in the Hong Kong and New York offices. He was also a design engineer at Quantum Corporation (acquired by Maxtor). Mr. Wei graduated with an MBA from the Wharton School and obtained his M.Sc. degree in mechanical engineering from Stanford University.