Climate Change, Streamflows, and Water Management Implications in the Upper Rio Grande Watershed

DOI: 10.15233/gfz.2018.35.3 Original scientific paper
UDC 556.5
Trend analysis of monthly streamflows using Şen’s innovative trend method
Özgür Kişi 1, Celso Augusto Guimarães Santos 2, Richarde Marques da Silva 3
and Mohammad Zounemat-Kermani 4
1* Faculty of Natural Sciences and Engineering, Ilia State University, Tbilisi, Georgia2 Department of Civil and Environmental Engineering, Federal University of Paraíba,
Paraíba, Brazil3 Department of Geosciences, Federal University of Paraíba, Paraíba, Brazil
4 Department of Water Engineering, Shahid Bahonar University of Kerman, Kerman, Iran
Received 20 June 2017, in final form 17 December 2017
Trend analysis of monthly mean streamflows is essential for better water resources management and planning. In this study, Mann Kendall (MK), Sen’s method and Şen’s innovative trend method (ITM) were employed in order to examine the possible trends of monthly streamflows obtained from nine stations from three basins (Yakabasi and Derecikviran in Western Black Sea Basin; Durucasu, Sütlüce, Kale and Gomeleonu in Yesilirmak Basin; Şimşirli, Tozköy and Topluca in Eastern Black Sea Basin) located in Black Sea Region of Turkey. Based on the MK, streamflow data of Tozköy Station which is located in west-ern part of the Eastern Black Sea Region showed a significantly increasing trend while a significantly decreasing trend was found for the Yakabasi, Der-ecikviran, Durucasu and Sütlüce stations which are situated in western part of the Black Sea Region. According to the Sen’s trend method, a significantly decreasing trend was seen in Durucasu, Sütlüce, Yakabasi and Derecikviran stations while Tozköy station showed significantly increasing trend. According to the ITM, low-medium values of Tozköy Station indicated slightly increasing trend while low and medium streamflow values of Yakabasi, Derecikviran, Durucasu and Sütlüce stations showed a decreasing trend. High streamflow values of Derecikviran and Sütlüce stations showed a decreasing trend while corresponding values of Yakabasi, Şimşirli and Tozköy stations indicated an increasing trend. It was showed that trends of low, medium, and high data can be easily identified by ITM which has some advantages (having no assumption such as serial relationship, non-normality, and, test number) over the Sen’s method and Mann-Kendall test.
Keywords: monthly mean streamflows, trend analysis, Mann-Kendall, Sen’s method, innovative trend method
GEOFIZIKA VOL. 35 2018

54 Ö. KIŞI ET AL.: TREND ANALYSIS OF MONTHLY STREAMFLOWS USING ŞEN’S INNOVATIVE ...
1. Introduction
Observation of the streamflows data is one of the most important issues in water resources planning, management and designing related projects. There are many factors such as climate change and anthropogenic activities which are effective on time-dependent streamflow data. Identifying possible trends in his-torical streamflow data is one of the main steps in water resources. Decision on water management and policies is mainly affected by a detection of a significant trend in streamflow (Yenigun et al. 2008).
There are numerous studies related to trend analysis of hydro-meteorologi-cal time series (Kahya and Kalayci, 2004; Cigizoglu et al., 2005; Topaloglu, 2006; Yenigün et al., 2008; Kim and Jain, 2010; Tabari and Marofi, 2010; Tabari and Talaee, 2011; Eris and Agiralioglu, 2012; Shadmani et al., 2012; Unal et al., 2012; Tabari et al., 2012; Palizdan et al., 2014; Sayemuzzaman and Jha, 2014; Silva et al., 2015; Santos et al., 2018a,b). Kahya and Kalayci (2004) used non-paramet-ric Spearman’s Rho, Sen’s T, MK, and the Seasonal Kendall trend tests for exam-ining the possible trends in monthly flows of Turkey. They showed that basins situated in western Turkey generally exhibited decreasing trend, significant at the 0.05 or lower level, while the basins situated in eastern part of Turkey showed no trend. Cigizoglu et al. (2005) examined the possible trends in high, mean, and low streamflows of some rivers in Turkey. They used nonparametric MK test and parametric t test. They indicated that flows showed a decreasing trend except at a few stations. Topaloglu (2006) utilized the MK for identifying possible trend in annual minimum, mean and maximum streamflows and monthly mean stream-flows in 26 basins of Turkey. He reported that of the 26 basins, only basins with the number of 14–16 and 22–25 showed significant upward trend for small num-ber of stations situated mostly in the Black Sea, Central and Eastern Anatolia regions. Yenigün et al. (2008) investigated the trends in streamflow of the Eu-phrates basin, Turkey, by using non-parametric trend tests (MK and Spearman’s rho). They found that there were significant decreasing trends in six stations and an upward trend for only one station. Kim and Jain (2010) employed a quantile regression methodology for a regional analysis of the changes in streamflow sea-sonality. Eris and Agiralioglu (2012) investigated the trend analysis of hydro-me-teorological time series from Eastern Black Sea Region of Turkey using MK test. They used annual precipitation data of 38 stations and flow data of 40 stations. For annual flow data, they found no trend in 35 stations while the remaining stations showed significant trends. Unal et al. (2012) examined the temporal and spatial variability of precipitations in Turkey and the results showed that there were decreasing trends in annual precipitations dominating throughout Anato-lia, including west, and southwest sections.
Recently, innovative trend method (ITM) first proposed by Şen (2012) has been succesfully applied in hydrological time series (Şen, 2014; Kişi and Ay, 2014; Haktanir and Citakoglu, 2014; Ay and Kişi, 2015). Şen (2012) proposed ITM and

GEOFIZIKA, VOL. 35, NO. 1, 2018, 53–68 55
applied to annual total precipitation and streamflow time series of some stations in Turkey. Şen (2014) applied ITM to set of temperature records from the Mar-mara region in Turkey and he reported that this new method did not have any restriction, and it was applicable whether the time series was serially correlated, nonnormally distributed, or had short record length. Kişi and Ay (2014) applied Mann-Kendall and ITM for water quality parameters of the Kizilirmak River, Turkey. Haktanir and Citakoglu (2014) used innovative trend method, MK and linear regression trend, von Neumann independence, Wald-Wolfowitz stationar-ity, and Mann-Whitney homogeneity tests for trends of maximum rainfall series of standard durations recorded in Turkey. The test results indicated that almost 90% of all annual maximum rainfall series were trend free, stationary, indepen-dent, and homogeneous at 5% probability. Ay and Kişi (2015) investigated the trends of monthly total precipitations of Black Sea and Central Anatolia regions, Turkey by using MK and ITM. They have succesfully evaluated the trends of low, medium and high precipitations using ITM. According to the our best knowledge, there is no published study related to use of ITM in trend analysis of streamflows. In the current study, ITM was also used to examine the possible trends in low, medium and high monthly streamflow values. The main goal of the study is to investigate the trends of long term streamflow data of Black Sea Region, Turkey using MK, Sen’s method and ITM. The next section briefly de-scribes the case study and trend methods used in the analysis. The 3rd section gives the trend analsysis results and discussion. The conclusions derived from the analaysis is provided in the last section.
2. Materials and methods
2.1. Case studyIn the study, monthly mean streamflow data from nine stations, Yakabasi,
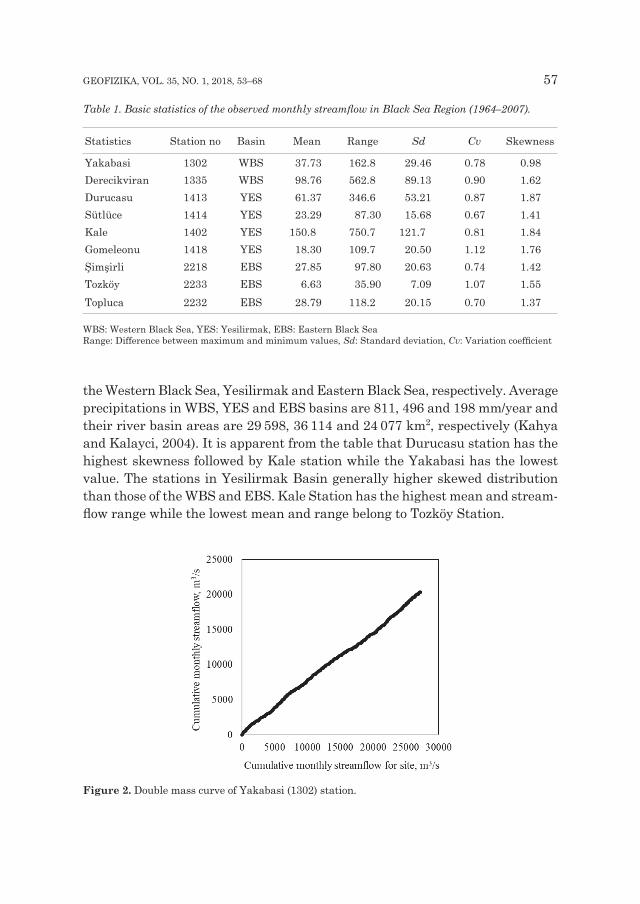
Derecikviran, Durucasu, Sütlüce, Kale, Gomeleonu, Şimşirli, Tozköy and Toplu-ca, Black Sea Region of Turkey (Fig. 1) were used. Data cover the period of 1964-2007 without any gap or missing values. Double mass curve method (DMCM) was applied for seeing the homogeneity of each data set (Searcy and Hardison, 1960). According to the graphical DMCM, all streamflow data were found to be homogeneous. As an example, the curve of the Yakabasi (1302) station is shown in Fig. 2. The straight line indicates homogeneity of the data. The Black Sea coast has the highest rainfall amount in Turkey. Its eastern part receives 2 200 millimeters annual rainfall and is the only region in the country that collects rainfall throughout the year. The climate of this region is wet and humid (gen-erally winter 4 °C and summer 22 °C). Annual mean total rainfall is 842 mm and 19.4% of this is contributed by summer precipitations. Annual mean relative humidity is very high, 71% (Sensoy et al., 2008). Basic statistics of the used streamflow data are provided in Tab. 1 for each station. The stations’ numbers and basins are also included in the table. In the table, WBS, YES and EBS indicate

56 Ö. KIŞI ET AL.: TREND ANALYSIS OF MONTHLY STREAMFLOWS USING ŞEN’S INNOVATIVE ...
Figu
re 1
. Geo
grap
hica
l loc
atio
n of
the
basi
ns a
nd s
tudi
ed s
tatio
ns (Y
akab
asi,
1302
; Der
ecik
vira
n,13
35; D
uruc
asu,
141
3; S
ütlü
ce, 1
414;
Kal
e,
1402
; Gom
eleo
nu, 1
418;
Şim
şirl
i, 22
18; T
ozkö
y, 2
233;
Top
luca
, 223
2) in
Bla
ck S
ea R
egio
n of
Tur
key.
GEOFIZIKA, VOL. 35, NO. 1, 2018, 53–68 57
the Western Black Sea, Yesilirmak and Eastern Black Sea, respectively. Average precipitations in WBS, YES and EBS basins are 811, 496 and 198 mm/year and their river basin areas are 29 598, 36 114 and 24 077 km2, respectively (Kahya and Kalayci, 2004). It is apparent from the table that Durucasu station has the highest skewness followed by Kale station while the Yakabasi has the lowest value. The stations in Yesilirmak Basin generally higher skewed distribution than those of the WBS and EBS. Kale Station has the highest mean and stream-flow range while the lowest mean and range belong to Tozköy Station.
Table 1. Basic statistics of the observed monthly streamflow in Black Sea Region (1964–2007).
Statistics Station no Basin Mean Range Sd Cv Skewness
Yakabasi 1302 WBS 37.73 162.8 29.46 0.78 0.98Derecikviran 1335 WBS 98.76 562.8 89.13 0.90 1.62Durucasu 1413 YES 61.37 346.6 53.21 0.87 1.87Sütlüce 1414 YES 23.29 87.30 15.68 0.67 1.41Kale 1402 YES 150.8 750.7 121.7 0.81 1.84Gomeleonu 1418 YES 18.30 109.7 20.50 1.12 1.76Şimşirli 2218 EBS 27.85 97.80 20.63 0.74 1.42Tozköy 2233 EBS 6.63 35.90 7.09 1.07 1.55Topluca 2232 EBS 28.79 118.2 20.15 0.70 1.37
WBS: Western Black Sea, YES: Yesilirmak, EBS: Eastern Black Sea Range: Difference between maximum and minimum values, Sd: Standard deviation, Cv: Variation coefficient
Figure 2. Double mass curve of Yakabasi (1302) station.

58 Ö. KIŞI ET AL.: TREND ANALYSIS OF MONTHLY STREAMFLOWS USING ŞEN’S INNOVATIVE ...
2.2. Trend tests
In this study, three different types of trend methods were applied for test. First, nonparametric Mann-Kendall trend test was used in order to examine the presence of a monotonic increasing or decreasing trends. Second, Şen’s method was applied to estimate the true slope of a linear trend (Gilbert, 1987). Finally, innovative trend method was considered to check the possible trends in low, medium and high streamflow data. The Mann-Kendall test is designed for mono-tonic cases and thus it is not suitable for cases with seasonal or other cycle data. In the Şen’s method, which uses a linear model to estimate the trend’s slope and the residuals’ variance, data should be constant in time. It should be noted that the Şen’s method is not highly affected by outliers or single data errors. The mentioned methods offer many advantages that have made them useful in ana-lyzing hydrological time series data.
2.2.1. Mann-Kendall test
The Mann-Kendall test is applied in cases when the time series data values xi are assumed to suit the following model
xi = f(ti) + εi (1)
where f(t) = a continuous monotonic time dependent function, εi = residuals which are assumed to be from the same distribution having zero mean. Therefore, it is expected that the distribution’s variance should be constant in time.
The aim is to test the null hypothesis of no trend, the null hypothesis (H0), i.e. the data xi is randomly ordered in time, versus the alternative hypothesis (H1) where an upward or downward monotonic trends exist. Hence, two statistics might be computed depending on the data length, the S statistics provided by Gilbert (1987) and the Z statistics. S test is utilized for the time series having data points less than 10, whereas normal approximation is utilized for the time series having 10 or more data points (n) (Kişi, 2015).
The Mann-Kendall test statistic S can be computed using the following for-mula:
1
1 1sgn( )n n
k jj k kS x x
-
= = += -å å (2)
In the above formula xj and xk are the data values at times j and k, j > k, respectively, and
1 if 0sgn( ) 0 if 0
1 if 0
k j
k j k j
k j
x xx x x x
x x
ì - >ïï- = - =íï- - <ïî
(3)

GEOFIZIKA, VOL. 35, NO. 1, 2018, 53–68 59
If data points are less than 10, the absolute value of S is compared with the theoretical distribution of MK (Gilbert, 1987). If the absolute value of S equals or exceeds a specific value Sα’/2 (which has the probability less than α’/2), then at certain probability level H0 is rejected.
It is worth noting that a positive S value represents an increasing trend whereas a negative value shows a decreasing trend. The significance level of 0.001 shows that there is a 0.1% probability that the values xi are from a random distribution and with that probability we make a mistake when H0 is rejected (Niazi et al., 2014).
If data points are more than 9 (which is the case of this research) the normal approximation test should be used. However, precaution should be taken when the number of data values is close to 10 as well as several tied values in the time series, the validity of normal approximation may be reduced, it may reduce the validity of the normal approximation.
For data points which are distributed identically and independently with a zero mean, the variance of S can be computed by the following equation
1
1( ) [ ( 1)(2 5) ( 1)(2 5)]18
qp p pp
VAR S n n n t t t=
= - + - - +å (4)
where q denotes the number of tied groups and tp represents the number of data values in the qth set. The statistic of the Mann–Kendall test, Z, can be computed considering the values of S and VAR(S) as below:
1 if 0( )
0 if 01 if 0( )
S SVAR S
Z SS S
VAR S
+ì >ïïï= =íï +ï <ïî
(5)
The presence of a trend’s significance is evaluated by computing the Z value. A positive/negative value of Z indicates an increasing/decreasing trend.
In a two-sided trend test, with α’ indicating the significance level, the null hypothesis is rejected if the |Z | > Z1 – α’/2, where Z1 – α’/2 is get from the standard normal cumulative distribution tables.
2.2.2. Sen’s methodThe nonparametric Sen’s method (Sen, 1968) is useful tool for estimating the
true slope of an existing linear trend. Therefore, f(t) in equation (1) is equivalent to
f(t) = Q t + B (6)

60 Ö. KIŞI ET AL.: TREND ANALYSIS OF MONTHLY STREAMFLOWS USING ŞEN’S INNOVATIVE ...
where Q stands for the slope and B is a constant. First, the slopes of all data pairs are calculated as below:
Qi = (xj – xk) / (j – k), j > k. (7)
In the above relation, N slopes can be calculated which estimate Qi (N = n (n – 1) / 2), n = data points. The median of these N values of Qi is the Sen’s estimator of slope. This method is valid for n as small as 10 unless there are many ties.
In this study, two frequent confidence levels α’ = 0.01 and α’ = 0.05 were ap-plied, bringing about two diverse confidence intervals. First Cα’ is computed as:
Ca’ = Z1 – a’/2 ( )VAR S (8)
In the above relation, Z1–a’/2 can be obtained from the standard normal dis-tribution.
Next, for calculating the lower and upper intervals of Q (Qmin and Qmax), M1 = (N – Cα’) / 2 and M2 = (N + Cα’) / 2 are calculated which are the M1
th largest and the (M2 + 1)th largest of the N ordered slope estimates Qi.
The median of xi – Q ti gives an estimate of B (Sirois, 1998). Similarly, esti-mation of the constant B of the 99% and 95% confidence intervals’ lines can be computed through the same methodology.
2.2.3. Innovative trend method
Innovative trend method (ITM), which is new trend analysis, was first in-troduced by Sen (2012). He claimed that commonly utilized Mann-Kendall and Spearman’s rho tests have some restrictive assumptions, for example, independ-ent structure of the time series, normal distribution, and data length (Kişi, 2015).
Figure 3. The innovative trend method proposed by Şen (2012).
GEOFIZIKA, VOL. 35, NO. 1, 2018, 53–68 61
In this method, time series is split into two equivalent sets. Both sets are indi-vidually sorted in ascending order. The first portion of the time series is placed on the horizontal x-axis, while the second 50% of the time series is placed on the vertical y-axis. The procedure of ITM is shown in Fig. 3 on the Cartesian coordi-nate system. Data points plotted on the 45° ideal line indicate no trend in the time series. There is an/a increasing/decreasing trend if data are placed on the upper/lower triangular area of the ideal line (Şen, 2012; Şen, 2014).
3. Results and discussion
3.1. Mann-Kendall
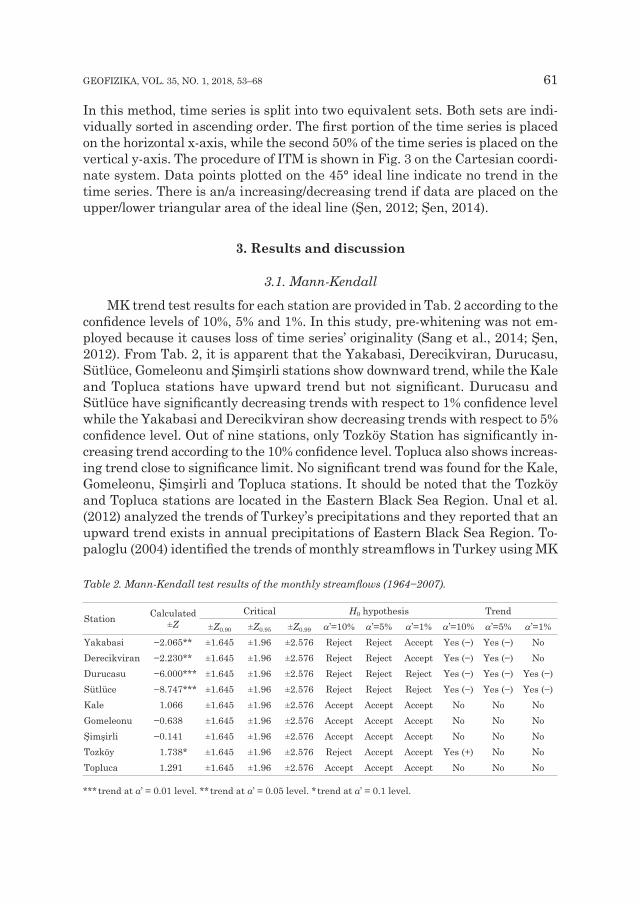
MK trend test results for each station are provided in Tab. 2 according to the confidence levels of 10%, 5% and 1%. In this study, pre-whitening was not em-ployed because it causes loss of time series’ originality (Sang et al., 2014; Şen, 2012). From Tab. 2, it is apparent that the Yakabasi, Derecikviran, Durucasu, Sütlüce, Gomeleonu and Şimşirli stations show downward trend, while the Kale and Topluca stations have upward trend but not significant. Durucasu and Sütlüce have significantly decreasing trends with respect to 1% confidence level while the Yakabasi and Derecikviran show decreasing trends with respect to 5% confidence level. Out of nine stations, only Tozköy Station has significantly in-creasing trend according to the 10% confidence level. Topluca also shows increas-ing trend close to significance limit. No significant trend was found for the Kale, Gomeleonu, Şimşirli and Topluca stations. It should be noted that the Tozköy and Topluca stations are located in the Eastern Black Sea Region. Unal et al. (2012) analyzed the trends of Turkey’s precipitations and they reported that an upward trend exists in annual precipitations of Eastern Black Sea Region. To-paloglu (2004) identified the trends of monthly streamflows in Turkey using MK
Table 2. Mann-Kendall test results of the monthly streamflows (1964−2007).
Station Calculated±Z
Critical H0 hypothesis Trend±Z0.90 ±Z0.95 ±Z0.99 a’=10% a’=5% a’=1% a’=10% a’=5% a’=1%
Yakabasi −2.065** ±1.645 ±1.96 ±2.576 Reject Reject Accept Yes (−) Yes (−) NoDerecikviran −2.230** ±1.645 ±1.96 ±2.576 Reject Reject Accept Yes (−) Yes (−) NoDurucasu −6.000*** ±1.645 ±1.96 ±2.576 Reject Reject Reject Yes (−) Yes (−) Yes (−)Sütlüce −8.747*** ±1.645 ±1.96 ±2.576 Reject Reject Reject Yes (−) Yes (−) Yes (−)Kale 1.066 ±1.645 ±1.96 ±2.576 Accept Accept Accept No No NoGomeleonu −0.638 ±1.645 ±1.96 ±2.576 Accept Accept Accept No No NoŞimşirli −0.141 ±1.645 ±1.96 ±2.576 Accept Accept Accept No No NoTozköy 1.738* ±1.645 ±1.96 ±2.576 Reject Accept Accept Yes (+) No NoTopluca 1.291 ±1.645 ±1.96 ±2.576 Accept Accept Accept No No No
*** trend at α’ = 0.01 level. ** trend at α’ = 0.05 level. * trend at α’ = 0.1 level.
62 Ö. KIŞI ET AL.: TREND ANALYSIS OF MONTHLY STREAMFLOWS USING ŞEN’S INNOVATIVE ...
test. He found downward trend in Yakabasi, Derecikviran, Şimşirli, Durucasu and Sütlüce stations. Saris et al. (2010) investigated the trends in streamflow data of northeast Turkey using MK. They found no significant trend for the Şimşirli and Topluca stations while Tozköy indicated increasing trend according to their study. The MK provided inverse trends in the monthly streamflow time series at the nearby stations of Durucasu (or Sütlüce with significant negative trend) and Kale (with increasing trend). Türkeş and Sümer (2004) reported that opposite trends at two neighbouring stations may be owing to some natural dynamics and special situations. Urbanization (variations in land uses, for ex-ample, non-agricultural usages of lands, vegetation cover etc.) might have also caused for opposite streamflow trends at these two nearby stations.
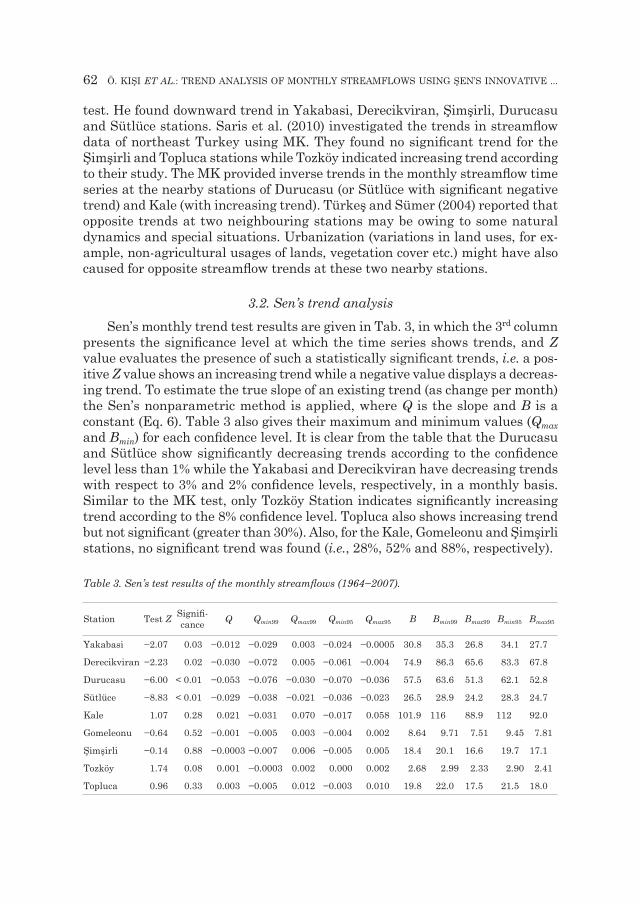
3.2. Sen’s trend analysisSen’s monthly trend test results are given in Tab. 3, in which the 3rd column
presents the significance level at which the time series shows trends, and Z value evaluates the presence of such a statistically significant trends, i.e. a pos-itive Z value shows an increasing trend while a negative value displays a decreas-ing trend. To estimate the true slope of an existing trend (as change per month) the Sen’s nonparametric method is applied, where Q is the slope and B is a constant (Eq. 6). Table 3 also gives their maximum and minimum values (Qmax and Bmin) for each confidence level. It is clear from the table that the Durucasu and Sütlüce show significantly decreasing trends according to the confidence level less than 1% while the Yakabasi and Derecikviran have decreasing trends with respect to 3% and 2% confidence levels, respectively, in a monthly basis. Similar to the MK test, only Tozköy Station indicates significantly increasing trend according to the 8% confidence level. Topluca also shows increasing trend but not significant (greater than 30%). Also, for the Kale, Gomeleonu and Şimşirli stations, no significant trend was found (i.e., 28%, 52% and 88%, respectively).
Table 3. Sen’s test results of the monthly streamflows (1964−2007).
Station Test Z Signifi-cance Q Qmin99 Qmax99 Qmin95 Qmax95 B Bmin99 Bmax99 Bmin95 Bmax95
Yakabasi −2.07 0.03 −0.012 −0.029 0.003 −0.024 −0.0005 30.8 35.3 26.8 34.1 27.7
Derecikviran −2.23 0.02 −0.030 −0.072 0.005 −0.061 −0.004 74.9 86.3 65.6 83.3 67.8
Durucasu −6.00 < 0.01 −0.053 −0.076 −0.030 −0.070 −0.036 57.5 63.6 51.3 62.1 52.8
Sütlüce −8.83 < 0.01 −0.029 −0.038 −0.021 −0.036 −0.023 26.5 28.9 24.2 28.3 24.7
Kale 1.07 0.28 0.021 −0.031 0.070 −0.017 0.058 101.9 116 88.9 112 92.0
Gomeleonu −0.64 0.52 −0.001 −0.005 0.003 −0.004 0.002 8.64 9.71 7.51 9.45 7.81
Şimşirli −0.14 0.88 −0.0003 −0.007 0.006 −0.005 0.005 18.4 20.1 16.6 19.7 17.1
Tozköy 1.74 0.08 0.001 −0.0003 0.002 0.000 0.002 2.68 2.99 2.33 2.90 2.41
Topluca 0.96 0.33 0.003 −0.005 0.012 −0.003 0.010 19.8 22.0 17.5 21.5 18.0

GEOFIZIKA, VOL. 35, NO. 1, 2018, 53–68 63
3.3. Innovative trend analysisIn this section of the study, innovative trend method was applied to the
monthly streamflows. The scattered streamflow data were divided into “low”, “medium” and “high” groups following the studies of Şen (2012) and Öztopal and Şen (2017). The results of the ITM are shown in Fig. 4 for the Yakabasi and Derecikviran stations. According to the figure, low and medium streamflow val-ues (< 100 m3/s) of Yakabasi station show monotonic decreasing trend while the high values have slightly increasing trend. In Derecikviran station, low, medium and high streamflows show decreasing trend. Figure 5 illustrates the monthly streamflow trends of Durucasu and Sütlüce stations. It is clear from the figure that there exists a decreasing trend for the low and medium values (< 190 m3/s) of the Durucasu while the high values show no trend in some cases (between
Figure 4. The results of innovative trend method for (a) Yakabasi and (b) Derecikviran stations.
Figure 5. The results of innovative trend method for (a) Durucasu and (b) Sütlüce stations.

64 Ö. KIŞI ET AL.: TREND ANALYSIS OF MONTHLY STREAMFLOWS USING ŞEN’S INNOVATIVE ...
190 m3/s and 300 m3/s). In Sütlüce station, the low, medium and high streamflow values show highly decreasing trend similar to the MK and Sen’s trend tests. The ITM results for the monthly streamflow data of Kale and Gomeleonu stations are provided in Fig. 6. In Kale station, the low (< 150 m3/s) and low-medium (between 150 m3/s and 480 m3/s) streamflow values respectively show slightly increasing and decreasing trends while the high (> 480 m3/s) values generally indicate no trend. From the figure, it is clear that no trend exists for the low, medium and high streamflow values of Gomeleonu station. However, there is an increasing trend in some cases including high streamflows (between 75 m3/s and 95 m3/s). Figure 7 gives the ITM results of the Şimşirli and Topluca stations. In Şimşirli station, no significant trend is seen for the low and medium streamflows
Figure 6. The results of innovative trend method for (a) Kale and (b) Gomelonu stations.
Figure 7. The results of innovative trend method for (a) Şimşirli and (b) Topluca stations.

GEOFIZIKA, VOL. 35, NO. 1, 2018, 53–68 65
while the high streamflow values (> 70 m3/s) indicate slightly increasing trend. The low, medium and high streamflows of the Topluca station show slightly increasing trend. Trend results of Tozköy station are illustrated in Fig. 8. As seen from the figure, the low-medium ( 13 m3/s) values indicate slightly increas-ing trend. The medium (between 13 m3/s and 20 m3/s) streamflow values show no trend whereas the peak values show upward trend.
4. Conclusion
In the present study, trends of monthly streamflows were analyzed by in-novative trend method, MK and Sen’s method. According to the MK, Yakabasi, Derecikviran, Durucasu and Sütlüce which are located in western part of the Black Sea Region indicated a significantly decreasing trend with respect to 5% and 1% confidence levels while the Tozköy Station which is situated in eastern part of the Black Sea Region showed a significantly increasing trend according to the 10% confidence level. In the Kale, Gomeleonu, Şimşirli and Topluca sta-tions, no trend was found. Sen’s trend method indicated that there is a signifi-cantly decreasing trend in Durucasu and Sütlüce stations with respect to 1% confidence level while the Yakabasi and Derecikviran had decreasing trends according to the 10% and 5% confidence levels, respectively. Tozköy Station in-dicated significantly increasing trend according to the 5% confidence level. The streamflows of the Kale, Gomeleonu, Şimşirli and Topluca stations did not show a significant trend. According to the innovative trend method, different trends were found for the low, medium and high streamflows in some cases. The low and medium streamflow values of the Yakabasi, Derecikviran, Durucasu and Sütlüce stations showed a decreasing trend while the low-medium values of the Tozköy Station indicated slightly increasing trend. The high streamflow values of the Yakabasi, Simsirli and Tozköy stations showed an increasing trend while
Figure 8. The results of innovative trend method for Tozköy station.

66 Ö. KIŞI ET AL.: TREND ANALYSIS OF MONTHLY STREAMFLOWS USING ŞEN’S INNOVATIVE ...
the corresponding values of the Derecikviran and Sütlüce stations indicated a decreasing trend.
The study showed that innovative trend method has a few points of interest in relative to Mann-Kendall and Sen’s trend methods. One is that it does not include any assumptions (e.g., serial relationship, nonnormality, test number, etc.) compared to MK and Sen’s trend method. The other point is that the trends of low, medium, and high data can be easily identified by innovative trend meth-od. This new method can provide a useful information and a priori view to the authorities and designers and can be used in climate change scenarios.
ReferencesAy, M. and Kişi, O. (2015): Investigation of trend analysis of monthly total precipitation by an in-
novative method, Theor. Appl. Climatol., 120, 617–629, DOI: 10.1007/s00704-014-1198-8.Cigizoglu, H. K., Bayazit, M. and Önöz, B. (2005): Trends in the maximum, mean, and low flows of
Turkish rivers, J. Hydrometeorol., 6, 280–290, DOI: 10.1175/JHM412.1.Eris, E. and Agiralioglu, N. (2012): Homogeneity and trend analysis of hydrometeorological data of the
eastern Black Sea region, Turkey, J. Water Resource Prot., 4, 99–105, DOI: 10.4236/jwarp.2012.42012.Gilbert, R. O. (1987): Statistical methods for environmental pollution monitoring. New Van Nostrand
Reinhold, New York, 320 pp.Haktanir, T. and Citakoglu, H. (2014): Trend, independence, stationarity, and homogeneity tests on
maximum rainfall series of standard durations recorded in Turkey, J. Hydrol. Eng., 19, DOI: 10.1061/(ASCE)HE.1943-5584.0000973.
Kahya, E. and Kalayci, S. (2004): Trend analysis of streamflow in Turkey, J. Hydrol., 289, 128–144, DOI: 10.1016/j.jhydrol.2003.11.006.
Kim, J. S. and Jain, S. (2010): High-resolution streamflow trend analysis applicable to annual deci-sion calendars: A western United States case study, Climatic Change, 102, 699–707, DOI: 10.1007/s10584-010-9933-3.
Kişi, O. (2015): An innovative method for trend analysis of monthly pan evaporations, J. Hydrol., 527, 1123–1129, DOI: 10.1016/j.jhydrol.2015.06.009.
Kişi, O. and Ay, M. (2014): Comparison of Mann-Kendall and innovative trend method for water quality parameters of the Kizilirmak River, Turkey, J. Hydrol., 513, 362–375, DOI: 10.1016/j.jhydrol.2014.03.005.
Niazi, F., Mofid, H. and Fazel Modares, N. (2014): Trend analysis of temporal changes of discharge and water quality parameters of Ajichay River in four recent decades, Water Qual. Expos. Hea., 6, 89–95, DOI: 10.1007/s12403-013-0108-0.
Öztopal, A. and Şen, Z. (2017): Innovative trend methodology applications to precipitation records in Turkey, Water Resour. Manag., 31(3), 727–737, DOI: 10.1007/s11269-016-1343-5.
Palizdan, N., Falamarzi, Y., Huang, Y. F., Lee, T. S. and Ghazali, A. H. (2014): Regional precipitation trend analysis at the Langat River Basin, Selangor, Malaysia, Theor. Appl. Climatol., 117, 589–606, DOI: 10.1007/s00704-013-1026-6.
Sang, Y. F., Wang, Z. G. and Liu, C. M. (2014): Comparison of the MK test and EMD method for trend identification in hydrological time series, J. Hydrol., 510, 293–298, DOI: 10.1016/j.jhydrol.2013.12.039.
Santos, C. A. G., Brasil Neto, R. M., Silva, R. M. and Passos, J. S. A. (2018a): Integrated spatiotem-poral trends using TRMM 3B42 data for the Upper São Francisco River basin, Brazil, Environ. Monit. Assess., 190, 175, DOI: 10.1007/s10661-018-6536-3.
Santos, C. A. G., Kişi, Ö, Silva, R. M. and Zounemat-Kermani, M. (2018b): Wavelet-based variabil-ity on streamflow at 40-year timescale in the Black Sea region of Turkey, Arab. J. Geosci., 11, 169, DOI: 10.1007/s12517-018-3514-6.

GEOFIZIKA, VOL. 35, NO. 1, 2018, 53–68 67
Sayemuzzaman, M. and Jha, M. K. (2014): Seasonal and annual precipitation time series trend analysis in North Carolina, United States, Atmos. Res., 137, 183–194, DOI: 10.1016/j.atmosres.2013.10.012.
Searcy, J. K. and Hardison, C. H. (1960): Double mass curves. Manual of hydrology: Part 1. General surface water techniques. United States Government Printing Office, Washington, 66 pp.
Şen, P. K. (1968): Estimates of the regression coefficient based on Kendall’s Tau, J. Am. Stat. Assoc., 63, 1379–1389.
Şen, Z. (2012): Innovative trend analysis methodology, J. Hydrol. Eng., 17, 1042–1046, DOI: 10.1061/(ASCE)HE.1943-5584.0000556.
Şen, Z. (2014): Trend identification simulation and application, J. Hydrol. Eng., 19, 635–642, DOI: 10.1061/(ASCE)HE.1943-5584.0000811.
Sensoy, S., Demircan, M., Ulupınar, U. and Balta, I. (2008): Turkey Climate, available at http://www.dmi.gov.tr/iklim/iklim.aspx (in Turkish).
Shadmani, M., Marofi, S. and Roknian, M. (2012): Trend analysis in reference evapotranspiration using Mann-Kendall and Spearman’s rho tests in arid regions of Iran, Water Resour. Manag., 26, 211–224, DOI: 10.1007/s11269-011-9913-z.
Silva, R. M., Santos, C. A. G., Moreira, M., Corte-Real, J., Silva, V. C. L. and Medeiros, I. C. (2015): Rainfall and river flow trends using Mann-Kendall and Sen’s slope estimator statistical tests in the Cobres River basin, Nat. Hazards, 77, 1205–1221, DOI: 10.1007/s11069-015-1644-7.
Sirois, A. (1998): A brief and biased overview of time series analysis or how to find that evasive trend, in: WMO report No. 133: WMO/EMEP workshop on advanced statistical methods and their ap-plication to air quality data sets, Helsinki, 14–18 September 1998.
Tabari, H., Aeini, A., Talaee, P. H. and Some’e, B. S. (2012): Spatial distribution and temporal variation of reference evapotranspiration in arid and semi-arid regions of Iran, Hydrol. Process., 26, 500–512, DOI: 10.1002/hyp.8146.
Tabari, H. and Marofi, S. (2010): Changes of pan evaporation in the west of Iran, Water Resour. Manag., 25, 97–111, DOI: 10.1007/s11269-010-9689-6.
Tabari, H. and Talaee, P. H. (2011): Temporal variability of precipitation over Iran: 1966–2005, J. Hydrol., 396, 313–320, DOI: 10.1016/j.jhydrol.2010.11.034.
Topaloglu, F. (2006): Trend detection of streamflow variables in Turkey, Fresen. Environ. Bull., 15, 644–653.
Türkeş, M. and Sümer, U. M. (2004): Spatial and temporal patterns of trends and variability in di-urnal temperature ranges of Turkey, Theor. Appl. Climatol., 77, 195–227, DOI: 10.1007/s00704-003-0024-5.
Yenigün, K., Gümüş, V. and Bulut, H. (2008): Trends in streamflow of the Euphrates basin, Turkey, Water Management, 161, 189–198, DOI: 10.1680/wama.2008.161.4.189.
Unal, Y. S., Deniz, A., Toros, H. and Incecik, S. (2012): Temporal and spatial patterns of precipitation variability for annual, wet, and dry seasons in Turkey, Int. J. Climatol., 32, 392–405, DOI: 10.1002/joc.2274.
SAŽETAK
Analiza trenda mjesečnih strujanja Şenovom inovativnom metodom trenda
Özgür Kişi, Celso Augusto Guimarães Santos, Richarde Marques da Silva i Mohammad Zounemat-Kermani
Analiza trenda srednjih mjesečnih strujanja je neophodna za bolje upravljanje vo-dama i planiranje. U ovom su istraživanju korišteni: Mann-Kendallova test (MK), Seno-va metoda i Şenova inovativna metoda trendova (ITM) kako bi se ispitali mogući tren-

68 Ö. KIŞI ET AL.: TREND ANALYSIS OF MONTHLY STREAMFLOWS USING ŞEN’S INNOVATIVE ...
dovi mjesečnih strujanja dobivenih s devet postaja u tri bazena (Yakabasi i Derecikviran u zapadnom slivu Crnog mora, Durucasu, Sütlüce, Kale i Gomeleonu u slivu Yesilirmak, Şimşirli, Tozköy i Topluca u istočnom slivu Crnog mora) koji se nalaze u crnomorskoj regiji Turske. Na temelju MK, podaci strujanja s postaje Tozköy, koja se nalazi na zapad-nom dijelu istočne crnomorske regije, pokazali su znatno povećanje trenda, dok su za Yakabasi, Derecikviran, Durucasu i Sütlüce u zapadnom dijelu crnomorske regije uočeni znatno opadajući trendovi. Prema Senovoj metodi trenda, znatno je smanjen trend na postajama Durucasu, Sütlüce, Yakabasi i Derecikviran, dok je postaja Tozköy pokazala znatno povećanje trenda. Prema ITM-u, niske i srednje vrijednosti postaje Tozköy poka-zuju neznatno povećanje trenda, dok su niske i srednje vrijednosti strujanja za Yakabasi, Derecikviran, Durucasu i Sutluce pokazale trend smanjenja. Visoke vrijednosti strujanja Derecikviran i Sütlüce postaja pokazale su trend smanjenja, dok su odgovarajuće vrijed-nosti za Yakabasi, Şimşirli i Tozköy pokazale rastući trend. Pokazalo se da ITM može lako identificirati trendove niskih, srednjih i visokih vrijednosti podataka, što ima neke prednosti u odnosu na Senovu metodu i Mann-Kendallov test (nema pretpostavki poput serijskog odnosa, nenormalnosti i testnog broja).
Ključne riječi: mjesečni srednji tokovi, analiza trendova, Mann-Kendall, Senova metoda, inovativna metoda trenda
Corresponding author’s address: Özgür Kişi, Faculty of Natural Sciences and Engineering, Ilia State University, Tbilisi, Georgia; e-mail: [email protected]