Trend Analysis of IMR of SRS (2005-2012) Infant...
10
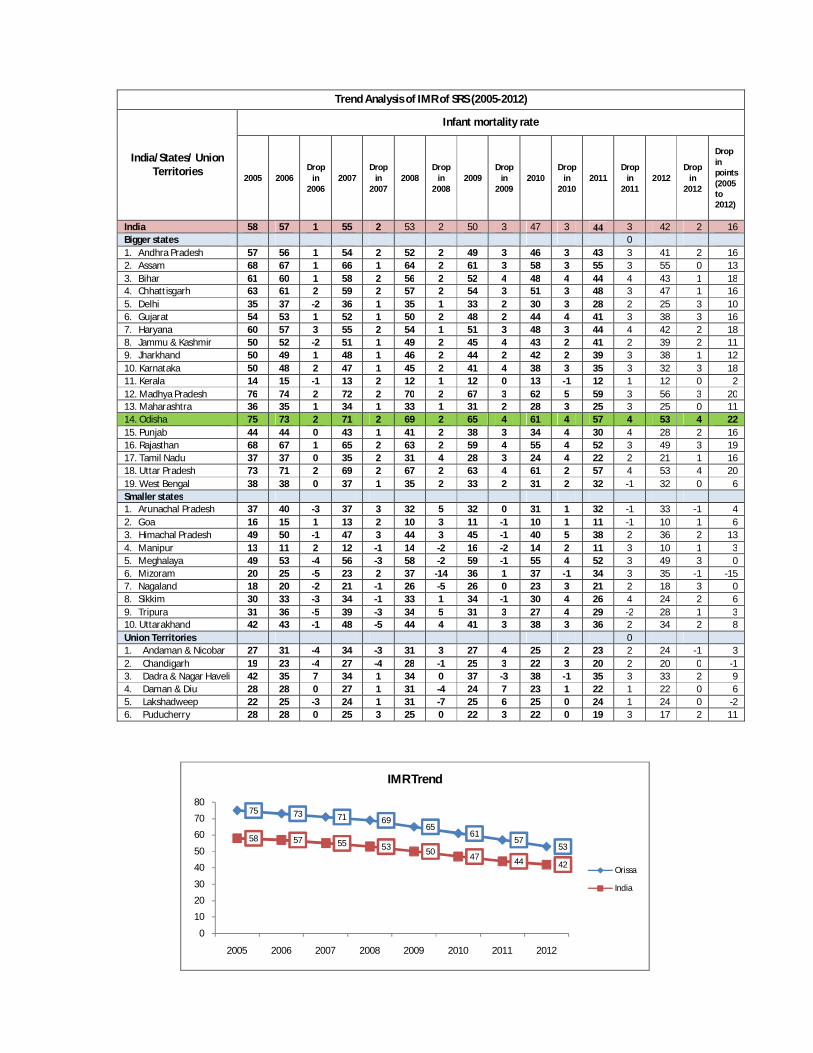
75 73 71 69 65 61 57 53 58 57 55 53 50 47 44 42 0 10 20 30 40 50 60 70 80 2005 2006 2007 2008 2009 2010 2011 2012 IMR Trend Orissa India Trend Analysis of IMR of SRS (2005-2012) India/States/ Union Territories Infant mortality rate 2005 2006 Drop in 2006 2007 Drop in 2007 2008 Drop in 2008 2009 Drop in 2009 2010 Drop in 2010 2011 Drop in 2011 2012 Drop in 2012 Drop in points (2005 to 2012) India 58 57 1 55 2 53 2 50 3 47 3 44 3 42 2 16 Bigger states 0 1. Andhra Pradesh 57 56 1 54 2 52 2 49 3 46 3 43 3 41 2 16 2. Assam 68 67 1 66 1 64 2 61 3 58 3 55 3 55 0 13 3. Bihar 61 60 1 58 2 56 2 52 4 48 4 44 4 43 1 18 4. Chhattisgarh 63 61 2 59 2 57 2 54 3 51 3 48 3 47 1 16 5. Delhi 35 37 -2 36 1 35 1 33 2 30 3 28 2 25 3 10 6. Gujarat 54 53 1 52 1 50 2 48 2 44 4 41 3 38 3 16 7. Haryana 60 57 3 55 2 54 1 51 3 48 3 44 4 42 2 18 8. Jammu & Kashmir 50 52 -2 51 1 49 2 45 4 43 2 41 2 39 2 11 9. Jharkhand 50 49 1 48 1 46 2 44 2 42 2 39 3 38 1 12 10. Karnataka 50 48 2 47 1 45 2 41 4 38 3 35 3 32 3 18 11. Kerala 14 15 -1 13 2 12 1 12 0 13 -1 12 1 12 0 2 12. Madhya Pradesh 76 74 2 72 2 70 2 67 3 62 5 59 3 56 3 20 13. Maharashtra 36 35 1 34 1 33 1 31 2 28 3 25 3 25 0 11 14. Odisha 75 73 2 71 2 69 2 65 4 61 4 57 4 53 4 22 15. Punjab 44 44 0 43 1 41 2 38 3 34 4 30 4 28 2 16 16. Rajasthan 68 67 1 65 2 63 2 59 4 55 4 52 3 49 3 19 17. Tamil Nadu 37 37 0 35 2 31 4 28 3 24 4 22 2 21 1 16 18. Uttar Pradesh 73 71 2 69 2 67 2 63 4 61 2 57 4 53 4 20 19. West Bengal 38 38 0 37 1 35 2 33 2 31 2 32 -1 32 0 6 Smaller states 1. Arunachal Pradesh 37 40 -3 37 3 32 5 32 0 31 1 32 -1 33 -1 4 2. Goa 16 15 1 13 2 10 3 11 -1 10 1 11 -1 10 1 6 3. Himachal Pradesh 49 50 -1 47 3 44 3 45 -1 40 5 38 2 36 2 13 4. Manipur 13 11 2 12 -1 14 -2 16 -2 14 2 11 3 10 1 3 5. Meghalaya 49 53 -4 56 -3 58 -2 59 -1 55 4 52 3 49 3 0 6. Mizoram 20 25 -5 23 2 37 -14 36 1 37 -1 34 3 35 -1 -15 7. Nagaland 18 20 -2 21 -1 26 -5 26 0 23 3 21 2 18 3 0 8. Sikkim 30 33 -3 34 -1 33 1 34 -1 30 4 26 4 24 2 6 9. Tripura 31 36 -5 39 -3 34 5 31 3 27 4 29 -2 28 1 3 10. Uttarakhand 42 43 -1 48 -5 44 4 41 3 38 3 36 2 34 2 8 Union Territories 0 1. Andaman & Nicobar 27 31 -4 34 -3 31 3 27 4 25 2 23 2 24 -1 3 2. Chandigarh 19 23 -4 27 -4 28 -1 25 3 22 3 20 2 20 0 -1 3. Dadra & Nagar Haveli 42 35 7 34 1 34 0 37 -3 38 -1 35 3 33 2 9 4. Daman & Diu 28 28 0 27 1 31 -4 24 7 23 1 22 1 22 0 6 5. Lakshadweep 22 25 -3 24 1 31 -7 25 6 25 0 24 1 24 0 -2 6. Puducherry 28 28 0 25 3 25 0 22 3 22 0 19 3 17 2 11
Transcript of Trend Analysis of IMR of SRS (2005-2012) Infant...
75 73 71 6965
6157
5358 57 55 53 50
47 44 42
0
10
20
30
40
50
60
70
80
2005 2006 2007 2008 2009 2010 2011 2012
IMR Trend
Orissa
India
Trend Analysis of IMR of SRS (2005-2012)
India/States/ Union Territories
Infant mortality rate
2005 2006 Drop
in 2006
2007 Drop
in 2007
2008 Drop
in 2008
2009 Drop
in 2009
2010 Drop
in 2010
2011 Drop
in 2011
2012 Drop
in 2012
Drop in points (2005 to 2012)
India 58 57 1 55 2 53 2 50 3 47 3 44 3 42 2 16 Bigger states 0 1. Andhra Pradesh 57 56 1 54 2 52 2 49 3 46 3 43 3 41 2 16 2. Assam 68 67 1 66 1 64 2 61 3 58 3 55 3 55 0 13 3. Bihar 61 60 1 58 2 56 2 52 4 48 4 44 4 43 1 18 4. Chhattisgarh 63 61 2 59 2 57 2 54 3 51 3 48 3 47 1 16 5. Delhi 35 37 -2 36 1 35 1 33 2 30 3 28 2 25 3 10 6. Gujarat 54 53 1 52 1 50 2 48 2 44 4 41 3 38 3 16 7. Haryana 60 57 3 55 2 54 1 51 3 48 3 44 4 42 2 18 8. Jammu & Kashmir 50 52 -2 51 1 49 2 45 4 43 2 41 2 39 2 11 9. Jharkhand 50 49 1 48 1 46 2 44 2 42 2 39 3 38 1 12 10. Karnataka 50 48 2 47 1 45 2 41 4 38 3 35 3 32 3 18 11. Kerala 14 15 -1 13 2 12 1 12 0 13 -1 12 1 12 0 2 12. Madhya Pradesh 76 74 2 72 2 70 2 67 3 62 5 59 3 56 3 20 13. Maharashtra 36 35 1 34 1 33 1 31 2 28 3 25 3 25 0 11 14. Odisha 75 73 2 71 2 69 2 65 4 61 4 57 4 53 4 22 15. Punjab 44 44 0 43 1 41 2 38 3 34 4 30 4 28 2 16 16. Rajasthan 68 67 1 65 2 63 2 59 4 55 4 52 3 49 3 19 17. Tamil Nadu 37 37 0 35 2 31 4 28 3 24 4 22 2 21 1 16 18. Uttar Pradesh 73 71 2 69 2 67 2 63 4 61 2 57 4 53 4 20 19. West Bengal 38 38 0 37 1 35 2 33 2 31 2 32 -1 32 0 6 Smaller states 1. Arunachal Pradesh 37 40 -3 37 3 32 5 32 0 31 1 32 -1 33 -1 4 2. Goa 16 15 1 13 2 10 3 11 -1 10 1 11 -1 10 1 6 3. Himachal Pradesh 49 50 -1 47 3 44 3 45 -1 40 5 38 2 36 2 13 4. Manipur 13 11 2 12 -1 14 -2 16 -2 14 2 11 3 10 1 3 5. Meghalaya 49 53 -4 56 -3 58 -2 59 -1 55 4 52 3 49 3 0 6. Mizoram 20 25 -5 23 2 37 -14 36 1 37 -1 34 3 35 -1 -15 7. Nagaland 18 20 -2 21 -1 26 -5 26 0 23 3 21 2 18 3 0 8. Sikkim 30 33 -3 34 -1 33 1 34 -1 30 4 26 4 24 2 6 9. Tripura 31 36 -5 39 -3 34 5 31 3 27 4 29 -2 28 1 3 10. Uttarakhand 42 43 -1 48 -5 44 4 41 3 38 3 36 2 34 2 8 Union Territories 0 1. Andaman & Nicobar 27 31 -4 34 -3 31 3 27 4 25 2 23 2 24 -1 3 2. Chandigarh 19 23 -4 27 -4 28 -1 25 3 22 3 20 2 20 0 -1 3. Dadra & Nagar Haveli 42 35 7 34 1 34 0 37 -3 38 -1 35 3 33 2 9 4. Daman & Diu 28 28 0 27 1 31 -4 24 7 23 1 22 1 22 0 6 5. Lakshadweep 22 25 -3 24 1 31 -7 25 6 25 0 24 1 24 0 -2 6. Puducherry 28 28 0 25 3 25 0 22 3 22 0 19 3 17 2 11

-15
-2
-1
0
0
2
3
3
3
4
6
6
6
6
8
9
10
11
11
11
12
13
13
16
16
16
16
16
16
18
18
18
19
20
20
22
-20 -10 0 10 20 30
Mizoram
Lakshadweep
Chandigarh
Meghalaya
Nagaland
Kerala
Manipur
Tripura
Andaman & Nicobar
Arunachal Pradesh
West Bengal
Goa
Sikkim
Daman & Diu
Uttarakhand
Dadra & Nagar Haveli
Delhi
Jammu & Kashmir
Maharashtra
Puducherry
Jharkhand
Assam
Himachal Pradesh
India
Andhra Pradesh
Chhattisgarh
Gujarat
Punjab
Tamil Nadu
Bihar
Haryana
Karnataka
Rajasthan
Madhya Pradesh
Uttar Pradesh
Odisha
State wise Drop in points : IMR(2005 to 2012)

Sl. No.
States 2004-06 2007-09 2011-12
Points of Decline
(2007-09 to 2011-12)
India 254 212 178 34
1 Uttar Pradesh/Uttaranchal EAG State 440 359 292 67 2 Rajasthan EAG State 388 318 255 63 3 Assam EAG State 480 390 328 62 4 Bihar/Jharkhand EAG State 312 261 219 42 5 Madhya Pradesh/Chattisgarh EAG State 335 269 230 39 6 Karnatak South State 213 178 144 34 7 West Bengal Other State 141 145 117 28 8 Gujarat Other State 160 148 122 26 9 Andhra Pradesh South State 154 134 110 24
10 Orissa EAG State 303 258 235 23 11 Maharastra Other State 130 104 87 17 12 Punjab Other State 192 172 155 17 13 Keral South State 95 81 66 15 14 Haryana Other State 186 153 146 7 15 Tamili Nadu South State 111 97 90 7
INDIA
ODISHA0
200
400
600
SRS 1998SRS 2003
SRS 2006SRS 2009
SRS 2010-12
407
301254
212178
367 358303
258235
Decline in MMR
INDIA ODISHA

Trend Analysis of Birth Rate of SRS (2005-2012)
India/States/ Union Territories
Birth rate
2005 2006 Drop
in 2006
2007 Drop
in 2007
2008 Drop
in 2008
2009 Drop
in 2009
2010 Drop
in 2010
2011 Drop
in 2011
2012 Drop
in 2012
Total Drop from 2005
India 23.8 23.5 0.3 23.1 0.4 22.8 0.3 22.5 0.3 22.1 0.4 21.8 0.3 21.6 0.2 2.2 Bigger states 1. Andhra Pradesh 19.1 18.9 0.2 18.7 0.2 18.4 0.3 18.3 0.1 17.9 0.4 17.5 0.4 17.5 0 1.6 2. Assam 25 24.6 0.4 24.3 0.3 23.9 0.4 23.6 0.3 23.2 0.4 22.8 0.4 22.5 0.3 2.5 3. Bihar 30.4 29.9 0.5 29.4 0.5 28.9 0.5 28.5 0.4 28.1 0.4 27.7 0.4 27.7 0 2.7 4. Chhattisgarh 27.2 26.9 0.3 26.5 0.4 26.1 0.4 25.7 0.4 25.3 0.4 24.9 0.4 24.5 0.4 2.7 5. Delhi 18.6 18.4 0.2 18.1 0.3 18.4 -0.3 18.1 0.3 17.8 0.3 17.5 0.3 17.3 0.2 1.3 6. Gujarat 23.7 23.5 0.2 23 0.5 22.6 0.4 22.3 0.3 21.8 0.5 21.3 0.5 21.1 0.2 2.6 7. Haryana 24.3 23.9 0.4 23.4 0.5 23 0.4 22.7 0.3 22.3 0.4 21.8 0.5 21.6 0.2 2.7 8. Jammu & Kashmir 18.9 18.7 0.2 19 -0.3 18.8 0.2 18.6 0.2 18.3 0.3 17.8 0.5 17.6 0.2 1.3 9. Jharkhand 26.8 26.2 0.6 26.1 0.1 25.8 0.3 25.6 0.2 25.3 0.3 25 0.3 24.7 0.3 2.1 10. Karnataka 20.6 20.1 0.5 19.9 0.2 19.8 0.1 19.5 0.3 19.2 0.3 18.8 0.4 18.5 0.3 2.1 11. Kerala 15 14.9 0.1 14.7 0.2 14.6 0.1 14.7 -0.1 14.8 -0.1 15.2 -0.4 14.9 0.3 0.1 12. Madhya Pradesh 29.4 29.1 0.3 28.5 0.6 28 0.5 27.7 0.3 27.3 0.4 26.9 0.4 26.6 0.3 2.8 13. Maharashtra 19 18.5 0.5 18.1 0.4 17.9 0.2 17.6 0.3 17.1 0.5 16.7 0.4 16.6 0.1 2.4 14. Odisha 22.3 21.9 0.4 21.5 0.4 21.4 0.1 21 0.4 20.5 0.5 20.1 0.4 19.9 0.2 2.4 15. Punjab 18.1 17.8 0.3 17.6 0.2 17.3 0.3 17 0.3 16.6 0.4 16.2 0.4 15.9 0.3 2.2 16. Rajasthan 28.6 28.3 0.3 27.9 0.4 27.5 0.4 27.2 0.3 26.7 0.5 26.2 0.5 25.9 0.3 2.7 17. Tamil Nadu 16.5 16.2 0.3 15.8 0.4 16 -0.2 16.3 -0.3 15.9 0.4 15.9 0 15.7 0.2 0.8 18. Uttar Pradesh 30.4 30.1 0.3 29.5 0.6 29.1 0.4 28.7 0.4 28.3 0.4 27.8 0.5 27.4 0.4 3 19. West Bengal 18.8 18.4 0.4 17.9 0.5 17.5 0.4 17.2 0.3 16.8 0.4 16.3 0.5 16.1 0.2 2.7 Smaller states 1. Arunachal Pradesh 23.3 22.5 0.8 22.2 0.3 21.8 0.4 21.1 0.7 20.5 0.6 19.8 0.7 19.4 0.4 3.9 2. Goa 14.8 15.1 -0.3 14.7 0.4 13.6 1.1 13.5 0.1 13.2 0.3 13.3 -0.1 13.1 0.2 1.7 3. Himachal Pradesh 20 18.8 1.2 17.4 1.4 17.7 -0.3 17.2 0.5 16.9 0.3 16.5 0.4 16.2 0.3 3.8 4. Manipur 14.7 13.4 1.3 14.6 -1.2 15.8 -1.2 15.4 0.4 14.9 0.5 14.4 0.5 14.6 -0.2 0.1 5. Meghalaya 25.1 24.7 0.4 24.4 0.3 25.2 -0.8 24.4 0.8 24.5 -0.1 24.1 0.4 24.1 0 1 6. Mizoram 18.8 17.8 1 18.2 -0.4 17.8 0.4 17.6 0.2 17.1 0.5 16.6 0.5 16.3 0.3 2.5 7. Nagaland 16.4 17.3 -0.9 17.4 -0.1 17.5 -0.1 17.2 0.3 16.8 0.4 16.1 0.7 15.6 0.5 0.8 8. Sikkim 19.9 19.2 0.7 18.1 1.1 18.4 -0.3 18.1 0.3 17.8 0.3 17.6 0.2 17.2 0.4 2.7 9. Tripura 16 16.6 -0.6 17.1 -0.5 15.4 1.7 14.8 0.6 14.9 -0.1 14.3 0.6 13.9 0.4 2.1 10. Uttarakhand 20.9 21 -0.1 20.4 0.6 20.1 0.3 19.7 0.4 19.3 0.4 18.9 0.4 18.5 0.4 2.4 Union Territories 1. Andaman & Nicobar 15.7 15.7 0 15.8 -0.1 16.9 -1.1 16.3 0.6 15.6 0.7 15.1 0.5 15 0.1 0.7 2. Chandigarh 17.3 15.8 1.5 15.7 0.1 16.4 -0.7 15.9 0.5 15.6 0.3 15 0.6 14.8 0.2 2.5 3. Dadra & Nagar Haveli 29.4 28.1 1.3 27.8 0.3 27 0.8 27 0 26.6 0.4 26.1 0.5 25.6 0.5 3.8 4. Daman & Diu 19.1 18.4 0.7 17.8 0.6 17.5 0.3 19.2 -1.7 18.8 0.4 18.4 0.4 18.1 0.3 1 5. Lakshadweep 19.1 18.9 0.2 18.3 0.6 14.3 4 15 -0.7 14.3 0.7 14.7 -0.4 14.8 -0.1 4.3 6. Puducherry 16.2 15.7 0.5 15.1 0.6 16.4 -1.3 16.5 -0.1 16.7 -0.2 16.1 0.6 15.8 0.3 0.4
22.3 21.9 21.5 21.4 21 20.5 20.1 19.9
23.8 23.5 23.1 22.8 22.5 22.1 21.8 21.6
0
5
10
15
20
25
SRS-2005 SRS-2006 SRS-2007 SRS-2008 SRS-2009 SRS-2010 SRS-2011 SRS-2012
Birth Rate
Orissa
India

4.3
3.9
3.8
3.8
3
2.8
2.7
2.7
2.7
2.7
2.7
2.7
2.6
2.5
2.5
2.5
2.4
2.4
2.4
2.2
2.2
2.1
2.1
2.1
1.7
1.6
1.3
1.3
1
1
0.8
0.8
0.7
0.4
0.1
0 0.5 1 1.5 2 2.5 3 3.5 4 4.5 5
Lakshadweep
Arunachal Pradesh
Himachal Pradesh
Dadra & Nagar Haveli
Uttar Pradesh
Madhya Pradesh
Rajasthan
Bihar
Chhattisgarh
Haryana
West Bengal
Sikkim
Gujarat
Assam
Mizoram
Chandigarh
Odisha
Maharashtra
Uttarakhand
Punjab
India
Jharkhand
Karnataka
Tripura
Goa
Andhra Pradesh
Delhi
Jammu & Kashmir
Meghalaya
Daman & Diu
Tamil Nadu
Nagaland
Andaman & Nicobar
Puducherry
Kerala
Birth Rate (Total Drop)2005-2012

9.5 9.3 9.2 9 8.8 8.6 8.5 8.57.6 7.5 7.4 7.4 7.3 7.2 7.1 7
0123456789
10
2005 2006 2007 2008 2009 2010 2011 2012
Death Rate
Orissa
India
Trend Analysis of Death Rate of SRS (2005-2012)
India/States/ Union Territories
Death rate
2005 2006 Drop
in 2006
2007 Drop
in 2007
2008 Drop
in 2008
2009 Drop
in 2009
2010 Drop
in 2010
2011 Drop
in 2011
2012 Drop
in 2012
Total Drop from 2005
India 7.6 7.5 0.1 7.4 0.1 7.4 0 7.3 0.1 7.2 0.1 7.1 0.1 7 0.1 0.6 1. Andhra Pradesh 7.3 7.3 0 7.4 -0.1 7.5 -0.1 7.6 -0.1 7.6 0 7.5 0.1 7.4 0.1 -0.1 2. Assam 8.7 8.7 0 8.6 0.1 8.6 0 8.4 0.2 8.2 0.2 8 0.2 7.9 0.1 0.8 3. Bihar 8.1 7.7 0.4 7.5 0.2 7.3 0.2 7 0.3 6.8 0.2 6.7 0.1 6.6 0.1 1.5 4. Chhattisgarh 8.1 8.1 0 8.1 0 8.1 0 8.1 0 8 0.1 7.9 0.1 7.9 0 0.2 5. Delhi 4.6 4.7 -0.1 4.8 -0.1 4.8 0 4.4 0.4 4.2 0.2 4.3 -0.1 4.2 0.1 0.4 6. Gujarat 7.1 7.3 -0.2 7.2 0.1 6.9 0.3 6.9 0 6.7 0.2 6.7 0 6.6 0.1 0.5 7. Haryana 6.7 6.5 0.2 6.6 -0.1 6.9 -0.3 6.6 0.3 6.6 0 6.5 0.1 6.4 0.1 0.3 8. Jammu & Kashmir 5.5 5.9 -0.4 5.8 0.1 5.8 0 5.7 0.1 5.7 0 5.5 0.2 5.4 0.1 0.1 9. Jharkhand 7.9 7.5 0.4 7.3 0.2 7.1 0.2 7 0.1 7 0 6.9 0.1 6.8 0.1 1.1 10. Karnataka 7.1 7.1 0 7.3 -0.2 7.4 -0.1 7.2 0.2 7.1 0.1 7.1 0 7.1 0 0 11. Kerala 6.4 6.7 -0.3 6.8 -0.1 6.6 0.2 6.8 -0.2 7 -0.2 7 0 6.9 0.1 -0.5 12. Madhya Pradesh 9 8.9 0.1 8.7 0.2 8.6 0.1 8.5 0.1 8.3 0.2 8.2 0.1 8.1 0.1 0.9 13. Maharashtra 6.7 6.7 0 6.6 0.1 6.6 0 6.7 -0.1 6.5 0.2 6.3 0.2 6.3 0 0.4 14. Odisha 9.5 9.3 0.2 9.2 0.1 9 0.2 8.8 0.2 8.6 0.2 8.5 0.1 8.5 0 1 15. Punjab 6.7 6.8 -0.1 7 -0.2 7.2 -0.2 7 0.2 7 0 6.8 0.2 6.8 0 -0.1 16. Rajasthan 7 6.9 0.1 6.8 0.1 6.8 0 6.6 0.2 6.7 -0.1 6.7 0 6.6 0.1 0.4 17. Tamil Nadu 7.4 7.5 -0.1 7.2 0.3 7.4 -0.2 7.6 -0.2 7.6 0 7.4 0.2 7.4 0 0 18. Uttar Pradesh 8.7 8.6 0.1 8.5 0.1 8.4 0.1 8.2 0.2 8.1 0.1 7.9 0.2 7.7 0.2 1 19. West Bengal 6.4 6.2 0.2 6.3 -0.1 6.2 0.1 6.2 0 6 0.2 6.2 -0.2 6.3 -0.1 0.1 Smaller states 1. Arunachal Pradesh 5 5 0 5.1 -0.1 5.2 -0.1 6.1 -0.9 5.9 0.2 5.8 0.1 5.8 0 -0.8 2. Goa 7.1 7.4 -0.3 7.2 0.2 6.6 0.6 6.7 -0.1 6.6 0.1 6.7 -0.1 6.6 0.1 0.5 3. Himachal Pradesh 6.9 6.8 0.1 7.1 -0.3 7.4 -0.3 7.2 0.2 6.9 0.3 6.7 0.2 6.7 0 0.2 4. Manipur 4.1 4.5 -0.4 4.4 0.1 5 -0.6 4.7 0.3 4.2 0.5 4.1 0.1 4 0.1 0.1 5. Meghalaya 7.5 8 -0.5 7.5 0.5 7.9 -0.4 8.1 -0.2 7.9 0.2 7.8 0.1 7.6 0.2 -0.1 6. Mizoram 5.1 5.5 -0.4 5.2 0.3 5.1 0.1 4.5 0.6 4.5 0 4.4 0.1 4.4 0 0.7 7. Nagaland 3.8 4.8 -1 5 -0.2 4.6 0.4 3.6 1 3.6 0 3.3 0.3 3.2 0.1 0.6 8. Sikkim 5.1 5.6 -0.5 5.3 0.3 5.2 0.1 5.7 -0.5 5.6 0.1 5.6 0 5.4 0.2 -0.3 9. Tripura 5.7 6.3 -0.6 6.5 -0.2 5.9 0.6 5.1 0.8 5 0.1 5 0 4.8 0.2 0.9 10. Uttarakhand 7.4 6.7 0.7 6.8 -0.1 6.4 0.4 6.5 -0.1 6.3 0.2 6.2 0.1 6.1 0.1 1.3 Union Territories 1. Andaman & Nicobar 4.7 5.1 -0.4 4.5 0.6 4.8 -0.3 4.1 0.7 4.3 -0.2 4.6 -0.3 4.6 0 0.1 2. Chandigarh 4.5 4.1 0.4 4 0.1 4.4 -0.4 3.9 0.5 3.9 0 4.1 -0.2 4 0.1 0.5 3. Dadra & Nagar Haveli 5.1 4.8 0.3 4.8 0 5.4 -0.6 4.8 0.6 4.7 0.1 4.6 0.1 4.5 0.1 0.6 4. Daman & Diu 5.6 5.5 0.1 5.5 0 5.3 0.2 5.1 0.2 4.9 0.2 4.9 0 4.8 0.1 0.8 5. Lakshadweep 6.3 6.4 -0.1 6.5 -0.1 7.1 -0.6 5.8 1.3 6.4 -0.6 6.4 0 6.4 0 -0.1 6. Puducherry 7.1 7.3 -0.2 7.7 -0.4 7.5 0.2 7 0.5 7.4 -0.4 7.2 0.2 7.1 0.1 0

1.5
1.3
1.1
1
1
0.9
0.9
0.8
0.8
0.7
0.6
0.6
0.6
0.5
0.5
0.5
0.4
0.4
0.4
0.3
0.2
0.2
0.1
0.1
0.1
0.1
0
0
0
-0.1
-0.1
-0.1
-0.1
-0.3
-0.5
-0.8
-1 -0.5 0 0.5 1 1.5 2
Bihar
Uttarakhand
Jharkhand
Odisha
Uttar Pradesh
Madhya Pradesh
Tripura
Daman & Diu
Assam
Mizoram
India
Nagaland
Dadra & Nagar Haveli
Gujarat
Goa
Chandigarh
Maharashtra
Rajasthan
Delhi
Haryana
Himachal Pradesh
Chhattisgarh
West Bengal
Andaman & Nicobar
Jammu & Kashmir
Manipur
Karnataka
Tamil Nadu
Puducherry
Punjab
Meghalaya
Andhra Pradesh
Lakshadweep
Sikkim
Kerala
Arunachal Pradesh
Death Rate (Total Drop)2005-2012
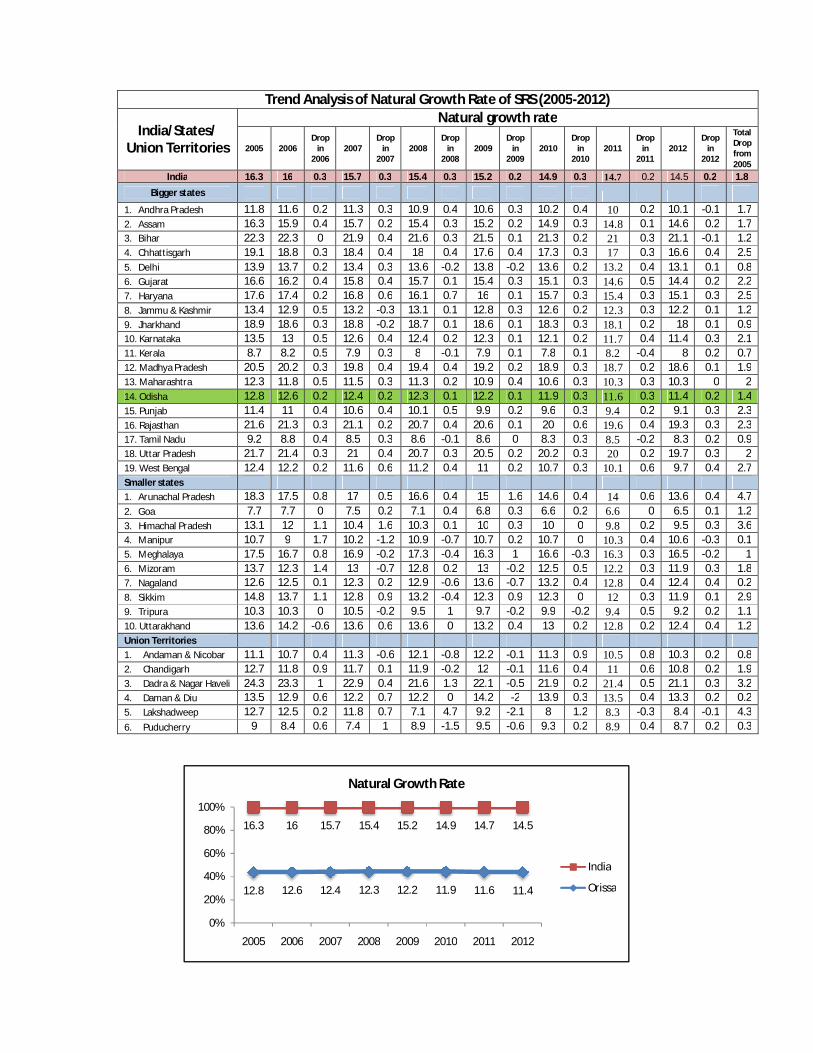
12.8 12.6 12.4 12.3 12.2 11.9 11.6 11.4
16.3 16 15.7 15.4 15.2 14.9 14.7 14.5
0%
20%
40%
60%
80%
100%
2005 2006 2007 2008 2009 2010 2011 2012
Natural Growth Rate
India
Orissa
Trend Analysis of Natural Growth Rate of SRS (2005-2012)
India/States/ Union Territories
Natural growth rate
2005 2006 Drop
in 2006
2007 Drop
in 2007
2008 Drop
in 2008
2009 Drop
in 2009
2010 Drop
in 2010
2011 Drop
in 2011
2012 Drop
in 2012
Total Drop from 2005
India 16.3 16 0.3 15.7 0.3 15.4 0.3 15.2 0.2 14.9 0.3 14.7 0.2 14.5 0.2 1.8
Bigger states 1. Andhra Pradesh 11.8 11.6 0.2 11.3 0.3 10.9 0.4 10.6 0.3 10.2 0.4 10 0.2 10.1 -0.1 1.7 2. Assam 16.3 15.9 0.4 15.7 0.2 15.4 0.3 15.2 0.2 14.9 0.3 14.8 0.1 14.6 0.2 1.7 3. Bihar 22.3 22.3 0 21.9 0.4 21.6 0.3 21.5 0.1 21.3 0.2 21 0.3 21.1 -0.1 1.2 4. Chhattisgarh 19.1 18.8 0.3 18.4 0.4 18 0.4 17.6 0.4 17.3 0.3 17 0.3 16.6 0.4 2.5 5. Delhi 13.9 13.7 0.2 13.4 0.3 13.6 -0.2 13.8 -0.2 13.6 0.2 13.2 0.4 13.1 0.1 0.8 6. Gujarat 16.6 16.2 0.4 15.8 0.4 15.7 0.1 15.4 0.3 15.1 0.3 14.6 0.5 14.4 0.2 2.2 7. Haryana 17.6 17.4 0.2 16.8 0.6 16.1 0.7 16 0.1 15.7 0.3 15.4 0.3 15.1 0.3 2.5 8. Jammu & Kashmir 13.4 12.9 0.5 13.2 -0.3 13.1 0.1 12.8 0.3 12.6 0.2 12.3 0.3 12.2 0.1 1.2 9. Jharkhand 18.9 18.6 0.3 18.8 -0.2 18.7 0.1 18.6 0.1 18.3 0.3 18.1 0.2 18 0.1 0.9 10. Karnataka 13.5 13 0.5 12.6 0.4 12.4 0.2 12.3 0.1 12.1 0.2 11.7 0.4 11.4 0.3 2.1 11. Kerala 8.7 8.2 0.5 7.9 0.3 8 -0.1 7.9 0.1 7.8 0.1 8.2 -0.4 8 0.2 0.7 12. Madhya Pradesh 20.5 20.2 0.3 19.8 0.4 19.4 0.4 19.2 0.2 18.9 0.3 18.7 0.2 18.6 0.1 1.9 13. Maharashtra 12.3 11.8 0.5 11.5 0.3 11.3 0.2 10.9 0.4 10.6 0.3 10.3 0.3 10.3 0 2 14. Odisha 12.8 12.6 0.2 12.4 0.2 12.3 0.1 12.2 0.1 11.9 0.3 11.6 0.3 11.4 0.2 1.4 15. Punjab 11.4 11 0.4 10.6 0.4 10.1 0.5 9.9 0.2 9.6 0.3 9.4 0.2 9.1 0.3 2.3 16. Rajasthan 21.6 21.3 0.3 21.1 0.2 20.7 0.4 20.6 0.1 20 0.6 19.6 0.4 19.3 0.3 2.3 17. Tamil Nadu 9.2 8.8 0.4 8.5 0.3 8.6 -0.1 8.6 0 8.3 0.3 8.5 -0.2 8.3 0.2 0.9 18. Uttar Pradesh 21.7 21.4 0.3 21 0.4 20.7 0.3 20.5 0.2 20.2 0.3 20 0.2 19.7 0.3 2 19. West Bengal 12.4 12.2 0.2 11.6 0.6 11.2 0.4 11 0.2 10.7 0.3 10.1 0.6 9.7 0.4 2.7 Smaller states 1. Arunachal Pradesh 18.3 17.5 0.8 17 0.5 16.6 0.4 15 1.6 14.6 0.4 14 0.6 13.6 0.4 4.7 2. Goa 7.7 7.7 0 7.5 0.2 7.1 0.4 6.8 0.3 6.6 0.2 6.6 0 6.5 0.1 1.2 3. Himachal Pradesh 13.1 12 1.1 10.4 1.6 10.3 0.1 10 0.3 10 0 9.8 0.2 9.5 0.3 3.6 4. Manipur 10.7 9 1.7 10.2 -1.2 10.9 -0.7 10.7 0.2 10.7 0 10.3 0.4 10.6 -0.3 0.1 5. Meghalaya 17.5 16.7 0.8 16.9 -0.2 17.3 -0.4 16.3 1 16.6 -0.3 16.3 0.3 16.5 -0.2 1 6. Mizoram 13.7 12.3 1.4 13 -0.7 12.8 0.2 13 -0.2 12.5 0.5 12.2 0.3 11.9 0.3 1.8 7. Nagaland 12.6 12.5 0.1 12.3 0.2 12.9 -0.6 13.6 -0.7 13.2 0.4 12.8 0.4 12.4 0.4 0.2 8. Sikkim 14.8 13.7 1.1 12.8 0.9 13.2 -0.4 12.3 0.9 12.3 0 12 0.3 11.9 0.1 2.9 9. Tripura 10.3 10.3 0 10.5 -0.2 9.5 1 9.7 -0.2 9.9 -0.2 9.4 0.5 9.2 0.2 1.1 10. Uttarakhand 13.6 14.2 -0.6 13.6 0.6 13.6 0 13.2 0.4 13 0.2 12.8 0.2 12.4 0.4 1.2 Union Territories 1. Andaman & Nicobar 11.1 10.7 0.4 11.3 -0.6 12.1 -0.8 12.2 -0.1 11.3 0.9 10.5 0.8 10.3 0.2 0.8 2. Chandigarh 12.7 11.8 0.9 11.7 0.1 11.9 -0.2 12 -0.1 11.6 0.4 11 0.6 10.8 0.2 1.9 3. Dadra & Nagar Haveli 24.3 23.3 1 22.9 0.4 21.6 1.3 22.1 -0.5 21.9 0.2 21.4 0.5 21.1 0.3 3.2 4. Daman & Diu 13.5 12.9 0.6 12.2 0.7 12.2 0 14.2 -2 13.9 0.3 13.5 0.4 13.3 0.2 0.2 5. Lakshadweep 12.7 12.5 0.2 11.8 0.7 7.1 4.7 9.2 -2.1 8 1.2 8.3 -0.3 8.4 -0.1 4.3 6. Puducherry 9 8.4 0.6 7.4 1 8.9 -1.5 9.5 -0.6 9.3 0.2 8.9 0.4 8.7 0.2 0.3

4.7
4.3
3.6
3.2
2.9
2.7
2.5
2.5
2.3
2.3
2.2
2.1
2
2
1.9
1.9
1.8
1.8
1.7
1.7
1.4
1.2
1.2
1.2
1.2
1.1
1
0.9
0.9
0.8
0.8
0.7
0.3
0.2
0.2
0.1
0 0.5 1 1.5 2 2.5 3 3.5 4 4.5 5
Arunachal Pradesh
Lakshadweep
Himachal Pradesh
Dadra & Nagar Haveli
Sikkim
West Bengal
Haryana
Chhattisgarh
Punjab
Rajasthan
Gujarat
Karnataka
Maharashtra
Uttar Pradesh
Madhya Pradesh
Chandigarh
India
Mizoram
Andhra Pradesh
Assam
Odisha
Jammu & Kashmir
Goa
Bihar
Uttarakhand
Tripura
Meghalaya
Jharkhand
Tamil Nadu
Delhi
Andaman & Nicobar
Kerala
Puducherry
Nagaland
Daman & Diu
Manipur
Natural Growth Rate (Total Drop)2005-2012
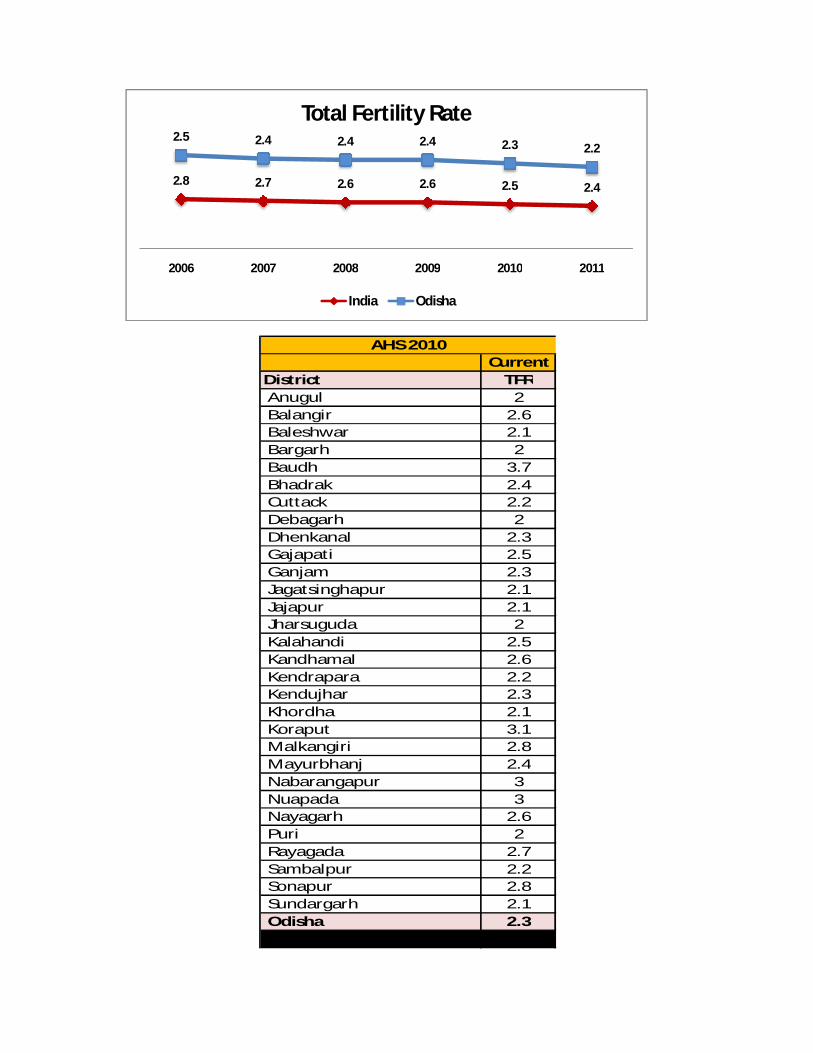
2.8 2.7 2.6 2.6 2.5 2.4
2.5 2.4 2.4 2.4 2.3 2.2
2006 2007 2008 2009 2010 2011
Total Fertility Rate
India Odisha
CurrentDistrict TFR Anugul 2 Balangir 2.6 Baleshwar 2.1 Bargarh 2 Baudh 3.7 Bhadrak 2.4 Cuttack 2.2 Debagarh 2 Dhenkanal 2.3 Gajapati 2.5 Ganjam 2.3 Jagatsinghapur 2.1 Jajapur 2.1 Jharsuguda 2 Kalahandi 2.5 Kandhamal 2.6 Kendrapara 2.2 Kendujhar 2.3 Khordha 2.1 Koraput 3.1 Malkangiri 2.8 Mayurbhanj 2.4 Nabarangapur 3 Nuapada 3 Nayagarh 2.6 Puri 2 Rayagada 2.7 Sambalpur 2.2 Sonapur 2.8 Sundargarh 2.1 Odisha 2.3Average 2.4
AHS 2010