TREGTIA E JASHTME E MALLRAVE SIPAS KARAKTERISTIKAVE...
40
TREGTIA E JASHTME E MALLRAVE SIPAS KARAKTERISTIKAVE TË NDËRMARRJEVE EXTERNAL TRADE IN GOODS BY ENTERPRISES CHARACTERISTICS 2012 - 2016
Transcript of TREGTIA E JASHTME E MALLRAVE SIPAS KARAKTERISTIKAVE...

TREGTIA E JASHTME E MALLRAVE SIPAS
KARAKTERISTIKAVE TË NDËRMARRJEVE
EXTERNAL TRADE IN GOODS BY
ENTERPRISES CHARACTERISTICS
2012 - 2016

TREGTIA E JASHTME E MALLRAVE SIPAS KARAKTERISTIKAVE TË NDËRMARRJEVE 2012 - 2016EXTERNAL TRADE IN GOODS BY ENTERPRISES CHARACTERISTICS 2012 - 2016
Drejtor botimi / Director of Publication : Phd Delina IBRAHIMAJ
Punoi / Prepared: Elsa Dhuli Alma Mara Ana Karbunara
Copyright INSTAT 2017
Ndalohet riprodhimi i këtij botimi apo transmetimi i tij në cilëndo formë,pa autorizimin paraprak me shkrim të mbajtësit të së drejtës së autorit.
No part of this publication can be reproduced or trasmitted in any form or byany means without the prior written permission of the copyright holder.
Përpunimi në kompjuter / Computer procesing: Teuta Topi
INSTITUTI I STATISTIKAVEBlv. “Zhan d’Ark” , Nr. 3, Tiranë / ShqipëriTel: + 355 4 2222411 / 2233356Faks: + 355 4 2228300e-mail: [email protected]
MEDIA - PRINT SH.P.K.Adresa: Rruga “Sulejman Delvina”,Godina Nr. 10, Kati i 2-të, Nr. 3, TiranëCel: 069 40 50 380e-mail: [email protected]
©

PËRMBAJTJACONTENT fq / pg
Hyrje Introduction 4
Treguesit, variablat dhe shpërndarja e informacionit statistikor Indicators, variables and dissemination of statistical information 5
Eksportet sipas karakteristikave të ndërmarrjeve, 2012-2016Exports by enterprises characteristics, 2012-2016 7
Importet sipas karakteristikave të ndërmarrjeve, 2012-2016Imports by enterprises characteristics, 2012-2016 12
Tab. 1 Numri i ndërmarrjeve sipas aktivitetit ekonomik dhe numrit të të punësuarve, 2012-2016 Number of enterprises by economic activity and enterprises size class, 2012-2016 16
Tab. 2 Tregtia e jashtme e mallrave sipas aktivitetit ekonomik dhe numrit të të punësuarve, 2012-2016 External trade in goods enterprises by economic activity and enterprises size class, 2012-2016 16
Tab. 3 Numri i ndërmarrjeve sipas aktivitetit ekonomik dhe disa vendeve partnere, 2012-2016 Number of enterprises by economic activity and some main partner countries, 2012- 2016 18
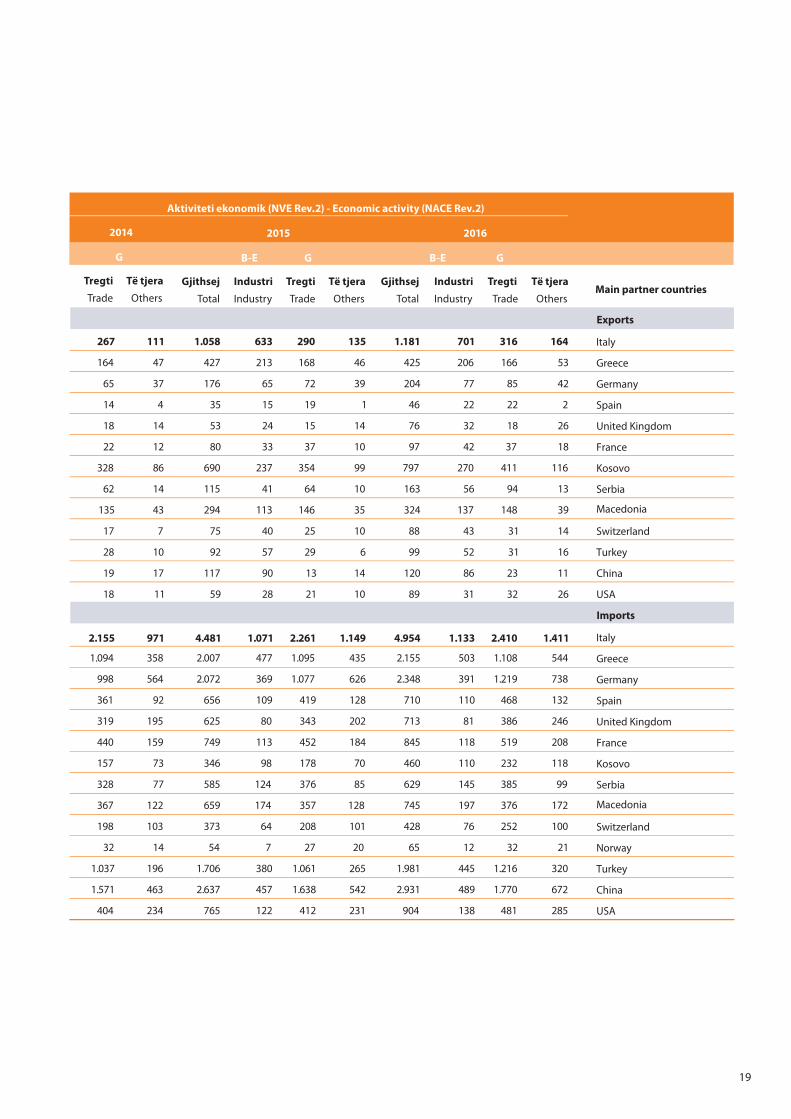
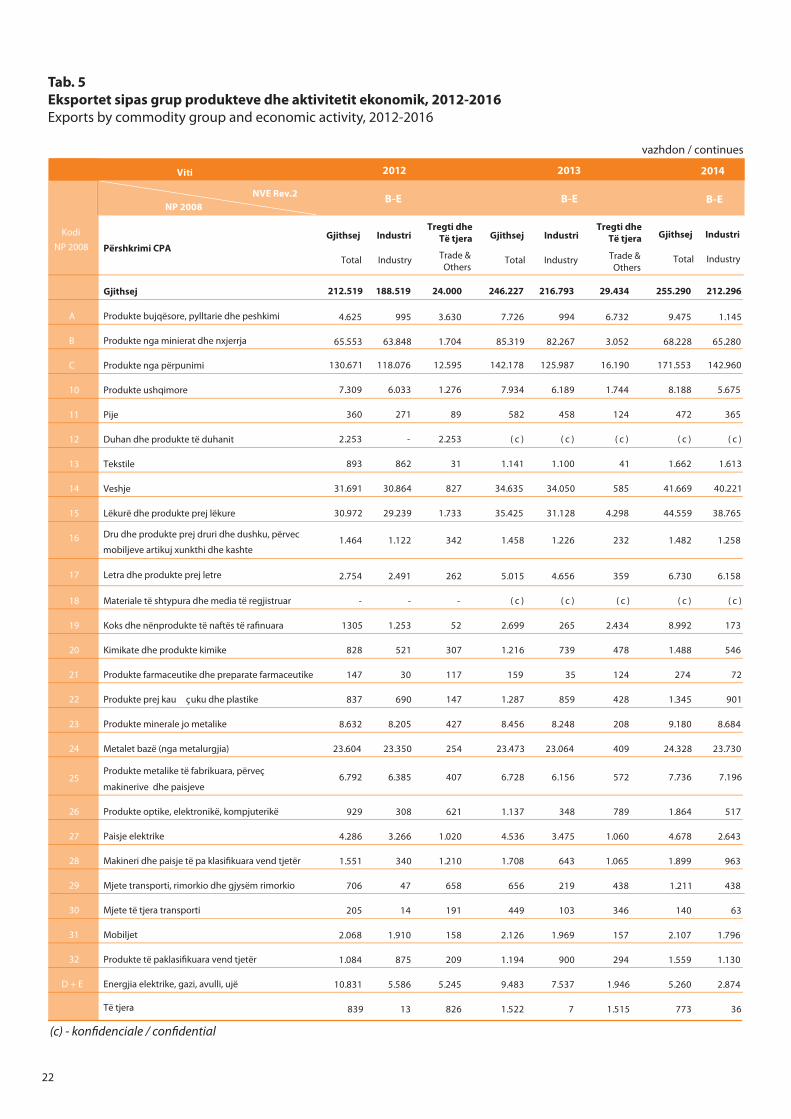
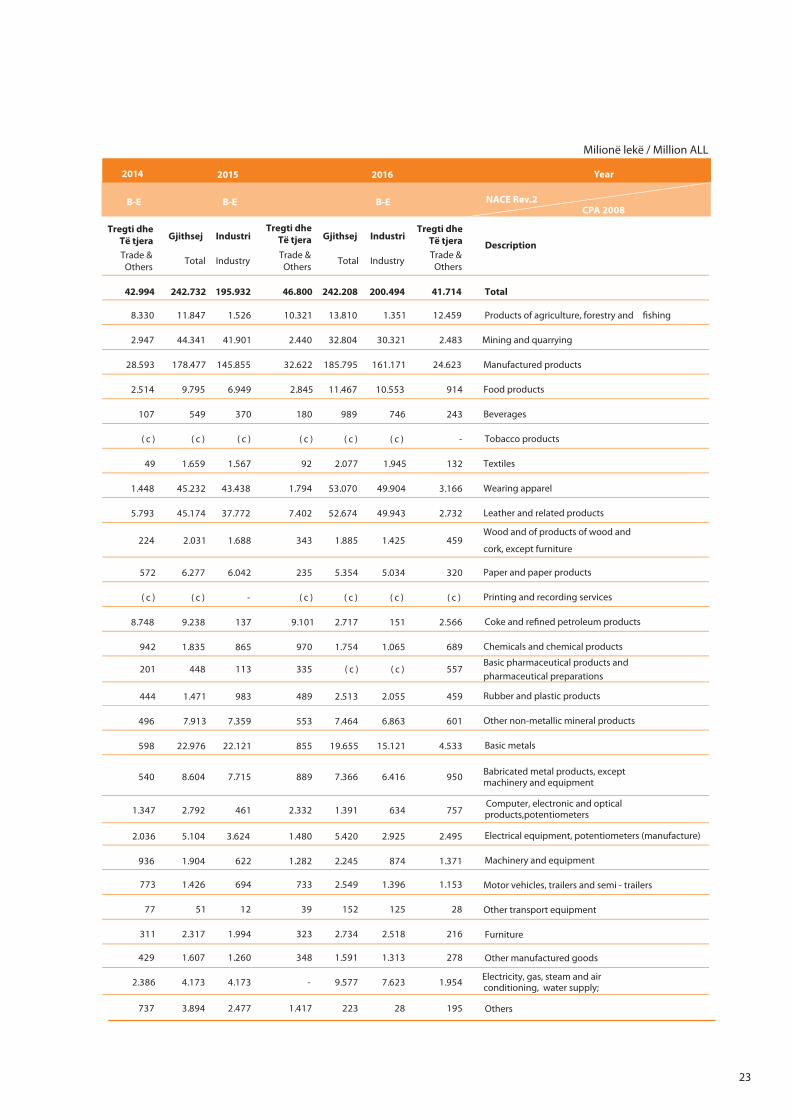
Tab. 4 Tregtia e jashtme e mallrave sipas aktivitetit ekonomik dhe disa vendeve partnere, 2012-2016 External trade in goods by economic activity and some main partner countries, 2012-2016 20 Tab. 5 Eksportet sipas grup produkteve dhe aktivitetit ekonomik, 2012-2016 Exports by commodity group and economic activity, 2012-2016 22
Tab. 6 Importet sipas grup produkteve dhe aktivitetit ekonomik, 2012-2016 Imports by commodity group and economic activity, 2012-2016 24
Tab. 7 Përqëndrimi i tregtisë së jashtme të mallrave sipas aktivitetit ekonomik, 2012-2016 Concentration of external trade by economic activity, 2012- 2016 26
Tab. 8 Numri i ndërmarrjeve sipas numrit të vendeve partnere dhe aktivitetit ekonomik, 2012-2016 Number of enterprises according to number of partner countries and economic activity, 2012-2016 28
Tab. 9 Tregtia e jashtme e mallrave sipas numrit të vendeve partnere dhe aktivitetit ekonomik, 2012-2016 External trade in goods according to number of partner countries and economic activity, 2012-2016 30
SHPJEGUES METODOLOGJIKMETHODOLOGICAL NOTE 32

1. Hyrje
“Tregtia e jashtme sipas karakteristikave të ndërmarrjeve” ka për objektiv të paraqesë statistika mbi tregtinë e mallrave të detajuar sipas kategorive të ndryshme të ndërmarrjeve, gjatë periudhës 2012-2016. Të dhënat përmbajnë informacion thelbësor mbi ndërmarrjet të cilat marrin pjesë në tregun ndërkombëtar dhe karakteristikat e tyre si vlerat e eksport-importeve dhe numri i ndërmarrjeve Nëpërmjet lidhjes së statistikave të tregtisë së jashtme të mallrave me statistikat e ndërmarrjeve kuptojmë kontributin e sektorëve të ndryshëm ekonomikë si dhe pjesëmarrjen e ndërmarrjeve e vogla, të mesme dhe të mëdha në transaksionet tregtare.
Hartimi i statistikave të tregtisë së jashtme të mallrave sipas karakteristikave të ndërmarrjeve kryhet përmes lidhjes në nivel individual të të dhënave të tregtisë së jashtme me regjistrin statistikor të ndërmarrjeve. Karakteristikat kryesore të ndërmarrjeve nga rregjistri statistikor i ndërmarrjeve – si aktiviteti ekonomik dhe numri i të punësuarve – janë të kombinuar me variablat tipikë të të dhënave të tregtisë së jashtme si kodi i produktit dhe vendi partner, duke na dhënë në këtë mënyrë një pamje më të plotë të strukturës së tregtisë së jashtme të mallrave.
Treguesit kryesor të cilat janë marrë në analizë në këtë publikim janë:• Numri i ndërmarrjeve që kryejnë eksporte / importe sipas
aktivitetit ekonomik ;• Numri i ndërmarrjeve që kryejnë eksporte / importe sipas
madhësisë së ndërmarrjeve përcaktuar nga numri i të punësuarve;
• Tregtia e mallrave sipas aktivitetit ekonomik;• Tregtia e mallrave sipas madhësisë së ndërmarrjeve
përcaktuar nga numri i të punësuarve;• Numri i ndërmarrjeve sipas aktivitetit ekonomik dhe
partnerëve kryesorë;• Tregtia e mallrave sipas aktivitetit ekonomik dhe
partnerëve kryesorë;• Eksportet / importet sipas grupprodukteve dhe aktivitetit
kryesor;• Përqëndrimi i tregtisë së mallrave sipas aktivitetit
ekonomik;• Numri i ndërmarrjeve sipas numrit të vendeve partnere
dhe aktivitetit ekonomik;• Tregtia e mallrave sipas numrit të vendeve partnere dhe
aktivitetit ekonomik.
Për prodhimin e treguesve statistikorë të mësipërm janë marrë në konsideratë dy prej variablave kryesorë statistikorë, vlera e mallrave të tregtuara (importuara / eksportuara) dhe numri i ndërmarrjeve. Vlera e mallrave i referohet informacionit të siguruar nga skedari kryesor i importeve dhe eksporteve, ndërsa regjistri i ndërmarrjeve i referohet Regjistrit Statistikor të Ndërmarrjeve.
4
1. Introduction
“External trade in goods by enterprises characteristics”, aims to provide statistics on detailed trade of goods by different char-acteristic of enterprises, for the period 2012- 2015. The data contain essential information on enterprises participating in the international market and their characteristics as export-import values and number of enterprises.The linkage between external trade statistics to goods with enterprise statistics help to understand the contribution of various economic sectors as well as the participation of small, medium and large enterprises in trade transactions.
The calculation of external trade in goods statistics by enter-prise characteristics requires the linkage of Trade Register and Business Register in detail level. The most important variables from Business Register (economic activity and number of em-ployee) are linked with typical external trade variables (prod-ucts code and trade partner). From this point of view it is pos-sible a full picture of external trade in goods structure.
The main indicators that are taken for analysis in this publica-tion are: • Number of enterprises carrying out exports / imports by
economic activity• Number of enterprises carrying out exports / imports by
size of enterprises determined by the number of employ-ees;
• External trade in goods by economic activity• External trade in goods by size of enterprises• Number of enterprises by economic activity and main
partners • External trade in goods by economic activity and main
partners;• Exports/Imports by group of goods and main activity • Concentration of trade of goods by economic activity;• Number of enterprises by number of partner countries
and economic activity• Trade of goods by number of partner countries and eco-
nomic activity
For statistical indicators production have been considered two of the statistical value main variables: the value of traded goods (import/export) and the number of enterprises. The value of the goods refers to the information provided by the main import and export file, while the enterprise register re-fers to the Statistical Register of Enterprises.

5
Ky publikim mbulon informacion statistikor të ndarë sipas:
• Aktivitetet ekonomike janë analizuar të ndara sipas Nomenklaturës së Veprimtarive Ekonomike dhe mbulojnë:
o Aktivitetet ekonomike gjithsej;o Aktivitetet Industri, Tregti dhe Të Tjera;o Produktet sipas aktivitetit ekonomik• Ndërmarrjet janë analizuar sipas numrit të të punësuarve dhe janë ndarë sipas grupeve :o Mikro - me 0 - 9 të punësuar ;o Të vogla - me 10 - 49 të punësuar;o Të mesme - me 50 – 249 të punësuar;o Të mëdha - me mbi 250 të punësuar.
• Vendet partnere të cilat kanë marrë pjesë në shkëmbimin e mallrave janë grupuar sipas:o Vendeve të Bashkimit Evropian;o Vendeve anëtare të CEFTAo Vendeve anëtare EFTA
This publication covers:
• Economic activities are classifyed separately by: Nomenclature of Economic Activities and cover:o Total Economic activities; o Industry, Trade and Other; o Products by Economic -Industry activity;• Enterprises are grouped according to the number of employees and are divided by: o Micro - enterprise with 1-9 employees ;o Small - enterprise with 10 to 49 employees; o Medium - enterprise with 50 to 249 employees; o Large - enterprise with over 250 employees. • Partner countries which have participated in the exchange of goods are grouped by:o European Union countries; o CEFTA member countries; o EFTA member countries.
6
KORÇË
DIBËR
FIER
VLORË
ELBASAN
KUKËS
SHKODËR
BERAT
LEZHË
TIRANË
GJIROKASTËR
DURRËS
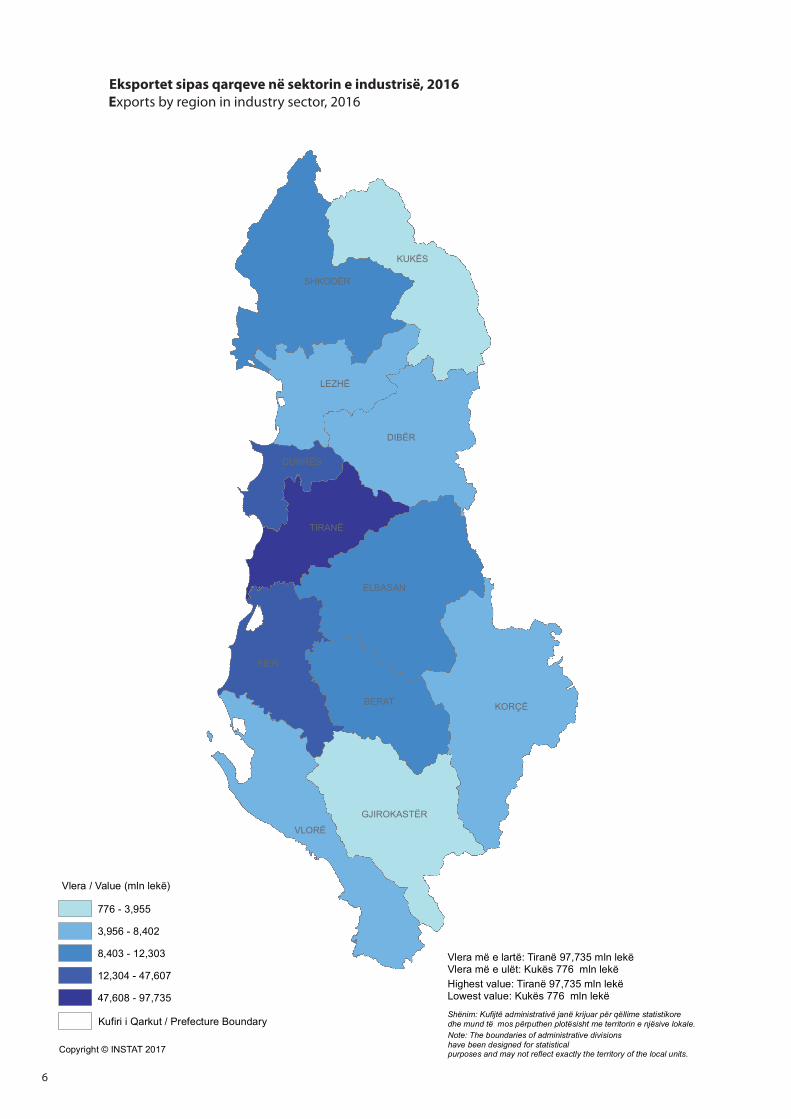
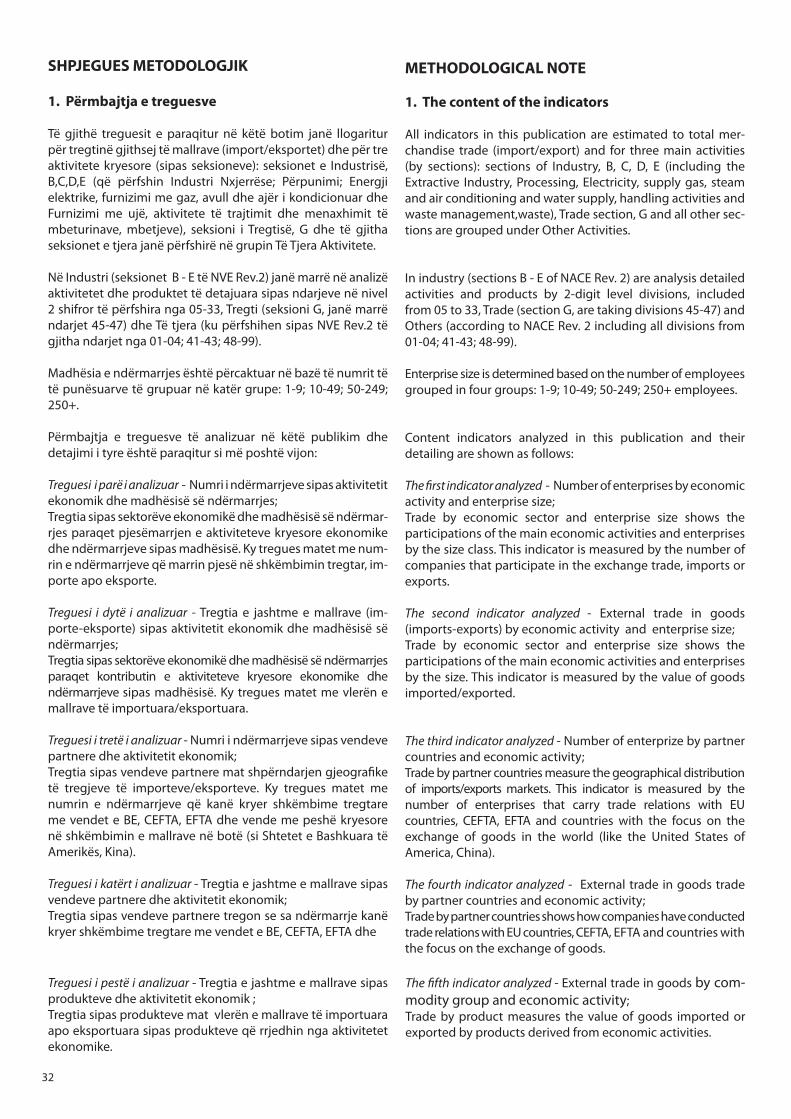
Vlera më e lartë: Tiranë 97,735 mln lekëVlera më e ulët: Kukës 776 mln lekë
Vlera / Value (mln lekë)
Copyright © INSTAT 2017
Kufiri i Qarkut / Prefecture BoundaryShënim: Kufijtë administrativë janë krijuar për qëllime statistikoredhe mund të mos përputhen plotësisht me territorin e njësive lokale.Note: The boundaries of administrative divisions have been designed for statistical purposes and may not reflect exactly the territory of the local units.
Highest value: Tiranë 97,735 mln lekëLowest value: Kukës 776 mln lekë
776 - 3,955
3,956 - 8,402
8,403 - 12,303
12,304 - 47,607
47,608 - 97,735
Eksportet sipas qarqeve në sektorin e industrisë, 2016 Exports by region in industry sector, 2016
7
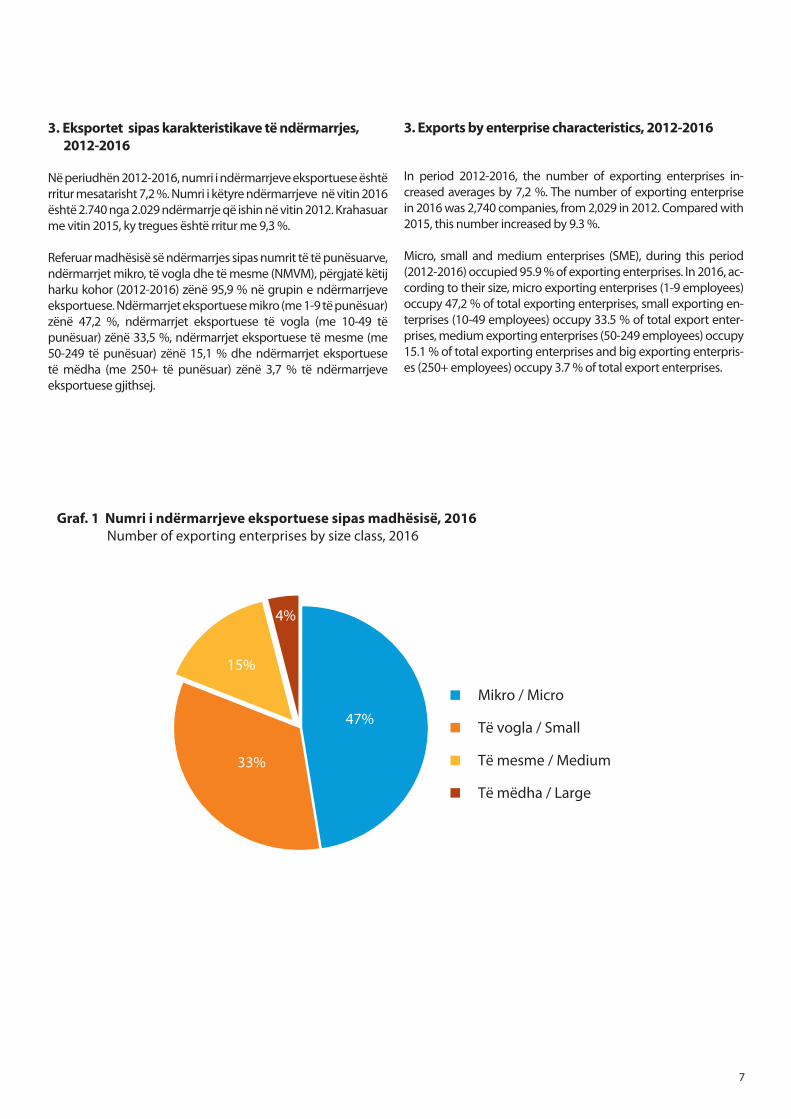
Graf. 1 Numri i ndërmarrjeve eksportuese sipas madhësisë, 2016 Number of exporting enterprises by size class, 2016
3. Exports by enterprise characteristics, 2012-2016
In period 2012-2016, the number of exporting enterprises in-creased averages by 7,2 %. The number of exporting enterprise in 2016 was 2,740 companies, from 2,029 in 2012. Compared with 2015, this number increased by 9.3 %.
Micro, small and medium enterprises (SME), during this period (2012-2016) occupied 95.9 % of exporting enterprises. In 2016, ac-cording to their size, micro exporting enterprises (1-9 employees) occupy 47,2 % of total exporting enterprises, small exporting en-terprises (10-49 employees) occupy 33.5 % of total export enter-prises, medium exporting enterprises (50-249 employees) occupy 15.1 % of total exporting enterprises and big exporting enterpris-es (250+ employees) occupy 3.7 % of total export enterprises.
Mikro / Micro
Të vogla / Small
Të mesme / Medium
Të mëdha / Large
47%
33%
15%
4%
3. Eksportet sipas karakteristikave të ndërmarrjes, 2012-2016
Në periudhën 2012-2016, numri i ndërmarrjeve eksportuese është rritur mesatarisht 7,2 %. Numri i këtyre ndërmarrjeve në vitin 2016 është 2.740 nga 2.029 ndërmarrje që ishin në vitin 2012. Krahasuar me vitin 2015, ky tregues është rritur me 9,3 %.
Referuar madhësisë së ndërmarrjes sipas numrit të të punësuarve, ndërmarrjet mikro, të vogla dhe të mesme (NMVM), përgjatë këtij harku kohor (2012-2016) zënë 95,9 % në grupin e ndërmarrjeve eksportuese. Ndërmarrjet eksportuese mikro (me 1-9 të punësuar) zënë 47,2 %, ndërmarrjet eksportuese të vogla (me 10-49 të punësuar) zënë 33,5 %, ndërmarrjet eksportuese të mesme (me 50-249 të punësuar) zënë 15,1 % dhe ndërmarrjet eksportuese të mëdha (me 250+ të punësuar) zënë 3,7 % të ndërmarrjeve eksportuese gjithsej.

8
Sektori i industrisë është sektori që mbizotëron në eksportet e mallrave
Në ndërmarrjet eksportuese mbizotërojnë, ndërmarrjet që operojnë në sektorin e industrisë, ku përfshihen aktivitetet e industrisë nxjerrëse, përpunuese, energji elektrike dhe ujë. Për periudhën 2012-2016, vlera e eksporteve e kryer nga ndërmarrjet që operojnë në këtë sektor, zë 84,5 % të vlerës së eksporteve gjithsej. Referuar të njejtës periudhë, ky tregues ka patur një rritje mesatare prej 3,1 %. Në vitin 2016, vlera e eksporteve të kryera nga ndërmarrjet që operojnë në industri është rritur me 2,3 %, krahasuar me vitin 2015, ndërsa krahasuar me mesataren vjetore të kësaj periudhe është ulur me 1,1 %.Në vitin 2016, ndërmarrjet e mëdha zënë 45,0 % të vlerës së eksporteve të ndërmarrjeve që operojnë në sektorin e industrisë. Ndërmarrjet mikro, të vogla dhe të mesme zënë 93,9 % të vlerës së eksporteve të ndërmarrjeve që operojnë në sektorin e tregtisë.
Graf. 2 Eksportet e mallrave sipas sektorëve kryesorë Exports of goods by main sectors
%
Industrial sector is the main sector in exports of goods
In exporting enterprises predominate, enterprises operating in the industry sector, including extractive, processing, electricity and water activities.For the period 2012-2016, the value of exports made by enterprises operating in this sector amounts to 84.5% of the total exports value. Referring to the same period, this indicator had an average growth of 3.1%.In 2016, the value of exports made by enterprises operating in the industry increased by 2.3% compared to 2015, compared with the annual average of this period decreased by 1.1%.In 2016, large enterprises account for 45.0% of the value of exports of enterprises operating in the industry sector. Micro, small and medium enterprises account for 93.9% of the value of exports of enterprises operating in the trade sector.
Eksportet e ndërmarrjeve sipas vendeve partnere
Gjatë periudhës 2012-2016, vlera e eksporteve drejt vendeve të BE zë mesatarisht 76,6 %, ndërkohë në vitin 2016 ky tregues është 77,8 %. Në vlerën e eksporteve, përgjatë kësaj periudhe, mbizotërojnë ndërrmarrjet që operojnë në sektorin e industrisë me mesatarisht 84,7 %, ndërkohë në vitin 2016 eksportet nga ky aktivitet zënë 82,8 %. Pjesën më të madhe të vlerës së eksporteve drejt vendeve të BE, në vitin 2016 e zë Italia me 71,6 %, me produkte industriale. Ndërsa, në periudhën 2012-2016, përsa i përket numrit të ndërmarrjeve, rritjen mesatare më të lartë e kanë patur drejt Kinës me 9,2 %. Eksportet e ndërmarrjeve të industrisë drejt vendeve anëtare të CEFTA zënë 9,5 % të eksporteve të këtij sektori, duke u ulur me 5,4 % krahasuar me vitin 2015 dhe dhe ulur me 1,7 % krahasuar me mesataren vjetore të kësaj periudhe.
Exports of enterprises by partner countries
During the 2012-2016 period, the value of exports to EU countries averages 76.6%, while in 2016 this indicator is 77.8%.In the value of exports, during this period, enterprises operating in the industry sector dominate by an average of 84.7%, while in 2016 exports from this activity account for 82.8%.
Most of the value of exports to EU countries, in 2016, Italy accounts for 71.6% with industrial products. While in the 2012-2016 period, with regard to the number of enterprises, China’s highest growth rate was 9.2%
Exports of industrial enterprises to the CEFTA member countries occupy 9.5 % of the exports value of the sector, decreasing by 5.4 % compared with 2015 and decreasing by 1.7 % compared with annual average of this period.
0 %
10 %
20 %
30 %
40 %
50 %
60 %
70 %
80 %
90 %
Industri Tregti Të tjera
2016 2015 2014 2013 2012
Industry Trade Other
9
Eksportet e ndërmarrjeve sipas produkteve
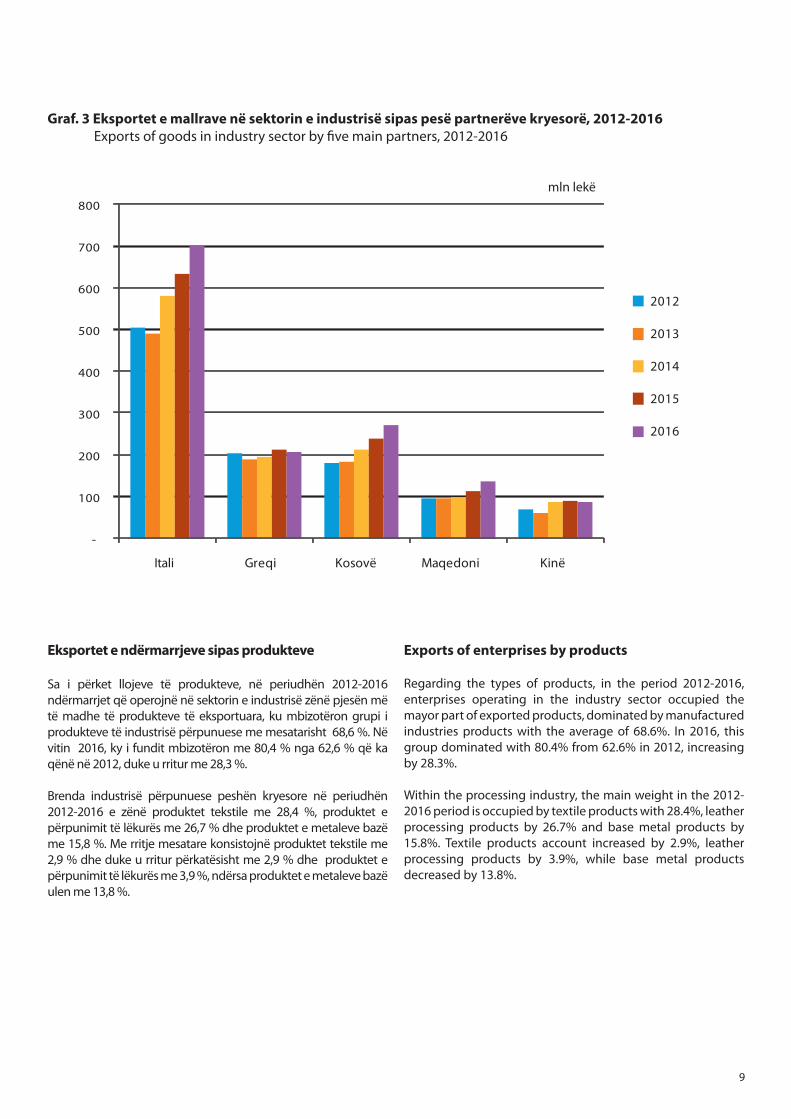
Sa i përket llojeve të produkteve, në periudhën 2012-2016 ndërmarrjet që operojnë në sektorin e industrisë zënë pjesën më të madhe të produkteve të eksportuara, ku mbizotëron grupi i produkteve të industrisë përpunuese me mesatarisht 68,6 %. Në vitin 2016, ky i fundit mbizotëron me 80,4 % nga 62,6 % që ka qënë në 2012, duke u rritur me 28,3 %.
Brenda industrisë përpunuese peshën kryesore në periudhën 2012-2016 e zënë produktet tekstile me 28,4 %, produktet e përpunimit të lëkurës me 26,7 % dhe produktet e metaleve bazë me 15,8 %. Me rritje mesatare konsistojnë produktet tekstile me 2,9 % dhe duke u rritur përkatësisht me 2,9 % dhe produktet e përpunimit të lëkurës me 3,9 %, ndërsa produktet e metaleve bazë ulen me 13,8 %.
Regarding the types of products, in the period 2012-2016, enterprises operating in the industry sector occupied the mayor part of exported products, dominated by manufactured industries products with the average of 68.6%. In 2016, this group dominated with 80.4% from 62.6% in 2012, increasing by 28.3%.
Within the processing industry, the main weight in the 2012-2016 period is occupied by textile products with 28.4%, leather processing products by 26.7% and base metal products by 15.8%. Textile products account increased by 2.9%, leather processing products by 3.9%, while base metal products decreased by 13.8%.
Exports of enterprises by products
Graf. 3 Eksportet e mallrave në sektorin e industrisë sipas pesë partnerëve kryesorë, 2012-2016 Exports of goods in industry sector by five main partners, 2012-2016
-
100
200
300
400
500
600
700
800
Itali Greqi Kosovë Maqedoni Kinë
2012
2013
2014
2015
2016
mln lekë

10
Përqëndrimi i ndërmarrjeve eksportuese
Për periudhën 2012-2016, 50,0 % e vlerës së eksporteve është dhënë nga 20 ndërmarrjet më të mëdha. Në vitin 2016 ky përqendrim është ulur dhe ka arritur në 37,3 %. Në 2016, duke u nisur nga aktiviteti ekonomik ku ato operojnë, 20 ndërmarrjet e sektorit të industrisë dhe tregtisë zënë përkatësisht 35,2 % dhe 42,5 % të eksporteve të këtyre sektorëve. Në sektorët e tjerë (përjashtuar Industri dhe Tregti), 10 janë ndërmarjet më të mëdha të cilat zënë 56,4 % të eksporteve të këtij sektori.
Ndarja e ndërmarrjeve eksportuese, sipas vendeve partnere
Në periudhën 2012-2016, 68,0 % e ndërmarrjeve eksportuese, kryejnë eksport vetëm drejt një vendi partner, ndërsa në 2016 ky tregues është 64,9 %. Në 2016, pjesa e eksporteve të ndërmarrjeve me një vend partner zë 64,9 % të eksporteve gjithsej, e ndjekur nga ndërmarrjet që eksportojnë drejt 2 vendeve partnere me 16,9 % të eksporteve.
The concentration of exported goods
For the period 2012-2016, 50.0 % of the value of exports was provided by the 20 largest enterprises. In 2016 this concentration has decreased to 37.3 %. In 2016 based on economic activity in which they operate, 20 enterprises of the industrial and trade sector represent respectively 35.2 % and 42.5 % of exports of these sectors. While in other sectors (excluding Industry and Trade), are 10 large enterprises, which occupy 56.4 % of exports in this sector.
The share of exports enterprises by partner countries
In 2012-2016, 68.0 % of exporting enterprises export only to one partner country, while in 2016 this indicator is 64.9 %. In 2016, the share of exports to one partner country occupied 64.9 % of total exports, followed by exports to two partner countries with 16.9 % of exports.
Graf. 4 Eksportet e mallrave sipas grup produkteve, 2016 Exports of goods according the group products, 2016
0,7
15,1
80,4
4,0
Produkte bujqësore, pylltarie dhe peshkimi
Produkte nga minierat dhe nxjerrja
Produkte nga përpunimi
Energjia elektrike, gazi, avulli, uji

11
KORÇË
DIBËR
FIER
VLORË
ELBASAN
KUKËS
SHKODËR
BERAT
LEZHË
TIRANË
GJIROKASTËR
DURRËS
Vlera më e lartë: Tiranë 346,093 mln lekëVlera më e ulët: Dibër 2,068 mln lekë
Vlera / Value (mln lekë)
Copyright © INSTAT 2017
Shënim: Kufijtë administrativë janë krijuar për qëllime statistikoredhe mund të mos përputhen plotësisht me territorin e njësive lokale.Note: The boundaries of administrative divisions have been designed for statistical purposes and may not reflect exactly the territory of the local units.
Highest value: Tiranë 346,093 mln lekëLowest value: Dibër 2,068 mln lekë
2,068 - 3,923
3,924 - 15,923
15,924 - 21,110
21,111 - 84,469
84,470 - 346,093
Kufiri i Qarkut / Prefecture Boundary
Importet sipas qarqeve në sektorin e tregtisë, 2016 Imports by region in the trade sector, 2016

12
4. Importet sipas karakteristikave të ndërmarrjes, 2012-2016
Në periudhën 2012-2016, numri i ndërmarrjeve importuese nga kombinimi i të dhënave të tregtisë jashtme të mallrave me regjistrin e ndërmarrjeve ka ardhur duke u rritur. Numri i ndër-marrjeve importuese nga 7.347 ndërmarrje të konstatuara në vitin 2012 shkon në 10.038 ndërmarrje në vitin 2016. Krahas-uar me vitin 2015, ky numër është rritur me 13.1 %, ndërsa kra-hasuar me mesataren vjetore të kësaj periudhe është rritur me 18,9 %.
Sipas definicionit, ndërmarrjet mikro, të vogla dhe të mesme (NMVM), përgjatë këtij harku kohor (2012-2016) zënë, në grupin e ndërmarrjeve për aktivitetin importues, mesatarisht në vit 98,2 % të ndërmarrjeve importuese gjithsej. Ndërmarrjet importuese, në vitin 2016, mikro (1-9 të punësuar) zënë 68,0 % të ndërmarrjeve importuese gjithsej, ndërmarrjet importuese të vogla (10-49 të punësuar) zënë 22,7 % të ndërmarrjeve importuese gjithsej, ndërmarrjet importuese të mesme (me 50-249 të punësuar) zënë 7,2 % të ndërmarrjeve importuese gjithsej dhe ndërmarrjet importuese të mëdha (me 250+ të punësuar) zënë 1,7 % të ndërmarrjeve importuese gjithsej.
4. Imports by enterprise characteristics, 2012-2016
In period 2012-2016, the number of exporting and importing enterprises from the merger of the Trade Register and Enter-prises Register has been increasing. The number of importing enterprises from 7.347 companies in 2012 goes 10.038 com-panies in 2016. Compared with 2015, this number increased by 13.1 % and 18.9 % compared with annual average of this period.
Micro, small and medium enterprises (SME), during this period (2012-2016) dominated the group of companies for importer activity, representing 98.2 % of total import enterprises. In 2016, micro importing enterprises (1-9 employees) occupy 68.0 % of total importing enterprises, small importing enter-prises (10-49 employees) occupy 22.7 % of total importing enterprises, medium importing enterprises (with 50- 249 em-ployees) occupy 7.2 % of total importing enterprises and large importing enterprises (with 250+ employees) occupy 1.7 % of total import enterprises.
Graf. 5 Numri i ndërmarrjeve importuese sipas madhësisë, 2016 Number of importing enterprises by size class, 2016
Mikro / Micro
Të vogla / Small
Të mesme / Medium
Të mëdha / Large
68 %
23 %
7 %
2 %
13
Trade sector is the main sector in imports of goods
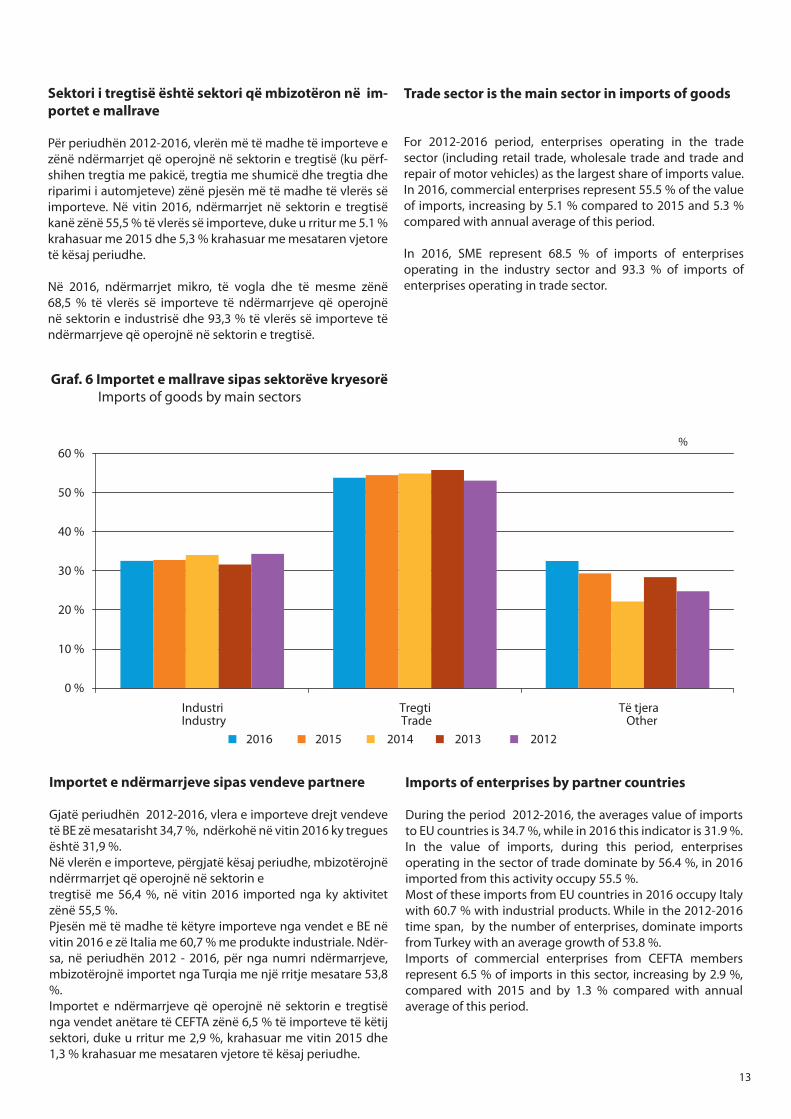
For 2012-2016 period, enterprises operating in the trade sector (including retail trade, wholesale trade and trade and repair of motor vehicles) as the largest share of imports value. In 2016, commercial enterprises represent 55.5 % of the value of imports, increasing by 5.1 % compared to 2015 and 5.3 % compared with annual average of this period.
In 2016, SME represent 68.5 % of imports of enterprises operating in the industry sector and 93.3 % of imports of enterprises operating in trade sector.
Sektori i tregtisë është sektori që mbizotëron në im-portet e mallrave
Për periudhën 2012-2016, vlerën më të madhe të importeve e zënë ndërmarrjet që operojnë në sektorin e tregtisë (ku përf-shihen tregtia me pakicë, tregtia me shumicë dhe tregtia dhe riparimi i automjeteve) zënë pjesën më të madhe të vlerës së importeve. Në vitin 2016, ndërmarrjet në sektorin e tregtisë kanë zënë 55,5 % të vlerës së importeve, duke u rritur me 5.1 % krahasuar me 2015 dhe 5,3 % krahasuar me mesataren vjetore të kësaj periudhe.
Në 2016, ndërmarrjet mikro, të vogla dhe të mesme zënë 68,5 % të vlerës së importeve të ndërmarrjeve që operojnë në sektorin e industrisë dhe 93,3 % të vlerës së importeve të ndërmarrjeve që operojnë në sektorin e tregtisë.
Graf. 6 Importet e mallrave sipas sektorëve kryesorë Imports of goods by main sectors
Importet e ndërmarrjeve sipas vendeve partnere
Gjatë periudhën 2012-2016, vlera e importeve drejt vendeve të BE zë mesatarisht 34,7 %, ndërkohë në vitin 2016 ky tregues është 31,9 %.Në vlerën e importeve, përgjatë kësaj periudhe, mbizotërojnë ndërrmarrjet që operojnë në sektorin etregtisë me 56,4 %, në vitin 2016 imported nga ky aktivitet zënë 55,5 %.Pjesën më të madhe të këtyre importeve nga vendet e BE në vitin 2016 e zë Italia me 60,7 % me produkte industriale. Ndër-sa, në periudhën 2012 - 2016, për nga numri ndërmarrjeve, mbizotërojnë importet nga Turqia me një rritje mesatare 53,8 %. Importet e ndërmarrjeve që operojnë në sektorin e tregtisë nga vendet anëtare të CEFTA zënë 6,5 % të importeve të këtij sektori, duke u rritur me 2,9 %, krahasuar me vitin 2015 dhe 1,3 % krahasuar me mesataren vjetore të kësaj periudhe.
%
Imports of enterprises by partner countries
During the period 2012-2016, the averages value of imports to EU countries is 34.7 %, while in 2016 this indicator is 31.9 %.In the value of imports, during this period, enterprises operating in the sector of trade dominate by 56.4 %, in 2016 imported from this activity occupy 55.5 %.Most of these imports from EU countries in 2016 occupy Italy with 60.7 % with industrial products. While in the 2012-2016 time span, by the number of enterprises, dominate imports from Turkey with an average growth of 53.8 %.Imports of commercial enterprises from CEFTA members represent 6.5 % of imports in this sector, increasing by 2.9 %, compared with 2015 and by 1.3 % compared with annual average of this period.
0 %
10 %
20 %
30 %
40 %
50 %
60 %
Industri Tregti Të tjera
2016 2015 2014 2013 2012Industry Trade Other

14
Graf. 7 Importet e mallrave në sektorin e tregtisë sipas pesë vendeve partnere, 2016 Imports of goods in trade sector by five partner countries, 2016
Imports of enterprises by products
Regarding the types of products, in the period 2012-2016, the products obtained from the processing industry were imported average by 58.3 % from the enterprises operating in the trade sector and by 31.9 % from the enterprises operating in the processing industry sector. Here we can mention a group of food products which average 15.4 % and refined petroleum products and petroleum products with 17.2 %.
In 2016, trade enterprises imported 54.6 % of manufactured products, increasing by 5.6 % compared with 2015 and 16.7 % compared with annual average of this period; while industrial enterprises imported 31.9 % of manufactured products, increasing by 12.5 % compared to 2015 and 13.2 % compared with annual average of this period.
Importet e ndërmarrjeve sipas produkteve
Sa i përket llojeve të produkteve, në periudhën 2012-2016 produktet e përftuara nga industria përpunuese janë impor-tuar mesatarisht 58,3 % nga ndërmarrjet që operojnë në sek-torin e tregtisë dhe 31,9 % nga ndërmarrjet që operojnë në sektorin e industrisë përpunuese. Këtu mund të përmendim grup produktet ushqimore të cilat zënë mesatarisht 15,4 % dhe produktet e koks dhe nënprodukte të naftës të rafinuara me 17,2 %.
Në 2016, ndërmarrjet e tregtisë importuan 54,6 % të produk-teve nga industria përpunuese, duke u rritur 5,6 %, krahasuar me vitin 2015 dhe 16,7 %, krahasuar me mesataren vjetore të kësaj periudhe. Ndërmarrjet në sektorin e industrisë impor-tuan 31,9 % të produkteve nga përpunimi, ku krahasuar me 2015 rezultojnë me 12,5 % rritje dhe 13,2 % rritje krahasuar me mesataren vjetore të kësaj periudhe.
mln lekë
-
10.000
20.000
30.000
40.000
50.000
60.000
70.000
80.000
90.000
100.000
Itali Greqi Gjermani Turqi Kinë
2012 2013 2014 2015 2016

15
Graf. 8 Importet e mallrave sipas grup produkteve, 2016 Imports of goods by group products, 2016
4,3 0,3
92,3
2,1
Produkte bujqësore,
pylltarie dhe peshkimi
Produkte nga minierat
dhe nxjerrja
Produkte nga përpunimi
Energjia elektrike, gazi,
avulli, uji
Përqëndrimi i importeve të mallrave
Përgjatë periudhës 2012-2016, 50,0 % të vlerës së importeve është kryer 50 ndërmarrjet më të mëdha. Në vitin 2016, 100 ndërmarrje më të mëdha zënë 56,3 % të importeve.Duke u nisur nga aktiviteti ekonomik ku ato operojnë, 50 ndërmarrje të sektorit të industrisë dhe të sektorëve të tjerë zënë përkatësisht 49,6 % dhe 60,0 % të importeve të këtyre sektorëve. Në sektorin e tregtisë 100 janë ndërmarrjet më të mëdha të cilat zënë 48,5 % të importeve të këtij sektori.
Ndarja e ndërmarrjeve importuese, sipas vendeve partnere
Në periudhën kohore 2012-2016, 11,6 % e importeve e zënë ndërmarrjet që importojnë vetëm nga një vend partner. Ndër-sa në 2016 ky tregues është 10,6 %.Në vitin 2016, këto ndërmarrje u rritën me 13,8 % krahasuar me 2015 dhe 19,0 % krahasuar me mesataren vjetore të per-iudhës, duke zënë 51,0 % të ndërmarrjeve importuese. Në 2016, pjesa e importeve të ndërmarrjeve nga 2 vende partnere zë 17,9 % të importeve gjithsej, e ndjekur nga ndërmarrjet që importojnë nga 3-5 vende partnere me 17,4 % të importeve.
The concentration of imported goods
During the 2012-2016 period, 50.0 % of the value of imports was provided by the largest 50 enterprises. In 2016, the 100 largest enterprises occupied 56.3 % of imports.Meanwhile based on economic activity in which they oper-ate, 50 enterprises of the industrial sector and other sectors represent respectively 49.6 % and 60.0 % of imports of these sectors. While in trade sector are 100 large enterprises which represent 48.5 % of imports in this sector.
The share of imports enterprises by partner countries
In the 2012-2016 period, 11.6 % of imports are occupied by enterprises that import only from one partner country. While in 2016 this indicator is 10.6 %.In 2016, these enterprises grew 13.8 % for imports compared with 2015 and 19.0 % compared with annual average of this period, representing 51.0 % of importing enterprises. In 2016, the share of importing enterprises by 2 partner countries is 17.9 % of total imports, followed by enterprises that import from 3-5 partner countries with 17.4 % of total imports.

16
Tab. 1Numri i ndërmarrjeve sipas aktivitetit ekonomik dhe numrit të të punësuarve, 2012-2016 Number of enterprises by economic activity and enterprise size class, 2012-2016
B-E G B-E G
Gjithsej Industri Tregti Të tjera Gjithsej Industri Tregti Të tjeraNumri i të
Total Industry Trade Others Total Industry Trade Others
Eksporte
Gjithsej
1-9
10-49
50-249
250+
Importe
Gjithsej
1-9
10-49
50-249
250+
Aktiviteti ekonomik (NVE Rev.2) - Economic activity (NACE Rev.2)
2012 2013
punësuarve
B-E
Gjithsej Industri
Total Industry
2014
2.029 910 769 350 2.236 1.000 838 398 2.387 1.047
1.029 345 503 181 1.143 370 552 221 1.212 392
645 333 208 104 699 358 239 102 755 373
277 189 54 34 308 223 41 44 338 235
78 43 4 31 86 49 6 31 82 47
7.347 1.489 3.819 2.039 7.586 1.526 3.921 2.139 8.357 1.591
5.109 738 3.168 1.203 5.130 713 3.172 1.245 5.845 760
1.645 500 575 570 1.794 515 663 616 1.784 515
482 205 72 205 530 249 75 206 596 264
111 46 4 61 132 49 11 72 132 52
Tab. 2 Tregtia e jashtme e mallrave sipas aktivitetit ekonomik dhe numrit të të punësuarve, 2012-2016 External trade by economic activity and employment size class, 2012-2016
*Vlerësim-Estimation
vazhdon / continues
vazhdon / continues
B-E G B-E G
Gjithsej Industri Tregti Të tjera Gjithsej Industri Tregti Të tjeraNumri i të
Total Industry Trade Others Total Industry Trade Others
Eksporte
Gjithsej
1-9
10-49
50-249
250+
Importe
Gjithsej
1-9
10-49
50-249
250+
Aktiviteti ekonomik (NVE Rev.2) - Economic activity (NACE Rev.2)
2012 2013
punësuarve
B-E
Gjithsej Industri
Total Industry
2014
212.519 188.519 19.134 4.867 246.227 216.793 23.263 6.172 255.290 212.296
17.071 6.834 7.944 2.293 19.803 7.396 9.617 2.790 20.607 8.684
28.377 20.588 7.055 734 30.295 21.108 8.341 846 38.694 20.236
47.205 42.726 3.943 536 51.017 48.245 1.864 908 60.764 55.233
119.866 118.371 191 1.303 145.112 140.043 3.441 1.627 135.224 128.143
506.887 181.499 280.375 45.013 498.967 163.677 288.781 46.509 532.976 188.152
111.629 19.090 78.971 13.567 99.097 10.576 77.933 10.588 111.533 15.205
171.737 33.793 126.734 11.210 162.383 26.322 125.869 10.192 168.659 28.234
118.739 44.377 63.892 10.470 127.798 49.528 68.556 9.714 129.433 51.004
104.783 84.238 10.778 9.766 109.689 77.251 16.423 16.015 123.351 93.708

17
Exports
Total
1-9
10-49
50-249
250+
Imports
Total
1-9
10-49
50-249
250+
B-E G B-E G
Gjithsej Industri Tregti Të tjera Gjithsej Industri Tregti Të tjera
Total Industry Trade Others Total Industry Trade Others
Aktiviteti ekonomik (NVE Rev.2) - Economic activity (NACE Rev.2)
2015 2016
Number of
922 418 2.506 1.117 967 422 2.740 1.190 1.065 485
609 211 1.100 358 527 215 1.299 409 647 243
256 126 913 426 359 128 922 440 340 142
49 54 398 279 66 53 416 282 70 64
8 27 95 54 15 26 103 59 8 36
4.475 2.291 8.878 1.712 4.648 2.518 10.038 1.854 4.964 3.220
3.694 1.391 5.784 732 3.596 1.456 6.850 834 3.942 2.074
679 590 2.226 611 926 689 2.287 641 903 743
90 242 713 313 111 289 725 316 105 304
12 68 155 56 15 84 176 63 14 99
employees Tregti Të tjera
Trade Others
G
2014
Milionë lekë / Million ALL
Exports
Total
1-9
10-49
50-249
250+
Imports
Total
1-9
10-49
50-249
250+
B-E G B-E G
Gjithsej Industri Tregti Të tjera Gjithsej Industri Tregti Të tjera
Total Industry Trade Others Total Industry Trade Others
Aktiviteti ekonomik (NVE Rev.2) - Economic activity (NACE Rev.2)
2015 2016
Number of employees
Tregti Të tjera
Trade Others
G
2014
36.942 6.051 242.732 195.932 40.054 6.746 242.208 200.494 33.637 8.077
10.257 1.666 25.462 9.091 14.363 2.008 30.709 11.512 16.933 2.264
16.912 1.546 38.010 22.996 13.220 1.794 37.572 24.554 10.590 2.428
3.976 1.555 66.907 59.937 5.116 1.854 80.953 74.279 4.059 2.615
5.797 1.284 112.353 103.907 7.356 1.090 92.974 90.149 2.055 770
303.120 41.705 527.790 178.618 296.783 52.389 561.670 188.548 311.810 61.312
85.217 11.111 95.384 16.525 68.959 9.900 115.995 16.153 78.818 21.024
130.256 10.168 172.723 33.254 129.322 10.147 186.812 46.351 128.299 12.162
70.010 8.419 149.407 59.708 76.028 13.671 164.150 66.721 83.697 13.732
17.636 12.007 110.276 69.131 22.474 18.671 94.713 59.323 20.996 14.394

18
Tab. 3Numri i ndërmarrjeve sipas aktivitetit ekonomik dhe disa shteteve kryesore, 2012-2016Number of enterprises by economic activity and some main partner countries, 2012- 2016
Vende partnere
Eksporte
Itali
Greqi
Gjermani
Spanjë
Mbretëri e Bashkuar
Francë
Kosovë
Serbi
Maqedoni
Zvicër
Turqi
Kinë
SHBA
Importe
Itali
Greqi
Gjermani
Spanjë
Mbretëri e Bashkuar
Francë
Kosovë
Serbi
Maqedoni
Zvicër
Norvegji
Turqi
Kinë
SHBA
B-E G B-E G
Aktiviteti ekonomik (NVE Rev.2) - Economic activity (NACE Rev.2)
2012 2013
B-E
2014
Gjithsej Industri Tregti Të tjera Gjithsej Industri Tregti Të tjera
Total Industry Trade Others Total Industry Trade Others
Gjithsej Industri
Total Industry
815 504 224 87 785 491 209 85 959 581
392 202 136 54 342 190 111 41 407 196
132 42 57 33 123 47 44 32 151 49
24 9 12 3 22 10 8 4 30 12
37 13 11 13 36 7 7 22 53 21
57 19 22 16 49 19 22 8 69 35
519 181 274 64 517 182 260 75 625 211
83 29 38 16 69 22 35 12 109 33
244 95 108 41 228 95 97 36 276 98
57 32 16 9 58 28 16 14 58 34
66 33 22 11 59 23 22 14 81 43
97 69 13 15 85 60 15 10 123 87
38 11 14 13 39 12 14 13 48 19
3.681 908 1.916 857 3.761 916 1.924 921 4.122 996
1.793 472 970 351 1.896 473 1.023 400 1.917 465
1.674 316 859 499 1.597 301 819 477 1.902 340
445 74 291 80 441 69 300 72 535 82
517 71 271 175 502 56 256 190 592 78
576 84 351 141 582 80 360 142 688 89
235 60 119 56 252 64 113 75 306 76
412 84 265 63 423 95 260 68 501 96
594 160 304 130 680 160 345 175 658 169
279 45 160 74 307 53 168 86 354 53
38 8 16 14 34 4 16 14 51 5
1.153 273 724 156 1.119 241 704 174 1.575 342
1.975 288 1.261 426 1.946 296 1.260 390 2.395 361
615 82 309 224 631 94 329 208 739 101
vazhdon / continues
19
Main partner countries
Exports
Italy
Greece
Germany
Spain
United Kingdom
France
Kosovo
Serbia
Macedonia
Switzerland
Turkey
China
USA
Imports
Italy
Greece
Germany
Spain
United Kingdom
France
Kosovo
Serbia
Macedonia
Switzerland
Norway
Turkey
China
USA
B-E G B-E G
Gjithsej Industri Tregti Të tjera Gjithsej Industri Tregti Të tjera
Total Industry Trade Others Total Industry Trade Others
Aktiviteti ekonomik (NVE Rev.2) - Economic activity (NACE Rev.2)
2015 2016
Tregti Të tjera
Trade Others
G
2014
267 111 1.058 633 290 135 1.181 701 316 164
164 47 427 213 168 46 425 206 166 53
65 37 176 65 72 39 204 77 85 42
14 4 35 15 19 1 46 22 22 2
18 14 53 24 15 14 76 32 18 26
22 12 80 33 37 10 97 42 37 18
328 86 690 237 354 99 797 270 411 116
62 14 115 41 64 10 163 56 94 13
135 43 294 113 146 35 324 137 148 39
17 7 75 40 25 10 88 43 31 14
28 10 92 57 29 6 99 52 31 16
19 17 117 90 13 14 120 86 23 11
18 11 59 28 21 10 89 31 32 26
2.155 971 4.481 1.071 2.261 1.149 4.954 1.133 2.410 1.411
1.094 358 2.007 477 1.095 435 2.155 503 1.108 544
998 564 2.072 369 1.077 626 2.348 391 1.219 738
361 92 656 109 419 128 710 110 468 132
319 195 625 80 343 202 713 81 386 246
440 159 749 113 452 184 845 118 519 208
157 73 346 98 178 70 460 110 232 118
328 77 585 124 376 85 629 145 385 99
367 122 659 174 357 128 745 197 376 172
198 103 373 64 208 101 428 76 252 100
32 14 54 7 27 20 65 12 32 21
1.037 196 1.706 380 1.061 265 1.981 445 1.216 320
1.571 463 2.637 457 1.638 542 2.931 489 1.770 672
404 234 765 122 412 231 904 138 481 285

20
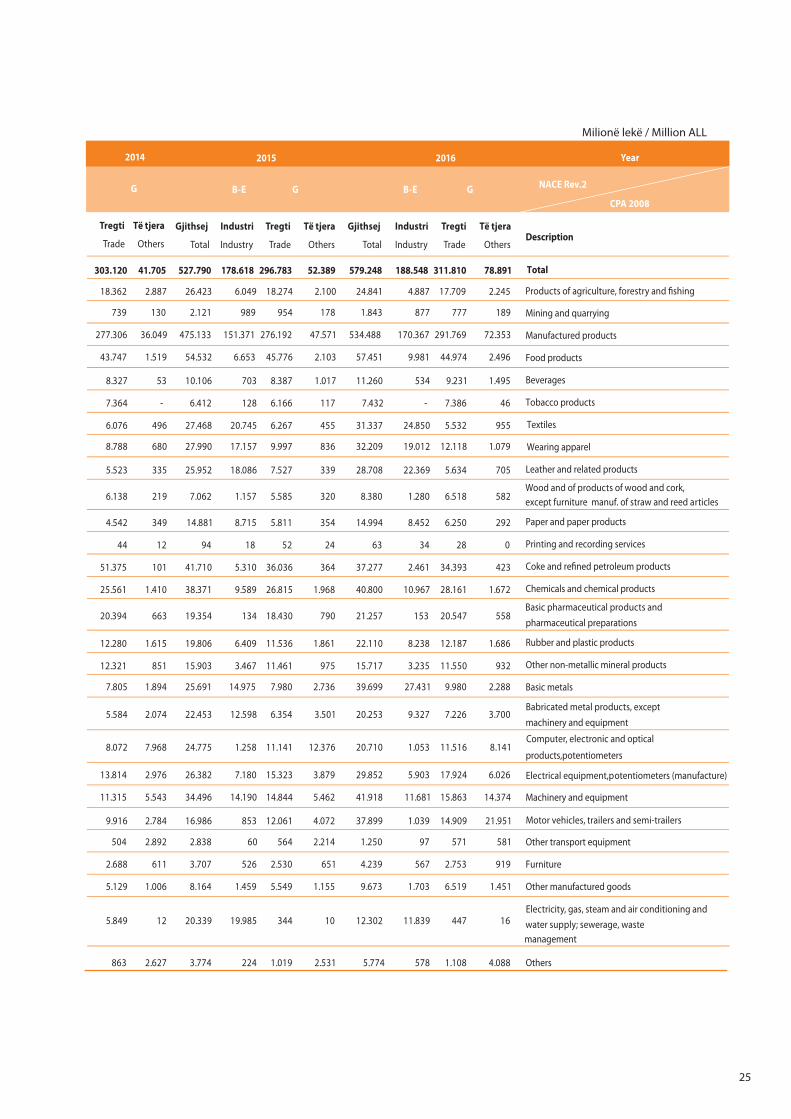
Tab. 4Tregtia e jashtme e mallrave sipas aktivitetit ekonomik dhe disa shteteve kryesore, 2012-2016 External trade by economic activity and some main partner countries, 2012-2016
Eksporte
Vendet e BE
Itali
Greqi
Gjermani
Spanjë
Mbretëri e Bashkuar
Francë
Vendet e CEFTA
Kosovë
Serbi
Maqedoni
Vendet e EFTA
Zvicër
Të tjera
Turqi
Kinë
SHBA
Importe
Vendet e BE
Itali
Greqi
Gjermani
Spanjë
Mbretëri e Bashkuar
Francë
Vendet e CEFTA
Kosovë
Serbi
Maqedoni
Vendet e EFTA
Zvicër
Norvegji
Të tjera
Turqi
Kinë
SHBA
Grup vendet
B-E G B-E G
Aktiviteti ekonomik (NVE Rev.2) - Economic activity (NACE Rev.2)
2012 2013
B-E
2014
Gjithsej Industri Tregti Të tjera Gjithsej Industri Tregti Të tjera
Total Industry Trade Others Total Industry Trade Others
Gjithsej Industri
Total Industry
212.519 188.519 19.134 4.867 246.227 216.793 23.263 6.172 255.290 212.296
160.840 145.948 12.855 2.037 188.906 171.351 14.357 3.199 197.780 173.368
108.862 103.415 4.899 548 114.142 105.523 7.294 1.325 133.044 117.249
9.451 5.076 4.259 116 7.774 5.462 1.921 391 8.847 6.443
6.611 5.173 1.346 92 9.460 7.529 1.537 394 7.201 5.244
19.693 19.536 79 79 24.088 23.980 87 21 16.684 16.586
236 169 9 58 1.450 1.334 41 75 439 328
1.525 1.183 242 100 5.244 4.948 214 82 2.754 2.481
25.174 19.604 3.352 2.218 26.393 20.519 4.849 1.025 29.653 17.590
17.331 13.777 1.667 1.887 16.285 13.400 2.423 462 18.762 10.726
1.647 1.316 268 63 2.247 1.446 748 53 1.608 896
4.150 2.926 1.055 170 4.394 3.016 996 382 5.299 3.135
2.082 1.738 92 252 4.363 3.745 226 392 1.954 1.411
2.041 1.699 90 251 4.351 3.733 226 392 1.937 1.394
24.423 21.228 2.835 360 26.565 21.178 3.831 1.556 25.903 19.927
13.463 12.338 1.090 35 9.223 7.984 817 422 10.092 8.590
5.736 4.533 1.010 192 11.455 9.176 1.683 596 8.737 7.144
922 391 487 43 1.128 321 752 55 1.462 590
506.887 181.499 280.375 45.013 498.967 163.677 288.781 46.509 532.976 188.152
314.118 98.617 185.040 30.461 315.813 100.144 183.907 31.762 320.031 109.786
160.502 62.490 86.532 11.479 163.687 70.160 84.482 9.045 158.503 73.504
49.147 11.472 33.146 4.530 44.878 9.162 32.442 3.274 51.467 11.258
23.124 5.283 14.089 3.752 22.158 4.986 14.435 2.737 24.145 6.056
10.282 4.868 5.098 317 7.965 2.506 5.044 415 9.540 2.702
4.615 1.053 2.451 1.112 3.542 889 2.175 478 4.273 622
7.974 2.899 3.809 1.267 15.125 2.808 4.168 8.149 10.258 3.460
41.512 23.406 16.505 1.601 34.897 12.519 20.041 2.337 43.592 18.070
5.090 2.205 2.400 485 6.000 2.974 2.487 539 5.953 3.067
23.293 16.444 6.381 468 15.198 4.481 9.813 904 23.648 9.259
8.353 3.836 4.014 504 8.596 3.495 4.379 722 8.332 2.859
15.515 11.624 3.236 655 8.175 4.994 2.665 516 17.025 12.818
15.233 11.534 3.154 544 7.971 4.981 2.617 373 16.690 12.749
238 84 43 111 200 13 44 143 304 46
136.023 47.941 75.676 12.407 140.082 46.020 82.168 11.894 152.328 47.478
30.346 9.692 18.499 2.155 32.864 10.321 20.251 2.292 38.997 12.426
33.563 6.265 21.906 5.392 34.976 7.827 22.625 4.524 40.301 9.136
11.010 2.214 7.150 1.645 12.103 2.906 7.743 1.454 12.734 4.011
vazhdon / continues

21
Exports
European Union (EU 28)
Italy
Greece
Germany
Spain
United Kingdom
France
CEFTA countries
Kosovo
Serbia
Macedonia
EFTA countries
Switzerland
Others
Turkey
China
USA
Imports
Italy
Greece
Germany
Spain
United Kingdom
France
CEFTA countries
Kosovo
Serbia
Macedonia
EFTA countries
Switzerland
Norway
Others
Turkey
China
USA
European Union (EU 28)
36.942 6.051 242.732 195.932 40.054 6.746 242.208 200.494 33.637 8.077
21.151 3.260 182.718 157.178 22.775 2.765 188.504 166.679 16.059 5.766
13.941 1.854 123.694 108.200 14.150 1.344 132.248 119.288 9.032 3.928
2.114 290 9.508 7.284 1.907 317 11.091 8.513 2.339 239
1.738 219 7.556 5.809 1.331 416 8.276 6.052 1.615 609
94 4 12.605 12.487 118 0 7.994 7.734 260 0
88 23 453 367 79 7 521 427 22 72
242 31 2.408 2.134 250 24 2.547 2.238 272 37
10.716 1.347 34.524 20.146 11.952 2.426 33.027 19.059 12.756 1.212
7.422 614 20.911 11.789 7.774 1.348 16.589 8.901 7.184 504
667 45 3.204 1.753 1.431 20 4.700 2.995 1.652 53
1.635 529 6.385 4.104 1.442 839 6.415 4.264 1.692 459
248 295 2.478 1.957 485 36 2.590 2.174 350 66
247 296 2.405 1.886 484 35 2.573 2.164 342 67
4.827 1.149 25.490 18.608 5.327 1.555 18.087 12.582 4.472 1.033
1.227 275 6.943 5.602 1.245 96 2.803 1.715 958 130
853 740 6.570 5.244 500 826 7.452 5.779 1.101 572
844 28 2.139 994 1.059 86 1.595 401 1.094 100
303.120 41.705 527.790 178.618 296.783 52.389 561.670 188.548 311.810 61.312
185.165 25.080 320.684 111.360 176.904 32.420 350.183 132.248 179.097 38.838
77.003 7.996 160.094 75.363 74.226 10.505 164.857 80.247 68.839 15.771
37.341 2.868 42.377 10.126 29.172 3.079 45.374 12.465 29.860 3.049
15.330 2.759 27.924 5.382 17.932 4.610 45.755 19.072 20.351 6.332
5.739 1.099 8.686 2.606 5.624 456 12.614 4.647 7.530 437
2.834 817 4.429 451 2.745 1.233 3.820 285 2.880 655
4.220 2.578 11.671 4.655 4.157 2.859 11.079 3.456 4.474 3.149
23.259 2.263 41.092 18.660 19.605 2.827 37.982 14.927 20.169 2.886
2.483 403 5.461 2.499 2.411 551 5.786 1.918 3.121 747
13.168 1.221 20.747 10.762 9.186 799 18.060 7.448 9.700 912
4.942 531 8.563 2.063 5.348 1.152 7.757 1.903 4.943 911
3.844 363 8.316 4.367 3.363 586 6.654 2.600 3.639 415
3.745 196 8.002 4.319 3.266 417 6.253 2.523 3.482 248
90 168 302 48 89 165 389 73 156 160
90.852 13.998 157.698 44.231 96.911 16.556 166.851 38.773 108.905 19.173
23.853 2.718 43.686 15.661 24.583 3.442 45.591 12.834 30.077 2.680
25.397 5.768 46.507 8.360 30.621 7.526 50.580 10.366 33.277 6.937
7.584 1.139 8.114 3.501 3.490 1.123 10.418 1.780 5.207 3.431
Country group
B-E G B-E G
Gjithsej Industri Tregti Të tjera Gjithsej Industri Tregti Të tjera
Total Industry Trade Others Total Industry Trade Others
Aktiviteti ekonomik (NVE Rev.2) - Economic activity (NACE Rev.2)
2015 2016
Tregti Të tjera
Trade Others
G
2014
Milionë lekë / Million ALL
22
Tab. 5Eksportet sipas grup produkteve dhe aktivitetit ekonomik, 2012-2016 Exports by commodity group and economic activity, 2012-2016
(c)-konfidenciale/confidential
vazhdon / continues
Gjithsej IndustriTregti dhe Të tjera Gjithsej IndustriKodi
NP 2008 Përshkrimi CPA Total Industry Total Industry
Gjithsej
A Produkte bujqësore, pylltarie dhe peshkimi
B Produkte nga minierat dhe nxjerrja
C Produkte nga përpunimi
10 Produkte ushqimore
11 Pije
12 Duhan dhe produkte të duhanit
13 Tekstile
14 Veshje
15 Lëkurë dhe produkte prej lëkure
16 Dru dhe produkte prej druri dhe dushku, përvec
17 Letra dhe produkte prej letre
18 Materiale të shtypura dhe media të regjistruar
19 Koks dhe nënprodukte të naftës të ra�nuara
20 Kimikate dhe produkte kimike
21 Produkte farmaceutike dhe preparate farmaceutike
22 Produkte prej kau çuku dhe plastike
23 Produkte minerale jo metalike
24 Metalet bazë (nga metalurgjia)
25Produkte metalike të fabrikuara, përveç
26 Produkte optike, elektronikë, kompjuterikë
27 Paisje elektrike
28 Makineri dhe paisje të pa klasi�kuara vend tjetër
29 Mjete transporti, rimorkio dhe gjysëm rimorkio
30 Mjete të tjera transporti
31 Mobiljet
32 Produkte të paklasi�kuara vend tjetër
D + E Energjia elektrike, gazi, avulli, ujë
Të tjera
mobiljeve artikuj xunkthi dhe kashte
Viti
NVE Rev.2NP 2008
Tregti dhe Të tjera
Trade & Others
Trade & Others
makinerive dhe paisjeve
B-E B-E
2012 2013
B-E
2014
Gjithsej Industri
Total Industry
212.519 188.519 24.000 246.227 216.793 29.434 255.290 212.296
4.625 995 3.630 7.726 994 6.732 9.475 1.145
65.553 63.848 1.704 85.319 82.267 3.052 68.228 65.280
130.671 118.076 12.595 142.178 125.987 16.190 171.553 142.960
7.309 6.033 1.276 7.934 6.189 1.744 8.188 5.675
360 271 89 582 458 124 472 365
2.253 - 2.253 ( c ) ( c ) ( c ) ( c ) ( c )
893 862 31 1.141 1.100 41 1.662 1.613
31.691 30.864 827 34.635 34.050 585 41.669 40.221
30.972 29.239 1.733 35.425 31.128 4.298 44.559 38.765
1.464 1.122 342 1.458 1.226 232 1.482 1.258
2.754 2.491 262 5.015 4.656 359 6.730 6.158
- - - ( c ) ( c ) ( c ) ( c ) ( c )
1305 1.253 52 2.699 265 2.434 8.992 173
828 521 307 1.216 739 478 1.488 546
147 30 117 159 35 124 274 72
837 690 147 1.287 859 428 1.345 901
8.632 8.205 427 8.456 8.248 208 9.180 8.684
23.604 23.350 254 23.473 23.064 409 24.328 23.730
6.792 6.385 407 6.728 6.156 572 7.736 7.196
929 308 621 1.137 348 789 1.864 517
4.286 3.266 1.020 4.536 3.475 1.060 4.678 2.643
1.551 340 1.210 1.708 643 1.065 1.899 963
706 47 658 656 219 438 1.211 438
205 14 191 449 103 346 140 63
2.068 1.910 158 2.126 1.969 157 2.107 1.796
1.084 875 209 1.194 900 294 1.559 1.130
10.831 5.586 5.245 9.483 7.537 1.946 5.260 2.874
839 13 826 1.522 7 1.515 773 36
23
Milionë lekë / Million ALL
Gjithsej Industri Gjithsej Industri
Total Industry Trade & Others
Total Industry
Total
Products of agriculture, forestry and �shing
Mining and quarrying
Manufactured products
Food products
Beverages
Tobacco products
Textiles
Wearing apparel
Leather and related products
Wood and of products of wood and
cork, except furniture
Paper and paper products
Printing and recording services
Coke and re�ned petroleum products
Chemicals and chemical products
Basic pharmaceutical products and pharmaceutical preparations
Rubber and plastic products
Other non-metallic mineral products
Basic metals
Babricated metal products, except machinery and equipment
Computer, electronic and optical products,potentiometers
Electrical equipment, potentiometers (manufacture)
Machinery and equipment
Motor vehicles, trailers and semi - trailers
Other transport equipment
Furniture
Other manufactured goods
Electricity, gas, steam and air conditioning, water supply;
Others
Description
B-E B-E NACE Rev.2CPA 2008
Year
Tregti dhe Të tjera
Tregti dhe Të tjera Trade & Others
Tregti dhe Të tjera Trade & Others
2015 20162014
B-E
42.994 242.732 195.932 46.800 242.208 200.494 41.714
8.330 11.847 1.526 10.321 13.810 1.351 12.459
2.947 44.341 41.901 2.440 32.804 30.321 2.483
28.593 178.477 145.855 32.622 185.795 161.171 24.623
2.514 9.795 6.949 2.845 11.467 10.553 914
107 549 370 180 989 746 243
( c ) ( c ) ( c ) ( c ) ( c ) ( c ) -
49 1.659 1.567 92 2.077 1.945 132
1.448 45.232 43.438 1.794 53.070 49.904 3.166
5.793 45.174 37.772 7.402 52.674 49.943 2.732
224 2.031 1.688 343 1.885 1.425 459
572 6.277 6.042 235 5.354 5.034 320
( c ) ( c ) - ( c ) ( c ) ( c ) ( c )
8.748 9.238 137 9.101 2.717 151 2.566
942 1.835 865 970 1.754 1.065 689
201 448 113 335 ( c ) ( c ) 557
444 1.471 983 489 2.513 2.055 459
496 7.913 7.359 553 7.464 6.863 601
598 22.976 22.121 855 19.655 15.121 4.533
540 8.604 7.715 889 7.366 6.416 950
1.347 2.792 461 2.332 1.391 634 757
2.036 5.104 3.624 1.480 5.420 2.925 2.495
936 1.904 622 1.282 2.245 874 1.371
773 1.426 694 733 2.549 1.396 1.153
77 51 12 39 152 125 28
311 2.317 1.994 323 2.734 2.518 216
429 1.607 1.260 348 1.591 1.313 278
2.386 4.173 4.173 - 9.577 7.623 1.954
737 3.894 2.477 1.417 223 28 195

24
Tab. 6Importet sipas grup produkteve dhe aktivitetit ekonomik, 2012-2016 Imports by commodity group and economic activity, 2012-2016
vazhdon / continues
KodiNP 2008 Përshkrimi
Gjithsej
A Produkte bujqësore, pylltarie dhe peshkimi
B
C
10
11
12
13
14
15
16
17
18
19
20
21
22
23
24
25
26
27
28
29
30
31
32
D + E
Të tjera
Energjia elektrike, gazi, avulli dhe furnizimi me ajër të kondicionuar dhe furnizimi me ujë, aktivitetet etrajtimit dhe menaxhimit të mbeturinave, mbetjeve
Pije
Veshje
Lëkurë dhe produkte prej lëkure
Letra dhe produkteve prej letre
Koksi dhe nënprodukte të ra�nerisë së naftës
Kimikate dhe produkte kimike
Produkte farmaceutike dhe preparate farmaceutike
Produkte të kauçukut dhe plastikës
Produkte minerale jo metalike
Produkte të metaleve bazë (nga Metalurgjia)
Produkte metalikë të fabrikuar, përveç makinerive dhe pajisjeve
Produkte optikë, elektronikë, kompjuterikë
Paisje elektrike
Makineri dhe paisje të p.k.t
Mjete të transportit, rimorkiodhe gjysëmrimorkio
Mjete të tjera të transportit
Mobiljet
Produkte të paklasi�kuara vend tjetër
Produkte nga përpunimi
Produkte nga minierat dhe nxjerrja
Produkte ushqimore
Duhan dhe produkte të duhanit
Tekstile
Dru dhe produkte prej druri dhe dushku, përvec mobilje, artikuj xunkthi dhe kashte
Materiale të shtypura dhe media të regjistruar
NVE Rev.2
NP 2008
Viti
506.887 181.499 280.375 45.013 498.967 163.677 288.781 46.509 532.976 188.152
24.760 7.760 15.175 1.825 24.914 6.468 16.005 2.441 26.739 5.490
2.676 1.171 1.407 99 2.225 1.635 431 159 2.517 1.648
437.402 138.386 259.286 39.730 449.492 142.446 267.203 39.843 463.438 150.082
49.317 9.214 38.423 1.680 48.547 8.039 38.465 2.043 51.259 5.993
10.205 673 9.387 146 10.448 849 9.428 171 8.960 581
8.976 47 8.917 12 9.256 159 9.097 - 7.502 138
17.865 13.237 4.219 409 20.598 15.403 4.778 417 24.153 17.581
19.828 12.472 6.652 704 22.161 14.311 7.226 624 26.136 16.667
17.836 13.452 4.147 237 20.187 14.604 5.363 220 23.476 17.617
6.694 1.388 5.002 304 6.722 1.698 4.793 231 7.468 1.111
11.618 5.767 5.186 665 13.702 7.408 5.673 620 14.027 9.136
85 6 66 14 72 3 54 15 66 11
73.311 15.997 54.547 2.768 75.786 18.169 57.329 287 60.876 9.400
34.670 8.573 24.881 1.216 37.194 8.825 27.136 1.232 36.132 9.161
16.909 132 16.408 369 16.246 128 15.733 385 21.173 116
15.626 5.848 7.997 1.781 16.699 5.513 9.467 1.719 19.818 5.922
18.218 3.612 12.663 1.943 16.579 3.380 12.090 1.109 17.351 4.179
29.396 16.399 11.920 1.077 26.820 15.471 9.836 1.514 24.832 15.133
16.524 9.529 5.173 1.822 16.323 9.211 5.086 2.026 19.631 11.974
17.462 1.757 6.808 8.897 16.223 1.358 6.492 8.373 17.985 1.946
20.057 4.623 11.830 3.604 20.407 4.651 13.170 2.585 23.108 6.318
28.038 12.994 9.415 5.629 25.936 10.575 10.580 4.781 30.985 14.126
12.428 1.023 8.754 2.650 12.335 1.123 8.635 2.577 13.941 1.242
1.956 123 413 1.419 7.708 39 473 7.196 3.424 28
3.199 349 2.337 514 3.112 349 2.205 558 3.784 485
7.184 1.170 4.142 1.872 6.431 1.178 4.093 1.160 7.351 1.216
38.253 34.080 3.763 409 18.434 13.049 4.470 915 36.654 30.793
3.796 101 745 2.950 3.902 79 672 3.150 3.628 138
B-E G B-E G
2012 2013
B-E
2014
Gjithsej Industri Tregti Të tjera Gjithsej Industri Tregti Të tjera
Total Industry Trade Others Total Industry Trade Others
Gjithsej Industri
Total Industry
25
Description
Total
Mining and quarrying
Manufactured products
Food products
Beverages
Tobacco products
Textiles
Wearing apparel
Leather and related products
except furniture manuf. of straw and reed articles
Paper and paper products
Printing and recording services
Coke and re�ned petroleum products
Chemicals and chemical products
pharmaceutical preparations
Rubber and plastic products
Other non-metallic mineral products
Basic metals
machinery and equipment
products,potentiometers
Machinery and equipment
Other transport equipment
Furniture
Other manufactured goods
management
Others
Products of agriculture, forestry and �shing
Wood and of products of wood and cork,
Basic pharmaceutical products and
Babricated metal products, except
Computer, electronic and optical
Electrical equipment,potentiometers (manufacture)
Motor vehicles, trailers and semi-trailers
Electricity, gas, steam and air conditioning and water supply; sewerage, waste
NACE Rev.2
CPA 2008
Year
303.120 41.705 527.790 178.618 296.783 52.389 579.248 188.548 311.810 78.891
18.362 2.887 26.423 6.049 18.274 2.100 24.841 4.887 17.709 2.245
739 130 2.121 989 954 178 1.843 877 777 189
277.306 36.049 475.133 151.371 276.192 47.571 534.488 170.367 291.769 72.353
43.747 1.519 54.532 6.653 45.776 2.103 57.451 9.981 44.974 2.496
8.327 53 10.106 703 8.387 1.017 11.260 534 9.231 1.495
7.364 - 6.412 128 6.166 117 7.432 - 7.386 46
6.076 496 27.468 20.745 6.267 455 31.337 24.850 5.532 955
8.788 680 27.990 17.157 9.997 836 32.209 19.012 12.118 1.079
5.523 335 25.952 18.086 7.527 339 28.708 22.369 5.634 705
6.138 219 7.062 1.157 5.585 320 8.380 1.280 6.518 582
4.542 349 14.881 8.715 5.811 354 14.994 8.452 6.250 292
44 12 94 18 52 24 63 34 28 0
51.375 101 41.710 5.310 36.036 364 37.277 2.461 34.393 423
25.561 1.410 38.371 9.589 26.815 1.968 40.800 10.967 28.161 1.672
20.394 663 19.354 134 18.430 790 21.257 153 20.547 558
12.280 1.615 19.806 6.409 11.536 1.861 22.110 8.238 12.187 1.686
12.321 851 15.903 3.467 11.461 975 15.717 3.235 11.550 932
7.805 1.894 25.691 14.975 7.980 2.736 39.699 27.431 9.980 2.288
5.584 2.074 22.453 12.598 6.354 3.501 20.253 9.327 7.226 3.700
8.072 7.968 24.775 1.258 11.141 12.376 20.710 1.053 11.516 8.141
13.814 2.976 26.382 7.180 15.323 3.879 29.852 5.903 17.924 6.026
11.315 5.543 34.496 14.190 14.844 5.462 41.918 11.681 15.863 14.374
9.916 2.784 16.986 853 12.061 4.072 37.899 1.039 14.909 21.951
504 2.892 2.838 60 564 2.214 1.250 97 571 581
2.688 611 3.707 526 2.530 651 4.239 567 2.753 919
5.129 1.006 8.164 1.459 5.549 1.155 9.673 1.703 6.519 1.451
5.849 12 20.339 19.985 344 10 12.302 11.839 447 16
863 2.627 3.774 224 1.019 2.531 5.774 578 1.108 4.088
B-E G B-E G
Gjithsej Industri Tregti Të tjera Gjithsej Industri Tregti Të tjera
Total Industry Trade Others Total Industry Trade Others
2015 2016
Tregti Të tjera
Trade Others
G
2014
Milionë lekë / Million ALL

26
Tab. 7Përqëndrimi i tregtisësë jashtme të mallrave sipas aktivitetit ekonomik, 2012-2016 Concentration of external trade by economic activity, 2012- 2016
Eksporte
Të gjitha ndërmarrjet
5 ndërmarrjet kryesore
10 ndërmarrjet kryesore
20 ndërmarrjet kryesore
50 ndërmarrjet kryesore
100 ndërmarrjet kryesore
200 ndërmarrjet kryesore
300 ndërmarrjet kryesore
Importe
Të gjitha ndërmarrjet
5 ndërmarrjet kryesore
10 ndërmarrjet kryesore
20 ndërmarrjet kryesore
50 ndërmarrjet kryesore
100 ndërmarrjet kryesore
200 ndërmarrjet kryesore
300 ndërmarrjet kryesore
Aktiviteti ekonomik (NVE Rev.2) - Economic activity (NACE Rev.2)
212.519 188.519 19.134 4.867 246.227 216.793 23.263 6.172 255.290 212.296
85.982 78.849 4.346 2.787 104.116 95.436 6.453 2.227 99.066 83.261
104.570 94.811 6.484 3.275 123.863 111.625 8.987 3.251 119.823 99.449
124.274 110.947 9.605 3.722 145.005 128.772 12.094 4.139 143.178 117.255
153.889 136.003 13.567 4.319 177.511 155.358 16.937 5.216 179.438 146.038
177.335 156.491 16.186 4.658 202.907 177.276 19.822 5.809 207.708 169.711
196.116 173.271 18.003 4.842 224.853 196.886 21.862 6.105 231.938 190.804
204.978 181.459 18.653 4.866 235.365 206.582 22.617 6.166 243.486 201.389
506.887 181.499 280.375 45.013 498.967 163.677 288.781 46.509 532.976 188.152
109.258 54.959 43.939 10.360 104.578 46.599 44.259 13.720 104.153 54.288
151.006 71.579 64.251 15.176 138.313 56.433 64.171 17.709 142.093 69.331
198.093 88.427 89.204 20.462 181.967 69.618 89.858 22.491 187.472 85.854
272.514 117.358 127.527 27.629 254.757 94.965 130.730 29.062 264.025 114.303
330.596 139.074 159.029 32.493 314.678 116.370 164.107 34.201 328.026 137.036
385.631 158.369 190.242 37.020 372.842 137.798 196.159 38.885 391.016 159.615
414.714 167.476 207.925 39.313 403.504 147.966 214.374 41.164 424.671 170.565
B-E G B-E G
Gjithsej Industri Tregti Të tjera Gjithsej Industri Tregti Të tjera
Total Industry Trade Others Total Industry Trade Others
2012 2013
B-E
Gjithsej Industri
Total Industry
2014
vazhdon / continues

27
Milionë lekë / Million ALL
Exports
All enterprises
Top 5 enterprises
Top 10 enterprises
Top 20 enterprises
Top 50 enterprises
Top 100 enterprises
Top 200 enterprises
Top 300 enterprises
Imports
All enterprises
Top 5 enterprises
Top 10 enterprises
Top 20 enterprises
Top 50 enterprises
Top 100 enterprises
Top 200 enterprises
Top 300 enterprises
Aktiviteti ekonomik (NVE Rev.2) - Economic activity (NACE Rev.2)
B-E G B-E G
Gjithsej Industri Tregti Të tjera Gjithsej Industri Tregti Të tjera
Total Industry Trade Others Total Industry Trade Others
2015 2016
Tregti Të tjera
Trade Others
G
2014
36.943 6.051 242.732 195.932 40.054 6.746 242.208 200.494 33.637 8.078
13.638 2.167 73.403 56.867 13.969 2.567 48.250 37.569 7.301 3.380
17.165 3.209 92.706 71.186 17.995 3.525 66.584 51.700 10.326 4.558
21.751 4.172 114.777 87.641 22.644 4.492 90.326 70.527 14.280 5.519
28.203 5.197 152.342 116.604 30.019 5.719 131.783 103.081 21.952 6.750
32.297 5.700 183.902 143.269 34.250 6.383 169.020 134.437 27.068 7.515
35.149 5.985 212.677 168.339 37.666 6.672 204.361 165.699 30.731 7.931
36.056 6.041 227.018 181.414 38.871 6.733 221.190 181.058 32.088 8.044
303.120 41.705 527.790 178.618 296.783 52.389 561.670 188.548 311.810 61.312
40.459 9.406 76.692 31.312 34.394 10.986 79.896 28.465 33.276 18.155
59.932 12.830 113.733 45.722 50.383 17.628 114.385 42.052 48.951 23.382
84.310 17.308 158.874 62.699 72.111 24.064 160.019 60.772 70.157 29.090
125.654 24.068 236.275 92.837 112.193 31.245 243.847 93.566 113.507 36.774
161.514 29.476 305.553 118.181 150.335 37.037 315.974 121.829 151.125 43.020
197.560 33.841 373.651 142.925 188.327 42.399 390.062 149.565 191.420 49.077
218.015 36.091 410.738 156.022 209.590 45.126 429.616 163.428 214.049 52.139

28
Tab. 8Numri i ndërmarrjeve sipas numrit të vendeve partnere dhe aktivitetit ekonomik, 2012-2016 Number of enterprises according to number of partner countries and economic activity, 2012-2016
Numri i vendeve partnere
Eksporte
Gjithsej
1 vend partner
2 vende partnere
3-5 vende partnere
6-9 vende partnere
10 ose më shumë vende partnere
Importe
Gjithsej
1 vend partner
2 vende partnere
3-5 vende partnere
6-9 vende partnere
10 ose më shumë vende partnere
Aktiviteti ekonomik (NVE Rev.2) - Economic activity (NACE Rev.2)
B-E G B-E G
Gjithsej Industri Tregti Të tjera Gjithsej Industri Tregti Të tjera
Total Industry Trade Others Total Industry Trade Others
2012 2013
B-E
Gjithsej Industri
Total Industry
2014
2.029 910 769 350 2.236 1.000 838 398 2.387 1.047
1.407 621 536 250 1.584 685 601 298 1.646 699
323 146 125 52 331 161 111 59 387 188
245 118 86 41 260 128 100 32 282 134
35 17 15 3 39 19 16 4 47 17
19 8 7 4 22 7 10 5 25 9
7.347 1.489 3.819 2.039 7.586 1.526 3.921 2.139 8.357 1.591
3.763 775 1.794 1.194 3.845 768 1.812 1.265 4.275 749
1.370 275 731 364 1.436 297 745 394 1.552 335
1.307 269 712 326 1.321 275 724 322 1.430 300
508 102 316 90 521 110 331 80 552 117
399 68 266 65 463 76 309 78 548 90
vazhdon / continues

29
Number of partner country
Exports
Total
1 partner country
2 partner countries
3-5 partner countries
6-9 partner countries
Imports
Total
1 partner country
2 partner countries
3-5 partner countries
6-9 partner countries
10 or more partner countries
10 or more partner countries
Exports
922 418 2.506 1.117 967 422 2.740 1.190 1.065 485
632 315 1.652 700 645 307 1.779 757 673 349
132 67 421 206 147 68 464 206 191 67
123 25 328 164 128 36 379 178 147 54
22 8 73 35 32 6 82 34 38 10
13 3 32 12 15 5 36 15 16 5
4.475 2.291 8.878 1.712 4.648 2.518 10.038 1.854 4.964 3.220
2.131 1.395 4.500 793 2.211 1.496 5.121 847 2.325 1.949
812 405 1.624 338 879 407 1.792 367 861 564
828 302 1.492 331 766 395 1.749 382 896 471
332 103 629 144 363 122 695 150 409 136
372 86 633 106 429 98 681 108 473 100
Aktiviteti ekonomik (NVE Rev.2) - Economic activity (NACE Rev.2)
B-E G B-E G
Gjithsej Industri Tregti Të tjera Gjithsej Industri Tregti Të tjera
Total Industry Trade Others Total Industry Trade Others
2015 2016
Tregti Të tjera
Trade Others
G
2014

30
Tab. 9Tregtia e jashtme e mallrave sipas numrit të vendeve partnere dhe aktivitetit ekonomik, 2012-2016 External trade according to number of partner countries and economic activity, 2012-2016
Numri i vendeve partnere
Eksporte
Gjithsej
1 vend partner
2 vende partnere
3-5 vende partnere
6-9 vende partnere
10 ose më shumë vende partnere
Importe
Gjithsej
1 vend partner
2 vende partnere
3-5 vende partnere
6-9 vende partnere
10 ose më shumë vende partnere
Aktiviteti ekonomik (NVE Rev.2) - Economic activity (NACE Rev.2)
B-E G B-E G
Gjithsej Industri Tregti Të tjera Gjithsej Industri Tregti Të tjera
Total Industry Trade Others Total Industry Trade Others
2012 2013
B-E
Gjithsej Industri
Total Industry
2014
212.519 188.519 19.134 4.867 246.227 216.793 23.263 6.172 255.290 212.296
67.926 59.517 7.115 1.294 75.123 64.688 7.601 2.834 80.377 66.839
20.630 15.364 3.472 1.794 33.453 27.254 5.082 1.117 27.908 22.107
37.563 31.799 5.085 679 27.212 22.366 4.169 677 37.426 30.765
73.211 71.409 1.754 48 94.659 93.110 1.360 189 73.800 66.509
13.189 10.429 1.708 1.052 15.781 9.375 5.051 1.355 35.779 26.076
506.887 181.499 280.375 45.013 498.967 163.677 288.781 46.509 532.976 188.152
62.060 24.605 31.036 6.419 64.708 25.227 26.102 13.379 55.670 22.891
47.701 22.934 20.527 4.240 41.419 16.086 21.641 3.692 54.682 19.055
105.196 32.046 64.063 9.087 88.648 35.267 44.986 8.395 104.798 43.555
90.365 29.814 51.405 9.146 86.634 24.937 59.725 1.972 81.144 28.271
201.565 72.100 113.344 16.121 217.558 62.161 136.325 19.072 236.683 74.380
vazhdon / continues

31
Milionë lekë / Million ALL
36.943 6.051 242.733 195.932 40.054 6.747 242.208 200.494 33.638 8.076
10.475 3.063 85.087 71.325 10.909 2.853 93.973 79.040 9.904 5.029
4.372 1.429 24.916 18.985 3.885 2.046 31.994 25.276 5.893 825
6.099 562 44.595 38.400 4.775 1.421 46.112 37.378 7.180 1.554
7.131 160 51.445 37.091 14.190 164 46.018 38.882 6.686 450
8.866 837 36.690 30.131 6.295 264 24.111 19.918 3.975 218
303.120 41.705 527.790 178.618 296.783 52.389 561.670 188.548 311.810 61.312
27.557 5.222 61.303 26.905 28.690 5.708 59.455 22.604 28.252 8.599
28.192 7.435 51.056 20.814 25.326 4.917 43.980 20.742 18.879 4.359
54.845 6.398 87.453 34.481 41.068 11.904 85.605 29.964 44.116 11.525
47.333 5.540 73.888 25.746 41.368 6.774 101.755 46.651 48.214 6.890
145.193 17.112 254.090 70.672 160.331 23.087 270.875 68.588 172.348 29.939
Number of partner country
Exports
Total
1 partner country
2 partner countries
3-5 partner countries
6-9 partner countries
Imports
Total
1 partner country
2 partner countries
3-5 partner countries
6-9 partner countries
10 or more partner countries
10 or more partner countries
Exports
Aktiviteti ekonomik (NVE Rev.2) - Economic activity (NACE Rev.2)
B-E G B-E G
Gjithsej Industri Tregti Të tjera Gjithsej Industri Tregti Të tjera
Total Industry Trade Others Total Industry Trade Others
2015 2016
Tregti Të tjera
Trade Others
G
2014
32
SHPJEGUES METODOLOGJIK
1. Përmbajtja e treguesve
Të gjithë treguesit e paraqitur në këtë botim janë llogaritur për tregtinë gjithsej të mallrave (import/eksportet) dhe për tre aktivitete kryesore (sipas seksioneve): seksionet e Industrisë, B,C,D,E (që përfshin Industri Nxjerrëse; Përpunimi; Energji elektrike, furnizimi me gaz, avull dhe ajër i kondicionuar dhe Furnizimi me ujë, aktivitete të trajtimit dhe menaxhimit të mbeturinave, mbetjeve), seksioni i Tregtisë, G dhe të gjitha seksionet e tjera janë përfshirë në grupin Të Tjera Aktivitete.
Në Industri (seksionet B - E të NVE Rev.2) janë marrë në analizë aktivitetet dhe produktet të detajuara sipas ndarjeve në nivel 2 shifror të përfshira nga 05-33, Tregti (seksioni G, janë marrë ndarjet 45-47) dhe Të tjera (ku përfshihen sipas NVE Rev.2 të gjitha ndarjet nga 01-04; 41-43; 48-99).
Madhësia e ndërmarrjes është përcaktuar në bazë të numrit të të punësuarve të grupuar në katër grupe: 1-9; 10-49; 50-249; 250+.
Përmbajtja e treguesve të analizuar në këtë publikim dhe detajimi i tyre është paraqitur si më poshtë vijon:
Treguesiiparëianalizuar- Numri i ndërmarrjeve sipas aktivitetit ekonomik dhe madhësisë së ndërmarrjes;Tregtia sipas sektorëve ekonomikë dhe madhësisë së ndërmar-rjes paraqet pjesëmarrjen e aktiviteteve kryesore ekonomike dhe ndërmarrjeve sipas madhësisë. Ky tregues matet me num-rin e ndërmarrjeve që marrin pjesë në shkëmbimin tregtar, im-porte apo eksporte.
Treguesi i dytë i analizuar - Tregtia e jashtme e mallrave (im-porte-eksporte) sipas aktivitetit ekonomik dhe madhësisë së ndërmarrjes;Tregtia sipas sektorëve ekonomikë dhe madhësisë së ndërmarrjes paraqet kontributin e aktiviteteve kryesore ekonomike dhe ndërmarrjeve sipas madhësisë. Ky tregues matet me vlerën e mallrave të importuara/eksportuara.
Treguesiitretëianalizuar- Numri i ndërmarrjeve sipas vendeve partnere dhe aktivitetit ekonomik;Tregtia sipas vendeve partnere mat shpërndarjen gjeografike të tregjeve të importeve/eksporteve. Ky tregues matet me numrin e ndërmarrjeve që kanë kryer shkëmbime tregtare me vendet e BE, CEFTA, EFTA dhe vende me peshë kryesore në shkëmbimin e mallrave në botë (si Shtetet e Bashkuara të Amerikës, Kina).
Treguesiikatërtianalizuar- Tregtia e jashtme e mallrave sipas vendeve partnere dhe aktivitetit ekonomik;Tregtia sipas vendeve partnere tregon se sa ndërmarrje kanë kryer shkëmbime tregtare me vendet e BE, CEFTA, EFTA dhe
METHODOLOGICAL NOTE
1. The content of the indicators
All indicators in this publication are estimated to total mer-chandise trade (import/export) and for three main activities (by sections): sections of Industry, B, C, D, E (including the Extractive Industry, Processing, Electricity, supply gas, steam and air conditioning and water supply, handling activities and waste management,waste), Trade section, G and all other sec-tions are grouped under Other Activities.
In industry (sections B - E of NACE Rev. 2) are analysis detailed activities and products by 2-digit level divisions, included from 05 to 33, Trade (section G, are taking divisions 45-47) and Others (according to NACE Rev. 2 including all divisions from 01-04; 41-43; 48-99).
Enterprise size is determined based on the number of employees grouped in four groups: 1-9; 10-49; 50-249; 250+ employees.
Content indicators analyzed in this publication and their detailing are shown as follows:
Thefirstindicatoranalyzed - Number of enterprises by economic activity and enterprise size;Trade by economic sector and enterprise size shows the participations of the main economic activities and enterprises by the size class. This indicator is measured by the number of companies that participate in the exchange trade, imports or exports.
The second indicator analyzed - External trade in goods (imports-exports) by economic activity and enterprise size;Trade by economic sector and enterprise size shows the participations of the main economic activities and enterprises by the size. This indicator is measured by the value of goods imported/exported.
Thethirdindicatoranalyzed- Number of enterprize by partner countries and economic activity;Trade by partner countries measure the geographical distribution of imports/exports markets. This indicator is measured by the number of enterprises that carry trade relations with EU countries, CEFTA, EFTA and countries with the focus on the exchange of goods in the world (like the United States of America, China).
Thefourthindicatoranalyzed - External trade in goods trade by partner countries and economic activity;Trade by partner countries shows how companies have conducted trade relations with EU countries, CEFTA, EFTA and countries with the focus on the exchange of goods.
Treguesiipestëianalizuar- Tregtia e jashtme e mallrave sipas produkteve dhe aktivitetit ekonomik ;Tregtia sipas produkteve mat vlerën e mallrave të importuara apo eksportuara sipas produkteve që rrjedhin nga aktivitetet ekonomike.
Thefifthindicatoranalyzed- External trade in goods by com-modity group and economic activity;Trade by product measures the value of goods imported or exported by products derived from economic activities.

33
2. Burimi informacionit
a. Të dhënat e tregtisë së jashtme
Burimi kryesor i sigurimit të të dhënave statistikore të tregtisë së jashtme të mallrave është Drejtoria e Përgjithshme e Doganave. Informacioni grumbullohet çdo muaj, nëpërmjet Deklaratës Doganore, e cila është vendosur për herë të parë në vendin tonë, në vitin 1992. Kjo deklaratë siguron të dhëna të nevojshme, si për qëllime doganore, ashtu dhe për qëllime statistikore dhe mbledh të dhëna statistikore për periudhën e kryerjes së transaksionit për llojin e mallit, peshën neto, peshën bruto, vlerën statistikore të mallit, vendin destinacion, vendin eksportues, vendin origjinë, tipin e transaksionit, llojin e koncensionit etj. Natyra komplekse e doganave dhe e nevojave statistikore bën të domosdoshëm përdorimin e klasifikimeve të mallrave. Nomenklaturat e përdoruara jane Sistemi i Harmonizuar (HS) si dhe Klasifikimi Standard Ndërkombëtar i Tregtisë (SITC). Përshkrimi i harmonizuar i mallrave dhe sistemi i kodimit (Sistemi i Harmonizuar ose HS) ose versione të zgjeruara bazuar në HS, siç është Nomenklatura e Kombinuar e përdorur tani provojnë një detajim të tillë. Klasifikimi që përdorin këto nomenklatura bazohet në natyrën e mallrave.Kategoritë e mallrave më të përdorëshme për analizat ekonomike sigurohen nga Klasifikimi Standard Ndërkombëtar i Tregtisë (SITC), i cili i klasifikon mallrat sipas fazave të tyre të prodhimit.
Statistikat e tregtisë së jashtme regjistrojnë të gjitha mallrat, të cilat shtojnë ose pakësojnë burimet materiale të një vendi nëpërmjet hyrjeve (importeve) ose daljeve (eksporteve) nga territori ekonomik i tij.
Mallrat që thjesht janë transportuar përmes një vendi (mallrat në tranzit) ose ato me qëndrim të përkohshëm (përveç mallrave për përpunim pasiv ose aktiv), nuk përfshihen në statistikat e tregtisë së jashtme.
Treguesiigjashtëianalizuar - Përqëndrimi i tregtisë së jashtme të mallrave (eksporte/importe);Përqëndrimi i eksport/importeve është matur duke grupuar 5 deri 300 ndërmarrjet më të mëdha nga këndvështrimi i volumit/vlerës tregtare dhe pjesa e tyre në vlerën gjithsej.
Treguesiishtatëianalizuar - Numri i ndërmarrjeve sipas numrit të vendeve partnere dhe aktivitetit ekonomik.Numri i ndërmarrjeve sipas numrit të vendeve partnere dhe aktivitetit ekonomik mat numrin e ndërmarrjeve sipas shpërndarjes gjeografike.
Treguesi i tetë i analizuar - Tregtia jashtme e mallrave sipas numrit të vendeve partnere dhe aktivitetit ekonomik; Tregtia sipas numrit të vendeve partnere mat shpërndarjen gjeografike të tregjeve të eksporteve / importeve.
The sixth indicator analyzed - Concentration of external trade in goods (exports/imports);Concentration of export/import is measured by grouping 5 up to 300 large enterprises from the perspective of volume/commercial value and their share in total value.
The seventh indicator analyzed - Number of enterprises by number of partner countries and economic activity;Number of enterprises by number of partner countries and economic activity measures the number of enterprises by geographical distribution.
The eighth indicator analyzed - External trade in goods by number of partner countries and economic activity;External trade in goods by number of partner countries measures the geographical distribution of exports / imports market .
2. Source of information
a. External trade in goods dataset
The Customs General Directorate is the main source for collection of data related to Trade register. These data are collected monthly through the Custom’s Declaration, which was introduced in Albania since 1992. This declaration serves for both customs and statistical purposes. It includes data related to time of transactions, kind of transaction, sort of goods, gross weight, net weight, statistical value of goods, country of origin, exporting country, destination, kind of concession, etc.
The complex characteristics of the customs activities and statistical needs make it indispensable to introduce the classification of goods. The Harmonized Commodity Description and coding System (Harmonized System, or HS) or extended versions based on HS, such as the Combined Nomenclature used by our country provide such details. Classification using these nomenclatures is based on the nature of the commodity.Commodity categories more suitable for economic analysis are provided by the Standard International Trade Classification (SITC), which classifies commodities according to their stage of production.
External trade statistics record all goods, which are added or subtracted from the material stock resources of a country by imports or exports entering or leaving a territory of a country.
Goods simply being transported through a country (transit goods) temporarily admitted or withdrawn (inward or outward processed goods) do not add or subtract from the stock of material resources of a country and are not included in the external trade statistics.

34
b. Regjistri i Ndërmarrjeve
Regjistri i Ndërmarrjeve përmban të gjitha njësitë ligjore jo bujqësore (ndërmarrjet e institucionet) që ushtrojnë aktivitet ekonomik brenda territorit të Shqipërisë.
Regjistri i Ndërmarrjeve bazuar në informacionin e marrë nga burimet administrative ndërton variablat identifikues, de-mografik dhe ekonomik, karakteristikat e shkallëzimit, pronës-inë e njësisë duke krijuar në këtë mënyrë mundësinë e lidhjes me regjistra të tjerë. Rregjistri i Ndërmarrjeve luan një rol të rëndësishëm në përafrimin e të dhënave të tregtisë së jashtme me të dhënat e ndërmarrjeve. Ai siguron mjetin për lidhjen e detajuar të të dhënave mikro të tregtisë së jashtme (importe dhe eksporte) me njësitë statistikore në statistikat e ndër-marrjeve. Gjithashtu, Regjistri i Ndërmarrjeve është bazë për hartimin e statistikave të nevojshme për dhënien e treguesve afat-shkurtër dhe të zhvillimeve strukturore ekonomike. Ky regjistër bazohet në informacionin e marrë nga burimet ad-ministrative si: Drejtoria e Përgjithshme e Tatimeve (DPT), Qendra Kombëtare e Regjistrimit (QKR) si dhe nga vrojtimet statistikore që organizon INSTAT-i apo agjencitë statistikore.
Baza ligjore mbi të cilën është ndërtuar dhe mbështetet Regjistri i ndërmarrjeve, janë: i) Ligji Nr. 9180, datë 5.2.2004 “Për statistikat zyrtare”, i ndryshuar; ii) Rregullore e Këshillit EU (EEC) Nr 177/2008 datë 20 Shkurt 2008 mbi Ndërtimin e regjistrave të ndërmarrjeve për qëllime statistikore; iii)Vendim i Kuvendit të Shqipërisë Nr. 3/2013 datë 14/02/2013 “Për miratimin e Programit të Statistikave Zyrtare 2012-2016”; iv) Vendim i Këshillit të Ministrave për “Për miratimin e nomenklaturës së veprimtarive ekonomike të revizionuar (Rev.2)” Nr. 320, datë 28.5.2014; v) Ligji Nr 8957 datë 17.10.2002 “Për ndërmarrjet e vogla e të mesme” ndryshuar me Ligjin Nr. 10042 datë 22.12.2008.
3. Grumbullimi i të dhënave
Në nivelin konceptual, metodologjia e përdorur në grumbu-llimin dhe vlefshmërinë e të dhënave mund të shpjegohet sipas skemës në vazhdim:
Njësi ligjore
(Kodi ID = NIPT)
Ndërmarrje:
• Aktivitet Ekonomik•
Të punësuar
Regjistri i Ndërmarrjeve
Tregtarët
(Kodi ID = NIPT)
Vlerat Importe / Eksporte
• Kodi i produktit
• Vendi partner
Të dhënat e tregtisë së jashtme të mallrave
Legal unit
(ID code)
Enterprise:
•Economic activity
• Number of employees
Business Register
Traders
(ID - code)
Value Imports / Exports
• Product code
• Partner country
External trade of goods data set
b. Business Register
Business Register hold all non-agricultural legal unit (enterpris-es and institutions) that perform their economic activity inside Albanian territory.
Business Register based on information taken from adminis-trative sources builds identifying, demographic and economic variables, scalability characteristics, ownership of the unit thereby creating the possibility of connecting with other reg-isters. Business Register plays an important role in aligning the foreign trade data with enterprise data. It provides the tools for detailed link of micro data of foreign trade (imports and exports) with statistical units in enterprise statistics.Also, Business register is a base for the compilation of the statistics needed to provide indicators of both short-term and structural economic developments. Business Register is based on: administrative sources provided by General Directory of Taxation (GDT) and by National Registration Centre (NRC) and surveys conducted by INSTAT and other statistical agencies.
The legal basis on which is built and supported Business Register, are: I) Albanian Law No 9180 date 05.02.2004 “For official statistics”, amended; II) Council Regulation (EEC) No 177/2008 of 20 February 2008 on Community coordination in drawing up business registers for statistical purposes; III) Decision of Albanian Parliament No. 3/2013 date 14/02/2013 “On Official Statistics Program 2012-2016”; IV) Decision of Albanian Government “On nomenclature of economic activities” No. 327 date 18.07.1994; V) Albanian Law No 8957 date 17.10.2002 “For small and medium enterprises, SME”, amended by the Law No. 10042 date 22.12.2008.
3. Data collection
At the conceptual level, the methodology used in the collection and validation of data can be explained by the following scheme:
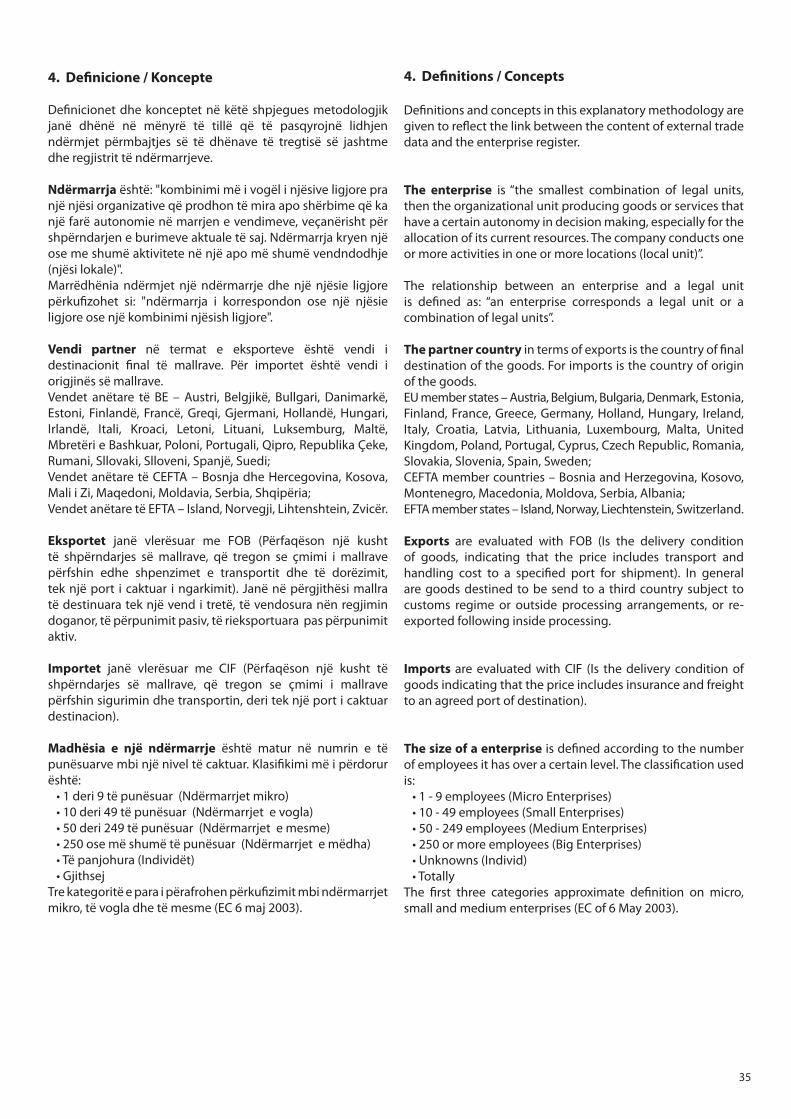
35
4. Definicione / Koncepte
Definicionet dhe konceptet në këtë shpjegues metodologjik janë dhënë në mënyrë të tillë që të pasqyrojnë lidhjen ndërmjet përmbajtjes së të dhënave të tregtisë së jashtme dhe regjistrit të ndërmarrjeve.
Ndërmarrja është: "kombinimi më i vogël i njësive ligjore pra një njësi organizative që prodhon të mira apo shërbime që ka një farë autonomie në marrjen e vendimeve, veçanërisht për shpërndarjen e burimeve aktuale të saj. Ndërmarrja kryen një ose me shumë aktivitete në një apo më shumë vendndodhje (njësi lokale)".Marrëdhënia ndërmjet një ndërmarrje dhe një njësie ligjore përkufizohet si: "ndërmarrja i korrespondon ose një njësie ligjore ose një kombinimi njësish ligjore".
Vendi partner në termat e eksporteve është vendi i destinacionit final të mallrave. Për importet është vendi i origjinës së mallrave.Vendet anëtare të BE – Austri, Belgjikë, Bullgari, Danimarkë, Estoni, Finlandë, Francë, Greqi, Gjermani, Hollandë, Hungari, Irlandë, Itali, Kroaci, Letoni, Lituani, Luksemburg, Maltë, Mbretëri e Bashkuar, Poloni, Portugali, Qipro, Republika Çeke, Rumani, Sllovaki, Slloveni, Spanjë, Suedi;Vendet anëtare të CEFTA – Bosnja dhe Hercegovina, Kosova, Mali i Zi, Maqedoni, Moldavia, Serbia, Shqipëria;Vendet anëtare të EFTA – Island, Norvegji, Lihtenshtein, Zvicër.
Eksportet janë vlerësuar me FOB (Përfaqëson një kusht të shpërndarjes së mallrave, që tregon se çmimi i mallrave përfshin edhe shpenzimet e transportit dhe të dorëzimit, tek një port i caktuar i ngarkimit). Janë në përgjithësi mallra të destinuara tek një vend i tretë, të vendosura nën regjimin doganor, të përpunimit pasiv, të rieksportuara pas përpunimit aktiv.
Importet janë vlerësuar me CIF (Përfaqëson një kusht të shpërndarjes së mallrave, që tregon se çmimi i mallrave përfshin sigurimin dhe transportin, deri tek një port i caktuar destinacion).
Madhësia e një ndërmarrje është matur në numrin e të punësuarve mbi një nivel të caktuar. Klasifikimi më i përdorur është: • 1 deri 9 të punësuar (Ndërmarrjet mikro) • 10 deri 49 të punësuar (Ndërmarrjet e vogla) • 50 deri 249 të punësuar (Ndërmarrjet e mesme) • 250 ose më shumë të punësuar (Ndërmarrjet e mëdha) • Të panjohura (Individët) • GjithsejTre kategoritë e para i përafrohen përkufizimit mbi ndërmarrjet mikro, të vogla dhe të mesme (EC 6 maj 2003).
4. Definitions / Concepts
Definitions and concepts in this explanatory methodology are given to reflect the link between the content of external trade data and the enterprise register.
The enterprise is “the smallest combination of legal units, then the organizational unit producing goods or services that have a certain autonomy in decision making, especially for the allocation of its current resources. The company conducts one or more activities in one or more locations (local unit)”.
The relationship between an enterprise and a legal unit is defined as: “an enterprise corresponds a legal unit or a combination of legal units”.
The partner country in terms of exports is the country of final destination of the goods. For imports is the country of origin of the goods. EU member states – Austria, Belgium, Bulgaria, Denmark, Estonia, Finland, France, Greece, Germany, Holland, Hungary, Ireland, Italy, Croatia, Latvia, Lithuania, Luxembourg, Malta, United Kingdom, Poland, Portugal, Cyprus, Czech Republic, Romania, Slovakia, Slovenia, Spain, Sweden;CEFTA member countries – Bosnia and Herzegovina, Kosovo, Montenegro, Macedonia, Moldova, Serbia, Albania;EFTA member states – Island, Norway, Liechtenstein, Switzerland.
Exports are evaluated with FOB (Is the delivery condition of goods, indicating that the price includes transport and handling cost to a specified port for shipment). In general are goods destined to be send to a third country subject to customs regime or outside processing arrangements, or re-exported following inside processing.
Imports are evaluated with CIF (Is the delivery condition of goods indicating that the price includes insurance and freight to an agreed port of destination).
The size of a enterprise is defined according to the number of employees it has over a certain level. The classification used is: • 1 - 9 employees (Micro Enterprises) • 10 - 49 employees (Small Enterprises) • 50 - 249 employees (Medium Enterprises) • 250 or more employees (Big Enterprises) • Unknowns (Individ) • TotallyThe first three categories approximate definition on micro, small and medium enterprises (EC of 6 May 2003).
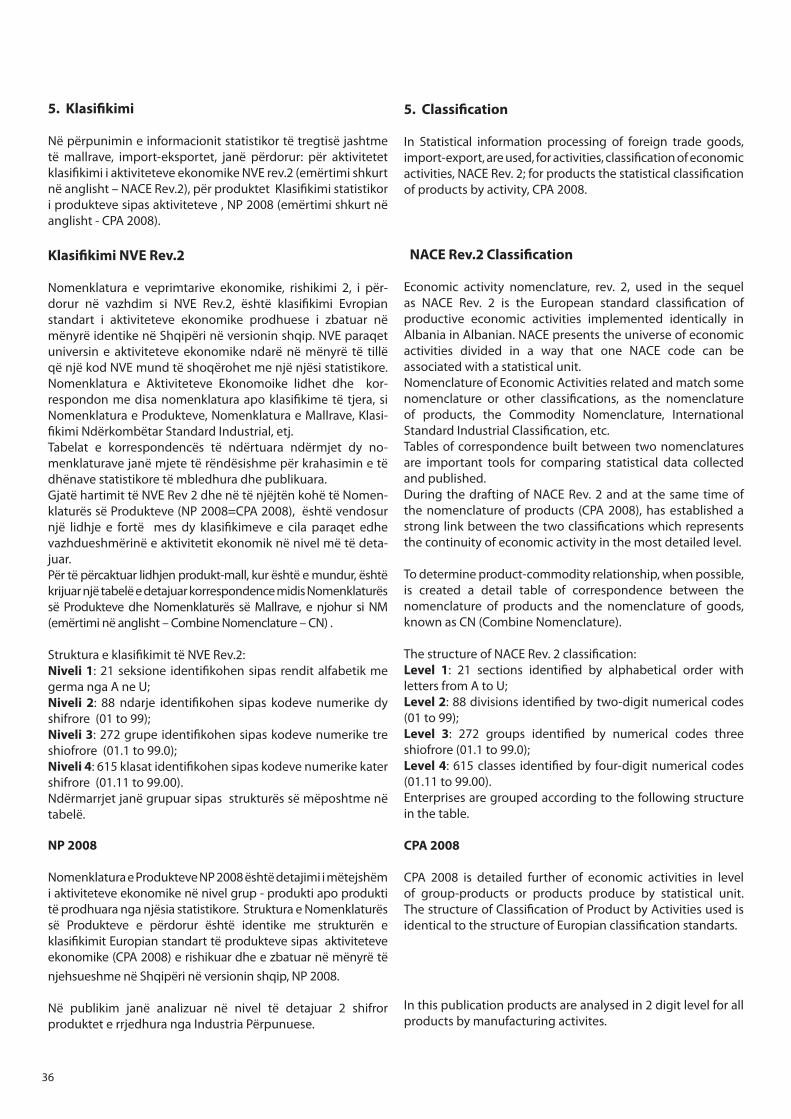
36
5. Klasifikimi Në përpunimin e informacionit statistikor të tregtisë jashtme të mallrave, import-eksportet, janë përdorur: për aktivitetet klasifikimi i aktiviteteve ekonomike NVE rev.2 (emërtimi shkurt në anglisht – NACE Rev.2), për produktet Klasifikimi statistikor i produkteve sipas aktiviteteve , NP 2008 (emërtimi shkurt në anglisht - CPA 2008).
Klasifikimi NVE Rev.2
Nomenklatura e veprimtarive ekonomike, rishikimi 2, i për-dorur në vazhdim si NVE Rev.2, është klasifikimi Evropian standart i aktiviteteve ekonomike prodhuese i zbatuar në mënyrë identike në Shqipëri në versionin shqip. NVE paraqet universin e aktiviteteve ekonomike ndarë në mënyrë të tillë që një kod NVE mund të shoqërohet me një njësi statistikore. Nomenklatura e Aktiviteteve Ekonomoike lidhet dhe kor-respondon me disa nomenklatura apo klasifikime të tjera, si Nomenklatura e Produkteve, Nomenklatura e Mallrave, Klasi-fikimi Ndërkombëtar Standard Industrial, etj. Tabelat e korrespondencës të ndërtuara ndërmjet dy no-menklaturave janë mjete të rëndësishme për krahasimin e të dhënave statistikore të mbledhura dhe publikuara. Gjatë hartimit të NVE Rev 2 dhe në të njëjtën kohë të Nomen-klaturës së Produkteve (NP 2008=CPA 2008), është vendosur një lidhje e fortë mes dy klasifikimeve e cila paraqet edhe vazhdueshmërinë e aktivitetit ekonomik në nivel më të deta-juar.Për të përcaktuar lidhjen produkt-mall, kur është e mundur, është krijuar një tabelë e detajuar korrespondence midis Nomenklaturës së Produkteve dhe Nomenklaturës së Mallrave, e njohur si NM (emërtimi në anglisht – Combine Nomenclature – CN) .
Struktura e klasifikimit të NVE Rev.2:Niveli 1: 21 seksione identifikohen sipas rendit alfabetik me germa nga A ne U;Niveli 2: 88 ndarje identifikohen sipas kodeve numerike dy shifrore (01 to 99); Niveli 3: 272 grupe identifikohen sipas kodeve numerike tre shiofrore (01.1 to 99.0); Niveli 4: 615 klasat identifikohen sipas kodeve numerike kater shifrore (01.11 to 99.00). Ndërmarrjet janë grupuar sipas strukturës së mëposhtme në tabelë.
5. Classification
In Statistical information processing of foreign trade goods, import-export, are used, for activities, classification of economic activities, NACE Rev. 2; for products the statistical classification of products by activity, CPA 2008.
NACE Rev.2 Classification
Economic activity nomenclature, rev. 2, used in the sequel as NACE Rev. 2 is the European standard classification of productive economic activities implemented identically in Albania in Albanian. NACE presents the universe of economic activities divided in a way that one NACE code can be associated with a statistical unit.Nomenclature of Economic Activities related and match some nomenclature or other classifications, as the nomenclature of products, the Commodity Nomenclature, International Standard Industrial Classification, etc.Tables of correspondence built between two nomenclatures are important tools for comparing statistical data collected and published.During the drafting of NACE Rev. 2 and at the same time of the nomenclature of products (CPA 2008), has established a strong link between the two classifications which represents the continuity of economic activity in the most detailed level.
To determine product-commodity relationship, when possible, is created a detail table of correspondence between the nomenclature of products and the nomenclature of goods, known as CN (Combine Nomenclature).
The structure of NACE Rev. 2 classification:Level 1: 21 sections identified by alphabetical order with letters from A to U; Level 2: 88 divisions identified by two-digit numerical codes (01 to 99);Level 3: 272 groups identified by numerical codes three shiofrore (01.1 to 99.0);Level 4: 615 classes identified by four-digit numerical codes (01.11 to 99.00).Enterprises are grouped according to the following structure in the table.
CPA 2008
CPA 2008 is detailed further of economic activities in level of group-products or products produce by statistical unit. The structure of Classification of Product by Activities used is identical to the structure of Europian classification standarts.
In this publication products are analysed in 2 digit level for all products by manufacturing activites.
NP 2008
Nomenklatura e Produkteve NP 2008 është detajimi i mëtejshëm i aktiviteteve ekonomike në nivel grup - produkti apo produkti të prodhuara nga njësia statistikore. Struktura e Nomenklaturës së Produkteve e përdorur është identike me strukturën e klasifikimit Europian standart të produkteve sipas aktiviteteve ekonomike (CPA 2008) e rishikuar dhe e zbatuar në mënyrë të njehsueshme në Shqipëri në versionin shqip, NP 2008.
Në publikim janë analizuar në nivel të detajuar 2 shifror produktet e rrjedhura nga Industria Përpunuese.

37
Seksioni Përshkrimi Ndarjet
A Bujqësia, Pyjet, Peshkimi 01- 03
B Industria Nxjerrëse 05- 09
C Përpunimi 10-33
D Energjia elektrike, furnizimi me gaz, avull dhe ajër i kondicionuar 35
E Furnizimi me ujë, aktivitete të trajtimit dhe menaxhimit të mbeturinave, mbetjeve 36-39
F Ndërtimi 41- 43
G Tregtia me shumicë dhe me pakicë; Riparimi i automjeteve dhe motoçikletave 45- 47
H Transporti dhe magazinimi 49 -53
I Akomodimi dhe shërbimi ushqimor 55-56
J Informacioni dhe komunikaioni 58- 63
K Aktivitete �nanciare dhe të sigurimit 64-66
L Aktivitete të pasurive të paluajtëshme 68
M Aktivitete profesionale, shkencore dhe teknike 69-75
N Shërbime administrative dhe mbështetëse 77- 82
O Administrimi publik dhe mbrojtja; Sigurimi social i detyrueshëm 84
P Arsimi 85
Q Shëndetësia dhe aktivitete të punës sociale 86-88
R Arte, argëtim dhe çlodhje 90-93
S Aktivitete të tjera shërbimi 94-96
T Aktivitetet të familjeve si punëdhënës; Aktivitete të prodhimit të mallrave e shërbimeve të pandryshueshme të familjeve për përdorimin e vet 97- 98
U Aktivitete të organizatave dhe organizmave ndërkombëtare 99
Section Description Divisions
Agriculture, forestry and �shing
Mining and quarrying
Manufacturing
Electricity, gas, steam and air conditioning supply
Water supply and treatment activities, waste management, waste
Construction
Wholesale and retail trade; repair of motor vehicles and motorcycles
Transportation and storage
Accommodation and food service activities
Information and communication
Financial and insurance activities
Real estate activities
Professional, scienti�c and technical activities
Administrative and support service activities
Public administration and defence; compulsory social security
Education
Human health and social work activities
Arts, entertainment and recreation
Other service activities
Activities of households as employers; undi�erentiated goods-and services-producingof households for own use
Activities of extraterritorial organisations and bodies
Struktura e Nomenklaturës së Veprimtarive Ekonomike, Rev.2.The Structure of Classification of Economic Activity, Rev. 2.

38
Struktura e Nomenklaturë së Produkteve sipas Aktiviteteve Ekonomike, Rev.2
Ndarjet sipas NP 2008 Përshkrimi
Grup - Ndarjet
A 01-03
B 05-09
C
10-33
10
11
12
13
14
15
16
17
18
19
20
21
22
23
24
25
26
27
28
29
31
32
33 Riparimi dhe instalimi i makinerive dhe pajisjeve
D 35
E Furnizimi me ujë, aktivitete të trajtimit dhe menaxhimit të mbeturinave, mbetjeve 36-39
F-U Të tjera 41-99
Divisions by CPA 2008 Description Group - Divisions
Agriculture, forestry and �shing products
Mining and quarrying products
Food processing products
Beverages
Tobacco products
Textile
Clothing
Leather and leather products
Wood, product of wood and oak manufacture, except furniture; of straw and reed articles
Paper and paper products
Printing and regrouping of recorded media
Coke and re�nery of crude oil products
Chemicals and chemical products
Pharmaceutical products and pharmaceutical preparations
Rubber and plastic products
Non - metallic mineral products
Metallurgy
Fabricated metal products manufacture except, machinery and equipment
Production of optics, electronics, computer
Eectrical equipment
Machinery and equipment
Motor vehicles, trailers and semi - trailers
Furniture
Other manufactured products
Repair and machinery and equipment installation
Electricity, gas, steam and air conditioning supply
Water supply and treatment activities, waste management, waste
Other
Produkte bujqësore, pylltarie dhe peshkimi
Pije
Veshje
Lëkurë dhe produkte prej lëkure
Letra dhe produkteve prej letre
Koksi dhe nënprodukte të ra�nerisë së naftës
Kimikate dhe produkte kimike
Produkte farmaceutike dhe preparate farmaceutike
Produkte të kauçukut dhe plastikës
Produkte minerale jo metalike
Produkte të metaleve bazë (nga Metalurgjia)
Produkte metalikë të fabrikuar, përveç makinerive dhe pajisjeve
Produkte optikë, elektronikë, kompjuterikë
Paisje elektrike
Makineri dhe paisje të p.k.t
Mjete të transportit, rimorkio dhe gjysëmrimorkio
Mjete të tjera të transportit
Mobiljet
Produkte të paklasi�kuara vend tjetër
Energjia elektrike, gazi, avulli dhe furnizimi me ajër të kondicionuar dhe
Produkte nga përpunimi
Produkte nga minierat dhe nxjerrja
Produkte ushqimore
Duhan dhe produkte të duhanit
Tekstile
Dru dhe produkte prej druri dhe dushku, përvec mobilje, artikuj xunkthi dhe kashte
Materiale të shtypura dhe media të regjistruar
Other transport equipmentp q p30
The Structure of the Classification of Products by Economic Activity, Rev. 2

39
Për më shumë informacion mbi klasifikimet, për referencë:For more information about the classification, for reference:http://www.instat.gov.al/al/metodologji/klasifikime-nomenklatura.aspx;
Shkurtime / Abriviations
INSTAT – Instituti i Statistikave / Institute of StatisticsBE – Bashkimi Evropian / EU - Europian UnionCEFTA – Marëveshja e Tregtisë së Lirë e Vendeve të Evropës Qëndrore / Central European Free Trade AgreementEFTA – Bashkimi i Tregtisë së Lirë të Vendeve Evropiane / European Free Trade AssociationNVE Rev.2 – Nomenklatura e Veprimtarive Ekonomike, Rishikimi 2 / NACE Rev.2 – Classification of Economic Activities of European Community, Rev.2NP-2008 – Klasifikimi i produkteve sipas aktiviteteve / CPA 2008 – Classification of Products by ActivitiesNMVM – Ndërmarrje Mikro, të Vogla dhe të Mesme / SME – Micro, small and Medium EnterprisesNM – Nomenklatura e Mallrave / CN – Combine NomenclatureSITC – Klasifikimi Standart i Tregtisë Ndërkombëtare / Standard International Trade Classification
Shpjegimi i simboleve / Explanation of Symbols
0 vlerë më e vogël se gjysma e njësisë matëse / value less than half of unit of measure- pa vlerë / no value

Tirazhi 300 kopje