TREE -RING RESEARCH - Open Repository of Tree -Ring Research, ... Biotechnical Faculty, University...
52
Tree-Ring Bulletin, Volume 59, Issue 1 (2003) Item Type Article Publisher Tree-Ring Society Journal Tree-Ring Research Rights Copyright © Tree-Ring Society. All rights reserved. Download date 28/06/2018 00:46:02 Link to Item http://hdl.handle.net/10150/263024
Transcript of TREE -RING RESEARCH - Open Repository of Tree -Ring Research, ... Biotechnical Faculty, University...
Tree-Ring Bulletin, Volume 59, Issue 1 (2003)
Item Type Article
Publisher Tree-Ring Society
Journal Tree-Ring Research
Rights Copyright © Tree-Ring Society. All rights reserved.
Download date 28/06/2018 00:46:02
Link to Item http://hdl.handle.net/10150/263024
TREE -RINGRESEARCH
2003
PUBLISHED BY THE TREE -RING SOCIETY
with the cooperation of
THE LABORATORY OF TREE -RING RESEARCH
THE UNIVERSITY OF ARIZONA®
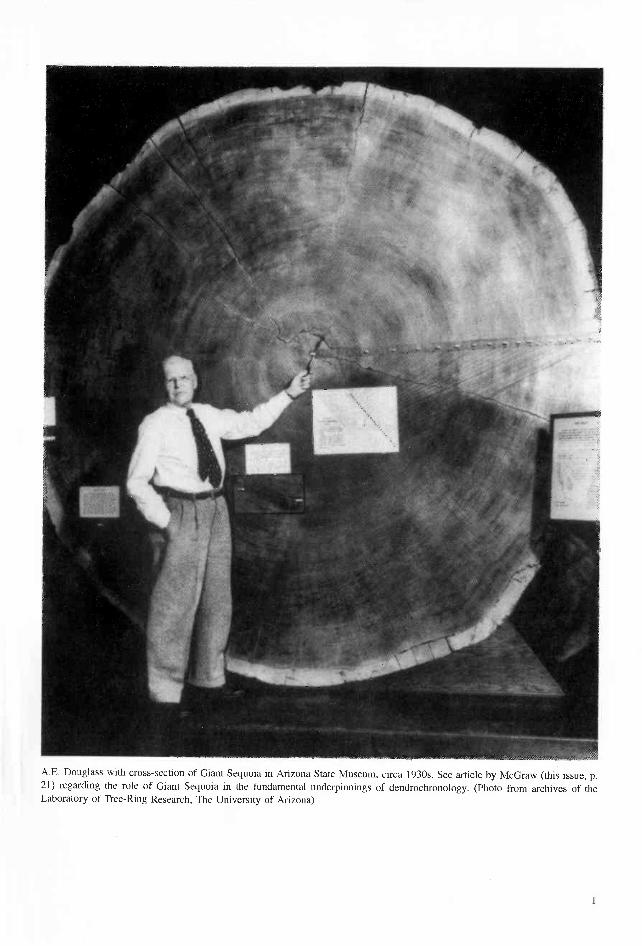
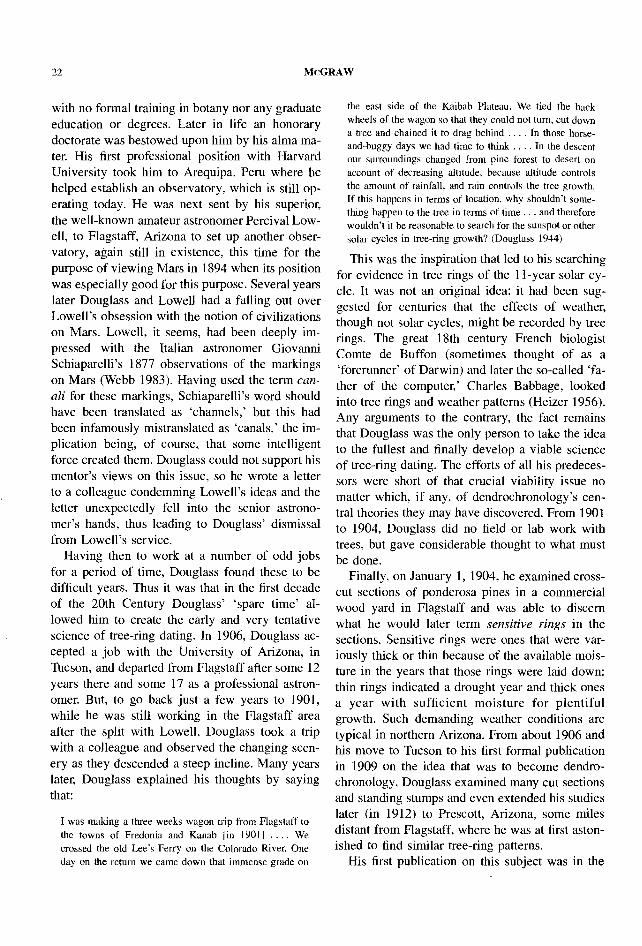
A.E. Douglass with cross - section of Giant Sequoia in Arizona State Museum, circa 1930s. See article by McGraw (this issue, p.21) regarding the role of Giant Sequoia in the fundamental underpinnings of dendrochronology. (Photo from archives of theLaboratory of Tree -Ring Research, The University of Arizona)
1

TREE -RING RESEARCH, Vol. 59(1), 2003, p. 2
TREE -RING SOCIETY
EXECUTIVE BOARD
The Tree -Ring Society is governed by a nine -member Executive Board that consists of a President,Vice President, Secretary, Treasurer, the Editor of the Society's journal, and four members -at- large.Board members serve 2 -year terms. Current Executive Board members will serve during 2002 and2003.
President: Dave LeBlancDepartment of Biology, Ball State University, Indiana, USAdleblanc @bsu.edu
Vice President: Malcolm K. HughesLaboratory of Tree -Ring Research, University of Arizona, [email protected]
Secretary: Connie WoodhouseNational Oceanic and Atmospheric Association Paleoclimatology Program, Colorado, [email protected]
Treasurer: Peter BrownRocky Mountain Tree -Ring Research, Colorado, [email protected]
Editor: Steven W. LeavittLaboratory of Tree -Ring Research, University of Arizona, USAsleavitt @ltrr.arizona.edu
Member -at- Large: Katarina CufarBiotechnical Faculty, University of Ljubljana, Sloveniakatarina.cufar @uni_lj.si
Member -at- Large: Elaine Kennedy -SutherlandUS Forest Service, Rocky Mountain Research Station, Montana, [email protected]
Member -at- Large: Jacques TardifCentre for Forest Interdisciplinary Research, University of Winnipeg, Canadaj.tardif @uwinnipeg.ca
Member -at- Large: Qibin ZhangCold and Arid Regions Environmental and Engineering Research Institute, Chinese Acad-emy of Sciences, Chinaqbzhang @ ns.lzb.ac.cn
2 Copyright © 2003 by the Tree -Ring Society
TREE -RING RESEARCH, Vol. 59(1), 2003, pp. 3 -10
SPECIAL EDITORIALCANONS FOR WRITING AND EDITING MANUSCRIPTS
HENRI D. GRISSINO -MAYERAssociate Editor
Laboratory of Tree -Ring ScienceDepartment of GeographyUniversity of Tennessee
Knoxville, Tennessee 37996, USA
ABSTRACT
Writing is much like any other activity -the more you read and write, the more proficient you becomeas a scientist. Here, I provide canons for writing and editing scientific papers that should help novice writersavoid common hazards that could render a manuscript unpublishable. Abstracts should be well -written andconcise and contain all the major results and conclusions. The manuscript should be well organized. Sen-tences in all paragraphs should stick to the central theme of the paragraph. Writers should provide Latinnames for species analyzed, and should use SI units in all cases. The use of bulleted lists, active voice,and commas after introductory phrases will improve the clarity of the manuscript. Tables and figures shouldbe clear, well- organized, stand -alone accessories to the text, and usually convey data and results that arenumerous or complex. Writers should avoid both plagiarism and self -plagiarism, and should have theirmanuscript proofread before submitting to a journal. Finally, authors should consult primary references(such as Scientific Style and Format, published by the Council of Biology Editors in 1994) to becomefamiliar with troublesome words and phrases.
Keywords: abstracts, manuscript organization, proofreading, active voice, plagiarism.
INTRODUCTION
When I was first thrust into the scientific writingpool, I was given several articles and books aboutwriting manuscripts, many of which serve me tothis day. I realized I had much to learn (e.g. whydoes it matter if I use "which" instead of "that " ?),and I was continually frustrated by what appearedto be a lack of acceptance by my peers for mywriting. I later realized that writing like a scientistis like any other activity -the more you engage inthe activity, the more proficient you become. As Isteadily gained confidence, I saw a major improve-ment in my writing and my manuscripts were in-creasingly accepted. One activity that most im-proved my own scientific writing was the readingof hundreds of manuscripts, proposals, and studentterm papers. As one editor recently informed me,the best writers are also the most prolific readers(Brian C. McCarthy, personal communication).Today, I provide a set of canons to my students
Copyright © 2003 by the Tree -Ring Society
for writing scientific papers in the hope that theywill avoid the mistakes to which I (too often) fellprey. Writers should keep in mind, however, thatdifferent journals will have different formats andstyles, and that the guidelines for the targeted jour-nal should be read carefully when preparing amanuscript.
THE THREE C's
Be concise. Nothing is more tedious than read-ing a paper bloated with unnecessary text and fillersentences. Many novice writers believe lengthymanuscripts equate to more scientific manuscripts,and this simply is not true. In fact, the articles citedmost often by other scientists are usually short ar-ticles. Some journals (such as Science and Nature)have strict guidelines that require submitted man-uscripts be as short as possible while still com-municating the major findings of the study. Learn
3
4 GRISSINO -MAYER
how to maximize the amount of information pre-sented in as short a space as possible.
Be clear. Avoid wordiness. Why say "mastertree -ring index chronology" when "master chro-nology" will suffice? As scientists, we must nec-essarily be technical, but writing like a scientistrequires a balance between being technical and be-ing clear. Remember that many reading your arti-cle may not be experts in your particular field.Simple, non -technical phrases and sentences areeasier to read and understand. Always read overeach sentence and look for those hallmark expres-sions that indicate wordiness (some examples arelisted at the end of this article).
Be correct. Never ever fabricate data, invent re-sults, embellish your findings, steal words or ideasfrom others, or purposely mislead the reader.Nothing is more heinous than a scientist who in-tentionally commits fraud. In a well -publicizedcase, two cancer researchers fabricated data thatwere reported in more than 40 peer- reviewed pub-lications (Abbott 1997, 1998). Report only whatyour results show and be prepared to back up yourinterpretations with graphs, tables, and hard data.
THE ABSTRACT IS CRITICAL
The abstract is the single most important sectionof the manuscript because scientists read abstractsto gauge whether to read the entire paper (Landes1951; Hart 1976; Council of Biology Editors(CBE) 1994). Writers must therefore convey in theabstract as much vital information about the studyas possible (Weil 1970). Abstracts should be shortand concise, no longer than 250 -300 words (butcheck the journal's guidelines). Abstracts shouldconsist of only one paragraph, although two par-agraphs are allowable for more extensive studies.The abstract should contain all the elements of thepaper itself:
1) 1 -3 sentences that introduce and justify thestudy
2) 1 -3 sentences about the study area and speciesused
3) 2 -3 sentences on the methods employed4) all significant results, which should comprise
the majority of the abstract
5) 2 -3 sentences that encapsulate the major con-clusions
Never use vague phrases such as "is described,""is reported," "is discussed," and "is presented"(Landes 1951; Hart 1976). Avoid verbose, space -wasting phrases such as "In this study, we inves-tigated ... ". State simply "We investigated ... ".
ORGANIZATION IS KEY
A manuscript must be well organized with allthe sections required by the journal, typically: Ab-stract, Introduction, Site Description, Methods (not"Methodology "), Results, Discussion, Conclu-sions, and References Cited. Begin all manuscriptsby creating a detailed outline of the content to beincluded (justification, objectives, site information,tests to be conducted, etc.). In fact, the sections inyour outline should easily turn into the headingsused in the sections of the paper. While writing,ask yourself to which section your sentences (andthe ideas they convey) belong. Be sure to placebackground material, objectives, and the study jus-tification in the Introduction. Any sentences thatdescribe field and laboratory techniques and sta-tistical and graphical analyses must go in theMethods section. The Results section (sometimesthe shortest) should contain tables and figures thatclearly and concisely present the main findings ofthe study. Reserve any interpretations of the re-sults for the Discussion section. Do not repeat sen-tences from previous sections to "remind" thereader why particular techniques were used. Donot introduce new methods in the Results section,as these are often viewed by readers as "after-thoughts," possibly introduced once the primarymethods did not produce the desired results. En-sure that your paragraphs "flow" from one to thenext, using transitional sentences when necessary.
MAINTAIN GOODPARAGRAPH STRUCTURE
Each paragraph should have a topic sentence(CBE 1994; Sorenson 1995). All other sentencesin the paragraph must support the central topic ofparagraph. When writing, ask yourself, "Does thissentence support the major topic of this paragraph?
Canons for Writing and Editing 5
Does it instead belong in the previous (or follow-ing) paragraph ?" Furthermore, all sentencesshould flow, with each subsequent sentence relat-ing in some way to the previous statements. Usetransition words and phrases when necessary (butsparingly), such as "Furthermore," "In contrast,""In addition," "Subsequently," and "Consequent-ly" (Sorenson 1995).
USE BULLETED AND NUMBERED LISTS
Bulleted and numbered lists add clarity to com-plex statements that involve listing more than oneitem. For example, fire history studies make useof several intra- annual positions for fire scars tohelp designate the season of fire occurrence:
Dormant: a scar between the latewood and ear -lywood.Early earlywood: a scar in the first one -thirdportion of the earlywood.Middle earlywood: a scar in the second one-third portion of the earlywood.Late earlywood: a scar in the last one -third por-tion of the earlywood.Latewood: a scar in the latewood.
Supplying this information in one or more sen-tences would have created an awkwardly wordedparagraph. The list is preceded by a colon andeach entry in the list is capitalized (Vorfeld 2002),although lowercase can be used if each entry issyntactically part of the sentence (Chicago Edito-rial Staff 1993). The use of periods after each listentry depends on whether the list entry completesthe introductory sentence, although consistent useof periods is recommended (Vorfeld 2002). Usenumbered lists only when the items must be per-formed, analyzed, or discussed sequentially; oth-erwise, use non- numbered lists.
ALWAYS PROVIDE LATIN NAMES
"Identification of organisms is the first step incommunicating an investigator's results in any re-port involving any biological entities" (Lee et al.1982). Because replication of experiments is ahallmark of good science, always mention theplant species investigated (Tippo 1989). Include
the full Latin binomial name, as well as the author,in parentheses after the common name. Forexample, "We analyzed the growth response ofshortleaf pine (Pinus echinata Mill.) to changingclimate conditions." Italicize or underline the Lat-in binomial names. Use accepted abbreviations forthe authors (e.g. "L. ", not "Linnaeus "). Avoid us-ing outdated or unacceptable synonyms for the bi-nomial name (e.g. Pseudotsuga taxifolia Pseu-dotsuga menziesii). Once mentioned, the genusname can be abbreviated (e.g. "P. echinata").
ALWAYS USE SI UNITS
Use SI units in all manuscripts (Orvis and Gris -sino -Mayer 2002). "SI" refers to "Système Inter-national" units, the modern version of the metricsystem and the standard for scientific writing,adopted in 1960. In the physical sciences, the mostcommon base units are meters (for length or dis-tance), kilograms (for mass), and seconds (fortime) (CBE 1994). Standard prefixes and theirsymbols (if the journal permits) should be used(e.g. kilo = k; micro = p,) in the text of themanuscript. More information on SI base unitsand conversions can be found at the web site forthe Bureau International des Poids et Mesures athttp://www.bipm.fr/enus/3_SI/si.html.
USE COMMAS WHEN NECESSARY
The use of a comma after introductory phrasesat the beginning of a sentence may make the sen-tence more understandable (Shertzer 1986). I ab-hor reading a sentence that does not make senseas punctuated, only to discover that a commaplaced after the introductory phrase would havemade the sentence much more clear. For example,"After analyzing the program output using thestandardization options we selected we chose touse a 100 -yr smoothing spline." In this sentence,one does not know whether to pause the readingafter the words "output," "options," or "select-ed" without somehow reading ahead. Commas arenecessary after such long introductory preposition-al phrases, and should always be used when punc-tuation is needed for clarity (Shertzer 1986; Gi-baldi 1999). When in doubt, opt for clarity and

6 GRISSINO -MAYER
Table 1. Nominalizations found in the dendrochronological literature.
Nominalization Alternative
... allowed the development of
... climate was a significant influence on
... these analyses were performed on
... the chronology provided estimates of
... helped the creation of
... facilitated an interpretation of
... an expression of past climate for
... developed
... climate significantly influenced
... we analyzed
... the chronology estimated
... helped create
... helped interpret
... expressed as past climate for
insert a comma after introductory phrases in sen-tences.
USE ACTIVE VOICE
Manuals on writing style and many scientificjournals explicitly direct writers to use the activerather than the passive voice (Strunk and White1979; Sublett 1993). The subject conducts the ac-tion in active voice, whereas the subject receivesthe action in the passive voice. For example, thepassively- voiced sentence "The tree rings werefound to be too complacent for accurate dating"becomes "We found the tree rings too complacentfor accurate dating" in active voice. The activevoice is considered more direct, concise, and ef-fective (McMillan 1988; Sublett 1993). The use ofactive voice often requires the use of personal pro-nouns (Hart 1976), which is advantageous becausescientists should assume personal responsibilityfor their research (McMillan 1988). The overuseof active voice, however, can render a manuscripttoo personal, and the writer should occasionallyuse passive constructions. Writers should peruserecent issues of the targeted journal to gauge theacceptance of first/third person usage.
AVOID NOMINALIZATIONS
Nominalizations are usually verbs converted tonouns (Lanciani 1998; Table 1). For example, thephrase "led to the generation of indices" couldeasily be shortened to the much clearer phrase"generated indices. Many novice writers believethat liberal use of nominalizations creates a studythat sounds more scientific, but this is rarely thecase. Sentences should describe the actions of sci-
entists concisely and clearly, which requires gen-erous use of action verbs rather than nominaliza-tions. Nominalizations are verbose, but are com-monly found in dendrochronology as in many oth-er sciences.
AVOID NOUN CLUSTERS ANDSTACKED MODIFIERS
A noun adjunct is any noun used to modify an-other noun (Wilson 1993), and is very common inscientific writing, e.g. "tree ring" and "computerprogram." The overuse of noun adjuncts createsnoun clusters (CBE 1994) and clumsy sentencestructure. Similarly, adjectives that are clusteredare known as stacked modifiers (CBE 1994). Acommon mistake by beginning writers is the over-use of noun adjuncts and stacked modifiers in thefalse belief that their writing will appear more"scientific." For example, in the sentence "The1926 juniper growth ring index was below 1.0,"the subject word "index" is preceded by fournouns used as adjectives. Instead, use prepositionalphrases to clarify the sentence: "The tree -ring in-dex for the year 1926 from our junipers was below1.0." While brevity will be sacrificed, clarity willbe gained (CBE 1994).
AVOID PLAGIARISM
Plagiarism occurs when "one presents substan-tial portions or elements of another's work or dataas their own" (American Psychological Associa-tion (APA) 1994). Plagiarism not only applies towritten statements, but also extends to ideas andhypotheses expressed previously by someone else(APA 1994). To ensure written plagiarism is
Canons for Writing and Editing 7
avoided, writers should learn how to paraphrase,whereby sentences and passages are placed inone's own words (McMillan 1988; APA 1994; So-renson 1995). Paraphrased passages, however,must be properly credited in the text. If exact textis used, it should be enclosed in quotation marksand again properly cited, although quoted passagesare not very common in the natural and physicalsciences.
Another contentious issue is self - plagiarism.Self -plagiarism occurs when an author lifts com-plete sentences or paragraphs from previous pub-lications and inserts them in a new manuscript(Binder 1990; Samuelson 1994), which infringeson the copyright secured by the first journal. Es-pecially egregious, self -plagiarism occurs whenauthors submit a manuscript as original when ithas already been published in another journal, orwhen one attempts to re- publish a manuscript in aslightly altered form (Binder 1990). Submitting thesame study in another language also constitutesself -plagiarism (unless editors specifically ask fora translation of the previous study, or appropriateaccommodations are made to republish copyright-ed material). Self - plagiarized publications are easyto spot-they often have a similar title to a pre-viously published article. Avoid self -plagiarismbecause it "is sometimes both unlawful and un-ethical" (Samuelson 1994).
USE EASY -TO -READ TABLESAND FIGURES
Tables and figures are often required accessoriesto the text in a manuscript, but unfortunately arealso the most difficult parts to design and edit(CBE 1994). Both should contain enough infor-mation to be stand -alone items. Tables are usedmostly to display large amounts of numeric dataor text information in a concise, organized spacein a logical column/row format. If the informationcan be tabulated, or if the information would cre-ate text that is difficult to read, consider placingthis material in a table. All tables should have (1)a number and title, (2) column headings, (3) rowheadings (or the "stub "), (4) the data fields (alsocalled "cells "), and (5) footnotes (if required).
Figures are visual aids that should clearly, con-
cisely, and immediately convey information to thereader without the reader having to resort to thetext. If trends (both temporal and spatial) are ap-parent in your data or results, consider using achart or map rather than attempting to convey thisinformation in the text. Keep charts (e.g. X -Ygraphs, line charts, bar charts) simple, using ac-cepted symbols and abbreviations that are clear.Label all axes (including the secondary y -axis ifused) and keep the text size uniform throughoutthe figure and sufficiently large that it will still bereadable when reduced to fit into the allotted jour-nal page space. Flow charts can be used to conveycomplex schemes and concepts (e.g. Fritts 1976:232). Photographs should always contain some in-dicator of the scale of the object (e.g. a coin, cam-era lens cap, handle from an increment borer, oreven a size scale printed onto the photo). Ensurethat all figures are absolutely necessary -ask your-self, "Does this figure add a significant amount ofvaluable information not presented in the text ?"
PROOFREAD AND READ PROOFS
Never submit a manuscript for publication un-less is has gone through an internal (and some-times external) review process (CBE 1994). Noth-ing is more frustrating than reviewing a manu-script that has multiple grammatical and spellingerrors, odd given that most word processors havegrammar and spell checkers. You should alwayshave one or more of your colleagues read overyour paper for accuracy and clarity. If your col-league has difficulty understanding a sentence orparagraph, then some journal readers surely will.If English is not your native language, considerasking an English- speaking colleague to read overyour manuscript for correctness and clarity and forhelp in some of the translations.
Once accepted for publication, the senior author(usually) is responsible for ensuring accuracy andcompleteness, and should carefully read the proofpages (called "galley proofs ") sent to them by thejournal prior to publication. I read each page atleast twice. During the first reading, I concentratesolely on the details: spelling, punctuation, andgrammar. During the second and subsequent read-ings, I concentrate on the clarity of the text, tables,
8 GRISSINO -MAYER
and graphics. Remember, though, that journalsmay charge a fee if you suggest that extensivechanges be made to the proofs.
TROUBLESOME WORDS AND PHRASES
Certain words and phrases are repeatedly mis-used by beginning writers and seasoned profes-sionals alike, despite many being clearly explainedin such standard references as Strunk and White(1979) and CBE (1994). These are some of themore common
time period, period of time: These are redundant,wordy expressions because period already refersto time. Simply use period, as in "We examinedthe period before suppression began."
in order: This wordy phrase is never necessary.For example, rather than saying "In order to ex-amine the growth rates of trees ... ," simply say"To examine the growth rates of trees ... ".
There are, There is, There were: Never begin sen-tences with these phrases because they indicate awordy sentence that can be restructured for clarity(Hart 1976). There should never be the subject.Rather than saying "There were many micro -ringsfound in this section of the wood," say "We foundmany micro -rings in this section of the wood."
Figure 1 shows, Table 2 proves: References to ta-bles and figures should always be parenthetical inthe sentence and never occupy positions in thesubject (Hart 1976; CBE 1994). For example, "Wefound statistically significant correlation coeffi-cients between the two variables (Table 1)."
This indicates, It can be seen, It is: Sometimes thisor it may not be obvious to the reader. Such sen-tences can always be re- worded (Hart 1976). Forexample, rather than saying "It can be seen thatclimate changed over time," say simply "Climatechanged over time."
through the use of Attribution is the correct in-tention of this phrase, but the phrase always in-dicates a sentence that can be restructured for clar-ity. For example, rather than saying "Through theuse of dendrochronology, we...," say "We useddendrochronological techniques to ... ".
As previously stated, As mentioned previously:Such phrases always suggest a paper that can bemore clearly written and perhaps re- organized(Hart 1976). One should never have to restate afact already stated. This situation often occurswhen sentences in the Methods section are restatedin the Results section.
A.D. 1861, 1127 B.C.: In dates, "A.D." precedesthe year, while "B.C." follows the year (Gibaldi1999). Repeatedly mentioning "A.D." is redun-dant if all dates reported in your manuscript areA.D., but follow the journal's guidelines. "AD"and "BC" (without periods) are also acceptable,but again should follow the journal guidelines.
1700s and 1800s (with no apostrophes) are pre -ferred over 1700's and I800's: Although the pluralform of years can take an apostrophe, the primaryintent of an apostrophe is to indicate the possessivecase. The apostrophe can be omitted when no pos-sibility exists in mistaking the plural meaning(Shertzer 1986; Gibaldi 1999).
P < 0.05 is preferred over P = 0.05: In classicalhypothesis testing, significance levels for statisticaltests are chosen beforehand (Burt and Barber1996). A test result is statistically significant whenthe probability level associated with the test statis-tic falls below the chosen significance level. In ad-dition, never report "P < 0.0000." Instead, simplystate "P < 0.0001." The "P" should be capital-ized (CBE 1994). (Again, check journal.)
since because: The primary definitions for theword since are related to elapsed time (CBE 1994;Agnes 1995). If causality is implied, use insteadthe word because. Rather than saying "Sincegrowth rates have changed..." say "Becausegrowth rates have changed since AD 1950... ".
due to because of Although common, due to isnot a satisfactory substitute for because of Theprimary meanings of the word due refer to some-thing owed (Agnes 1995). Again, if causality isimplied, use because. Rather than saying "Treegrowth was exceptional due to this enhanced rain-fall," say "Tree growth was exceptional becauseof this enhanced rainfall."
because whereas while: These conjunctions
Canons for Writing and Editing 9
are not interchangeable. Use because if causalityis suggested by the second conjoined sentence.Use whereas and while if the second conjoinedsentence contrasts the meaning of the first sentenceor phrase. While also carries the element of time.
that which: These troublesome words are notinterchangeable. The pronoun that is restrictive,referring to one specific object, whereas which isnonrestrictive (Hart 1976; Strunk and White 1979;CBE 1994). In most cases, that can be substitutedfor which, thereby improving the clarity of the sen-tence. For example, "The tree that had the mostsensitive rings was located on a ridge" is differentfrom "This tree, which was located on a ridge, hadthe most sensitive rings."
instance example: Instance refers to a "person,thing, or event that proves or supports a generalstatement" (Agnes 1995). Example is applied toanything "cited as typical of members of thegroup" (Agnes 1995). In most scientific studies,we provide examples rather than instances. Whenappropriate, use "For example" rather than "Forinstance."
effect affect: The most common use of effect isas a noun indicating the result of an action, e.g."Summer precipitation had the greatest effect."The most common use of affect is as a verb mean-ing to influence, e.g. "Summer precipitation ad-versely affected tree growth."
effect impact: Often used synonymously, thesewords have different primary meanings. Impactshould be used only when describing the action ofone object striking another. For example, ratherthan saying "Summer precipitation had the great-est impact on tree growth," say "Summer precip-itation had the greatest effect on tree growth"(CBE 1994).
accuracy precision: In dendrochronology, we(too often) throw these words around indiscrimi-nately. Accuracy is the degree of correctness of ameasure or statement, whereas precision is the de-gree of refinement of a measure or statement (CBE1994). Tree -ring scientists provide dates that areaccurate to one year, e.g. "A.D. 1685." We rarelycan provide dates that are more precise, e.g. "A.D.1685.125."
use utilize employ: These are not interchange-able (CBE 1994). Employ (meaning "to put towork ") should never be used in the natural sci-ences. Utilize is simply too wordy, while use ismore straight -forward: "We used monthly climatedata," not "We utilized monthly climate data."
data and criteria: These words are the plural formfor the singular datum (itself rarely used in sci-entific writing) and criterion. Sentence structuresmust reflect that these are plural nouns.
methods, not methodology: The word methodologyrefers primarily to the "science of method or or-derly arrangement" (Agnes 1995) and the collec-tive body of principles, techniques, and analysesemployed in a discipline. Dendrochronology as ascience indeed has a methodology. In a particularstudy, however, scientists design, use, and reportspecific methods that answer a hypothesis.
firstly, secondly, and related words: Avoid thesewords altogether when enumerating sequentialphrases. Instead, simply say "First" and "Sec-ond."
highly, extremely, strongly, very: Avoid qualifiersas much as possible because these words are oftenunnecessary and indicate opinion. For example,"The coefficients were highly significant (p <0.05)." Instead, say simply "The coefficients werestatistically significant (p < 0.05)."
crossdating, not cross -dating: Crossdating is oneword, not two, and it is not hyphenated (Kaenneland Schweingruber 1995).
tree rings, but tree -ring dating; ring widths, butring -width series: Adjectival noun phrases mayneed to be hyphenated to improve clarity (APA1994). If a group of adjectival nouns precedeswhat it modifies, consider hyphenating the adjec-tives. If the group of words follows it, then itshould not need hyphenating (APA 1994). For ex-ample, "Tree -ring dating was successful," but"Dating of the tree rings was successful." Thecompound noun "treering" should never be used.
dendrochronology: This is the science, not a timeseries. Avoid referring to tree -ring chronologies as"dendrochronologies."

10 GRISSINO -MAYER
ACKNOWLEDGMENTS
Over the years, my writing benefited from sug-gestions made by my mentors. James Wheeler in-troduced me to the art of critically reading andreviewing science articles. David Butler was mymaster's advisor and to him I owe a debt of grat-itude for first guiding my scientific writing. ToTom Swetnam, my Ph.D. advisor, I owe specialthanks, not only for his instruction and intense ad-vice that greatly improved my writing skills, butalso for his patience with a sometimes overly stub-born graduate student who was hard set in hisways. This manuscript was vastly improved bysuggestions from Ken Orvis, Steve Leavitt, Me-lanie Lenart, Brian McCarthy, and an anonymousreviewer.
REFERENCES CITED
Abbott, A.1997 Fraud claims shake German complacency. Nature
387:750.Abbott, A.
1998 German scientists may escape fraud trial. Nature 395:532 -533.
Agnes, M. E., editor1995 Webster's New World Dictionary and Thesaurus.
John Wiley & Sons, Inc., New York.American Psychological Association (APA)
1994 Publication Manual of the American PsychologicalAssociation. American Psychological Association,Washington, DC.
Binder, C.1990 Self- plagiarism and multiple publications- negli-
gence or epidemic disease. Acta Endocrinologica122:7.
Burt, J. E., and G. M. Barber1996 Elementary Statistics for Geographers. Guilford
Press, New York.Chicago Editorial Staff
1993 Chicago Manual of Style. University of ChicagoPress, Chicago.
Council of Biology Editors (CBE)1994 Scientific Style and Format: The CBE Manual for
Authors, Editors, and Publishers. Cambridge Uni-versity Press, New York.
Fritts, H. C.1976 Tree Rings and Climate. Academic Press, New York.
Gibaldi, J.1999 MIA Handbook for Writers of Research Papers. The
Modern Language Association of America, NewYork.
Hart, J. T.1976 Ruminations of a dyspeptic ex- editor. The Profes-
sional Geographer 28:225 -232.Kaennel, M., and F. H. Schweingruber
1995 Multilingual Glossary of Dendrochronology. PaulHaupt Verlag, Birmensdorf.
Lanciani, C. A.1998 Reader -friendly writing in science. Bulletin of the
Ecological Society of America 79:171 -172.Landes, K. K.
1951 A scrutiny of the abstract. Bulletin of the AmericanAssociation of Petroleum Geologists 35:1660.
Lee, W. L., B. M. Bell, and J. E Sutton, eds.1982 Guidelines for Acquisition and Management of Bio-
logical Specimens. Association of Systematics Col-lections, Lawrence, Kansas.
McMillan, V. E.1988 Writing Papers in the Biological Sciences. St. Mar-
tin's Press, New York.Orvis, K. H., and H. D. Grissino -Mayer
2002 Standardizing the reporting of abrasive papers usedto surface tree -ring samples. Tree -Ring Research 58:47 -50.
Samuelson, P.1994 Self -plagiarism or fair use? Communications of the
ACM 37:21 -25Shertzer, M.
1986 The Elements of Grammar. Macmillan PublishingCompany, New York.
Sorenson, S.1995 How to Write Research Papers. Macmillan Publish-
ing Company, New York.Strunk, Jr., W., and E. B. White
1979 The Elements of Style. Macmillan Publishing Com-pany, New York.
Sublett, M. D.1993 The active voice: one key to more effective geo-
graphic writing. The Geographical Bulletin 35:23-32.
Tippo, O.1989 Confessions of a botanical editor. Economic Botany
43:4 -16.Vorfeld, J.
2002 Bulleted lists: capitalization and punctuation. Officeof Support Services, Peoria, Illinois. http: / /www.
ossweb.com /article -bullets.html.Weil, B. H.
1970 Standards for writing abstracts. Journal of the Amer-ican Society for Information Science 21:351 -358.
Wilson, K. G.1993 The Columbia Guide to Standard American English.
Columbia University Press, New York.
Received 26 December 2002; accepted 1 May 2003.

TREE -RING RESEARCH, Vol. 59(1), 2003, pp. 11 -19
A COOL SEASON PRECIPITATION RECONSTRUCTION FORSALTILLO, MEXICO
11th North American Dendroecological Fieldweek, Climatic ReconstructionResearch Group, Saltillo, Mexico, August 2001
KELLY POHL
The Nature Conservancy2424 Spruce St.
Boulder, CO 80302
MATTHEW D. THERRELL
Tree -Ring LaboratoryOzark Hall 113
University of ArkansasFayetteville, AR 72701
JORGE SANTIAGO BLAY
Department of Paleobiology, MRC -121National Museum of Natural History
Smithsonian InstitutionP.O. Box 37012
Washington, D.C. 2001 3 -701 2
NICOLE AYOTTE
1005 Cahill Drive WestOttawa, OntarioK1V9H9 Canada
JOSE JIL CABRERA HERNANDEZ
Departamento ForestalUniversidad Autonoma Agraria Antonio Narro
Buenavista, Saltillo, Coahuila, Mexico
SARA DIAZ CASTRO
Centro de Investigaciones Biologicasdel Noroeste, S.C.
Mar Bermejo No. 195Col. Playa Palo de Santa Rita
AP 128, La Paz, B.C.S., Mexico, 23090
ELADIO CORNEJO OVIEDO
Departamento ForestalUniversidad Autonoma Agraria Antonio Narro
Buenavista, Saltillo, Coahuila, Mexico
JOSE A. ELVIR
Department of Forest Ecosystem Science101 Nutting Hall
University of MaineOrono, ME 04469
MARTHA GONZALES ELIZONDO
CIIDIR -TPN Unidad durangoApartado Postal 738
34000 Durango, Durango, Mexico
DAWN OPLAND
Department of Forest Ecosystem Science101 Nutting Hall
University of MaineOrono, ME 04473
JUNGJAE PARK
Geography DepartmentMcCone Hall 507
University of CaliforniaBerkeley, CA 94720 -4740
GREG PEDERSON
Land Resources and Environmental SciencesMontana State University
P.O. Box 173490Bozeman, MT 59717
SERGIO BERNAL SALAZAR
Especialidad de BotanicaColegio de Postgraduados
Km. 36.5 Can. Mexico -TexcocoMontecillo, Estado de Mexico, Mexico 56230
LORENZO VAZGUEZ SELEM
Instituto de GeografiaUniversidad Nacional Autonoma de Mexico
Ciudad Universitaria04510 Mexico, D.E Mexico
JOSE VILLANUEVA DIAZ
Instituto Nacional de InvestigacionesForestales y Agropecurias
KM 6.5, Margen Derecha Canal SacramentoGomes Palacio, Durango, Mexico 35140
and
DAVID W. STAHLE(corresponding author)
Tree -Ring LaboratoryOzark Hall 113
University of ArkansasFayetteville, AR 72701
Copyright © 2003 by the Tree -Ring Society 11
12 POHL et al.
ABSTRACT
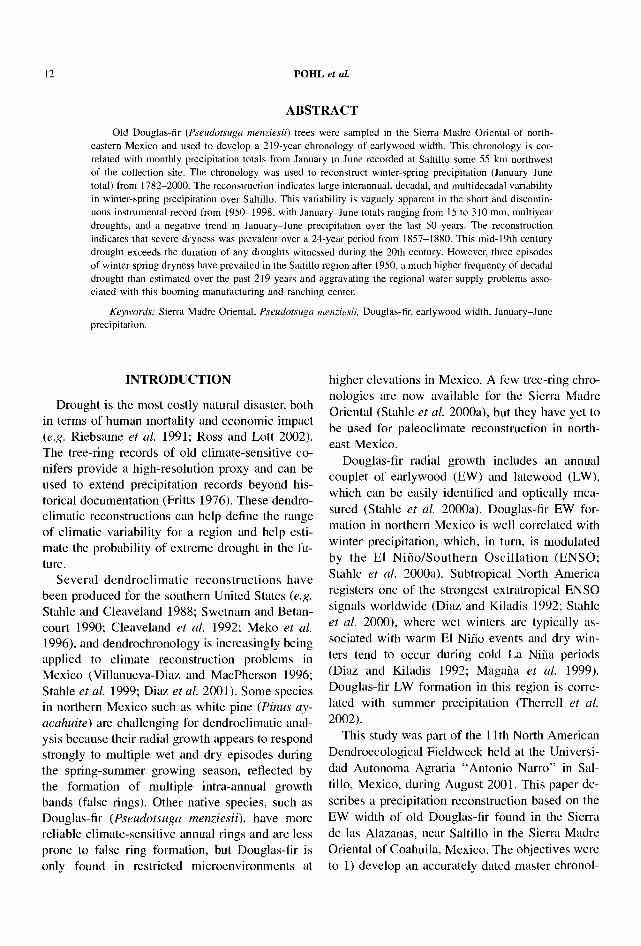
Old Douglas -fir (Pseudotsuga menziesii) trees were sampled in the Sierra Madre Oriental of north-eastern Mexico and used to develop a 219 -year chronology of earlywood width. This chronology is cor-related with monthly precipitation totals from January to June recorded at Saltillo some 55 km northwestof the collection site. The chronology was used to reconstruct winter- spring precipitation (January -Junetotal) from 1782 -2000. The reconstruction indicates large interannual, decadal, and multidecadal variabilityin winter- spring precipitation over Saltillo. This variability is vaguely apparent in the short and discontin-uous instrumental record from 1950 -1998, with January -June totals ranging from 15 to 310 mm, multiyeardroughts, and a negative trend in January -June precipitation over the last 50 years. The reconstructionindicates that severe dryness was prevalent over a 24 -year period from 1857 -1880. This mid -19th centurydrought exceeds the duration of any droughts witnessed during the 20th century. However, three episodesof winter -spring dryness have prevailed in the Saltillo region after 1950, a much higher frequency of decadaldrought than estimated over the past 219 years and aggravating the regional water supply problems asso-ciated with this booming manufacturing and ranching center.
Keywords: Sierra Madre Oriental, Pseudotsuga menziesii, Douglas -fir, earlywood width, January -Juneprecipitation.
INTRODUCTION
Drought is the most costly natural disaster, bothin terms of human mortality and economic impact(e.g. Riebsame et al. 1991; Ross and Lott 2002).The tree -ring records of old climate- sensitive co-nifers provide a high -resolution proxy and can beused to extend precipitation records beyond his-torical documentation (Fritts 1976). These dendro-climatic reconstructions can help define the rangeof climatic variability for a region and help esti-mate the probability of extreme drought in the fu-ture.
Several dendroclimatic reconstructions havebeen produced for the southern United States (e.g.Stahle and Cleaveland 1988; Swetnam and Betan-court 1990; Cleaveland et al. 1992; Meko et al.1996), and dendrochronology is increasingly beingapplied to climate reconstruction problems inMexico (Villanueva -Diaz and MacPherson 1996;Stahle et al. 1999; Diaz et al. 2001). Some speciesin northern Mexico such as white pine (Pinus ay-acahuite) are challenging for dendroclimatic anal-ysis because their radial growth appears to respondstrongly to multiple wet and dry episodes duringthe spring- summer growing season, reflected bythe formation of multiple intra- annual growthbands (false rings). Other native species, such asDouglas -fir (Pseudotsuga menziesii), have morereliable climate- sensitive annual rings and are lessprone to false ring formation, but Douglas -fir isonly found in restricted microenvironments at
higher elevations in Mexico. A few tree -ring chro-nologies are now available for the Sierra MadreOriental (Stahle et al. 2000a), but they have yet tobe used for paleoclimate reconstruction in north-east Mexico.
Douglas -fir radial growth includes an annualcouplet of earlywood (EW) and latewood (LW),which can be easily identified and optically mea-sured (Stahle et al. 2000a). Douglas -fir EW for-mation in northern Mexico is well correlated withwinter precipitation, which, in turn, is modulatedby the El Niño /Southern Oscillation (ENSO;Stahle et al. 2000a). Subtropical North Americaregisters one of the strongest extratropical ENSOsignals worldwide (Diaz and Kiladis 1992; Stahleet al. 2000), where wet winters are typically as-sociated with warm El Niño events and dry win-ters tend to occur during cold La Niña periods(Diaz and Kiladis 1992; Magaña et al. 1999).Douglas -fir LW formation in this region is corre-lated with summer precipitation (Therrell et al.2002).
This study was part of the 11th North AmericanDendroecological Fieldweek held at the Universi-dad Autonoma Agraria "Antonio Narro" in Sal -tillo, Mexico, during August 2001. This paper de-scribes a precipitation reconstruction based on theEW width of old Douglas -fir found in the Sierrade las Alazanas, near Saltillo in the Sierra MadreOriental of Coahuila, Mexico. The objectives wereto 1) develop an accurately dated master chronol-
Saltillo Precipitation
ogy of Douglas -fir EW width in the Sierra de lasAlazanas, 2) define the monthly precipitation re-sponse of the derived EW width chronology, 3)develop a seasonal precipitation reconstruction forSaltillo, the largest nearby city with a reasonablylong monthly precipitation record, 4) document thehistory of extended drought and wetness episodesfor this portion of northeastern Mexico, and 5) de-termine the strength of the ENSO signal in thereconstructed precipitation series.
STUDY SITE
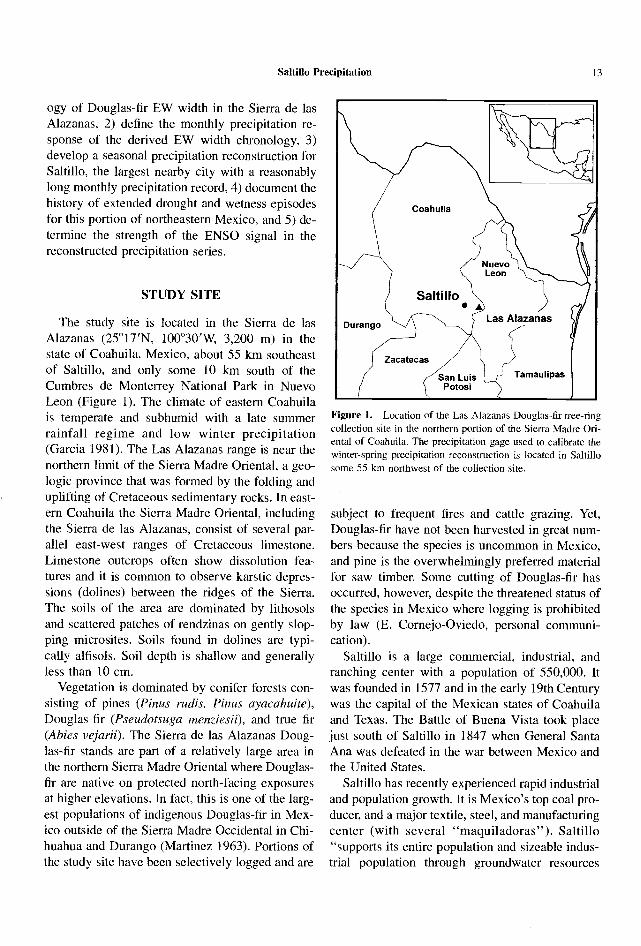
The study site is located in the Sierra de lasAlazanas (25 °17'N, 100 °30'W, 3,200 m) in thestate of Coahuila, Mexico, about 55 km southeastof Saltillo, and only some 10 km south of theCumbres de Monterrey National Park in NuevoLeon (Figure 1). The climate of eastern Coahuilais temperate and subhumid with a late summerrainfall regime and low winter precipitation(Garcia 1981). The Las Alazanas range is near thenorthern limit of the Sierra Madre Oriental, a geo-logic province that was formed by the folding anduplifting of Cretaceous sedimentary rocks. In east-ern Coahuila the Sierra Madre Oriental, includingthe Sierra de las Alazanas, consist of several par-allel east -west ranges of Cretaceous limestone.Limestone outcrops often show dissolution fea-tures and it is common to observe karstic depres-sions (dolines) between the ridges of the Sierra.The soils of the area are dominated by lithosolsand scattered patches of rendzinas on gently slop-ping microsites. Soils found in dolines are typi-cally alfisols. Soil depth is shallow and generallyless than 10 cm.
Vegetation is dominated by conifer forests con-sisting of pines (Pinus radis, Pinus ayacahuite),Douglas -fir (Pseudotsuga menziesii), and true fir(Abies vejarii). The Sierra de las Alazanas Doug-las -fir stands are part of a relatively large area inthe northern Sierra Madre Oriental where Douglas -fir are native on protected north -facing exposuresat higher elevations. In fact, this is one of the larg-est populations of indigenous Douglas -fir in Mex-ico outside of the Sierra Madre Occidental in Chi-huahua and Durango (Martinez 1963). Portions ofthe study site have been selectively logged and are
13
NuevoLeon
Durango
Zacatecas
San LuisPotosi
Las Alazanas
Tamaulipas
Figure 1. Location of the Las Alazanas Douglas -fir tree -ringcollection site in the northern portion of the Sierra Madre Ori-ental of Coahuila. The precipitation gage used to calibrate thewinter- spring precipitation reconstruction is located in Saltillosome 55 km northwest of the collection site.
subject to frequent fires and cattle grazing. Yet,Douglas -fir have not been harvested in great num-bers because the species is uncommon in Mexico,and pine is the overwhelmingly preferred materialfor saw timber. Some cutting of Douglas -fir hasoccurred, however, despite the threatened status ofthe species in Mexico where logging is prohibitedby law (E. Cornejo- Oviedo, personal communi-cation).
Saltillo is a large commercial, industrial, andranching center with a population of 550,000. Itwas founded in 1577 and in the early 19th Centurywas the capital of the Mexican states of Coahuilaand Texas. The Battle of Buena Vista took placejust south of Saltillo in 1847 when General SantaAna was defeated in the war between Mexico andthe United States.
Saltillo has recently experienced rapid industrialand population growth. It is Mexico's top coal pro-ducer, and a major textile, steel, and manufacturingcenter (with several "maquiladoras "). Saltillo"supports its entire population and sizeable indus-trial population through groundwater resources
14 POHL et al.
alone" (Allanach and Johnson -Richards 1995).The population is projected to surpass 700,000 by2010, and the city plans to double its water supplyfrom 1.5 to 3.0 m3 /second to meet the expectedgrowth and industrial expansion (Allanach andJohnson -Richards 1995). The city is trying to in-crease water supply by developing new ground-water supplies from the region, modernizing thewater distribution system, and developing surfacewater reservoirs. Information on the long term var-iability of precipitation and the persistence of pastdrought could be useful for water resource plan-ning in the region.
METHODS
To facilitate crossdating, Douglas -fir trees weresampled both at a dry cliff site, where radialgrowth is slow and likely moisture -limited, and ata more level and mesic site where radial growthwas more rapid. Two increment cores were takenat breast height from each of 25 selected trees. Weselected older Douglas -firs by choosing trees withflattened crowns, large- diameter branches, spiralgrain, exposed root collar, and other old- growthcharacteristics. Some subfossil wood was presentat the site, and further field sampling of this relicwood might help extend the chronology derivedfrom living trees.
The Douglas -fir increment cores were mountedon prefabricated wooden mounts and polished us-ing progressively finer grits of sandpaper (Stokesand Smiley 1976). Cores were visually crossdatedusing the skeleton plot method (Stokes and Smiley1976). Earlywood and latewood ring widths weremeasured. Where boundaries between earlywoodand latewood were diffuse, the difference betweenpure earlywood and pure latewood was identified,and this transition zone was split in half for mea-surement (after Stahle et al. 2000; Therrell et al.2002). Crossdating and measurement accuracywere verified with the computer program COFE-CHA (Holmes 1983) using 50 -year segmentslagged 25 years.
Each tree -ring series was detrended and indexedusing the program ARSTAN (Cook and Holmes1985). Detrending is designed to remove long-term biological growth trends caused by changing
size and age, and indexing to remove differencesin mean growth rate among trees. All series werefirst detrended with a curve of best fit (either anegative exponential curve or straight lines of anyslope) and were secondly de -i with asmoothing spline (Cook and Pete ). The au-toregressive modelling option in Ht(STAN wasused to remove the low -order autocorrelationfound in the individual ring width indices. The ro-bust mean value function was used to compute thewhite noise residual chronology, which corre-sponds to the time series structure of the instru-mental precipitation data for the January -June sea-son (see below). Thirty cores from 20 trees wereincluded in the final EW residual chronology forLas Alazanas.
Instrumental precipitation data were obtainedfrom the meteorological station at Saltillo, Coa-huila (25 °25'N, 101 °0'W; 1,589 m) approximately55 km northwest of the study site. These monthlydata were discontinuous and extended from 1950-1959, 1970 -1981, and 1983 -1998 (38 total years).A few records from other nearby climate stationswere examined, but they were very short, discon-tinuous, and too weakly related with the derivedchronology to contribute to this analysis.
To determine the seasonal precipitation responseof the EW chronology, the monthly precipitationdata for Saltillo were first correlated with the stan-dardized EW chronology. Consecutive monthswith the highest correlation were seasonalized andthen used to develop the subsequent transfer func-tion. The EW chronology was entered into a bi-variate regression analysis with the seasonal pre-cipitation data. The resulting model was used topredict precipitation from EW tree growth, bothduring and preceding the period of instrumentalprecipitation measurement. We attempted to verifythe model by splitting the instrumental precipita-tion record in half, performing experimental cali-brations on the shorter subperiods, and then com-paring the predicted to observed precipitation inthe alternate subperiod not used in the calibration.To test the relationship between ENSO and recon-structed winter precipitation, we correlated the ob-served and tree -ring reconstructed precipitationdata for Saltillo with the Tropical Rainfall Index(TRI), a standardized measure of precipitation
Saltillo Precipitation 15
Las Alazanas EarlywoodCorrelated with Monthly Precipitation
0.5
0.4-
0.3-
0.2
0 .1-
0,ON DJ FM A M J J A S
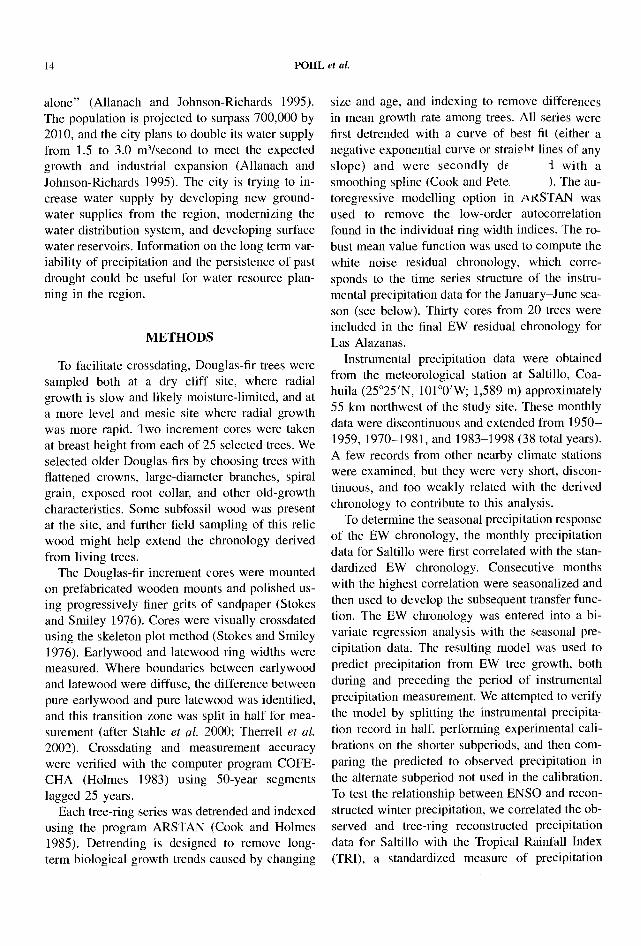
MonthFigure 2. A plot of the correlation coefficients (r) computedbetween the Las Alazanas EW chronology and monthly pre-cipitation totals for Saltillo from 1950 -1998 (minus 11 missingvalues).
anomalies over the central equatorial Pacific avail-able from 1900 to 2000.
RESULTS
A 219 -year EW -width chronology was devel-oped, dating from 1782 to 2000. The earlywoodchronology crossdated extremely well and had ahigh inter -series correlation (r = 0.70 among allradii). The EW chronology is most highly corre-lated with March, April, and May precipitation atSaltillo (Figure 2), but it is also weakly correlatedwith the Saltillo data in January, February, andAugust (although August is likely by chance).Correlation experiments indicated that Januarythrough June (winter -spring) was the optimal sea -sonalization period to maximize the precipitationcorrelation with the EW chronology.
We regressed the EW chronology against ob-served winter - spring precipitation to develop a cal-ibration model for reconstruction (Figure 3). Thisregression model explains 49% of the variance inSaltillo January -June precipitation for the period1950 -1998 (Table 1, after downward adjustmentfor the loss of two degrees of freedom):
350
300-
o-, 250-CC_ :.
200-
(3) 43,1Lp 150-
o?= ß loo-m
_t6 50-7
19811959
o 1
0 4 0.6
r= 0.71
0.8 1 1.2 1.4 1.6 18
Las Alazanas Earlywood Width
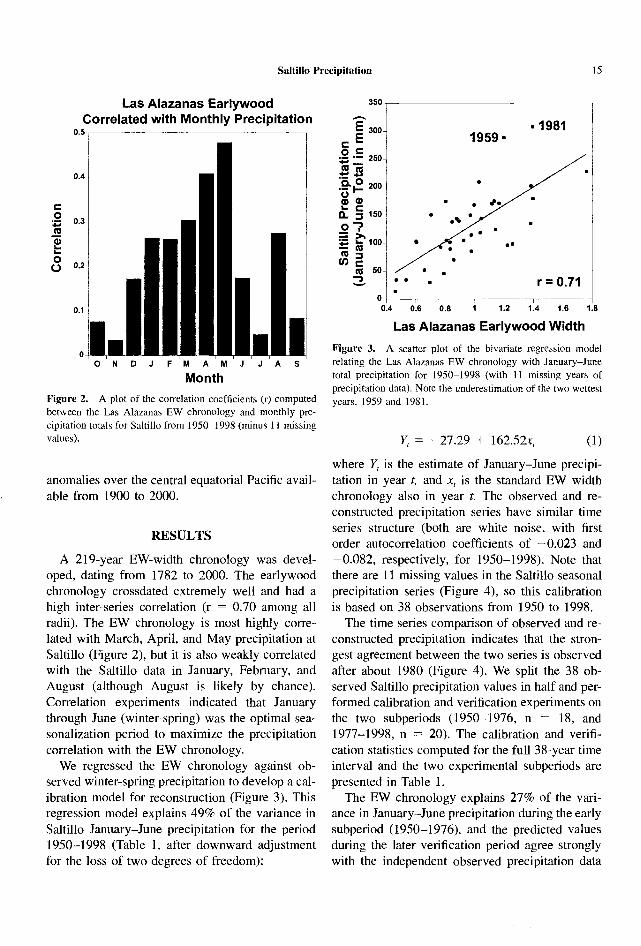
Figure 3. A scatter plot of the bivariate regression modelrelating the Las Alazanas EW chronology with January -Junetotal precipitation for 1950 -1998 (with 11 missing years ofprecipitation data). Note the underestimation of the two wettestyears, 1959 and 1981.
Y = -27.29 + 162.52x, (1)
where Y, is the estimate of January -June precipi-tation in year t, and x, is the standard EW widthchronology also in year t. The observed and re-constructed precipitation series have similar timeseries structure (both are white noise, with firstorder autocorrelation coefficients of -0.023 and- 0.082, respectively, for 1950- 1998). Note thatthere are 11 missing values in the Saltillo seasonalprecipitation series (Figure 4), so this calibrationis based on 38 observations from 1950 to 1998.
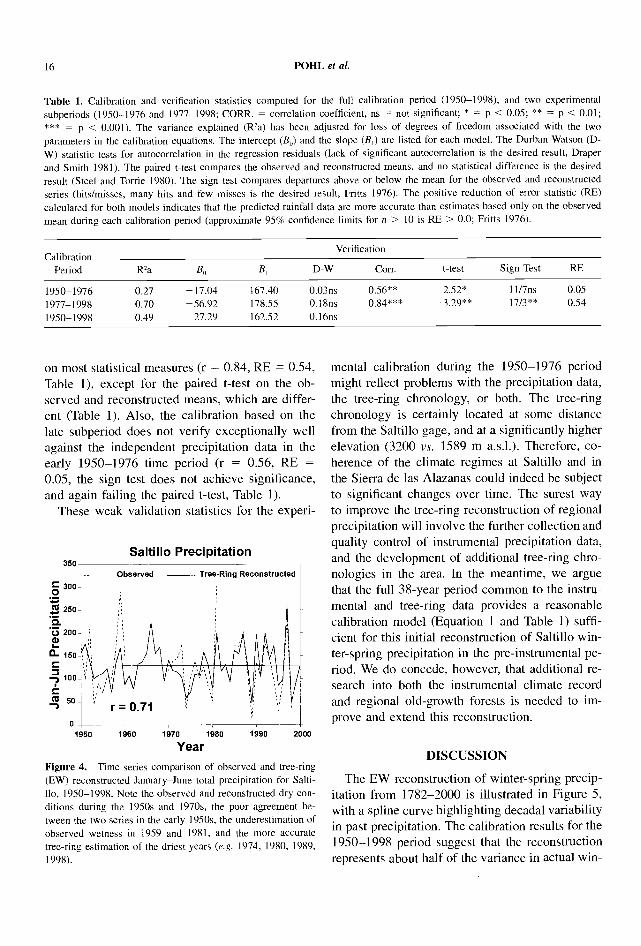
The time series comparison of observed and re-constructed precipitation indicates that the stron-gest agreement between the two series is observedafter about 1980 (Figure 4). We split the 38 ob-served Saltillo precipitation values in half and per-formed calibration and verification experiments onthe two subperiods (1950 -1976, n = 18, and1977 -1998, n = 20). The calibration and verifi-cation statistics computed for the full 38 -year timeinterval and the two experimental subperiods arepresented in Table 1.
The EW chronology explains 27% of the vari-ance in January -June precipitation during the earlysubperiod (1950- 1976), and the predicted valuesduring the later verification period agree stronglywith the independent observed precipitation data
16 POHL et al.
Table 1. Calibration and verification statistics computed for the full calibration period (1950- 1998), and two experimentalsubperiods (1950 -1976 and 1977 -1998; CORR. = correlation coefficient, ns = not significant; * = p < 0.05; ** = p < 0.01;* ** = p < 0.001). The variance explained (R2a) has been adjusted for loss of degrees of freedom associated with the twoparameters in the calibration equations. The intercept (B) and the slope (B,) are listed for each model. The Durban -Watson (D-W) statistic tests for autocorrelation in the regression residuals (lack of significant autocorrelation is the desired result, Draperand Smith 1981). The paired t -test compares the observed and reconstructed means, and no statistical difference is the desiredresult (Steel and Torrie 1980). The sign test compares departures above or below the mean for the observed and reconstructedseries (hits /misses, many hits and few misses is the desired result, Fritts 1976). The positive reduction of error statistic (RE)calculated for both models indicates that the predicted rainfall data are more accurate than estimates based only on the observedmean during each calibration period (approximate 95% confidence limits for n > 10 is RE > 0.0; Fritts 1976).
CalibrationPeriod
Verification
Rza B B, D -W Corr. t -test Sign Test RE
1950 -1976 0.27 -17.04 167.40
1977 -1998 0.70 -56.92 178.55
1950 -1998 0.49 -27.29 162.52
0.03ns0.18ns0.16ns
0.56 **
0.84 * **
2.52* 11/7ns 0.05- 3.29 ** 17/3 ** 0.54
on most statistical measures (r = 0.84, RE = 0.54,Table 1), except for the paired t -test on the ob-served and reconstructed means, which are differ-ent (Table 1). Also, the calibration based on thelate subperiod does not verify exceptionally wellagainst the independent precipitation data in theearly 1950 -1976 time period (r = 0.56, RE =0.05, the sign test does not achieve significance,and again failing the paired t -test, Table 1).
These weak validation statistics for the experi-
350Saltillo Precipitation
C300-
al 250-
'V 200CD
a 150
100-
as 50
o
Observed Tree -Ring Reconstructed
1950 1960 1970 1980 1990 2000
Year
Figure 4. Time series comparison of observed and tree -ring(EW) reconstructed January -June total precipitation for Salti-llo, 1950 -1998. Note the observed and reconstructed dry con-ditions during the 1950s and 1970s, the poor agreement be-tween the two series in the early 1950s, the underestimation ofobserved wetness in 1959 and 1981, and the more accuratetree -ring estimation of the driest years (e.g. 1974, 1980, 1989,1998).
mental calibration during the 1950 -1976 periodmight reflect problems with the precipitation data,the tree -ring chronology, or both. The tree -ringchronology is certainly located at some distancefrom the Saltillo gage, and at a significantly higherelevation (3200 vs. 1589 m a.s.l.). Therefore, co-herence of the climate regimes at Saltillo and inthe Sierra de las Alazanas could indeed be subjectto significant changes over time. The surest wayto improve the tree -ring reconstruction of regionalprecipitation will involve the further collection andquality control of instrumental precipitation data,and the development of additional tree -ring chro-nologies in the area. In the meantime, we arguethat the full 38 -year period common to the instru-mental and tree -ring data provides a reasonablecalibration model (Equation 1 and Table l) suffi-cient for this initial reconstruction of Saltillo win-ter -spring precipitation in the pre -instrumental pe-riod. We do concede, however, that additional re-search into both the instrumental climate recordand regional old- growth forests is needed to im-prove and extend this reconstruction.
DISCUSSION
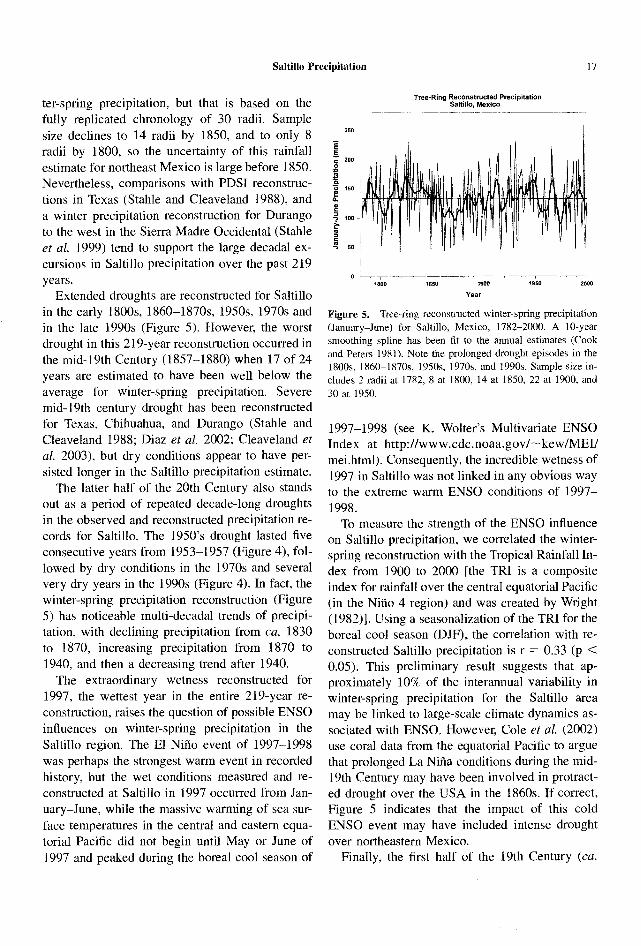
The EW reconstruction of winter -spring precip-itation from 1782 -2000 is illustrated in Figure 5,with a spline curve highlighting decadal variabilityin past precipitation. The calibration results for the1950 -1998 period suggest that the reconstructionrepresents about half of the variance in actual win-
Saltillo Precipitation
ter -spring precipitation, but that is based on thefully replicated chronology of 30 radii. Samplesize declines to 14 radii by 1850, and to only 8radii by 1800, so the uncertainty of this rainfallestimate for northeast Mexico is large before 1850.Nevertheless, comparisons with PDSI reconstruc-tions in Texas (Stahle and Cleaveland 1988), anda winter precipitation reconstruction for Durangoto the west in the Sierra Madre Occidental ( Stahleet al. 1999) tend to support the large decadal ex-cursions in Saltillo precipitation over the past 219years.
Extended droughts are reconstructed for Saltilloin the early 1800s, 1860- 1870s, 1950s, 1970s andin the late 1990s (Figure 5). However, the worstdrought in this 219 -year reconstruction occurred inthe mid -19th Century (1857 -1880) when 17 of 24years are estimated to have been well below theaverage for winter - spring precipitation. Severemid -19th century drought has been reconstructedfor Texas, Chihuahua, and Durango ( Stahle andCleaveland 1988; Diaz et al. 2002; Cleaveland etal. 2003), but dry conditions appear to have per-sisted longer in the Saltillo precipitation estimate.
The latter half of the 20th Century also standsout as a period of repeated decade -long droughtsin the observed and reconstructed precipitation re-cords for Saltillo. The 1950's drought lasted fiveconsecutive years from 1953 -1957 (Figure 4), fol-lowed by dry conditions in the 1970s and severalvery dry years in the 1990s (Figure 4). In fact, thewinter - spring precipitation reconstruction (Figure5) has noticeable multi -decadal trends of precipi-tation, with declining precipitation from ca. 1830to 1870, increasing precipitation from 1870 to1940, and then a decreasing trend after 1940.
The extraordinary wetness reconstructed for1997, the wettest year in the entire 219 -year re-construction, raises the question of possible ENSOinfluences on winter -spring precipitation in theSaltillo region. The El Niño event of 1997 -1998was perhaps the strongest warm event in recordedhistory, but the wet conditions measured and re-constructed at Saltillo in 1997 occurred from Jan-uary -June, while the massive warming of sea sur-face temperatures in the central and eastern equa-torial Pacific did not begin until May or June of1997 and peaked during the boreal cool season of
250Ï
200
150
100 -
Tree -Ring Reconstructed PrecipitationSaltillo, Mexico
0 -1800 1850 1900 1950
Year
17
2000
Figure 5. Tree -ring reconstructed winter -spring precipitation(January -June) for Saltillo, Mexico, 1782 -2000. A 10 -yearsmoothing spline has been fit to the annual estimates (Cookand Peters 1981). Note the prolonged drought episodes in the1800s, 1860- 1870s, 1950s, 1970s, and 1990s. Sample size in-cludes 2 radii at 1782, 8 at 1800, 14 at 1850, 22 at 1900, and30 at 1950.
1997 -1998 (see K. Wolter's Multivariate ENSOIndex at http : / /www.cdc.noaa.gov /---kew /MEI/mei.html). Consequently, the incredible wetness of1997 in Saltillo was not linked in any obvious wayto the extreme warm ENSO conditions of 1997-1998.
To measure the strength of the ENSO influenceon Saltillo precipitation, we correlated the winter -spring reconstruction with the Tropical Rainfall In-dex from 1900 to 2000 [the TRI is a compositeindex for rainfall over the central equatorial Pacific(in the Niño 4 region) and was created by Wright(1982)]. Using a seasonalization of the TRI for theboreal cool season (DJF), the correlation with re-constructed Saltillo precipitation is r = 0.33 (p <0.05). This preliminary result suggests that ap-proximately 10% of the interannual variability inwinter -spring precipitation for the Saltillo areamay be linked to large -scale climate dynamics as-sociated with ENSO. However, Cole et al. (2002)use coral data from the equatorial Pacific to arguethat prolonged La Niña conditions during the mid -19th Century may have been involved in protract-ed drought over the USA in the 1860s. If correct,Figure 5 indicates that the impact of this coldENSO event may have included intense droughtover northeastern Mexico.
Finally, the first half of the 19th Century (ca.
18 POHI, et al.
1810 -1840) is reconstructed as a period of recur-rent winter -spring wetness (Figure 5). The samplesize in the EW chronology is low during this timeperiod, but this wet episode is probably real. Fyeet al. (2003) reconstruct widespread wetness overthe western USA during the early 19th Century,one of four or five decade -long pluvials estimatedfor the West since A.D. 1500.
CONCLUSIONS
The EW width series developed by this projectin the Sierra de las Alazanas of Coahuila crossdateextremely well. The high correlation between treesand radii is indicative of a strong external envi-ronmental influence on radial growth, which weshow to be predominantly precipitation during andpreceding the early growing season. We were ableto calibrate the derived EW width chronology withJanuary -June seasonalized precipitation measuredat Saltillo since 1950. However, attempts to inde-pendently verify this reconstruction have beenhampered by the short and discontinuous nature ofthe available monthly precipitation data from Sal -tillo and nearby stations. The experimental verifi-cation performed on two short subperiods after1950 passes on some statistics, but fails on others.We do see considerable agreement between the de-cadal moisture anomalies estimated for Saltillo andother tree -ring reconstructions of precipitation anddrought indices over the western USA and north-western Mexico. Additional tree -ring data from theSierra Madre Oriental and further development ofthe instrumental precipitation data will help im-prove precipitation reconstruction for northeasternMexico. Old- growth Douglas -fir can be found lo-cally at higher elevations on the northern rangesof the Sierra Madre Oriental and promise to pro-vide an excellent network of climate- sensitivechronologies for the region.
ACKNOWLEDGMENTS
This collaborative field research project wasconducted under the auspices of the North Amer-ican Dendroecological Fieldweek, and would havebeen impossible without the many efforts of PeterBrown and the faculty and staff of the Departa-
mento Forestal, Universidad Autonoma AgrariaAntonio Narro, Saltillo. Laura Elizabeth AlanisMercado assisted our research in Saltillo and Mal-colm Cleaveland assisted final preparation of themanuscript. This research was sponsored in partby the U.S. National Science Foundation (grantnumber ATM -9986074), and the Inter AmericanInstitute for Global Change, Treelines Project. Wethank Brian Luckman and co- investigators in-volved in the Treelines Project for sponsoring theparticipation of several colleagues in the field -week. The earlywood, latewood, and total ringwidth data and chronologies developed during ourproject have been contributed to the InternationalTree -Ring Data Bank, National Geophysical DataCenter, Boulder, CO (http: / /www.ngdc.noaa.gov/paleo /treering.html).
REFERENCES CITED
Allanach, W. C., and B. Johnson -Richards1995 Water infrastructure study Saltillo, Mexico. In
Groundwater Management, edited by R.J. Charbe-neau, pp. 18 -23. Proceedings, First InternationalConference on Water Resources Engineering, SanAntonio, Texas, Aug 14 -16, 1995, American Societyof Civil Engineers, New York, New York.
Cleaveland, M. K., E. R. Cook, and D.W. Stahle1992 Secular variability of the Southern Oscillation de-
tected in tree -ring data from Mexico and the southernUnited States. In E! Nino: Historical and Paleocli-matic Aspects of the Southern Oscillation, edited byH. F. Diaz, and V. Markgraf, pp. 272 -291. CambridgeUniversity Press, Cambridge.
Cleaveland, M. K., D. W. Stahle, M. D. The ell, J. Villanuea-va -Diaz, and B. T. Burns
2003 Tree -ring reconstructed winter precipitation in Du-rango, Mexico. Climate Change. in press.
Cole, J., J. T. Overpeck, and E. R. Cook2002 Multiyear La Niña events and persistent drought in
the contiguous United States. Geophysical ResearchLetters 29(13) 1 647doi/029/2002GL013561.
Cook, E. R., and R. L. Holmes1985 Users Manual for Program ARSTAN. Lamont -Do-
herty Geological Observatory, Columbia University.Cook, E. R., and K. Peters
1981 The smoothing spline: a new approach to standard-izing forest interior tree -ring width series for dendro-climatic studies. Tree -Ring Bulletin 41:45 -53.
Cuellar- Valdez, P. M.1979 Historia del Estado de Coahuila, Volume 1. Saltillo,
Coahuila. Mexico.

Saltillo Precipitation 19
Diaz, H. F., and G. N. Kiladis1992 Atmospheric teleconnections associated with the ex-
treme phases of the Southern Oscillation. In El Nino:Historical and Paleoclimatic Aspects of the SouthernOscillation. edited by H. F. Diaz, and V. Markgraf,pp. 7 -28. Cambridge University Press, Cambridge.
Diaz, S. C., R. Touchan, and T. W. Swetnam2001 A tree -ring reconstruction of past precipitation for
Baja California Sur, Mexico. International Journal ofClimatology 21:1007 -1019.
Diaz, S. C., M. D. Therrell, D. W. Stahle, and M. K. Cleaveland2002 Chihuahua (Mexico) winter- spring precipitation re-
constructed from tree rings, 1647 -1992. Climate Re-search 22:237 -244.
Draper, N. R., and H. Smith1981 Applied Regression Analysis. Wiley, New York. 364
pp.Fritts, H. C.
1976 Tree Rings and Climate. Academic Press, New York.Eye, E, D. W. Stahle, and E. R. Cook
2003 Paleoclimatic analogs to 20th Century moisture re-gimes in the United States. Bulletin of the AmericanMeteorological Society. in press.
Garcia, E.1981 Modificaciones al Sistema de Clasificacion Climatica
de Koppen (Para Adaptarlo a las Condiciones Cli-maticas de la Republica Mexicana). Offset Larios.Tercera Edicion. Mexico, D.E
Holmes, R. L.1983 Computer- assisted quality control in tree -ring dating
and measurement. Tree -Ring Bulletin 43:69 -78.Magaña, V., J. L. Perez, J. L. Vazquez, E. Carrizosa, y J. Perez.
1999 El Niño y el clima. In Los Impactos del Niño enMexico, edited by V. Magaña, pp. 23 -66. Secretariade Educación Publica, Consejo Nacional de Cienciay Tecnología. México.
Marinez, M.1963 Las Pinaceas Mexicanas. Universidad Nacional Au-
tonoma de Mexico, Ciudad Universitaria, Mexico 20,D.E 400 pp.
Meko, D., C. W. Stockton, and W. R. Boggess1996 The tree -ring record of severe sustained drought. Wa-
ter Resources Bulletin 31:789 -801.Lopez, A.
1996 La Ciudad y Su Tiempo Historic °_ Saltillo SiglosXVIII -XIX. Instituto Tecnologico de Saltillo. Saltillo,Coahuila. Mexico.
Riebsame, W E., S. A. Chagnon, and T. R. Karl1991 Drought and Natural Resources Management in the
United States: Impacts and Implications of the 1987-1989 Drought. Westview Press, Boulder, Colorado.
Ross, T., and N. Lott2002 Billion dollar U.S. weather Disasters 1980 -2001. Na-
tional climatic Data Center, Asheville, NC. http://www.ncdc.noaa.gov/ol/reports/billionz.html
Stahle, D. W., and M. K. Cleaveland1988 Texas drought history reconstructed and analyzed
from 1698 to 1980. Journal of Climate 1:59-74.Stable, D. W., M. K. Cleaveland, M. D. Therrell, and J. Vil-lanueva -Diaz
1999 Tree -ring reconstruction of winter and summer pre-cipitation in Durango, Mexico, for the past 600 years.10th Symposium on Global Change Studies. Dallas,Texas.
Stahle, D. W, J. Villanueva, M. K. Cleaveland, M. D. Therrell,G. J. Paull, B. T. Burns, W. Salinas, H. Suzan, and P. Z. Fule
2000a Recent tree -ring research in Mexico. In Dendrocron-ologia en America Latina, edited by E Roig, pp. 285-306. EDIUNC, Mendoza, Argentina..
Stahle, D. W., E. R. Cook, M. K. Cleaveland, M. D. Therrell,D. M. Meko, H. D. Grissino- Mayer, E. Watson, and B. Luck -man
2000b Tree -ring data document 16th Century megadroughtover North America. EOS, Transactions, AmericanGeophysical Union 81:121 -125.
Steel. R. G. D., and J. H. Torrie1980 Principles and Procedures of Statistics, 2nd ed, Mc-
Graw -Hill, New York.Stokes, M. A., and T. L. Smiley
1968 Introduction to Tree -Ring Dating. University of Chi-cago Press, Chicago.
Swetnam, T. W, and J. L. Betancourt1990 Fire- Southern Oscillation relations in the southwest-
ern United States. Science 249:1017 -1020.Therrell, M. D., D. W. Stahle, M. K. Cleaveland, and J. Vil-lanueva -Diaz
2002 Warm season tree growth and precipitation overMexico. Journal of Geophysical Research 107(D14)4205, doi:10.102912OO1JD000851(2002).
Trenberth, K. E., and T. J. Hoar1997 El Niño and climate change. Geophysical Research
Letters 24: 3057 -3060.Villanueva -Diaz, J., and G. R. MacPherson
1996 Reconstruction of precipitation and PDSI from tree -ring chronologies developed in mountains of NewMexico, USA and Sonora, Mexico. Arizona -NevadaAcademy of Science, Hydrology Section 26:45 -54.
Wright, P. B.1982 Homogenized long -period Southern Oscillation in-
dices. International Journal of Climatology 9:33 -54.
Received 1 August 2002; accepted 6 May 2003.

TREE -RING RESEARCH, Vol. 59(1), 2003, pp. 21 -27
ANDREW ELLICOTT DOUGLASS AND THE GIANT SEQUOIAS IN THEFOUNDING OF DENDROCHRONOLOGY
DONALD J. McGRAW
Associate ProvostUniversity of San Diego
San Diego, CA 92110 -2492
ABSTRACT
The Giant Sequoia played several crucial roles in the founding of the modern science of tree -ringdating. These included at least two central theoretical constructs and at least two minor ones; however,historical studies of dendrochronology are actively continuing and this list is expected to expand. Secondonly to the importance of the ponderosa pine (Pinus ponderosa) in the earliest days of the infant science,the Giant Sequoia (Sequoiadendron giganteum) was at the very center of the establishment of the disciplineof dendrochronology. How the sequoia came to be used by A.E. Douglass, and what vital information andhow it provided such information is the topic here.
Keywords: A.E. Douglass, dendochronology, Giant Sequoia, historical studies.
INTRODUCTION
Dendrochronology, or tree -ring dating, is a sci-ence-or in the view of some, an amalgam of sci-ences -that has become a vibrant and richly pro-ductive discipline engaged in by a global networkof scientists of wide- ranging backgrounds and in-terests, but which of many avenues of pursuit theyfollow depend upon the unifying features of thepolyglot dendrochronology. Not unlike oceanog-raphy, scientists trained in numerous fields findthat their data are best understood and their epis-temology and theory generation are most logicallyinterpreted by the application of dendrochronologyand its own central theories. Dendrologists, ecol-ogists, climatologists, astronomers, archaeologists,chemists, forest resource managers and many oth-ers have been well served by the possibilities pro-vided by dendrochronology.
The discipline's own history, however, has beenbarely touched until recently. Works by Webb(1983), Nash (1999), and McGraw (2001) have, invery recent years, begun to alter that status quo,however. And, in all cases, these authors havefound that to appreciate the creation and rise ofdendrochronology, it is requisite that one comes toknow its creator and long -time prime theorist and
practitioner, Andrew Ellicott Douglass. Moreover,in the present case, the roles played by one speciesof tree, the Giant Sequoia, have also proven toilluminate much of the early developmental his-tory of tree -ring dating (McGraw 2001).
Andrew Ellicott Douglass was born in Vermontin 1867 and died in Arizona in 1962 after a re-markably long and productive career, the last half -century -plus of which was at the University of Ar-izona where he practiced his primary discipline ofastronomy, founded the Laboratory of Tree -RingResearch, the first facility of its kind, and soughtproof that trees held evidence of the role of the11 -year solar cycle on Earth's weather- somethingneither he nor anyone else has yet conclusivelyproved. Douglass' primary drive was to demon-strate that this well-known solar cycle did, in fact,affect the long -term climate of this planet and sohe spent much of his professional life trying todemonstrate that. In the process of so doing, hecreated what he came to christen dendrochronol-ogy as a tool to parse out his sought -after 11 -yearsolar cycle records from the `calendar' in the ringsof trees. He truly became "the lord of the rings"(Nash 1999).
Douglass graduated from Trinity College withemphases in geology, physics and astronomy, but
Copyright © 2003 by the Tree -Ring Society 21
22 McGRAW
with no formal training in botany nor any graduateeducation or degrees. Later in life an honorarydoctorate was bestowed upon him by his alma ma-ter. His first professional position with HarvardUniversity took him to Arequipa, Peru where hehelped establish an observatory, which is still op-erating today. He was next sent by his superior,the well -known amateur astronomer Percival Low-ell, to Flagstaff, Arizona to set up another obser-vatory, again still in existence, this time for thepurpose of viewing Mars in 1894 when its positionwas especially good for this purpose. Several yearslater Douglass and Lowell had a falling out overLowell's obsession with the notion of civilizationson Mars. Lowell, it seems, had been deeply im-pressed with the Italian astronomer GiovanniSchiaparelli's 1877 observations of the markingson Mars (Webb 1983). Having used the term can-ali for these markings, Schiaparelli's word shouldhave been translated as `channels,' but this hadbeen infamously mistranslated as `canals,' the im-plication being, of course, that some intelligentforce created them. Douglass could not support hismentor's views on this issue, so he wrote a letterto a colleague condemning Lowell's ideas and theletter unexpectedly fell into the senior astrono-mer's hands, thus leading to Douglass' dismissalfrom Lowell's service.
Having then to work at a number of odd jobsfor a period of time, Douglass found these to bedifficult years. Thus it was that in the first decadeof the 20th Century Douglass' `spare time' al-lowed him to create the early and very tentativescience of tree -ring dating. In 1906, Douglass ac-cepted a job with the University of Arizona, inTucson, and departed from Flagstaff after some 12years there and some 17 as a professional astron-omer. But, to go back just a few years to 1901,while he was still working in the Flagstaff areaafter the split with Lowell, Douglass took a tripwith a colleague and observed the changing scen-ery as they descended a steep incline. Many yearslater, Douglass explained his thoughts by sayingthat:
I was making a three weeks wagon trip from Flagstaff tothe towns of Fredonia and Kanab [in 19011 .... Wecrossed the old Lee's Ferry on the Colorado River. Oneday on the return we came down that immense grade on
the east side of the Kaibab Plateau. We tied the backwheels of the wagon so that they could not turn, cut downa tree and chained it to drag behind .... In those horse -and -buggy days we had time to think .... In the descentour surroundings changed from pine forest to desert onaccount of decreasing altitude, because altitude controlsthe amount of rainfall, and rain controls the tree growth.If this happens in terms of location, why shouldn't some-thing happen to the tree in terms of time ... and thereforewouldn't it be reasonable to search for the sunspot or othersolar cycles in tree -ring growth? (Douglass 1944)
This was the inspiration that led to his searchingfor evidence in tree rings of the 11 -year solar cy-cle. It was not an original idea: it had been sug-gested for centuries that the effects of weather,though not solar cycles, might be recorded by treerings. The great 18th century French biologistComte de Buffon (sometimes thought of as a`forerunner' of Darwin) and later the so- called 'fa-ther of the computer,' Charles Babbage, lookedinto tree rings and weather patterns (Heizer 1956).Any arguments to the contrary, the fact remainsthat Douglass was the only person to take the ideato the fullest and finally develop a viable scienceof tree -ring dating. The efforts of all his predeces-sors were short of that crucial viability issue nomatter which, if any, of dendrochronology's cen-tral theories they may have discovered. From 1901to 1904, Douglass did no field or lab work withtrees, but gave considerable thought to what mustbe done.
Finally, on January 1, 1904, he examined cross-cut sections of ponderosa pines in a commercialwood yard in Flagstaff and was able to discernwhat he would later term sensitive rings in thesections. Sensitive rings were ones that were var-iously thick or thin because of the available mois-ture in the years that those rings were laid down:thin rings indicated a drought year and thick onesa year with sufficient moisture for plentifulgrowth. Such demanding weather conditions aretypical in northern Arizona. From about 1906 andhis move to Tucson to his first formal publicationin 1909 on the idea that was to become dendro-chronology, Douglass examined many cut sectionsand standing stumps and even extended his studieslater (in 1912) to Prescott, Arizona, some milesdistant from Flagstaff, where he was at first aston-ished to find similar tree -ring patterns.
His first publication on this subject was in the
A.E. Douglass and the Giant Sequoias 23
journal Monthly Weather Review (Douglass 1909)where he met with considerable resistance by afather and son editorial team (Cleveland Abbe, Sr.,then `dean' of American weathermen, and his son,Cleveland, Jr.) who saw his ideas as fundamentallyheretical. Nevertheless, the astronomer had laidclaim to a fascinating idea that clearly needed tobe pursued. The fact that the editors of the Month-ly Weather Review assailed him, though they ap-proved his manuscript for publication, was enoughfor Douglass to fret about one aspect of the edi-tors' resistance: Douglass did not have a very longrecord of weather history in his specimens of pon-derosa pine. At that point, he had only several cen-turies' worth of data. The argument that the 1l-year solar cycle could be seen easily in such ma-terial was contested by the Abbes and several re-viewers of the 1909 paper. Furthermore, Douglasshimself felt the need for very long chronologies.It is in that sense, among others, that the GiantSequoia would eventually come into the pictureand has been the object of interest of my recentand continuing research efforts.
Ellsworth Huntington (1876 -1947), a Yale pro-fessor whose name is infamously familiar to thosewith an interest in the history of eugenics andthose who are practitioners in the field of geog-raphy- Huntington's primary discipline -cameinto Douglass' life in 1910 when Huntington wason a trip to visit with a local Tucson botanist, Dan-iel MacDougal, who the geographer had met sev-eral years before. MacDougal and Douglass kneweach other only slightly as fellow Tucson scien-tists, it seems, and so the astronomer was invitedto a dinner at which the nationally well -knownHuntington was being feted. It is possible thatHuntington came to know of Douglass's aborningscience at this dinner, but it was not until anotheryear had passed and Huntington again was in Tuc-son on the way to California in 1911 that the ge-ographer had become enamored of the possibilitiesof Douglass' infant science, he having by thenread Douglass' 1909 paper in the Monthly WeatherReview. Huntington's ideas about the role of cli-mate as the primary formative agent for the natureof human civilizations led him to seek out the Gi-ant Sequoia in order to see what weather historieshe could discern in the rings. He knew, as did oth-
ers at that time, that the sequoia grew to immenseages, though they are seldom as ancient as wasthen thought. Huntington had no interest in anysolar connection to Earth's climate, nor to any reg-ular cycles other than periodic ones he supposedmust exist and must be correlatable with the wax-ing and waning of the various great civilizations.Perforce of this, when he did finally count ringsin some 450 cut sequoia stumps in the loggingshows north of Sequoia National Park, his meth-ods were, at best, a bit sloppy. Later, Douglasswould demonstrate that Huntington's ring countscould be off, as compared to a calendar, by asmuch as 300 years. Such imprecision would hardlydo for Douglass when he was looking for neardecadal- length cycles.
As it eventuated, Huntington asked Douglass tocreate a chapter for the geographer's next book(Huntington 1914). That contribution was basical-ly an early primer on the youthful dendrochronol-ogy, but one that made use of only a single speciesof tree in its foundations, the ponderosa pine ofNorthern Arizona. The problems that inhered inthat limited situation were not yet apparent toDouglass. One specific problem was that Douglasshad not studied the pines in areas where they werelikely to have sufficient moisture year round andyear after year. The impact of the importance ofthis was soon to be seen, however, and that wasvia the Giant Sequoia.
On Huntington's first trip to the Sierra Nevadamountains of California, the only endemic area inthe world for the Giant Sequoias, he found that therings of the Big Trees were very hard to read: thereis very little variation from year to year in thisspecies -an evolutionary quirk quite independentof any weather history superimposed upon therings. Much later this type of ring would be termedsemi -complacent. Complacent trees are those, soDouglass would finally define it (in a letter toHuntington where he also coined and defined 'sen-sitive', see Douglass 1916a), that have enoughmoisture at all times that they do not show fluc-tuations in weather patterns, or are otherwise sen-sitive species but are individuals that stand in plac-es where such fluctuations don't even exist -theAmazonian Rain Forest, for example. While thesequoia sees annual variations of snowy winters
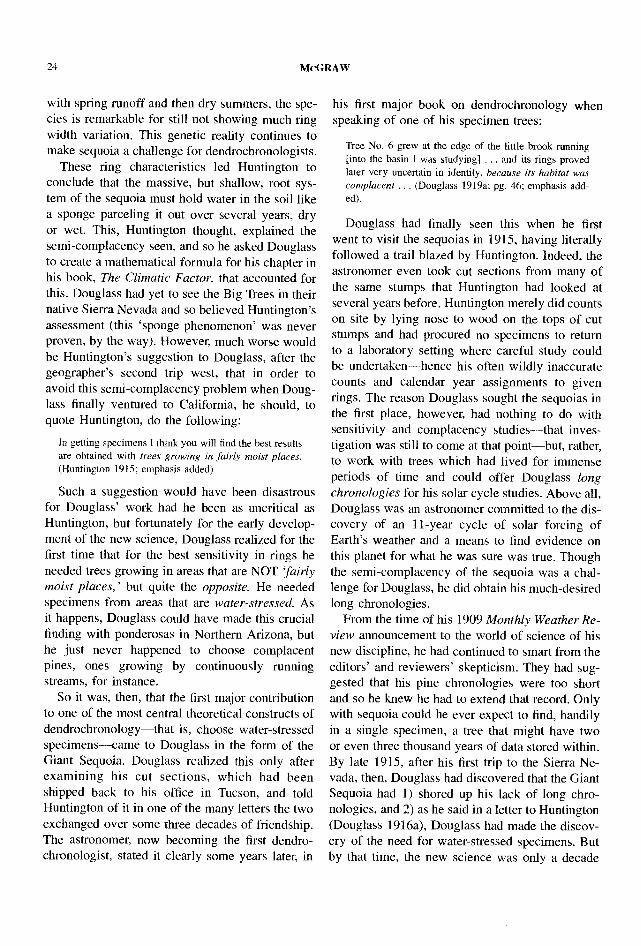
24 McGRAW
with spring runoff and then dry summers, the spe-cies is remarkable for still not showing much ringwidth variation. This genetic reality continues tomake sequoia a challenge for dendrochronologists.
These ring characteristics led Huntington toconclude that the massive, but shallow, root sys-tem of the sequoia must hold water in the soil likea sponge parceling it out over several years, dryor wet. This, Huntington thought, explained thesemi- complacency seen, and so he asked Douglassto create a mathematical formula for his chapter inhis book, The Climatic Factor, that accounted forthis. Douglass had yet to see the Big Trees in theirnative Sierra Nevada and so believed Huntington'sassessment (this `sponge phenomenon' was neverproven, by the way). However, much worse wouldbe Huntington's suggestion to Douglass, after thegeographer's second trip west, that in order toavoid this semi -complacency problem when Doug-lass finally ventured to California, he should, toquote Huntington, do the following:
In getting specimens 1 think you will find the best resultsare obtained with trees growing in fairly moist places.(Huntington 1915; emphasis added)
Such a suggestion would have been disastrousfor Douglass' work had he been as uncritical asHuntington, but fortunately for the early develop-ment of the new science, Douglass realized for thefirst time that for the best sensitivity in rings heneeded trees growing in areas that are NOT 'fairlymoist places,' but quite the opposite. He neededspecimens from areas that are water -stressed. Asit happens, Douglass could have made this crucialfinding with ponderosas in Northern Arizona, buthe just never happened to choose complacentpines, ones growing by continuously runningstreams, for instance.
So it was, then, that the first major contributionto one of the most central theoretical constructs ofdendrochronology -that is, choose water- stressedspecimens -came to Douglass in the form of theGiant Sequoia. Douglass realized this only afterexamining his cut sections, which had beenshipped back to his office in Tucson, and toldHuntington of it in one of the many letters the twoexchanged over some three decades of friendship.The astronomer, now becoming the first dendro-chronologist, stated it clearly some years later, in
his first major book on dendrochronology whenspeaking of one of his specimen trees:
Tree No. 6 grew at the edge of the little brook running[into the basin I was studying] ... and its rings provedlater very uncertain in identity, because its habitat wascomplacent ... (Douglass 1919a; pg. 46; emphasis add-ed).
Douglass had finally seen this when he firstwent to visit the sequoias in 1915, having literallyfollowed a trail blazed by Huntington. Indeed, theastronomer even took cut sections from many ofthe same stumps that Huntington had looked atseveral years before. Huntington merely did countson site by lying nose to wood on the tops of cutstumps and had procured no specimens to returnto a laboratory setting where careful study couldbe undertaken -hence his often wildly inaccuratecounts and calendar year assignments to givenrings. The reason Douglass sought the sequoias inthe first place, however, had nothing to do withsensitivity and complacency studies -that inves-tigation was still to come at that point-but, rather,to work with trees which had lived for immenseperiods of time and could offer Douglass longchronologies for his solar cycle studies. Above all,Douglass was an astronomer committed to the dis-covery of an 1.1 -year cycle of solar forcing ofEarth's weather and a means to find evidence onthis planet for what he was sure was true. Thoughthe semi -complacency of the sequoia was a chal-lenge for Douglass, he did obtain his much -desiredlong chronologies.
From the time of his 1909 Monthly Weather Re-view announcement to the world of science of hisnew discipline, he had continued to smart from theeditors' and reviewers' skepticism. They had sug-gested that his pine chronologies were too shortand so he knew he had to extend that record. Onlywith sequoia could he ever expect to find, handilyin a single specimen, a tree that might have twoor even three thousand years of data stored within.By late 1915, after his first trip to the Sierra Ne-vada, then, Douglass had discovered that the GiantSequoia had 1) shored up his lack of long chro-nologies, and 2) as he said in a letter to Huntington(Douglass 1916a), Douglass had made the discov-ery of the need for water- stressed specimens. Butby that time, the new science was only a decade
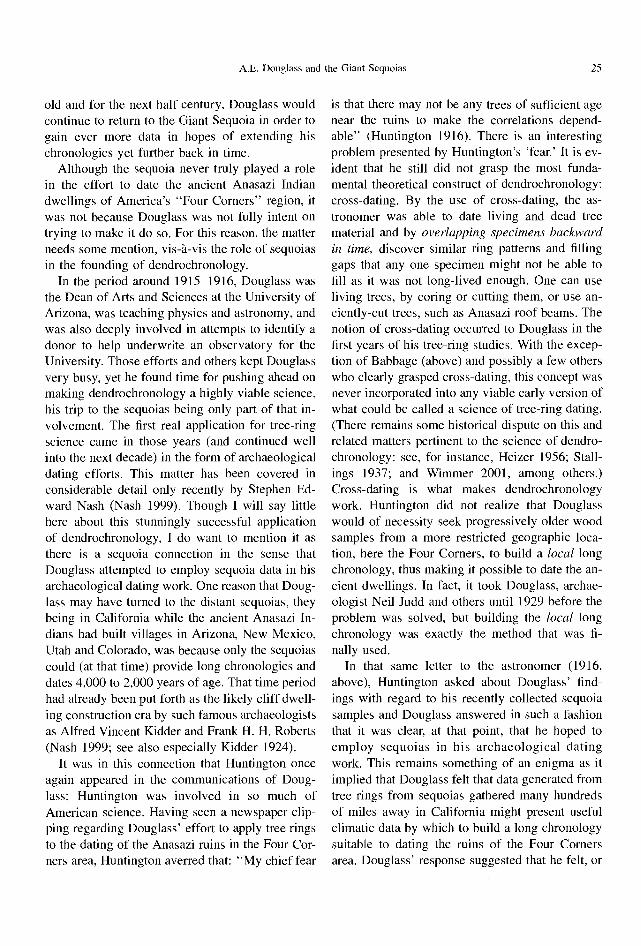
A.E. Douglass and the Giant Sequoias 25
old and for the next half century, Douglass wouldcontinue to return to the Giant Sequoia in order togain ever more data in hopes of extending hischronologies yet further back in time.
Although the sequoia never truly played a rolein the effort to date the ancient Anasazi Indiandwellings of America's "Four Corners" region, itwas not because Douglass was not fully intent ontrying to make it do so. For this reason, the matterneeds some mention, vis -à -vis the role of sequoiasin the founding of dendrochronology.
In the period around 1915 -1916, Douglass wasthe Dean of Arts and Sciences at the University ofArizona, was teaching physics and astronomy, andwas also deeply involved in attempts to identify adonor to help underwrite an observatory for theUniversity. Those efforts and others kept Douglassvery busy, yet he found time for pushing ahead onmaking dendrochronology a highly viable science,his trip to the sequoias being only part of that in-volvement. The first real application for tree -ringscience came in those years (and continued wellinto the next decade) in the form of archaeologicaldating efforts. This matter has been covered inconsiderable detail only recently by Stephen Ed-ward Nash (Nash 1999). Though I will say littlehere about this stunningly successful applicationof dendrochronology, I do want to mention it asthere is a sequoia connection in the sense thatDouglass attempted to employ sequoia data in hisarchaeological dating work. One reason that Doug-lass may have turned to the distant sequoias, theybeing in California while the ancient Anasazi In-dians had built villages in Arizona, New Mexico,Utah and Colorado, was because only the sequoiascould (at that time) provide long chronologies anddates 4,000 to 2,000 years of age. That time periodhad already been put forth as the likely cliff dwell-ing construction era by such famous archaeologistsas Alfred Vincent Kidder and Frank H. H. Roberts(Nash 1999; see also especially Kidder 1924).
It was in this connection that Huntington onceagain appeared in the communications of Doug-lass; Huntington was involved in so much ofAmerican science. Having seen a newspaper clip-ping regarding Douglass' effort to apply tree ringsto the dating of the Anasazi ruins in the Four Cor-ners area, Huntington averred that: "My chief fear
is that there may not be any trees of sufficient agenear the ruins to make the correlations depend-able" (Huntington 1916). There is an interestingproblem presented by Huntington's `fear.' It is ev-ident that he still did not grasp the most funda-mental theoretical construct of dendrochronology:cross -dating. By the use of cross -dating, the as-tronomer was able to date living and dead treematerial and by overlapping specimens backwardin time, discover similar ring patterns and fillinggaps that any one specimen might not be able tofill as it was not long -lived enough. One can useliving trees, by coring or cutting them, or use an-ciently -cut trees, such as Anasazi roof beams. Thenotion of cross- dating occurred to Douglass in thefirst years of his tree -ring studies. With the excep-tion of Babbage (above) and possibly a few otherswho clearly grasped cross -dating, this concept wasnever incorporated into any viable early version ofwhat could be called a science of tree -ring dating.(There remains some historical dispute on this andrelated matters pertinent to the science of dendro-chronology: see, for instance, Heizer 1956; Stall-ings 1937; and Wimmer 2001, among others.)Cross -dating is what makes dendrochronologywork. Huntington did not realize that Douglasswould of necessity seek progressively older woodsamples from a more restricted geographic loca-tion, here the Four Corners, to build a local longchronology, thus making it possible to date the an-cient dwellings. In fact, it took Douglass, archae-ologist Neil Judd and others until 1929 before theproblem was solved, but building the local longchronology was exactly the method that was fi-nally used.
In that same letter to the astronomer (1916,above), Huntington asked about Douglass' find-ings with regard to his recently collected sequoiasamples and Douglass answered in such a fashionthat it was clear, at that point, that he hoped toemploy sequoias in his archaeological datingwork. This remains something of an enigma as itimplied that Douglass felt that data generated fromtree rings from sequoias gathered many hundredsof miles away in California might present usefulclimatic data by which to build a long chronologysuitable to dating the ruins of the Four Cornersarea. Douglass' response suggested that he felt, or
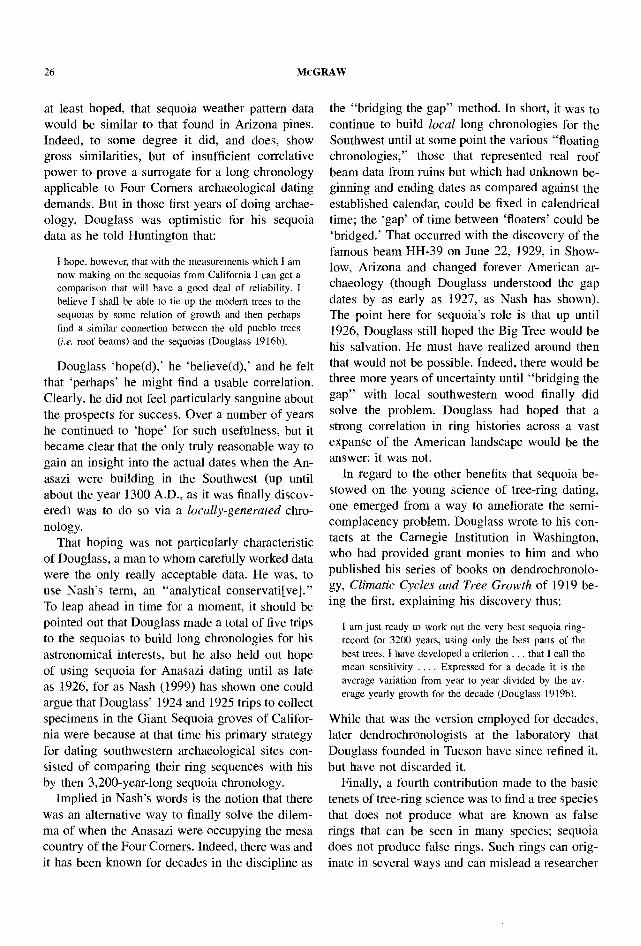
26 McGRAW
at least hoped, that sequoia weather pattern datawould be similar to that found in Arizona pines.Indeed, to some degree it did, and does, showgross similarities, but of insufficient correlativepower to prove a surrogate for a long chronologyapplicable to Four Corners archaeological datingdemands But in those first years of doing archae-ology, Douglass was optimistic for his sequoiadata as he told Huntington that:
I hope, however, that with the measurements which I amnow making on the sequoias from California I can get acomparison that will have a good deal of reliability. Ibelieve I shall be able to tie up the modern trees to thesequoias by some relation of growth and then perhapsfind a similar connection between the old pueblo trees(i.e. roof beams) and the sequoias (Douglass 1916b).
Douglass `hope(d),' he `believe(d),' and he feltthat `perhaps' he might find a usable correlation.Clearly, he did not feel particularly sanguine aboutthe prospects for success. Over a number of yearshe continued to `hope' for such usefulness, but itbecame clear that the only truly reasonable way togain an insight into the actual dates when the An-asazi were building in the Southwest (up untilabout the year 1300 A.D., as it was finally discov-ered) was to do so via a locally -generated chro-nology.
That hoping was not particularly characteristicof Douglass, a man to whom carefully worked datawere the only really acceptable data. He was, touse Nash's term, an "analytical conservati[ve]."To leap ahead in time for a moment, it should bepointed out that Douglass made a total of five tripsto the sequoias to build long chronologies for hisastronomical interests, but he also held out hopeof using sequoia for Anasazi dating until as lateas 1926, for as Nash (1999) has shown one couldargue that Douglass' 1924 and 1925 trips to collectspecimens in the Giant Sequoia groves of Califor-nia were because at that time his primary strategyfor dating southwestern archaeological sites con-sisted of comparing their ring sequences with hisby then 3,200 -year -long sequoia chronology.
Implied in Nash's words is the notion that therewas an alternative way to finally solve the dilem-ma of when the Anasazi were occupying the mesacountry of the Four Corners. Indeed, there was andit has been known for decades in the discipline as
the "bridging the gap" method. In short, it was tocontinue to build local long chronologies for theSouthwest until at some point the various "floatingchronologies," those that represented real roofbeam data from ruins but which had unknown be-ginning and ending dates as compared against theestablished calendar, could be fixed in calendricaltime; the `gap' of time between `floaters' could be`bridged.' That occurred with the discovery of thefamous beam HH -39 on June 22, 1929, in Show -low, Arizona and changed forever American ar-chaeology (though Douglass understood the gapdates by as early as 1927, as Nash has shown).The point here for sequoia's role is that up until1926, Douglass still hoped the Big Tree would behis salvation. He must have realized around thenthat would not be possible. Indeed, there would bethree more years of uncertainty until "bridging thegap" with local southwestern wood finally didsolve the problem. Douglass had hoped that astrong correlation in ring histories across a vastexpanse of the American landscape would be theanswer: it was not.
In regard to the other benefits that sequoia be-stowed on the young science of tree -ring dating,one emerged from a way to ameliorate the semi -complacency problem. Douglass wrote to his con-tacts at the Carnegie Institution in Washington,who had provided grant monies to him and whopublished his series of books on dendrochronolo-gy, Climatic Cycles and Tree Growth of 1919 be-ing the first, explaining his discovery thus:
I am just ready to work out the very best sequoia ring -record for 3200 years, using only the best parts of thebest trees. I have developed a criterion ... that I call themean sensitivity .... Expressed for a decade it is theaverage variation from year to year divided by the av-erage yearly growth for the decade (Douglass 1919b).
While that was the version employed for decades,later dendrochronologists at the laboratory thatDouglass founded in Tucson have since refined it,but have not discarded it.
Finally, a fourth contribution made to the basictenets of tree -ring science was to find a tree speciesthat does not produce what are known as falserings that can be seen in many species; sequoiadoes not produce false rings. Such rings can orig-inate in several ways and can mislead a researcher
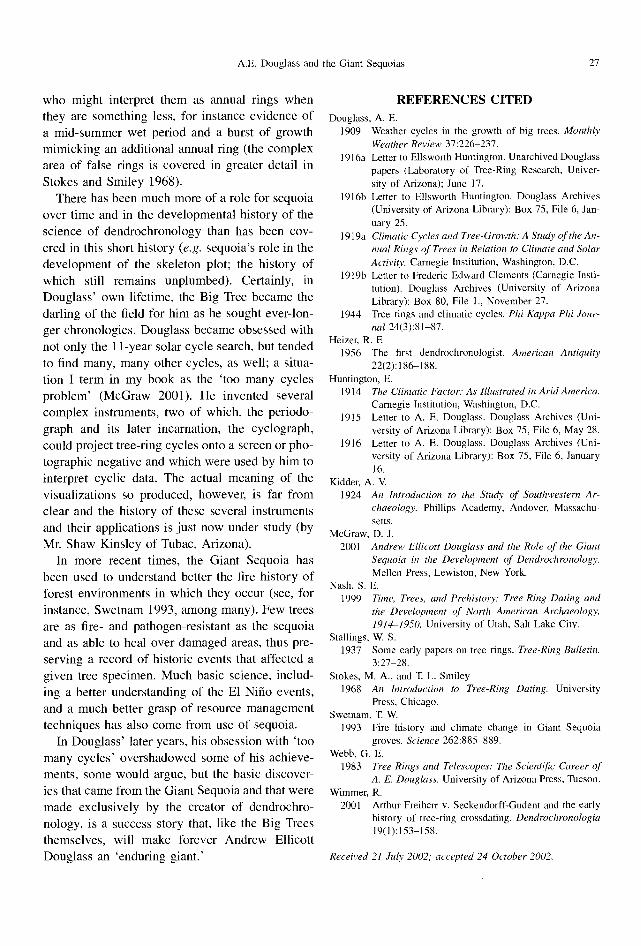
A.E. Douglass and the Giant Sequoias 27
who might interpret them as annual rings whenthey are something less, for instance evidence ofa mid -summer wet period and a burst of growthmimicking an additional annual ring (the complexarea of false rings is covered in greater detail inStokes and Smiley 1968).
There has been much more of a role for sequoiaover time and in the developmental history of thescience of dendrochronology than has been cov-ered in this short history (e.g. sequoia's role in thedevelopment of the skeleton plot; the history ofwhich still remains unplumbed). Certainly, inDouglass' own lifetime, the Big Tree became thedarling of the field for him as he sought ever -lon-ger chronologies. Douglass became obsessed withnot only the 11-year solar cycle search, but tendedto find many, many other cycles, as well; a situa-tion I term in my book as the `too many cyclesproblem' (McGraw 2001). He invented severalcomplex instruments, two of which, the periodo-graph and its later incarnation, the cyclograph,could project tree -ring cycles onto a screen or pho-tographic negative and which were used by him tointerpret cyclic data. The actual meaning of thevisualizations so produced, however, is far fromclear and the history of these several instrumentsand their applications is just now under study (byMr. Shaw Kinsley of Tubac, Arizona).
In more recent times, the Giant Sequoia hasbeen used to understand better the fire history offorest environments in which they occur (see, forinstance, Swetnam 1993, among many). Few treesare as fire- and pathogen- resistant as the sequoiaand as able to heal over damaged areas, thus pre-serving a record of historic events that affected agiven tree specimen. Much basic science, includ-ing a better understanding of the El Niño events,and a much better grasp of resource managementtechniques has also come from use of sequoia.
In Douglass' later years, his obsession with `toomany cycles' overshadowed some of his achieve-ments, some would argue, but the basic discover-ies that came from the Giant Sequoia and that weremade exclusively by the creator of dendrochro-nology, is a success story that, like the Big Treesthemselves, will make forever Andrew EllicottDouglass an `enduring giant.'
REFERENCES CITEDDouglass, A. E.
1909 Weather cycles in the growth of big trees. MonthlyWeather Review 37:226 -237.
1916a Letter to Ellsworth Huntington. Unarchived Douglasspapers (Laboratory of Tree -Ring Research, Univer-sity of Arizona); June 17.
1916b Letter to Ellsworth Huntington. Douglass Archives(University of Arizona Library): Box 75, File 6, Jan-uary 25.
1919a Climatic Cycles and Tree -Growth: A Study of the An-nual Rings of Trees in Relation to Climate and SolarActivity. Carnegie Institution, Washington, D.C.
1919b Letter to Frederic Edward Clements (Carnegie Insti-tution). Douglass Archives (University of ArizonaLibrary): Box 80, File 1., November 27.
1944 Tree rings and climatic cycles. Phi Kappa Phi Jour-nal 24(3):81 -87.
Heizer, R. F.1956 The first dendrochronologist. American Antiquity
22(2):186 -188.Huntington, E.
1914 The Climatic Factor: As Illustrated in Arid America.Carnegie Institution, Washington, D.C.
1915 Letter to A. E. Douglass. Douglass Archives (Uni-versity of Arizona Library): Box 75, File 6, May 28.
1916 Letter to A. E. Douglass. Douglass Archives (Uni-versity of Arizona Library): Box 75, File 6, January16.
Kidder, A. V.1924 An Introduction to the Study of Southwestern Ar-
chaeology. Phillips Academy, Andover, Massachu-setts.
McGraw, D. J.2001 Andrew Ellicott Douglass and the Role of the Giant
Sequoia in the Development of Dendrochronology.Mellen Press, Lewiston, New York.
Nash, S. E.1999 Time, Trees, and Prehistory: Tree -Ring Dating and
the Development of North American Archaeology,1914 -1950. University of Utah, Salt Lake City.
Stallings, W S.1937 Some early papers on tree rings. Tree -Ring Bulletin.
3:27 -28.Stokes, M. A., and T. L. Smiley
1968 An Introduction to Tree -Ring Dating. UniversityPress, Chicago.
Swetnam, T. W.1993 Fire history and climate change in Giant Sequoia
groves. Science 262:885 -889.Webb, G. E.
1983 Tree Rings and Telescopes: The Scientific Career ofA. E. Douglass. University of Arizona Press, Tucson.
Wimmer, R.2001 Arthur Freiherr v. Seckendorff- Gudent and the early
history of tree -ring crossdating. Dendrochronologia19(1):153 -158.
Received 21 July 2002; accepted 24 October 2002.
TREE -RING RESEARCH, Vol. 59(1), 2003, pp. 29 -36
SURVIVORSHIP BIAS IN TREE -RING RECONSTRUCTIONS OF FORESTTENT CATERPILLAR OUTBREAKS USING TREMBLING ASPEN
BARRY J. COOKE
Natural Resources CanadaCanadian Forest Service
Laurentian Forestry CentreSte -Foy, QC, G1V 4C7
WILLIAM E. MILLER
University of MinnesotaDepartment of Entomology
St. Paul, MN, 55108
and
JENS ROLAND
University of AlbertaDepartment of Biological Sciences
Edmonton, AB, T6G 2E9
ABSTRACT
When trembling aspen (Populus tremuloides Michx.) from northern Minnesota, USA, were sampledin 2000, the impact on annual radial growth of a 1951 -1954 outbreak of forest tent caterpillar (Malacosomadisstria [I- Ibn.]) was found to be just as strong and clear as it was when estimated from samples taken in1955. During those 45 intervening years, at least three tent caterpillar outbreaks occurred, yet the statisticaldistribution of ring -width profiles did not change. This suggests that survivorship bias is not a majorimpediment to the use of aspen ring widths for inferring the magnitude of past tent caterpillar outbreaks.
Keywords: historical ecology, dendroecological disturbance reconstruction, survivorship bias, ringwidth analysis, insect outbreaks, forest tent caterpillar.
INTRODUCTION
As a forest ages, some trees die while otherssurvive. This fact, while obvious, has importantimplications for dendroecological research that arenot so obvious. Because trees that have died anddecomposed are unavailable for sampling, there isa natural tendency in dendrochronological studiesof forest dynamics to focus on the surviving stemsand to lose sight of the important information con-tained in stems that have died. Dendroecologicalreconstructions, to the extent that they are basedon living trees, thus provide a biased view of pastrecruitment, survival and mortality events (Veblenet al. 1991). A specific problem is that the induc-tion of systematic, time -dependent biases into his-torical reconstructions can lead to erroneous infer-
Copyright © 2003 by the Tree -Ring Society
ences about the critical processes shaping statisti-cal distributions of stem age and size.
Of particular interest is the role of differentialmortality in the analysis of time -series of tree -ringwidths. Because individual trees vary in growthrates, the statistical distribution of an annual radialincrement in a stand of trees will change as indi-viduals are selected out of the population. If theprobability of death is independent of previous an-nual increments, then the mean annual incrementobserved in a sample of survivors should fluctuatearound the mean of the original population. But ifstressed trees with low growth rates are more sus-ceptible to mortality, then annual increment esti-mates from a residual stand of survivors shouldappear to increase the later a sample is taken, pure-ly as a result of the cumulative effect of differ-
29
30 COOKE, MILLER, and ROLAND
ential survival of stressed and unstressed trees. In-deed, this is expected to happen even if the standdeclines gradually, as a result of secondary agents.All that is required for differential mortality is thatthe secondary agents act more strongly on stressedindividuals. Any difference in estimated annual in-crement arising from the comparison of old andnew samples that is caused by differential mortal-ity of slow -growing, stressed, or attacked trees weformally define as "survivorship bias."
Because of the "fading record problem" of his-torical ecology (Swetnam et al. 1999) differentialsurvivorship poses a curious problem for dendro-ecological research. For if stressed trees fade fromthe record more quickly than unstressed trees,then, as the total number of observations in a chro-nology declines the further one goes back in time,the record of ring widths becomes dominated byincreasingly biased observations. In other words,a certain non -stationary portion of the signal in aring -width chronology is attributable to the effectsof differential survivorship. This provides a sec-ond, informal meaning for the term "survivorshipbias" -one that is useful in the practical contextof understanding the pattern of fluctuations in asingle ring -width chronology.
Where large -scale disturbances, such as insectoutbreaks, lead to pulses of growth suppressionand mortality (direct or indirect; immediate or de-layed), the information loss and distortion result-ing from differential survivorship could be partic-ularly strong and deceiving. Dendroecological dis-turbance reconstructions based on tree -ring widthsmay therefore be particularly vulnerable to theproblem of survivorship bias. The specific dangeris that the impact of a periodic disturbance regimeof constant amplitude could falsely appear to in-crease in severity over time. The question thusarises: when, in a dendrochronological reconstruc-tion, prolonged dips in tree -ring widths tend to in-crease in amplitude through time, is this a resultof increased disturbance severity, or is it an artifactof survivorship bias? How far back in time canone assume that the distortion caused by survi-vorship bias is negligible?
Our questions were motivated by an interestingdiscovery we made recently during efforts to re-construct tent caterpillar (Malacosoma disstria
[Hbn.]) outbreaks from historical records of trem-bling aspen (Populus tremuloides Michx.) ringwidths in Alberta, Canada (Figure 1). One aspenring -width chronology (Figure 2a) showed a trendtoward increasingly severe dips in ring width, es-pecially after the mid- 1970's. These dips were as-sociated with the occurrence of periodic tent cat-erpillar outbreaks, raising the question: has the im-pact of local outbreaks worsened in recent times?Or is it just that trees defoliated prior to 1970 havebeen differentially selected out of the population,such that they were unavailable for sampling?
Although forest tent caterpillars are not gener-ally considered to be a primary cause of aspenmortality (Batzer et al. 1954; Ghent 1958; Rose1958; Hildahl and Reeks 1960), severe defoliationcan weaken stems, especially older ones, such thatsecondary agents, such as fungi and beetles, be-come important sources of mortality (Barter andCameron 1955; Duncan and Hodson 1958; Chur-chill et al. 1964; Hogg et al. 2002). Thus it ispossible that defoliation by forest tent caterpillarscould accelerate the loss of aspen stems from astand, thereby introducing a systematic bias in thehistorical record of tree -ring widths. The purposeof this study was to determine if the evidence forpast tent caterpillar outbreaks tends to diminishwith the passage of time, as a result of survivor-ship bias.
METHODS
Our investigation was prompted by recent ob-servations in Alberta, Canada; but because histor-ical samples from Alberta were not available forcomparison with our modem samples, we decidedto re- sample an area where (1) historical aspensamples had been collected previously and (2) thehistory of forest tent caterpillar outbreaks was welldocumented. A large portion of northern Minne-sota had been sampled in 1955 to estimate the im-pact on aspen growth of a 1951 -1954 outbreak offorest tent caterpillar. Though the original aspensamples were destroyed and full chronologies werenever published, Froelich et al. (1955) did assem-ble partial ring -width chronologies for the years1950 -1954. These were based on the year inwhich peak defoliation was observed: either 1952
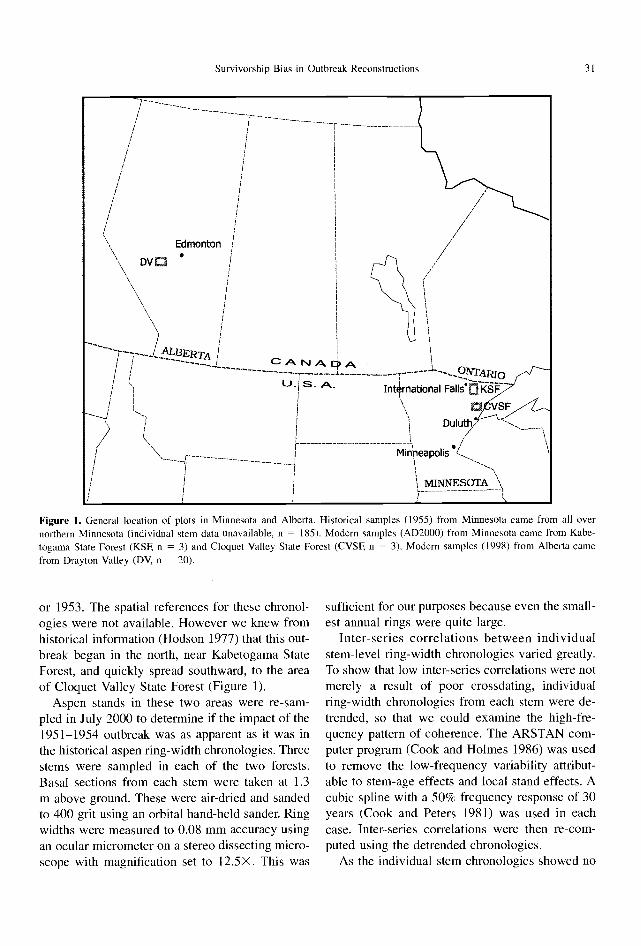
Survivorship Bias in Outbreak Reconstructions 31
Edmonton
DVC
;_ALBERTAÿ_._._._._ C A IV Ai4)
u_ S. A_ Intrnational Falls K
Duluth/
Minheapolis
j MINNESOTA
Figure 1. General location of plots in Minnesota and Alberta. Historical samples (1955) from Minnesota came from all overnorthern Minnesota (individual stem data unavailable, n = 185). Modern samples (AD2000) from Minnesota came from Kabe-togama State Forest (KSF, n = 3) and Cloquet Valley State Forest (CVSF, = 3). Modem samples (1998) from Alberta camefrom Drayton Valley (DV, n = 20).
or 1953. The spatial references for these chronol-ogies were not available. However we knew fromhistorical information (Hodson 1977) that this out-break began in the north, near Kabetogama StateForest, and quickly spread southward, to the areaof Cloquet Valley State Forest (Figure 1).
Aspen stands in these two areas were re -sam-pled in July 2000 to determine if the impact of the1951 -1954 outbreak was as apparent as it was inthe historical aspen ring -width chronologies. Threestems were sampled in each of the two forests.Basal sections from each stem were taken at 1.3m above ground. These were air -dried and sandedto 400 grit using an orbital hand -held sander. Ringwidths were measured to 0.08 mm accuracy usingan ocular micrometer on a stereo dissecting micro-scope with magnification set to 12.5X . This was
sufficient for our purposes because even the small-est annual rings were quite large.
Inter -series correlations between individualstem -level ring -width chronologies varied greatly.To show that low inter -series correlations were notmerely a result of poor crossdating, individualring -width chronologies from each stem were de-trended, so that we could examine the high -fre-quency pattern of coherence. The ARSTAN com-puter program (Cook and Holmes 1986) was usedto remove the low- frequency variability attribut-able to stem -age effects and local stand effects. Acubic spline with a 50% frequency response of 30years (Cook and Peters 1981) was used in eachcase. Inter- series correlations were then re -com-puted using the detrended chronologies.
As the individual stem chronologies showed no

32 COOKE, MILLER, and ROLAND
2.0 -
1.0 -
0.0 -
5.0
4.0 -E
3.0 -:0
2.0 -
1.0
0.0 -
-a-- Kabetogama, MN-0- Cloquet Valley, MN
I I r
1920 1930 140 1950 1960 1970 9980 1990
-- Kabetogama (modern, 2000)
0 1952 outbreak (historical, 1955)
0.5 -
0.0
2.0 -
1.5
--- Cloquet Valley (modern, 2000)
A 1953 outbreak (historical, 1955)
1.0 -
0.5 -
0.0 -1950 1951 1952 1953 1954
2000
Figure 2. Aspen ring -width data. (a) Mean detrended aspen ring -width chronology (n = 20) for Drayton Valley. Alberta,indicating a possible trend toward more severe outbreaks in recent decades. Dotted lines indicate 95% confidence interval. Arrowsindicate severe growth reductions caused by forest tent caterpillar outbreaks. Question marks indicate smaller growth reductionspotentially caused by forest tent caterpillar. (b) Mean aspen ring widths for Kabetogama State Forest (open squares) and CloquetValley State Forest (shaded circles). Arrows indicate dips in aspen ring width that correspond with records of defoliation by

Survivorship Bias in Outbreak Reconstructions 33
consistent pattern in growth trend, mean, site -levelchronologies were created simply by averaging thenon -detrended ring widths. The non -detrendedmodern chronologies were then compared graphi-cally to historical forest tent caterpillar census dataand defoliation maps (Hodson 1977) for the period1948 -1959 to confirm that forest tent caterpillarwas the cause of episodes of growth reduction.
Each non -detrended modern chronology wasthen compared with the appropriate historicalchronology to determine if the ring -width profilesdiffered among sampling times. For each year inthe chronology, a t -test was used to compare an-nual relative growth rates estimated from modernand historical samples. The annual relative growthrate was computed as the annual ring width divid-ed by the stem radius. By using relative growthrates, differences among stems in mean growthrates were factored out of the analysis. Conse-quently, the tests were comparing annual depar-tures from normal growth.
As individual stem data were not available forthe historical chronologies, a one -sample t -test wasused to compare annual relative growth rates fromeach modern chronology to the mean annual rel-ative growth rates from the corresponding histor-ical mean chronology, for each year from 1950 to1954. All analyses were conducted using Minitab(Minitab Inc., State College, PA).
RESULTS
Inter -series correlations among individual stem -level ring -width chronologies were strongly posi-tive in some cases (r = 0.50, SD = 0.09, n = 5),but negative in most others (r = -0.12, SD =0.19, n = 10). Detrending led to a mean inter -series correlation of r = 0.46 (SD = 0.10, n = 3)at Cloquet Vally State Forest and r = 0.45 (SD =0.09, n = 3) at Kabetogama State Forest, confirm-ing that poor coherence was in fact caused by site-
and stand -level differences in growth trends, andnot to any errors in crossdating. Pair -wise corre-lations for chronologies from different sites werelower (r = 0.18, SD = 0.11, n = 9), indicatingstronger coherence within than between sites.
Despite the small number of samples, the Ka-betogama and Cloquet Valley aspen ring -widthchronologies (Figure 2b) agreed well with both theMinnesota defoliation maps and the forest tent cat-erpillar census data of Hodson (1977, his Figures1 -20). The aspen ring -width chronologies revealedadditional subsequent disturbances in 1968 -1973,1977 -1981 and 1988 -1992 (arrows in Figure 2b).These disturbances were caused mostly by foresttent caterpillar defoliation, with some contributionby the large aspen tortrix (Choristoneura conflic-tana [Walker]), as revealed by aerial survey maps(Beach 1968 -1971, Minnesota Dept. Nat. Re-sources 1974 -1981, 1989 -1990, 1992). These re-cords correspond generally with Witter's (1979)list of outbreak years in Minnesota since 1891. Se-vere defoliation was also observed in the plotswhere stem sections were collected for this studyin July 2000.
The severe impact of the 1952 and 1953 out-break revealed in Froelich's (1955) historical sam-ples was also evident in modern samples (Figure2b). In fact, the 1950 -1954 dip in the ring widthprofiles of the modern samples was just as severeas in the historical chronology (Figure 2c, d). Inonly 2 of 10 year -wise comparisons did growthestimates differ between historical and modernchronologies -and one of those differences wasvery small. If anything, radial growth at Kabeto-gama in 1951 and Cloquet Valley in 1953 and1954 appeared to be lower in the modern samplesthan in the historical chronologies.
DISCUSSION
The low inter - series correlations for raw ring -width chronologies resulted from a lack of low-
forest tent caterpillar. (c) Aspen annual relative growth rates from Kabetogama State Forest modern chronology (open square)compared to historical chronology (open triangle) for plots defoliated in 1952 (Froelich et al. 1955). (d) Same data as in (c), butfor Cloquet Valley State Forest (shaded circle) and plots defoliated in 1953 (open triangle). Error bars in (c) and (d) indicate95% confidence interval. Dark filled symbols indicate years where relative growth rates differ significantly (p G 0.05, one -samplet -test) between modern and historical chronologies.
34 COOKE, MILLER, and ROLAND
frequency coherence in growth trends -a patternthat is to be expected for a shade -intolerant speciesgrowing in dense forests dominated by asynchro-nous and patchy natural disturbance (Cooke 2001).Detrending helped to remove the between -stemvariability in growth trends, revealing a high de-gree of coherency in decadal fluctuations, whichwe attribute to periodic outbreaks of forest tentcaterpillar. Coherence in the detrended chronolo-gies was much lower between sites than withinsites. This we interpret as the effect of spatial var-iability in the precise timing of outbreaks. Thiswould be consistent with the pattern of the 1950soutbreak, which did not occur synchronouslyacross Minnesota, but peaked in Kabetogama StateForest 1 -2 years before peaking in Cloquet Valley(Figure 2).
The non -detrended modern and historical aspenring -width chronologies differed little from oneanother. The similarity in magnitude of the 1950-1954 dip was detected despite the occurrence ofthree additional outbreaks during the 45 interven-ing years. This suggests that any differential mor-tality resulting in the accelerated loss of defoliatedaspen is probably not severe enough to introducesurvivorship bias into aspen ring -width chronolo-gies. Whether this is the case for longer timeframes remains to be tested.
The apparent absence of survivorship bias intrembling aspen may be a result of a lack of dif-ferential mortality of defoliated stems. This inter-pretation would be consistent with other, numerousstudies concluding that the immediate impact oftent caterpillar defoliation on aspen survival isnegligible (Duncan and Hodson 1958; Rose 1958).Although mortality of aspen stems is known tooccur as a result of severe and prolonged defoli-ation (Hogg and Schwarz 1999), this seems not tohave occurred in Minnesota in response to the tentcaterpillar outbreak of the 1950s.
Wellington et al. (1950) claimed that severe de-foliation, in mature stands, eventually leads to ac-celerated rates of aspen decline, although Ghent(1958). found no evidence for this. Hildahl andReeks (1960) cautioned that evidence of tent cat-erpillar- caused mortality is difficult to amass inshort-term studies because of the numerous, slow -acting secondary agents involved in aspen stand
decline. Long -term studies have confirmed the de-layed, synergistic effects of secondary mortalityagents, including fungi and wood -boring beetles(Churchill et al. 1964). More recently, the foresttent caterpillar has been implicated as a co- factorin the premature decline of overstorey aspen inOntario (Candau et al. 2002) and in Alberta (Hogget al. 2002), thus validating our initial concern thatdifferential attrition of aspen stems defoliated bytent caterpillars could, in theory, lead to a biasedrecord of tree -ring widths. Fortunately for den -droecologists wishing to reconstruct tent caterpil-lar outbreaks, the effect appears to be negligible.Of course, if stem attrition is a gradual processinvolving slow- acting, secondary agents, thenmany more years may be required before the cu-mulative effects of differential mortality would berevealed in the form of survivorship bias.
Our results must be considered preliminary be-cause the number of modem samples (n = 6) wassmall. Nevertheless, our inability to detect signif-icant differences between modern and historicalchronologies was not caused by excessively largesample errors. Error estimates were in fact quitesmall, and it is doubtful they would improve withadditional sampling. We were also not able to sam-ple the exact stands used by Froelich et al. (1955),so we cannot rule out the possibility that similar-ities in modem and historical chronologies resultedfrom chance alone. At the same time, however,spatial errors in resampling could also explain why1951 growth at Kabetogama appeared to differ be-tween modern and historical chronologies. Actualdifferences between modern and historical chro-nologies could be even smaller than our estimatessuggest. More intensive sampling would undoubt-edly boost the strength of our analysis, althoughthere is a limit to the expected improvements whenthe precise locations of the historical plots are un-known.
More extensive sampling would also helpstrengthen our analysis. Initial data from Saskatch-ewan, Canada, are consistent with results reportedhere (Cooke 2001), suggesting that survivorshipbias is not a problem with trembling aspen. Ofcourse, outbreaks do vary in severity in time andspace (Daniel and Myers 1995). So it is possiblethat the outbreak of the 1950s was not severe
Survivorship Bias in Outbreak Reconstructions 35
enough to generate strong differential survivorshipin either Minnesota or Saskatchewan. Indeed, thiscould explain why different authors studying dif-ferent outbreaks in different areas reach differentconclusions regarding the impact of tent caterpillardefoliation on aspen survival.
Our findings suggest that survivorship bias maynot be a major impediment to the use of aspen ringwidths in tent caterpillar outbreak reconstruction.This implies that the trend toward increasing am-plitude of dips in aspen ring widths in the DraytonValley, Alberta, data (Figure 2a) may not be anartifact of survivorship bias. Does this then implythat outbreaks of forest tent caterpillar are there-fore having a greater impact now than they werejust a few decades ago? This is a critical propo-sition that we are investigating.
Although survivorship bias seems to be negli-gible in the case of tent caterpillars feeding on as-pen, the same may not be true in other herbivoresystems where stem mortality can be severe. SomeNorth American examples include spruce bud-worm feeding on balsam fir (MacLean and Piene1995), jack pine budworm (Choristoneura pinusFreeman) feeding on jack pine (Pinus banksianaLamb.) (Volney 1998), larch sawfly (Pristiphoraerichsonii [Htg.]) feeding on eastern larch (Larixlaricina [Du Roi] K. Koch) (Girardin et al. 2001),and gypsy moth (Lymantria dispar L.) feeding onoak (Quercus rubra L.) (Naidoo and Lechowicz2001). Here dendroecological reconstruction ofoutbreaks may be more precarious and the issueof survivorship bias should be addressed.
The matter is important because, as with the tentcaterpillars of Drayton Valley, Alberta, outbreakreconstructions of spruce budworm from whitespruce in eastern Canada (Blair 1983) and westernspruce budworm from Douglas -fir in the south-western United States (Swetnam and Lynch 1993)have revealed patterns of increasing outbreak se-verity over time. This is precisely the pattern ex-pected from survivorship bias. Notably, survivor-ship bias is not a concern for an outbreak recon-struction of Pandora moth (Coloradia pandoraBlake) from ponderosa pine (Pinus ponderosaLaws.) in Oregon because these data revealed atrend of decreasing severity of outbreaks over time
(Speer et al. 2001), which is the opposite patternthat one would expect from survivorship bias.
ACKNOWLEDGMENTS
We thank D.C. Blackford, G.M. Muggli -Millerand E. Hunt for field assistance and M.A. Albersand personnel of the Minnesota Department ofNatural Resources, Division of Forestry, for help-ing locate old aspen stands in the Kabetogama andCloquet Valley State Forests and for retrieving in-formation on past defoliation in Minnesota. Wethank T. Swetnam for commenting on an earlierdraft, and two anonymous reviewers for manyhelpful suggestions.
REFERENCES CITED
Barter, G. W., and D. G. Cameron1955 Some effects of defoliation of the forest tent cater-
pillar. Canada Dept. of Agric., For. Biol. Div., Bi-monthly Progress Report I1(6):í.
Batzer, H. O., A. C. Hodson, and A. E. Schneider1954 Preliminary results of an inquiry into the effects of
defoliation of aspen trees by the forest tent caterpillar.University of Minnesota, Agricultural ExperimentStation, Minnesota Forestry Notes No. 31.
Beach, G.1968 Forest Pest Newsletter No. 3. Minn. Dept. Agr., Div.
Plant Industry.1969 Forest Pest Newsletter No. 3. Minn. Dept. Agr., Div.
Plant Industry.1970 Forest Pest Newsletter No. 8. Minn. Dept. Agr., Div.
Plant Industry.1971a Forest Pest Newsletter No. 2. Minn. Dept. Agr., Div.
Plant Industry.1971b Forest Pest Newsletter No. 5. Minn. Dept. Agr., Div.
Plant Industry.1971c Forest Pest Newsletter No. 6. Minn. Dept. Agr., Div.
Plant Industry.Biais, J. R.
1983 Trends in the frequency, extent, and severity ofspruce budworm outbreaks in eastern Canada. Ca-nadian Journal of Forest Research 9:95 -105.
Candau, J. -N., V. Abt, and L. Keatley2002 Bioclimatic analysis of declining aspen stands in
northeastern Ontario. Ontario Forest Research Insti-tute, Forest Research Report No. 154.
Churchill, G.B., H. H. John, D. P. Duncan. and A. C. Hodson1964 Long -term effects of defoliation of aspen by the for-
est tent caterpillar. Ecology 45:630 -633.Cook, E. R., and K. Peters
1981 The smoothing spline: a new approach to standard-izing forest interior tree -ring width series for dendro-chronology. Tree -Ring Bulletin 41.45 -53.
36 COOKE, MILLER, and ROLAND
Cook, E. R., and R. L. Holmes1986 Program ARSTAN. Version 6.05P. Available online
at http:/ /www.ltrr.arizona.edu/pub /dpl/.Cooke, B. J.
2001 Interactions between climate, trembling aspen, andoutbreaks of the forest tent caterpillar in Alberta.PhD dissertation, University of Alberta, Edmonton,Alberta; 499 pp.
Daniel, C. J., and J. H. Myers1995 Climate and outbreaks of the forest tent caterpillar.
Ecography 18:353 -362.Duncan, D. P, and A. C. Hodson
1958 Influence of the forest tent caterpillar upon the aspenforests of Minnesota. Forest Science 4:71 -93.
Froelich, R., A. C. Hodson, A. E. Schneider, and D. P. Duncan.1955. Influence of aspen defoliation by the forest tent cat-
erpillar in Minnesota on the radial growth of asso-ciated balsam fir. University of Minnesota Agricul-tural Experiment Station, Minnesota Forestry NotesNo. 45.
Ghent, A. W.1958 Mortality of overstorey trembling aspen in relation to
outbreaks of the forest tent caterpillar and the sprucebudworm. Ecology 39:222 -232.
Girardin, M. P., J. Tardif, and Y. Bergeron2001 Radial growth analysis of Larix laricina from the
Lake Duparquet area, Quebec, in relation to climateand larch sawfly outbreaks. Ecoscience 8:127 -138.
Hildahl, V., and W. A. Reeks1960 Outbreaks of the forest tent caterpillar Malacosoma
disstria Hbn. and their effects on stands of tremblingaspen in Manitoba and Saskatchewan. The CanadianEntomologist 92:199 -209.
Hodson, A. C.1977 Some aspects of forest tent caterpillar population dy-
namics. In: Insect Ecology: Papers Presented in theA.C. Hodson Lecture Series, edited by H. M. Kul -man, and H. M. Chiang, pp. 5 -16. University of Min-nesota Agriculture Experiment Station, Tech. Bull.310.
Hogg, E. H.1999 Simulation of interannual responses of trembling as-
pen stands to climatic variation and insect defoliationin western Canada. Ecological Modelling 114:175-193.
Hogg, E. H., J. P. Brandt, and B. Kochtubajda2002 Growth and dieback of aspen forests in northwestern
Alberta, Canada, in relation to climate and insects.Canadian Journal of Forest Research 32:823 -832.
Hogg, E. H., and A. G. Schwarz1999 Tree -ring analysis of declining aspen stands in west -
central Saskatchewan. Canadian Forest Service,Northern Forestry Centre, Information Report NOR -X -359.
MacLean, D. A., and H. Piene1995 Spatial and temporal patterns of balsam fir mortality
in spaced and unspaced stands caused by spruce bud -worm defoliation. Canadian Journal of Forest Re-search 25:902 -911.
Minnesota Dept. Nat. Resources1974 Forest pest report.1975 Forest pest report.1976 Forest pest report.1977 Forest pest report.1978 Forest insect and disease report. Div. Forestry.1979 Forest insect and disease report. Div. Forestry.1980 Forest insect and disease report. Div. Forestry.1981 Forest insect and disease report. Div. Forestry.1989 Forest insect and disease report. Div. Forestry.1990 Forest insect and disease report. Div. Forestry.1992 Forest pest report 1991.
Naidoo, R., and M. J. Lechowicz2001 Effects of gypsy moth on radial growth of deciduous
trees. Forest Science 47:338 -348.Rose, A. H.
1958 The effect of defoliation on foliage production andradial growth of quaking aspen. Forest Science 4:335 -342.
Speer, J. H., T. W. Swetnam, B. E. Wickman, and A. Young-blood
2001 Changes in pandora moth outbreak dynamics duringthe past 622 years. Ecology 82:679 -697.
Swetnam, T. W., and A. M. Lynch1993 Multicentury regional -scale patterns of western
spruce budworm outbreaks. Ecological Monographs63:399 -424.
Swetnam, T. W., C. D. Allen, and J. L. Betancourt1999 Applied historical ecology: using the past to manage
for the future. Ecological Applications 9:1189 -1206.Veblen T. T., K. S. Hadley, M. S. Reid, and A. J. Rebertus
1991 Methods of detecting past spruce beetle outbreaks inRocky Mountain sub -alpine forests. Canadian Jour-nal of Forest Research 21:242 -254.
Volney, W. J. A.1998 Ten -year tree mortality following a jack pine bud -
worm outbreak in Saskatchewan. Canadian Journalof Forest Research 28:1784 -1793.
Wellington, W G., J. J. Fettes, K. B. Turner, and R. M. Belyea1950 Physical and biological indicators of the development
of outbreaks of the spruce budworm, Choristoneurafumiferana (Clem.). Canadian Journal of Forest Re-search 28:308 -331.
Witter, J. A.1979 The forest tent caterpillar (Lepidoptera: Lasiocam-
pidae) in Minnesota: a case history review. GreatLakes Entomologist 12:191 -197.
Received 15 February 2002; accepted 28 January 2003.
TREE -RING RESEARCH, Vol. 59(1), 2003, pp. 37-49
TREE RINGS AND WETLAND OCCUPATION IN SOUTHWESTGERMANY BETWEEN 2000 AND 500 BC: DENDROARCHAEOLOGY
BEYOND DATING IN TRIBUTE TO F. H. SCHWEINGRUBER
A. BILLAMBOZ
Landesdenkmalamt Baden -WürttembergArbeitstelle Hemmenhofen
Fischersteig 9Germany D -78343 Hemmenhofen
ABSTRACT
Within the framework of landscape and settlement archaeology, archaeological tree -ring data maycontain information on the interrelation between humans, climate and environment. This study uses datacollected through the systematic analysis and dendrochronological dating of timber from prehistoric lake-shore and bog sites in southwestern Germany spanning 2000 to 500 BC (i.e. Bronze and Early Iron Age).Crossdating various tree species associated with different ecosystems permits exploration of two areas:woodland development and human impact based principally on species determination from wood anatomyand dendrotypological analysis of a large sample series, and archaeological tree -ring data from a paleo-ecological and paleoclimatological perspective.
ZUSAMMENFASSUNG
Im Rahmen der Landschafts- und Siedlungsarchäologie, mit besonderem Augenmerk auf die Frageder Beziehungen zwischen Mensch, Klima und Umwelt, wird anhand systematischer Untersuchungen anBauhölzern prähistorischer Feuchtbodensiedlungen im südwestdeutschen Raum das Informationspotentialarchäologischer Holzserien- und Jahrringdaten beleuchtet. Mit der bronze- und früheisenzeitlichen Besied-lung wurde für diese Anwendung die Zeitscheibe zwischen 2000 und 500 v. Chr. ausgewählt. Ausgehendvon der Datierung bzw. dendrochronologischen Heterokonnexion verschiedener Holzarten der zonalen undazonalen Vegetation bezieht sich dieser Ansatz auf zwei Aspekte: einerseits wird aufgrund der holzanatom-ischen Serienbestimmung und der dendrotypologischen Analyse die Frage der Waldentwicklung unter men-schlichem Einfluß aufgegriffen. Andererseits werden die Jahrringdaten aus paläoökologischer und -klima-tologischer Sicht ausgewertet.
RÉSUMÉ
Dans le cadre de l'archéologie spatiale et environnementale, et plus spécialement dans l'optique desrelations entre l'homme, le climat et le milieu, le potentiel dendroarchéologique est mis en valeur par uneétude systématique de bois archéologiques et de leurs séries de croissance. Avec une période compriseentre 2000 et 500 avt J. C., l'application choisie à titre d'exemple se rapporte aux stations littorales etpalustres du sud -ouest de l'Allemagne relatives à l'âge du Bronze et au premier âge du Fer. A partir de ladatation croisée de différentes essences de la végétation zonale et azonale, l'approche s'organise sur deuxaxes principaux. D'une part, l'évolution de l'environnement forestier sous influence humaine est abordéesur la base de la détermination anatomique en série et de l'analyse dendrotypologique. D'autre part, lesséries de croissance sont évaluées dans une perspective paléoclimatologique et paléoécologique.
Keywords: Dendroarchaeology, southwestern German pile -dwellings, Bronze Age, heteroconnection,dendrotypology, woodland management, paleodendroecology.
Copyright CO 2003 by the Tree -Ring Society 37
38 BILLAMBOZ
INTRODUCTIONIn a previous paper (Billamboz 1996), I de-
scribed dendroarchaeological research on south-western German pile -dwellings that built upon thepioneering work of B. Huber from the middle ofthe last century (Huber and von Jazewitsch 1958).That paper focused on the relationship betweenhumans, timber and woodlands, and highlightedthree areas of investigation: (1) well replicateddendrochronological dating against the southernGerman oak master (Becker et al. 1985), (2) thestructural organization of settlements together withtheir construction and occupation history, and (3)woodland development in settlement surroundings.
This paper discusses new dendroarchaeologicaldevelopments in this area, with emphasis on theinteraction of climate, environmental conditionsand human behavior. Opportunity for enlarging theresearch program occurred together during the fi-nal publication of a large scale excavation andwithin the framework of a multidisciplinary pro-ject. The time period between 2000 and 500 BCspans the Bronze and Early Iron Age wetland oc-cupation in the area of study. Beyond the chro-nological work accomplished by crossdating dif-ferent tree species (heteroconnection), two broaderavenues are explored. One concerns the questionof timber supply and woodland development influ-enced by man, reconsidered in the light of dataprovided by wood anatomy analysis and dendro-typology (defined in Kaennel and Schweingruber(1995) as an attempt at sorting wood according todifferent parameters in order to reconstruct the agestructure and stand dynamic of the exploitedwoodland, see below). Another evaluates archae-ological tree -ring data from a paleodendroecolog -ical perspective, and uses the variations of radialgrowth to examine questions of evolution of cli-mate, environmental change and, possible relatedshifts of human wetland occupation. Finally, thispaper is presented as a tribute to E Schweingruber,who basically developed modern dendroecology(Schweingruber 1993). His work paved the way,providing inspiration for subsequent evaluation ofarchaeological tree -ring data and also for closerintegration of dendroarchaeological applications ingeneral tree -ring research.
DATING AS FIRST STEP:HETEROCONNECTIONS
In the dendroarchaeological field, dating is oftenthe ultimate goal of study. Yet within the scope ofdendroarchaeology beyond dating, chronologybuilding is only the first step. In Midwestern Eu-rope north of the Alps, where the most frequentdating success comes from the analysis of oak ma-terial, a further challenge has been to integrate dif-ferent species into the crossdating process. This isparticularly important for establishing a full pic-ture of the development of wetland occupation,considering the sparse representation of oak re-mains in some periods. So though initially appliedonly to archaeological and dating purposes, estab-lishing heteroconnections is turning out to be keyfor adding paleodendrecological perspectives tothe dendroarchaeological approach.
Material and Sampling
The wood investigated comes principally fromthe lakeshore sites at Lake Constance (German Bo-densee) and bog sites at Federsee in Upper Swa-bia, especially the well -defended sites at SiedlungForschner and Wasserburg Buchau, dated to theEarly/Middle Bronze Age and Late Bronze Age,respectively. Additionally, special structures liketrack -ways and fishing weirs provided substantialsample series (see the map, Figure 1, and the siteslisted in Table 1). In many situations, establishingheteroconnections has been made easier by thepreservation of clearly delimited structures usingtimbers from different tree species. This is the casein different sections of the palisade system at Sied-lung Forschner, in the respective lanes of the Mid-dle Bronze Age track -ways of Bad Buchau -Wuhr-straße, and in the v- shaped weirs of an extendedfishing system at Oggelshausen -Bruckgraben, thelatter site showing the first evidence for humanactivity during the Iron Age in the southwesternGerman wetlands (Köninger 1999).
Dendroarchaeological analysis at these sitesproceeded first by the systematic sampling of con-struction timbers, registering such information aswood working technique, tree species and suit-ability for tree -ring analysis, and subsequently bystoring all samples under wet conditions in plastic
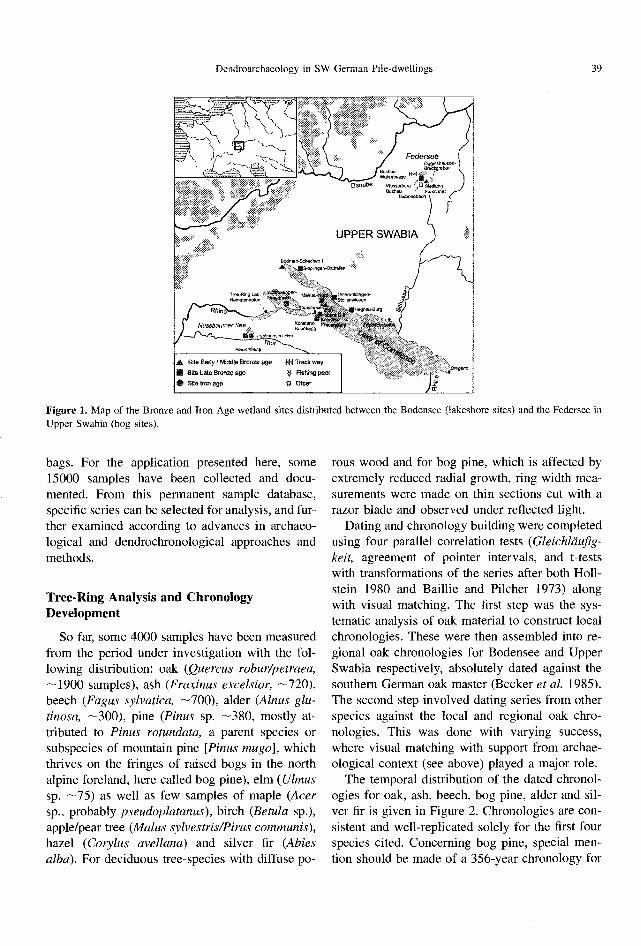
Dendroarchaeology in SW German Pile- dwellings 39
UPPER SWABIA
UnteruuMin9en-StdlenMesen
Nagnau Burg y
Nussbaumer See,.
A, Ste Early I Middle Bronze age 1}ç rSite Late Bronze age
Site Iron age
ÿ Fishing peer
O Other JFigure 1. Map of the Bronze and Iron Age wetland sites distributed between the Bodensee (lakeshore sites) and the Federsee inUpper Swabia (bog sites).
bags. For the application presented here, some15000 samples have been collected and docu-mented. From this permanent sample database,specific series can be selected for analysis, and fur-ther examined according to advances in archaeo-logical and dendrochronological approaches andmethods.
Tree -Ring Analysis and ChronologyDevelopment
So far, some 4000 samples have been measuredfrom the period under investigation with the fol-lowing distribution: oak (Quercus robur /petraea,---1900 samples), ash (Fraxinus excelsior, -720),beech (Fagus sylvatica, -700), alder (Alnus glu-tinosa, -300), pine (Pinus sp. -380, mostly at-tributed to Pinus rotundata, a parent species orsubspecies of mountain pine [ Pinus mugo], whichthrives on the fringes of raised bogs in the northalpine foreland, here called bog pine), elm (Ulmussp. --75) as well as few samples of maple (Atersp., probably pseudoplatanus), birch (Betula sp.),apple /pear tree (Malus sylvestris /Pirus communis),hazel (Corylus avellana) and silver fir (Abiesalba). For deciduous tree- species with diffuse po-
rous wood and for bog pine, which is affected byextremely reduced radial growth, ring width mea-surements were made on thin sections cut with arazor blade and observed under reflected light.
Dating and chronology building were completedusing four parallel correlation tests (Gleichläufig-keit, agreement of pointer intervals, and t -testswith transformations of the series after both Holl-stein 1980 and Baillie and Pilcher 1973) alongwith visual matching. The first step was the sys-tematic analysis of oak material to construct localchronologies. These were then assembled into re-gional oak chronologies for Bodensee and UpperSwabia respectively, absolutely dated against thesouthern German oak master (Becker et al. 1985).The second step involved dating series from otherspecies against the local and regional oak chro-nologies. This was done with varying success,where visual matching with support from archae-ological context (see above) played a major role.
The temporal distribution of the dated chronol-ogies for oak, ash, beech, bog pine, alder and sil-ver fir is given in Figure 2. Chronologies are con-sistent and well -replicated solely for the first fourspecies cited. Concerning bog pine, special men-tion should be made of a 356 -year chronology for
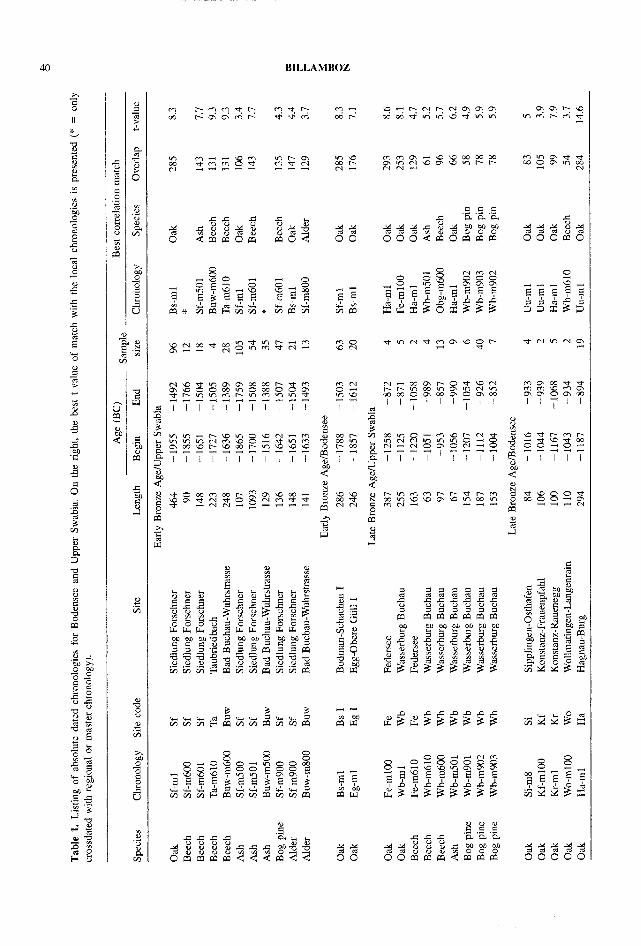
40 BILLAMBOZ
M r M M4 r 00 ,t r M7, 4 r N r N 0 0 0 01 O r 400 N CO CO M r 7 V' M 00 r 00 00 d' ,r-; V'1 ,c3, 7 V) h 4'1 M r M
M7, 7" .O M V) N CO 07 4 M M o\ \O 4 00 00 00 on V1 co of ,t4 M on O 7 M V Ñ N Co Ñ N O 01 VO v') N N 00 O CO v 00
Ç EU A ,r.: s., .s.; 0. Ó, O, .
.oC 5 . x .b X sd og 0ü ,o ,x .x .4o ¢wcPOw Ód ÓO ÓOÓmÓá mo ÓÓ0w0
g N M N OOO O' O g O_ O
D,
EE 8 E E E E E
4 Á c6g dcsri + V] xOx `x3
U
.N,N 00 Ñ Ó M ` N .-M- O 7 V' N V on O r d' N V' N
.-. .-+r.
ÚC4ÓÑOOOCCU,t V0 M N VI= .-i .rr.
I I I I I I I i l
W) l0 ,CVj V) Ñ b O V V1r.CO 00 l0 N 4 00 r V'1 .1.0- .0 10
1 1 1 1 1 1 1 1 1 1
O 0o M oc r " O1. 00Ot Ñ 71" O N
C Nh s..c)
I I
00 N00 V)ry oc
N Ñ
Nr-+ 00 0\ r O V N M O\ 00 d' d'
W OC Ó OC Ch00Ó QMi Ó OMi OC
1 1 1
I
1 1 I
I
1
UU
00 VO O M.0 N N d d N M rCDun01 :1.1
¡+ Ñ O O\ O N O O C CN_I I I I I I 1 I 1 I I I
dU
Oro vi ß ,r0 v- Oroon
aO W C C°M N r.+ ^- r.-i .r
!b--+ -. r-r, N
UVIw
ur à
''.0 " ,- c ,u W
b Áa o a a a a a U W M
U G C G C C S G , .0 04 4 R .a
.0 L .0
C
aC S a C .f C .0 . -- 0 0)0)0)0)00)(4 a o a a a . a "'U U o
aa w a as aa a a 0 a tw w w w w w wZ4 4
üc 2
,o ,, , ,u , w x ;o O oa o o o ó
C Q Gy a a a C q a t A U U -E -E Q fl c,,A ,ß 09 'd 0 ,D U ,) ,1) U a N aa a' PP a a 4 a ä t'A O h u h u u u u . í° c
'U.9 .2 y U .9 2 .2 .9
PaO,0
aCL O
c 0 0 63 'b .b -6 b b b b ,0 Ao 10 cd R C K ,1 v Cv,vvFvsnaa,ñ4 aaW w3w 71'9.,, o''
3 3 3vwF0.1c`"i0.a1
°°ggE E Eh o,aE 3 E E 3 E E
vvCo!'.) v a v ñavÑ4 w a
1,r1
W
,EuááW
P p A p p L Au°'-3w333333
óE
ó ° ó ó ó CE E E E E E E
.ó.ówap4 .fl333333
_g _g_11 E E E
ó6:1x x
u u u uu
'E "ç "
G
''C.-.1
G , w ..0 L 4 OPÓ,a X u5 .0 n n d '4 x x -4 i,3
° a° -5a
4 a .4 X -4 -4á áiOPáá cdQr<d ÓÓ ÓOPácñrádwP? 0Ó000
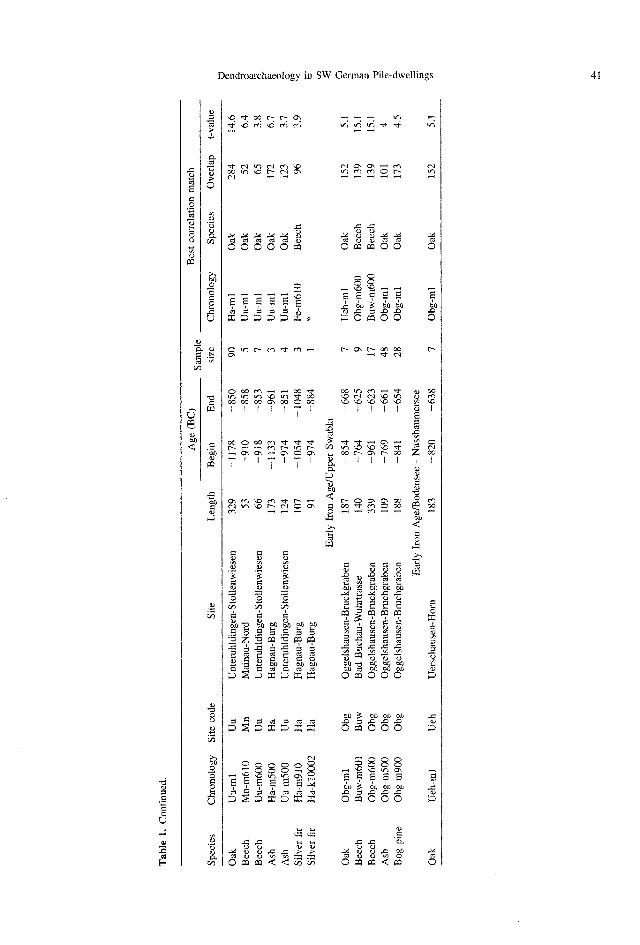
Tab
le 1
. Con
tinue
d.
Spec
ies
Chr
onol
ogy
Site
cod
eSi
teL
engt
h
Age
(B
C)
Sam
ple
size
Bes
t cor
rela
tion
mat
ch
Beg
inE
ndC
hron
olog
ySp
ecie
sO
verl
apt -
valu
e
Oak
Uu
-ml
Uu
Unt
eruh
ldin
gen-
Stol
lenw
iese
n32
9-1
178
-850
90H
a-m
lO
ak28
414
.6
Bee
chM
n -m
610
Mn
Mai
nau-
Nor
d53
-910
-858
5U
u-m
lO
ak52
6.4
Bee
chU
u -m
600
Uu
Unt
eruh
ldin
gen-
Stol
lenw
iese
n66
-918
-853
7U
u-m
lO
ak65
3.8
Ash
Ha
-m50
0H
aH
agna
u-B
urg
173
-113
3-9
613
Uu-
ml
Oak
172
6.7
Ash
Uu
-m50
0U
uU
nter
uhld
inge
n-St
olle
nwie
sen
124
-974
-851
4U
u-m
lO
ak12
33.
7
Silv
er f
irH
a -m
910
Ha
Hag
nau-
Bur
g10
7-1
054
-104
83
Fe-m
610
Bee
ch96
3.9
Silv
er f
irH
a- k
1000
2H
aH
agna
u-B
urg
91-9
74-8
84
Ear
ly I
ron
Age
/Upp
er S
wab
la
Oak
Obg
-m
lO
bgO
ggel
shau
sen
-Bru
ckgr
aben
187
-854
-668
7U
eh-m
1O
ak15
25.
1
Bee
chB
uw -
m60
1B
uwB
ad B
ucha
u -W
uhrt
rass
e14
0-7
64-6
259
Obg
-m60
0B
eech
139
15.1
Bee
chO
bg -
m60
0O
bgO
ggel
shau
sen
-Bru
ckgr
aben
339
-961
-623
17B
uw-m
600
Bee
ch13
915
.1
Ash
Obg
-m
500
Obg
Ogg
elsh
ause
n- B
ruch
grab
en10
9-7
69-6
6148
Obg
-ml
Oak
101
4
Bog
pin
eO
bg -
m90
0O
bgO
ggel
shau
sen-
Bru
chgr
aben
188
-841
-654
28O
bg-m
lO
ak17
34.
5
Ear
ly I
ron
Age
/Bod
ense
e -
Nus
sbau
mer
see
Oak
Ueh
-m
lU
ehU
ersc
haus
en-H
orn
183
-820
-638
7O
bg -
ml
Oak
152
5.1

42 BILLAMBOZ
St -m
3850 3750 3650 3550 3450 3350
Sf-15600 I Sf-Zkfm Ta-154{610
1u.Sr-m500
UpperSwabia
BodenseeBs -m
Eg-m1
Sites at Bodensee:
Buw 15600
Sf-m501
', Sf-m000 Buw_m500
'u- '4fk`v=
5f-m800 q I
'
y°c-eE.,trkrrerks:
' Buw m
Bs: Bodman-Schachen IEg: Egg-Obere Güll IHa:Hagnau-BurgKt Konstanz-FrauenpfahlKr:Konstanz-RaueneggMn:Mainau-NordSi: Sipplingen-OsthafenUeh: Uerschausen-Horn (Nu(Sbaumersee)Uu: Unteruhldingen-StollenwiesenWo: Wolimatingen-Langenrain
Sites in Upper Swabia:
Buw: Bad Buchau -WuhrstrasseFe: FederseeObg: Oggelshausen- BruckgrabenSf: Siedlung ForschnerTa: TaubriedbachWb: Wasserburg Buchau
3250
Oaki
Beech
Ash.
Bog pine
Alder
Oak
3150
m1ó0
Beech
Ash
Silver fir
3050 2950 2850 2750 2650 cal BP
Wb-m100
'Wb-m6Fe-15610 Wb-0600
0 g+n6W
0b5-0500.
Wb-m501
Wb-m901 wWb-15902
5,n8'' ídï ....e..
I Kf-m100
-
f,tavr=2Wb-0903
Kr-mt' i I Wo-m100
Uu
Ha-m500
41:y.)Mn-m610
Uu-m600
Uu-m500
Ha-k10002
-1900 -1800 -1700 -1600 -1500 -1400 -1300 -1200 -1100 -1000
Obg-0900
Ueh-mi
-900 -800 -700
Figure 2. Chronology and crossdating chart of different tree -species between 2000 and 600 BC. The curves are low -pass filteredafter Fritts (1976) and the horizontal line corresponds to the 1 -mm width on the y -axis. Details of each chronology are in Table 1.
Wasserburg Buchau, now absolutely dated 1207-852 BC, completing the original investigation byHuber (Huber and Holdheide 1942) and my for-mer dating on a relative scale (Billamboz 1996).Based on the resulting crossdating in general, it isdifficult at this time to provide a definitive assess-ment of dendrochronological suitability and reli-ability of each tree species because of high vari-ability in cambial age and record length of inves-tigated wood as well as in sample depth of chro-nologies. Therefore, the approach is still empiricalin character but as a first indication, the best match(t- value) with local chronologies is given in Table1 (a more detailed correlation against standard andregional chronologies as well as full presentationof cutting dates is in preparation by the author).Because samples with very few rings were includ-ed in the analysis (wood with 15 or more ringswere considered), speculation on a classic relation-ship between dated and undated material is worth-less. Much more significant, in my opinion, wasgoing beyond mere dating to creating a data poolfrom which specific series might be extracted ac-
cording to the different aspects of the dendroar-chaeological analysis developed here.
DEVELOPMENT OF WOODLAND ASINFLUENCED BY HUMANS
Independent of, but supplemental to other ar-chaeobotanical investigations (pollen, macrofos-sils), wood identification and dendrotypologicalanalysis combined with dendrochronological dat-ing of large sample series permit a temporal re-construction of woodland development and ex-ploitation.
Wood Anatomy and Timber Supply
Based on systematic wood identification, thedistribution of tree species throughout the occu-pation phases reveals changes in the strategies oftimber retrieval in relation to the tree species avail-able. Consider, for example, the composition oftree species used in two palisade systems at Sied-lung Forschner (3,444 wood samples analyzed).
Dendroarchaeology in SW German Pile- dwellings
These palisades date to 1767 -1766 BC (SF1a: thebeginning of the first phase of occupation) and to1511 -1504 BC (SF3: the last phase), respectively.To investigate potential timber sources, three mainecosystem groups in the settlement surroundings(Figure 3) have been reconstructed: 1) the hillsbordering the peat basin, covered by beech, whichaccording to the palynological standard diagram ofFedersee (Liese - Kleiber 1993), was dominant from3500 BC onwards; 2) the lower slopes, character-ized by colluvial deposits in the transitional stagebetween mineral soil and peat formation, withinwhich two types of forest were associated: hard-wood riverine -like forest (similar to the GermanHartholzaue in riparian situations) on the slopefringes with various tree species such as oak, elm,ash, lime and maple, and streamside ash /alderstands on the floor of the adjacent ditches; 3) thepeat basin itself, characterized by wetland birchand alder formations (German Birken- and Erlen-bruchwald) in its lowland part, and bog pinestands towards its southern end, where a raisedbog was probably in the early stages of develop-ment (Liese -Kleiber 1993). As shown in the tableaccompanying Figure 3, timber for SF1 was takenprincipally from the first two zones, whereas dur-ing SF3, settlers used more wetland species of thethird zone, such as alder and bog pine. This datasupports the long -term clearance trend occurringin the final stage of the Early Bronze Age, becausethe slope area bordering the peat basin, owing toits species diversity, was the most attractive zone,and hence first to be exploited for settlement ac-tivities. In the same way, the scarcity of oak atWasserburg Buchau, constructed primarily withbog pine, illustrates a more pronounced defores-tation of this area in the Late Bronze Age.
Dentrotypology, Structure of Crop andStand Dynamics
This documented shift in woodland exploitationis paralleled by the results of a second method Ihave previously termed dendrotypology (Billam-boz 1985 and 1992), which is a means of classi-fying timber using dendrological, dendrochrono-logical and techno -morphological criteria. Partic-ularly with large sample sets, as is the case with
43
oak in most of the investigated sites, single serieswith similar cambial age and growth trend are as-sembled into so- called local dendro -groups. Pre-senting the dated groups on the same time scaleallows insight into the age structure and dynamicof the exploited stands. For a more simplified il-lustration of dendrotypological results, a documen-tation system in triangular form was chosen, wherethe length of the group corresponding to the ap-proximate class of age is plotted against the av-erage growth rate (= mean ring width as ordinate).
As shown in Figure 4 (with theoretical modelsin part A), the phases of coppice where settlersused young wood is dominated by raised triangles,whereas thinning is characterized by more flat -ly-ing triangles. The eventual combination of bothhigh and flat triangles reflects a broken, unnaturaldistribution of age classes, suggesting such a cop-pice with standards as commonly applied in thepast historical times. The natural stand structure(as presented here, one representing minimal hu-man impact) is better illustrated by a more ho-mogeneous distribution of the triangle shapes ac-cording to the classes of age. This is particularlythe case at the beginning of occupation, when set-tlers first started clearing the natural forest. As aresult, a cycle -like development of woodland inthe settlement surroundings can be outlined forEarly and Late Bronze Age occupation respective-ly from the canopy state to the final thinningthrough intermediate stages of coppice.
This approach, the analysis of which is alreadylargely complete for the oak timbers, is extendableto other tree- species. It may be possible to addshorter sequences to the graph dated by othermethods, e.g. radiocarbon dating. This is particu-larly necessary for the short -lived wetland treespecies like poplar and willow, the dating of whichserve to highlight the phases of drying wetlandand associated afforestation.
ARCHAEOLOGICAL TREE -RING DATAFROM A PALEODENDROECOLOGICAL
PERSPECTIVE
Background of Approach
Particular attention is paid to the assumptionthat climate stimulates the environmental condi-
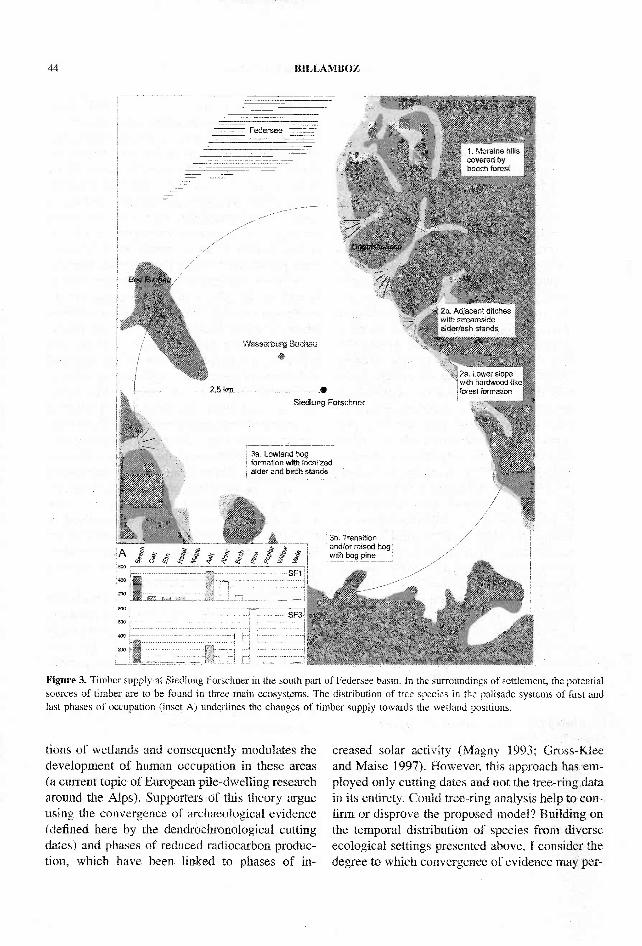
44 BILLAMBOZ
Federsee
1. Moraine hillscovered bybeech forest
2b. Adjacent ditcheswith streamsidealder /ash stands
Wasserburg Buchau
2,5 km
chner
2a. Lower slopewith hardwood -1ikforest formation
3a. Lowland bog .
formation with localizedalder and birch stands
3b. Transitionand /or raised bogwith bog pine
Figure 3. Timber supply at Siedlung Forschner in the south part of Federsee basin. In the surroundings of settlement, the potentialsources of timber are to be found in three main ecosystems. The distribution of tree species in the palisade systems of first andlast phases of occupation (inset A) underlines the changes of timber supply towards the wetland positions.
tions of wetlands and consequently modulates thedevelopment of human occupation in these areas(a current topic of European pile- dwelling researcharound the Alps). Supporters of this theory argueusing the convergence of archaeological evidence(defined here by the dendrochronological cuttingdates) and phases of reduced radiocarbon produc-tion, which have been linked to phases : of in-
creased solar activity (Magny 1993; Gross -Kleeand Maise 1997). However, this approach has em-ployed only cutting dates and not the tree -ring datainits entirety. Could tree -ring analysis help to con-firm or disprove the .proposed model? Building onthe temporal distribution of species from diverseecological settings presented above, I consider thedegree to which convergence of evidence may per-

Dendroarchaeology in SW German Pile-dwellings 45
4, Mean ringwidth(1/100 mm)
Sequence length of dendro-group
-2a°L-I- 100
LA
L
1. Canopystate
O 50 100
2. Coppice
Cycle
0 50
Young trees< 50 yr
3. Thinning:Coppice withStandards
young wood
Old trees> 200 yr
100 200J
3750 3550 3350 3150
Thinning(without coppice)
-1800 -1600 -1200
2950 2750 2550 cal BP;
-1000 -800
UpperSwabia
Figure 4. Dendrotypology in triangles. For a better understanding of woodland development related to age structure and standdynamic, results of dendrotypological sorting for oak material are presented in triangle forms. For each unit (= dendro-groupembracing series of equal cambial age and similar growth trend), mean ring width is plotted as ordinate against sequence length(corresponding to class of age in crop structure). Models related principally to mode of treatment are simulated in inset A. Thisway, different phases of woodland development, from canopy state to final thinning through phases of coppice, are enhanced forboth subregions of study.
mit the differentiation of factors that simultaneous-ly affect tree growth, site conditions and settlementpossibilities in wetland areas on both local andlarger scales.
Growth Trend and Single-Year Analysis
To approach this question, tree-ring data hasbeen evaluated in two ways. First, a growth trendanalysis was performed, with special emphasis onhigh and medium-frequency variations. In order toreduce the effects of segment-length curse (Cooket al. 1990), local subchronologies were built ac-cording to dendrotypological analysis. (Le. in re-lation to the cambial age of dated samples of re-specfive dendro-groups). After removing the high*frequency signal with the help of an 11-yr lowpass filter (Fritts 1976), variations of growth were
expressed as departures from the mean in units ofstandard deviation (Osborn et al. 1997). The subchronologies were calculated separately and plotted on the same axis for each tree-species (Figure5, Part A). Second, a single-year analysis was ap-plied, highlighting pointer years. For each tree-ring series, positive and negative pointer years aredefined as index values respectively > 1 and <-1 in a 5-yr running window (Cropper 1979). Foreach species, when the sum of pointer years ob-served in all specimens was at least 10 for a givendecade, the proportion of negative and positiveyears was calculated (and plotted in Figure 5C).
RESULTS AND DISCUSSION
The results of the analyses by both methods arecombined, together with the chronological frame-
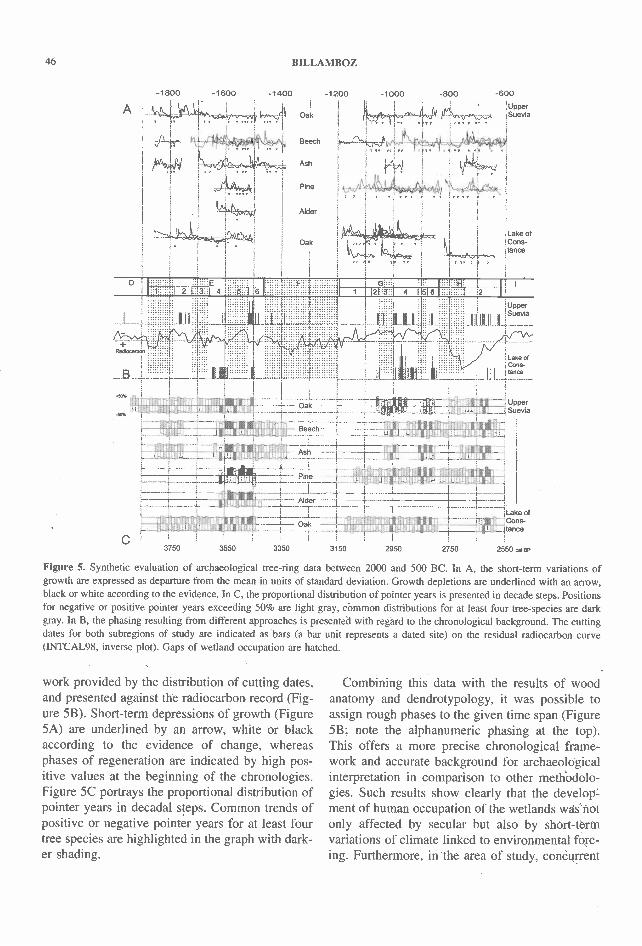
46 BILLAMBOZ
-1800 -1600 -1400 -1200 -9000 -800 -600
+ Su:Upper
Lake ofGons -¡tance
;UpperSuevia
lif
Lake ofCons-
: tance
=í UpperSuevia
tiitsIn
}Itil11 , :WM
IiFrl:fztlt :lititain
- t;Lake ofCons-
_ tance
2950 2750 2550 c4 BPC
3750 3550 3350 3150
Figure 5. Synthetic evaluation of archaeological tree -ring data between 2000 and 500 BC. In A, the short-term variations ofgrowth are expressed as departure from the mean in units of standard deviation. Growth depletions are underlined with an arrow,black or white according to the evidence. In. C, the proportional distribution of pointer years is presented in decade steps. Positionsfor negative or positive pointer years exceeding 50% are light gray, common distributions for at least four tree- species are darkgray. In B, the phasing resulting from different approaches' is presented with regard to the chronological background. The cuttingdates for both subregions of study are indicated as bars (a bar unit represents a dated site) on the residual radiocarbon curve(INTCAL98, inverse plot). Gaps of wetland occupation are hatched.
work provided by the distribution of cutting dates,and presented against the radiocarbon record (Fig-ure 5B). Short-term depressions of growth (Figure5A) are underlined by an arrow,` white or blackaccording to the evidence of change, whereasphases of regeneration are indicated by high pos-itive values at the beginning of the chronologies.Figure 5C portrays the proportional distribution ofpointer years in decadal steps. Common trends ofpositive or negative pointer years for at least fourtree species are highlighted in the graph with dark -er shading,
Combining this data with the results of woodanatomy and dendrotypology, it was possible toassign rough phases to the 'given time span (Figure5B; note the alphanumeric phasing at the top).This offers a more precise chronological frame-work and accurate background for archaeologicalinterpretation in comparison to other methodolo-gies. Such results show clearly that the develop-ment of human occupation of the wetlands was notonly affected by secular but also by short -termvariations of climate linked to environmental forc-ing. Furthermore, in the area of study, concurrent_
Dendroarchaeology in SW German Pile- dwellings
Bronze and Iron Age settlement development inboth bog and lakeshore sites as shown by the dis-tribution of cutting dates (the vertical bars in Fig-ure 5B) may suggest that the related factors wereacting beyond the local scale. At the present stateof evaluation, the following observations can behighlighted:
(1) Because of insufficient tree -ring data, phase D,which corresponds approximately to the firsthalf of Early Bronze Age (2200 -1800 BC),cannot be evaluated by dendrochronologicalheteroconnections. Nevertheless, a generallowering of lake levels in the North Alpineforeland is already postulated by other meth-ods (Magny 1993) and insufficient archaeolog-ical evidence is probably caused by erosion,or minimized sedimentation at that time.
(2) Phase E covers the second part of the EarlyBronze Age with alternating occupation ofwetlands in E2, E4 and E6. Although sub -phases E2 and E4 are characterized by wood-land regeneration, E6 corresponds to a periodof thinning (Figure 4). Between 1580 and1520 BC (sub -phase E5) a particular succes-sion of abrupt short -term changes of growthcan be found, which are also expressed incurve trends and proportional distribution ofpointer years for all investigated tree species.Accompanying this stronger signal of climate,this period is characterized by a reduction ofradiocarbon production and a lack of humanoccupation.Phase F corresponds to the well known MiddleBronze Age "pile- dwelling gap" around theAlps. This is also noted by an increase of ra-diocarbon production and by an advance ofAlpine glaciers (Magny 1993; Burga and Per -ret 1998). In the area of study, evidence forhuman activities in wetlands is only found inthe last two track -ways of Buchau- Wuhrstrasseat Federsee, constructed in 1435/34 BC and1389/88 BC, respectively.
(4) During the Late Bronze Age in Phase G, asearlier in Phase E, an alternation of human oc-cupation with short periods of abandonment(G3 and G5) is noted. These sub -phases arecharacterized by a stronger distribution of neg-ative pointer years.
(3)
(5)
47
Phase H, which spans the first half of IronAge, can be divided into two periods. The firstperiod (H1), between 850 and 750 BC, showsa strong increase of radiocarbon productionand no evidence for human wetland occupa-tion, which has been related to a major climatedeterioration on a global scale (Van Geel andMagny 2001). At Federsee, beech shows apersistent decline in growth at this time (Bil-lamboz 2002). The return to better conditionsin the second period (H2) is supported bywoodland regeneration and general release ofsubsequent tree growth. Cutting dates of pierlogs and cabin posts show repeated or nearlycontinuous fishing activities between 730 and620 BC on southern shores of the Federsee.This area was not covered by water during theEarly and Late Bronze Age occupation, sug-gesting a temporary lowering of the lake levelduring this period.
CONCLUSION AND PERSPECTIVES
Several conclusions and perspectives regardingdevelopment of dendrochronology as applied towetland archaeology emerge:
(1) The crossdating of different tree species fromvarying ecosystems is a suitable method forunderstanding the relationship between treegrowth, climate evolution, environmentalchange and human settlement patterns. Theevaluation of crossdated series is particularlyeffective at sorting related factors acting at dif-ferent scales, and it also offers consistent in-formation for comparison with other high -res-olution proxies. Despite the time -consumingnature of this application, efforts should bemade to build chronologies and develop het -eroconnections.
(2) Within the framework of wetland dendroar-chaeology, wetland tree species can provide uswith precise information about the short -termchanges of hydrological conditions and suit-ability for human occupation. Although thistask is more reliable for longer -lived species,particularly alder and bog pine, the use of oth-er dating methods (e.g. radiocarbon) for short-lived species (e.g. poplar and willow) could
48 BILLAMBOZ
(3)
help to expand the documentation of wetlandafforestation and the related woodland devel-opment.A major characteristic, and both a strength andweakness, of this approach is the unequal dis-tribution of dendroarchaeological tree -ringdata in space and time. In order to counter-balance the problem, a comparison with con-tinuous series from natural deposits in rivervalleys and at the timberline could be made.However, one should note that study of thedevelopment of riparian forests during themiddle and late Holocene has mainly depend-ed on wood collected from rather old treesfound in river deposits. The more largely dis-tributed timber series from prehistoric lake-shore settlements represent a unique collectionof harvested trees that mainly grew under sim-ilar ecological conditions in the woodland sur-rounding of lake basins. The high variabilityof cambial age in the trees of these collectionscould thus provide complementary informa-tion about structure and stand dynamics,modes of exploitation and, through disconti-nuities and changes in sample depth of the dat-ed series, about woodland development in thisvegetation belt.
(4) At this first stage of evaluation, the approachpresented should be considered mainly diag-nostic. For a further interpretation of the ob-served phenomena, a closer collaboration withdendroecology and other disciplines is needed.This is generally the case for dendroarchaeol-ogy related to pile -dwelling research, whichafter more than 30 years of investigation isstill principally used only for dating and re-solving archaeological questions. More bal-ance between fundamental and applied re-search is needed. There is a great opportunitynow for dendroarchaeology to provide precisereferences about human -environment relationsin the past and thus increase its contributionto issues of current interest in ecology.In the same way, the assessment of climate,which may have influenced both environmen-tal changes and adaptations of human settle-ment, should be made in closer cooperationwith climatologists and partners from others
(5)
disciplines devoted to earth and natural sci-ences. Particular attention should be paid tothe question of climate stability, which, per-haps more than the general aspects of warmingor cooling, was a precondition for extendedoccupation of the wetlands.
Finally, I would like to refer to Fritz Schwein-gruber who, at a dendroarchaeological meeting ineastern France 10 years ago (Charavines, France,February 1991) stated: "I think the time is overnow for both, archaeologists and historians, to sayto dendrochronologists `I want something dated'.Of course, we have to date, that's the principle ofdendrochronology. However, we have also to eval-uate the tree -ring data itself; because, as alreadyknown, it contains much more information ...."
ACKNOWLEDGMENTS
I thank Angelika Clemens, Carrie McEwan, Gil-lian Wallace and Maryanne Newton for the stylis-tic review of the English text as well as the re-viewers and editors for their major contribution tothe restructuring and improvement of earlier ver-sions of this paper.
The tree -ring laboratory in Hemmenhofen ispart of a unit within the Office for the Protectionof Monuments in Baden - Wuerttemberg dedicatedspecifically to wetland and underwater archaeolo-gy under leadership of H. Schlichtherle. The lab-oratory is responsible for the investigation of ar-chaeological wood remains in the county.
This study was conducted during the course ofthe final publication of the large scale excavationat Siedlung Forschner (leaders: E. Keefer and WTorke, within the framework of the research pro-gram "Siedlungsarchäologische Untersuchungenim Alpenvorland" supported by the GermanCouncil of Research -DFG). In conjunction, itwas involved in the project " Landschaftswandelam Übergang vom Subboreal zum Subatlantikumam Bodensee ", supported by the DFG as well asthe Swiss Council of Research (FNRS) as part ofthe research program " Geobiosphäre der letzten15 000 Jahre."
Dendroarchaeology in SW German Pile -dwellings 49
REFERENCES CITED
Baillie, M. G. L., and J. R. Pilcher1973 A simple crossdating program for tree -ring research.
Tree -Ring Bull. 33:7 -14.Becker, B, A. Billamboz, H. Egger, P. Gassmann, A. Orcel, Chr.Orcel, and U. Ruoff
1985 Dendrochronologie in der Ur- und Frühgeschichte.Die absolute Datierung von Pfahlbausiedlungen nör-dlich der Alpen im Jahrringkalender Mitteleuropas.Antiqua 11, Basel, 68 pp.
Billamboz, A.1985 Premières investigations dans le champ de pieux de
la station de Hornstaad -Hörnle I sur les bords du lacde Constance. In Berichte zu Ufer -und Moorsiedlun-gen Südwestdeutschland 2 edited by Landesdenk-malamt Baden -Württemberg. Materialhefte zur Vor -und Frühgeschichte in Baden -Württemberg 7:125-147.
Billamboz, A.1992 Tree -ring analysis in archaeodendrological perspec-
tive.The structural timber from the south -westernGerman lake dwellings. In Tree Rings and Environ-ment edited by T. S. Bartholin, B. E. Berglund, D.Eckstein & F H., Lundqua Report 34:34 -40.
Billamboz, A.1996 Tree -rings and pile dwellings in southwestern Ger-
many. Following in the steps of Bruno Huber. In TreeRings, Environment and Humanity edited by J. S.Dean, D. M. Meko, and T. W. Swetnam, Radiocar-bon, Tucson, Arizona: pp. 471 -483.
Billamboz, A.2002 Die dendrochronologische Heterokonnexion ver-
schiedener Holzarten am Beispiel der metallzeitlich-en Pfahlbausiedlungen Südwestdeutschlands. Aussa-gen aus paläoklimatischer und ökologischer Sicht.In Zum Stand der Anwendung der Dendrochronolo-gie in den Geowissenschaften edited by A. Bräuning.Stuttgarter Geographische Studien 133:13 -32.
Burga, C. A., and R. Perret1998 Vegetation und Klima der Schweiz seit dem jüngeren
Zeitalter, Ott Verlag Thun; 805 pp.Cook, E. R, K. R. Briffa, S. Shiyatov, and V. Mazepa
1990 The 'segment length curse' in long tree -ring chro-nology development for paleoclimatic studies. TheHolocene 5(2):229 -237.
Cropper, J. P.1979 Tree -ring skeleton plotting by computer. Tree -Ring
Bulletin 39:47 -54.Gross -Klee, E., and C. Maise
1997 Sonne, Vulkane und Seeufersiedlungen. Jahrbuchder schweizerischen Gesellschaft fir Ur- und Frü-hgeschichte 80:85 -94.
Fritts, H. C.1976 Tree Rings and Climate. Academic Press, New York;
567 pp.Hollstein, E.
1980 Mitteleuropäische Eichenchronologie. Trierer Gra-bungen und Forschungen XI. Mainz, Philipp von Za-bern; 273 pp.
Huber, B., and W Holdheide1942 Jahrringchronologische Untersuchungen an Hölzern
der bronzezeitlichen Wasserburg Buchau am Feder-see. Berichte der Deutschen Botanischen Gesell-schaft Band LX, Heft 5:261 -283.
Huber B., and W. von Jazewitsch1958 Jahrringuntersuchungen an Pfahlbauhölzern. Flora
146:445 -471.Kaennel, M., and F. H. Schweingruber
1995 Multilingual glossary of dendrochronology. Termsand Definition in English, German, French, Spanish,Italian, Portuguese and Russian, edited by WSL Bir-mensdorf, Berne, Stuttgart, Vienna, Haupt; 467 pp.
Köninger, J.1999 Oggelshausen- Bruckgraben -Ein saisonal bewohnter
Hechtfangplatz der frühen Eisenzeit im südlichenFederseeried. NAU (Nachrichtenblatt ArbeitskreisUnterwasserarchäologie) 6:47 -48.
Liese- Kleiber, H.1993 Pollenanalysen zur Geschichte der Siedlungsland-
schaft des Federsees vom Neolithikum bis ins aus-gehende Mittelalter. In Festschrift Zoller edited by C.Brombacher, S. Jacomet, and J. N. Haas. Disserta-tiones Botanicae 196, Berlin- Stuttgart: pp. 347 -368.
Magny, M.1993 Solar influences on Holocene climatic changes illus-
trated by correlations between past lake -level fluc-tuations and the 14C record. Quaternary Research 40:1 -9.
Osborn, Th., K. R. Briffa, and P. Jones1997 Adjusting variance for sample -size in tree -ring chro-
nologies and other regional mean -time series. Den -drochronologia 15:89 -100.
Schweingruber, F. H.1993 Jahrringe und Umwelt- Dendroökologie. Birmens-
dorf; 474 pp.Van Geel, B., and M. Magny
2001 Mise en évidence d'un forçage solaire du climat àpartir de données paléoécologiques et archéolo-giques: la transition Subboréal -Subatlantique. InEquilibres et Ruptures dans les écosystèmes durantles 20 derniers millénaires en Europe de l'Ouest.Durabilité et mutation. Actes du Colloque de Besan-çon, sep. 2000.
Received 20 December 2001; accepted 12 May 2003.
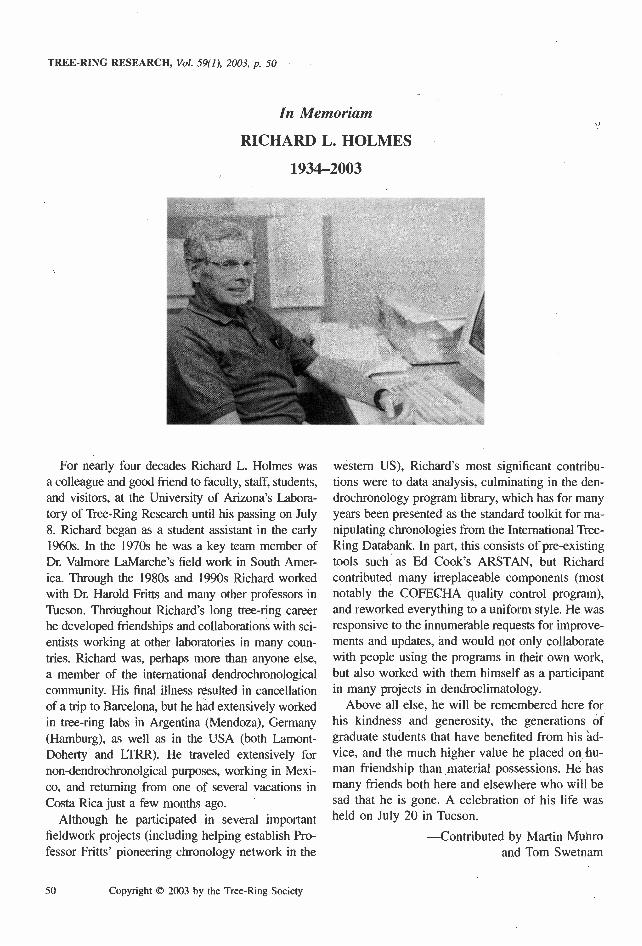
TREE-RING RESEARCH, Vol. 59(1); 2003, p. 50
In Memoriam
RICHARD L. HOLMES
1934-2003
For nearly four decades Richard L. Holmes wasa colleague and good friend to faculty, staff, students,and visitors, at the University of Arizona's Labora-tory of Tree- Ring Research until his passing on July8 Richard began as a student assistant in the early1960s. In the 1970s he was a key team member ofDr Valmore LaMarche's field work in South Amer-ica. Through the 1980s and 1990s Richard workedwith Dr. Harold Fritts and many other professors inTucson. Throughout Richard's long tree-ring careerhe developed friendships and collaborations with sci-entists working at other laboratories in many coun-tries. Richard was, perhaps more than anyone else,a member of the international dendrochronologicalcommunity. His final illness resulted in cancellationof a trip to Barcelona, but he had extensively worked .
in tree- ring labs in Argentina (Mendoza), Germany(Hamburg), as well as in the USA (both Lamont-Doherty and L ). He traveled extensively fornon- dendrochronolgical purposes, working in Mexi-co, and returning from one of several vacations inCosta Rica just a few months ago.
Although he participated in several importantfieldwork projects (including helping establish Pro-fessor Fritts' pioneering chronology network in the
50 Copyright © 2003 by the Tree -Ring Society
western US), Richard's most significant contribu-tions were to data analysis, culminating in the den -drochronology program library, which has for manyyears been presented as the standard toolkit for ma-nipulating chronologies from the International TreeRing Databank. In part, this consists of pre -existingtools such as Ed Cook's ARSTAN, but Richardcontributed many irreplaceable components (mostnotably the COFECHA quality control program),and reworked everything to a uniform style. He wasresponsive to the innumerable requests for improve-ments and updates, and would not only collaboratewith people using the programs in their own work,but also worked with them himself as a participantin many projects in dendroclimatology.
Above all else, he will be remembered here forhis kindness and generosity, the generations ofgraduate students that have benefited from his advice, and the much higher value he placed on hu-man friendship than material possessions. He hasmany friends both here and elsewhere who will besad that he is gone. A celebration of his life washeld on July 20 in Tucson.
-Contributed by Martin Munroand Tom Swetnam
TREE -RING RESEARCH
EDITORIAL POLICY AND INSTRUCTION FOR AUTHORS
Tree -Ring Research is devoted to papers dealing with the growth rings of trees and the applica-tions of tree -ring research in a wide variety of fields, including but not limited to archaeology, geol-ogy, ecology, hydrology, climatology, forestry, and botany. Papers involving research results, newtechniques of data acquisition or analysis, and regional or subject -oriented reviews or syntheses areconsidered for publication.
Two primary categories of scientific papers are considered. Articles should not exceed 5000words, or approximately 20 double- spaced typewritten pages, including tables, references, and anabstract of 200 words or fewer. All manuscripts submitted as Articles are reviewed by at least two ref-erees. Research Reports, which normally are not reviewed, should not exceed 1500 words or includemore than two figures. Research Reports address technical developments, describe well- documentedbut preliminary research results, or present findings for which the Article format is not appropriate.Book or monograph Reviews of 500 words or less are also considered.
Articles, Reports, and Reviews are published only in English. Abstracts of the Articles or Reportsmay be printed in other languages if supplied by the author(s) with English translations.
Submit four copies of the manuscript, including tables and legible copies of figures, and if pos-sible, the names of 3 possible reviewers with their contact information (postal and e -mail addresses,phone numbers) to:
Editor, Tree -Ring ResearchLaboratory of Tree -Ring ResearchBuilding 58University of ArizonaTucson, Arizona 85721USA
Follow the style and format of recent issues as guides to organization, units of measurement,abbreviations, and literature citation. Manuscripts must be typewritten double - spaced throughout(including the abstract, tables, captions, footnotes and references) on one side of approximately22 x 28 cm paper, with margins of at least 2.5 cm. A separate title page should include the title,author(s) affiliations(s) and mailing address(es). Include telephone numbers in the letter of transmit-tal. The abstract should appear on a separate page preceding the text. Number tables consecutivelyusing Arabic numerals; do not prepare tables with lines or boxes. Type tables (including titles) andfigure captions separately and place them at the end of the manuscript. Explanatory notes in tablesshould be numbered and referenced in table titles or footnotes. All illustrations, whether line draw-ings or photographs, are considered figures to be denoted by Arabic numerals and cited consecutive-ly in the text. Supply one copy (not exceeding 22 X 28 cm) of each illustration in a form suitable forphoto- reproduction. Lettering should be large enough to allow 50% reduction. Original line drawings,black -line positives on acetate, and glossy prints are acceptable. Authors are responsible for readingproofs carefully and noting all errors. Except for corrections, alterations or additions must be kept toan absolute minimum. Additional detailed instructions to authors are accessible online at:http://www.treeringsociety.org/TRS j ournal. html
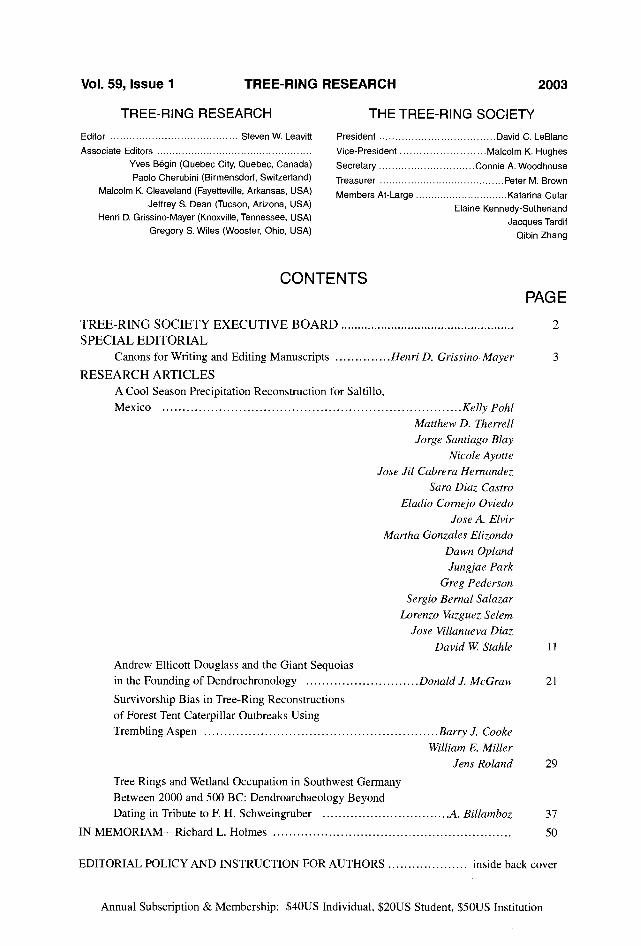
VoI. 59, Issue 1 TREE -RING RESEARCH 2003
TREE -RING RESEARCH
Editor Steven W. Leavitt
Associate EditorsYves Begin (Quebec City, Quebec, Canada)Paolo Cherubini (Birmensdorf, Switzerland)
Malcolm K. Cleaveland (Fayetteville, Arkansas, USA)
Jeffrey S. Dean (Tucson, Arizona, USA)Henri D. Grissino -Mayer (Knoxville, Tennessee, USA)
Gregory S. Wiles (Wooster, Ohio, USA)
THE TREE -RING SOCIETY
President David C. LeBlanc
Vice -President Malcolm K. Hughes
Secretary Connie A. Woodhouse
Treasurer Peter M. Brown
Members At -Large Katarina CufarElaine Kennedy -Sutherland
Jacques Tardif
Qibin Zhang
CONTENTSPAGE
TREE -RING SOCIETY EXECUTIVE BOARD 2SPECIAL EDITORIAL
Canons for Writing and Editing Manuscripts Henri D. Grissino -Mayer 3
RESEARCH ARTICLESA Cool Season Precipitation Reconstruction for Saltillo,Mexico Kelly Pohl
Matthew D. TherrellJorge Santiago Blay
Nicole Ayotte
Jose Jil Cabrera HernandezSara Diaz Castro
Eladio Cornejo OviedoJose A. Elvir
Martha Gonzales ElizondoDawn OplandJungjae Park
Greg PedersonSergio Bernal Salazar
Lorenzo Vazguez Selem
Jose Villanueva DiazDavid W Stahle 11
Andrew Ellicott Douglass and the Giant Sequoiasin the Founding of Dendrochronology Donald J. McGraw 21
Survivorship Bias in Tree -Ring Reconstructionsof Forest Tent Caterpillar Outbreaks UsingTrembling Aspen Barry J. Cooke
William E. MillerJens Roland 29
Tree Rings and Wetland Occupation in Southwest GermanyBetween 2000 and 500 BC: Dendroarchaeology BeyondDating in Tribute to F. H. Schweingruber A. Billamboz 37
IN MEMORIAM -Richard L. Holmes 50
EDITORIAL POLICY AND INSTRUCTION FOR AUTHORS inside back cover
Annual Subscription & Membership: $40US Individual, $20US Student, $SOUS Institution