TREE INVENTORY - fundecitrus.com.br · tree inventory . and orange production forecast for the...
96
Transcript of TREE INVENTORY - fundecitrus.com.br · tree inventory . and orange production forecast for the...

TREE INVENTORY
AND ORANGE PRODUCTION FORECAST FOR THE
2016-2017 SEASON OF THE SÃO PAULO AND
WEST-SOUTHWEST OF MINAS GERAIS CITRUS BELT
SECTION I
TREE INVENTORY
1 – INTRODUCTION ......................................................................................................................... 19
2 – METHODOLOGICAL PROCEDURES ..................................................................................... 21
3 – RESULTS ....................................................................................................................................... 25
SECTION II
ORANGE PRODUCTION FORECAST
1 – ORANGE PRODUCTION FORECAST FOR THE 2016-2017 SEASON ............................... 11
2 – OBJECTIVE SURVEY METHOD FOR ORANGE PRODUCTION FORECAST.................11
3 – TABELS ......................................................................................................................................... 18

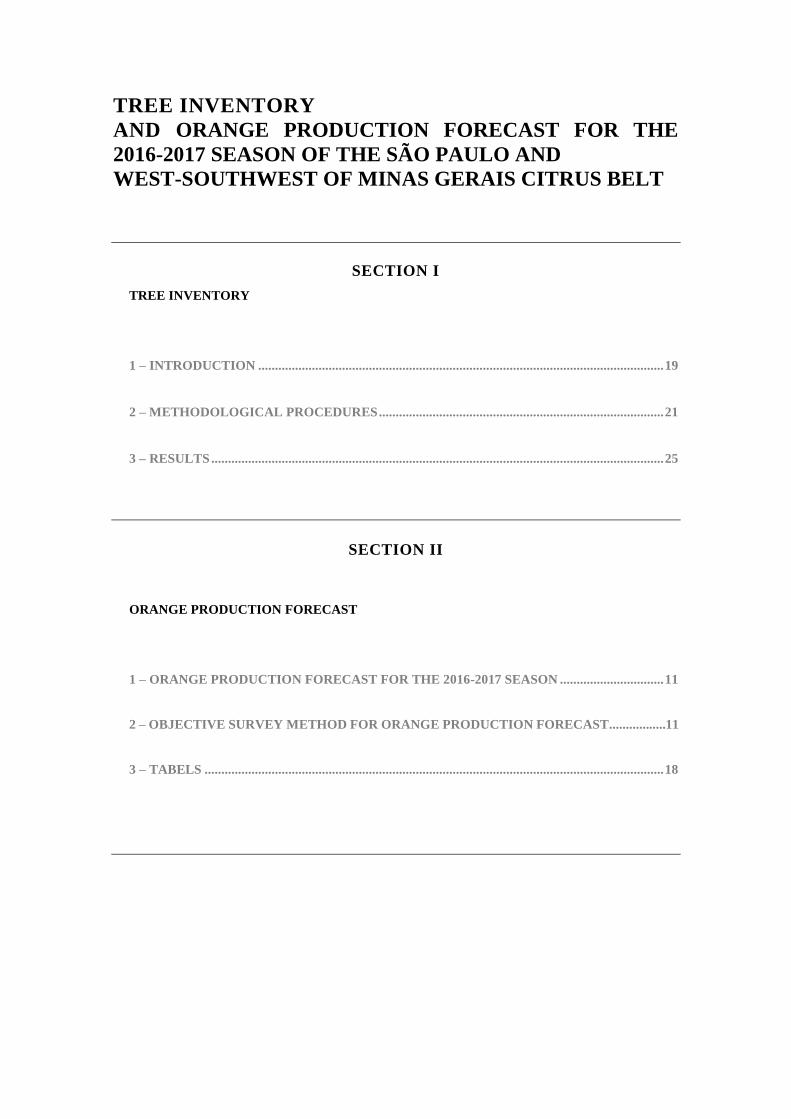
TREE INVENTORY OF THE SÃO PAULO AND WEST-SOUTHWEST OF MINAS GERAIS CITRUS BELT
SNAPSHOT OF GROVES IN MARCH/2016

TOTAL ORANGE TREES1 BY REGION
Total: 192.01 million trees
CHANGE OF TOTAL ORANGE TREES1
BETWEEN THE 2015 AND 2016 INVENTORIES
Abbre via
tions
Region
Total orange trees1 Abbre via
tions
Region
Total orange trees1
2015
inventory2
2016
inventory2 Change
2015
inventory2
2016
inventory2 Change
(million) (million) (%) (million) (million) (%)
TMG Triâng. Mineiro 12.25 12.14 -0.88% BEB Bebedouro 26.06 24.85 -4.65%
VOT Votuporanga 10.24 8.38 -18.24% ALT Altinópolis 5.41 5.39 -0.53% SJO S. J. do Rio Preto 10.77 11.32 5.11% MAT Matão 20.75 19.01 -8.36%
DUA Duartina 26.58 25.87 -2.65% PFE P.Ferreira 18.85 19.53 3.65% AVA Avaré 27.92 27.60 -1.15% BRO Brotas 8.96 9.33 4.18%
ITG Itapetininga 9.02 9.01 -0.06% LIM Limeira 21.04 19.57 -7.01% 1 Sweeet orange varieties: Hamlin, Westin, Rubi, Valencia Americana, Valencia Argentina, Seleta, Pineapple, Pera Rio, João Nunes,
Valencia sweeet orange, Natal e Valencia Folha Murcha. 2 Snapshot of groves in March.
(million)
5.00 – 9.99
10.00 – 15.99
16.00 – 19.99
20.00 – 25.99
> 25.00
(percent)
+6% – +3% +2% – -2% -3% – -6% -7% – -9% < -10%

TREE INVENTORY OF THE SÃO PAULO AND WEST-SOUTHWEST OF
MINAS GERAIS CITRUS BELT – SNAPSHOT OF GROVES IN MARCH/2016
Published on May 10, 20161
Forecast Dates
2016-2017 Season
March/2016 tree inventory: May 10, 2016
May forecast (orange production forecast): May 10, 2016
September forecast (1st orange production forecast update): September 12, 2016
December forecast (2nd orange production forecast update): December 12, 2016
February forecast (3rd orange production forecast update): February 10, 2017
April forecast (final orange production estimate): April 10, 2017
This is a living document, insofar as it serves to know and explore all the wealth of details of the citrus belt
and provide support to agents in the sector. In this regard, seeking to meet the demands of the citrus segment
and of the press, we reserve the right to enlarge, revise and expand on the information already published.
Therefore, we recommend always using the most recent publication available on the site
www.fundecitrus.com.br.
1 Year 2 – No 1 – May 10, 2016 (Portuguese version only)
Expanded and revised versions:
Year 2 – No 2 – May 17, 2016 (Portuguese version only)
Year 2 – No 3 – May 25, 2016 (Portuguese and English versions)

Prepared by FUNDECITRUS with cooperation from MARKESTRAT,
FEA-RP/USP and the Exact Sciences Department of FCAV/Unesp
Fundecitrus
Araraquara, São Paulo
2016
Av. Adhemar Pereira de Barros, 201 | Vila Melhado | CEP: 14807-040 | Araraquara | São Paulo | Brazil
www.fundecitrus.com.br
TREE INVENTORY OF THE SÃO PAULO AND WEST-
SOUTHWEST OF MINAS GERAIS CITRUS BELT
SNAPSHOT OF GROVES IN MARCH/2016
Catalogue card prepared by Fundecitrus Library
338.1
I624
Tree inventory of the São Paulo and West-
Southwest of Minas Gerais Citrus Belt:
snapshot of groves in March/2016 / Fundo de
Defesa da Citricultura... [et al.]. –
Araraquara,SP : Fundecitrus, 2016..
77 p.
ISSN: 2446-7723 (printed)
ISSN: 2446-7731 (online)
1. Agricultural census 2. Agribusiness 3. Citrus
Fruits 4. Orange I. Fundecitrus II. Markestrat III.
FEA-RP/USP IIII. FCAV/Unesp.
Use of any data from this publication should be duly credited to the providing organizations through citation
of their names, subject to the rules of use. This credit should be made in any publication or public
presentation that alludes to or mentions any data. No reproduction publication, distribution or reprinting
may be made of all or a substantial part for commercial purposes, except with the proper authorization of
the legal representatives of the organizations.

Lourival Carmo Monaco President of Fundecitrus
Antonio Juliano Ayres
General manager of Fundecitrus
Marcos Fava Neves
PES political-institucional and methodology coordinator, FEA-RP/USP full professor and member of the
administrative board of Markestrat
Vinícius Gustavo Trombin
PES executive coordinator and member of Markestrat
José Carlos Barbosa PES methodology analyst and full professor at the Exact Sciences Department of FCAV/Unesp
Supervision
Fernando Alvarinho Delgado, Fundecitrus
Renato Tadeu Rovarotto, Fundecitrus
Roseli Reina, Fundecitrus
Technical Committee
Aprígio Tank Junior, Agroterenas agriculture manager
Bruno Gustavo Zacarin, Citrosuco statistician
Franklin Behlau, Fundecitrus researcher
Hélio de Rezende Triboni, Louis Dreyfus Commodities manager
Ivaldo Sala, Coordinator of Fundecitrus Technology Transfer Department
Ivan Brandimarte, Cambuhy agriculture manager
Jackeline da Silva Carvalho, Louis Dreyfus Commodities senior researcher
Leandro Bonamichi Gois, Citrosuco product manager
Luiz Fernando Baenninger Catapani, citrus grower
Advisor
Fernando Engelberg de Moraes, lawyer

PREFACES
Dr. Lourival Carmo Monaco President of Fundecitrus
Fundecitrus, with the same responsibility and transparency, once again endeavors to estimate the production
of our citrus industry, following the original plan approved by the Board of Directors’ citrus growers. The
results of the estimates for the 2015-2016 season – from its first presentation to the April 2016 revision –
showed reliable numbers accepted by the links of the production chain. The dedication by those responsible
for data collection and processing is worth stressing due to their respect to the concepts defined by the
original plan and continuously assessed by the Technical Committee, always faithful to the reliability of
the process.
This report aims to expand the information about procedures, although it maintains the discretion of only
making available to all citrus growers and entities related to the citrus industry, in a simultaneous and public
manner, the results forecast in the first estimate so as to preserve this extensive work from any individual
or unilateral exploration of partial data. The final data of the 2015-2016 season revealed the adequacy of
the basic data, initially provided by growers as well as the industry, used in projections and which are
incorporated into proprietary databases, respecting the characteristics of the different growing regions and
wide access to interested parties.
The trust shown on the PES allows us to visualize its contribution to expand the actions to all links of the
orange production chain and increasingly drive towards good commercial practices, which is an old need
of the industry. This is a process to be worked on in order to provide citrus growing with enough strength
to face the threats of pests and diseases and to meet in a more complete manner the market demands for a
quality product produced in a sustainable manner.
Thus, we are living through another positive stage in the solidary work of the citrus agribusiness links. The
adopted model undoubtedly opens up opportunity windows for citrus growers regardless of their structure
and size. The numbers contained in this document are carefully kept in order to maintain information
confidentiality up to its disclosure, and we hope they become part of the culture embedded in the industry’s
day-to-day activities.
Antonio Juliano Ayres General manager of Fundecitrus
Providing the most accurate and useful information for the citrus grower is a responsibility that Fundecitrus
has undertaken as part of its mission since its foundation. The determination to carry out an ethical, precise
and professional work underpins the whole process of Production Forecast Research (PES) and further
consolidates another service provided to citrus growing by Fundecitrus, now in a new but strategically
important area. The result can be capitalized by citrus growers and all the links of the citrus growing chain
through unbiased, transparent and qualitative information, thus contributing to citrus growing
sustainability. The knowledge amassed by Fundecitrus experience along its almost 40 years is its biggest
asset, which we endeavor to share with all those interested in the advancement of citrus growing.
Marcos Fava Neves PES political-institucional and methodology coordinator, FEA-RP/USP full professor and member of the
administrative board of Markestrat
Despite the amazing efficiency and productivity gains in many sectors, the bumper agricultural income,
which grew from R$ 257 billion in 2004 to probably more than R$ 515 billion in 2016 and the leap in
exports, which went from US$ 20 billion in 2000 to roughly US$ 100 billion in the last few years, Brazilian
agriculture underwent some transformations, among which the considerable increase in production costs,
namely:
Labor cost (100-percent increase in dollars within 10 years) and increasing labor demands and issues;
Costs related to environmental aspects, growing demands and complex regulations;
Costs of crime, such as cargo thefts, property thefts, growing need of insurance and security at
properties and deplorable growth of organized crime in Brazil;
Costs of logistical operations, much beyond the possibilities and low capacity to store the Brazilian
crops;
Costs related to taxes, mainly due to tax complexity;
General costs of governmental bureaucracy, the time spent on excessive procedures, the government’s
excessive size and low efficiency;
Lower capital availability, with increased interest rates and difficult access to governmental credit;
Cost of corruption in state-owned companies and in the government, which encumbers the production
sector;
Inflation’s comeback;
Lack of proper understanding by the Judiciary Branch of the operation of the production chains and
the recent cases of inadequate interventions in citrus and sugarcane operations, in addition to problems
of invasions by native Indians, landless people and others which give rise to legal insecurity;
Loss of efficiency on the part of Regulating Agencies, as evidenced by ANVISA’s slow action to
approve procedures, thus hampering the access to important products both for planting and protecting
crops;
Increasing ideological cost, with movements against production, against companies and against profit
making, affecting Brazilian students and youngsters.
Public and private sectors need to vigorously work to reduce such costs aiming to make the country more
competitive and growers more capable of withstanding lower-price periods and continue to conquer greater
influence in the international market, thus generating dollars to drive Brazil’s growth. Failure to do so will
cause Brazil to run the risk of not becoming the winner in the unarguable increase of food consumption to
take place in the world.
Citrus growing once again gives Brazil an example by organizing, in a collective effort, the issue of crop
estimating. A consortium of organizations, led by reinvigorated Fundecitrus, involving USP, UNESP,
Markestrat, industrial companies and growers, solves an old problem of the industry, namely the shortage
of information, in a much clearer, more efficient manner than in the past. In this second year, the project
went forward with fewer drawbacks, a consequence of the learning curve, greatly decreasing conflicts,
meetings, friction, since it attained society’s widespread trust and support. Thus, we have all become more
competitive. Let’s proceed to our third year. Good crop to all of us!
Vinícius Gustavo Trombin PES executive coordinator and member of Markestrat
This second publication keeps bringing subsidies for citrus growers to assess their business amidst the
reality of the citrus industry published in this survey, but it goes beyond: the set of information provided
by means of the PES is not only current but also points to the future. The advanced view of the crop greatly
reduces the uncertainties of the scenario and brings transparency to the industry. However, nothing of this
kind would have occurred without the steady cooperation of citrus growers and all the professionals who
lent their service to this survey in the last two years. Together, they are giving a remarkable lesson as to
how to take greater advantage of the efficiencies arising from cooperation. Citrus growing is the top
beneficiary, since it is creating, by means of the consolidation of this initiative, a more thoughtful, sound,
and collaborative industry.
José Carlos Barbosa Methodology analyst and full professor at the Exact Sciences Department of FCAV/Unesp
In this second year of our participation in the team in charge of the methodology to be utilized to assess the
tree inventory of the citrus belt and orange production forecast for the state of São Paulo, we share our
knowledge with citrus growers, representatives of the processing companies and technicians who work in
the industry, perfect our methodologies and generate new knowledge that will be utilized in future works.
Additionally, we are forming two post-doctoral students. In this manner, our work in this project represents
a contribution from UNESP to the production sector, involving teaching, research and extension of services
to the community.

ACKNOWLEDGEMENTS
We are proud to present the update to the Tree Inventory and Orange Production Forecast for the 2016-
2017 Season of the São Paulo and West-Southwest Minas Gerais Citrus Belt. In order for this survey to be
published within the expected deadline, many people devoted their efforts, to whom we offer our most
sincere gratitude. Among them are citrus growers and the three orange juice processing companies
associated to Fundecitrus – Citrosuco, Cutrale and Louis Dreyfus – who opened the gates to their properties
and allowed their groves to be included in the sampling required for the whole process.
Another outstanding contribution comes from the São Paulo State Agricultural and Livestock Defense
Coordination (CDA-SP), reporting to the São Paulo State Agriculture and Supply Office, by supplying
information concerning their work throughout the state’s citrus growing areas.
We hereby acknowledge the fundamental role played by the members of the Technical Committee by
donating their time and precious knowledge needed for this survey. Also, the remarkable effort by all
Fundecitrus employees, who strived to meet deadlines and fulfill their tasks within the highest quality
standards, and within that group we include all outsourced workers who engaged themselves and combined
their efforts, especially the researchers and their aides and all those who participated in the stripping lab.
Our thanks to all radio and TV stations, specialized magazines and other media, for their respect, follow-
up and publicizing of the evolution of the Production Forecast Research (PES) along the months, treating
the issues with relevance and prominence.
Finally, our thanks to Fundecitrus Advisory Board for being the strongest encouragers of this research and
acting to foster the whole citrus industry by bringing transparency and reliable information to the entire
citrus production chain.

SUMMARY
1 – INTRODUCTION ......................................................................................................................... 19
1.1 – BUDGET ............................................................................................................................ 19
1.2 – OVERALL NUMBERS ...................................................................................................... 19
1.3 – DEFINITION OF TECHNICAL TERMS .......................................................................... 19
2 – METHODOLOGICAL PROCEDURES ..................................................................................... 21
2.1 – OBJECTIVE METHOD FOR MAPPING CITRUS GROVES .......................................... 21
2.2 – OBJECTIVE METHOD TO PREPARE THE TREE INVENTORY ................................. 21
2.3 – PERIOD OF FIELD RESEARCH OF THE 2016 INVENTORY ...................................... 21
2.4 – STRATIFICATION OF THE CITRUS BELT......................................................................22
3 – RESULTS ....................................................................................................................................... 25
3.1 – MAIN CONCLUSIONS ABOUT THE CITRUS INVENTORY ....................................... 25
3.2 – TABELS .............................................................................................................................. 27
3.3 – ABANDONED ORANGE GROVES ................................................................................. 77

LIST OF CHARTS
Chart 1 – Division of municipalities with citrus groves into sectors and regions ....................................... 23 Chart 2 – Division of oranges by group of varieties ................................................................................... 24 Chart 3 – Classification of grove planting years by age groups ................................................................. 24
LIST OF TABELS
Table 1 – All oranges: Grove areas by sector ............................................................................................ 27
Table 2 – Oranges: Area of groves by variety group ................................................................................. 27
Table 3 – Orange: Trees by sector and region ........................................................................................... 27
Table 4 – Oranges: Properties stratified by number of orange trees .......................................................... 28
Table 5 – Oranges: Orange blocks stratified by area of block ................................................................... 28
Table 6 – Oranges: Average age of mature groves by sector and region .................................................. 29
Table 7 – Oranges: Stratification of the entire holes of orange groves ...................................................... 30
Table 8 – Oranges: Area of young and mature groves by sector and region ............................................. 32
Table 9 – Oranges: Non-bearing and bearing trees by sector and region .................................................. 33
Table 10 – Oranges: Oranges: Area of groves by age, sector and region .................................................. 34
Table 11 – Oranges: Trees by age, sector and region ................................................................................ 35
Table 12 – Oranges: Grove area of early season varieties by sector and region ....................................... 36
Table 13 – Oranges: Trees of early season varieties by sector and region ................................................ 37
Table 14 – Oranges: Oranges: Grove area of mid-season and late varieties by sector and region ............ 38
Table 15 – Oranges: Trees of mid-season and late varieties by sector and region .................................... 39
Table 16 – Oranges: Grove area by age, region and variety – North Sector ............................................. 40
Table 17 – Oranges: Trees by age, region and variety – North Sector ...................................................... 41
Table 18 – Oranges: Grove area by age, region and variety – Northwest Sector ...................................... 42
Table 19 – Oranges: Trees by age, region and variety – Northwest Sector ............................................... 43
Table 20 – Oranges: Grove area by age, region and variety – Central Sector ........................................... 44
Table 21 – Oranges: Trees by age, region and variety – Central Sector .................................................... 45
Table 22 – Oranges: Grove area by age, region and variety – South Sector ............................................. 46
Table 23 – Oranges: Trees by age, region and variety – South Sector ...................................................... 47
Table 24 – Oranges: Grove area by age, region and variety – Southwest Sector ...................................... 48
Table 25 – Oranges: Trees by age, region and variety – Southwest Sector ............................................... 49
Table 26 – Oranges: Grove areas by sector and variety ............................................................................ 50
Table 27 – Oranges: Trees by sector and variety ....................................................................................... 51
Table 28 – Oranges: Grove areas by planting year .................................................................................... 52
Table 29 – Oranges: Trees by planting year .............................................................................................. 53
Table 30 – Oranges: Grove areas by sector and planting year .................................................................. 54
Table 31 – Oranges: Trees by sector and planting year ............................................................................. 55
Table 32 – Oranges: Grove area of early season varieties by planting year .............................................. 56
Table 33 – Oranges: Trees of early season varieties by planting year ....................................................... 57
Table 34 – Oranges: Grove area of mid-season and late season varieties by planting year ...................... 58
Table 35 – Oranges: Trees of mid-season and late season varieties by planting year ............................... 59
Table 36 – Oranges: Density planting of mature and young groves by sector and region ........................ 60
Table 37 – Oranges: Density planting of mature and young groves by variety and maturation stage ....... 61
Table 38 – Oranges: Density planting of young groves by variety and region .......................................... 62
Table 39 – Oranges: Density planting of mature groves by variety and region ........................................ 63
Table 40 – Oranges: Density planting of groves younger than 11 years by variety and region ................ 64
Table 41 – Oranges: Density planting of groves older than 10 years by variety and region ..................... 65
Table 42 – Oranges: Density planting of groves by planting year ............................................................ 66
Table 43 – Oranges: Area of groves irrigated, non-irrigated or without information by sector and region 67
Table 44 – Oranges: Area of groves irrigated, non-irrigated or without information by variety ................ 68
Table 45 – Oranges: Area of groves irrigated, non-irrigated or without information by age groups ......... 69
Table 46 – Oranges: Area of irrigated groves by irrigation method .......................................................... 69
Table 47 – Oranges: Area of groves removed by sector and region .......................................................... 70
Table 48 – Oranges: Area of groves removed by variety .......................................................................... 70
Table 49 – Oranges: Area of groves removed by age ................................................................................ 71
Table 50 – Oranges: Removal rate stratified by number of orange trees .................................................. 71
Table 51 – Oranges: Intention to reoccupy the area of removed groves, by grove size ............................ 71

18 18
Table 52 – Oranges: Dead trees by sector and region ............................................................................... 72
Table 53 – Oranges: Dead trees by variety ................................................................................................ 72
Table 54 – Oranges: Dead trees by age ..................................................................................................... 73
Table 55 – Oranges: Vacancies by sector and region ................................................................................ 74
Table 56 – Oranges: Vacancies by variety ................................................................................................ 74
Table 57 – Oranges: Vacancies by tree age group ..................................................................................... 75
Table 58 – Oranges: Municipalities with groves by sector and region ....................................................... 76
Tabel 59 – Oranges: Area of abandoned groves by sector and region ....................................................... 77

19
1 – INTRODUCTION
This publication presents the results of the second study of the tree inventory conducted by Fundecitrus
with the cooperation of Markestrat, FEA-RP/USP and the Exact Sciences Department of FCAV/Unesp,
during the period from January/2016 to May/2016 to update the information concerning orange groves.
Fundecitrus was responsible for performing all the activities involving gathering data in the field,
laboratory, and processing this information. Professor José Carlos Barbosa, of the Exact Sciences
Department of FCAV/Unesp, assumed responsibility for the analysis of the methodologies. Markestrat,
through Vinícius Gustavo Trombin was in charge of project governance, and Professor Marcos Fava Neves
from FEA-RP/USP contributed with the political, institutional and methodological coordination.
Created since the previous crop season, the Technical Committee, made up of citrus growers,
representatives from orange juice processing companies, faculty members, Fundecitrus researchers and
supervisors, continued with their commitment to follow up on the activities carried out by PES and propose
operating enhancements.
The results compiled from the inventory, obtained throughout the research, were kept restricted, until the
date of this publication, only to the professionals connected to Fundecitrus, such as Fundecitrus general
manager, PES supervisors and service providers specifically hired for the project, all of whom subject to
terms of confidentiality regarding PES information until its public disclosure, pursuant to the confidentiality
agreement executed between each one of them and Fundecitrus. Regarding antitrust practices, all of them
were complied with throughout all the work phases, through the adoption of the measures necessary to
prevent any sharing of individual information with a competitive content, among the orange juice
companies members of Fundecitrus, and between these and the citrus growers.
1.1 – BUDGET
On May 27, 2015, the Fundecitrus Advisory Board decided to conduct this study, having approved a budget
of R$ 5.013 million, of which 57% refers to expenses for the technical and administrative staff, labor related
charges, travel, accommodations, meals, etc., 24% allocated for travel, accommodations, meals and
maintenance, and the remaining 20% for materials, stripping indemnities and others. This budget provides
the financial support required for the activities scheduled until May 31, 2016.
1.2 – OVERALL NUMBERS
127 professionals directly involved in the study;
Field personnel: 39 agents, 51 field assistants.
Laboratory personnel: 33 assistants.
Office personnel: 1 coordinator and 3 supervisors.
More than 476 thousand kilometers covered;
Accumulated distance when counting 5% of citrus blocks to update the inventory: 226,899 km.
Accumulated distance travelled for stripping: 249,110 km.
1.3 – DEFINITION OF TECHNICAL TERMS
Citrus belt: region in Brazil containing the highest concentration of groves dedicated to commercial orange
production, including municipalities in the state of São Paulo as well as some municipalities of Minas
Gerais located in the West and Southwest regions of this state.
Grove: rural property covering a continuous area (there may be physical interruptions such as roads or
waterways) held by the same landowner, containing at least 200 citrus trees. There may be areas in the same
grove used for another purpose, such as raising other crops or livestock.
Block: fraction or section of a grove separated by, highways, rows, turn-rows (endrows) or other means,
generally with a width greater than the spacing between rows.
Bearing tree: tree planted in 2013 or in previous years.

20
Non-bearing tree: tree planted in 2014 or 2015 that has not yet begun to produce.
Dead tree: defoliated tree with at least 75% of dried branches, with no evidence of recovery.
Vacancy: empty space in the planting row which should be occupied by a citrus tree, according to the
spacing between plants adopted when implementing the block.
Hole: central point of the space occupied by each tree (plant area), where the soil is dug and prepared to
accommodate a seedling; point on the planting alignment where potentially there is a tree.
Young grove: grove implemented in 2014 or 2015. Groves implemented in 2016 were not included in this
inventory since the data collection in the field ended in the first quarter of the year in question.
Mature grove: grove implemented in 2013 or in previous years.
Grove removed: area where citrus trees have been eliminated, possibly covering the whole block or just
part of it.
Box: one orange box is equivalente to 40.8 kg or 90 lb.
Hectare: one hectare is equivalente to 2.4710439 US acres.
Kilometer: one kilometer is equivalente to 0.621371192 mile.

21
2 – METHODOLOGICAL PROCEDURES
2.1 – OBJECTIVE METHOD FOR MAPPING CITRUS GROVES
The first mapping of groves carried out by Fundecitrus used orthorectified, georeferenced high-definition
images collected by satellites Pleiades 1A and 1B from French operator Airbus Defence and Space from
May to October 2014. The georeferenced mapping was performed by research agents in situ, that is, in
person at each of the citrus properties, located in the 349 municipalities contained in the 152,000 km2 of
images, between October 27, 2014 and March 6, 2015.
The data gathered from each block were: area occupied solely by the trees, spacing, variety, planting year
and irrigation method. Only for a small portion of the properties which did not allow access to them were
the data estimated from remote sensing and statistical inference. Such volume of data was encrypted and
recorded into Fundecitrus Geographic Information System, making up the primary base on March 6, 2015,
which was preserved for use in future updates. At this registration stage, no information was collected that
could identify the owner or the grove by name, in order to protect the privacy of the citrus grower.
2.2 – OBJECTIVE METHOD TO PREPARE THE TREE INVENTORY
In order to generate the inventory published in 2015 and those for subsequent years, 5% of the blocks in
the primary base (2015) are randomly chosen to be visited and have their holes classified and quantified
into four categories: bearing trees, non-bearing trees, dead trees and vacancies. However, if this random
choice finds removed blocks, their areas are used to calculate the proportion of removal in the sample. Such
proportion, called removal rate, is applied to the primary base. The same calculation is made if abandoned
blocks are found. After applying those two rates to the primary base, one obtains the estimated area
occupied by groves in the current season. That new area multiplied by the tree density of the primary base
updates its amount of holes. These in turn are corrected using the index generated from the comparison
between the amount of holes found in the sample and its respective amount in the primary base. To these
holes one applies the indices of bearing trees, non-bearing trees, dead trees and vacancies, aiming to
determine the new tree inventory.
Blocks are chosen randomly using the stratified proportional sampling technique. The stratification
variables are: 12 regions, five orange variety groups and four age groups, totaling 240 strata. Details of the
variables are found in item 2.4 – Stratification of the Citrus Belt.
In all properties visited for the sample, one verifies the existence of groves implemented after the visit by
the research agent as of the 2015 mapping which gave rise to the primary base. The index of new plantings
is created by variety from the proportion between the added area and the respective total area of the variety
on the property. Such indices by variety are extrapolated to their regions. The result of such sampling can
be ascertained vis-à-vis other data sources. In the 2016 inventory, for instance, a comparison was made
between the data provided by the São Paulo State Agricultural and Livestock Defense Coordination (CDA-
SP), reporting to the São Paulo State Agriculture and Supply Office, and the amount of citrus seedlings
marketed authorized for plant transportation in the State of São Paulo as of March 2015.
The method further contemplates the survey of intended reoccupation of removed groves. If the intention
is to replant with citrus, the survey must go deeper in terms of type: orange, lemon/acid lime, or tangerine.
Finally, the entire field process is audited to evaluate the quality of the collected data.
2.3 – PERIOD OF FIELD RESEARCH OF THE 2016 INVENTORY
In 2016, the period of visits to the 5-percent randomly chosen blocks was concentrated between February
1, 2016 and March 18, 2016. The data collected during that period and further processed gave rise to the
Tree Inventory of the São Paulo and West-Southwest Minas Gerais Citrus Belt – Snapshot of Groves in
March/2016.
22
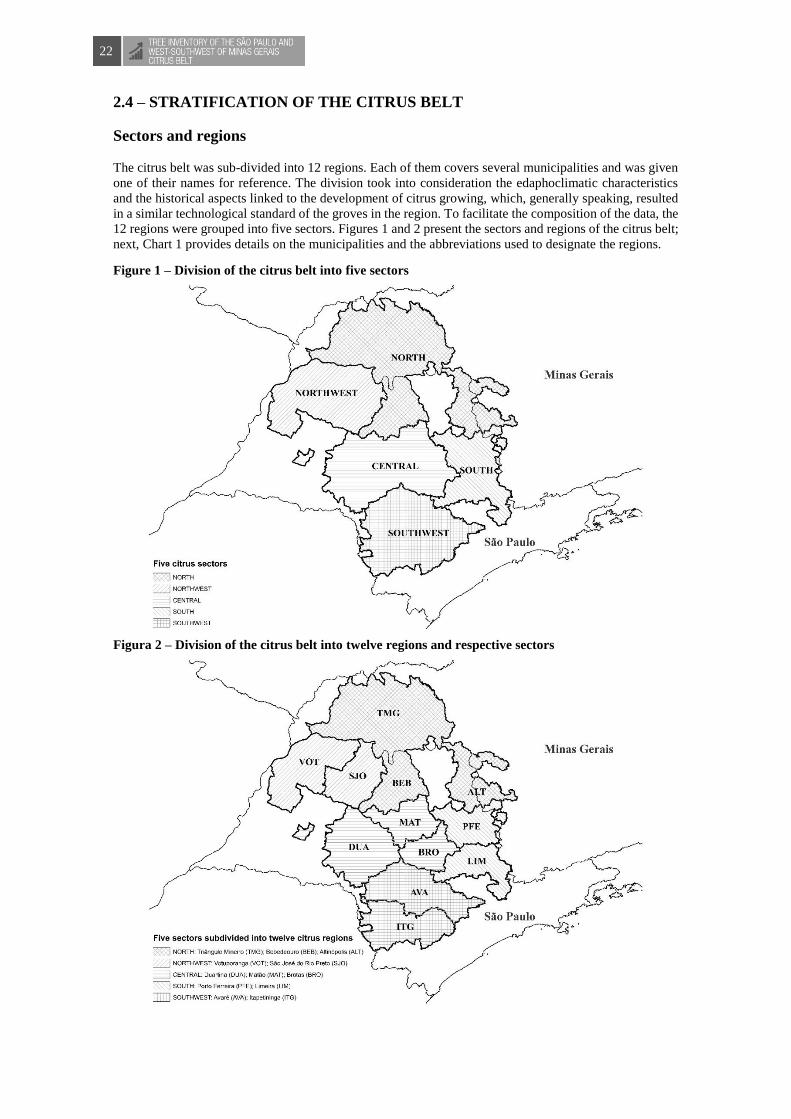
2.4 – STRATIFICATION OF THE CITRUS BELT
Sectors and regions
The citrus belt was sub-divided into 12 regions. Each of them covers several municipalities and was given
one of their names for reference. The division took into consideration the edaphoclimatic characteristics
and the historical aspects linked to the development of citrus growing, which, generally speaking, resulted
in a similar technological standard of the groves in the region. To facilitate the composition of the data, the
12 regions were grouped into five sectors. Figures 1 and 2 present the sectors and regions of the citrus belt;
next, Chart 1 provides details on the municipalities and the abbreviations used to designate the regions.
Figure 1 – Division of the citrus belt into five sectors
Figura 2 – Division of the citrus belt into twelve regions and respective sectors

23
Chart 1 – Division of municipalities with citrus groves into sectors and regions Sector and number of
municipalities
Region (abbreviation) and number of municipalities
Municipalities
North
73 municipalities
Triângulo Mineiro (TMG),
the West region of Minas Gerais
16 municipalities
Campina Verde, Campo Florido, Canápolis, Comendador Gomes, Conceição
das Alagoas, Frutal, Gurinhatã, Itapagipe, Ituiutaba, Iturama, Monte Alegre de Minas, Planura, Prata, São Francisco de Sales, Uberaba, Uberlândia
Bebedouro (BEB)
35 municipalities
Ariranha, Barretos, Bebedouro, Cajobi, Catanduva, Catiguá, Colina,
Colômbia, Elisiário, Embaúba, Guaraci, Ibirá, Irapuã, Itajobi, Marapoama, Monte Azul Paulista, Novais, Olímpia, Palmares Paulista, Paraíso,
Pindorama, Pirangi, Pitangueiras, Sales, Santa Adélia, Severínia, Tabapuã,
Taiaçu, Taiúva, Taquaral, Terra Roxa, Uchoa, Urupês, Viradouro, Vista Alegre do Alto
Altinópolis (ALT)
22 municipalities, of which 13 are located in São Paulo
and 9 in the Southwest
region of Minas Gerais
Altinópolis, Batatais, Brodowski, Cajuru, Cássia dos Coqueiros, Cristais
Paulista, Delfinópolis, Fortaleza de Minas, Franca, Ibiraci, Igarapava, Jacuí, Jeriquara, Monte Santo de Minas, Nova Resende, Patrocínio Paulista,
Pedregulho, Restinga, Santo Antônio da Alegria, São Pedro da União, São
Sebastião do Paraíso, São Tomás de Aquino
Northwest 91 municipalities
Votuporanga (VOT) 55 municipalities
Álvares Florence, Américo de Campos, Andradina, Aparecida d’Oeste, Aspásia, Auriflama, Cardoso, Dirce Reis, Dolcinópolis, Estrela d’Oeste,
Fernandópolis, General Salgado, Guaraçaí, Guarani d’Oeste, Guzolândia,
Indiaporã, Jales, Macedônia, Marinópolis, Meridiano, Mesópolis, Mira Estrela, Mirandópolis, Murutinga do Sul, Nova Canaã Paulista, Nova
Castilho, Ouroeste, Palmeira d’Oeste, Paranapuã, Parisi, Pedranópolis,
Pereira Barreto, Pontalinda, Pontes Gestal, Populina, Riolândia, Rubinéia, Santa Albertina, Santa Clara d’Oeste, Santa Fé do Sul, Santa Rita d’Oeste,
Santa Salete, Santana da Ponte Pensa, Santo Antônio do Aracanguá, São
Francisco, São João das Duas Pontes, São João de Iracema, Sud Mennucci, Suzanápolis, Três Fronteiras, Turmalina, Urânia, Valentim Gentil, Vitória
Brasil, Votuporanga
São José do Rio Preto (SJO)
36 municipalities
Adolfo, Altair, Bady Bassitt, Bálsamo, Cedral, Cosmorama, Floreal,
Guapiaçu, Icém, Ipiguá, Jaci, José Bonifácio, Macaubal, Magda, Mendonça, Mirassol, Mirassolândia, Monções, Monte Aprazível, Neves Paulista,
Nhandeara, Nipoã, Nova Aliança, Nova Granada, Onda Verde, Orindiúva,
Palestina, Paulo de Faria, Planalto, Poloni, Potirendaba, São José do Rio
Preto, Tanabi, Ubarana, União Paulista, Zacarias
Central
81 municipalities
Matão (MAT)
22 municipalities
Américo Brasiliense, Araraquara, Bariri, Boa Esperança do Sul, Borborema,
Cândido Rodrigues, Fernando Prestes, Gavião Peixoto, Ibitinga, Itajú,
Itápolis, Jaboticabal, Matão, Monte Alto, Motuca, Nova Europa, Novo Horizonte, Rincão, Santa Ernestina, Santa Lúcia, Tabatinga, Taquaritinga
Duartina (DUA)
44 municipalities
Agudos, Álvaro de Carvalho, Alvinlândia, Arealva, Avaí, Balbinos, Bastos,
Bauru, Boracéia, Cabrália Paulista, Cafelândia, Campos Novos Paulista,
Duartina, Echaporã, Espírito Santo do Turvo, Fernão, Gália, Garça, Getulina, Guaiçara, Guaimbê, Guarantã, Iacanga, Iacri, Júlio Mesquita, Lins,
Lucianópolis, Lupércio, Marília, Ocauçu, Parapuã, Paulistânia, Pederneiras,
Pirajuí, Piratininga, Pongaí, Presidente Alves, Promissão, Reginópolis, Sabino, Santa Cruz do Rio Pardo, São Pedro do Turvo, Ubirajara, Uru
Brotas (BRO)
15 municipalities
Analândia, Bocaina, Brotas, Corumbataí, Dois Córregos, Dourado, Ibaté,
Itirapina, Mineiros do Tietê, Ribeirão Bonito, Santa Maria da Serra, São
Carlos, São Pedro, Torrinha, Trabiju
South 51 municipalities
Porto Ferreira (PFE) 19 municipalities
Aguaí, Caconde, Casa Branca, Cravinhos, Descalvado, Guatapará, Guaxupé, Luiz Antônio, Mococa, Pirassununga, Porto Ferreira, Santa Cruz da
Conceição, Santa Cruz das Palmeiras, Santa Rita do Passa Quatro, Santa
Rosa de Viterbo, São José do Rio Pardo, São Simão, Tambaú, Vargem Grande do Sul
Limeira (LIM)
32 municipalities
Águas de Lindóia, Americana, Amparo, Araras, Artur Nogueira, Itatiba,
Bragança Paulista, Charqueada, Conchal, Cordeirópolis, Cosmópolis,
Engenheiro Coelho, Espírito Santo do Pinhal, Estiva Gerbi, Holambra, Ipeúna, Iracemápolis, Itapira, Jaguariúna, Jarinu, Leme, Limeira, Lindóia,
Mogi Guaçu, Mogi Mirim, Paulínia, Piracicaba, Rio Claro, Santa Gertrudes,
Santo Antônio de Posse, Serra Negra, Socorro
Southwest 53 municipalities
Avaré (AVA) 33 municipalities
Águas de Santa Bárbara, Angatuba, Anhembi, Araçoiaba da Serra, Arandu, Avaré, Bofete, Borebi, Botucatu, Cabreúva, Capela do Alto, Cerqueira César,
Cesário Lange, Conchas, Guareí, Iaras, Iperó, Itatinga, Laranjal Paulista, Lençóis Paulista, Manduri, Óleo, Pardinho, Piraju, Porangaba, Porto Feliz,
Pratânia, Quadra, Salto de Pirapora, São Manuel, Sorocaba, Tatuí, Tietê
Itapetininga (ITG)
20 municipalities
Alambari, Buri, Campina do Monte Alegre, Capão Bonito, Coronel Macedo,
Itaberá, Itaí, Itapetininga, Itapeva, Itaporanga, Itararé, Nova Campina, Paranapanema, Pilar do Sul, São Miguel Arcanjo, Sarapuí, Sarutaiá,
Taquarituba, Taquarivaí, Tejupá
5 sectors 12 regions 349 municipalities with citrus groves
24
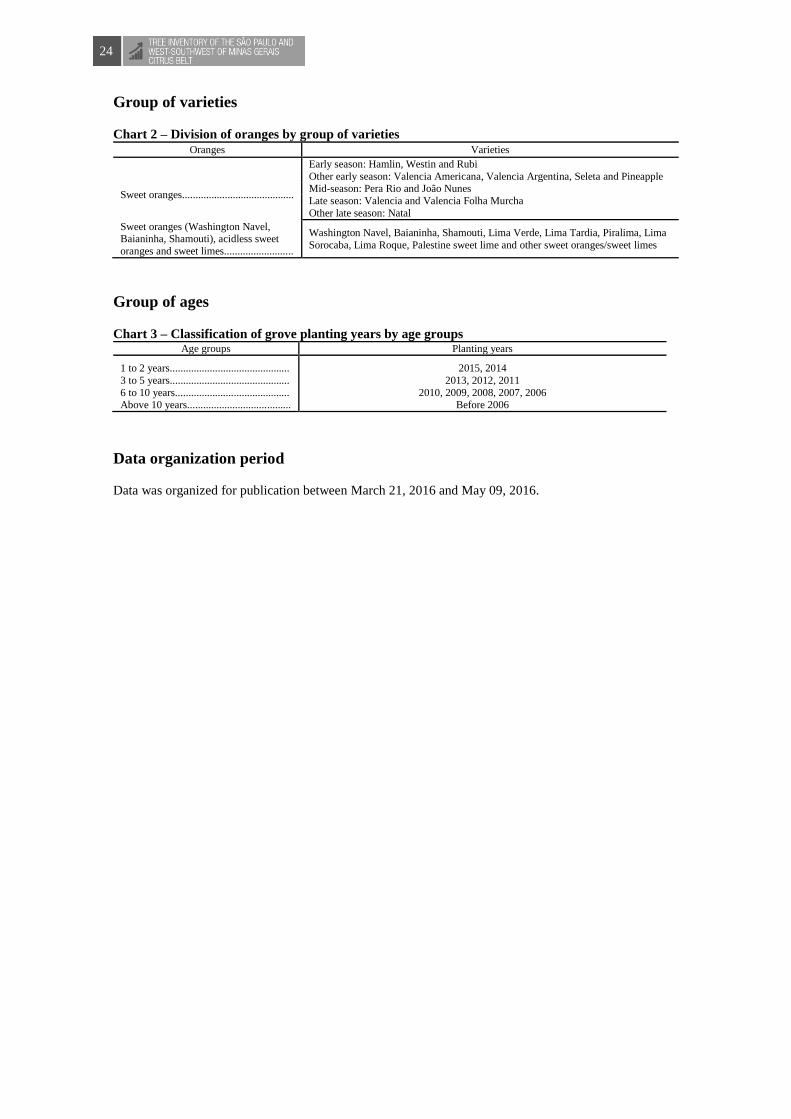
Group of varieties
Chart 2 – Division of oranges by group of varieties Oranges Varieties
Sweet oranges..........................................
Early season: Hamlin, Westin and Rubi
Other early season: Valencia Americana, Valencia Argentina, Seleta and Pineapple Mid-season: Pera Rio and João Nunes
Late season: Valencia and Valencia Folha Murcha
Other late season: Natal
Sweet oranges (Washington Navel, Baianinha, Shamouti), acidless sweet
oranges and sweet limes..........................
Washington Navel, Baianinha, Shamouti, Lima Verde, Lima Tardia, Piralima, Lima
Sorocaba, Lima Roque, Palestine sweet lime and other sweet oranges/sweet limes
Group of ages
Chart 3 – Classification of grove planting years by age groups Age groups Planting years
1 to 2 years.............................................
3 to 5 years.............................................
6 to 10 years........................................... Above 10 years.......................................
2015, 2014
2013, 2012, 2011
2010, 2009, 2008, 2007, 2006 Before 2006
Data organization period
Data was organized for publication between March 21, 2016 and May 09, 2016.

25
3 – RESULTS
3.1 – MAIN CONCLUSIONS ABOUT THE TREE INVENTORY
The result of the field research shows a current photo which portrays the reality of orange groves one year
after the first inventory carried out by Fundecitrus. The estimated profile of the groves presented in this
publication is precisely that of March 2016. The analyses are a comparison between the current situation
and that of March 2015. The structure of the tables remains similar, and the organization of the 349
municipalities of the citrus belt is kept in 5 sectors, which are subdivided into 12 regions, namely: North
(Triângulo Mineiro, Bebedouro and Altinópolis), Northwest (Votuporanga and São José do Rio Preto),
Central (Duartina, Matão and Brotas), South (Porto Ferreira and Limeira) and Southwest (Avaré and
Itapetininga). Acid limes, lemons and tangerines are not included into this publication but will be
contemplated in the next imaging of the whole citrus belt.
The area with orange groves, including all the varieties, is 416,703 hectares, 6% smaller as compared to
that of the 2015 inventory. From that total, 97% are from the Hamlin, Westin, Rubi, Valencia Americana,
Valencia Argentina, Seleta, Pineapple, Pera Rio, Valencia, Valencia Folha Murcha and Natal varieties. As
with the previous inventory, the information presented herein deals with those varieties, which are simply
called “oranges” in the tables which make up this report. The exceptions appear in Table 1 and Chart 1,
which show the data of 3% of the remaining groves, which include the Bahia, Baianinha, Shamouti, acidless
sweet oranges, sweet limes, among others.
The groves of all the orange varieties implemented in 2015, which totaled 9,583 hectares, were added to
the inventory this year. The decreasing trend for new plantings seen in the last few years continues. The
removed blocks, together with abandoned ones, estimated at 37,465 hectares were subtracted from the total.
Abandoned blocks are shown in Table 59. The loss of groves was fourfold greater than the entry of new
plantings. In the group of varieties with greater representativeness, net variation, that is, the difference
between groves entering and leaving the inventory, was negative by 26,759 hectares. In the group of orange
varieties of lesser expression, the net variation also remained negative by 1,123 hectares. All sectors of the
citrus belt presented a net area reduction for the main types of oranges.
From this point of the text forward, the observations carried out are limited to the main orange varieties.
The largest losses of groves due to removal or abandonment took place in the following regions: Matão
-6,429 hectares (18% of the total), Limeira -5,107 hectares (14% of the total), Bebedouro -4,820 hectares
(14% of the total), Porto Ferreira -4,677 hectares (13% of the total), and Votuporanga -4,670 hectares (13%
of the total).
The average removal rate in the citrus belt, taken separately from abandoned groves, was 4.96% in the
period from April/2015 to March/2016 and 6.69% as accumulated since October/2014, when the first
mapping was carried out. The largest removal was observed on properties with up to 10,000 trees, which
presented a rate of 25.22%.
According to the declarations about intention to reoccupy the removed groves, 20% of the area will be
replanted with citrus still in this season – with 17% being oranges, 1% with lemon/acid lime and 2% with
tangerine – 53% intend to plant another crop in the short term, and in 27% of them, their decision makers
were not found.
Orange trees total 175.55 million bearing trees and 16.46 non-bearing trees, totaling 192.01 million orange
trees. The distribution of the varieties per maturation stage shows that 39.06 million trees are of early
varieties, normally picked between May and August, 66.62 million are mid-season varieties, normally
picked between July and October, and 86.33 million are of late varieties, normally picked from October to
January. Climate variations may advance or extend harvesting periods from one season to another.
Four varieties account for roughly 90% of the citrus belt. Pera Rio, with 34% of the total, has been leading
as the most planted variety since 2007, surpassing the Valencia variety, with 29%, which holds the second
place. Varieties Hamlin, with 12%, and Natal, with 11%, remain in third and fourth place, respectively.
Graph 1 presents the complete distribution of volume of trees by variety.

26
Graph 1 – Distribution of bearing and non-bearing orange trees by variety
Expressive differences in density have been observed again between regions. Young groves, with a higher
average density, are located in the Altinópolis region, with 781 trees/hectare, followed by Itapetininga, with
712 trees/hectare. On the opposite side are those from the Votuporanga region, with 445 trees/hectare. The
average density of young groves is 654 trees/hectare, thus maintaining the level of 600 trees/hectare attained
as of 2013.
The average density of mature groves, that is, implemented before 2014, is 467 trees/hectare, a 4-percent
increase as compared to the previous inventory (448 trees/hectare). In this grove category, taking into
account the average density per region, variation ranges from 419 trees/hectare in the Votuporanga region
up to 518 trees/hectare in Itapetininga. When analyzed by age, older groves present a lower average density;
for instance, groves older than 10 years have in average 392 trees/hectare, whereas those planted during the
last decade present an average of 538 trees/hectare.
The average age of mature groves remains at 9.8 years, which shows a relatively young population.
However, 35,566 hectares, or 9% of the total area of orange groves, are older than 20 years of age, with an
average density of 336 trees/hectare, lagging behind the currently adopted one (656 trees/hectare). This
shows that, along the last two decades, little by little, groves have become denser and, in 2015, they reached
twice as many trees planted in the same area.
The revision of the number of properties depends on a new imaging to scan the whole citrus areas. While
this does not happen, the total of 7,588 orange properties remains unchanged, but the data on their groves
are updated by sampling assessment, which reassesses the area and proportion of bearing trees, non-bearing
tress, dead trees and vacancies in such groves. Of that total, 5,442 properties, or 72%, hold less than 10,000
trees, said number increasing to 83% if one considers properties having up to 20,000 trees. The 83% of
properties account for only 16% of the total trees of the whole areas. Therefore, the 1,295 remaining
properties, which have more than 20,000 trees each, equal 17% of the total properties, but encompass 84%
of the trees. In average, orange properties have 53 hectares with 9 blocks. The use of irrigation technology
is present in almost 100,000 hectares, and half of them are found in the North region.
The stratification of the 201.61 million holes of orange groves results in the following estimates: 175.55
million bearing trees (87% of holes), 16.46 million non-bearing trees (8.2%), 2.99 million dead trees
(1.5%), 6.61 million vacancies (3.3%).
495.87
229.71
37.93
674.74
172.85
134.07
2,229.39
956.73
1,186.33
8,493.96
21,259.04
56,578.46
5.53
66,612.35
1,042.23
76.60
1,264.32
6,248.68
3,179.45
3,934.13
23,317.93
0.25%
0.12%
0.02%
0.34%
0.09%
0.07%
1.13%
0.48%
0.60%
4.29%
10.73%
28.56%
0.00%
33.62%
0.53%
0.04%
0.64%
3.15%
1.60%
1.99%
11.77%
0% 5% 10% 15% 20% 25% 30% 35% 40%
- 20.000,00 40.000,00 60.000,00 80.000,00 100.000,00
Other sweet oranges/sweet limes
Palestine sweet lime
Lima Roque
Lima Sorocaba
Piralima
Lima Tardia
Lima Verde
Shamouti
Washington Navel / Baianinha
Valencia Folha Murcha
Natal
Valencia
João Nunes
Pera Rio
Pineapple
Seleta
Valencia Argentina
Valencia Americana
Westin
Rubi
Hamlin
Percentage of bearing and non-bearing trees (%)
Number of bearing and non-bearing orange trees (x 1,000)
27
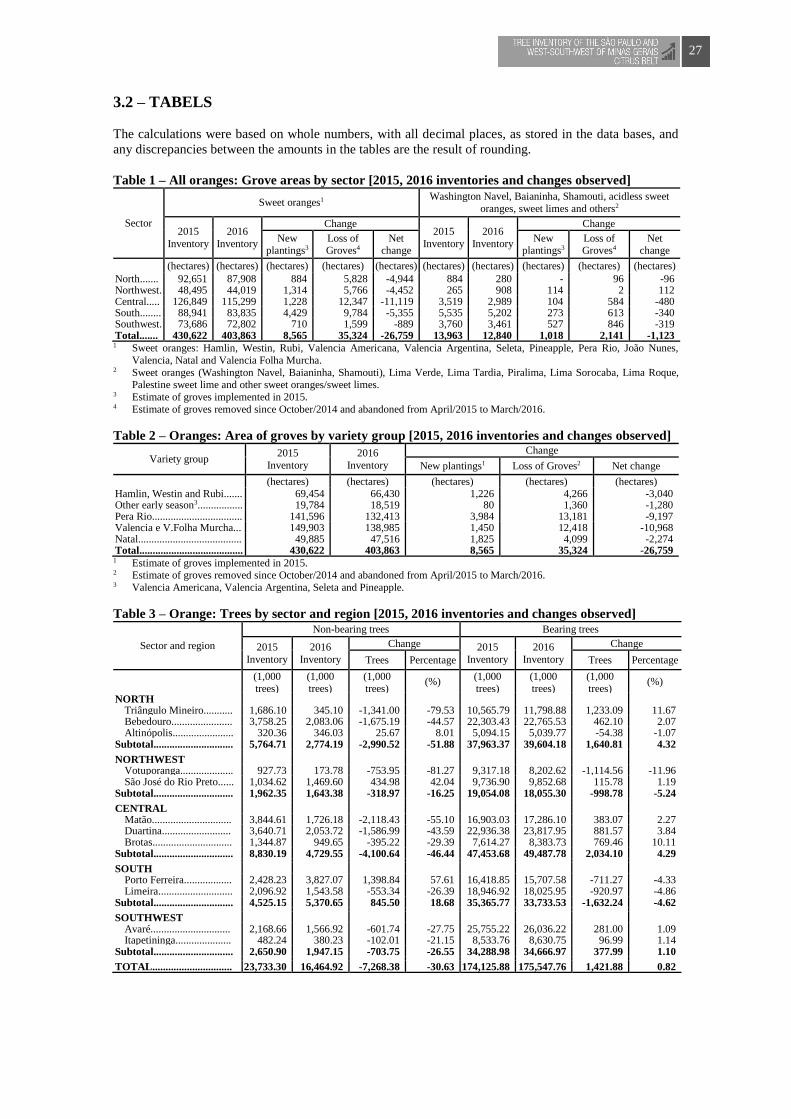
3.2 – TABELS
The calculations were based on whole numbers, with all decimal places, as stored in the data bases, and
any discrepancies between the amounts in the tables are the result of rounding.
Table 1 – All oranges: Grove areas by sector [2015, 2016 inventories and changes observed]
Sector
Sweet oranges1 Washington Navel, Baianinha, Shamouti, acidless sweet
oranges, sweet limes and others2
2015
Inventory 2016
Inventory
Change 2015
Inventory
2016
Inventory
Change
New plantings3
Loss of Groves4
Net change
New plantings3
Loss of Groves4
Net change
(hectares) (hectares) (hectares) (hectares) (hectares) (hectares) (hectares) (hectares) (hectares) (hectares)
North....... 92,651 87,908 884 5,828 -4,944 884 280 - 96 -96 Northwest. 48,495 44,019 1,314 5,766 -4,452 265 908 114 2 112 Central..... 126,849 115,299 1,228 12,347 -11,119 3,519 2,989 104 584 -480 South........ 88,941 83,835 4,429 9,784 -5,355 5,535 5,202 273 613 -340 Southwest. 73,686 72,802 710 1,599 -889 3,760 3,461 527 846 -319 Total....... 430,622 403,863 8,565 35,324 -26,759 13,963 12,840 1,018 2,141 -1,123
1 Sweet oranges: Hamlin, Westin, Rubi, Valencia Americana, Valencia Argentina, Seleta, Pineapple, Pera Rio, João Nunes,
Valencia, Natal and Valencia Folha Murcha. 2 Sweet oranges (Washington Navel, Baianinha, Shamouti), Lima Verde, Lima Tardia, Piralima, Lima Sorocaba, Lima Roque,
Palestine sweet lime and other sweet oranges/sweet limes. 3 Estimate of groves implemented in 2015. 4 Estimate of groves removed since October/2014 and abandoned from April/2015 to March/2016.
Table 2 – Oranges: Area of groves by variety group [2015, 2016 inventories and changes observed]
Variety group 2015
Inventory 2016
Inventory Change
New plantings1 Loss of Groves2 Net change
(hectares) (hectares) (hectares) (hectares) (hectares) Hamlin, Westin and Rubi....... 69,454 66,430 1,226 4,266 -3,040 Other early season3................. 19,784 18,519 80 1,360 -1,280 Pera Rio.................................. 141,596 132,413 3,984 13,181 -9,197 Valencia e V.Folha Murcha... 149,903 138,985 1,450 12,418 -10,968 Natal....................................... 49,885 47,516 1,825 4,099 -2,274 Total....................................... 430,622 403,863 8,565 35,324 -26,759
1 Estimate of groves implemented in 2015. 2 Estimate of groves removed since October/2014 and abandoned from April/2015 to March/2016.
3 Valencia Americana, Valencia Argentina, Seleta and Pineapple.
Table 3 – Orange: Trees by sector and region [2015, 2016 inventories and changes observed]
Sector and region
Non-bearing trees Bearing trees
2015
Inventory 2016
Inventory
Change 2015
Inventory
2016
Inventory
Change
Trees Percentage Trees Percentage
(1,000 trees)
(1,000 trees)
(1,000 trees)
(%) (1,000 trees)
(1,000 trees)
(1,000 trees)
(%)
NORTH Triângulo Mineiro........... 1,686.10 345.10 -1,341.00 -79.53 10,565.79 11,798.88 1,233.09 11.67 Bebedouro....................... 3,758.25 2,083.06 -1,675.19 -44.57 22,303.43 22,765.53 462.10 2.07 Altinópolis....................... 320.36 346.03 25.67 8.01 5,094.15 5,039.77 -54.38 -1.07
Subtotal.............................. 5,764.71 2,774.19 -2,990.52 -51.88 37,963.37 39,604.18 1,640.81 4.32 NORTHWEST
Votuporanga.................... 927.73 173.78 -753.95 -81.27 9,317.18 8,202.62 -1,114.56 -11.96 São José do Rio Preto...... 1,034.62 1,469.60 434.98 42.04 9,736.90 9,852.68 115.78 1.19
Subtotal.............................. 1,962.35 1,643.38 -318.97 -16.25 19,054.08 18,055.30 -998.78 -5.24 CENTRAL
Matão.............................. 3,844.61 1,726.18 -2,118.43 -55.10 16,903.03 17,286.10 383.07 2.27 Duartina.......................... 3,640.71 2,053.72 -1,586.99 -43.59 22,936.38 23,817.95 881.57 3.84 Brotas.............................. 1,344.87 949.65 -395.22 -29.39 7,614.27 8,383.73 769.46 10.11
Subtotal.............................. 8,830.19 4,729.55 -4,100.64 -46.44 47,453.68 49,487.78 2,034.10 4.29 SOUTH
Porto Ferreira.................. 2,428.23 3,827.07 1,398.84 57.61 16,418.85 15,707.58 -711.27 -4.33 Limeira............................ 2,096.92 1,543.58 -553.34 -26.39 18,946.92 18,025.95 -920.97 -4.86
Subtotal.............................. 4,525.15 5,370.65 845.50 18.68 35,365.77 33,733.53 -1,632.24 -4.62 SOUTHWEST
Avaré.............................. 2,168.66 1,566.92 -601.74 -27.75 25,755.22 26,036.22 281.00 1.09 Itapetininga..................... 482.24 380.23 -102.01 -21.15 8,533.76 8,630.75 96.99 1.14
Subtotal.............................. 2,650.90 1,947.15 -703.75 -26.55 34,288.98 34,666.97 377.99 1.10 TOTAL.............................. 23,733.30 16,464.92 -7,268.38 -30.63 174,125.88 175,547.76 1,421.88 0.82

28
Table 4 – Oranges: Properties1 stratified by number of orange trees [2016 inventory]
Range of the number of orange trees
in the property Properties
Properties
percentage
Non-bearing and
bearing trees
Percentage of
non-bearing
and bearing trees
(number) (number) (%) (1,000 trees) (%)
Below 10 thousand......................................... 5,442 71.72 18,525.31 9.65 10 – 19 thousand............................................ 851 11.22 12,527.11 6.52
20 – 29 thousand............................................ 378 4.98 9,634.88 5.02
30 – 49 thousand............................................ 314 4.14 12,532.08 6.53 50 – 99 thousand............................................ 289 3.81 21,172.69 11.03
100 – 199 thousand........................................ 156 2.06 23,924.55 12.46
Above 200 thousand ..................................... 158 2.08 93,696.06 48.80
TOTAL.......................................................... 7,588 100.00 192,012.68 100.00
(hectares)
AVERAGE.................................................... 53.22 1 This inventory was generated by a sampling technique covering 5% of the blocks in the primary base finished on 2015. The
number of properties will remain until a new sweep is conducted to scan the whole citrus areas using updated images, therefore,
the reclassification of the properties in the seven ranges shown in the table is due to the updating of the holes at those properties, deducting the removed and abandoned groves, following the application of the indices obtained in the assessment (bearing trees,
non-bearing trees, dead trees and vacancies). Since this is a new sampling, the reclassification of the number of properties in
each range presents variations due to the assessment in each year.
Table 5 – Oranges: Orange blocks stratified by area of block [2015 and 2016 inventories]
Orange block area
2015 inventory 2016 inventory
Orange blocks Percentage Orange blocks Percentage
(hectares) (number) (%) (number) (%)
Below 1.......................................................... 3,336 6.58 2,663 5.90 1.1 – 4............................................................ 14,300 28.22 11,689 25.88
4.1 – 10.......................................................... 17,953 35.43 16,466 36.46
10.1 – 20........................................................ 10,391 20.51 9,791 21.68 Above 20....................................................... 4,688 9.25 4,555 10.09
TOTAL.......................................................... 50,668 100.00 45,164 100.00
(hectares) (hectares)
AVERAGE.................................................... 8.50 8.94

29
Table 6 – Oranges: Average age1 of mature groves by sector and region [2015 and 2016 inventories]
Sector and region
2015 inventory 2016 inventory
Average age of
mature groves2
Average age of
mature groves3
(years) (years)
NORTH
Triângulo Mineiro ..................................................... 11.1 7.8
Bebedouro ................................................................. 9.2 9.5
Altinópolis ................................................................ 9.5 10.3
Average ..................................................................................... 9.6 9.1
NORTHWEST
Votuporanga.............................................................. 7.9 8.3
São José do Rio Preto ................................................ 8.0 8.0
Average...................................................................................... 7.9 8.2
CENTRAL
Matão ........................................................................ 9.3 8.9
Duartina .................................................................... 9.6 9.3
Brotas ........................................................................ 7.6 10.9
Average...................................................................................... 9.0 9.4
SOUTH
Porto Ferreira ............................................................ 10.2 9.9
Limeira ...................................................................... 10.6 11.7
Average...................................................................................... 10.3 10.8
SOUTHWEST
Avaré ........................................................................ 11.7 10.7
Itapetininga ............................................................... 11.2 10.6
Average...................................................................................... 11.5 10.7
GENERAL AVERAGE............................................................ 9.8 9.8
1 Average age weighted by sector trees. 2 Groves implemented in 2012 or in previous years. 3 Groves implemented in 2013 or in previous years.

30
Table 7 – Oranges: Stratification of the entire holes of orange groves [2016 inventory] (continues on
the next page)
Region Bearing trees Non-bearing trees Dead trees Vacancies Total
(1,000
trees)
(1,000
trees)
(1,000
trees)
(1,000
holes)
(1,000
trees/holes)
Triângulo Mineiro
Hamlin, Westin and Rubi.... 2,239.74 29.87 4.19 7.51 2,281.31
Other early season1.............. 125.44 1.59 1.33 0.91 129.27
Pera Rio............................... 3,651.49 222.11 37.03 34.32 3,944.95
Natal.................................... 1,569.34 10.07 5.40 6.18 1,590.99
Valencia e V.Folha Murcha2 4,212.87 81.46 13.03 6.87 4,314.23
Subtotal.................................... 11,798.88 345.10 60.98 55.79 12,260.75
Bebedouro
Hamlin, Westin and Rubi.... 4,977.83 201.98 51.84 212.70 5,444.35
Other early season1.............. 1,809.66 84.04 16.16 71.16 1,981.02
Pera Rio............................... 6,286.88 616.93 31.92 237.55 7,173.28
Natal.................................... 1,997.68 185.07 13.01 69.13 2,264.89
Valencia e V.Folha Murcha2 7,693.48 995.04 61.85 244.31 8,994.68
Subtotal.................................... 22,765.53 2,083.06 174.78 834.85 25,858.22
Altinópolis
Hamlin, Westin and Rubi.... 777.99 148.01 26.19 12.47 964.66
Other early season1.............. 89.86 5.99 2.52 3.53 101.90
Pera Rio............................... 1,885.42 43.76 29.65 39.37 1,998.20
Natal.................................... 217.66 34.24 0.38 17.73 270.01
Valencia e V.Folha Murcha2 2,068.84 114.03 19.86 35.33 2,238.06
Subtotal.................................... 5,039.77 346.03 78.60 108.43 5,572.83
Votuporanga
Hamlin, Westin and Rubi.... 445.51 3.91 18.71 41.98 510.11
Other early season1.............. 199.97 0.92 5.15 3.06 209.10
Pera Rio............................... 6,073.01 130.37 82.26 204.48 6,490.12
Natal.................................... 458.49 23.99 4.44 11.62 498.54
Valencia e V.Folha Murcha2 1,025.64 14.59 26.91 41.11 1,108.25
Subtotal.................................... 8,202.62 173.78 137.47 302.25 8,816.12
São José do Rio Preto
Hamlin, Westin and Rubi.... 2,364.74 171.70 33.32 77.88 2,647.64
Other early season1.............. 1,183.60 28.31 11.27 24.66 1,247.84
Pera Rio............................... 2,235.99 466.25 13.22 113.22 2,828.68
Natal.................................... 1,231.60 472.24 23.09 39.74 1,766.67
Valencia e V.Folha Murcha2 2,836.75 331.10 31.24 48.31 3,247.40
Subtotal.................................... 9,852.68 1,469.60 112.14 303.81 11,738.23
Matão
Hamlin, Westin and Rubi.... 2,708.38 86.88 50.00 134.25 2,979.51
Other early season1.............. 1,957.75 39.08 116.17 60.75 2,173.75
Pera Rio............................... 5,497.11 1,121.18 99.45 212.27 6,930.01
Natal.................................... 1,324.46 105.31 67.50 79.32 1,576.59
Valencia e V.Folha Murcha2 5,798.40 373.73 85.01 225.43 6,482.57
Subtotal.................................... 17,286.10 1,726.18 418.13 712.02 20,142.43
Duartina
Hamlin, Westin and Rubi.... 3,394.95 222.80 185.35 132.42 3,935.52
Other early season1.............. 1,048.81 36.92 20.44 41.15 1,147.32
Pera Rio............................... 9,393.07 828.21 175.88 308.80 10,705.96
Natal.................................... 2,608.44 161.60 47.42 122.23 2,939.69
Valencia e V.Folha Murcha2 7,372.68 804.19 150.58 269.60 8,597.05
Subtotal.................................... 23,817.95 2,053.72 579.67 874.20 27,325.54
Brotas
Hamlin, Westin and Rubi.... 1,344.56 73.73 23.16 111.06 1,552.51
Other early season1.............. 208.00 38.96 4.07 6.79 257.82
Pera Rio............................... 2,373.27 497.79 49.25 136.23 3,056.54
Natal.................................... 714.15 213.01 8.73 96.50 1,032.39
Valencia e V.Folha Murcha2 3,743.75 126.16 71.43 310.44 4,251.78
Subtotal.................................... 8,383.73 949.65 156.64 661.02 10,151.04

31
Table 7 – Oranges: Stratification of the entire holes of orange groves [2016 inventory] (continued)
Region Bearing trees Non-bearing trees Dead trees Vacancies Total
(1,000
trees)
(1,000
trees)
(1,000
trees)
(1,000
holes)
(1,000
trees/holes)
Porto Ferreira
Hamlin, Westin and Rubi.... 2,213.04 820.41 27.25 164.76 3,225.46
Other early season1.............. 359.99 19.71 12.31 20.02 412.03
Pera Rio............................... 5,406.43 1,631.42 80.16 235.39 7,353.40
Natal.................................... 1,564.25 525.13 44.76 87.41 2,221.55
Valencia e V.Folha Murcha2 6,163.87 830.40 77.22 388.55 7,460.04
Subtotal.................................... 15,707.58 3,827.07 241.70 896.13 20,672.48
Limeira
Hamlin, Westin and Rubi.... 2,796.55 121.40 44.03 138.41 3,100.39
Other early season1.............. 186.51 5.16 3.56 7.90 203.13
Pera Rio............................... 6,666.14 543.67 99.71 343.10 7,652.62
Natal.................................... 1,330.45 408.69 18.26 62.82 1,820.22
Valencia e V.Folha Murcha2 7,046.30 464.66 106.17 414.48 8,031.61
Subtotal.................................... 18,025.95 1,543.58 271.73 966.71 20,807.97
Avaré
Hamlin, Westin and Rubi.... 4,196.21 201.90 111.59 130.10 4,639.80
Other early season1.............. 693.13 43.32 11.32 19.52 767.29
Pera Rio............................... 7,522.79 682.45 174.68 263.43 8,643.35
Natal.................................... 4,028.09 211.03 132.48 106.45 4,478.05
Valencia e V.Folha Murcha2 9,596.00 428.22 182.56 263.63 10,470.41
Subtotal.................................... 26,036.22 1,566.92 612.63 783.13 28,998.90
Itapetininga
Hamlin, Westin and Rubi.... 846.09 43.33 8.16 11.66 909.24
Other early season1.............. 391.96 73.15 9.79 1.96 476.86
Pera Rio............................... 2,676.48 165.66 68.28 45.87 2,956.29
Natal.................................... 1,842.43 21.62 20.79 17.47 1,902.31
Valencia e V.Folha Murcha2 2,873.79 76.47 40.75 33.45 3,024.46
Subtotal.................................... 8,630.75 380.23 147.77 110.41 9,269.16
Total ....................................... 175,547.76 16,464.92 2,992.24 6,608.75 201,613.67
Percentange ........................... 87.07 8.17 1.48 3.28 100.00
1 Valencia Americana, Valencia Argentina, Seleta and Pineapple. 2 V.Folha Murcha – Valencia Folha Murcha.

32
Table 8 – Oranges: Area of young and mature groves by sector and region [2016 inventory and
changes observed in relation to the 2015 inventory]
Sector and region
2016 inventory
Change () in relation to the 2015
inventory in each category of grove age Area of
young groves1
Area of
mature groves2
Total
(A) (B) (C) ( A) ( B) ( C)
(hectares) (hectares) (hectares) (%) (%) (%)
NORTH
Triângulo Mineiro........... 399 24,837 25,236 -84.17 6.92 -2,00
Bebedouro....................... 2,077 49,756 51,833 -52.00 -3.70 -7,43
Altinópolis....................... 6 10,833 10,839 -94.83 0.40 -0,61
Subtotal ....................................... 2,482 85,426 87,908 -64.36 -0.30 -5.12
NORTHWEST
Votuporanga.................... 205 19,738 19,943 -86.69 -14.45 -18,97
São José do Rio Preto...... 1,997 22,079 24,076 42.64 -1.79 0,81
Subtotal........................................ 2,202 41,817 44,019 -25.10 -8.21 -9.23
CENTRAL
Matão............................... 1,648 39,593 41,241 -64.97 -7.40 -13,10
Duartina........................... 1,746 52,249 53,995 -60.58 -0.25 -4,95
Brotas.............................. 1,031 19,032 20,063 -29.96 -9.84 -11,15
Subtotal........................................ 4,425 110,874 115,299 -58.27 -4.62 -9.11
SOUTH
Porto Ferreira.................. 4,509 36,078 40,587 85.56 -8.93 -3,47
Limeira............................ 1,799 41,449 43,248 1.58 -8.15 -7,78
Subtotal........................................ 6,308 77,527 83,835 50.15 -8.51 -5.74
SOUTHWEST
Avaré............................... 1,277 54,333 55,610 -27.73 0.30 -0,59
Itapetininga...................... 470 16,722 17,192 -28.02 -2.17 -3,12
Subtotal ....................................... 1,747 71,055 72,802 -27.81 -0.30 -1.20
TOTAL........................................ 17,164 386,699 403,863 -36.73 -4.16 -6.21
PERCENTAGE........................... 4.25 95.75 100.00 (X) (X) (X)
(X) Not applicable. 1 Groves implemented in 2014 and 2015. 2 Groves implemented in 2013 or in previous years.

33
Table 9 – Oranges: Non-bearing and bearing trees by sector and region [2016 inventory and changes
observed in relation to the 2015 inventory]
Sector and region
2016 inventory
Change () in relation to the 2015 inventory in each category of
grove age
Non-bearing trees1
Bearing
trees4 Total In young
groves2
In mature
groves3
(resets) Total
(A) (B) (C) (D) (E) (A) (B) (C) (D) (E)
(1,000
trees)
(1,000
trees)
(1,000
trees)
(1,000
trees)
(1,000
trees) (%) (%) (%) (%) (%)
NORTH
Triângulo Mineiro.. 235.32 109.78 345.10 11,798.88 12,143.98 -84.34 -40.23 -79.53 11.67 -0.88
Bebedouro.............. 1,297.73 785.33 2,083.06 22,765.53 24,848.59 -54.18 -15.17 -44.57 2.07 -4.65
Altinópolis.............. 4.33 341.70 346.03 5,039.77 5,385.80 -93.07 32.48 8.01 -1.07 -0.53
Subtotal ....................... 1,537.38 1,236.81 2,774.19 39,604.18 42,378.37 -65.04 -9.55 -51.88 4.32 -3.09
NORTHWEST
Votuporanga...........
.. 91.78 82.00 173.78 8,202.62 8,376.40 -88.00 -49.59 -81.27 -11.96 -18.24
S. J. do Rio Preto.... 1,279.84 189.76 1,469.60 9,852.68 11,322.28 55.46 -10.23 42.04 1.19 5.11
Subtotal........................ 1,371.62 271.76 1,643.38 18,055.30 19,698.68 -13.64 -27.35 -16.25 -5.24 -6.27
CENTRAL
Matão........................
1,157.32 568.86 1,726.18 17,286.10 19,012.28 -62.03 -28.61 -55.10 2.27 -8.36
Duartina...................
1,157.56 896.16 2,053.72 23,817.95 25,871.67 -57.24 -3.99 -43.59 3.84 -2.65
Brotas..................... 696.98 252.67 949.65 8,383.73 9,333.38 -25.94 -37.43 -29.39 10.11 4.18
Subtotal........................ 3,011.86 1,717.69 4,729.55 49,487.78 54,217.33 -55.02 -19.51 -46.44 4.29 -3.67
SOUTH
Porto Ferreira......... 3,109.85 717.22 3,827.07 15,707.58 19,534.65 93.16 -12.35 57.61 -4.33 3.65
Limeira................... 1,001.82 541.76 1,543.58 18,025.95 19,569.53 -14.04 -41.84 -26.39 -4.86 -7.01
Subtotal 4,111.67 1,258.98 5,370.65 33,733.53 39,104.18 48.15 -28.05 18.68 -4.62 -1.97
SOUTHWEST
Avaré...................... 893.48 673.44 1,566.92 26,036.22 27,603.14 -29.25 -25.65 -27.75 1.09 -1.15
Itapetininga................
334.42 45.81 380.23 8,630.75 9,010.98 -19.98 -28.79 -21.15 1.14 -0.06
Subtotal........................
.
1,227.90 719.25 1,947.15 34,666.97 36,614.12 -26.94 -25.86 -26.55 1.10 -0.88
TOTAL......................... 11,260.43 5,204.49 16,464.92 175,547.76 192,012.68 -34.30 -21.09 -30.63 0.82 -2.95
PERCENTAGE........... 5.90 2.70 8.60 91.40 100.00 (X) (X) (X) (X) (X)
(X) Not applicable. 1 Trees planted in 2014 or 2015. 2 Groves implemented in 2014 or 2015. 3 Groves implemented in 2013 or in previous years. 4 Trees planted in 2013 or in previous years.
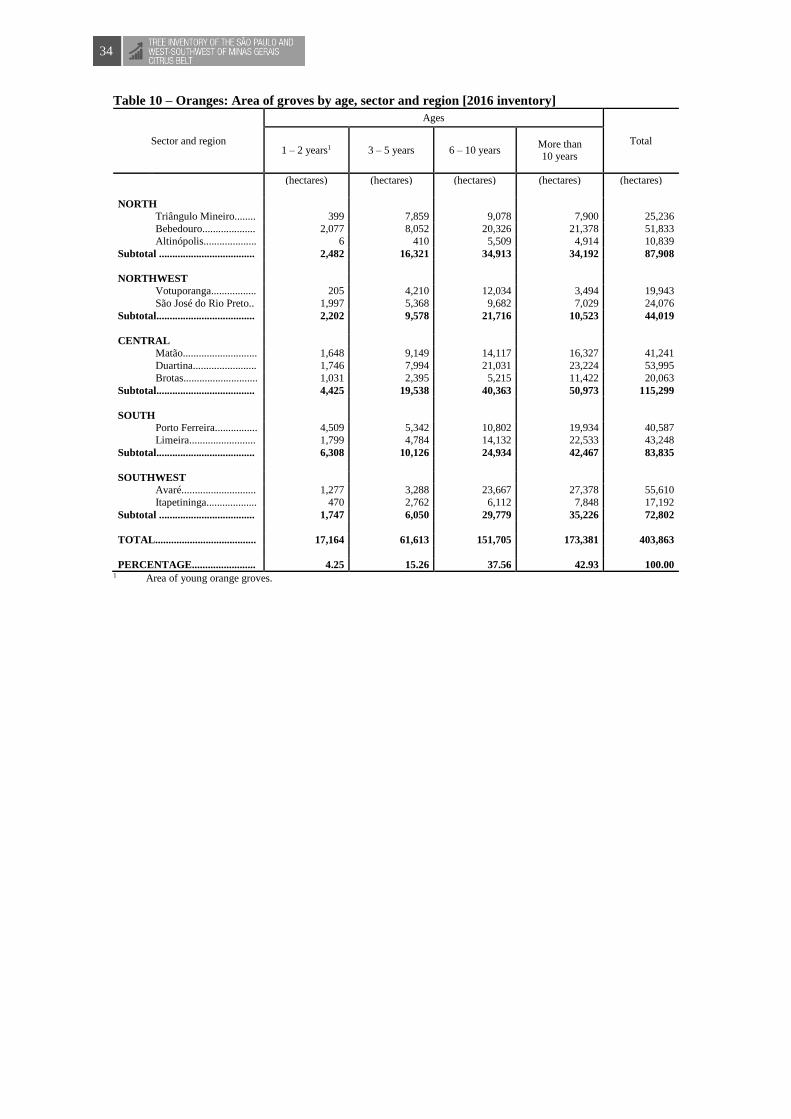
34
Table 10 – Oranges: Area of groves by age, sector and region [2016 inventory]
Sector and region
Ages
Total 1 – 2 years1 3 – 5 years 6 – 10 years
More than 10 years
(hectares) (hectares) (hectares) (hectares) (hectares)
NORTH
Triângulo Mineiro........ 399 7,859 9,078 7,900 25,236
Bebedouro.................... 2,077 8,052 20,326 21,378 51,833
Altinópolis.................... 6 410 5,509 4,914 10,839
Subtotal .................................... 2,482 16,321 34,913 34,192 87,908
NORTHWEST
Votuporanga................. 205 4,210 12,034 3,494 19,943
São José do Rio Preto.. 1,997 5,368 9,682 7,029 24,076
Subtotal..................................... 2,202 9,578 21,716 10,523 44,019
CENTRAL
Matão............................ 1,648 9,149 14,117 16,327 41,241
Duartina........................ 1,746 7,994 21,031 23,224 53,995
Brotas............................ 1,031 2,395 5,215 11,422 20,063
Subtotal..................................... 4,425 19,538 40,363 50,973 115,299
SOUTH
Porto Ferreira................ 4,509 5,342 10,802 19,934 40,587
Limeira......................... 1,799 4,784 14,132 22,533 43,248
Subtotal..................................... 6,308 10,126 24,934 42,467 83,835
SOUTHWEST
Avaré............................ 1,277 3,288 23,667 27,378 55,610
Itapetininga................... 470 2,762 6,112 7,848 17,192
Subtotal .................................... 1,747 6,050 29,779 35,226 72,802
TOTAL...................................... 17,164 61,613 151,705 173,381 403,863
PERCENTAGE........................ 4.25 15.26 37.56 42.93 100.00 1 Area of young orange groves.
35
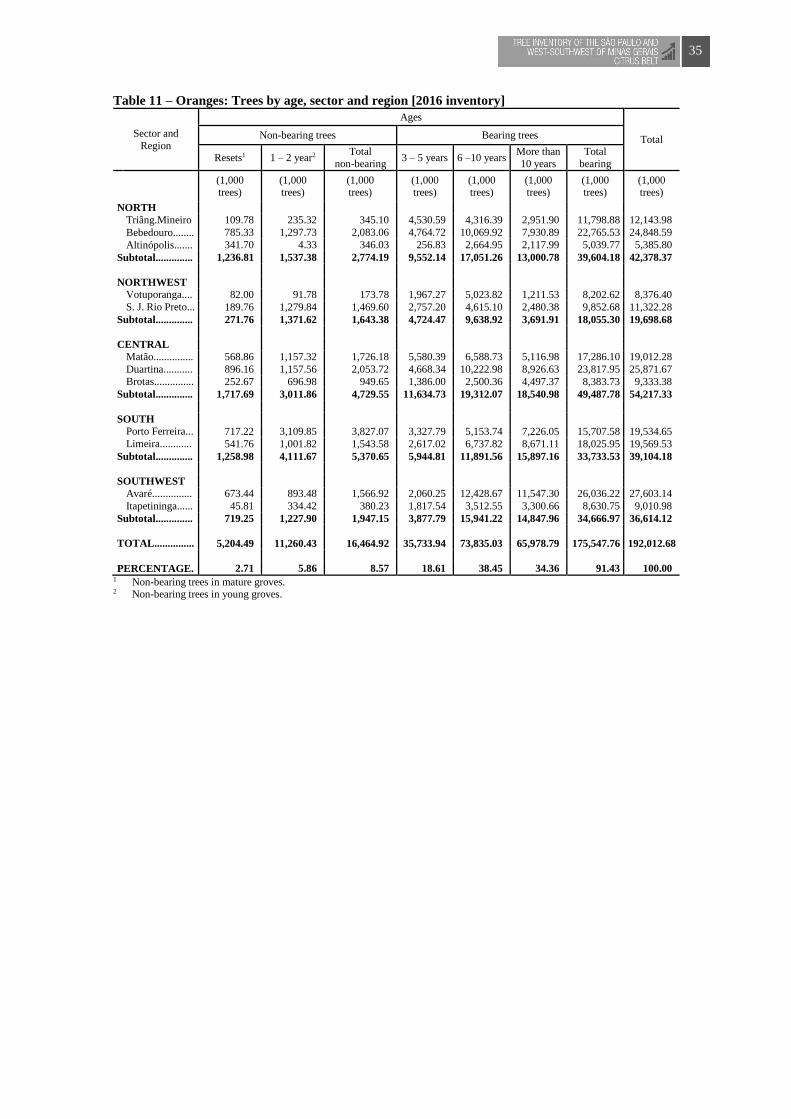
Table 11 – Oranges: Trees by age, sector and region [2016 inventory]
Sector and
Region
Ages
Total Non-bearing trees Bearing trees
Resets1 1 – 2 year2 Total
non-bearing 3 – 5 years 6 –10 years
More than
10 years
Total
bearing
(1,000 trees)
(1,000 trees)
(1,000 trees)
(1,000 trees)
(1,000 trees)
(1,000 trees)
(1,000 trees)
(1,000 trees)
NORTH
Triâng.Mineiro 109.78 235.32 345.10 4,530.59 4,316.39 2,951.90 11,798.88 12,143.98
Bebedouro........ 785.33 1,297.73 2,083.06 4,764.72 10,069.92 7,930.89 22,765.53 24,848.59
Altinópolis....... 341.70 4.33 346.03 256.83 2,664.95 2,117.99 5,039.77 5,385.80
Subtotal.............. 1,236.81 1,537.38 2,774.19 9,552.14 17,051.26 13,000.78 39,604.18 42,378.37
NORTHWEST
Votuporanga.... 82.00 91.78 173.78 1,967.27 5,023.82 1,211.53 8,202.62 8,376.40
S. J. Rio Preto... 189.76 1,279.84 1,469.60 2,757.20 4,615.10 2,480.38 9,852.68 11,322.28
Subtotal.............. 271.76 1,371.62 1,643.38 4,724.47 9,638.92 3,691.91 18,055.30 19,698.68
CENTRAL
Matão............... 568.86 1,157.32 1,726.18 5,580.39 6,588.73 5,116.98 17,286.10 19,012.28
Duartina........... 896.16 1,157.56 2,053.72 4,668.34 10,222.98 8,926.63 23,817.95 25,871.67
Brotas............... 252.67 696.98 949.65 1,386.00 2,500.36 4,497.37 8,383.73 9,333.38
Subtotal.............. 1,717.69 3,011.86 4,729.55 11,634.73 19,312.07 18,540.98 49,487.78 54,217.33
SOUTH
Porto Ferreira... 717.22 3,109.85 3,827.07 3,327.79 5,153.74 7,226.05 15,707.58 19,534.65
Limeira............ 541.76 1,001.82 1,543.58 2,617.02 6,737.82 8,671.11 18,025.95 19,569.53
Subtotal.............. 1,258.98 4,111.67 5,370.65 5,944.81 11,891.56 15,897.16 33,733.53 39,104.18
SOUTHWEST
Avaré............... 673.44 893.48 1,566.92 2,060.25 12,428.67 11,547.30 26,036.22 27,603.14
Itapetininga...... 45.81 334.42 380.23 1,817.54 3,512.55 3,300.66 8,630.75 9,010.98
Subtotal.............. 719.25 1,227.90 1,947.15 3,877.79 15,941.22 14,847.96 34,666.97 36,614.12
TOTAL............... 5,204.49 11,260.43 16,464.92 35,733.94 73,835.03 65,978.79 175,547.76 192,012.68
PERCENTAGE. 2.71 5.86 8.57 18.61 38.45 34.36 91.43 100.00 1 Non-bearing trees in mature groves. 2 Non-bearing trees in young groves.

36
Table 12 – Oranges: Grove area of early season varieties by sector and region [2016 inventory]
- Represents zero.
Sector and region
Varieties
Hamlin Westin Rubi Valencia
Americana
Valencia
Argentina Seleta Pineapple Total
(hectares) (hectares) (hectares) (hectares) (hectares) (hectares) (hectares) (hectares)
NORTH
Triângulo Mineiro 4,615 228 247 216 12 - 3 5,321
Bebedouro.........
... 9,349 1,294 1,077 2,859 527 1 249 15,356
Altinópolis...........
1,603 43 160 169 1 - 15 1,991
Subtotal
..................... 15,567 1,565 1,484 3,244 540 1 267 22,668
NORTHWEST
Votuporanga......
... 877 127 159 409 - - 91 1,663
S. J. Rio Preto... 4,157 451 905 2,027 481 - 173 8,194
Subtotal...................
... 5,034 578 1,064 2,436 481 - 264 9,857
CENTRAL
Matão................
... 5,490 253 756 2,482 2,022 - 513 11,516
Duartina...............
6,713 330 894 2,003 - 60 79 10,079
Brotas................
... 2,918 241 76 251 52 - 152 3,690
Subtotal...................
... 15,121 824 1,726 4,736 2,074 60 744 25,285
SOUTH
Porto Ferreira.... 3,676 1,326 726 662 208 12 9 6,619
Limeira.................
4,381 1,644 378 181 162 64 18 6,828
Subtotal...................
... 8,057 2,970 1,104 843 370 76 27 13,447
SOUTHWEST
Avaré....................
6,855 926 1,722 826 677 23 112 11,141
Itapetininga.......
... 1,353 148 332 292 13 - 413 2,551
Subtotal
..................... 8,208 1,074 2,054 1,118 690 23 525 13,692
TOTAL...................
... 51,987 7,011 7,432 12,377 4,155 160 1,827 84,949
PERCENTAGE.....
.... 61.20 8.25 8.75 14.57 4.89 0.19 2.15 100.00

37
Table 13 – Oranges: Trees of early season varieties by sector and region [2016 inventory]
- Represents zero.
Sector and region
Early varieties
Hamlin Westin Rubi Valencia
Americana
Valencia
Argentina Seleta Pineapple Total
(1,000
trees)
(1,000
trees)
(1,000
trees)
(1,000
trees)
(1,000
trees)
(1,000
trees)
(1,000
trees)
(1,000
trees)
NORTH
Triângulo Mineiro 2,019.59 104.52 145.50 121.06 4.84 - 1.13 2,396.64
Bebedouro............ 4,057.11 529.81 592.89 1,563.58 206.65 0.58 122.89 7,073.51
Altinópolis........... 807.03 23.85 95.12 84.86 0.65 - 10.34 1,021.85
Subtotal ..................... 6,883.73 658.18 833.51 1,769.50 212.14 0.58 134.36 10,492.00
NORTHWEST Votuporanga......... 334.59 38.46 76.37 175.30 - - 25.59 650,31
S. J. Rio Preto. 1,913.17 153.33 469.94 1,000.20 123.94 - 87.77
3.748,35 Subtotal...................... 2,247.76 191.79 546.31 1,175.50 123.94 - 113.36 4,398.66
CENTRAL Matão................... 2,316.83 98.83 379.60 1,178.88 513.47 - 304.48 4,792.09
Duartina............... 3,005.50 136.34 475.91 1,016.87 - 35.11 33.75 4,703.48
Brotas................... 1,278.08 108.15 32.06 116.38 27.68 - 102.90 1,665.25
Subtotal...................... 6,600.41 343.32 887.57 2,312.13 541.15 35.11 441.13 11,160.82
11,160.82 SOUTH Porto Ferreira....... 1,862.32 750.94 420.19 300.90 67.24 6.36 5.20 3,413.15
Limeira................. 1,963.07 742.87 212.01 91.16 66.54 26.09 7.88 3,109.62
Subtotal...................... 3,825.39 1,493.81 632.20 392.06 133.78 32.45 13.08 6,522.77
SOUTHWEST
Avaré.................... 3,132.53 421.29 844.29 429.61 246.63 8.46 51.75 5,134.56
Itapetininga.......... 628.11 71.06 190.25 169.88 6.68 - 288.55 1,354.53
Subtotal ..................... 3,760.64 492.35 1,034.54 599.49 253.31 8.46 340.30 6,489.09
TOTAL...................... 23,317.93 3,179.45 3,934.13 6,248.68 1,264.32 76.60 1,042.23 39,063.34
PERCENTAGE......... 59.69 8.14 10.07 16.00 3.24 0.20 2.67 100.00
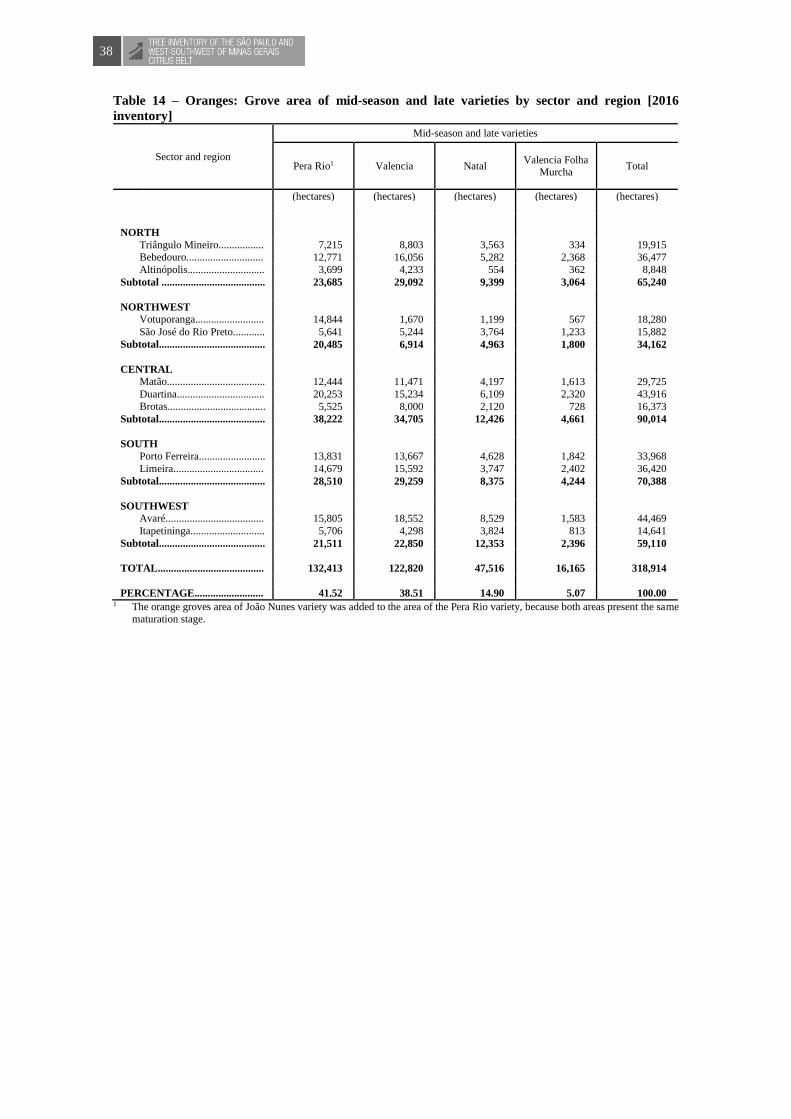
38
Table 14 – Oranges: Grove area of mid-season and late varieties by sector and region [2016
inventory]
1 The orange groves area of João Nunes variety was added to the area of the Pera Rio variety, because both areas present the same
maturation stage.
Sector and region
Mid-season and late varieties
Pera Rio1 Valencia Natal Valencia Folha
Murcha Total
(hectares) (hectares) (hectares) (hectares) (hectares)
NORTH
Triângulo Mineiro................. 7,215 8,803 3,563 334 19,915
Bebedouro.............................
. 12,771 16,056 5,282 2,368 36,477
Altinópolis..............................
3,699 4,233 554 362 8,848
Subtotal ....................................... 23,685 29,092 9,399 3,064 65,240
NORTHWEST
Votuporanga..........................
.
14,844 1,670 1,199 567 18,280
São José do Rio Preto............ 5,641 5,244 3,764 1,233 15,882
Subtotal........................................
... 20,485 6,914 4,963 1,800 34,162
CENTRAL
Matão.....................................
.... 12,444 11,471 4,197 1,613 29,725
Duartina................................. 20,253 15,234 6,109 2,320 43,916
Brotas.....................................
. 5,525 8,000 2,120 728 16,373
Subtotal........................................
. 38,222 34,705 12,426 4,661 90,014
SOUTH
Porto Ferreira......................... 13,831 13,667 4,628 1,842 33,968
Limeira...................................
14,679 15,592 3,747 2,402 36,420
Subtotal........................................
.
28,510 29,259 8,375 4,244 70,388
SOUTHWEST
Avaré.....................................
.. 15,805 18,552 8,529 1,583 44,469
Itapetininga............................ 5,706 4,298 3,824 813 14,641
Subtotal........................................
. 21,511 22,850 12,353 2,396 59,110
TOTAL........................................
.
132,413 122,820 47,516 16,165 318,914
PERCENTAGE..........................
.
41.52 38.51 14.90 5.07 100.00

39
Table 15 – Oranges: Trees of mid-season and late varieties by sector and region [2016 inventory]
1 The orange trees of the João Nunes variety were added to the area of the Pera Rio variety, because both areas present the same maturation stage.
Sector and region
Mid-season and late varieties
Pera Rio1 Valencia Natal Valencia Folha
Murcha Total
(1,000 trees)
(1,000 trees)
(1,000 trees)
(1,000 trees)
(1,000 trees)
NORTH
Triângulo Mineiro................. 3,873.60 4,106.56 1,579.41 187.77 9,747.34
Bebedouro............................. 6,903.81 7,413.13 2,182.75 1,275.39 17,775.08
Altinópolis............................ 1,929.18 1,999.10 251.90 183.77 4,363.95
Subtotal ...................................... 12,706.59 13,518.79 4,014.06 1,646.93 31,886.37
NORTHWEST
Votuporanga......................... 6,203.38 755.99 482.48 284.24 7,726.09
São José do Rio Preto........... 2,702.24 2,489.02 1,703.84 678.83 7,573.93
Subtotal....................................... 8,905.62 3,245.01 2,186.32 963.07 15,300.02
CENTRAL
Matão.................................... 6,618.29 5,251.29 1,429.77 920.84 14,220.19
Duartina................................ 10,221.28 6,931.89 2,770.04 1,244.98 21,168.19
Brotas.................................... 2,871.06 3,508.33 927.16 361.58 7,668.13
Subtotal....................................... 19,710.63 15,691.51 5,126.97 2,527.40 43,056.51
SOUTH
Porto Ferreira........................ 7,037.85 6,061.82 2,089.38 932.45 16,121.50
Limeira.................................. 7,209.81 6,446.58 1,739.14 1,064.38 16,459.91
Subtotal....................................... 14,247.66 12,508.40 3,828.52 1,996.83 32,581.41
SOUTHWEST
Avaré.................................... 8,205.24 9,123.60 4,239.12 900.62 22,468.58
Itapetininga........................... 2,842.14 2,491.15 1,864.05 459.11 7,656.45
Subtotal....................................... 11,047.38 11,614.75 6,103.17 1,359.73 30,125.03
TOTAL....................................... 66,617.88 56,578.46 21,259.04 8,493.96 152,949.34
PERCENTAGE.......................... 43.56 36.99 13.90 5.55 100.00
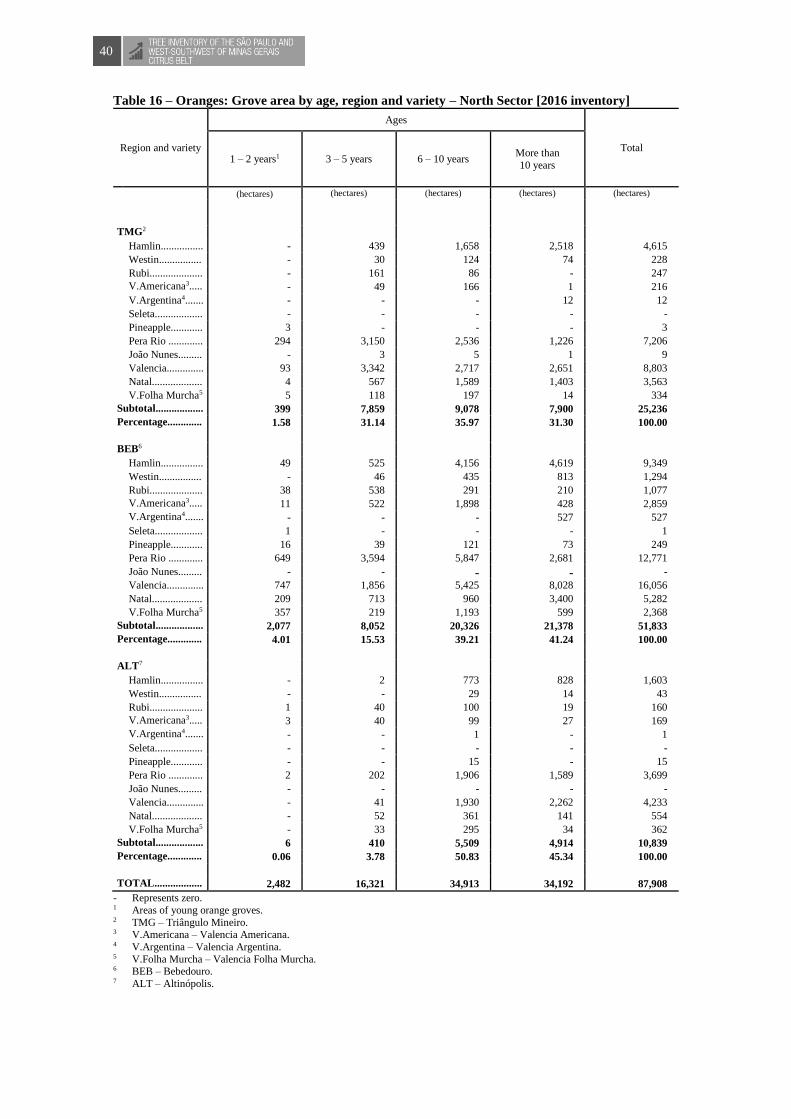
40
Table 16 – Oranges: Grove area by age, region and variety – North Sector [2016 inventory]
Region and variety
Ages
Total 1 – 2 years1 3 – 5 years 6 – 10 years
More than
10 years
(hectares) (hectares) (hectares) (hectares) (hectares)
TMG2
Hamlin................ - 439 1,658 2,518 4,615
Westin................ - 30 124 74 228
Rubi.................... - 161 86 - 247
V.Americana3.....
. - 49 166 1 216
V.Argentina4....... - - - 12 12
Seleta.................. - - - - -
Pineapple............ 3 - - - 3
Pera Rio ............. 294 3,150 2,536 1,226 7,206
João Nunes......... - 3 5 1 9
Valencia.............. 93 3,342 2,717 2,651 8,803
Natal................... 4 567 1,589 1,403 3,563
V.Folha Murcha5 5 118 197 14 334
Subtotal.................. 399 7,859 9,078 7,900 25,236
Percentage.............
. 1.58 31.14 35.97 31.30 100.00
BEB6
Hamlin................ 49 525 4,156 4,619 9,349
Westin................ - 46 435 813 1,294
Rubi.................... 38 538 291 210 1,077
V.Americana3.....
. 11 522 1,898 428 2,859
V.Argentina4.......
. - - - 527 527
Seleta.................. 1 - - - 1
Pineapple............ 16 39 121 73 249
Pera Rio ............. 649 3,594 5,847 2,681 12,771
João Nunes......... - - - - -
Valencia.............. 747 1,856 5,425 8,028 16,056
Natal................... 209 713 960 3,400 5,282
V.Folha Murcha5 357 219 1,193 599 2,368
Subtotal.................. 2,077 8,052 20,326 21,378 51,833
Percentage.............
. 4.01 15.53 39.21 41.24 100.00
ALT7
Hamlin................ - 2 773 828 1,603
Westin................ - - 29 14 43
Rubi.................... 1 40 100 19 160
V.Americana3.....
. 3 40 99 27 169
V.Argentina4.......
. - - 1 - 1
Seleta.................. - - - - -
Pineapple............ - - 15 - 15
Pera Rio ............. 2 202 1,906 1,589 3,699
João Nunes......... - - - - -
Valencia.............. - 41 1,930 2,262 4,233
Natal................... - 52 361 141 554
V.Folha Murcha5 - 33 295 34 362
Subtotal.................. 6 410 5,509 4,914 10,839
Percentage.............
. 0.06 3.78 50.83 45.34 100.00
TOTAL.................. 2,482 16,321 34,913 34,192 87,908
- Represents zero. 1 Areas of young orange groves. 2 TMG – Triângulo Mineiro. 3 V.Americana – Valencia Americana. 4 V.Argentina – Valencia Argentina. 5 V.Folha Murcha – Valencia Folha Murcha. 6 BEB – Bebedouro. 7 ALT – Altinópolis.
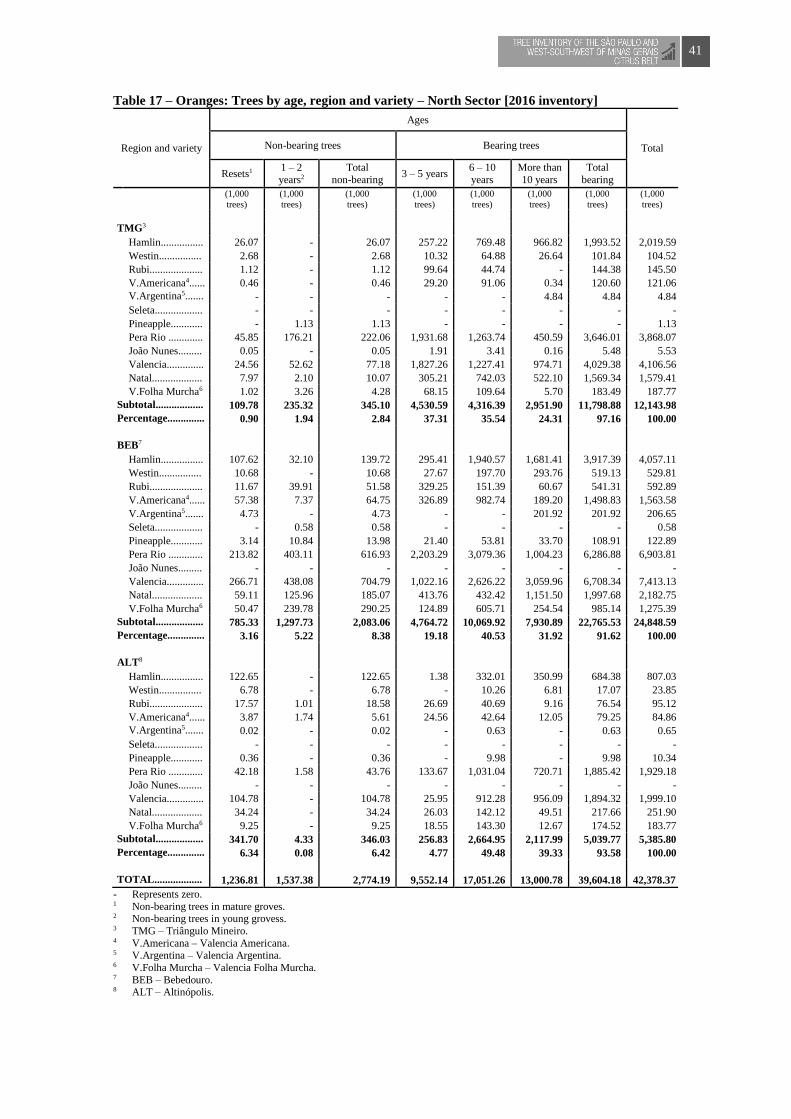
41
Table 17 – Oranges: Trees by age, region and variety – North Sector [2016 inventory]
Region and variety
Ages
Total Non-bearing trees Bearing trees
Resets1 1 – 2
years2
Total
non-bearing 3 – 5 years
6 – 10
years
More than
10 years
Total
bearing
(1,000
trees)
(1,000
trees)
(1,000
trees)
(1,000
trees)
(1,000
trees)
(1,000
trees)
(1,000
trees)
(1,000
trees)
TMG3
Hamlin................ 26.07 - 26.07 257.22 769.48 966.82 1,993.52 2,019.59
Westin................ 2.68 - 2.68 10.32 64.88 26.64 101.84 104.52
Rubi.................... 1.12 - 1.12 99.64 44.74 - 144.38 145.50
V.Americana4...... 0.46 - 0.46 29.20 91.06 0.34 120.60 121.06
V.Argentina5........
- - - - - 4.84 4.84 4.84
Seleta.................. - - - - - - - -
Pineapple............ - 1.13 1.13 - - - - 1.13
Pera Rio ............. 45.85 176.21 222.06 1,931.68 1,263.74 450.59 3,646.01 3,868.07
João Nunes......... 0.05 - 0.05 1.91 3.41 0.16 5.48 5.53
Valencia.............. 24.56 52.62 77.18 1,827.26 1,227.41 974.71 4,029.38 4,106.56
Natal................... 7.97 2.10 10.07 305.21 742.03 522.10 1,569.34 1,579.41
V.Folha Murcha6 1.02 3.26 4.28 68.15 109.64 5.70 183.49 187.77
Subtotal.................. 109.78 235.32 345.10 4,530.59 4,316.39 2,951.90 11,798.88 12,143.98
Percentage.............. 0.90 1.94 2.84 37.31 35.54 24.31 97.16 100.00
BEB7
Hamlin................ 107.62 32.10 139.72 295.41 1,940.57 1,681.41 3,917.39 4,057.11
Westin................ 10.68 - 10.68 27.67 197.70 293.76 519.13 529.81
Rubi.................... 11.67 39.91 51.58 329.25 151.39 60.67 541.31 592.89
V.Americana4...... 57.38 7.37 64.75 326.89 982.74 189.20 1,498.83 1,563.58
V.Argentina5....... 4.73 - 4.73 - - 201.92 201.92 206.65
Seleta.................. - 0.58 0.58 - - - - 0.58
Pineapple............ 3.14 10.84 13.98 21.40 53.81 33.70 108.91 122.89
Pera Rio ............. 213.82 403.11 616.93 2,203.29 3,079.36 1,004.23 6,286.88 6,903.81
João Nunes......... - - - - - - - -
Valencia.............. 266.71 438.08 704.79 1,022.16 2,626.22 3,059.96 6,708.34 7,413.13
Natal................... 59.11 125.96 185.07 413.76 432.42 1,151.50 1,997.68 2,182.75
V.Folha Murcha6 50.47 239.78 290.25 124.89 605.71 254.54 985.14 1,275.39
Subtotal.................. 785.33 1,297.73 2,083.06 4,764.72 10,069.92 7,930.89 22,765.53 24,848.59
Percentage.............. 3.16 5.22 8.38 19.18 40.53 31.92 91.62 100.00
ALT8
Hamlin................ 122.65 - 122.65 1.38 332.01 350.99 684.38 807.03
Westin................ 6.78 - 6.78 - 10.26 6.81 17.07 23.85
Rubi.................... 17.57 1.01 18.58 26.69 40.69 9.16 76.54 95.12
V.Americana4...... 3.87 1.74 5.61 24.56 42.64 12.05 79.25 84.86
V.Argentina5........
0.02 - 0.02 - 0.63 - 0.63 0.65
Seleta.................. - - - - - - - -
Pineapple............ 0.36 - 0.36 - 9.98 - 9.98 10.34
Pera Rio ............. 42.18 1.58 43.76 133.67 1,031.04 720.71 1,885.42 1,929.18
João Nunes......... - - - - - - - -
Valencia.............. 104.78 - 104.78 25.95 912.28 956.09 1,894.32 1,999.10
Natal................... 34.24 - 34.24 26.03 142.12 49.51 217.66 251.90
V.Folha Murcha6 9.25 - 9.25 18.55 143.30 12.67 174.52 183.77
Subtotal.................. 341.70 4.33 346.03 256.83 2,664.95 2,117.99 5,039.77 5,385.80
Percentage.............. 6.34 0.08 6.42 4.77 49.48 39.33 93.58 100.00
TOTAL.................. 1,236.81 1,537.38 2,774.19 9,552.14 17,051.26 13,000.78 39,604.18 42,378.37
- Represents zero. 1 Non-bearing trees in mature groves. 2 Non-bearing trees in young grovess. 3 TMG – Triângulo Mineiro. 4 V.Americana – Valencia Americana. 5 V.Argentina – Valencia Argentina. 6 V.Folha Murcha – Valencia Folha Murcha. 7 BEB – Bebedouro. 8 ALT – Altinópolis.

42
Table 18 – Oranges: Grove area by age, region and variety – Northwest Sector [2016 inventory]
Region and variety
Ages
Total 1 – 2 years1 3 – 5 years 6 – 10 years
More than
10 years
(hectares) (hectares) (hectares) (hectares) (hectares)
VOT2
Hamlin................ - 151 551 175 877
Westin................ 9 12 84 22 127
Rubi.................... - 50 107 2 159
V.Americana3.....
. - 105 268 36 409
V.Argentina4.......
. - - - - -
Seleta.................. - - - - -
Pineapple............ - 3 88 - 91
Pera Rio ............. 148 3,599 9,076 2,021 14,844
João Nunes......... - - - - -
Valencia.............. 28 139 1,000 503 1,670
Natal................... 20 120 467 592 1,199
V.Folha Murcha5 - 31 393 143 567
Subtotal.................. 205 4,210 12,034 3,494 19,943
Percentage.............
. 1.03 21.11 60.34 17.52 100.00
SJO6
Hamlin................ 171 1,005 2,286 695 4,157
Westin................ - 10 156 285 451
Rubi.................... 3 290 331 281 905
V.Americana3.....
. 6 1,029 907 85 2,027
V.Argentina4.......
. - - - 481 481
Seleta.................. - - - - -
Pineapple............ - 33 89 51 173
Pera Rio ............. 731 745 2,231 1,934 5,641
João Nunes......... - - - - -
Valencia.............. 469 1,829 2,135 811 5,244
Natal................... 580 244 860 2,080 3,764
V.Folha Murcha5 37 183 687 326 1,233
Subtotal.................. 1,997 5,368 9,682 7,029 24,076
Percentage.............
. 8.29 22.30 40.21 29.20 100.00
TOTAL.................. 2,202 9,578 21,716 10,523 44,019
- Represents zero. 1 Areas of young orange groves. 2 VOT – Votuporanga. 3 V.Americana – Valencia Americana. 4 V.Argentina – Valencia Argentina. 5 V.Folha Murcha – Valencia Folha Murcha. 6 SJO – São José do Rio Preto.

43
Table 19 – Oranges: Trees by age, region and variety – Northwest Sector [2016 inventory]
Region and variety
Ages
Total Non-bearing trees Bearing trees
Resets1 1 – 2
years2
Total
non-bearing
3 – 5
years
6 – 10
years
More than
10 years
Total
bearing
(1,000
trees)
(1,000
trees)
(1,000
trees)
(1,000
trees)
(1,000
trees)
(1,000
trees)
(1,000
trees)
(1,000
trees)
VOT3
Hamlin................ 0.66 - 0.66 88.24 196.62 49.07 333.93 334.59
Westin................ 0.06 3.02 3.08 6.08 23.59 5.71 35.38 38.46
Rubi.................... 0.17 - 0.17 25.91 49.56 0.73 76.20 76.37
V.Americana4......
0.90 - 0.90 48.19 113.27 12.94 174.40 175.30
V.Argentina5........
- - - - - - - -
Seleta.................. - - - - - - - -
Pineapple............ 0.02 - 0.02 1.60 23.97 - 25.57 25.59
Pera Rio ............. 64.72 65.65 130.37 1,679.95 3,689.93 703.13 6,073.01 6,203.38
João Nunes......... - - - - - - - -
Valencia.............. 2.00 12.12 14.12 74.16 486.16 181.55 741.87 755.99
Natal................... 13.00 10.99 23.99 29.58 228.81 200.10 458.49 482.48
V.Folha Murcha6 0.47 - 0.47 13.56 211.91 58.30 283.77 284.24
Subtotal.................. 82.00 91.78 173.78 1,967.27 5,023.82 1,211.53 8,202.62 8,376.40
Percentage.............
. 0.98 1.10 2.07 23.49 59.98 14.46 97.93 100.00
SJO7
Hamlin................ 17.07 139.00 156.07 479.94 1,043.18 233.98 1,757.10 1,913.17
Westin................ 0.91 - 0.91 5.13 71.58 75.71 152.42 153.33
Rubi.................... 12.07 2.65 14.72 196.64 160.43 98.15 455.22 469.94
V.Americana4......
21.73 3.78 25.51 493.12 452.17 29.40 974.69 1,000.20
V.Argentina5........
- - - - - 123.94 123.94 123.94
Seleta.................. - - - - - - - -
Pineapple............ 2.80 - 2.80 15.72 45.61 23.64 84.97 87.77
Pera Rio ............. 69.75 396.50 466.25 434.83 1,066.12 735.04 2,235.99 2,702.24
João Nunes......... - - - - - - - -
Valencia.............. 28.46 271.52 299.98 910.18 981.53 297.33 2,189.04 2,489.02
Natal................... 27.60 444.64 472.24 118.90 417.56 695.14 1,231.60 1,703.84
V.Folha Murcha6 9.37 21.75 31.12 102.74 376.92 168.05 647.71 678.83
Subtotal.................. 189.76 1,279.84 1,469.60 2,757.20 4,615.10 2,480.38 9,852.68 11,322.28
Percentage.............
. 1.68 11.30 12.98 24.35 40.76 21.91 87.02 100.00
TOTAL.................. 271.76 1,371.62 1,643.38 4,724.47 9,638.92 3,691.91 18,055.30 19,698.68
- Represents zero. 1 Non-bearing trees in mature groves. 2 Non-bearing trees in young groves. 3 VOT – Votuporanga. 4 V.Americana – Valencia Americana. 5 V.Argentina – Valencia Argentina. 6 V.Folha Murcha – Valencia Folha Murcha. 7 SJO – São José do Rio Preto.

44
Table 20 – Oranges: Grove area by age, region and variety – Central Sector [2016 inventory]
Region and variety
Ages
Total 1 – 2 years1 3 – 5 years 6 – 10 years
More than
10 years
(hectares) (hectares) (hectares) (hectares) (hectares)
MAT2
Hamlin................ 16 955 2,835 1,684 5,490
Westin................ - 45 92 116 253
Rubi.................... - 223 516 17 756
V.Americana3......
- 220 1,550 712 2,482
V.Argentina4........
- 26 154 1,842 2,022
Seleta.................. - - - - -
Pineapple............ - 513 - - 513
Pera Rio ............. 1,135 3,397 3,882 4,030 12,444
João Nunes......... - - - - -
Valencia.............. 176 2,832 3,692 4,771 11,471
Natal................... 125 388 874 2,810 4,197
V.Folha Murcha5 196 550 522 345 1,613
Subtotal.................. 1,648 9,149 14,117 16,327 41,241
Percentage.............
. 4.00 22.18 34.23 39.59 100.00
DUA6
Hamlin................ 81 654 3,203 2,775 6,713
Westin................ - 19 151 160 330
Rubi.................... 1 352 483 58 894
V.Americana3......
- 572 1,116 315 2,003
V.Argentina4....... - - - - -
Seleta.................. 4 - 49 7 60
Pineapple............ - - 40 39 79
Pera Rio ............. 864 3,332 7,995 8,062 20,253
João Nunes......... - - - - -
Valencia.............. 567 1,633 5,406 7,628 15,234
Natal................... 61 1,079 1,716 3,253 6,109
V.Folha Murcha5 168 353 872 927 2,320
Subtotal.................. 1,746 7,994 21,031 23,224 53,995
Percentage.............
. 3.23 14.81 38.95 43.01 100.00
BRO7
Hamlin................ - 370 1,120 1,428 2,918
Westin................ 10 35 6 190 241
Rubi.................... - - 31 45 76
V.Americana3......
- 19 100 132 251
V.Argentina4........
- - - 52 52
Seleta.................. - - - - -
Pineapple............ 48 104 - - 152
Pera Rio ............. 641 1,087 1,443 2,354 5,525
João Nunes......... - - - - -
Valencia.............. 96 612 1,583 5,709 8,000
Natal................... 218 57 720 1,125 2,120
V.Folha Murcha5 18 111 212 387 728
Subtotal.................. 1,031 2,395 5,215 11,422 20,063
Percentage.............
. 5.14 11.94 25.99 56.93 100.00
TOTAL.................. 4,425 19,538 40,363 50,973 115,299
- Represents zero. 1 Areas of young orange groves. 2 MAT – Matão. 3 V.Americana – Valencia Americana. 4 V.Argentina – Valencia Argentina. 5 V.Folha Murcha – Valencia Folha Murcha. 6 DUA – Duartina. 7 BRO – Brotas.

45
Table 21 – Oranges: Trees by age, region and variety – Central Sector [2016 inventory]
Region and variety
Ages
Total Non-bearing trees Bearing trees
Resets1 1 – 2
years2
Total
non-bearing
3 – 5
years
6 – 10
years
More than
10 years
Total
bearing
(1,000
trees)
(1,000
trees)
(1,000
trees)
(1,000
trees)
(1,000
trees)
(1,000
trees)
(1,000
trees)
(1,000
trees)
MAT3
Hamlin................ 69.99 8.95 78.94 562.85 1,132.72 542.32 2,237.89 2,316.83
Westin................ 3.97 - 3.97 20.63 34.99 39.24 94.86 98.83
Rubi.................... 3.97 - 3.97 127.54 241.58 6.51 375.63 379.60
V.Americana4...... 35.22 - 35.22 122.02 797.28 224.36 1,143.66 1,178.88
V.Argentina5........
1.10 - 1.10 15.60 76.93 419.84 512.37 513.47
Seleta.................. - - - - - - - -
Pineapple............ 2.76 - 2.76 301.72 - - 301.72 304.48
Pera Rio ............. 300.45 820.73 1,121.18 2,103.29 2,028.50 1,365.32 5,497.11 6,618.29
João Nunes......... - - - - - - - -
Valencia.............. 120.83 115.33 236.16 1,765.87 1,648.07 1,601.19 5,015.13 5,251.29
Natal................... 20.07 85.24 105.31 191.97 339.83 792.66 1,324.46 1,429.77
V.Folha Murcha6 10.50 127.07 137.57 368.90 288.83 125.54 783.27 920.84
Subtotal.................. 568.86 1,157.32 1,726.18 5,580.39 6,588.73 5,116.98 17,286.10 19,012.28
Percentage.............. 2.99 6.09 9.08 29.35 34.66 26.91 90.92 100.00
DUA7
Hamlin................ 159.69 52.07 211.76 356.06 1,462.97 974.71 2,793.74 3,005.50
Westin................ 2.36 - 2.36 9.83 70.01 54.14 133.98 136.34
Rubi.................... 8.37 0.31 8.68 196.23 250.59 20.41 467.23 475.91
V.Americana4...... 31.98 - 31.98 345.10 537.38 102.41 984.89 1,016.87
V.Argentina5....... - - - - - - - -
Seleta.................. 1.32 2.68 4.00 - 28.75 2.36 31.11 35.11
Pineapple............ 0.94 - 0.94 - 19.92 12.89 32.81 33.75
Pera Rio ............. 252.90 575.31 828.21 1,989.39 4,002.56 3,401.12 9,393.07 10,221.28
João Nunes......... - - - - - - - -
Valencia.............. 275.66 367.78 643.44 907.88 2,614.18 2,766.39 6,288.45 6,931.89
Natal................... 118.77 42.83 161.60 663.57 765.57 1,179.30 2,608.44 2,770.04
V.Folha Murcha6 44.17 116.58 160.75 200.28 471.05 412.90 1,084.23 1,244.98
Subtotal.................. 896.16 1,157.56 2,053.72 4,668.34 10,222.98 8,926.63 23,817.95 25,871.67
Percentage.............. 3.46 4.47 7.94 18.04 39.51 34.50 92.06 100.00
BRO8
Hamlin................ 64.15 - 64.15 178.92 512.91 522.10 1,213.93 1,278.08
Westin................ 0.73 7.57 8.30 24.64 2.42 72.79 99.85 108.15
Rubi.................... 1.28 - 1.28 - 15.24 15.54 30.78 32.06
V.Americana4...... 5.25 - 5.25 9.65 55.61 45.87 111.13 116.38
V.Argentina5.......
. 0.83 - 0.83 - - 26.85 26.85 27.68
Seleta.................. - - - - - - - -
Pineapple............ 0.08 32.80 32.88 70.02 - - 70.02 102.90
Pera Rio ............. 69.17 428.62 497.79 610.60 761.21 1,001.46 2,373.27 2,871.06
João Nunes......... - - - - - - - -
Valencia.............. 45.11 62.96 108.07 390.72 763.19 2,246.35 3,400.26 3,508.33
Natal................... 62.20 150.81 213.01 27.79 280.34 406.02 714.15 927.16
V.Folha Murcha6 3.87 14.22 18.09 73.66 109.44 160.39 343.49 361.58
Subtotal.................. 252.67 696.98 949.65 1,386.00 2,500.36 4,497.37 8,383.73 9,333.38
Percentage.............. 2.71 7.47 10.17 14.85 26.79 48.19 89.83 100.00
TOTAL.................. 1,717.69 3,011.86 4,729.55 11,634.73 19,312.07 18,540.98 49,487.78 54,217.33
- Represents zero. 1 Non-bearing trees in mature groves. 2 Non-bearing trees in young groves. 3 MAT – Matão. 4 V.Americana – Valencia Americana. 5 V.Argentina – Valencia Argentina. 6 V.Folha Murcha – Valencia Folha Murcha. 7 DUA – Duartina. 8 BRO – Brotas.
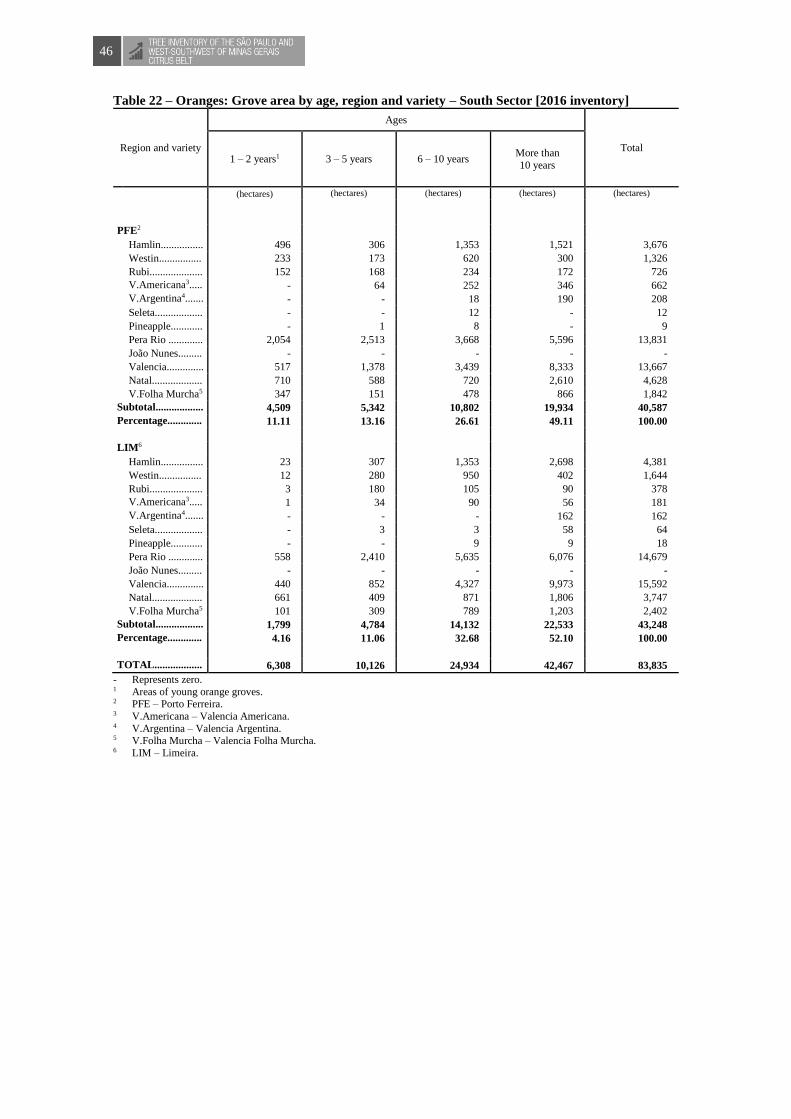
46
Table 22 – Oranges: Grove area by age, region and variety – South Sector [2016 inventory]
Region and variety
Ages
Total 1 – 2 years1 3 – 5 years 6 – 10 years
More than
10 years
(hectares) (hectares) (hectares) (hectares) (hectares)
PFE2
Hamlin................ 496 306 1,353 1,521 3,676
Westin................ 233 173 620 300 1,326
Rubi.................... 152 168 234 172 726
V.Americana3......
- 64 252 346 662
V.Argentina4........
- - 18 190 208
Seleta.................. - - 12 - 12
Pineapple............ - 1 8 - 9
Pera Rio ............. 2,054 2,513 3,668 5,596 13,831
João Nunes......... - - - - -
Valencia.............. 517 1,378 3,439 8,333 13,667
Natal................... 710 588 720 2,610 4,628
V.Folha Murcha5 347 151 478 866 1,842
Subtotal.................. 4,509 5,342 10,802 19,934 40,587
Percentage.............
. 11.11 13.16 26.61 49.11 100.00
LIM6
Hamlin................ 23 307 1,353 2,698 4,381
Westin................ 12 280 950 402 1,644
Rubi.................... 3 180 105 90 378
V.Americana3......
1 34 90 56 181
V.Argentina4........
- - - 162 162
Seleta.................. - 3 3 58 64
Pineapple............ - - 9 9 18
Pera Rio ............. 558 2,410 5,635 6,076 14,679
João Nunes......... - - - - -
Valencia.............. 440 852 4,327 9,973 15,592
Natal................... 661 409 871 1,806 3,747
V.Folha Murcha5 101 309 789 1,203 2,402
Subtotal.................. 1,799 4,784 14,132 22,533 43,248
Percentage.............
. 4.16 11.06 32.68 52.10 100.00
TOTAL.................. 6,308 10,126 24,934 42,467 83,835
- Represents zero. 1 Areas of young orange groves. 2 PFE – Porto Ferreira. 3 V.Americana – Valencia Americana. 4 V.Argentina – Valencia Argentina. 5 V.Folha Murcha – Valencia Folha Murcha. 6 LIM – Limeira.

47
Table 23 – Oranges: Trees by age, region and variety – South Sector [2016 inventory]
Region and variety
Ages
Total Non-bearing trees Bearing trees
Resets1 1 – 2
years2
Total
non-bearing
3 – 5
years
6 – 10
years
More than
10 years
Total
bearing
(1,000
trees)
(1,000
trees)
(1,000
trees)
(1,000
trees)
(1,000
trees)
(1,000
trees)
(1,000
trees)
(1,000
trees)
PFE3
Hamlin................ 105.01 390.96 495.97 201.03 625.49 539.83 1,366.35 1,862.32
Westin................ 31.12 181.61 212.73 131.54 293.74 112.93 538.21 750.94
Rubi.................... 15.85 95.86 111.71 119.26 135.96 53.26 308.48 420.19
V.Americana4.....
. 17.46 - 17.46 38.37 122.58 122.49 283.44 300.90
V.Argentina5.......
. 1.78 - 1.78 - 13.01 52.45 65.46 67.24
Seleta.................. 0.25 - 0.25 0.11 6.00 - 6.11 6.36
Pineapple............ 0.22 - 0.22 0.71 4.27 - 4.98 5.20
Pera Rio ............. 251.14 1,380.28 1,631.42 1,509.23 1,754.50 2,142.70 5,406.43 7,037.85
João Nunes......... - - - - - - - -
Valencia.............. 205.57 357.59 563.16 879.64 1,646.01 2,973.01 5,498.66 6,061.82
Natal................... 63.04 462.09 525.13 342.80 306.29 915.16 1,564.25 2,089.38
V.Folha Murcha6 25.78 241.46 267.24 105.10 245.89 314.22 665.21 932.45
Subtotal.................. 717.22 3,109.85 3,827.07 3,327.79 5,153.74 7,226.05 15,707.58 19,534.65
Percentage.............
. 3.67 15.92 19.59 17.04 26.38 36.99 80.41 100.00
LIM7
Hamlin................ 64.74 11.22 75.96 154.82 643.29 1,089.00 1,887.11 1,963.07
Westin................ 26.28 6.23 32.51 132.72 418.70 158.94 710.36 742.87
Rubi.................... 11.75 1.18 12.93 110.31 50.96 37.81 199.08 212.01
V.Americana4.....
. 1.15 0.42 1.57 18.37 49.49 21.73 89.59 91.16
V.Argentina5.......
. 1.96 - 1.96 - - 64.58 64.58 66.54
Seleta.................. 1.57 - 1.57 1.35 2.13 21.04 24.52 26.09
Pineapple............ 0.06 - 0.06 - 4.64 3.18 7.82 7.88
Pera Rio ............. 186.10 357.57 543.67 1,349.77 2,941.33 2,375.04 6,666.14 7,209.81
João Nunes......... - - - - - - - -
Valencia.............. 158.88 222.11 380.99 464.08 1,872.32 3,729.19 6,065.59 6,446.58
Natal................... 61.83 346.86 408.69 220.15 420.28 690.02 1,330.45 1,739.14
V.Folha Murcha6 27.44 56.23 83.67 165.45 334.68 480.58 980.71 1,064.38
Subtotal.................. 541.76 1,001.82 1,543.58 2,617.02 6,737.82 8,671.11 18,025.95 19,569.53
Percentage.............
. 2.77 5.12 7.89 13.37 34.43 44.31 92.11 100.00
TOTAL.................. 1,258.98 4,111.67 5,370.65 5,944.81 11,891.56 15,897.16 33,733.53 39,104.18
- Represents zero. 1 Non-bearing trees in mature groves. 2 Non-bearing trees in young groves. 3 PFE – Porto Ferreira. 4 V.Americana – Valencia Americana. 5 V.Argentina – Valencia Argentina. 6 V.Folha Murcha – Valencia Folha Murcha. 7 LIM – Limeira.

48
Table 24 – Oranges: Grove area by age, region and variety – Southwest Sector [2016 inventory]
Region and variety
Ages
Total 1 – 2 years1 3 – 5 years 6 – 10 years
More than
10 years
(hectares) (hectares) (hectares) (hectares) (hectares)
AVA2
Hamlin................ 82 176 3,297 3,300 6,855
Westin................ 8 64 445 409 926
Rubi.................... 41 198 1,085 398 1,722
V.Americana3......
11 195 357 263 826
V.Argentina4........
- - - 677 677
Seleta.................. - - - 23 23
Pineapple............ - - 51 61 112
Pera Rio ............. 750 942 6,971 7,142 15,805
João Nunes......... - - - - -
Valencia.............. 138 854 7,559 10,001 18,552
Natal................... 200 474 3,364 4,491 8,529
V.Folha Murcha5 47 385 538 613 1,583
Subtotal.................. 1,277 3,288 23,667 27,378 55,610
Percentage.............
. 2.30 5.91 42.56 49.23 100.00
ITG6
Hamlin................ - 185 384 784 1,353
Westin................ - 23 67 58 148
Rubi.................... 58 101 120 53 332
V.Americana3......
91 68 95 38 292
V.Argentina4........
- - 13 - 13
Seleta.................. - - - - -
Pineapple............ 7 347 42 17 413
Pera Rio ............. 208 966 1,532 3,000 5,706
João Nunes......... - - - - -
Valencia.............. 88 590 2,046 1,574 4,298
Natal................... 18 267 1,399 2,140 3,824
V.Folha Murcha5 - 215 414 184 813
Subtotal.................. 470 2,762 6,112 7,848 17,192
Percentage.............
. 2.73 16.07 35.55 45.65 100.00
TOTAL.................. 1,747 6,050 29,779 35,226 72,802
- Represents zero. 1 Areas of young orange groves. 2 AVA – Avaré. 3 V.Americana – Valencia Americana. 4 V.Argentina – Valencia Argentina. 5 V.Folha Murcha – Valencia Folha Murcha. 6 ITG – Itapetininga.
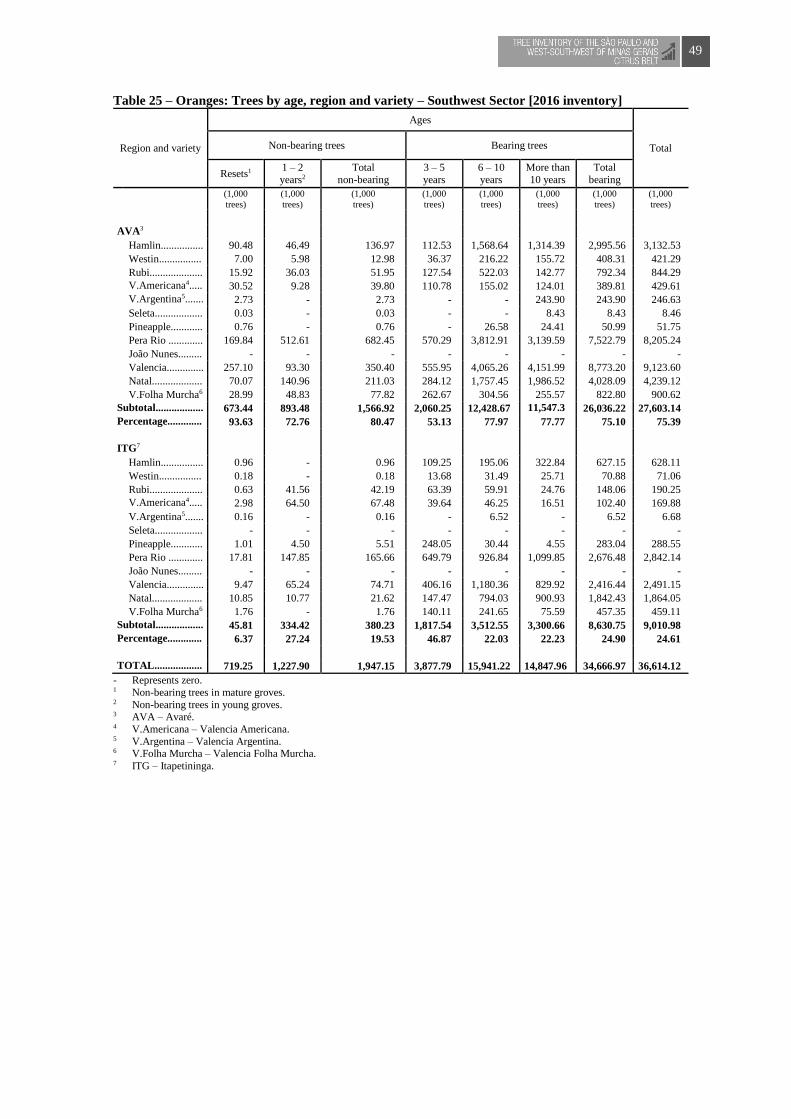
49
Table 25 – Oranges: Trees by age, region and variety – Southwest Sector [2016 inventory]
Region and variety
Ages
Total Non-bearing trees Bearing trees
Resets1 1 – 2
years2
Total
non-bearing
3 – 5
years
6 – 10
years
More than
10 years
Total
bearing
(1,000
trees)
(1,000
trees)
(1,000
trees)
(1,000
trees)
(1,000
trees)
(1,000
trees)
(1,000
trees)
(1,000
trees)
AVA3
Hamlin................ 90.48 46.49 136.97 112.53 1,568.64 1,314.39 2,995.56 3,132.53
Westin................ 7.00 5.98 12.98 36.37 216.22 155.72 408.31 421.29
Rubi.................... 15.92 36.03 51.95 127.54 522.03 142.77 792.34 844.29
V.Americana4.....
. 30.52 9.28 39.80 110.78 155.02 124.01 389.81 429.61
V.Argentina5.......
. 2.73 - 2.73 - - 243.90 243.90 246.63
Seleta.................. 0.03 - 0.03 - - 8.43 8.43 8.46
Pineapple............ 0.76 - 0.76 - 26.58 24.41 50.99 51.75
Pera Rio ............. 169.84 512.61 682.45 570.29 3,812.91 3,139.59 7,522.79 8,205.24
João Nunes......... - - - - - - - -
Valencia.............. 257.10 93.30 350.40 555.95 4,065.26 4,151.99 8,773.20 9,123.60
Natal................... 70.07 140.96 211.03 284.12 1,757.45 1,986.52 4,028.09 4,239.12
V.Folha Murcha6 28.99 48.83 77.82 262.67 304.56 255.57 822.80 900.62
Subtotal.................. 673.44 893.48 1,566.92 2,060.25 12,428.67 11,547.3
0 26,036.22 27,603.14
Percentage.............
. 93.63 72.76 80.47 53.13 77.97 77.77 75.10 75.39
ITG7
Hamlin................ 0.96 - 0.96 109.25 195.06 322.84 627.15 628.11
Westin................ 0.18 - 0.18 13.68 31.49 25.71 70.88 71.06
Rubi.................... 0.63 41.56 42.19 63.39 59.91 24.76 148.06 190.25
V.Americana4.....
. 2.98 64.50 67.48 39.64 46.25 16.51 102.40 169.88
V.Argentina5....... 0.16 - 0.16 - 6.52 - 6.52 6.68
Seleta.................. - - - - - - - -
Pineapple............ 1.01 4.50 5.51 248.05 30.44 4.55 283.04 288.55
Pera Rio ............. 17.81 147.85 165.66 649.79 926.84 1,099.85 2,676.48 2,842.14
João Nunes......... - - - - - - - -
Valencia.............. 9.47 65.24 74.71 406.16 1,180.36 829.92 2,416.44 2,491.15
Natal................... 10.85 10.77 21.62 147.47 794.03 900.93 1,842.43 1,864.05
V.Folha Murcha6 1.76 - 1.76 140.11 241.65 75.59 457.35 459.11
Subtotal.................. 45.81 334.42 380.23 1,817.54 3,512.55 3,300.66 8,630.75 9,010.98
Percentage.............
. 6.37 27.24 19.53 46.87 22.03 22.23 24.90 24.61
TOTAL.................. 719.25 1,227.90 1,947.15 3,877.79 15,941.22 14,847.96 34,666.97 36,614.12
- Represents zero. 1 Non-bearing trees in mature groves. 2 Non-bearing trees in young groves. 3 AVA – Avaré. 4 V.Americana – Valencia Americana. 5 V.Argentina – Valencia Argentina. 6 V.Folha Murcha – Valencia Folha Murcha. 7 ITG – Itapetininga.

50
Table 26 – Oranges: Grove areas by sector and variety [2016 inventory]
Variety
Sector
Total Group
percentage
Total
percentage North Northwest Central South Southwest
(hectares) (hectares) (hectares) (hectares) (hectares) (hectares) (%) (%)
EARLY SEASON
Hamlin...................... 15,567 5,034 15,121 8,057 8,208 51,987 61.20 12.87
Westin...................... 1,565 578 824 2,970 1,074 7,011 8.25 1.74
Rubi.......................... 1,484 1,064 1,726 1,104 2,054 7,432 8.75 1.84
Valencia Americana. 3,244 2,436 4,736 843 1,118 12,377 14.57 3.06
Valencia Argentina... 540 481 2,074 370 690 4,155 4.89 1.03
Seleta........................ 1 - 60 76 23 160 0.19 0.04
Pineapple.................. 267 264 744 27 525 1,827 2.15 0.45
Subtotal........................ 22,668 9,857 25,285 13,447 13,692 84,949 100.00 21.03
MID-SEASON
Pera Rio ................... 23,676 20,485 38,222 28,510 21,511 132,404 99.99 32.78
João Nunes............... 9 - - - - 9 0.01 0.00
Subtotal........................ 23,685 20,485 38,222 28,510 21,511 132,413 100.00 32.79
LATE SEASON
Valencia.................... 29,092 6,914 34,705 29,259 22,850 122,820 65.85 30.41
Natal......................... 9,399 4,963 12,426 8,375 12,353 47,516 25.48 11.77
V.Folha Murcha1...... 3,064 1,800 4,661 4,244 2,396 16,165 8.67 4.00
Subtotal........................ 41,555 13,677 51,792 41,878 37,599 186,501 100.00 46.18
TOTAL........................ 87,908 44,019 115,299 83,835 72,802 403,863 (X) 100.00
PERCENTAGE........... 21.77 10.90 28.55 20.76 18.03 100.00 (X) (X)
- Represents zero. (X) Not applicable. 1 V.Folha Murcha – Valencia Folha Murcha.

51
Table 27 – Oranges: Trees by sector and variety [2016 inventory]
Variety
Sector
Total Group
percentage
Total
percentage North Northwest Central South Southwest
(1,000 trees)
(1,000 trees)
(1,000 trees)
(1,000 trees)
(1,000 trees)
(1,000 trees)
(%) (%)
EARLY SEASON
Hamlin...................... 6,883.73 2,247.76 6,600.41 3,825.39 3,760.64 23,317.93 59.69 12.14
Westin...................... 658.18 191.79 343.32 1,493.81 492.35 3,179.45 8.14 1.66
Rubi.......................... 833.51 546.31 887.57 632.20 1,034.54 3,934.13 10.07 2.05
Valencia Americana. 1,769.50 1,175.50 2,312.13 392.06 599.49 6,248.68 16.00 3.25
Valencia Argentina... 212.14 123.94 541.15 133.78 253.31 1,264.32 3.24 0.66
Seleta........................ 0.58 - 35.11 32.45 8.46 76.60 0.20 0.04
Pineapple.................. 134.36 113.36 441.13 13.08 340.30 1,042.23 2.67 0.54
Subtotal........................ 10,492.00 4,398.66 11,160.82 6,522.77 6,489.09 39,063.34 100.00 20.34
MID-SEASON
Pera Rio ................... 12,701.06 8,905.62 19,710.63 14,247.66 11,047.38 66,612.35 99.99 34.69
João Nunes............... 5.53 - - - - 5.53 0.01 -
Subtotal........................ 12,706.59 8,905.62 19,710.63 14,247.66 11,047.38 66,617.88 100.00 34.69
TARDIAS
Valencia.................... 13,518.79 3,245.01 15,691.51 12,508.40 11,614.75 56,578.46 65.54 29.47
Natal......................... 4,014.06 2,186.32 5,126.97 3,828.52 6,103.17 21,259.04 24.62 11.07
V.Folha Murcha1...... 1,646.93 963.07 2,527.40 1,996.83 1,359.73 8,493.96 9.84 4.42
Subtotal........................ 19,179.78 6,394.40 23,345.88 18,333.75 19,077.65 86,331.46 100.00 44.96
TOTAL........................ 42,378.37 19,698.68 54,217.33 39,104.18 36,614.12 192,012.68 (X) 100.00
PERCENTAGE........... 22.07 10.26 28.24 20.37 19.07 100.00 (X) (X)
- Represents zero. (X) Not applicable. 1 V.Folha Murcha – Valencia Folha Murcha.

52
Table 28 – Oranges: Grove areas by planting year [2015 and 2016 inventories and changes observed]
Planting year1 2015
Inventory2
2016
Inventory2
Loss of groves3: changes between the 2025 and 2016 inventories observed in
each planting year
(hectares) (hectares) (hectares) (%)
1979 or previous years.................. 1,591 1,525 -66 -4.15
1980............................................... 177 149 -28 -15.82
1981............................................... 131 117 -14 -10.69
1982.............................................. 191 159 -32 -16.75
1983............................................... 547 494 -53 -9.69
1984.............................................. 264 245 -19 -7.20
1985.............................................. 2,395 2,075 -320 -13.36
1986.............................................. 2,325 1,718 -607 -26.11
1987.............................................. 1,542 1,422 -120 -7.78
1988.............................................. 1,558 1,368 -190 -12.20
1989.............................................. 3,093 2,381 -712 -23.02
1990.............................................. 5,337 4,440 -897 -16.81
1991.............................................. 4,585 4,038 -547 -11.93
1992.............................................. 3,750 3,340 -410 -10.93
1993.............................................. 4,888 4,308 -580 -11.87
1994.............................................. 4,436 3,796 -640 -14.43
1995.............................................. 4,652 3,991 -661 -14.21
1996.............................................. 4,069 3,487 -582 -14.30
1997.............................................. 5,766 5,328 -438 -7.60
1998.............................................. 8,723 7,614 -1,109 -12.71
1999.............................................. 9,701 8,289 -1,412 -14.56
2000.............................................. 15,460 13,538 -1,922 -12.43
2001.............................................. 11,844 10,833 -1,011 -8.54
2002.............................................. 18,586 16,056 -2,530 -13.61
2003.............................................. 22,693 20,447 -2,246 -9.90
2004.............................................. 28,064 25,087 -2,977 -10.61
2005.............................................. 29,891 27,136 -2,755 -9.22
2006.............................................. 32,997 30,991 -2,006 -6.08
2007.............................................. 37,050 34,870 -2,180 -5.88
2008.............................................. 40,333 38,229 -2,104 -5.22
2009.............................................. 28,210 26,570 -1,640 -5.81
2010.............................................. 22,840 21,045 -1,795 -7.86
2011.............................................. 22,498 21,783 -715 -3.18
2012.............................................. 23,305 22,536 -769 -3.30
20134.............................................. (X) 17,294 17,294 -2.70
Mature groves.............................. 403,492 386,699 -16,793 -4.16
20134.............................................. 17,774 (X) (X) (X)
2014............................................... 9,356 8,599 -757 -8.09
2015............................................... (X) 8,565 8,565 (X)
Young groves............................... 27,130 17,164 -9,966 -36.73
Total.............................................. 430,622 403,863 -26,759 -6.21
(X) Not applicable. 1 The information on planting year refers to the groves remaining at the time of data collection for this publication; in other words,
it does not portray all the groves formed in these years, as a result of eradication and renewal over time. 2 Snapshot of groves in March of the year mentioned. 3 Estimate of removed and abandoned groves from April/2015 to March/2016. 4 The groves implemented in 2013 belonged to the group of young groves in the 2015 inventory and began to be part of the mature
groves in this 2016 inventory.

53
Table 29 – Oranges: Trees by planting year [2015 and 2016 inventories and changes observed]
Planting year1 2015
Inventory2
2016
Inventory2
Loss of groves3: changes between the 2025 and 2016 inventories observed in
each planting year
(1,000 (1,000 (1,000 (%)
trees) trees) trees)
1979 or previous years.................. 450.71 452.70 1.99 0.44
1980.............................................. 59.16 50.65 -8.51 -14.38
1981.............................................. 42.21 40.23 -1.98 -4.69
1982.............................................. 67.16 57.64 -9.52 -14.18
1983.............................................. 162.49 152.58 -9.91 -6.10
1984.............................................. 78.24 76.05 -2.19 -2.80
1985.............................................. 573.87 536.10 -37.77 -6.58
1986.............................................. 663.27 543.32 -119.95 -18.08
1987.............................................. 486.71 460.84 -25.87 -5.32
1988.............................................. 474.71 453.20 -21.51 -4.53
1989.............................................. 960.86 811.41 -149.45 -15.55
1990.............................................. 1,682.88 1,522.09 -160.79 -9.55
1991.............................................. 1,425.69 1,301.13 -124.56 -8.74
1992.............................................. 1,235.23 1,162.14 -73.09 -5.92
1993.............................................. 1,567.64 1,442.68 -124.96 -7.97
1994.............................................. 1,485.40 1,329.29 -156.11 -10.51
1995.............................................. 1,721.15 1,540.81 -180.34 -10.48
1996.............................................. 1,417.44 1,265.16 -152.28 -10.74
1997.............................................. 2,078.84 1,962.11 -116.73 -5.62
1998.............................................. 3,169.90 2,881.00 -288.90 -9.11
1999.............................................. 3,367.30 3,069.42 -297.88 -8.85
2000.............................................. 5,273.02 4,949.89 -323.13 -6.13
2001.............................................. 4,311.43 4,132.59 -178.84 -4.15
2002.............................................. 6,411.57 6,132.44 -279.13 -4.35
2003.............................................. 8,391.43 7,922.77 -468.66 -5.58
2004.............................................. 10,746.29 10,039.69 -706.60 -6.58
2005.............................................. 12,925.17 11,690.86 -1,234.31 -9.55
2006.............................................. 14,575.50 13,876.05 -699.45 -4.80
2007.............................................. 17,392.03 16,666.29 -725.74 -4.17
2008.............................................. 19,493.31 18,897.54 -595.77 -3.06
2009.............................................. 13,734.37 13,171.86 -562.51 -4.10
2010.............................................. 12,195.31 11,223.29 -972.02 -7.97
2011.............................................. 12,458.29 12,240.70 -217.59 -1.75
2012.............................................. 13,047.36 12,827.19 -220.17 -1.69
20134............................................. (X) 10,666.05 -488.44 -4.38
Bearing trees................................ 174,125.94 175,547.76 1,421.82 0.82
Resets5........................................... 6,595.38 5,204.49 -1,390.89 -21.09
20134.............................................. 11,154.49 (X) (X) (X) 2014............................................... 5,983.45 5,620.29 -363.16 -6.07
2015............................................... (X) 5,640.14 5,640.14 (X)
Non-bearing trees........................ 23,733.32 16,464.92 -7,268.40 -30.63
Total............................................... 197,859.26 192,012.68 -5,846.58 -2.95
(X) Not applicable.
- Represents zero. 1 The information on planting year refers to the groves remaining at the time of data collection for this publication; in other words,
it does not portray all the groves formed in these years, as a result of eradication and renewal over time. 2 Snapshot of groves in March of the year mentioned. 3 Estimate of removed and abandoned groves from April/2015 to March/2016. 4 The groves implemented in 2013 belonged to the group of young groves in the 2015 inventory and began to be part of the mature
groves in this 2016 inventory. 5 Non-bearing trees in mature groves.

54
Table 30 – Oranges: Grove areas by sector and planting year [2016 inventory]
Planting year1
Sector
Total
North Northwest Central South Southwest
(hectares) (hectares) (hectares) (hectares) (hectares) (hectares)
1979 or previous years.................. 223 85 213 971 33 1,525
1980.............................................. 24 9 - 116 - 149
1981.............................................. 19 7 - 31 60 117
1982.............................................. 20 6 7 110 16 159
1983.............................................. 292 7 10 185 - 494
1984.............................................. 117 10 11 70 37 245
1985.............................................. 406 255 887 493 34 2,075
1986.............................................. 221 325 158 971 43 1,718
1987.............................................. 176 41 149 686 370 1,422
1988.............................................. 135 261 570 290 112 1,368
1989.............................................. 111 395 504 882 489 2,381
1990.............................................. 488 294 1,222 1,561 875 4,440
1991.............................................. 85 165 601 1,291 1,896 4,038
1992.............................................. 418 46 276 1,053 1,547 3,340
1993.............................................. 290 118 1,213 830 1,857 4,308
1994.............................................. 224 363 673 1,347 1,189 3,796
1995.............................................. 428 215 770 1,867 711 3,991
1996.............................................. 344 77 1,299 1,162 605 3,487
1997.............................................. 710 21 2,051 1,214 1,332 5,328
1998.............................................. 1,201 235 3,022 2,343 813 7,614
1999.............................................. 2,805 109 2,374 2,221 780 8,289
2000.............................................. 3,628 716 3,959 3,768 1,467 13,538
2001.............................................. 2,776 1,358 2,815 2,808 1,076 10,833
2002.............................................. 2,303 706 6,768 3,512 2,767 16,056
2003.............................................. 4,889 1,284 6,521 3,525 4,228 20,447
2004.............................................. 5,884 2,171 6,389 4,694 5,949 25,087
2005.............................................. 5,975 1,244 8,511 4,466 6,940 27,136
2006.............................................. 7,585 3,121 7,944 5,312 7,029 30,991
2007.............................................. 7,691 3,515 9,871 6,196 7,597 34,870
2008.............................................. 7,258 6,751 10,789 4,989 8,442 38,229
2009.............................................. 7,010 4,096 6,993 4,022 4,449 26,570
2010.............................................. 5,369 4,233 4,766 4,415 2,262 21,045
2011.............................................. 4,947 4,464 6,143 3,930 2,299 21,783
2012.............................................. 6,064 3,448 6,552 4,125 2,347 22,536
2013.............................................. 5,310 1,666 6,843 2,071 1,404 17,294
Mature groves............................. 85,426 41,817 110,874 77,527 71,055 386,699
2014.............................................. 1,598 888 3,197 1,879 1,037 8,599
2015.............................................. 884 1,314 1,228 4,429 710 8,565
Young groves............................... 2,482 2,202 4,425 6,308 1,747 17,164
Total............................................. 87,908 44,019 115,299 83,835 72,802 403,863
Percentage................................... 21.77 10.90 28.55 20.76 18.03 100.00
- Represents zero. 1 The information on planting year refers to the groves remaining at the time of data collection for this publication; in other words,
it does not portray all the groves formed in these years, as a result of eradication and renewal over time.

55
Table 31 – Oranges: Trees by sector and planting year [2016 inventory]
Planting year1
Sector
Total
North Northwest Central South Southwest
(1,000 trees)
(1,000 trees)
(1,000 trees)
(1,000 trees)
(1,000 trees)
(1,000 trees)
1979 or previous years................. 78.76 25.50 66.59 270.37 11.48 452.70
1980.............................................. 9.29 4.30 - 37.06 - 50.65
1981.............................................. 5.75 2.00 - 7.59 24.89 40.23
1982.............................................. 6.92 2.18 1.31 41.06 6.17 57.64
1983.............................................. 80.63 1.91 4.06 65.98 - 152.58
1984.............................................. 29.45 5.10 3.65 23.33 14.52 76.05
1985.............................................. 104.51 77.77 201.86 137.86 14.10 536.10
1986.............................................. 68.52 105.10 47.11 308.53 14.06 543.32
1987.............................................. 39.84 14.86 45.79 198.62 161.73 460.84
1988.............................................. 36.55 83.22 195.40 98.16 39.87 453.20
1989.............................................. 31.80 127.46 183.80 308.05 160.30 811.41
1990.............................................. 159.54 103.61 436.39 522.60 299.95 1,522.09
1991.............................................. 26.86 48.97 207.05 427.54 590.71 1,301.13
1992.............................................. 157.58 14.35 92.57 364.65 532.99 1,162.14
1993.............................................. 86.69 41.18 305.48 298.07 711.26 1,442.68
1994.............................................. 80.33 127.13 212.84 476.95 432.04 1,329.29
1995.............................................. 168.03 78.44 296.49 684.20 313.65 1,540.81
1996.............................................. 126.40 24.66 452.93 423.72 237.45 1,265.16
1997.............................................. 295.55 9.34 668.89 458.35 529.98 1,962.11
1998.............................................. 462.50 93.14 1,117.55 891.65 316.16 2,881.00
1999.............................................. 1,050.14 39.82 876.13 793.96 309.37 3,069.42
2000.............................................. 1,299.29 248.56 1,379.50 1,431.95 590.59 4,949.89
2001.............................................. 1,073.54 396.79 1,026.19 1,108.85 527.22 4,132.59
2002.............................................. 813.40 249.85 2,478.54 1,375.26 1,215.39 6,132.44
2003.............................................. 2,010.45 488.14 2,265.79 1,412.20 1,746.19 7,922.77
2004.............................................. 2,336.28 768.82 2,455.80 1,873.61 2,605.18 10,039.69
2005.............................................. 2,362.18 509.71 3,519.27 1,856.99 3,442.71 11,690.86
2006.............................................. 3,309.33 1,284.18 3,434.64 2,399.10 3,448.80 13,876.05
2007.............................................. 3,753.57 1,408.83 4,594.55 2,810.94 4,098.40 16,666.29
2008.............................................. 3,579.89 3,125.19 5,264.35 2,315.38 4,612.73 18,897.54
2009.............................................. 3,595.83 1,854.62 3,392.17 1,937.43 2,391.81 13,171.86
2010.............................................. 2,812.64 1,966.10 2,626.36 2,428.71 1,389.48 11,223.29
2011.............................................. 2,823.54 2,183.99 3,591.55 2,199.66 1,441.96 12,240.70
2012.............................................. 3,472.08 1,675.97 3,703.08 2,481.76 1,494.30 12,827.19
2013.............................................. 3,256.52 864.51 4,340.10 1,263.39 941.53 10,666.05
Bearing trees............................... 39,604.18 18,055.30 49,487.78 33,733.53 34,666.97 175,547.76
Resets2.......................................... 1,236.81 271.76 1,717.69 1,258.98 719.25 5,204.49
2014.............................................. 1,037.11 534.41 2,124.85 1,175.70 748.22 5,620.29
2015.............................................. 500.27 837.21 887.01 2,935.97 479.68 5,640.14
Non-bearing trees....................... 2,774.19 1,643.38 4,729.55 5,370.65 1,947.15 16,464.92
Total............................................. 42,378.37 19,698.68 54,217.33 39,104.18 36,614.12 192,012.68
Percentange................................. 22.07 10.26 28.24 20.37 19.07 100.00
- Represents zero.
1 The information on planting year refers to the groves remaining at the time of data collection for this publication; in other words,
it does not portray all the groves formed in these years, as a result of eradication and renewal over time. 2 Non-bearing trees in mature groves.
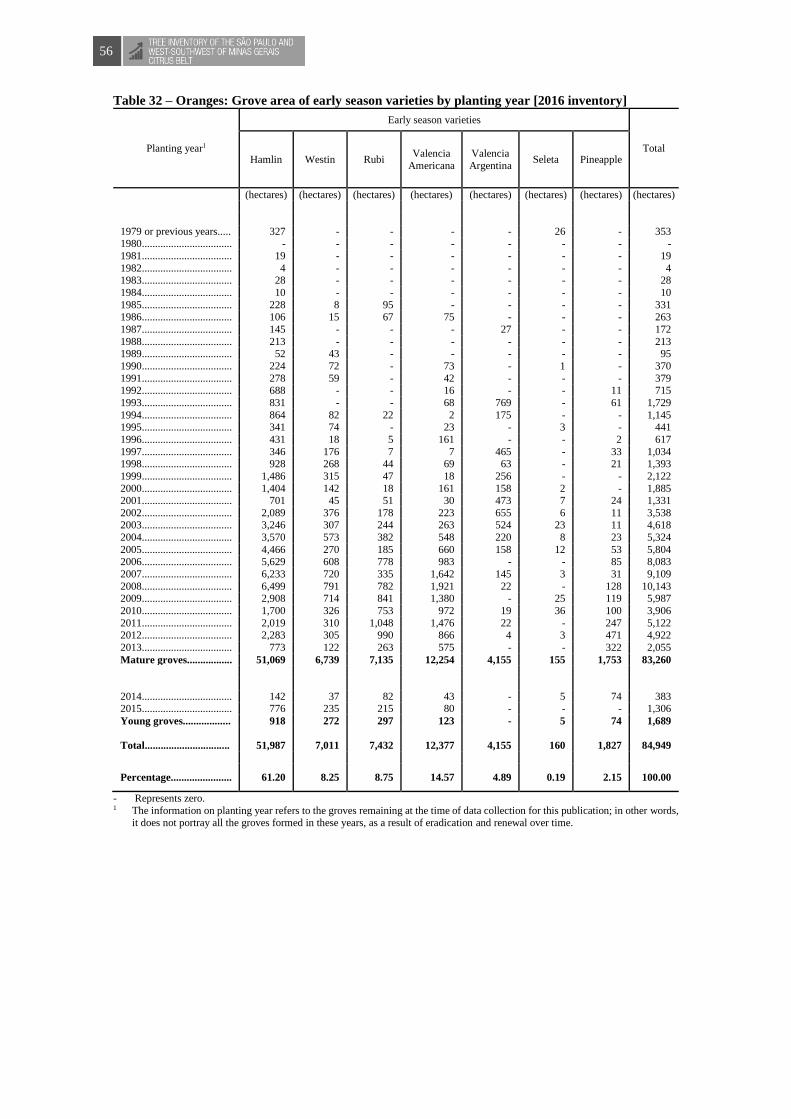
56
Table 32 – Oranges: Grove area of early season varieties by planting year [2016 inventory]
Planting year1
Early season varieties
Total Hamlin Westin Rubi
Valencia
Americana
Valencia
Argentina Seleta Pineapple
(hectares) (hectares) (hectares) (hectares) (hectares) (hectares) (hectares) (hectares)
1979 or previous years..... 327 - - - - 26 - 353 1980.................................. - - - - - - - -
1981.................................. 19 - - - - - - 19
1982.................................. 4 - - - - - - 4 1983.................................. 28 - - - - - - 28
1984.................................. 10 - - - - - - 10
1985.................................. 228 8 95 - - - - 331 1986.................................. 106 15 67 75 - - - 263
1987.................................. 145 - - - 27 - - 172
1988.................................. 213 - - - - - - 213 1989.................................. 52 43 - - - - - 95
1990.................................. 224 72 - 73 - 1 - 370
1991.................................. 278 59 - 42 - - - 379 1992.................................. 688 - - 16 - - 11 715
1993.................................. 831 - - 68 769 - 61 1,729
1994.................................. 864 82 22 2 175 - - 1,145 1995.................................. 341 74 - 23 - 3 - 441
1996.................................. 431 18 5 161 - - 2 617
1997.................................. 346 176 7 7 465 - 33 1,034 1998.................................. 928 268 44 69 63 - 21 1,393
1999.................................. 1,486 315 47 18 256 - - 2,122
2000.................................. 1,404 142 18 161 158 2 - 1,885 2001.................................. 701 45 51 30 473 7 24 1,331
2002.................................. 2,089 376 178 223 655 6 11 3,538 2003.................................. 3,246 307 244 263 524 23 11 4,618
2004.................................. 3,570 573 382 548 220 8 23 5,324
2005.................................. 4,466 270 185 660 158 12 53 5,804 2006.................................. 5,629 608 778 983 - - 85 8,083
2007.................................. 6,233 720 335 1,642 145 3 31 9,109
2008.................................. 6,499 791 782 1,921 22 - 128 10,143 2009.................................. 2,908 714 841 1,380 - 25 119 5,987
2010.................................. 1,700 326 753 972 19 36 100 3,906
2011.................................. 2,019 310 1,048 1,476 22 - 247 5,122 2012.................................. 2,283 305 990 866 4 3 471 4,922
2013.................................. 773 122 263 575 - - 322 2,055
Mature groves................. 51,069 6,739 7,135 12,254 4,155 155 1,753 83,260
2014.................................. 142 37 82 43 - 5 74 383 2015.................................. 776 235 215 80 - - - 1,306
Young groves.................. 918 272 297 123 - 5 74 1,689
Total................................ 51,987 7,011 7,432 12,377 4,155 160 1,827 84,949
Percentage....................... 61.20 8.25 8.75 14.57 4.89 0.19 2.15 100.00
- Represents zero. 1 The information on planting year refers to the groves remaining at the time of data collection for this publication; in other words,
it does not portray all the groves formed in these years, as a result of eradication and renewal over time.
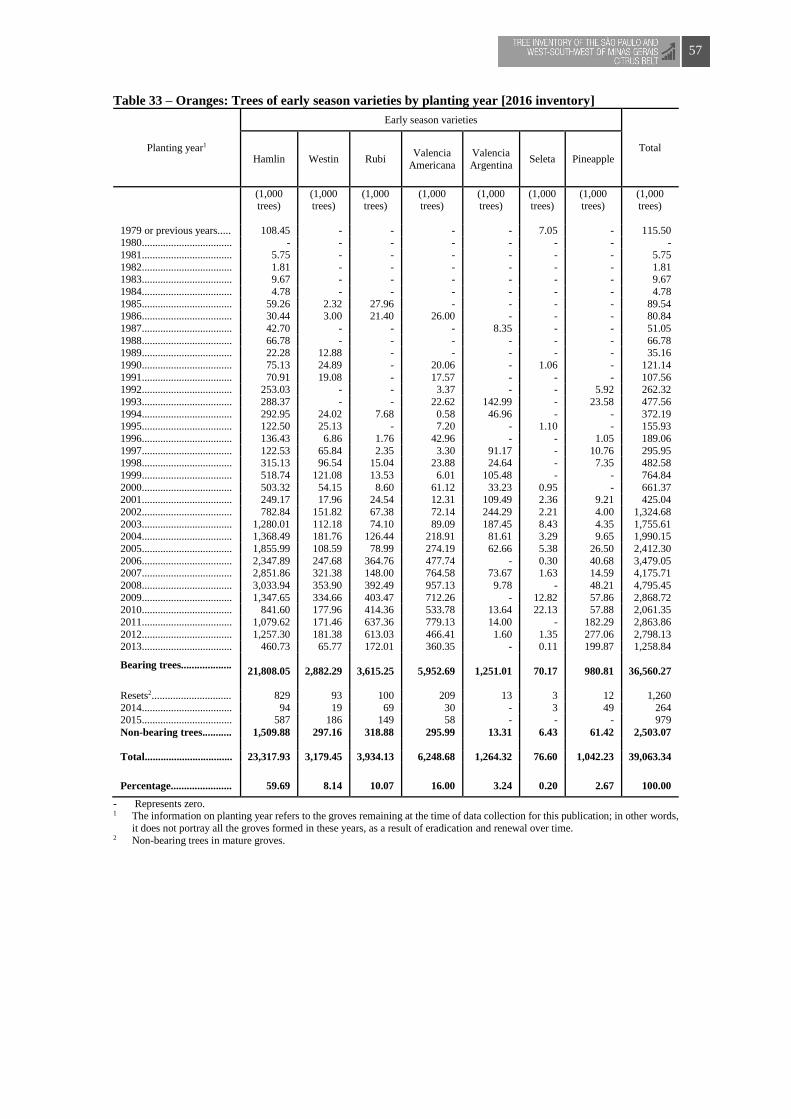
57
Table 33 – Oranges: Trees of early season varieties by planting year [2016 inventory]
Planting year1
Early season varieties
Total Hamlin Westin Rubi
Valencia
Americana
Valencia
Argentina Seleta Pineapple
(1,000 trees)
(1,000 trees)
(1,000 trees)
(1,000 trees)
(1,000 trees)
(1,000 trees)
(1,000 trees)
(1,000 trees)
1979 or previous years..... 108.45 - - - - 7.05 - 115.50 1980.................................. - - - - - - - -
1981.................................. 5.75 - - - - - - 5.75
1982.................................. 1.81 - - - - - - 1.81 1983.................................. 9.67 - - - - - - 9.67
1984.................................. 4.78 - - - - - - 4.78
1985.................................. 59.26 2.32 27.96 - - - - 89.54 1986.................................. 30.44 3.00 21.40 26.00 - - - 80.84
1987.................................. 42.70 - - - 8.35 - - 51.05
1988.................................. 66.78 - - - - - - 66.78 1989.................................. 22.28 12.88 - - - - - 35.16
1990.................................. 75.13 24.89 - 20.06 - 1.06 - 121.14
1991.................................. 70.91 19.08 - 17.57 - - - 107.56 1992.................................. 253.03 - - 3.37 - - 5.92 262.32
1993.................................. 288.37 - - 22.62 142.99 - 23.58 477.56
1994.................................. 292.95 24.02 7.68 0.58 46.96 - - 372.19 1995.................................. 122.50 25.13 - 7.20 - 1.10 - 155.93
1996.................................. 136.43 6.86 1.76 42.96 - - 1.05 189.06
1997.................................. 122.53 65.84 2.35 3.30 91.17 - 10.76 295.95 1998.................................. 315.13 96.54 15.04 23.88 24.64 - 7.35 482.58
1999.................................. 518.74 121.08 13.53 6.01 105.48 - - 764.84
2000.................................. 503.32 54.15 8.60 61.12 33.23 0.95 - 661.37 2001.................................. 249.17 17.96 24.54 12.31 109.49 2.36 9.21 425.04
2002.................................. 782.84 151.82 67.38 72.14 244.29 2.21 4.00 1,324.68
2003.................................. 1,280.01 112.18 74.10 89.09 187.45 8.43 4.35 1,755.61 2004.................................. 1,368.49 181.76 126.44 218.91 81.61 3.29 9.65 1,990.15
2005.................................. 1,855.99 108.59 78.99 274.19 62.66 5.38 26.50 2,412.30
2006.................................. 2,347.89 247.68 364.76 477.74 - 0.30 40.68 3,479.05 2007.................................. 2,851.86 321.38 148.00 764.58 73.67 1.63 14.59 4,175.71
2008.................................. 3,033.94 353.90 392.49 957.13 9.78 - 48.21 4,795.45
2009.................................. 1,347.65 334.66 403.47 712.26 - 12.82 57.86 2,868.72 2010.................................. 841.60 177.96 414.36 533.78 13.64 22.13 57.88 2,061.35
2011.................................. 1,079.62 171.46 637.36 779.13 14.00 - 182.29 2,863.86
2012.................................. 1,257.30 181.38 613.03 466.41 1.60 1.35 277.06 2,798.13 2013.................................. 460.73 65.77 172.01 360.35 - 0.11 199.87 1,258.84
Bearing trees...................
21,808.05 2,882.29 3,615.25 5,952.69 1,251.01 70.17 980.81 36,560.27
Resets2.............................. 829 93 100 209 13 3 12 1,260
2014.................................. 94 19 69 30 - 3 49 264 2015.................................. 587 186 149 58 - - - 979
Non-bearing trees........... 1,509.88 297.16 318.88 295.99 13.31 6.43 61.42 2,503.07
Total................................. 23,317.93 3,179.45 3,934.13 6,248.68 1,264.32 76.60 1,042.23 39,063.34
Percentage....................... 59.69 8.14 10.07 16.00 3.24 0.20 2.67 100.00
- Represents zero. 1 The information on planting year refers to the groves remaining at the time of data collection for this publication; in other words,
it does not portray all the groves formed in these years, as a result of eradication and renewal over time. 2 Non-bearing trees in mature groves.

58
Table 34 – Oranges: Grove area of mid-season and late season varieties by planting year [2016
inventory]
Planting year1
Mid-season and late season varieties
Total Pera Rio2 Valencia Natal
Valencia Folha
Murcha
(hectares) (hectares) (hectares) (hectares) (hectares)
1979 or previous years..... 234 712 226 - 1,172
1980.................................. 37 55 48 9 149 1981.................................. 10 31 57 - 98
1982.................................. 66 52 37 - 155
1983.................................. 151 85 230 - 466 1984.................................. 62 90 83 - 235
1985.................................. 428 440 876 - 1,744
1986.................................. 476 440 507 32 1,455
1987.................................. 368 286 559 37 1,250
1988.................................. 425 249 456 25 1,155
1989.................................. 866 891 454 75 2,286 1990.................................. 1,221 1,750 873 226 4,070
1991.................................. 1,352 1,099 1,163 45 3,659
1992.................................. 1,256 809 485 75 2,625 1993.................................. 979 877 585 138 2,579
1994.................................. 1,108 910 471 162 2,651
1995.................................. 1,331 1,598 425 196 3,550 1996.................................. 1,019 1,082 501 268 2,870
1997.................................. 1,241 2,379 578 96 4,294
1998.................................. 1,973 3,322 447 479 6,221 1999.................................. 2,083 3,358 401 325 6,167
2000.................................. 3,451 5,717 1,637 848 11,653
2001.................................. 2,543 4,278 2,110 571 9,502 2002.................................. 3,026 6,656 2,457 379 12,518
2003.................................. 5,879 7,393 2,327 230 15,829
2004.................................. 6,697 8,743 3,693 630 19,763
2005.................................. 7,430 8,942 4,165 795 21,332
2006.................................. 8,174 9,761 3,775 1,198 22,908
2007.................................. 10,404 10,563 3,493 1,301 25,761 2008.................................. 12,616 9,530 3,955 1,985 28,086
2009.................................. 11,289 6,369 1,649 1,276 20,583
2010.................................. 10,244 5,036 1,029 830 17,139 2011.................................. 8,802 5,704 1,353 802 16,661
2012.................................. 9,080 6,114 1,688 732 17,614
2013.................................. 8,058 4,140 1,917 1,124 15,239
Mature groves................. 124,379 119,461 44,710 14,889 303,439
2014.................................. 4,050 2,170 981 1,015 8,216
2015.................................. 3,984 1,189 1,825 261 7,259
Young groves.................. 8,034 3,359 2,806 1,276 15,475
Total................................. 132,413 122,820 47,516 16,165 318,914
Percentage....................... 41.52 38.51 14.90 5.07 100.00
- Represents zero. 1 The information on planting year refers to the groves remaining at the time of data collection for this publication; in other words,
it does not portray all the groves formed in these years, as a result of eradication and renewal over time. 2 The area covered by orange groves of the João Nunes variety was added to the area of the Pera Rio variety, since they both have
the same maturation stage.

59
Table 35 – Oranges: Trees of mid-season and late season varieties by planting year [2016 inventory]
Planting year1
Mid-season and late season varieties
Total Pera Rio2 Valencia Natal
Valencia Folha Murcha
(1,000 trees) (1,000 trees) (1,000 trees) (1,000 trees) (1,000 trees)
1979 or previous years..... 61.23 206.37 69.60 - 337.20
1980.................................. 14.92 15.76 17.90 2.07 50.65 1981.................................. 2.65 7.59 24.24 - 34.48
1982.................................. 24.77 17.97 13.09 - 55.83
1983.................................. 54.05 29.92 58.94 - 142.91 1984.................................. 18.81 22.63 29.83 - 71.27
1985.................................. 122.61 137.87 186.08 - 446.56
1986.................................. 156.57 141.70 152.28 11.93 462.48
1987.................................. 153.31 97.94 150.46 8.08 409.79
1988.................................. 143.07 84.76 150.85 7.74 386.42
1989.................................. 298.31 308.72 144.49 24.73 776.25 1990.................................. 439.31 577.24 302.42 81.98 1,400.95
1991.................................. 452.76 360.83 362.27 17.71 1,193.57
1992.................................. 417.93 290.20 165.95 25.74 899.82 1993.................................. 359.57 310.95 243.75 50.85 965.12
1994.................................. 429.51 307.54 155.29 64.76 957.10
1995.................................. 569.05 577.41 156.95 81.47 1,384.88 1996.................................. 387.13 389.46 173.94 125.57 1,076.10
1997.................................. 516.86 918.48 186.92 43.90 1,666.16
1998.................................. 742.01 1,279.96 156.87 219.58 2,398.42 1999.................................. 793.74 1,234.53 145.78 130.53 2,304.58
2000.................................. 1,304.84 2,054.86 576.02 352.80 4,288.52
2001.................................. 1,004.56 1,766.98 698.24 237.77 3,707.55 2002.................................. 1,117.83 2,579.07 963.81 147.05 4,807.76
2003.................................. 2,337.86 2,838.55 902.51 88.24 6,167.16 2004.................................. 2,813.33 3,469.78 1,507.27 259.16 8,049.54
2005.................................. 3,402.35 3,740.61 1,793.21 342.39 9,278.56
2006.................................. 3,867.97 4,343.33 1,623.55 562.15 10,397.00 2007.................................. 5,063.18 5,071.99 1,680.39 675.02 12,490.58
2008.................................. 6,291.31 4,772.31 1,978.08 1,060.39 14,102.09
2009.................................. 5,616.59 3,184.55 812.54 689.46 10,303.14 2010.................................. 5,522.40 2,650.81 532.17 456.56 9,161.94
2011.................................. 4,884.37 3,268.36 756.74 467.37 9,376.84
2012.................................. 5,250.93 3,432.36 890.31 455.46 10,029.06 2013.................................. 5,032.39 2,529.29 1,124.30 721.23 9,407.21
Bearing trees................... 59,668.08 53,020.68 18,887.04 7,411.69 138,987.49
Resets3.............................. 1,683.78 1,499.13 548.75 213.09 3,944.75 2014.................................. 2,641.45 1,338.59 678.27 698.07 5,356.38
2015.................................. 2,624.57 720.06 1,144.98 171.11 4,660.72
Non-bearing trees........... 6,949.80 3,557.78 2,372.00 1,082.27 13,961.85
Total................................. 66,617.88 56,578.46 21,259.04 8,493.96 152,949.34
Percentage........................ 43.56 36.99 13.90 5.55 100.00
- Represents zero. 1 The information on planting year refers to the groves remaining at the time of data collection for this publication; in other words,
it does not portray all the groves formed in these years, as a result of eradication and renewal over time. 2 The area covered by orange groves of the João Nunes variety was added to the area of the Pera Rio variety, since they both have
the same maturation stage. 3 Non-bearing trees in mature groves.

60
Table 36 – Oranges: Density1 planting of mature and young groves by sector and region [2015 and
2016 inventories]
Sector and region
2015 inventory 2016 inventory
Young groves2
Mature groves3
Young groves2
Mature groves3
(trees/hectare) (trees/hectare) (trees/hectare) (trees/hectare)
NORTH
Triângulo Mineiro........................................... 596 463 591 479
Bebedouro....................................................... 655 450 623 473
Altinópolis....................................................... 540 496 781 496
Average .................................................................. 631 459 618 478
NORTHWEST
Votuporanga.................................................... 497 411 445 419
São José do Rio Preto..................................... 588 443 639 455
Average .................................................................. 540 426 621 438
CENTRAL
Matão.............................................................. 648 414 700 451
Duartina.......................................................... 611 456 663 473
Brotas.............................................................. 639 380 670 454
Average................................................................... 631 427 679 462
SOUTH
Porto Ferreira.................................................. 662 435 688 455
Limeira............................................................ 658 441 555 448
Average................................................................... 661 438 650 451
SOUTHWEST
Avaré............................................................... 711 492 698 491
Itapetininga..................................................... 640 503 712 518
Average................................................................... 692 495 702 498
AVERAGE GENERAL........................................ 631 448 654 467
1 Average density planting weighted per stratum area. 2 Groves implemented in 2014 or 2015. 3 Groves implemented in 2013 or in previous years. The calculation considers the total number of trees of the block, that is, bearing
and non-bearing trees (2014 or 2015 resets).

61
Table 37 – Oranges: Density1 planting of mature and young groves by variety and maturation stage
[2015 and 2016 inventories]
Variety
2015 inventory 2016 inventory
Young
groves2
Mature
groves3
Young
groves2
Mature
groves3
(trees/hectare) (trees/hectare) (trees/hectare) (trees/hectare)
EARLY SEASON
Hamlin................................................................. 624 432 742 443
Westin.................................................................. 649 431 741 441
Rubi...................................................................... 746 510 738 521
Valencia Americana............................................. 653 480 710 503
Valencia Argentina.............................................. (NA) 300 (NA) 304
Seleta.................................................................... 725 447 695 464
Pineapple.............................................................. 545 523 664 565
Average................................................................... 637 440 735 454
MID-SEASON
Pera Rio............................................................... 637 472 654 493
João Nunes........................................................... (NA) 544 (NA) 594
Average................................................................... 637 472 654 493
LATE SEASON
Valencia............................................................... 622 435 611 456
Natal..................................................................... 607 418 649 434
Valencia Folha Murcha........................................ 652 489 675 511
Average................................................................... 624 435 636 455
GENERAL AVERAGE......................................... 631 448 654 467
NA, Not Available.
1 Average density planting weighted per stratum area. 2 Groves implemented in 2014 or 2015. 3 Groves implemented in 2013 or in previous years. The calculation considers the total number of trees of the block, that is, bearing
and non-bearing trees (2014 or 2015 resets).

62
Table 38 – Oranges: Density1 planting of young groves by variety and region [2016 inventory]
NA, Not Available.
1 Average density planting weighted per stratum area. 2 TMG – Triângulo Mineiro. 3 BEB – Bebedouro. 4 ALT – Altinópolis. 5 VOT – Votuporanga. 6 SJO – São José do Rio Preto. 7 MAT – Matão. 8 DUA – Duartina. 9 BRO – Brotas. 10 PFE – Porto Ferreira. 11 LIM – Limeira. 12 AVA – Avaré. 13 ITG – Itapetininga. 14 V.Folha Murcha – Valencia Folha Murcha.
Variety
Region
Average
TMG2 BEB3 ALT4 VOT5 SJO6 MAT7 DUA8 BRO9 PFE10 LIM11 AVA12 ITG13
(trees/
hectare)
(trees/
hectare)
(trees/
hectare)
(trees/
hectare)
(trees/
hectare)
(trees/
hectare)
(trees/
hectare)
(trees/
hectare)
(trees/
hectare)
(trees/
hectare)
(trees/
hectare)
(trees/
hectare)
(trees/
hectare)
EARLY SEASON
Hamlin...................... (NA) 659 (NA) (NA) 811 548 643 (NA) 786 472 582 (NA) 742
Westin....................... (NA) (NA) (NA) 351 (NA) (NA) (NA) 765 774 460 641 (NA) 741
Rubi........................... (NA) 1048 1049 (NA) 766 (NA) 465 (NA) 632 369 889 721 738
Valencia Americana.. (NA) 666 673 (NA) 581 (NA) (NA) (NA) (NA) 577 880 707 710
Valencia Argentina.... (NA) 567 (NA) (NA) (NA) (NA) 732 (NA) (NA) (NA) (NA) (NA) 695
Seleta......................... 337 683 (NA) (NA) (NA) (NA) (NA) 685 (NA) (NA) (NA) 631 664
Pineapple................... 337 791 775 351 802 548 646 699 757 462 697 709 735
Average…….…........ 598 622 792 441 542 721 666 664 672 635 685 710 654
MID-SEASON
Pera Rio..................... 598 622 792 441 542 721 666 664 672 635 685 710 654
João Nunes................ (NA) (NA) (NA) (NA) (NA) (NA) (NA) (NA) (NA) (NA) (NA) (NA) (NA)
Average…….…........ 598 622 792 441 542 721 666 664 672 635 685 710 654
LATE SEASON
Valencia..................... 572 586 (NA) 432 577 653 648 650 689 503 660 747 611
Natal.......................... 583 593 (NA) 530 767 679 707 689 649 526 704 587 649
V.Folha Murcha14..... 723 668 (NA) (NA) 563 649 696 686 692 554 971 (NA) 675
Average…….…........ 579 609 (NA) 474 677 658 663 678 671 520 723 719 636
GENERAL AVERAGE 591 623 781 445 639 700 663 670 688 555 698 712 654

63
Table 39 – Oranges: Density1 planting of mature groves by variety and region [2016 inventory]
NA, Not Available.
1 Average density planting weighted per stratum area. The calculation for groves older than 2 years considers the total number of trees of the block, that is, bearing and non-bearing trees (2014 or 2015 resets).
2 TMG – Triângulo Mineiro. 3 BEB – Bebedouro. 4 ALT – Altinópolis. 5 VOT – Votuporanga. 6 SJO – São José do Rio Preto. 7 MAT – Matão. 8 DUA – Duartina. 9 BRO – Brotas. 10 PFE – Porto Ferreira. 11 LIM – Limeira. 12 AVA – Avaré. 13 ITG – Itapetininga. 14 V.Folha Murcha – Valencia Folha Murcha.
Variety
Region
Average
TMG2 BEB3 ALT4 VOT5 SJO6 MAT7 DUA8 BRO9 PFE10 LIM11 AVA12 ITG13
(trees/
hectare)
(trees/
hectare)
(trees/
hectare)
(trees/
hectare)
(trees/
hectare)
(trees/
hectare)
(trees/
hectare)
(trees/
hectare)
(trees/
hectare)
(trees/
hectare)
(trees/
hectare)
(trees/
hectare)
(trees/
hectare)
EARLY SEASON
Hamlin...................... 437 433 503 380 445 422 445 438 463 447 455 464 443
Westin....................... 462 409 535 298 340 389 414 434 521 451 452 476 441
Rubi........................... 588 532 592 479 518 503 533 419 566 568 480 539 521
Valencia Americana.. 559 546 499 428 494 475 508 466 455 502 515 524 503
Valencia Argentina.... 412 393 488 (NA) 258 254 (NA) 528 322 412 365 515 304
Seleta......................... (NA) (NA) (NA) (NA) (NA) (NA) 577 (NA) 522 395 361 (NA) 464
Pineapple................... (NA) 478 653 277 507 594 420 673 602 423 463 700 565
Average…….……... 450 458 511 390 450 416 465 447 478 455 458 519 454
MID-SEASON
Pera Rio..................... 534 536 522 418 469 513 497 500 480 485 511 490 493
João Nunes................ 594 (NA) (NA) (NA) (NA) (NA) (NA) (NA) (NA) (NA) (NA) (NA) 594
Average…….……... 534 536 522 418 469 513 497 500 480 485 511 490 493
LATE SEASON
Valencia..................... 465 456 472 452 464 455 448 436 434 411 490 576 456
Natal.......................... 443 405 450 399 395 330 451 409 415 450 492 487 434
V.Folha Murcha14...... 558 515 504 500 548 560 524 489 462 438 554 561 511
Average…….……... 461 450 472 442 451 433 456 435 432 420 494 536 455
GENERAL AVERAGE 479 473 496 419 455 451 473 454 455 448 491 518 467

64
Table 40 – Oranges: Density1 planting of groves younger than 11 years by variety and region [2016
inventory]
NA, Not Available.
1 Average density planting weighted per stratum area. The calculation for groves older than 2 years considers the total number of
trees of the block, that is, bearing and non-bearing trees (2014 or 2015 resets). 2 TMG – Triângulo Mineiro. 3 BEB – Bebedouro. 4 ALT – Altinópolis. 5 VOT – Votuporanga. 6 SJO – São José do Rio Preto. 7 MAT – Matão. 8 DUA – Duartina. 9 BRO – Brotas. 10 PFE – Porto Ferreira. 11 LIM – Limeira. 12 AVA – Avaré. 13 ITG – Itapetininga. 14 V.Folha Murcha – Valencia Folha Murcha.
Variety
Region
Average
TMG2 BEB3 ALT4 VOT5 SJO6 MAT7 DUA8 BRO9 PFE10 LIM11 AVA12 ITG13
(trees/
hectare)
(trees/
hectare)
(trees/
hectare)
(trees/
hectare)
(trees/
hectare)
(trees/
hectare)
(trees/
hectare)
(trees/
hectare)
(trees/
hectare)
(trees/
hectare)
(trees/
hectare)
(trees/
hectare)
(trees/
hectare)
EARLY SEASON
Hamlin........................... 492 489 541 405 485 454 511 504 584 497 497 535 497
Westin............................ 494 480 487 311 466 404 479 687 611 465 506 503 507
Rubi............................... 588 612 605 480 595 505 545 521 656 603 529 592 568
Valencia Americana….. 559 561 504 433 500 539 542 559 532 558 543 605 535
Valencia Argentina........ (NA) (NA) 488 (NA) (NA) 514 (NA) (NA) 721 (NA) (NA) 515 532
Seleta............................. (NA) 567 (NA) (NA) (NA) (NA) 619 (NA) 522 511 (NA) (NA) 592
Pineapple....................... 337 504 653 277 517 594 511 677 602 498 540 718 594
Average…..………....... 506 522 544 406 500 491 523 527 597 496 510 599 517
MID-SEASON
Pera Rio......................... 571 575 569 429 527 609 555 585 581 556 577 642 553
João Nunes.................... 610 (NA) (NA) (NA) (NA) (NA) (NA) (NA) (NA) (NA) (NA) (NA) 610
Average…..………...... 571 575 569 429 527 609 555 585 581 556 577 642 553
LATE SEASON
Valencia........................ 508 526 513 492 494 531 538 544 561 466 566 609 530
Natal.............................. 487 524 429 442 584 456 538 522 569 526 551 569 531
V.Folha Murcha14…….. 568 566 517 531 562 622 585 579 623 478 652 608 578
Average…..………....... 505 532 501 485 524 532 543 541 570 481 568 596 536
GENERAL AVERAGE 528 543 533 434 516 546 543 554 580 515 558 610 538
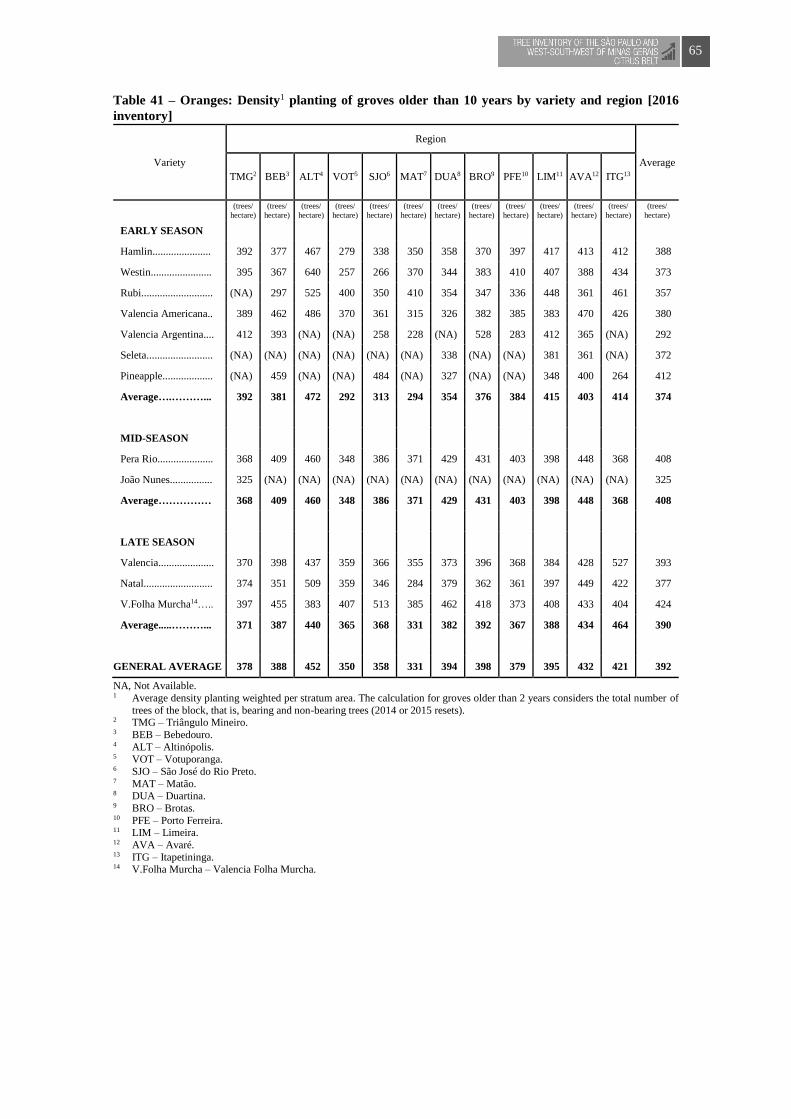
65
Table 41 – Oranges: Density1 planting of groves older than 10 years by variety and region [2016
inventory]
NA, Not Available.
1 Average density planting weighted per stratum area. The calculation for groves older than 2 years considers the total number of
trees of the block, that is, bearing and non-bearing trees (2014 or 2015 resets). 2 TMG – Triângulo Mineiro. 3 BEB – Bebedouro. 4 ALT – Altinópolis. 5 VOT – Votuporanga. 6 SJO – São José do Rio Preto. 7 MAT – Matão. 8 DUA – Duartina. 9 BRO – Brotas. 10 PFE – Porto Ferreira. 11 LIM – Limeira. 12 AVA – Avaré. 13 ITG – Itapetininga. 14 V.Folha Murcha – Valencia Folha Murcha.
Variety
Region
Average
TMG2 BEB3 ALT4 VOT5 SJO6 MAT7 DUA8 BRO9 PFE10 LIM11 AVA12 ITG13
(trees/
hectare)
(trees/
hectare)
(trees/
hectare)
(trees/
hectare)
(trees/
hectare)
(trees/
hectare)
(trees/
hectare)
(trees/
hectare)
(trees/
hectare)
(trees/
hectare)
(trees/
hectare)
(trees/
hectare)
(trees/
hectare)
EARLY SEASON
Hamlin...................... 392 377 467 279 338 350 358 370 397 417 413 412 388
Westin....................... 395 367 640 257 266 370 344 383 410 407 388 434 373
Rubi........................... (NA) 297 525 400 350 410 354 347 336 448 361 461 357
Valencia Americana.. 389 462 486 370 361 315 326 382 385 383 470 426 380
Valencia Argentina.... 412 393 (NA) (NA) 258 228 (NA) 528 283 412 365 (NA) 292
Seleta......................... (NA) (NA) (NA) (NA) (NA) (NA) 338 (NA) (NA) 381 361 (NA) 372
Pineapple................... (NA) 459 (NA) (NA) 484 (NA) 327 (NA) (NA) 348 400 264 412
Average….………... 392 381 472 292 313 294 354 376 384 415 403 414 374
MID-SEASON
Pera Rio..................... 368 409 460 348 386 371 429 431 403 398 448 368 408
João Nunes................ 325 (NA) (NA) (NA) (NA) (NA) (NA) (NA) (NA) (NA) (NA) (NA) 325
Average…………… 368 409 460 348 386 371 429 431 403 398 448 368 408
LATE SEASON
Valencia..................... 370 398 437 359 366 355 373 396 368 384 428 527 393
Natal.......................... 374 351 509 359 346 284 379 362 361 397 449 422 377
V.Folha Murcha14….. 397 455 383 407 513 385 462 418 373 408 433 404 424
Average.....………... 371 387 440 365 368 331 382 392 367 388 434 464 390
GENERAL AVERAGE 378 388 452 350 358 331 394 398 379 395 432 421 392

66
Table 42 – Oranges: Density1 planting of groves by planting year [2016 inventory]
Planting year2 Orange groves
(trees/hectare)
1979 or previous years.............. 325
1980........................................... 366
1981........................................... 355 1982........................................... 373
1983........................................... 325
1984........................................... 318 1985........................................... 270
1986........................................... 326
1987........................................... 332 1988........................................... 342
1989........................................... 352
1990........................................... 356 1991........................................... 331
1992........................................... 354 1993........................................... 342
1994........................................... 361
1995........................................... 398 1996........................................... 373
1997........................................... 377
1998........................................... 391 1999........................................... 384
2000........................................... 376
2001........................................... 390 2002........................................... 393
2003........................................... 399
2004........................................... 412 2005........................................... 443
2006........................................... 463
2007........................................... 496 2008........................................... 510
2009........................................... 510
2010........................................... 548 2011........................................... 576
2012........................................... 582
2013........................................... 630
Mature groves.......................... 467
2014........................................... 653 2015........................................... 656
Young groves........................... 654
Average..................................... 475 1 Average density planting weighted per stratum area. The calculation for mature groves considers the total number of trees of the
block, that is, bearing and non-bearing trees (2014 or 2015 resets). 2 The information on planting year refers to the groves remaining at the time of data collection for this publication; in other words,
it does not portray all the groves formed in these years, as a result of eradication and renewal over time.

67
Table 43 – Oranges: Area of groves irrigated, non-irrigated or without information by sector and
region1 [2016 inventory]
Sector and region Irrigated groves Non-irrigated groves or
without irrigation information
(hectares) (hectares)
NORTH Triângulo Mineiro......................... 16,111 8.563 Bebedouro..................................... 28,887 22.802 Altinópolis..................................... 192 10.965 Subtotal ....................................................... 45,190 42,330 NORTHWEST Votuporanga.................................. 5,212 15.129 São José do Rio Preto.................... 9,090 14.299 Subtotal........................................................ 14,302 29,428 CENTRAL Matão............................................. 13,748 27.836 Duartina......................................... 8,581 46.452 Brotas............................................ 641 19.111 Subtotal........................................................ 22,970 93,399 SOUTH Porto Ferreira................................. 7,359 30.793 Limeira.......................................... 4,237 38.690 Subtotal........................................................ 11,596 69,483 SOUTHWEST
Avaré............................................. 5,008 51.754 Itapetininga.................................... 147 18.254
Subtotal ....................................................... 5,155 70,008 TOTAL......................................................... 99,214 304,649
PERCENTAGE........................................... 24.57 75.43
1 The area of irrigated groves, non-irrigated groves and those with no information about irrigation – by sector, region, variety, age,
and method – was updated by applying the proportion of groves in each category obtained from the 2015 assessment to the area
of orange groves mesasured in the 2016 assessment.

68
Table 44 – Oranges: Area of groves irrigated, non-irrigated or without information by variety1 [2016
inventory]
Variety Irrigated groves Non-irrigated groves or without
information
(hectares) (hectares)
EARLY SEASON
Hamlin...................................................................... 12,880 40,232
Westin....................................................................... 1,839 5,236
Rubi.......................................................................... 1,737 5,386
Valencia Americana................................................. 2,782 9,922
Valencia Argentina................................................... 2,793 1,775
Seleta........................................................................ 31 132
Pineapple.................................................................. 229 1,625
Subtotal........................................................................ 22,291 64,308
MID-SEASON
Pera Rio ................................................................... 29,800 101,685
João Nunes............................................................... - 9
Subtotal........................................................................ 29,800 101,694
LATE SEASON
Valencia.................................................................... 29,474 93,233
Natal......................................................................... 14,816 13,623
Valencia Folha Murcha............................................ 2,833 31,791
Subtotal........................................................................ 47,123 138,647
TOTAL........................................................................ 99,214 304,649
- Represents zero. 1 The area of irrigated groves, non-irrigated groves and those with no information about irrigation – by sector, region, variety, age,
and method – was updated by applying the proportion of groves in each category obtained from the 2015 assessment to the area of orange groves mesasured in the 2016 assessment.

69
Table 45 – Oranges: Area of groves irrigated, non-irrigated or without information by age groups1
[2016 inventory]
Ages Irrigated groves Non-irrigated groves or without
irrigation information
(hectares) (hectares)
1 – 2 years..................................................................... 5,459 19,524
3 – 5 years..................................................................... 15,938 52,816
6 – 10 years................................................................... 31,226 130,305
More than 10 years........................................................ 46,591 102,004
Total.............................................................................. 99,214 304,649
1 The area of irrigated groves, non-irrigated groves and those with no information about irrigation – by sector, region, variety, age,
and method – was updated by applying the proportion of groves in each category obtained from the 2015 assessment to the area of orange groves mesasured in the 2016 assessment.
Table 46 – Oranges: Area of irrigated groves by irrigation method1 [2016 inventory]
Irrigation method Irrigated groves Percentage
(hectares) (%)
Sprinkling..................................................................... 11,585 11.68
Localized...................................................................... 87,629 88.32
Total............................................................................. 99,214 100.00 1 The area of irrigated groves, non-irrigated groves and those with no information about irrigation – by sector, region, variety, age,
and method – was updated by applying the proportion of groves in each category obtained from the 2015 assessment to the area
of orange groves mesasured in the 2016 assessment.
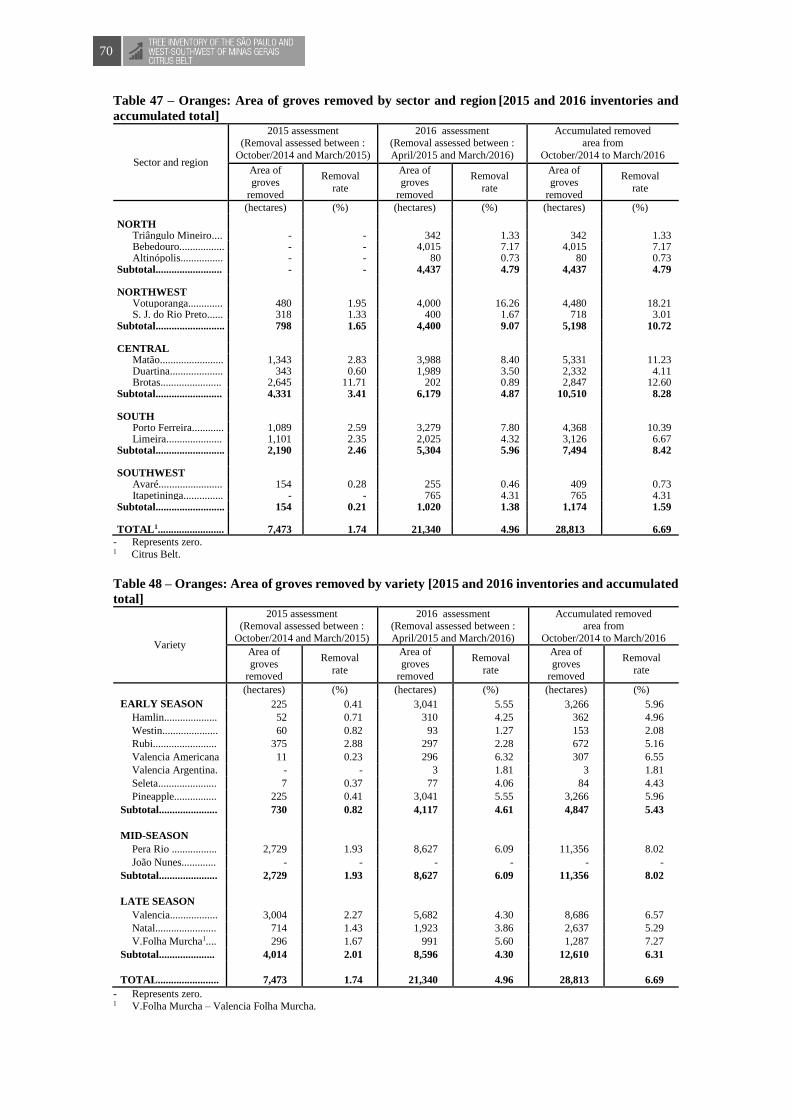
70
Table 47 – Oranges: Area of groves removed by sector and region [2015 and 2016 inventories and
accumulated total]
- Represents zero. 1 Citrus Belt.
Table 48 – Oranges: Area of groves removed by variety [2015 and 2016 inventories and accumulated
total]
Variety
2015 assessment (Removal assessed between :
October/2014 and March/2015)
2016 assessment (Removal assessed between :
April/2015 and March/2016)
Accumulated removed area from
October/2014 to March/2016
Area of
groves removed
Removal
rate
Area of
groves removed
Removal
rate
Area of
groves removed
Removal
rate
(hectares) (%) (hectares) (%) (hectares) (%)
EARLY SEASON 225 0.41 3,041 5.55 3,266 5.96
Hamlin.................... 52 0.71 310 4.25 362 4.96
Westin..................... 60 0.82 93 1.27 153 2.08
Rubi........................ 375 2.88 297 2.28 672 5.16
Valencia Americana 11 0.23 296 6.32 307 6.55
Valencia Argentina. - - 3 1.81 3 1.81
Seleta...................... 7 0.37 77 4.06 84 4.43
Pineapple................ 225 0.41 3,041 5.55 3,266 5.96
Subtotal...................... 730 0.82 4,117 4.61 4,847 5.43
MID-SEASON
Pera Rio ................. 2,729 1.93 8,627 6.09 11,356 8.02
João Nunes............. - - - - - -
Subtotal...................... 2,729 1.93 8,627 6.09 11,356 8.02
LATE SEASON
Valencia.................. 3,004 2.27 5,682 4.30 8,686 6.57
Natal....................... 714 1.43 1,923 3.86 2,637 5.29
V.Folha Murcha1.... 296 1.67 991 5.60 1,287 7.27
Subtotal..................... 4,014 2.01 8,596 4.30 12,610 6.31
TOTAL....................... 7,473 1.74 21,340 4.96 28,813 6.69
- Represents zero. 1 V.Folha Murcha – Valencia Folha Murcha.
Sector and region
2015 assessment (Removal assessed between :
October/2014 and March/2015)
2016 assessment (Removal assessed between :
April/2015 and March/2016)
Accumulated removed area from
October/2014 to March/2016
Area of
groves
removed
Removal
rate
Area of
groves
removed
Removal
rate
Area of
groves
removed
Removal
rate
(hectares) (%) (hectares) (%) (hectares) (%) NORTH
Triângulo Mineiro .... - - 342 1.33 342 1.33 Bebedouro................. - - 4,015 7.17 4,015 7.17 Altinópolis................ - - 80 0.73 80 0.73 Subtotal......................... - - 4,437 4.79 4,437 4.79 NORTHWEST Votuporanga............. 480 1.95 4,000 16.26 4,480 18.21 S. J. do Rio Preto...... 318 1.33 400 1.67 718 3.01 Subtotal.......................... 798 1.65 4,400 9.07 5,198
10.72
CENTRAL Matão........................ 1,343 2.83 3,988 8.40 5,331 11.23 Duartina.................... 343 0.60 1,989 3.50 2,332 4.11 Brotas....................... 2,645 11.71 202 0.89 2,847 12.60 Subtotal......................... 4,331 3.41 6,179 4.87 10,510 8.28 SOUTH Porto Ferreira............ 1,089 2.59 3,279 7.80 4,368 10.39 Limeira..................... 1,101 2.35 2,025 4.32 3,126 6.67 Subtotal.......................... 2,190 2.46 5,304 5.96 7,494 8.42 SOUTHWEST Avaré........................ 154 0.28 255 0.46 409 0.73 Itapetininga............... - - 765 4.31 765 4.31 Subtotal.......................... 154 0.21 1,020 1.38 1,174 1.59 TOTAL1......................... 7,473 1.74
21,340
4.96
28,813
6.69

71
Table 49 – Oranges: Area of groves removed by age [2015 and 2016 inventories and accumulated
total]
- Represents zero.
Table 50 – Oranges: Removal rate stratified by number of orange trees [accumulated total]
Range of the number of orange trees in
the grove
Accumulated removed
area from October/2014 to March/2016
Removal
rate
(number) (hectares) (%)
Below 10 thousand.................................. 12,406 25.22
10 – 19 thousand...................................... 3,179 10.23
20 – 29 thousand...................................... 1,241 5.50
30 – 49 thousand...................................... 2,430 8.42
50 – 99 thousand...................................... 3,054 6.48
100 – 199 thousand.................................. 2,993 5.70
Above 200 thousand ............................... 3,510 1.76
Total........................................................ 28,813 6.69
Table 51 – Oranges: Intention to reoccupy the area of removed groves, by grove size [2106 inventory
and accumulated total]
Range of the
number of orange
trees in the grove
Area that may be occupied with citrus Area that may be
occupied
with another
crop
Area with not
information
about intention to
reoccupy1
Total
removed Intention
to replant oranges
Intention to replant acid
lime or
lemon
Intention to
replant tangerine
Total with
Intention to replant
Percentage with
Intention to
replant in relation to
removed total
(number) (hectares) (hectares) (hectares) (hectares) (%) (hectares) (hectares) (hectares)
Below 10 thousand... - 34 442 476 1.65 7,271 4,659 12,406
10 – 19 thousand...... 407 - 159 566 1.96 1,200 1,413 3,179
20 – 29 thousand...... 134 - - 134 0.47 673 434 1,241
30 – 49 thousand...... 703 - - 703 2.44 1,371 356 2,430
50 – 99 thousand...... 1,337 - - 1,337 4.64 1,378 339 3,054
100 – 199 thousand.... 225 279 - 504 1.75 2,184 305 2,993
Above 200 thousand... 2,131 - - 2,131 7.40 1,143 236 3,510
Total........................ 4,937 313 601 5,851 20.31 15,220 7,742 28,813 1 Decision maker was not present at the time of assessment or did not know how to answer.
- Represents zero.
Ages
2015 assessment (Removal assessed between :
October/2014 and March/2015)
2016 assessment (Removal assessed between :
April/2015 and March/2016)
Accumulated removed area from
October/2014 to March/2016
Area of
groves
removed
Removal rate
Area of
groves
removed
Removal rate
Area of
groves
removed
Removal rate
(hectares) (%) (hectares) (%) (hectares) (%)
1 – 2 years ................. - - 953 3,51 953 3,51
3 – 5 years ................. 415 0,60 620 0,90 1.035 1,51
6 – 10 years ............... 1.132 0,67 7.535 4,47 8.667 5,14
More than 10 years ....
.................................. 5.926 3,56 12.232 7,35 18.158 10,91
Total ......................... 7.473 1,74 21.340 4,96 28.813 6,69
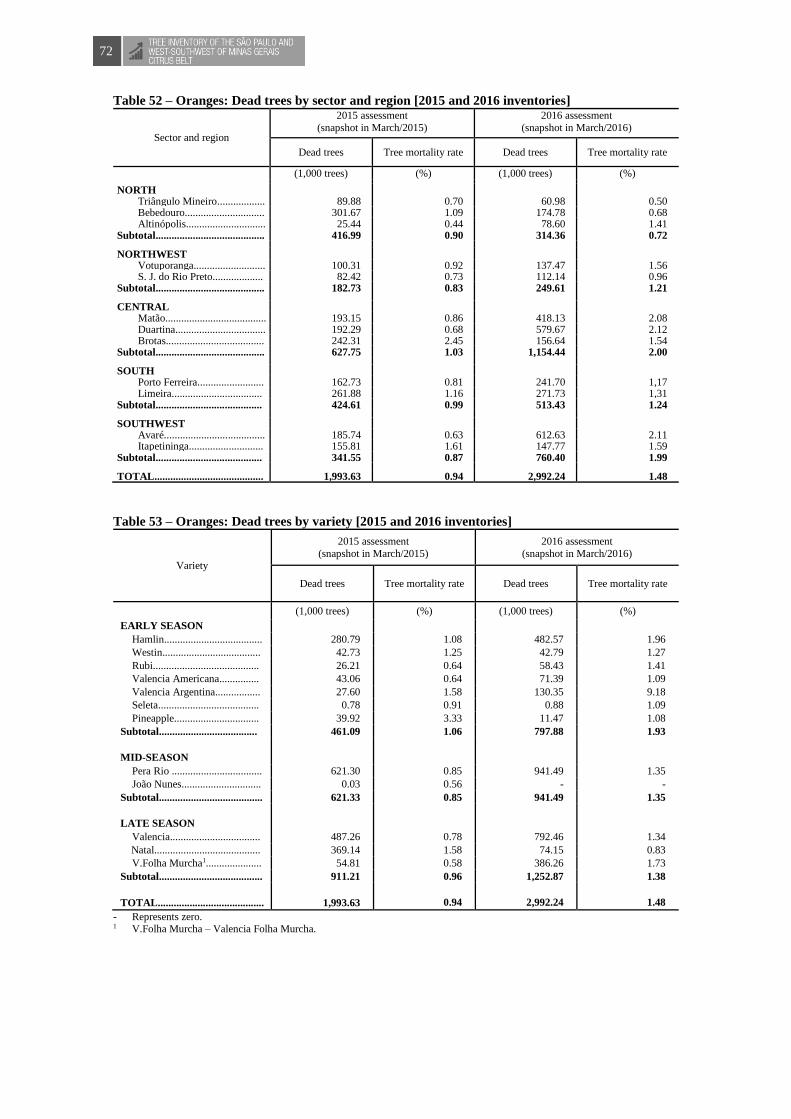
72
Table 52 – Oranges: Dead trees by sector and region [2015 and 2016 inventories]
Table 53 – Oranges: Dead trees by variety [2015 and 2016 inventories]
Variety
2015 assessment
(snapshot in March/2015)
2016 assessment
(snapshot in March/2016)
Dead trees Tree mortality rate Dead trees Tree mortality rate
(1,000 trees) (%) (1,000 trees) (%)
EARLY SEASON
Hamlin..................................... 280.79 1.08 482.57 1.96
Westin..................................... 42.73 1.25 42.79 1.27
Rubi........................................ 26.21 0.64 58.43 1.41
Valencia Americana............... 43.06 0.64 71.39 1.09
Valencia Argentina................. 27.60 1.58 130.35 9.18
Seleta...................................... 0.78 0.91 0.88 1.09
Pineapple................................ 39.92 3.33 11.47 1.08
Subtotal..................................... 461.09 1.06 797.88 1.93
MID-SEASON
Pera Rio .................................. 621.30 0.85 941.49 1.35
João Nunes.............................. 0.03 0.56 - -
Subtotal....................................... 621.33 0.85 941.49 1.35
LATE SEASON
Valencia.................................. 487.26 0.78 792.46 1.34
Natal........................................ 369.14 1.58 74.15 0.83
V.Folha Murcha1..................... 54.81 0.58 386.26 1.73
Subtotal....................................... 911.21 0.96 1,252.87 1.38
TOTAL........................................ 1,993.63 0.94 2,992.24 1.48
- Represents zero. 1 V.Folha Murcha – Valencia Folha Murcha.
Sector and region
2015 assessment
(snapshot in March/2015)
2016 assessment
(snapshot in March/2016)
Dead trees Tree mortality rate Dead trees Tree mortality rate
(1,000 trees) (%) (1,000 trees) (%)
NORTH Triângulo Mineiro .................. 89.88 0.70 60.98 0.50 Bebedouro.............................. 301.67 1.09 174.78 0.68 Altinópolis.............................. 25.44 0.44 78.60 1.41 Subtotal......................................... 416.99 0.90 314.36 0.72 NORTHWEST Votuporanga........................... 100.31 0.92 137.47 1.56 S. J. do Rio Preto................... 82.42 0.73 112.14 0.96 Subtotal......................................... 182.73 0.83 249.61 1.21 CENTRAL Matão...................................... 193.15 0.86 418.13 2.08 Duartina.................................. 192.29 0.68 579.67 2.12 Brotas..................................... 242.31 2.45 156.64 1.54 Subtotal......................................... 627.75 1.03 1,154.44 2.00 SOUTH Porto Ferreira......................... 162.73 0.81 241.70 1,17 Limeira.................................. 261.88 1.16 271.73 1,31 Subtotal........................................ 424.61 0.99 513.43 1.24 SOUTHWEST Avaré...................................... 185.74 0.63 612.63 2.11 Itapetininga............................ 155.81 1.61 147.77 1.59 Subtotal........................................ 341.55 0.87 760.40 1.99 TOTAL......................................... 1,993.63
0.94
2,992.24
1.48
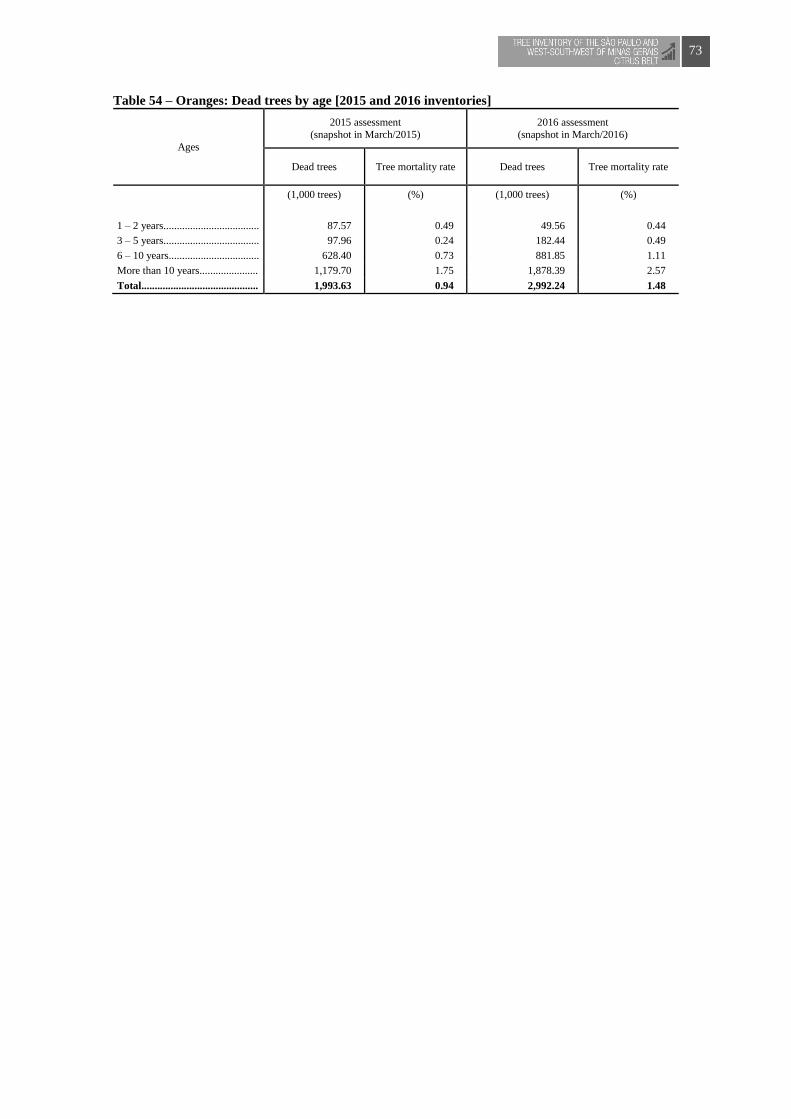
73
Table 54 – Oranges: Dead trees by age [2015 and 2016 inventories]
Ages
2015 assessment
(snapshot in March/2015)
2016 assessment
(snapshot in March/2016)
Dead trees Tree mortality rate Dead trees Tree mortality rate
(1,000 trees) (%) (1,000 trees) (%)
1 – 2 years.................................... 87.57 0.49 49.56 0.44
3 – 5 years.................................... 97.96 0.24 182.44 0.49
6 – 10 years.................................. 628.40 0.73 881.85 1.11
More than 10 years...................... 1,179.70 1.75 1,878.39 2.57
Total............................................ 1,993.63 0.94 2,992.24 1.48

74
Table 55 – Oranges: Vacancies by sector and region [2015 and 2016 inventories]
Table 56 – Oranges: Vacancies by variety [2015 and 2016 inventories]
Variety
2015 assessment
(snapshot in March/2015)
2016 assessment
(snapshot in March/2016)
Vacancies Percentage of
vacancies Vacancies
Percentage of
vacancies
(1,000 holes) (%) (1,000 holes) (%)
EARLY SEASON
Hamlin.................................... 1,896.91 7.29 870.24 3.53
Westin.................................... 198.25 5.79 156.22 4.62
Rubi........................................ 227.09 5.55 148.74 3.59
Valencia Americana............... 340.16 5.04 222.11 3.39
Valencia Argentina................ 316.41 18.09 25.56 1.80
Seleta...................................... 9.04 10.53 3.41 4.21
Pineapple................................ 156.77 13.08 10.33 0.97
Subtotal...................................... 3,144.63 7.26 1,436.61 3.48
MID-SEASON
Pera Rio ................................. 3,321.93 4.56 2,173.98 3.12
João Nunes............................. 0.07 1.31 0.05 0.99
Subtotal...................................... 3,322.00 4.56 2,174.03 3.12
LATE SEASON
Valencia.................................. 3,066.65 4.92 1,937.42 3.27
Natal....................................... 1,646.92 7.03 716.6 3.2
V.Folha Murcha1.................... 363.77 3.85 344.09 3.86
Subtotal..................................... 5,077.34 5.34 2,998.11 3.31
TOTAL...................................... 11,543.97
5.46
6,608.75
3.28
- Represents zero. 1 V.Folha Murcha – Valencia Folha Murcha.
Sector and region
2015 assessment
(snapshot in March/2015)
2016 assessment
(snapshot in March/2016)
Vacancies Percentage of
vacancies Vacancies
Percentage of vacancies
(1,000 holes) (%) (1.000 holes) (%)
NORTE Triângulo Mineiro ................. 527.73 4.10 55.79 0.46 Bebedouro............................. 1,293.68 4.68 834.85 3.23 Altinópolis............................ 375.85 6.46 108.43 1.95 Subtotal...................................... 2,197.26 4.74 999.07 2.29 NOROESTE Votuporanga........................ 526.01 4.84 302.25 3.43 S. J. do Rio Preto................. 410.43 3.64 303.81 2.59 Subtotal....................................... 936.44 4.23 606.06 2.95 CENTRO Matão................................... 1,600.59 7.10 712.02 3.53 Duartina............................... 1,606.00 5.66 874.20 3.20 Brotas.................................. 704.79 7.11 661.02 6.51 Subtotal...................................... 3,911.38 6.43 2,247.24 3.90 SUL Porto Ferreira....................... 1,147.63 5.69 896.13 4.33 Limeira................................ 1,258.64 5.58 966.71 51.89 Subtotal...................................... 2,406.27 5.63 1,862.84 56.23 SUDOESTE Avaré.................................... 1,608.13 5.41 783.13 2.70 Itapetininga........................... 484.49 5.02 110.41 1.19 Subtotal....................................... 2,092.62 5.31 893.54 2.33 TOTAL........................................ 11,543.97 5.46
6,608.75
3.28

75
Table 57 – Oranges: Vacancies by tree age group [2015 and 2016 inventories]
Ages
2015 assessment
(snapshot in March/2015)
2016 assessment
(snapshot in March/2016)
Vacancies Percentage of
vacancies Vacancies
Percentage of vacancies
(1,000 holes)
(%) (1,000 holes)
(%)
1 – 2 years.................................... 501.44 2.83 43.68 0.38
3 – 5 years.................................... 1,202.30 2.99 787.85 2.10
6 – 10 years.................................. 4,267.23 4.95 2,534.90 3.18
More than 10 years...................... 5,573.00 8.29 3,242.32 4.44
Total............................................ 11,543.97 5.46 6,608.75 3.28
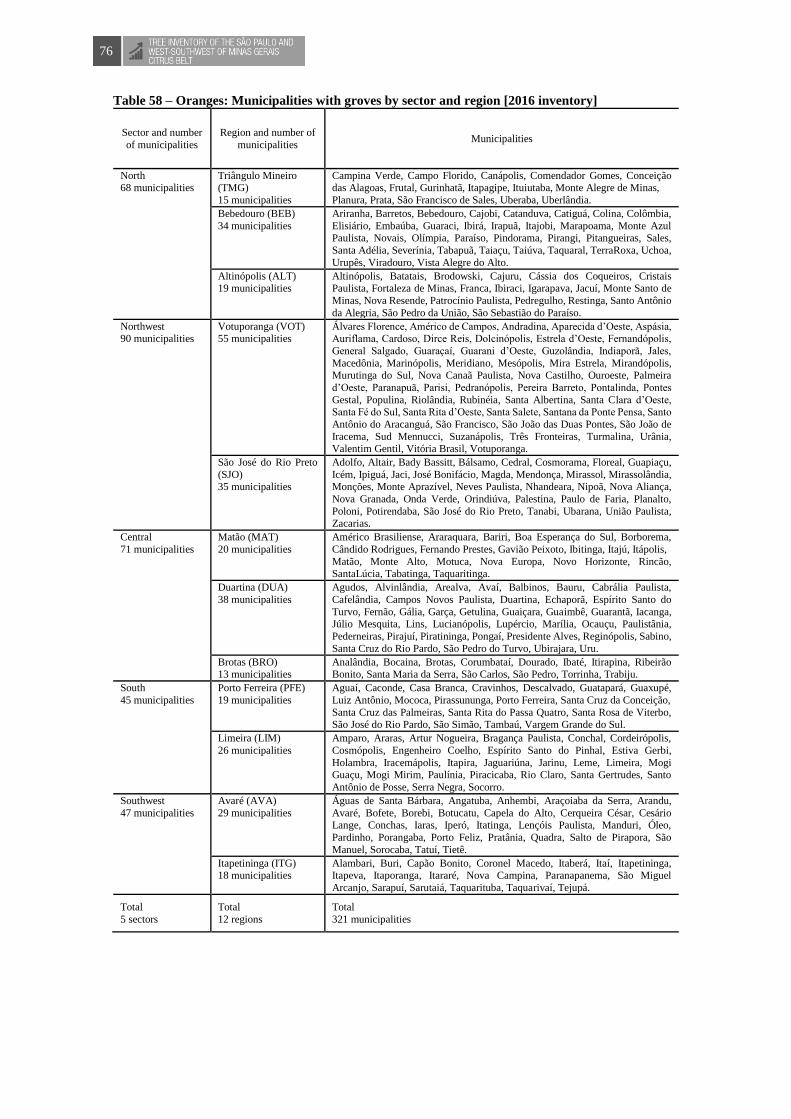
76
Table 58 – Oranges: Municipalities with groves by sector and region [2016 inventory]
Sector and number
of municipalities
Region and number of
municipalities Municipalities
North 68 municipalities
Triângulo Mineiro (TMG)
15 municipalities
Campina Verde, Campo Florido, Canápolis, Comendador Gomes, Conceição das Alagoas, Frutal, Gurinhatã, Itapagipe, Ituiutaba, Monte Alegre de Minas,
Planura, Prata, São Francisco de Sales, Uberaba, Uberlândia.
Bebedouro (BEB)
34 municipalities
Ariranha, Barretos, Bebedouro, Cajobi, Catanduva, Catiguá, Colina, Colômbia,
Elisiário, Embaúba, Guaraci, Ibirá, Irapuã, Itajobi, Marapoama, Monte Azul Paulista, Novais, Olímpia, Paraíso, Pindorama, Pirangi, Pitangueiras, Sales,
Santa Adélia, Severínia, Tabapuã, Taiaçu, Taiúva, Taquaral, TerraRoxa, Uchoa,
Urupês, Viradouro, Vista Alegre do Alto.
Altinópolis (ALT) 19 municipalities
Altinópolis, Batatais, Brodowski, Cajuru, Cássia dos Coqueiros, Cristais Paulista, Fortaleza de Minas, Franca, Ibiraci, Igarapava, Jacuí, Monte Santo de
Minas, Nova Resende, Patrocínio Paulista, Pedregulho, Restinga, Santo Antônio
da Alegria, São Pedro da União, São Sebastião do Paraíso.
Northwest 90 municipalities
Votuporanga (VOT) 55 municipalities
Álvares Florence, Américo de Campos, Andradina, Aparecida d’Oeste, Aspásia, Auriflama, Cardoso, Dirce Reis, Dolcinópolis, Estrela d’Oeste, Fernandópolis,
General Salgado, Guaraçaí, Guarani d’Oeste, Guzolândia, Indiaporã, Jales,
Macedônia, Marinópolis, Meridiano, Mesópolis, Mira Estrela, Mirandópolis, Murutinga do Sul, Nova Canaã Paulista, Nova Castilho, Ouroeste, Palmeira
d’Oeste, Paranapuã, Parisi, Pedranópolis, Pereira Barreto, Pontalinda, Pontes
Gestal, Populina, Riolândia, Rubinéia, Santa Albertina, Santa Clara d’Oeste, Santa Fé do Sul, Santa Rita d’Oeste, Santa Salete, Santana da Ponte Pensa, Santo
Antônio do Aracanguá, São Francisco, São João das Duas Pontes, São João de
Iracema, Sud Mennucci, Suzanápolis, Três Fronteiras, Turmalina, Urânia, Valentim Gentil, Vitória Brasil, Votuporanga.
São José do Rio Preto
(SJO) 35 municipalities
Adolfo, Altair, Bady Bassitt, Bálsamo, Cedral, Cosmorama, Floreal, Guapiaçu,
Icém, Ipiguá, Jaci, José Bonifácio, Magda, Mendonça, Mirassol, Mirassolândia, Monções, Monte Aprazível, Neves Paulista, Nhandeara, Nipoã, Nova Aliança,
Nova Granada, Onda Verde, Orindiúva, Palestina, Paulo de Faria, Planalto,
Poloni, Potirendaba, São José do Rio Preto, Tanabi, Ubarana, União Paulista, Zacarias.
Central
71 municipalities
Matão (MAT)
20 municipalities
Américo Brasiliense, Araraquara, Bariri, Boa Esperança do Sul, Borborema,
Cândido Rodrigues, Fernando Prestes, Gavião Peixoto, Ibitinga, Itajú, Itápolis,
Matão, Monte Alto, Motuca, Nova Europa, Novo Horizonte, Rincão, SantaLúcia, Tabatinga, Taquaritinga.
Duartina (DUA)
38 municipalities
Agudos, Alvinlândia, Arealva, Avaí, Balbinos, Bauru, Cabrália Paulista,
Cafelândia, Campos Novos Paulista, Duartina, Echaporã, Espírito Santo do
Turvo, Fernão, Gália, Garça, Getulina, Guaiçara, Guaimbê, Guarantã, Iacanga, Júlio Mesquita, Lins, Lucianópolis, Lupércio, Marília, Ocauçu, Paulistânia,
Pederneiras, Pirajuí, Piratininga, Pongaí, Presidente Alves, Reginópolis, Sabino,
Santa Cruz do Rio Pardo, São Pedro do Turvo, Ubirajara, Uru.
Brotas (BRO) 13 municipalities
Analândia, Bocaina, Brotas, Corumbataí, Dourado, Ibaté, Itirapina, Ribeirão Bonito, Santa Maria da Serra, São Carlos, São Pedro, Torrinha, Trabiju.
South
45 municipalities
Porto Ferreira (PFE)
19 municipalities
Aguaí, Caconde, Casa Branca, Cravinhos, Descalvado, Guatapará, Guaxupé,
Luiz Antônio, Mococa, Pirassununga, Porto Ferreira, Santa Cruz da Conceição,
Santa Cruz das Palmeiras, Santa Rita do Passa Quatro, Santa Rosa de Viterbo, São José do Rio Pardo, São Simão, Tambaú, Vargem Grande do Sul.
Limeira (LIM)
26 municipalities
Amparo, Araras, Artur Nogueira, Bragança Paulista, Conchal, Cordeirópolis,
Cosmópolis, Engenheiro Coelho, Espírito Santo do Pinhal, Estiva Gerbi,
Holambra, Iracemápolis, Itapira, Jaguariúna, Jarinu, Leme, Limeira, Mogi Guaçu, Mogi Mirim, Paulínia, Piracicaba, Rio Claro, Santa Gertrudes, Santo
Antônio de Posse, Serra Negra, Socorro.
Southwest
47 municipalities
Avaré (AVA)
29 municipalities
Águas de Santa Bárbara, Angatuba, Anhembi, Araçoiaba da Serra, Arandu,
Avaré, Bofete, Borebi, Botucatu, Capela do Alto, Cerqueira César, Cesário Lange, Conchas, Iaras, Iperó, Itatinga, Lençóis Paulista, Manduri, Óleo,
Pardinho, Porangaba, Porto Feliz, Pratânia, Quadra, Salto de Pirapora, São
Manuel, Sorocaba, Tatuí, Tietê.
Itapetininga (ITG) 18 municipalities
Alambari, Buri, Capão Bonito, Coronel Macedo, Itaberá, Itaí, Itapetininga, Itapeva, Itaporanga, Itararé, Nova Campina, Paranapanema, São Miguel
Arcanjo, Sarapuí, Sarutaiá, Taquarituba, Taquarivaí, Tejupá.
Total
5 sectors
Total
12 regions
Total
321 municipalities

77
3.3 – ABANDONED ORANGE GROVES
Abandoned groves are blocks of orange trees in which no signs of handling are seen, such as
pruning/cutting; they present unsatisfactory phytosanitary control, with a high degree of infestation with
pests and diseases, frequently with rotten fruit on the ground and cattle on the block. The areas of these
groves are accounted for separately and are not part of the bearing and non-bearing tree inventory.
In the Altinópolis and Itapetininga regions, no abandoned blocks were found on the sampling, which
indicates that the incidence of abandoned groves in said regions must be minimal or close to zero.
Tabel 59 – Oranges: Area of abandoned groves by sector and region [2016 inventory]
Sector and region Abandoned
groves Percentage in relation to
the total area of orange groves
(hectares) (%)
NORTH Triângulo Mineiro (TMG)........................... 586 2.28 Bebedouro (BEB)........................................ 805 1.44 Altinópolis (ALT)........................................ - - Subtotal ................................................................... 1,390 1.50
NORTHWEST Votuporanga (VOT)..................................... 190 0.77 São José do Rio Preto (SJO)........................ 378 1.58 Subtotal.................................................................... 568 1.17
CENTRAL Matão (MAT)............................................... 1,098 2.31 Duartina (DUA)........................................... 722 1.27 Brotas (BRO)............................................... 17 0.08 Subtotal.................................................................... 1,837 1.45
SOUTH Porto Ferreira (PFE)..................................... 309 0.73 Limeira (LIM).............................................. 1,981 4.22 Subtotal.................................................................... 2,290 2.57
SOUTHWEST
Avaré (AVA)............................................... 425 0.76 Itapetininga (ITG)........................................ - -
Subtotal ................................................................... 425 0.58
TOTAL.................................................................... 6,511 1.51
- Represents zero.
Figura 3 – Percentage of abandoned groves by sector
79
ORANGE PRODUCTION FORECAST FOR THE 2016-2017 SEASON OF THE SÃO PAULO AND WEST-SOUTHWEST OF MINAS GERAIS CITRUS BELT
MAY/2016 FORECAST

80 80
ORANGE BEARING TREES1 BY SECTOR
Total: 175.55 million trees
2015-2016 ORANGE PRODUCTION FORECAST2 BY SECTOR
Total: 245.74 million 40.8 kg box
1 Snapshot of March/2016. Sweet orange varieties: Hamlin, Westin, Rubi, Valencia Americana, Valencia Argentina, Seleta, Pineapple, Pera Rio, João Nunes, Valencia, Natal and Valencia Folha Murcha.
2 May/2016 forecast.
ORANGE PRODUCTION FORECAST FOR THE 2016-2017 SEASON OF THE SÃO
PAULO AND WEST-SOUTHWEST OF MINAS GERAIS CITRUS BELT – MAY/2016
FORECAST
Published on May 10, 20161
Forecast Dates 2016-2017 Season
March/2016 tree inventory: May 10, 2016
May forecast (orange production forecast): May 10, 2016
September forecast (1st orange production forecast update): September 12, 2016
December forecast (2nd orange production forecast update): December 12, 2016
February forecast (3rd orange production forecast update): February 10, 2017
April forecast (final orange production estimate): April 10, 2017
During the course of the season, the crop will be updated in the months mentioned in the preceding schedule
using the droppage and fruit size (fruits per box) data collected in the months prior to these forecasts. In
order to meet the demands of the citrus sector and the press, we reserve the right to expand and deepen the
information already published. Therefore, we recommend always the use of the most recent publication
available at www.fundecitrus.com.br.
1 Year 2 – No 1 – May 10, 2016 (Portuguese version only)
Expanded and revised versions:
Year 2 – No 2 – May 17, 2016 (Portuguese version only)
Year 2 – No 3 – May 25, 2016 (Portuguese and English versions)

Prepared by FUNDECITRUS with cooperation from MARKESTRAT,
FEA-RP/USP and the Exact Sciences Department of FCAV/Unesp
Av. Adhemar Pereira de Barros, 201 | Vila Melhado | CEP: 14807-040 | Araraquara | São Paulo | Brazil www.fundecitrus.com.br
ORANGE PRODUCTION FORECAST FOR THE
2016-2017 SEASON OF THE SÃO PAULO AND
WEST-SOUTHWEST OF MINAS GERAIS CITRUS BELT
MAY/2016 FORECAST
Fundecitrus
Araraquara, São Paulo
2016

Catalogue card prepared by Fundecitrus Library
338.1
E816
Orange production forecast for the 2016-2017
season of the São Paulo and West-Southwest
Minas Gerais: may forecast / Fundo de Defesa
da Citricultura... [et al.]. – Araraquara,SP :
Fundecitrus, 2016.
25 p.
ISSN 2446-7707(printed)
ISSN 2446-7715 (online)
1. Economy – Forecast 2. Orange I. Fundecitrus II. Markestrat III. FEA-RP/USP IIII. FCAV/Unesp.
Use of any data from this publication should be duly credited to the providing organizations through citation
of their names, subject to the rules of use. This credit should be made in any publication or public
presentation that alludes to or mentions any data. No reproduction publication, distribution or reprinting
may be made of all or a substantial part for commercial purposes, except with the proper authorization of
the legal representatives of the organizations.
Lourival Carmo Monaco President of Fundecitrus
Antonio Juliano Ayres General manager of Fundecitrus
Marcos Fava Neves PES political-institucional and methodology coordinator, FEA-RP/USP full professor and member of the
administrative board of Markestrat
Vinícius Gustavo Trombin PES executive coordinator and member of Markestrat
José Carlos Barbosa PES methodology analyst and full professor at the Exact Sciences Department of FCAV/Unesp
Fernando Alvarinho Delgado PES/Fundecitrus technical supervisor
Renato Tadeu Rovarotto PES/Fundecitrus supervisor
Roseli Reina PES/Fundecitrus supervisor
Advisor
Fernando Engelberg de Moraes, lawyer

SUMARRY
1 – ORANGE PRODUCTION FORECAST FOR THE 2016-2017 SEASON ............................... 11
2 – OBJECTIVE SURVEY METHOD FOR ORANGE PRODUCTION FORECAST..................11
Bearing trees ................................................................................................................................ 12
Fruit per tree ................................................................................................................................. 12
Fruit loss from droppage......................................................................................................... ...... 16
Fruit size .................................................................................. .................................................... 16
3 – TABELS ........................................................................................................................................ 18
LIST OF CHARTS
Chart 1 – Composition by sector of the citrus belt regions covered in the drawing ................................... 14
Chart 2– Composition by maturation stage of the groups of varieties covered in the drawing .................. 15
Chart 3– Composition of the planting years by age groups covered in the drawing .................................. 15
LIST OF TABELS
Table 1 – Difference between the maximum average temperature observed and the historical average
temperature in the citrus belt, from September/2015 to April/2016, by month and region ........................ 13
Table 2 – Average rainfall forecast for the citrus belt from May/2016 to November/2016 and average
historical rainfall from December/2016 to April/2017, by month and region ............................................ 17
Table 3 – Difference between the estimated and historical average rainfall from May/2016 to
November/2016, by month and region ....................................................................................................... 17
Table 4 – Orange production forecast for the 2016-2017 season by sector ................................................ 18
Table 5 – Orange production forecast for the 2016-2017 season by tree age group................................... 18
Table 6 – Orange production forecast for the 2016-2017 season by bloom ............................................... 18
Table 7 – Orange production forecast for 2016-2017 season as bloom percentage by region ................... 18
Table 8 – Orange production forecast for the 2016-2017 season and its components by variety group .... 19
Table 9 – Orange production forecast for the 2016-2017 season by variety group and sector ................... 19
Table 10 – Orange production forecast for the 2016-2017 season by variety group – North Sector .......... 19
Table 11 – Orange production forecast for the 2016-2017 season by variety group – Northwest Sector .. 20
Table 12 – Orange production forecast for the 2016-2017 season by variety group – Central Sector ....... 20
Table 13 – Orange production forecast for the 2016-2017 season by variety group – South Sector .......... 20
Table 14 – Orange production forecast for the 2016-2017 season by variety group – Southwest Sector .. 21
Table 15 – Fruits per tree at stripping, by tree age, region and variety groups – North Sector ................. 21
Table 16 – Fruits per tree at stripping, by tree age, region and variety groups – Northwest Sector .......... 22
Table 17 – Fruits per tree at stripping, by tree age, region and variety groups – Central Sector ............... 23
Table 18 – Fruits per tree at stripping, by tree age, region and variety groups – South Sector .................. 24
Table 19 – Fruits per tree at stripping, by tree age, region and variety groups – Soutwest Sector ............. 25

11
1 – ORANGE PRODUCTION FORECAST FOR THE 2016-2017 SEASON
The 2016-2017 orange production forecast published on May 10, 2016 by Fundecitrus with the cooperation
of Markestrat, FEA-RP/USP and FCAV/Unesp1 is 245.74 million boxes (40.8 kg). This total includes:
45.86 million boxes of the Hamlin, Westin and Rubi varieties;
13.48 million of the Valencia Americana, Valencia Argentina, Seleta and Pineapple varieties;
70.38 million of the Pera Rio variety;
84.48 million of the Valencia and Valencia Folha Murcha varieties;
31.54 million of the Natal variety.
This production is 18% smaller than that of the previous season2. The comparison per maturation stage of
the varieties results in the following differences: minus 19% for early varieties, minus 14% for mid-season
varieties and minus 20% for late varieties.
As regards the locations where such production is to be harvested, 9.59 million boxes are estimated for the
Triângulo Mineiro region, a 45-percent drop as compared to the 2015-2016 season, when the final
production estimate was 17.48 million boxes.
The Central and Southwest sectors together account for 55% of the estimated production with roughly equal
number of boxes, specifically 68.27 and 67.92 million boxes, respectively. However, the extensions of the
areas with mature groves is very different: the Central sector presents 110,874 hectares, and the Southwest
has 71,055 hectares (36% less). The explanation for those sectors attaining similar products lies on the
productivity of 956 boxes/hectare attained in the Southwest, which surpasses by 340 boxes/hectare that of
the Central sector. The Northwest sector, with 41,817 hectares of mature groves, representing 11% of the
total, has the lowest average productivity of all sectors, with 373 boxes/hectare, which is only 40% of the
956 boxes/hectare of the Southwest sector, the most productive one.
As regards the 2015-2016 season, the North sector presented the highest percentage slump in the average
productivity per hectare, going from 792 boxes/hectare down to 496 boxes/hectare in this 2016-2017
season, a 37-percent reduction. The Northwest, South, and Southwest sectors also had decreased average
productivities, by 17%, 15%, and 9%, respectively. Only the Central sector presented a discrete increase,
going from 613 boxes/hectare to 616 boxes/hectare in this season.
The average productivity per tree decreased by 19% in the current season, with a forecast of 1.40 boxes/tree,
as compared to 1.73 boxes/tree in the past season.
2 – OBJECTIVE SURVEY METHOD FOR ORANGE PRODUCTION
FORECAST
In order to carry out this forecast, we maintained the objective method used in the last season, based on
quantitative data – field measurements, counting and weighing of fruit – applied in the direct expansion
model, whose formula is shown below.
Production forecast = Bearing trees × Fruit per tree × ( 1 − Fruit loss from droppage )
Fruit size
For the purpose of bringing a critical mass and transparency, this survey has had, since its implementation,
its activities followed up by a technical committee, which had been organized since the previous season
aiming to propose operating improvements. The committee is formed by citrus growers, representatives
from orange juice processing companies, faculty members, and Fundecitrus researchers and supervisors.
1 Exact Sciences Department. 2 The orange production final estimate is 300.65 million boxes (40.8 kg), as disclosed on April 11, 2016, available on
www.fundecitrus.com.br

12
The results compiled from the inventory and stripping of the trees, obtained throughout the research, were
kept restricted, until the date of this publication, only to the professionals connected to Fundecitrus, such
as Fundecitrus general manager, PES supervisors and service providers specifically hired for the project,
all of whom subject to terms of confidentiality regarding PES information until its public disclosure,
pursuant to the confidentiality agreement executed between each one of them and Fundecitrus. Regarding
antitrust practices, all of them were complied with throughout all the work phases, through the adoption of
the measures necessary to prevent any sharing of individual information with a competitive content, among
the orange juice companies members of Fundecitrus, and between these and the citrus growers.
This team completed the production forecast on May 10, 2016 at 9:40 a.m., in a closed meeting, devoid of
any communication channel beyond Fundecitrus participants. Only then did Fundecitrus chairman,
Lourival Carmo Monaco, became aware of the final information and then, at 10 a.m., started the public
disclosure at the Fundecitrus auditorium, in Araraquara-SP. The presentation was shown live on the
internet, and afterwards, the information was made available on Fundecitrus website.
The detailed forecast for the four model components is shown below.
BEARING TREES
The estimated total of bearing trees is 175.55 million, a 0.8-percent increase as compared to the 2015-2016
season. Trees planted in 2013 and in previous years are considered to be bearing in this season. The varieties
contemplated in this forecast represent 97% of the trees and also 97% of the orange grove area which make
up the current agricultural year's inventory.
The information about bearing trees were extracted from the Tree Inventory of the São Paulo and West-
Southwest Minas Gerais Citrus Belt: Snapshot of Groves in March/2016, which was updated by the field
assessment carried out from February to March 2016.
FRUIT PER TREE
The average number of fruit per tree in April/2016, not considering the droppage to occur during the season,
was measured at 430 fruit per tree, 14% less than April/2015. The current season, therefore, had a low fruit
set, although it presented high bloom intensity. Such reduction was triggered by the weather conditions
observed from October 2015 to beginning of April 2016, influenced by El Niño, a phenomenon linked to
warming of the Pacific Ocean waters, which, among other consequences, increases the air temperature
around the globe and alters rainfall.
Blooming that started to appear by the end of August and intensified in September and October was
abundant throughout the producing regions, because trees were less loaded with fruit from the previous
season – therefore with higher levels of energy reserve – and because of favorable weather conditions in
the beginning of the season. However, the high temperatures seen in September and October 2015 in most
of the citrus belt contributed to the hormonal imbalance, ending up in a marked abortion of pea-sized fruit.
Data from the weather monitoring done by Somar Meteorologia3 showed that the average maximum
temperature recorded in the afternoons in October reached 4.63ºC above the historical average4, with larger
deviations in the Porto Ferreira, Brotas, Altinópolis, Triângulo Mineiro and Limeira regions, as shown in
Figure 1.
3 The data observed by Somar Meteorologia were obtained from weather stations from the Instituto Nacional de Meteorologia
(INMET) and Instituto Agronômico de Campinas (IAC) scattered throughout the State of São Paulo. In the case of the Triângulo
Mineiro, the data were obtained only through the INMET stations. 4 Interpolated data, period from 1960 to 1990.
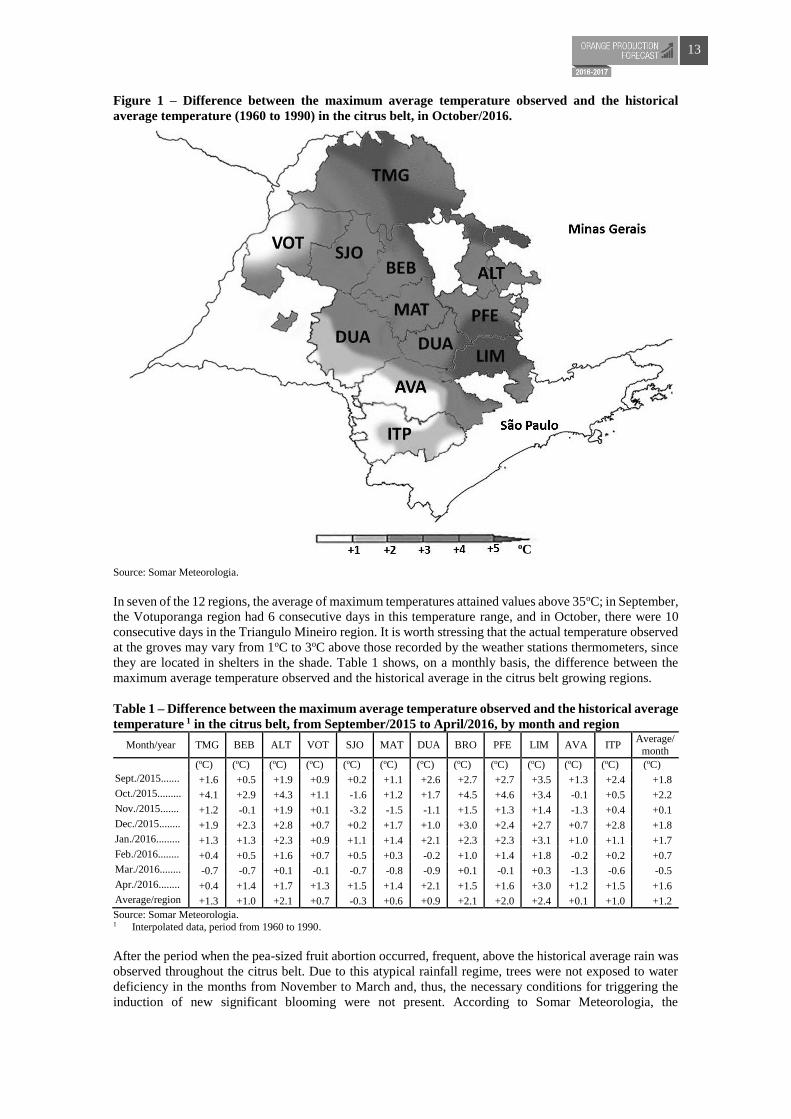
13
Figure 1 – Difference between the maximum average temperature observed and the historical
average temperature (1960 to 1990) in the citrus belt, in October/2016.
Source: Somar Meteorologia.
In seven of the 12 regions, the average of maximum temperatures attained values above 35oC; in September,
the Votuporanga region had 6 consecutive days in this temperature range, and in October, there were 10
consecutive days in the Triangulo Mineiro region. It is worth stressing that the actual temperature observed
at the groves may vary from 1oC to 3oC above those recorded by the weather stations thermometers, since
they are located in shelters in the shade. Table 1 shows, on a monthly basis, the difference between the
maximum average temperature observed and the historical average in the citrus belt growing regions.
Table 1 – Difference between the maximum average temperature observed and the historical average
temperature 1 in the citrus belt, from September/2015 to April/2016, by month and region
Month/year TMG BEB ALT VOT SJO MAT DUA BRO PFE LIM AVA ITP Average/
month
(oC) (oC) (oC) (oC) (oC) (oC) (oC) (oC) (oC) (oC) (oC) (oC) (oC)
Sept./2015....... +1.6 +0.5 +1.9 +0.9 +0.2 +1.1 +2.6 +2.7 +2.7 +3.5 +1.3 +2.4 +1.8
Oct./2015......... +4.1 +2.9 +4.3 +1.1 -1.6 +1.2 +1.7 +4.5 +4.6 +3.4 -0.1 +0.5 +2.2
Nov./2015....... +1.2 -0.1 +1.9 +0.1 -3.2 -1.5 -1.1 +1.5 +1.3 +1.4 -1.3 +0.4 +0.1
Dec./2015........ +1.9 +2.3 +2.8 +0.7 +0.2 +1.7 +1.0 +3.0 +2.4 +2.7 +0.7 +2.8 +1.8
Jan./2016......... +1.3 +1.3 +2.3 +0.9 +1.1 +1.4 +2.1 +2.3 +2.3 +3.1 +1.0 +1.1 +1.7
Feb./2016........ +0.4 +0.5 +1.6 +0.7 +0.5 +0.3 -0.2 +1.0 +1.4 +1.8 -0.2 +0.2 +0.7
Mar./2016........ -0.7 -0.7 +0.1 -0.1 -0.7 -0.8 -0.9 +0.1 -0.1 +0.3 -1.3 -0.6 -0.5
Apr./2016........ +0.4 +1.4 +1.7 +1.3 +1.5 +1.4 +2.1 +1.5 +1.6 +3.0 +1.2 +1.5 +1.6
Average/region +1.3 +1.0 +2.1 +0.7 -0.3 +0.6 +0.9 +2.1 +2.0 +2.4 +0.1 +1.0 +1.2
Source: Somar Meteorologia. 1 Interpolated data, period from 1960 to 1990.
After the period when the pea-sized fruit abortion occurred, frequent, above the historical average rain was
observed throughout the citrus belt. Due to this atypical rainfall regime, trees were not exposed to water
deficiency in the months from November to March and, thus, the necessary conditions for triggering the
induction of new significant blooming were not present. According to Somar Meteorologia, the
oC

14
accumulated rainfall increased starting in November, reaching its peak in January 2016. In some
municipalities in the São José do Rio Preto region, for example, the accumulated rainfall between October
2015 and March 2016 exceeded 2,000 millimeters, but as a whole, it rained between 1,000 and 1,500
millimeters in the production regions, which figures attained in average 300 millimeters above normal for
this time of the year. Bebedouro and Matão were the regions which presented a shortage during the period
vis-à-vis the historical average, with -30 mm and -70 mm, respectively.
Such weather conditions resulted in a production forecast concentrated primarily in the first and second
blooms, with 90% of the total, with 78% and 11%, respectively. The third bloom corresponds to 6%, and
the fourth one to 5%. To calculate such forecast, the fruit of the first, second, and third blooms were totally
considered. Fruit from the 4th bloom received a 50-percent set rate. Upon separating fruit per bloom, off-
season fruit from the previous season were also identified but not accounted for in the forecast for the
current season. In comparison with the previous season, the main difference lies in the first-bloom fruit set,
which had been lower in 2015-2016 due to the drought and high temperatures which hit the groves at that
time. Consequently, the proportion of first bloom in the previous season was lower than the second: 30%
and 60%, in this order. Another fact that was not repeated in the current season was the occurrence of the
fifth bloom, which had been noticed, albeit in a subtle manner, in some regions.
The number of fruit per tree, although under the influence of other factors such as plant age was strongly
related to the variety. In April/2016 – when trees were stripped – the early-season group (Hamlin, Westin,
and Rubi) presented, in average 523 fruit/tree. As it is already known, the varieties in this group are more
productive than the others, with a forecast of 22% above the average for this crop year. Next come: the late-
season Natal variety, with 500 fruit per tree, the other early-season varieties with 475 fruit per tree, late-
season Valencia and Valencia Folha Murcha with 409 fruit per tree, and lastly, the Pera Rio variety, with
378 fruit per tree.
The method utilized to estimate the number of fruit per tree is the same one employed for the 2015-2016
season. Basically, it consists of stripping, that is, picking all the fruit on the tree, regardless of the blooming
that originated them. The stripping in this season was carried out from March 28 to April 27, 2016. The
harvested fruit were taken to a laboratory in Araraquara, where they were separated, counted through an
automatic process and weighed, according to the bloom.
To determine the trees that are stripped, groves are first stratified by region and variety and age. Afterwards,
the relative weight (%) of each of the strata in the citrus belt is calculated, and through a random, stratified
sampling procedure blocks are chosen (at the same proportion they exist in the citrus belt) to be integrated
into the sample. From each block chosen, a tree is stripped with the grower`s authorization, who receives
R$ 30.00 per tree. This season comprises 2,200 samples, a size determined from the variance of the number
of fruit per tree (historical data) and the expected error of 2% to 3% of the average.
The “region” stratification factor is composed of 12 groups covering the 328 municipalities with rural
properties containing mature orange groves. In addition to the subdivision of the 12 regions, the following
charts present the five subdivisions of the “variety” factor and the three subdivisions of the “age” factor.
The combinations of these factors lead to 180 strata.
Chart 1 – Composition by sector of the citrus belt regions covered in the drawing Sector Region Abbreviation
North
Triângulo Mineiro TMG
Bebedouro BEB
Altinópolis ALT
Northwest Votuporanga VOT
São José do Rio Preto SJO
Central
Matão MAT
Duartina DUA
Brotas BRO
South Porto Ferreira PFE
Limeira LIM
Southwest Avaré AVA
Itapetininga ITG

15
Chart 2 – Composition by maturation stage of the groups of varieties covered in the drawing Maturation stage Grupo de variedades
Early season Hamlin Westin
Rubi
Other early season
Valencia Americana
Valencia Argentina Seleta
Pineapple
Mid-season Pera Rio1
Late season
Valencia Valencia Folha Murcha
Natal 1 The orange trees of João Nunes variety were added to the Pera Rio variety trees, because both areas present the same maturation
stage.
Chart 3 – Composition of the planting years by age groups covered in the drawing Age group Planting years
3 to 5 years.................................................................... 2013, 2012, 2011
6 to 10 years.................................................................. 2010, 2009, 2008, 2007, 2006
Above 10 years............................................................. Before 2006
The position of the tree to be stripped in the chosen block is predetermined per season. This procedure
causes trees to be selected in an impartial manner, that is, with no interference from the research agent.
Otherwise, the choice could be biased, by opting for trees with fewer or more fruit. For the 2016/2017, the
tree in the chosen block is that located in the 20th hole of the 15th row. If in that position there is a vacancy,
dead tree or tree of a different age than the one originally planted in the block, researchers moved forward
to the third tree. If the situation were the same, they moved to the next third tree until the researchers found
a tree of the chosen age. If the block does not have 15 or more planting lines, the count will be re-started
on the existing rows until number 15 is reached.
The map in Figure 2 shows the location and number of stripped trees per region. The full names of the
regions are shown in Chart 1.
Figure 2 – Location and total number of stripped trees per region
Stripped tree

16
FRUIT LOSS FROM DROPPAGE – rate of fruit droppage, from the time of stripping until the final
harvest of the block, caused naturally or by other means
The estimated average droppage rate is 15%, with 10% for early varieties Hamlin, Westin, and Rubi, 11%
for the other early varieties, 16% for the Pera Rio mid-season variety, and 17% for all the late-season
varieties. This rate is applied to the number of fruit found on the tree in April/2016, when the stripping is
carried out. The result of this calculation is the number of fruit that will be available on the tree at harvesting,
since part of the oranges that are present on the tree at the beginning of the season drop during the season
due to natural droppage, pests and diseases, weather conditions, among other reasons.
To estimate such rate, weather forecast and droppage rates as assessed during the 2015-2016 season were
taken into consideration, by means of continuous monitoring done by Fundecitrus starting in June at 900
orange blocks, which were no longer visited as they were completely harvested. The monitoring to be
started on June/2016 will serve as a basis to update the rate estimated at the time of this publication and,
consequently, update the production forecast.
The average fruit weight obtained on stripping in April/2016, together with the weather forecast data
provided by Somar Meteorologia, signaled that the harvest should be less prolonged than the previous
harvest. Consequently, fruit droppage tends also to be a little lower.
In addition to the information already mentioned to forecast the fruit droppage rate, consideration was also
given to the historical series of the seasons from 2004-2005 to 2014-2015, already used in the past season.
The data for this series were provided by orange juice companies associated to Fundecitrus – Citrosuco,
Cutrale, and Louis Dreyfus – which, in an isolated manner, have carried out this follow-up in the citrus
belt since 1988. The supply was carried out, individually and under formal confidentiality agreement, to
the independent consulting firm to ascertain the average, with the individual data supplied by each company
remaining confidential.
Based on the average deviations from orange production forecasts of citrus belt over the past 10 years, the
correction factor was forecast to be 5%, which is mainly justified by pest-triggered premature fruit drop
and uneven age of bearing trees (resets that have already reached producing age).
FRUIT SIZE – number of oranges to reach the weight of 40.8 kg (box) at harvest
The estimated average size of the fruit was 248 fruit per 40.8 kg box, with 275 fruit/box for the group of
Hamlin, Westin, and Rubi early varieties, 245 fruit/box for the group of other early varieties, 255 fruit/box
for the Pera Rio mid-season variety, 230 fruit/box for the Valencia and Valencia Folha Murcha late-season
varieties, and 235 fruit/box for the Natal late-season variety.
For the purpose of forecasting the citrus belt production, among all the factors influencing the growth of
fruit and, consequently, altering the number per box, two of them stand out: the number of fruit per tree,
which is assessed in April, and the volume of monthly rainfall, that will take place from May till the block
is harvested.
As mentioned, the number of fruit per tree in the 2016-2017 season is low, therefore this factor contributed
to fruit growth, since the orange tree tends to compensate the lower amount of fruit with their larger
development. On the other hand, the volume of rain forecast along the harvesting period may not contribute
to its above-average development, as observed in the last season. Based on the information obtained from
Somar Meteorologia as of the issuance of this publication, the average rainfall forecast for the citrus belt
between May/2016 and November/2016 is 457 millimeters, 3% below the historical average. If we consider
the historical average for the months from December/2016 to April/2016, the accumulated rainfall may
total 1,330 millimeters, or 9% below the historical average. Analysis of the rainfall forecast is essential,
since only one fourth of the São Paulo and West-Southwest of Minas Gerais citrus belt are irrigated.

17
Table 2 – Average rainfall forecast for the citrus belt from May/2016 to November/2016 and average
historical rainfall1 from December/2016 to April/2017, by month and region
Month/year TMG BEB ALT VOT SJO MAT DUA BRO PFE LIM AVA ITP Average/
month
(mm) (mm) (mm) (mm) (mm) (mm) (mm) (mm) (mm) (mm) (mm) (mm) (mm)
May/2016....... 45 71 61 72 73 74 88 74 71 84 92 113 77
Jun./2016....... 18 23 19 19 22 29 40 31 29 37 40 52 30
Jul./2016........ 4 9 13 6 7 11 17 13 14 20 27 52 16
Aug./2016...... 6 3 2 6 5 10 18 8 14 27 19 64 15
Sept./2016...... 27 30 36 26 30 35 50 42 44 61 71 111 47
Oct./2016....... 102 92 108 63 81 125 153 142 151 163 163 172 126
Nov./2016...... 152 110 140 115 132 124 128 140 160 177 169 210 146
Dec./2016...... 252 247 273 235 244 247 222 243 263 235 213 214 239
Jan./2017....... 208 215 221 186 213 205 209 201 209 212 195 159 204
Feb./2017...... 190 173 180 159 177 154 137 158 163 141 122 123 154
Mar./2017...... 81 64 81 75 72 56 67 62 66 58 60 65 66
Apr./2017....... 248 227 274 221 223 224 159 239 239 204 172 160 210
Total............... 1,331 1,263 1,407 1,183 1,278 1,294 1,287 1,352 1,425 1,417 1,343 1,495 1,330
Source: Somar Meteorologia. 1 Interpolated data, period from 1960 to 1990.
According to Table 3, only in May is the forecast rainfall 25 millimeters above the historical average. The
deviation shall be positive also in the months of October and November, but with values close to zero. In
the other months, forecast is for water shortage in practically all regions of the citrus belt.
Table 3 – Difference between the estimated and historical average1 rainfall from May/2016 to
November/2016, by month and region
Month/year TMG BEB ALT VOT SJO MAT DUA BRO PFE LIM AVA ITP Average/
month
(mm) (mm) (mm) (mm) (mm) (mm) (mm) (mm) (mm) (mm) (mm) (mm) (mm)
May/2016..... +3,3 +27,2 +18,0 +22,3 +28,9 +28,9 +26,6 +20,8 +28,3 +36,5 +27,2 +32,7 +25,1
Jun./2016..... +1,4 -5,8 -3,2 -16,3 -6,3 -7,4 -13,6 -10,9 -4,2 -7,3 -17,1 -20,2 -10,1
Jul./2016...... -6,1 -6,9 -4,7 -17,6 -7,9 -9,5 -17,5 -10,9 -7,9 -6,3 -16,0 +1,1 -9,6
Aug./2016.... -3,5 -12,3 -11,4 -11,2 -9,8 -12,4 -9,8 -19,3 -9,8 +0,9 -16,3 +20,2 -8,3
Sept./2016.... -19,6 -25,5 -25,4 -22,2 -22,1 -24,5 -19,8 -20,1 -16,4 -2,1 +0,1 +23,1 -14,8
Oct./2016..... -25,3 -34,4 -23,3 -55,2 -42,5 -3,4 +32,6 +4,6 19,6 +38,8 +43,3 +54,6 +1,1
Nov./2016.... -35,2 -44,9 -58,9 -30,9 -31,1 -18,6 +20,6 -15,0 -5,4 +37,7 +43,8 +84,0 +0,4
Total............. -85,0 -102,8 -108,8 -131,2 -90,8 -46,8 +19,0 -50,8 +4,3 +98,4 +65,0 +195,4 -16,3
Source: Somar Meteorologia. 1 Interpolated data, period from 1960 to 1990.
In order to forecast fruit size, we also considered the historical series of the seasons from 2004-2005 to
2014-2015 previously mentioned. The analysis of that series shows that the size of the fruit varies
significantly from one season to another due to the weather conditions taken place in each season. This fact,
added to the lesser reliability of weather forecast in the long run, reinforces the need to continuously monitor
the groves during the season, in order to update the crop.

18
3 – TABELS
The following tables present the orange forecast for 2016-2017 by variety, sector, age and bloom. In tables
15 to 19, the number of fruit per tree during stripping is shown separately for the 12 regions, but if the
forecast were calculated at the region level, the number of stripped trees would be statistically insufficient.
For this reason, the maximum detailing of the forecast is at the sector level. Despite this, the margin of error
in the production forecast by sector is greater than that of the production forecast for the citrus belt as a
whole.
Variations that may occur in fruit size and droppage rates could alter the forecast, and these will be
calculated throughout the season by constant monitoring in the field to carry out the production updates.
The calculations made used whole numbers, with all the decimal places. Any discrepancies between the
amounts in the tables are the result of rounding.
Table 4 – Orange production forecast for the 2016-2017 season by sector
Sector Mature groves
area
Average
density
planting1 of mature groves
Bearing
trees
Fruits per tree at
stripping2
Orange production forecast
2016-2017
By tree By area Total
(hectares) (trees/
hectare)
(1,000
trees)
(number) (boxes/
tree)
(boxes/
hectare)
(1,000,000
boxes)
North.................... 85,426 478 39,604 328 1.07 496 42.39
Northwest............. 41,817 438 18,056 268 0.86 373 15.58
Central.................. 110,874 462 49,487 423 1.38 616 68.27
South.................... 77,527 451 33,734 470 1.53 665 51.58
Southwest............. 71,055 498 34,667 601 1.96 956 67.92
Total.................... 386,699 467 175,548 430 1.40 635 245.74 1 The calculation considers the total number of trees of the block, that is, bearing and non-bearing trees (2014 or 2015 resets). 2 Weighted average per stratum fruits.
Table 5 – Orange production forecast for the 2016-2017 season by tree age group
Age
Mature
groves area
Average density
planting1 of
mature groves
Bearing
trees
Fruits per
tree at stripping2
Orange production forecast 2016-2017
By tree By area Total
(hectares) (trees/
hectare) (1,000 trees)
(number) (boxes/ tree)
(boxes/ hectare)
(1,000,000 boxes)
3 to 5 years........... 61,613 594 35,734 166 0.54 313 19.27 6 to 10 years......... 151,705 503 73,835 388 1.26 611 92.74
Above 10 years..... 173,381 392 65,979 620 2.03 771 133.73
Total.................... 386,699 467 175,548 430 1.40 635 245.74 1 The calculation considers the total number of trees of the block, that is, bearing and non-bearing trees (2014 or 2015 resets). 2 Weighted average per stratum fruits.
Table 6 – Orange production forecast for the 2016-2017 season by bloom
Bloom Orange production forecast
2016-2017
Percentage of orange production
forecast by bloom
(1,000,000 boxes) (percentage)
1st ............................................................ 192.52 78.3 2nd ........................................................... 27.58 11.2
3rd ............................................................ 13.96 5.7
4th ............................................................ 11.69 4.8
Total........................................................ 245.74 100.0
Table 7 – Orange production forecast for 2016-2017 season as bloom percentage by region
1 North: TMG – Triângulo Mineiro, BEB – Bebedouro, ALT – Altinópolis. 2 Northwest: VOT – Votuporanga, SJO – São José do Rio Preto. 3 Central: MAT – Matão, DUA – Duartina, BRO – Brotas. 4 South: PFE – Porto Ferreira, LIM – Limeira. 5 Southwest: AVA – Avaré, ITG – Itapetininga. 6 AVE – Weighted average per stratum fruits.
Bloom North1 Northwest2 Central3 South4 Sudoeste5
AVE6 TMG BEB ALT AVE6 VOT SJO AVE6 MAT DUA BRO AVE6 PFE LIM AVE6 AVA ITG AVE6
(%) (%) (%) (%) (%) (%) (%) (%) (%) (%) (%) (%) (%) (%) (%) (%) (%) (%)
1st ....... 62.3 76.2 79.6 73.6 74.2 68.5 71.2 73.1 82.5 77.1 78.4 75.0 76.2 75.6 84.0 87.5 85.0 78.3
2nd ....... 11.6 13.8 8.7 12.4 16.7 10.0 13.1 16.3 10.8 10.1 12.5 13.3 12.0 12.7 8.4 5.5 7.6 11.2
3rd ....... 13.7 6.7 4.5 7.9 6.1 4.8 5.4 7.0 4.3 6.3 5.5 6.3 5.4 5.9 4.1 5.2 4.4 5.7
4th ....... 12.4 3.3 7.2 6.0 3.0 16.7 10.3 3.7 2.5 6.5 3.6 5.4 6.3 5.8 3.5 1.8 3.0 4.8
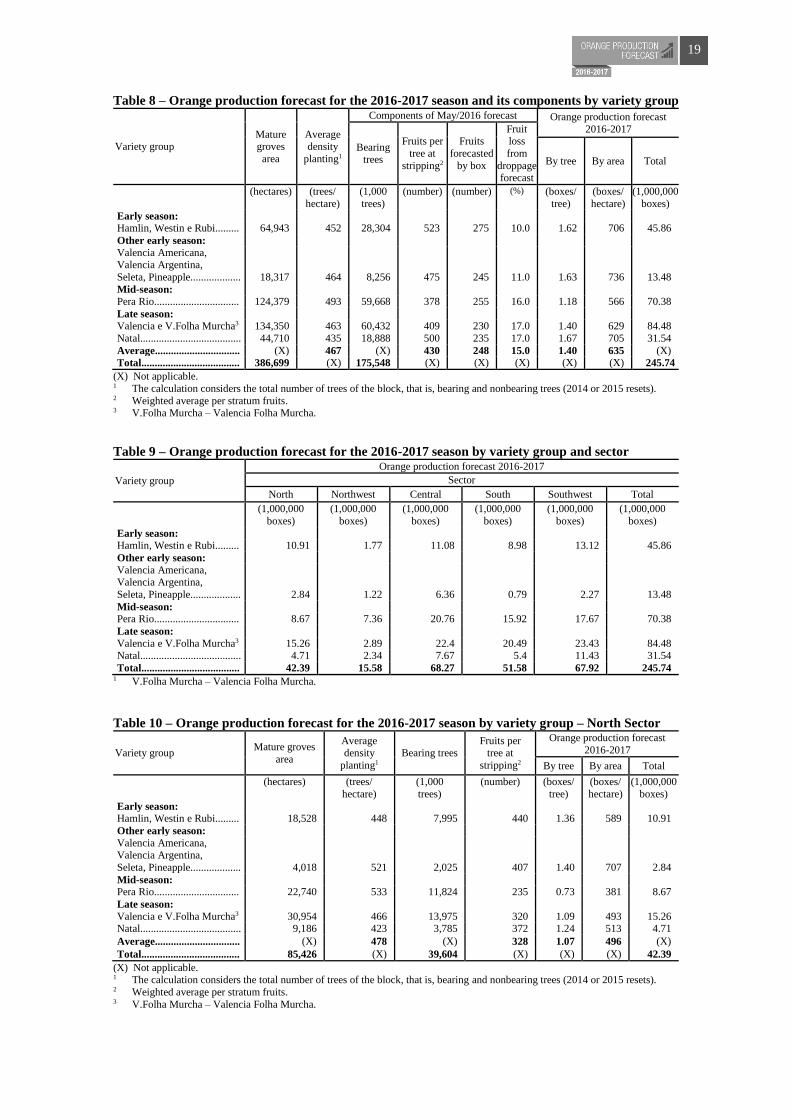
19
Table 8 – Orange production forecast for the 2016-2017 season and its components by variety group
Variety group Mature groves
area
Average density
planting1
Components of May/2016 forecast Orange production forecast
2016-2017
Bearing trees
Fruits per
tree at
stripping2
Fruits
forecasted
by box
Fruit loss
from
droppage forecast
By tree By area Total
(hectares) (trees/
hectare)
(1,000
trees)
(number) (number) (%) (boxes/
tree)
(boxes/
hectare)
(1,000,000
boxes)
Early season: Hamlin, Westin e Rubi......... 64,943 452 28,304 523 275 10.0 1.62 706 45.86
Other early season:
Valencia Americana, Valencia Argentina,
Seleta, Pineapple................... 18,317 464 8,256 475 245 11.0 1.63 736 13.48
Mid-season:
Pera Rio................................ 124,379 493 59,668 378 255 16.0 1.18 566 70.38
Late season:
Valencia e V.Folha Murcha3 134,350 463 60,432 409 230 17.0 1.40 629 84.48
Natal...................................... 44,710 435 18,888 500 235 17.0 1.67 705 31.54
Average................................ (X) 467 (X) 430 248 15.0 1.40 635 (X)
Total..................................... 386,699 (X) 175,548 (X) (X) (X) (X) (X) 245.74
(X) Not applicable. 1 The calculation considers the total number of trees of the block, that is, bearing and nonbearing trees (2014 or 2015 resets). 2 Weighted average per stratum fruits. 3 V.Folha Murcha – Valencia Folha Murcha.
Table 9 – Orange production forecast for the 2016-2017 season by variety group and sector
Variety group
Orange production forecast 2016-2017
Sector
North Northwest Central South Southwest Total
(1,000,000
boxes)
(1,000,000
boxes)
(1,000,000
boxes)
(1,000,000
boxes)
(1,000,000
boxes)
(1,000,000
boxes)
Early season:
Hamlin, Westin e Rubi......... 10.91 1.77 11.08 8.98 13.12 45.86
Other early season:
Valencia Americana, Valencia Argentina,
Seleta, Pineapple................... 2.84 1.22 6.36 0.79 2.27 13.48
Mid-season: Pera Rio................................ 8.67 7.36 20.76 15.92 17.67 70.38
Late season:
Valencia e V.Folha Murcha3 15.26 2.89 22.4 20.49 23.43 84.48 Natal...................................... 4.71 2.34 7.67 5.4 11.43 31.54
Total..................................... 42.39 15.58 68.27 51.58 67.92 245.74 1 V.Folha Murcha – Valencia Folha Murcha.
Table 10 – Orange production forecast for the 2016-2017 season by variety group – North Sector
Variety group Mature groves
area
Average density
planting1
Bearing trees Fruits per
tree at
stripping2
Orange production forecast
2016-2017
By tree By area Total
(hectares) (trees/
hectare)
(1,000
trees)
(number) (boxes/
tree)
(boxes/
hectare)
(1,000,000
boxes)
Early season: Hamlin, Westin e Rubi......... 18,528 448 7,995 440 1.36 589 10.91
Other early season:
Valencia Americana, Valencia Argentina,
Seleta, Pineapple................... 4,018 521 2,025 407 1.40 707 2.84
Mid-season: Pera Rio................................ 22,740 533 11,824 235 0.73 381 8.67
Late season:
Valencia e V.Folha Murcha3 30,954 466 13,975 320 1.09 493 15.26 Natal...................................... 9,186 423 3,785 372 1.24 513 4.71
Average................................ (X) 478 (X) 328 1.07 496 (X)
Total..................................... 85,426 (X) 39,604 (X) (X) (X) 42.39
(X) Not applicable. 1 The calculation considers the total number of trees of the block, that is, bearing and nonbearing trees (2014 or 2015 resets). 2 Weighted average per stratum fruits. 3 V.Folha Murcha – Valencia Folha Murcha.
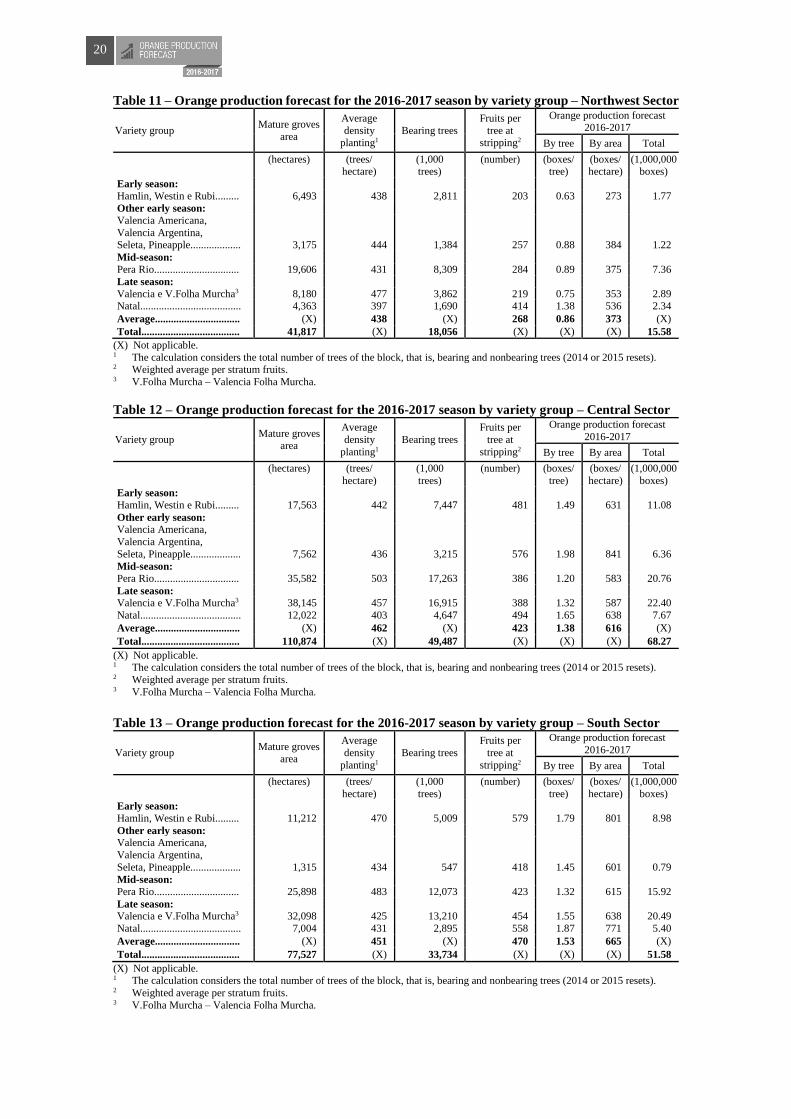
20
Table 11 – Orange production forecast for the 2016-2017 season by variety group – Northwest Sector
Variety group Mature groves
area
Average
density planting1
Bearing trees
Fruits per
tree at stripping2
Orange production forecast 2016-2017
By tree By area Total
(hectares) (trees/
hectare) (1,000 trees)
(number) (boxes/ tree)
(boxes/ hectare)
(1,000,000 boxes)
Early season:
Hamlin, Westin e Rubi......... 6,493 438 2,811 203 0.63 273 1.77
Other early season:
Valencia Americana,
Valencia Argentina, Seleta, Pineapple................... 3,175 444 1,384 257 0.88 384 1.22
Mid-season:
Pera Rio................................ 19,606 431 8,309 284 0.89 375 7.36
Late season:
Valencia e V.Folha Murcha3 8,180 477 3,862 219 0.75 353 2.89 Natal...................................... 4,363 397 1,690 414 1.38 536 2.34
Average................................ (X) 438 (X) 268 0.86 373 (X)
Total..................................... 41,817 (X) 18,056 (X) (X) (X) 15.58
(X) Not applicable. 1 The calculation considers the total number of trees of the block, that is, bearing and nonbearing trees (2014 or 2015 resets). 2 Weighted average per stratum fruits. 3 V.Folha Murcha – Valencia Folha Murcha.
Table 12 – Orange production forecast for the 2016-2017 season by variety group – Central Sector
Variety group Mature groves
area
Average
density
planting1
Bearing trees
Fruits per
tree at
stripping2
Orange production forecast
2016-2017
By tree By area Total
(hectares) (trees/
hectare)
(1,000
trees)
(number) (boxes/
tree)
(boxes/
hectare)
(1,000,000
boxes)
Early season:
Hamlin, Westin e Rubi......... 17,563 442 7,447 481 1.49 631 11.08
Other early season: Valencia Americana,
Valencia Argentina,
Seleta, Pineapple................... 7,562 436 3,215 576 1.98 841 6.36
Mid-season:
Pera Rio................................ 35,582 503 17,263 386 1.20 583 20.76
Late season: Valencia e V.Folha Murcha3 38,145 457 16,915 388 1.32 587 22.40
Natal...................................... 12,022 403 4,647 494 1.65 638 7.67
Average................................ (X) 462 (X) 423 1.38 616 (X)
Total..................................... 110,874 (X) 49,487 (X) (X) (X) 68.27
(X) Not applicable. 1 The calculation considers the total number of trees of the block, that is, bearing and nonbearing trees (2014 or 2015 resets). 2 Weighted average per stratum fruits. 3 V.Folha Murcha – Valencia Folha Murcha.
Table 13 – Orange production forecast for the 2016-2017 season by variety group – South Sector
Variety group Mature groves
area
Average
density
planting1
Bearing trees
Fruits per
tree at
stripping2
Orange production forecast
2016-2017
By tree By area Total
(hectares) (trees/
hectare)
(1,000
trees)
(number) (boxes/
tree)
(boxes/
hectare)
(1,000,000
boxes)
Early season:
Hamlin, Westin e Rubi......... 11,212 470 5,009 579 1.79 801 8.98
Other early season: Valencia Americana,
Valencia Argentina,
Seleta, Pineapple................... 1,315 434 547 418 1.45 601 0.79
Mid-season:
Pera Rio................................ 25,898 483 12,073 423 1.32 615 15.92
Late season: Valencia e V.Folha Murcha3 32,098 425 13,210 454 1.55 638 20.49
Natal...................................... 7,004 431 2,895 558 1.87 771 5.40
Average................................ (X) 451 (X) 470 1.53 665 (X)
Total..................................... 77,527 (X) 33,734 (X) (X) (X) 51.58
(X) Not applicable. 1 The calculation considers the total number of trees of the block, that is, bearing and nonbearing trees (2014 or 2015 resets). 2 Weighted average per stratum fruits. 3 V.Folha Murcha – Valencia Folha Murcha.
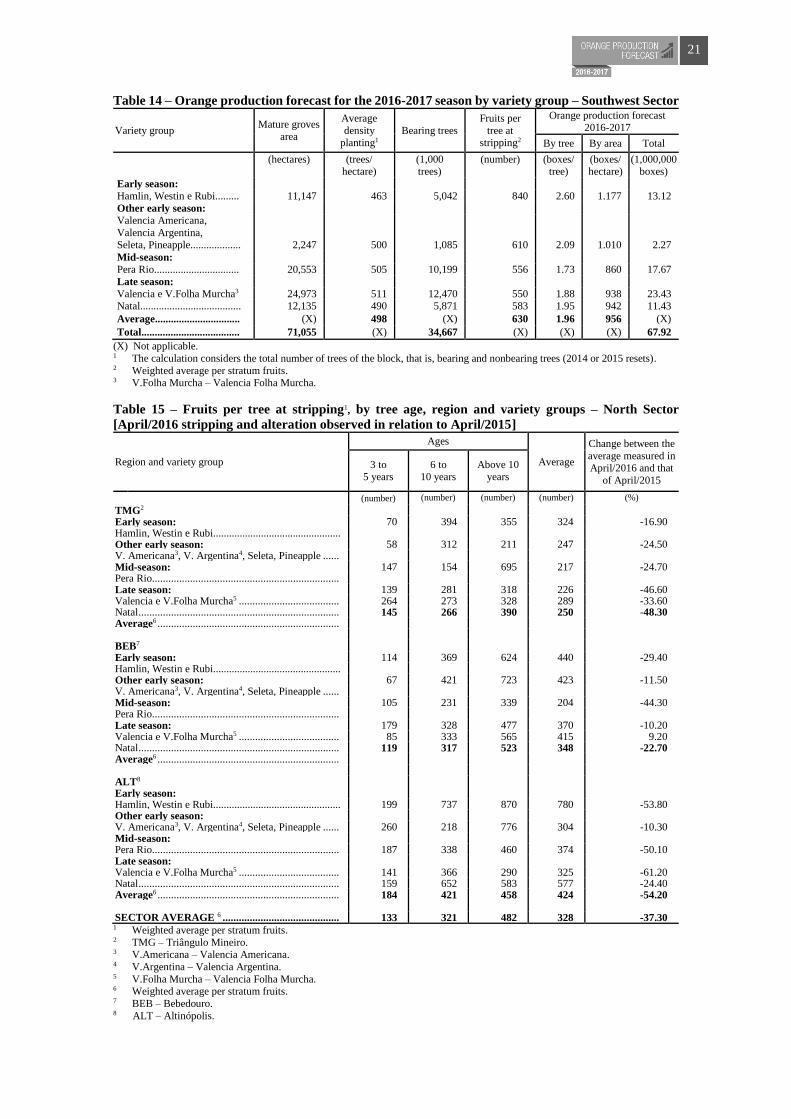
21
Table 14 – Orange production forecast for the 2016-2017 season by variety group – Southwest Sector
Variety group Mature groves
area
Average
density planting1
Bearing trees
Fruits per
tree at stripping2
Orange production forecast 2016-2017
By tree By area Total
(hectares) (trees/
hectare) (1,000 trees)
(number) (boxes/ tree)
(boxes/ hectare)
(1,000,000 boxes)
Early season:
Hamlin, Westin e Rubi......... 11,147 463 5,042 840 2.60 1.177 13.12
Other early season:
Valencia Americana,
Valencia Argentina, Seleta, Pineapple................... 2,247 500 1,085 610 2.09 1.010 2.27
Mid-season:
Pera Rio................................ 20,553 505 10,199 556 1.73 860 17.67
Late season:
Valencia e V.Folha Murcha3 24,973 511 12,470 550 1.88 938 23.43 Natal...................................... 12,135 490 5,871 583 1.95 942 11.43
Average................................ (X) 498 (X) 630 1.96 956 (X)
Total..................................... 71,055 (X) 34,667 (X) (X) (X) 67.92
(X) Not applicable. 1 The calculation considers the total number of trees of the block, that is, bearing and nonbearing trees (2014 or 2015 resets). 2 Weighted average per stratum fruits. 3 V.Folha Murcha – Valencia Folha Murcha.
Table 15 – Fruits per tree at stripping1, by tree age, region and variety groups – North Sector
[April/2016 stripping and alteration observed in relation to April/2015]
Region and variety group
Ages
Average
Change between the
average measured in April/2016 and that
of April/2015
3 to 5 years
6 to 10 years
Above 10 years
(number) (number) (number) (number) (%) TMG2 Early season: 70 394 355 324 -16.90 Hamlin, Westin e Rubi................................................ Other early season: 58 312 211 247 -24.50 V. Americana3, V. Argentina4, Seleta, Pineapple ...... Mid-season: 147 154 695 217 -24.70 Pera Rio ..................................................................... Late season: 139 281 318 226 -46.60 Valencia e V.Folha Murcha5 ..................................... 264 273 328 289 -33.60 Natal .......................................................................... 145 266 390 250 -48.30 Average6 ................................................................... BEB7 Early season: 114 369 624 440 -29.40 Hamlin, Westin e Rubi................................................ Other early season: 67 421 723 423 -11.50 V. Americana3, V. Argentina4, Seleta, Pineapple ...... Mid-season: 105 231 339 204 -44.30 Pera Rio ..................................................................... Late season: 179 328 477 370 -10.20 Valencia e V.Folha Murcha5 ..................................... 85 333 565 415 9.20 Natal .......................................................................... 119 317 523 348 -22.70 Average6 ................................................................... ALT8 Early season: Hamlin, Westin e Rubi................................................ 199 737 870 780 -53.80 Other early season: V. Americana3, V. Argentina4, Seleta, Pineapple ...... 260 218 776 304 -10.30 Mid-season: Pera Rio ..................................................................... 187 338 460 374 -50.10 Late season: Valencia e V.Folha Murcha5 ..................................... 141 366 290 325 -61.20 Natal .......................................................................... 159 652 583 577 -24.40 Average6 ................................................................... 184 421 458 424 -54.20 SECTOR AVERAGE 6 ........................................... 133 321 482 328 -37.30
1 Weighted average per stratum fruits. 2 TMG – Triângulo Mineiro. 3 V.Americana – Valencia Americana. 4 V.Argentina – Valencia Argentina. 5 V.Folha Murcha – Valencia Folha Murcha. 6 Weighted average per stratum fruits. 7 BEB – Bebedouro. 8 ALT – Altinópolis.

22
Table 16 – Fruits per tree at stripping1, by tree age, region and variety groups – Northwest Sector
[April/2016 stripping and alteration observed in relation to April/2015]
Region and variety group
Ages
Average
Change between the average measured in
April/2016 and that
of April/2015
3 to 5 years
6 to 10 years
Above 10 years
(number) (number) (number) (number) (%)
VOT2
Early season:
Hamlin, Westin e Rubi................................................ 72 394 256 290 -22.70
Other early season:
V. Americana3, V. Argentina4, Seleta, Pineapple ...... 314 361 780 377 52.00
Mid-season:
Pera Rio ..................................................................... 177 281 434 270 -3.60
Late season:
Valencia e V.Folha Murcha5 ..................................... 174 121 327 174 -31.50
Natal .......................................................................... 58 339 698 478 14.60
Average6 ................................................................... 172 270 452 273 -5.20
SJO7
Early season:
Hamlin, Westin e Rubi................................................ 83 237 204 187 -44.70
Other early season:
V. Americana3, V. Argentina4, Seleta, Pineapple ...... 80 277 572 236 -40.90
Mid-season:
Pera Rio ..................................................................... 151 344 392 322 6.30
Late season:
Valencia e V.Folha Murcha5 ..................................... 177 273 253 236 22.90
Natal .......................................................................... 158 393 429 391 -40.80
Average6 ................................................................... 131 291 358 263 -20.30
SECTOR AVERAGE 6 ........................................... 148 280 389 268 -13.50 1 Weighted average per stratum fruits. 2 VOT – Votuporanga. 3 V.Americana – Valencia Americana. 4 V.Argentina – Valencia Argentina. 5 V.Folha Murcha – Valencia Folha Murcha. 6 Weighted average per stratum fruits. 7 SJO – São José do Rio Preto.
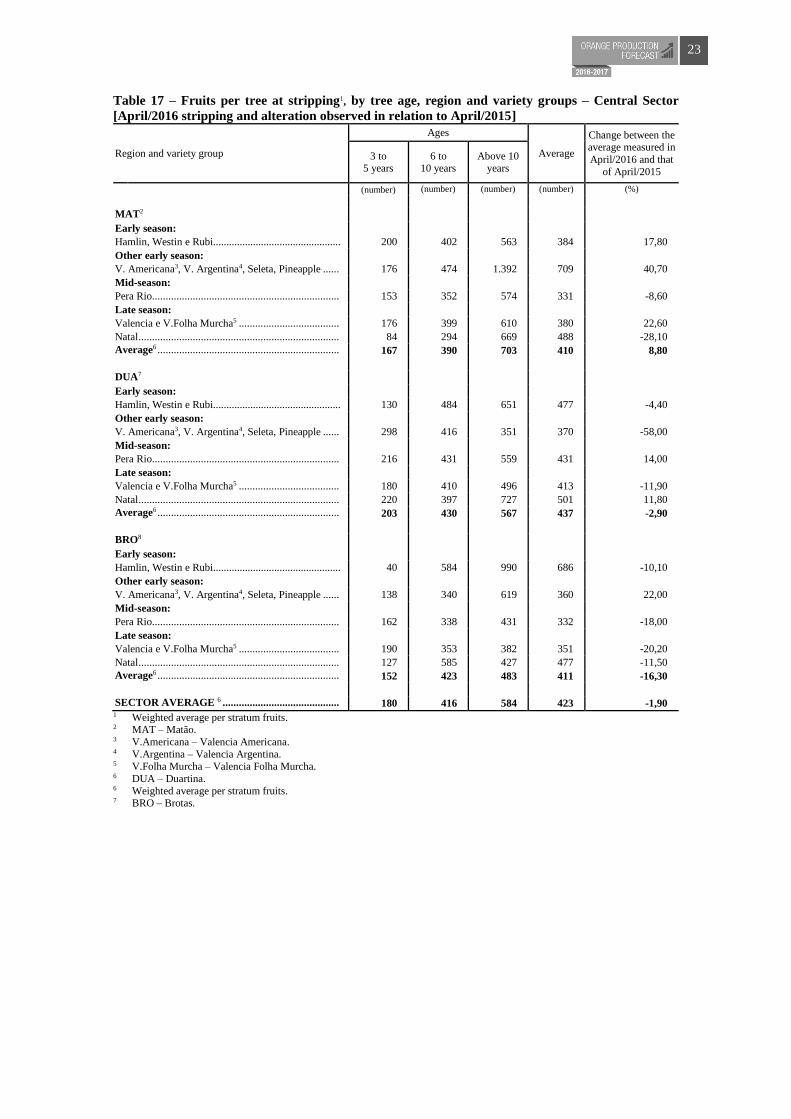
23
Table 17 – Fruits per tree at stripping1, by tree age, region and variety groups – Central Sector
[April/2016 stripping and alteration observed in relation to April/2015]
Region and variety group
Ages
Average
Change between the average measured in
April/2016 and that
of April/2015
3 to 5 years
6 to 10 years
Above 10 years
(number) (number) (number) (number) (%)
MAT2
Early season:
Hamlin, Westin e Rubi................................................ 200 402 563 384 17,80
Other early season:
V. Americana3, V. Argentina4, Seleta, Pineapple ...... 176 474 1.392 709 40,70
Mid-season:
Pera Rio ..................................................................... 153 352 574 331 -8,60
Late season:
Valencia e V.Folha Murcha5 ..................................... 176 399 610 380 22,60
Natal .......................................................................... 84 294 669 488 -28,10
Average6 ................................................................... 167 390 703 410 8,80
DUA7
Early season:
Hamlin, Westin e Rubi................................................ 130 484 651 477 -4,40
Other early season:
V. Americana3, V. Argentina4, Seleta, Pineapple ...... 298 416 351 370 -58,00
Mid-season:
Pera Rio ..................................................................... 216 431 559 431 14,00
Late season:
Valencia e V.Folha Murcha5 ..................................... 180 410 496 413 -11,90
Natal .......................................................................... 220 397 727 501 11,80
Average6 ................................................................... 203 430 567 437 -2,90
BRO8
Early season:
Hamlin, Westin e Rubi................................................ 40 584 990 686 -10,10
Other early season:
V. Americana3, V. Argentina4, Seleta, Pineapple ...... 138 340 619 360 22,00
Mid-season:
Pera Rio ..................................................................... 162 338 431 332 -18,00
Late season:
Valencia e V.Folha Murcha5 ..................................... 190 353 382 351 -20,20
Natal .......................................................................... 127 585 427 477 -11,50
Average6 ................................................................... 152 423 483 411 -16,30
SECTOR AVERAGE 6 ........................................... 180 416 584 423 -1,90 1 Weighted average per stratum fruits. 2 MAT – Matão. 3 V.Americana – Valencia Americana. 4 V.Argentina – Valencia Argentina. 5 V.Folha Murcha – Valencia Folha Murcha. 6 DUA – Duartina. 6 Weighted average per stratum fruits. 7 BRO – Brotas.
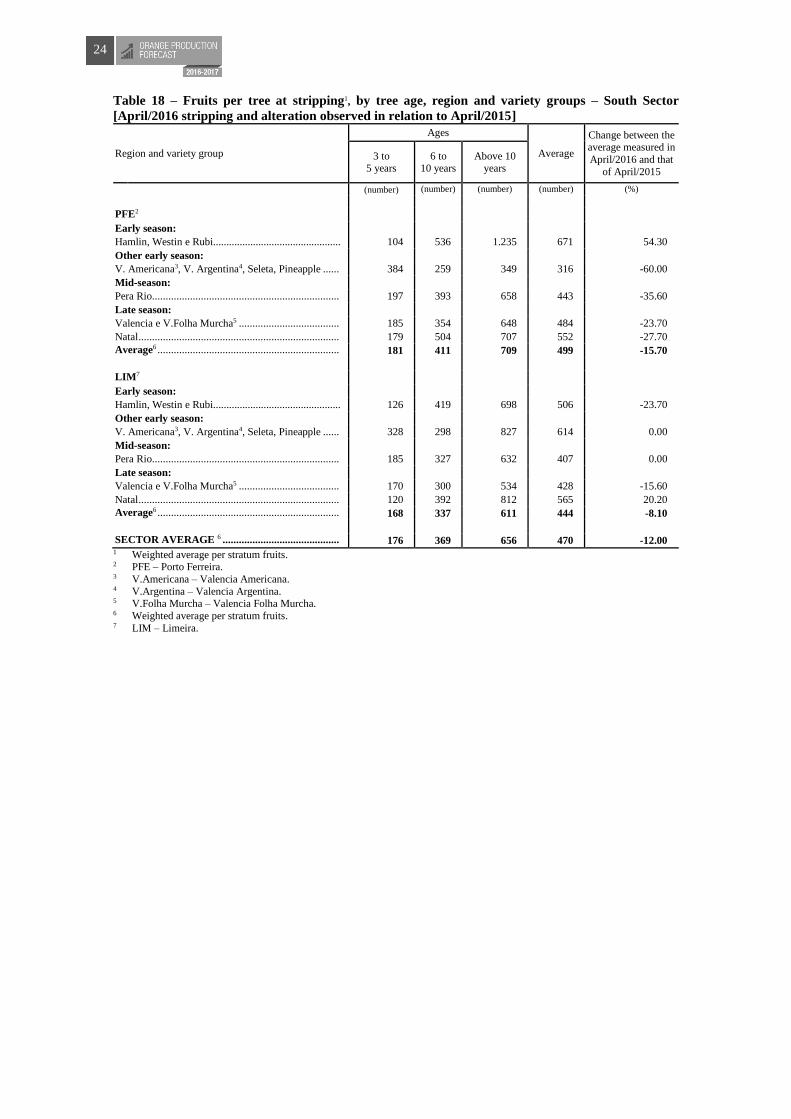
24
Table 18 – Fruits per tree at stripping1, by tree age, region and variety groups – South Sector
[April/2016 stripping and alteration observed in relation to April/2015]
Region and variety group
Ages
Average
Change between the average measured in
April/2016 and that
of April/2015
3 to 5 years
6 to 10 years
Above 10 years
(number) (number) (number) (number) (%)
PFE2
Early season:
Hamlin, Westin e Rubi................................................ 104 536 1.235 671 54.30
Other early season:
V. Americana3, V. Argentina4, Seleta, Pineapple ...... 384 259 349 316 -60.00
Mid-season:
Pera Rio ..................................................................... 197 393 658 443 -35.60
Late season:
Valencia e V.Folha Murcha5 ..................................... 185 354 648 484 -23.70
Natal .......................................................................... 179 504 707 552 -27.70
Average6 ................................................................... 181 411 709 499 -15.70
LIM7
Early season:
Hamlin, Westin e Rubi................................................ 126 419 698 506 -23.70
Other early season:
V. Americana3, V. Argentina4, Seleta, Pineapple ...... 328 298 827 614 0.00
Mid-season:
Pera Rio ..................................................................... 185 327 632 407 0.00
Late season:
Valencia e V.Folha Murcha5 ..................................... 170 300 534 428 -15.60
Natal .......................................................................... 120 392 812 565 20.20
Average6 ................................................................... 168 337 611 444 -8.10
SECTOR AVERAGE 6 ........................................... 176 369 656 470 -12.001 Weighted average per stratum fruits. 2 PFE – Porto Ferreira. 3 V.Americana – Valencia Americana.4 V.Argentina – Valencia Argentina.5 V.Folha Murcha – Valencia Folha Murcha.6 Weighted average per stratum fruits. 7 LIM – Limeira.
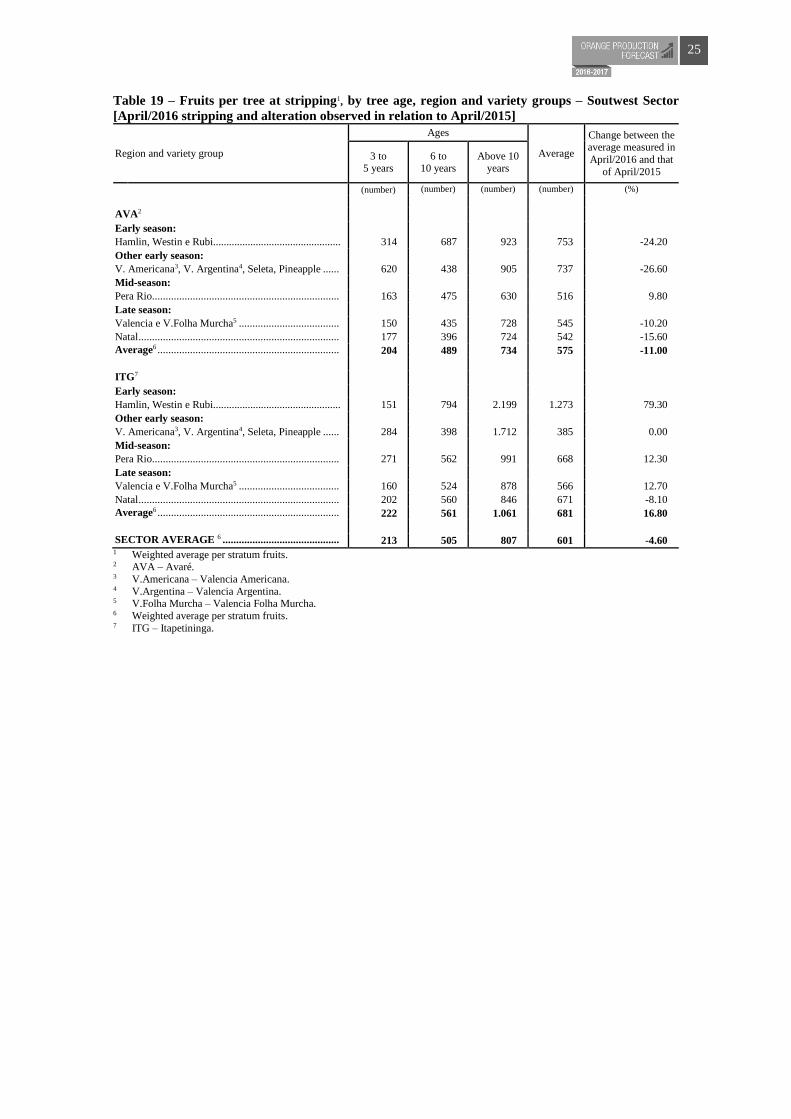
25
Table 19 – Fruits per tree at stripping1, by tree age, region and variety groups – Soutwest Sector
[April/2016 stripping and alteration observed in relation to April/2015]
Region and variety group
Ages
Average
Change between the average measured in
April/2016 and that
of April/2015
3 to 5 years
6 to 10 years
Above 10 years
(number) (number) (number) (number) (%)
AVA2
Early season:
Hamlin, Westin e Rubi................................................ 314 687 923 753 -24.20
Other early season:
V. Americana3, V. Argentina4, Seleta, Pineapple ...... 620 438 905 737 -26.60
Mid-season:
Pera Rio ..................................................................... 163 475 630 516 9.80
Late season:
Valencia e V.Folha Murcha5 ..................................... 150 435 728 545 -10.20
Natal .......................................................................... 177 396 724 542 -15.60
Average6 ................................................................... 204 489 734 575 -11.00
ITG7
Early season:
Hamlin, Westin e Rubi................................................ 151 794 2.199 1.273 79.30
Other early season:
V. Americana3, V. Argentina4, Seleta, Pineapple ...... 284 398 1.712 385 0.00
Mid-season:
Pera Rio ..................................................................... 271 562 991 668 12.30
Late season:
Valencia e V.Folha Murcha5 ..................................... 160 524 878 566 12.70
Natal .......................................................................... 202 560 846 671 -8.10
Average6 ................................................................... 222 561 1.061 681 16.80
SECTOR AVERAGE 6 ........................................... 213 505 807 601 -4.60 1 Weighted average per stratum fruits. 2 AVA – Avaré. 3 V.Americana – Valencia Americana. 4 V.Argentina – Valencia Argentina. 5 V.Folha Murcha – Valencia Folha Murcha. 6 Weighted average per stratum fruits. 7 ITG – Itapetininga.

26