TREATMENT OF AGRICULTURAL RUN-OFF USING …
133
i TREATMENT OF AGRICULTURAL RUN-OFF USING INNOVATIVE CDI FILTRATION TECHNIQUES A thesis submitted by Salam Bakly, B Eng For the award of Master of Engineering (Research) 2019
Transcript of TREATMENT OF AGRICULTURAL RUN-OFF USING …

i
TREATMENT OF AGRICULTURAL RUN-OFF USING INNOVATIVE
CDI FILTRATION TECHNIQUES
A thesis submitted by
Salam Bakly, B Eng
For the award of
Master of Engineering (Research)
2019

ii
Abstract
Anthropogenic activities such as industrial discharge and agricultural run-off
can negatively impact surface water quality. Agricultural run-off contaminants,
other than soil particles and suspended solids are mainly nitrogen-based,
phosphorus, sourced primarily from fertilisers and pesticides. Currently
available treatment methods include biological treatments, aeration and
filtration, however, these methods are restricted by their removal capacity, land
requirement and cost. Very little research has been done on the application of
capacitive deionisation (CDI) coupled with biochar in agricultural settings.
This project is dedicated to investigate the capacity of this combination for
removal of nitrate as a commonly existing contaminants in agriculture runoff.
The application of CDI to multi-media filter layers of biochar (BC) is a
promising technology to improve the nutrient adsorption capability of the BC
and thus remove nutrients from the water media. The ability to easily
rejuvenate the CDI-BC layers, allows for incorporation into simple backflush
cycles in line with current industrial practice, whilst the increased capacity
allows for a reduced number of such cycles.
This study tested the natural abilities of in-house prepared BCs sourced from
agricultural waste biomass source i.e. Macadamia or as it is more traditionally
known Bauple nutshells, in batch and column experiments targeting nitrate
removal. The macadamia biochar (MBC) samples were pyrolysed at 900°C
and 1000°C respectively, then characterised using standard techniques such as
functional group identification using Fourier Transform Infrared Spectroscopy
(FTIR) and physical structures analysis with a Scanning Electron Microscopy
(SEM). Batch experiments found that 1000°C pyrolysed MBC achieved better
nitrate removal around double than those of MBC pyrolyzed at 900°C.
Column test with upward flow removed more nitrate compared to downward
flow, largely due to their longer contact time. Three concentrations of 5, 10 and
15 mg/L and 3 flow rates of 2, 4 and 10 ml/min were tested applying factorial
design. The lowest flow rate of 2 ml/min with the highest concentration at 15
mg/L were found to be the most effective settings for nitrate removal. A
laboratory scale in-house designed CDI-MBC unit was used to assess the

iii
relative improvement to contaminant removal capacity of natural MBC. The
results of these laboratory scale tests can be used to aid the future design of a
pilot-scale unit, suitable for handling typical agricultural nutrient and pesticide
contamination on farm. The CDI assisted MBC tests found that with the
addition of CDI, the filter can remove around three times the natural MBC
capability. Incorporating CDI also prolonged effective useability of the filter.
CDI-MBC reached filter saturation after 72 hours usage, compared to 5.5 hrs
usage of natural MBC.
Nitrate desorption was carried out after the column was saturated by being back
flushed with deionised and/or tap water, using the so called ‘degaussing
method’. The name is derived from the approach used to remove magnetism
from test equipment by applying a strong alternating voltage. In the case of
CDI we applied a square waveform of frequency 100 Hz, amplitude 0.5 V and
current 0.06 A during backflush to desorb nitrate. These experiments found
that the ‘degaussing’ technique recovered around 80% of nitrate in 30 minutes,
while 48% and 35% of nitrate was recovered after one hour for the backflush
with deionised water and tap water respectively. The CDI- MBC regenerated
filter was tested for three cycles. It was found that the fresh column was
exhausted after 72 hours and the regenerated filters for cycle one and two were
exhausted after 60 and 48 hours, respectively.

iv
Certification of Thesis
This Thesis is the work of Salam Bakly except where otherwise acknowledged, with
the majority of the authorship of the papers presented as a Thesis by Publication
undertaken by the Student. The work is original and has not previously been submitted
for any other award, except where acknowledged.
Principal Supervisor: Senior Lecturer Les Bowtell
Associate Supervisor: Dr. Raed Ahmed Mahmood
Associate Supervisor: Dr. Vasanthadevi Aravinthan
Student and supervisors signatures of endorsement are held at the University.

v
Acknowledgements
I would like to extend my gratitude to the many people who have made my Master’s
thesis possible.
I would like to express my sincere gratitude to my principal supervisor Senior Lecturer
Dr Les Bowtell for his encouragement, support, and valuable guidance throughout the
entirety of the study. Thanks are also due to my Associate Supervisor Dr Raed Ahmed
Mahmood for providing guidance patiently through the challenge of identifying novel
research topics and completing successful experiments. Other thanks go to Associate
Supervisor Dr Vasanthadevi Aravinthan for her advice, support and constructive
feedback.
I would like to thank Sandra Cochrane, for her help to improve the language of this
thesis.
I am thankful to the Ministry of Water Resources of Iraq who gave the opportunity to
do my Masters study at the USQ.
I am thankful to the Australian Commonwealth Government’s contribution through
the Research Training Scheme (RTS) during my research.
I would like to show my great appreciation to all the academic, administrative and
technical staff at USQ for their support and patience during my research activities.
I am grateful to the wonderful colleagues that I made at USQ, and for the great
company and support that you provided to me.
My special thanks to my beloved mother who I hope to make proud in every way and
to my great father who will be very happy with this achievement. Also, I express my
thanks to my lovely wife and two gorgeous daughters for their support, patience and
loving environment created during my study journey.
It is to my parents, for unconditional love and support, my wife Shaymaa, for all time
you stand behind to push me forward, and to my children Zahraa and Rian that I
dedicate this thesis.

vi
Table of Contents
Abstract ....................................................................................................................... ii
Certification of Thesis ............................................................................................... iv
Acknowledgements ..................................................................................................... v
List of Figures ............................................................................................................. x
List of Tables ............................................................................................................. xi
CHAPTER 1 Introduction and Aims .................................................................. 1
1.1 Overview ....................................................................................................... 1
1.2 Techniques to reduce the effects of agricultural runoff................................. 1
Constructed wetlands (CWs) ................................................................. 1
Filtration ................................................................................................. 2
Aeration .................................................................................................. 2
Biochar ................................................................................................... 2
1.3 Research questions ........................................................................................ 3
1.4 Aim and objectives ........................................................................................ 3
1.5 The scope of the study ................................................................................... 3
1.6 Outline of the thesis ....................................................................................... 4
CHAPTER 2 Literature review ............................................................................ 5
2.1 The aim of this chapter .................................................................................. 5
2.2 Introduction ................................................................................................... 5
2.3 Common techniques for nutrients removal ................................................... 8

vii
Constructed Wetlands (CWs) ................................................................. 8
Filtration ............................................................................................... 13
Aeration ................................................................................................ 18
Other techniques (Algae and Woodchips) ........................................... 21
Biochar (BC) filtration ......................................................................... 27
Overall evaluation of available treatment technologies ....................... 33
2.4 Agricultural runoff ...................................................................................... 37
2.5 CDI techniques ............................................................................................ 38
2.6 Regeneration ................................................................................................ 40
2.7 Conclusions ................................................................................................. 42
CHAPTER 3 Biochar Characterisation and contaminant removal
capability ................................................................................................................... 43
3.1 Introduction ................................................................................................. 43
3.2 Materials and Methods ................................................................................ 44
Solution preparation ............................................................................. 44
Biomass preparation ............................................................................. 44
Column preparation .............................................................................. 45
Analytical measurements ..................................................................... 47
3.3 Results and discussions ............................................................................... 52
Preliminary results ............................................................................... 52
Effect of flow direction on nitrate adsorption ...................................... 58

vii
i
Normality and residual analyses .......................................................... 62
Maximum adsorption time ................................................................... 71
3.4 Chapter summary ........................................................................................ 73
CHAPTER 4 Applying CDI technique to promote MBC removal efficiency . 74
4.1 Introduction ................................................................................................. 74
4.2 Materials and Methods ................................................................................ 74
Solution preparation ............................................................................. 74
Preparation of carbon electrode ........................................................... 74
Experimental procedure for further adsorption improvement using CDI
75
Experimental procedure for regeneration and nitrate recovery using
back flush with DI.W and TW ........................................................................... 78
Experimental procedure for regeneration and nitrate recovery using a
degaussing technique with backflush ................................................................. 78
Nitrate removal with the regenerated MBC column ............................ 80
Analytical methods............................................................................... 80
4.3 Results and discussions ............................................................................... 81
Effect of CDI technique on the MBC adsorption capability ................ 81
Desorption and nitrates recovery by flushing deionised water ............ 83
Desorption and nitrates recovery using Degaussing with DI.W .......... 85
Tap water used for nitrate recovery ..................................................... 88

ix
Nitrate removal with regenerated filter ................................................ 90
4.4 Chapter summary ........................................................................................ 92
CHAPTER 5 Conclusions and future work ..................................................... 94
References ................................................................................................................. 96
Appendix A ............................................................................................................. 115

x
List of Figures
Page No.
FIGURE 1-1: TOTAL WITHDRAWALS WATER AND CONSUMPTION. SHIKLOMANOV (1998) ......................................... 1 FIGURE 1-2: IRAQ MAP WITH TIGRIS AND EUPHRATES RIVERS (S.SEAL 2014) ......................................................... 0 FIGURE 1-3: SALINITY IN THE EUPHRATES (AL-THAMIRY ET AL. 2013) .................................................................. 0 FIGURE 2-1: CONSTRUCTED WETLAND BASIC TYPES BASED ON (VYMAZAL, 2007), 1. DISTRIBUTION ZONE FILLED WITH
LARGE STONES; 2.IMPERMEABLE LINER; 3. FILTRATION MEDIUM (GRAVEL, CRUSHED ROCK); 4. VEGETATION; 5.
WATER LEVEL IN THE BED; 6. COLLECTION ZONE FILLED WITH LARGE STONES; 7. COLLECTION DRAINAGE PIPE; 8.
OUTLET STRUCTURE FOR MAINTAINING OF WATER LEVEL IN THE BED. THE ARROWS INDICATE ONLY A GENERAL FLOW
PATTERN (VYMAZAL, 2001). ............................................................................................................. 10 FIGURE 2-2: CONSTRUCTED WETLAND WITH FILTRATION BED (BROWNING ET AL. 2014) ........................................ 14 FIGURE 2-3: AERATION TYPES BASED ON UGGETTI ET AL. (2016) ....................................................................... 19 FIGURE 2-4: ALGAL BLOOMS POND (ROBERTS 2008) ...................................................................................... 22 FIGURE 2-5: (A) RACEWAY OF ALGAE POND GROWN AREA BASED ON (CHISTI 2007). (B) PADDLEWHEEL WITHIN THE
FLOW-WAY (MOANA 2016) ............................................................................................................ 23 FIGURE 2-6: (A) SCHEMATIC OF WOOD CHIPS BIOREACTOR (VAN DRIEL ET AL. 2006). (B) WOOD CHIPS BIOREACTOR IN
FIELD SCALE BASED ON CHRISTIANSON (2016) ...................................................................................... 25 FIGURE 2-7: DIFFERENT ABSORPTION MECHANISMS ON BIOCHAR ....................................................................... 29 FIGURE 2-8: PYROLYSIS BIOMASS TO PRODUCE BIOCHAR (LEHMANN 2007) ......................................................... 31 FIGURE 2-9: SCHEMATIC OF CDI TECHNIQUE ................................................................................................. 39 FIGURE 2-10: SQUARE WAVES WITH DUTY CYCLE OF 0.5 (EL) (SUKOW ET AL. 2010) ............................................. 41 FIGURE 3-1: SCHEMATIC DIAGRAM OF MBC COLUMN ..................................................................................... 46 FIGURE 3-2: SCHEMATIC OF MBC COLUMN EXPERIMENT ................................................................................. 50 FIGURE 3-3: NITRATE REMOVAL WITH 10 MG/L NO-
3 CONCENTRATION .............................................................. 52 FIGURE 3-4: A & B SEM FOR RAW MACADAMIA NUT SHELL AND PYROLYSIS MBC C. 900°C AND D. 1000°C ........... 54 FIGURE 3-5: WEIGHT & ATOMIC PERCENTAGE A. RAW MACADAMIA NUT SHELL AND B. MACADAMIA BIOCHAR........... 55 FIGURE 3-6: FTIR ANALYSIS FOR 900 AND 1000°C MBC ................................................................................ 57 FIGURE 3-7: UPWARD AND DOWNWARD FLOW COLUMN ADSORPTION EXPERIMENT FOR 6 HOURS ........................... 58 FIGURE 3-8: COMPARE BETWEEN MBC1000°C BEFORE AND AFTER NITRATE ADSORPTION ..................................... 60 FIGURE 3-9: NORMAL DISTRIBUTION PLOT OF RESIDUAL FOR NITRATE REMOVAL EXPERIMENTS ................................. 64 FIGURE 3-10: RESIDUAL VS. FITTED VALUE FOR NITRATE REMOVAL EXPERIMENTS ............................. 65 FIGURE 3-11: RESIDUAL VS. FREQUENCY FOR NITRATE REMOVAL EXPERIMENTS ................................ 66 FIGURE 3-12: RESIDUALS VS. OBSERVATION ORDER FOR NITRATE REMOVAL EXPERIMENTS ................ 67 FIGURE 3-13: NITRATE REMOVAL BY USING MBC A. SURFACE PLOT B. CONTOUR PLOT .................... 69 FIGURE 3-14: BREAKTHROUGH CURVE FOR NITRATE ADSORPTION USING MBC. IDEAL BREAKTHROUGH CURVE (IBC) AT
FLOW RATE OF 2 ML/MIN .................................................................................................................. 71 FIGURE 4-1: MBC COLUMN WITH CDI TECHNIQUE (3CELLS) FOR NITRATE REMOVAL TEST ...................................... 76 FIGURE 4-2: MBC COLUMN WITH DEGAUSSING TECHNIQUE (3CELLS) FOR NITRATE RECOVERY ................................. 79 FIGURE 4-3: NITRATE REMOVAL BY NATURAL MBC VS MBC-CDI FOR A. SIX HOURS AND B. THREE DAYS .................. 82 FIGURE 4-4: NITRATE RECOVERY BY USING DEIONISED WATER ........................................................................... 84 FIGURE 4-5: NITRATE RECOVERY BY USING DEGAUSSING TECHNIQUE ................................................................... 86 FIGURE 4-6: TAP WATER USED FOR DESORPTION NITRATE IONS .......................................................................... 88 FIGURE 4-7: THREE TECHNIQUES USED FOR NITRATE RECOVERY.......................................................................... 89 FIGURE 4-8: NITRATE REMOVAL BY FRESH AND REGENERATION FILTER OF MBC WITH CDI A. SIX & B. 72 HOURS ....... 91

xi
List of Tables
Page No.
TABLE 2-1: FILTER MATERIALS AND PERCENTAGE OF MINERAL REMOVAL .............................................................. 16 TABLE 2: ADVANTAGE AND DISADVANTAGES OF DIFFERENT TREATMENT METHODS ........................... 35 TABLE 3-1: TRIPLICATE NITRATE REMOVAL EXPERIMENT USING MBC .................................................................. 62 TABLE 3-2: ANALYSIS OF VARIANCE (ANOVA) FOR NO-
3 REMOVAL USING ADJUSTED SS FOR TESTS ...... 63 TABLE 3-3: NITRATE ADSORPTION IN FIXED BED COLUMN 2 ML/MIN FLOW RATE AND 15 MG/L INITIAL CONCENTRATION
.................................................................................................................................................... 72 TABLE 4-1: PERCENTAGE OF DESORPTION USING DEGAUSSING TECHNIQUE ........................................................... 87
Introduction and Aims Chapter 1
1
CHAPTER 1
Introduction and Aims
1.1 Overview
In spite of the fact that 71% of the earth’s surface consists of water, only
approximately 2.5% of this water considered as fit for human consumption.
This includes water found in rivers, but also ice at some lakes (USGS 2016).
Overall accessible fresh water in the world is just 0.26% of the total available
water. A substantial proportion of this water is at risk of contamination due to
untreated runoff from factories and agricultural irrigation processes and other
anthropogenic activities entering into river systems (Shiklomanov, 1998).
In most farming systems around the world, untreated agricultural runoff returns
nutrients, such as ammonium NH+4 and nitrate NO-
3, as well as salts such as
NaCl, directly into rivers through drainage systems (Silberbush and Lips,
1988). For example, sugar cane production in Australia requires around 200 kg
per ha of urea-based fertilizer. Typically, more than 50% of this is lost during
the irrigation process. These nutrients eventually find their way into rivers and
other surface water sources (Carpenter et al., 1998). In Iraq, which is largely
Figure 1-1: Total withdrawals water and consumption. Shiklomanov (1998)
km
3 /
yea
r

Introduction and Aims Chapter 1
2
considered to be an agricultural country, the majority of the irrigation systems
rely on a gravity or pumped supply of surface water from the Tigris or the
Euphrates for irrigation. This approach causes high water losses and allows the
additional water to slowly infiltrate the soil layers and leach nutrients into
nearby river systems. The salt and nitrogen groups (NG) associated with this
leachate then become a complicated problem downstream, e.g. in the southern
reaches of the Euphrates in Iraq the quality of drinking and irrigation water is
compromised (Al-Shujairi, 2013). Several studies have attributed the
deterioration in the water quality of the Euphrates River to farming water (Rahi
& Halihan 2010).
In 2011, in the town of Al-Qaim, where the Euphrates river crosses the Iraq-
Syria border, TDS measurements of around 760 mg/L were observed, while in
Al-Simawa, a city about 280 km south of Baghdad and 770 km along the river
from its entry to Iraq, TDS was measured as 3620 mg/L by AL-Thamiry et al.
2013). See Figures 1-1 and 1-2 for an Iraqi map with the two big rivers and
the salinity in the Euphrates River changing from it is an entry point to 950 km
along the river to the south of Iraq, respectively.

Introduction and Aims Chapter 1
0
Al-Qaim
Euphrates
Figure 1-2: Iraq map with Tigris and Euphrates rivers (S.Seal, 2014)

Introduction and Aims Chapter 1
0
0
500
1000
1500
2000
2500
3000
3500
4000
TD
S, p
pm
Distance from the Syrian Border, km
Pre 1973
Post 1980
Figure 1-3: Salinity in the Euphrates (AL-Thamiry et al. 2013)

Introduction and Aims Chapter 1
1
Water with Total Dissolved Salts (TDS) of the water that can be used for
agricultural purposes is around 1500 mg/L before crop productivity is affected
(Specification of Iraq No. 417 for maintenance of river pollution, 1967). In the
Food and Agriculture Organization (FAO) guidelines, this TDS level in
irrigation water is considered to be severe and will negatively affect crop
productivity (FAO 1974). AL-Thamiry et al. (2013) proposed a solution to
solve this problem by changing the path of the high TDS drainage water to
another river and to some artificial lakes in order to reduce TDS influence on
the water quality of the Euphrates. This treatment does not really solve the
problem, but simply shifts it from one place to another with resulting in the
continued increase of TDS in other river systems.
1.2 Techniques to reduce the effects of agricultural runoff
Contamination is the main problem for water systems these days. The major
part of this problem is agricultural runoff because of uncontrolled irrigation,
chemical fertilisers, pesticides, crop residue and poultry litter. Although
fertilisers such as urea, nitrate or ammonia can improve crop productivity,
more than 80% of applied fertiliser is lost to the soil, atmosphere or to the water
system, with only 17% adsorbed by plants roots (Leach et al., 2012). After the
irrigation process or heavy rainfall, water can carry the pesticide and fertiliser
residue to the water system through surface runoff or seepage. This can lead to
water quality degradation and requires effective treatment techniques.
There are many methods for treating agricultural runoff (with various
contaminants) before it re-enters the water system: biological, chemical,
filtration and bio-treatment (microorganisms primarily bacteria).
Constructed wetlands (CWs)
CW is one of the approaches used for water treatment. CW is a biological
method that can be used to reduce pesticide and fertilizer residue as well as the
salinity effects from agricultural runoff. Recently, Asia and Europe have
started to use this method, especially for flat land mitigation of surface runoff
(Haberl et al., 1995). It is an efficient method, for both surface and subsurface
flow (vertical and horizontal), for removing pesticides such as organochlorines.

Introduction and Aims Chapter 1
2
It is not able to remove urea group chemicals (NH+4 & NO-
3) (Vymazal and
Březinová, 2015), does not eliminate nitrogen (Vymazal, 2007) or remove TDS
(Calheiros et al., 2012).
Filtration
Ballantine and Tanner (2010) suggested a filtration method to treat agriculture
runoff, by adding natural tree bark which has the potential to act as a filter
material in CWs, and enhance their ability to remove NG contaminants before
returning water to the rivers (Ballantine and Tanner, 2010). Even though tree
bark has an adsorption capability for many nutrients, e.g. total phosphorus, it
has low capture efficiency for cations such as NH+4 (Bolan et al., 2004).
Aeration
Aeration can also be used for reducing contaminants in farming water. Bolan
et al. (2004) showed that during an intermittent aeration technique,
denitrification may occur while aeration is suspended, eventually transferring
nutrients from agricultural runoff to gaseous nitric oxide (NO) and nitrous
oxide (N2O) which in turn emits volatiles to the atmosphere, thus changing the
problem from water to air pollution (Greenhouse effects).
Biochar
This research project proposes the use of biochar (BC) to treat agricultural
runoff. Natural BC, which is considered an environmentally friendliness and
low-cost material, has the capability to capture contaminants from agricultural
runoff to prevent downstream river pollution, reduce greenhouse gases, hold
nutrients in the soil and keep carbon in a stable form for a long time. The project
also will investigate suitable methods for the potential reuse of captured
nutrients, e.g. by using granular BC as a fertilizer. Although the use of BC as
an agricultural runoff amendment is reviewed by Macdonald et al. (2015) and
others, there are limited studies using BC with capacitive deionisation (CDI)
which may enable the BC filter to capture more nutrients, at the same time
allowing regeneration of filters by reversing the supply voltage or degauss
techniques.

Introduction and Aims Chapter 1
3
1.3 Research questions
The essential question in this research is: Can a BC filter product made from
simple materials effectively absorb nutrients by using the CDI technique?
This question begs more questions which are:
How do the surface area and porosity size affect the adsorption efficiency
when using different feedstock and processes to produce BC?
How do different feedstock impact on the adsorption/ absorption ability by
changing chemical and physical properties such as porosity?
What is the impact of the applying DC voltage as a driving force in CDI
using BC?
1.4 Aim and objectives
The overall aim of this study is to investigate the ability of macadamia biochar
(MBC) as a low-cost sorbent to minimize and capture nitrate before and after
applying the CDI method. The main objectives are:
To study the capability of MBC’s adsorption as filter material in batch and
column experiments focusing on nitrate ions
To evaluate the efficiency of nitrate recovery methods to reuse as a soil
amendment
To investigate the performances of using an electrical technique CDI to
enhance the electronegativity to attract the ions to the BC’s surface
To investigate the capability of filter regeneration with different methods
such as degaussing with CDI electrodes and back flushing the system or
using the deionised and tap water.
1.5 The scope of the study
This thesis focuses on investigating the characteristics and efficiency of BC to
remove contaminants from agricultural run-off before allowing nutrients to
enter the river system. The scope of the study includes the following:
Macadamia nut shells will be used as a biomass source to prepare BC

Introduction and Aims Chapter 1
4
Synthetic water with the known contaminant and respective
concentrations will be used to identify the absorption capability
CDI method will be applied to enhance the absorption capability of the
MBC by attracting anions and cations including NG
Regeneration the filters and nitrate recovery by using the degauss
technique and backflushing with a small amount of deionised water
(DI.W)
1.6 Outline of the thesis
This thesis is laid out in five chapters:
Chapter1 gives the background of this study along with the objectives, and
the scope of this study.
Chapter 2 gives an overview of the nitrate removal technologies and the
reported removal controlling techniques in the literature. Extensive details
about the mechanisms of the available techniques for removing nitrate
including the advantages and disadvantages of each technique.
Chapter 3 introduces and discusses the material characterisation and
preliminary experiment for nitrate removal using waste biomass to produce
biochar and then use it in batch and column experiments to find an optimum
removal condition.
Chapter 4 demonstrates the use of an old technique, capacitive deionisation
(CDI), side by side with biochar to promote removal efficiency and
simultaneously regenerate the filter and recover the nitrate.
Chapter 6 presents the conclusions and recommendations for future work.

Literature Review Chapter 2
5
CHAPTER 2
Literature review
2.1 The aim of this chapter
Demand for fresh water is increasing due to population growth, but the amount of fresh
water is limited and aggravated by contamination from different sources such as
factories discharge and agricultural run-off. The aim of this chapter is to critically
review the available techniques for treating agriculture run-off focusing on nutrients
removal. The mechanisms, nutrients removal levels, advantages and disadvantages,
energy requirements and cost demands of these techniques are critically reviewed.
Further, this chapter will explore different techniques to remove contaminants from
the agricultural runoff such as constructed wetlands, filtration, aeration, algae and
woodchips. Biochar (BC) is one of the low-cost sorbents can absorb nutrient due to
multi-function capability. Agricultural runoff’s contaminants either dissolved or
suspended solids are the basis of nitrogen, i.e. ammonia and ammonium compounds
that are obtained primarily from fertilisers such as urea. Hence, this study will focus
on nitrate contaminant.
This literature will compare the natural abilities of BCs sourced from a range of natural
biomass sources such as Macadamia nut shells with other techniques regarding
agricultural runoff focussing on nitrate removal.
2.2 Introduction
Water is essential for living creatures because it dissolves nutrients and facilitates their
mobility in their bodies. Overall accessible fresh-water (rivers and lakes) around the
world is just about 0.26% of the total water body which is about 71% of the total earth’s
surface (USGS, 2016). Half of this water is at risk of becoming saline partially because
of untreated runoff from factories and agricultural irrigation processes entering into
river systems (Navarro-Ortega et al., 2015).
Irrigation processes for agriculture purpose are increasingly recognized as a serious
worldwide public health concern (Mateo-Sagasta et al., 2017). An agriculture runoff
is responsible for a large-scale water quality degradation, because of the seepage

Literature Review Chapter 2
6
occurring after the irrigation process carrying some fertilisers and pesticides residue.
A salt such as NaCl and NG such as NH+4 and NO-
3 contaminating water resources is
the primary cause of these resources becoming unsuitable for human consumption and
agricultural purposes (Bouraoui and Grizzetti, 2014). In addition, the high levels of
some nutrients in agricultural runoff such as phosphorus (P) along with nitrogen can
cause eutrophication which may increase growing algae bloom and cyanobacteria due
to the increase in nutrients concentration (Water_Online, 2017). For example,
sugarcane production in Australia requires around 200 kg per ha of urea-based
fertiliser. Typically, more than 50% of this is lost during the irrigation process.
Bouraoui, (2014) argued that these nutrients eventually find their way into rivers and
other surface water sources. Another example is Iraq, which is considered an
agricultural country, most of the irrigation systems rely on gravity or pumping of
surface water from the Tigris or the Euphrates for irrigation. This approach causes high
water losses and allows the additional water to infiltrate slowly through the soil layers
and leach nutrients into nearby river systems. To enhance the productivity of any land,
farmers invariable use fertilisers containing nitrogen, phosphorus and potassium and
pesticide that can wash into river system due to ineffective irrigation process, which
can exceed plants need or during heavy rain. This overridden water can cause growing
algae blooms, bad odour and may have a negative impact on aquatic life due to reduce
oxygen from the water (U.S_EPA, 2005). Also, the U.S. Environmental Protection
Agency (2005) reported that the high nitrate concentration might be a reason for many
infant deaths by methemoglobinemia which is considered a danger disease (blue baby
syndrome).
Nitrate was chosen to be investigated in this project due to it is available in the soil as
a sort of fertiliser to enhance productivity. However, it can cause a problem if the
concentration exceeds the acceptable limits in the water system after a runoff. Also,
can lose some of this fertiliser (cost money) carrying by the agricultural runoff. Nitrate
is considered as the main source of contaminant present in the agricultural runoff (Poe
et al., 2003).
There are many applicable methods for treating agricultural runoff water. One
approach is a biological method known as Constructed Wetlands (CWs). CWs can be
used to reduce pesticide and fertiliser residues as well as the salinity effects from
agricultural runoff. Some researchers add a filtration system to the CWs by adding

Literature Review Chapter 2
7
porous materials to promote NG removal from agricultural runoff (Ballantine and
Tanner, 2010). Aeration can also be used for improving the treatment of farming water.
Aeration pond is the common form of aeration treatment for agriculture runoff.
Standard multi-media filter system (sand, anthracite and gravel or sand) is another
method for removing pollutants from agriculture runoff (Samuel et al., 2014). Previous
approaches can remove sediments materials, salinity, phosphorus and some other
nutrients, while found to be inadequate for NG removal. From the above, finding an
alternative technique with cost-effect materials are very important at this stage.
Biochar (BC) can be a suitable solution for agricultural runoff remediation as a low-
cost sorbent with several functionalities.
This study aims to critically review the existing techniques for agriculture runoff
treatment with a focus on removal of nitrogen (N) compounds especially nitrate (NO-
3) due to its abundance in agriculture runoff owning to its frequent use as a nutrient in
agricultural activities (Oakes et al., 2000). The study will analyse the feasibility of
these techniques taking into consideration contaminants removal level, cost,
maintenance and other factors.

Literature Review Chapter 2
8
2.3 Common techniques for nutrients removal
Constructed Wetlands (CWs)
CWs are artificial wetlands designed to simulate a natural wetland and facilitate
pesticide removal. They are also referred to as human-made, engineered or artificial
wetlands. CWs are considered to be a biological method that can be used to reduce
pesticide and fertiliser residue as well as salts and NG from agricultural runoff.
Recently, some studies have investigated the capability of CWs to remove some
nutrient and pollutant species carried by agricultural runoff before returning it to water
systems such as rivers and lakes (Haverstock et al., 2017). Natural wetlands have been
used as wastewater treatment since the beginning of sewage collection. After finding
their ability to treat water in the early 1950s, the idea of designing a constructed
wetland was born. Kadlec and Wallace started applying engineering analysis to
wetland processes in the early 1970s to manage wetlands for water quality
improvement (Kadlec and Wallace, 2008). Since wetlands have a high capability to
retain some materials (Vymazal, 2010), constructed wetlands are expected to reduce
the concentration of pesticides in agricultural runoff by acting as buffer strips between
agrarian areas and the receiving surface waters.
Many developed and developing countries such as the United States of America,
Australia, United Kingdom, Egypt and Zambia have started to use this method,
especially for flat land mitigation of surface runoff (Vymazal, 2013a). It is an efficient
method for removing pesticides such as organochlorines but, it cannot be applied to
eliminate the urea group (e.g. NH+4), CO-
3 (Vymazal and Březinová, 2015), total
nitrogen (TN) (Vymazal, 2007) or TDS (Calheiros et al., 2012).
CWs are highly efficient in removing pesticides from agricultural runoff. Vymazal
(2015) found different mechanisms to remove pesticides by using CWs. Examples of
these are physical treatment (sedimentation, absorption and precipitation), chemical
treatment (oxidation and cation exchange), biological (plant absorption) and
biochemical processes (microbial degradation). Vymazal (2015) stated that there is no
clear study that can prove, which mechanism is the best for removing pesticide as
mechanisms rely on the local conditions. A previous study examined how the
availability of vegetation and medium type can affect CWs’ removal capability

Literature Review Chapter 2
9
through the use of gravel-beds and sand-beds with and without vegetation. It was found
that the CW technique, using high porosity for gravel-beds encouraged nitrification
and denitrification processes which improved NH+4 and NO-
3 respectively. At the same
time, plant uptake increased NO-3 removal more than unplanted beds managed to do
(Yang et al., 2001). Although root zone may affect both beds’ (gravel and sand)
capability, vegetation may facilitate nitrification and denitrification in gravel-beds
only. Also, contact time between plants and agricultural runoff during drainage inflows
to the wetland, may effect on the removal efficiency of N and P in CWs (Tanner et al.,
2005).
CWs were used for more than six decades to remove different kinds of contaminants
from wastewater and agricultural runoff, and how they were used dependedon the
macrophytes grown and the direction of the flow (Vymazal, 2010). Vymazal (2007)
reported that there are four types of CWs: free-floating plants, floating plants’ leaves,
submerged plants and emergent plants which are also divided into two types: the free
water surface and sub-surface flow. The sub-surface flow separated into a vertical and
horizontal flow. The hybrid CW system is a combination of two sorts of CWs; vertical
flow (VF) followed by horizontal flow to obtain better total nitrogen removal or to
remove the more complex contaminants in the agricultural runoff and industrial
wastewater. Hybrid CWs are mostly used in Europe and Asia (Vymazal, 2013b).
Vymazal (2013) reported that in the early 1960s hybrid systems started with multi-
stages of VF followed by multi-stages of HF, while in late 1990s, the hybrid systems
consisting of HF-VF or HF-VF emerged. Simulating an aerobic as a vertical flow stage
and an anaerobic as a horizontal flow stage may affect nutrient removal efficiency in
different seasons due to microbial nitrification (a temperature sensitive-denitrification
process) (Zhai et al., 2016, Wang and Li, 2015).
Figure 2-1 shows the most common CW configurations. Free-floating plant (FFP)
CWs depend on the plant uptake mechanism to remove nutrients. The mechanism for
removing TN and P for CWs with free water surface and with emergent vegetation
(FWS) is volatilization and denitrification, while in CWs with horizontal sub-surface
flows (HSSF) it is denitrification. CWs with vertical sub-surface flows (VSSF) is
another mechanism for removing nutrients and has a capability for oxidating ammonia
nitrogen to nitrate than HSSF.

Literature Review Chapter 2
10
The use of CWs for nutrient removal has it is advantages and disadvantages. CWs are
designed to simulate natural wetlands (Kröpfelová, 2008), and are considered to be
green treatment for nutrient removal from agricultural runoff (Saeed and Sun, 2012).
CWs have a high capability to remove pesticides from non-point pollution (agricultural
runoff). Vymazal and březinová (2015) reported that pesticide removal varies
depending on the type of pesticide itself, and the process to mitigate. However, CWs
FFP
FWS
HSSF
VSSF
Figure 2-1: Constructed wetland basic types based on (Vymazal, 2007), 1. distribution
zone filled with large stones; 2.impermeable liner; 3. filtration medium (gravel, crushed
rock); 4. vegetation; 5. water level in the bed; 6. collection zone filled with large stones; 7.
collection drainage pipe; 8. outlet structure for maintaining of water level in the bed. The
arrows indicate only a general flow pattern (Vymazal, 2001).

Literature Review Chapter 2
11
cannot entirely remove NG from agricultural runoff, but convert them into various N
forms. Farmers would not prefer to use CWs to treat agriculture run-off because of the
high maintenance, large land requirements and high installation cost (Reichenberger
et al., 2007). Each type of CW has its benefits and drawbacks. For example, vertical
flow (VF) CWs occupy a small area and have high nitrification, simple hydraulics and
can quickly remove ammonia-N. However, VF has some drawbacks such as short flow
distance, no denitrification, sophisticated technology requirements and ineffective P
removal. In comparison, HF CWs have a long flow distance, high denitrification and
nitrification, can remove N and P, but have some disadvantages such as large area
requirements, low P removal, limited ammonium oxidation, and complicated for
regular flow supply (clogging problems) (Luederitz et al., 2001).
Vymazal (2007) stated that some factors might have an impact on the capability of
CWs to remove some nutrients such ammonia. Nutrients removal increasing with
increased the initial concentration. Temperature is another factor that may affect
nutrient removal by CWs. For example, 20-30°C is the most effective temperature
range for the removal of biological nitrogen, due to the higher microbial activity and
oxygen diffusion rates in this range compared to lower temperatures. Hydraulic
residence time (HRT) has an effect on the removal of nutrients in CWs (Huang et al.,
2000). Increasing HRT impacts on ammonium and total Kjeldahl nitrogen (TKN)
removal positively, while there is no difference for NO-3 removal. Ballantine and
Tanner (2010) found that the increase in phosphate removal results from a decrease in
pH and an increase in ionic strength (Liu et al., 2008).
Overall, CWs have a high ability to remove pesticides, biological oxygen demand
(BOD) and chemical oxygen demand (COD), but are inefficient in removing N and P
nutrients. The contaminant removal efficiency of CWs relies on influent rate, contact
time and pasture intensity. Tanner (2005) identified that the removal rate for TN varied
between 250-840 g.m-2 per year, and the total phosphorus (TP) removal rate was in the
range of 45-75 g.m-2. y-1. Furthermore, the results of a two months study on hybrid
CWs, showed removal rates of 2 g.m-2.day-1 and 1 g.m-2.day-1 for TN and TP
respectively (Zhai et al., 2016).
Few researchers have addressed the cost-effectiveness of CWs. Luederitz (2001)
investigated the effect of construction materials and maintenance costs on the

Literature Review Chapter 2
12
feasibility of implementing CWs for sewage treatment. The technique for water
treatment requires a large number of materials for wetland construction which will
increases the implementation’s total cost. High additional costs are subsequently
incurred through vegetation management. However, CWs are regarded as energy-
efficient compared to other treatment methods, such as conventional treatment systems
(wastewater treatment plant (WWTP)), so the ongoing economics can overcome the
construction cost within a short period after operation begins.
Land cost is another factor that can affect the implementation of CWs (Zadeh et al.,
2013). Haverstock et al (2017) stated that CWs are considered to be ecologically and
economically viable for rural areas seeking to reduce NO-3 from agricultural runoff
and convert it to various N forms, especially with long residence time which reduces
the capital and operating cost compared to a multitude of small wetlands (Tanner and
Kadlec, 2013). However, the major drawback of CWs is the higher area demand which
may, for large CWs (more than 100ha), cost about $12,174.0 AUD/ha and for a smaller
size will cost around $60,870.0 AUD/ha (O'Geen et al., 2010, Tanner and Kadlec,
2013). Maintenance such as dredging, due to sediment accumulation, will be required
after start-up. This is likely to be necessary once or twice a year and may cost around
$102.26 AUD/ha/year. Dredging is also energy insensitive; around 18,734 ×103 J (Ko
et al., 2004). The expected lifetime of the traditional CW is around 25 years with
refurbishment every 8-15 years due to the clogging of the media (Butterworth et al.,
2013). As a pre-emptive, regeneration of CWs by changing the fouled gravel and
cleaning the media before the system clogs is also necessary. In 2009, renewing a CW
system of 300 m2 cost around $92,00000 AUD (Knowles, 2012).

Literature Review Chapter 2
13
Filtration
Filtration is a process for removing solid objects or contaminants from fluids through
either mechanical, chemical or biological effects by preventing the objects from
passing through the filter’s structure, such as sand or screens (United States
Environmental Protection Agency, 2010). The first water filtration treatment attempt
dates back to 4000 BC in Ancient Greek. This method focused on turbidity removal
and used water taste as a measure for water quality. The technique went through many
improvements over time until the mid-1800s when scientists introduced sand filtration
that was used in Europe to remove invisible contaminants (United States
Environmental Protection Agency, 2000). In the early 1900s, sand filters were found
to be effective for reducing turbidity, but had little effects on microbes, so chlorine
was used in the United States of America and ozone in Europe, to minimise the
waterborne disease outbreaks. Agricultural runoff experiences similar developments
in treatment, and these began around 500 BC. Hippocrates invented the first bag filter
to prevent sediments from moving through water and causing bad smells and tastes.
The United States’ EPA (2000) showed that treatment gradually improved in the early
1800s and scientists started to use sand as a filter to reduce the salt (which negatively
affects crop productivity) in irrigation water.
In the early 1900s, the ion-exchange technique came into existence improving the
efficiency of filtration methods in removing salinity and other contaminants. It is the
process of replacing the anion from agriculture runoff such as replacing P- with any
anion such as Cl- (Le, 2017, WARD and Monday, 2007).
There is a debate about the capability of CWs to remove nutrient from agricultural
runoff. Some scientists have add porous materials as a filter to CWs. These materials
include tree bark (Pinus radiate) and zeolite to promote adsorption (Bolan et al., 2004).
Zeolite (alumina-silicate) can capture nutrients in its pore structure or by attracting
cations (NH+4, K+) which happens to these elements naturally. Bolan (2004) also
reported that bark treatment achieved the removal of P, N, K and totally suspended
solids through their porosity, and NO-3−N through denitrification. The advantages of
bark filters are its after-use as a soil amendment and the practicality of building up
such filters for pollutants’ removal from industries and wastewater effluent. Figure 2-
2 shows the cross-section in CWs with a filtration bed made from tree bark and the

Literature Review Chapter 2
14
steps taken by the water, from the inflow through each towards the outflow as treated
water.
Some filtration techniques have the benefit of being an inexpensive due to the
availability of the raw materials such as sand, tree bark and limestone, is their lack of
toxicity and their high P removal. However, as Ballantine and Tanner (2010) stated,
these filtration techniques have some serious drawbacks: they also lack the ability to
remove dissolved fluids, experience quick saturation have a high replacement cost,
require maintenance and are inefficient in removing NG.
pH can have an extreme effect on the ecosystem (High or low pH solution releasing to
the drainage into water system) filter material during treatment process (Allred, 2017).
This will affect the product or by-product filter material will be chosen for any water
treatment plant. A recent study by Allerd (2017) involved 50ppm nitrate-nitrogen (NO-
3-N) and 0.25 ppm phosphate-phosphorus (PO3-4-P) with different filter material. The
average removal at pH 7.38 was found to be around 50% and 75% respectively, And
the reduction in the temperature reduced the biological processing of nitrogen through
(Hatt et al., 2009).
Figure 2-2: Constructed wetland with filtration bed (Browning et al., 2014)

Literature Review Chapter 2
15
Column lifetime relies on parameters such as filter materials, flow rate and type of
contaminants in the solution (Färm, 2002b). For example, natural Opoka as a filter
material (to remove heavy metal from runoff) clogs after receiving 461 litres of
solution (Cd, Cr and Cu), while burned Opoka, as a filtration material, clogs after 260
litres of solution. Cleaning approaches renew the filter by reversing the filtered water
flow from the bottom to the top of the filter to refresh and reuse it for the second time
(Clark et al., 2012, Astrom, 1999).
Using different filtration materials can remove different nutrients. For example, tree
bark can effectively remove P, but it has low performance for nitrate removal. The
capability to transfer nutrients can change with change to the filtration materials used.
A sand filter bed combined with CW can remove around 37.70% of NO-3 –N, 55.14%
of Ns O-2 –N, 49.37% of NH+
4–N and 54.74% of TN from effluent through the
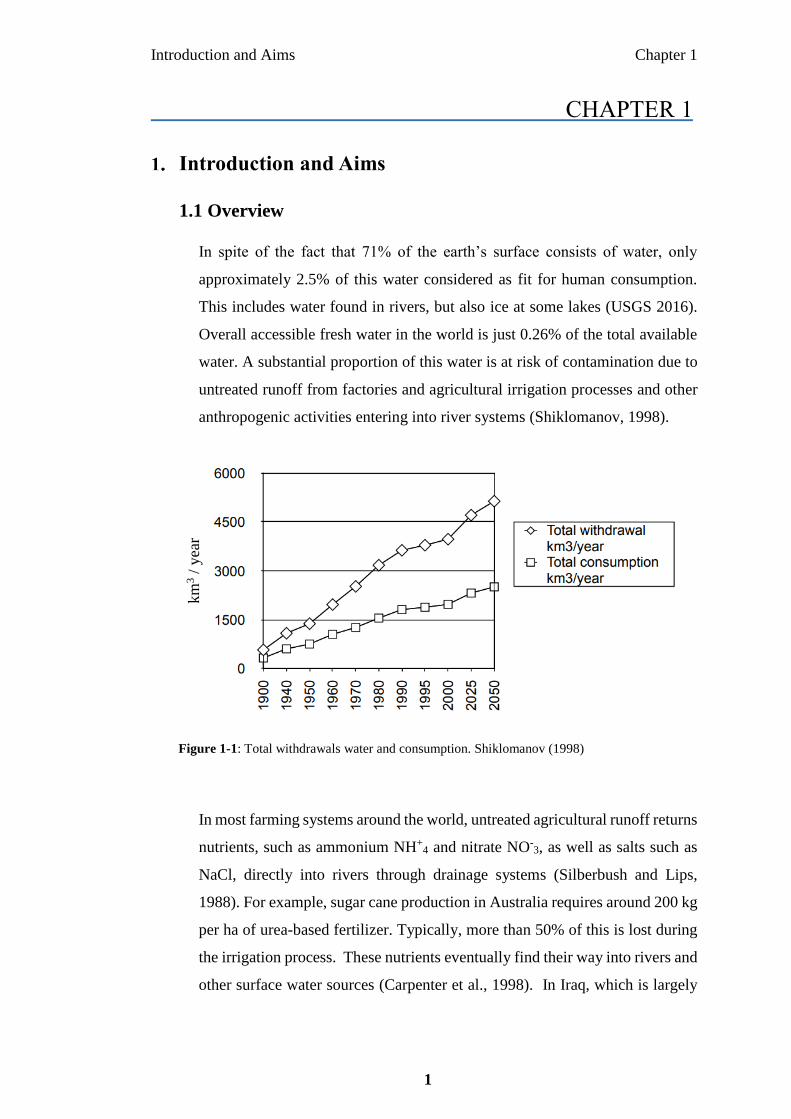
nitrification and denitrification processes (Xiong et al., 2011). Table 2-1 shows the
common types of filtration materials used to remove various solids and organic and
inorganic contaminants from agriculture runoff. Based on the table, pine bark seems
to be the best for P removal 98%, while limestone is the best for nitrate removal at
70%.
Literature Review Chapter 2
16
Table 2-1: Filter materials and percentage of mineral removal
Author Filtration
type
Percentage of the removal %
TN Heavy Metal P NH+4 NO-
3 TSS
(Shilton et al., 2005, Ugurlu
and Ozturkcu, 2018)
Limestone - - 64 - 74 -
(Davis et al., 2001) Sandy loam 65-75 92 80 60-80 <10 -
Bolan, (2004) Pine bark 35 - 98 64 - 72
(Fletcher and Deletic, 2007) Bio-filters 70 96 80 - - -
(Strategy, 2014),
(Healy et al., 2007)
Sand 61 - - - - 80
(Nick, 2018) Compost - 74 59-65 <20 <20 99

Literature Review Chapter 2
17
Bolan et al. (2004) used a survey to assess the various costs of filtration methods and
found that the greatest proportion of the cost comes from the replacement of filtration
materials (tree bark) in the farm scale after saturation. This means that installation of
the filtration material and maintenance of the filters are the most costly portions of this
method, while the feedstock is comparatively inexpensive. At the same time, a
saturated porous material with nutrients can be separated and reused on the farm as a
soil amendment for slow releasing of nutrients.
Le (2017) stated that using activated carbon (AC) as a filtration material to adsorb
contaminants increases the cost of the filter system. Sand filtration requires 8
cents/kWh to operate an entire filtration facility with electricity using Environmental
Protection Agency (EPA) calculations as a guide (Ko et al., 2004). For a sand filtration
facility with a capacity of 3785 m3/day, the total capital cost is $2.3 Million AUD. This
cost consists of land, equipment, tank installation and construction, but not the periodic
annual maintenance cost ($146,230.0 AUD). In terms of energy consumption, Ko et
al. (2004) indicated that 2.1 TJ was required to operate and maintain the sand filtration
facility for one year. While the embodied energy consumption of one year’s operation
of a biological filter plant with a treatment capacity of 200 m3/day, is around 159.4 GJ
(Shao et al., 2013). Membrane bioreactor (MBR) is another sort of filtration
technology and has two types of submerged and side-stream MBR (Howell et al.,
2004). Submerged MBRs are more popular than side-stream, because they require a
low energy consumption rate of 0.2-0.4 kWh/m3. Furthermore, the operating cost of
the MBR technique with AC is $2.15 AUD per 1000 gallons treated solution
(Conservation, 2007).

Literature Review Chapter 2
18
Aeration
Another method for treating agriculture runoff is aeration which was applied in
conjunction with CW to enhance the ability of the latter to remove contaminants from
runoff (Uggetti et al., 2016). Aeration is a process in which air is fed into the water in
the form of bubbles to remove dissolved gasses or oxidise dissolved metals and organic
matter (Boyle, 2002). Aeration was first used in 1882 in England with perforated tubes
and pipes, and was then developed gradually by Arden and Lockett during 1914 to
cover critical factors such as bubble size, placement of air flow, gas flow rate and
surface contact between air and water that could influence aeration efficiency (Martin,
1927). It has been implemented in most countries around the world such as the United
States of America, New Zealand, Spain, United Kingdom, Canada, Australia and
China.
Aeration can be used to remove some nutrients from water through nitrification. For
example, applying aeration to a hydroponic bed with a diffusor at the bottom of the
bed can minimize N2O emissions by around 50%, while reducing TN by 24.1% and
having no change to NO-3−N concentration (Zou et al., 2017). The oxidation efficiency
of NH+4 in aerated CWs relies on the concentration of dissolved oxygen applied to the
bottom of the soil surface in CW. Figure 2-3 shows the two commonly used types of
aeration configurations i) continuous and ii) intermittent. Uggetti et al. (2016)
identified that, in the intermittent configuration, flow is typically set at a minimum
limit of oxygen concentration so it can be controlled when the oxygen level drops
below the required level, while the continuous relies on providing oxygen 24h through
a specific compressor. The intermittent configuration reduces the cost of the aeration
process, while with continuous configuration, the oxygen level may exceed the limit
needed (Labella et al., 2015).

Literature Review Chapter 2
19
Although aeration system can efficiently remove suspended solids and carbon from
farm effluents (Bolan et al., 2004), it is inefficient for nutrient (N, P and K) removal.
The reduction of nitrate achieved through the intermittent aeration process may lead
to the volatilization of ammonia to the atmosphere due to physical agitation and the
nitrification activity (Jamieson et al., 2003, Chance and White, 2018). Denitrification
can occur during an intermittent aeration technique. While aeration is suspended, it
eventually transfers nutrients from agricultural runoff to gaseous nitric oxide (NO) and
nitrous oxide (N2O) which, in turn, volatiles to the atmosphere. Therefore, the
technology merely changes the problem from water pollution to air pollution
(Greenhouse effects) (Haustein, 2014, Tallec et al., 2008). Other contaminants such as
carbon are oxidised to carbon dioxide, then released into the atmosphere causing
greenhouse gases (GHG). This technique is also high cost due to installation, pumping,
and maintenance. It may also cause the loss of soil nutrients (Ouellet-Plamondon et
al., 2006, Wu et al., 2014).
Aeration can remove some ions, such as iron and manganese, through oxidation
(aeration) or by adding some chemical oxidants (e.g. chlorine) which are then filtered
Figure 2-3: Aeration types based on Uggetti et al. (2016)

Literature Review Chapter 2
20
through adsorptive media (Blanchfield, 2011). Ouellet-Plamondon et al. (2006) stated
that this method has a capability to remove 95% of Total Suspended Solids (TSS)
during any season in planted and unplanted units, while COD removal in Winter for
non-aerated mesocosms are less than Summer for both plant and unplanted units. In
terms of Total Kjeldahl Nitrogen (TKN), which is the sum of NH3 and Organic
Nitrogen, artificial aeration can improve the removal for unplanted more than planted
units in Summer and Winter. Even though removal by aeration for the unplanted unit
is higher than the planted unit, additional aeration did not replace the absence of the
plants. Intermittent aeration improves the removal efficiency of ammonium-nitrogen
(NH+4−N) and organic pollutants and, at the same time increases TN removal through
aerobic and anaerobic actions (Wu et al., 2015). Furthermore, this technique has a high
percentage removal such as 96% of organic pollutants, 98% of NH+4−N and 85% of
TN at any influent rate.
Uggetti et al. (2016) measured both components of the aeration methods (full and
intermittent) and found that the intermittent type is more reliable and cost-effective
than the continuous type. Comparing energy consumption between full and
intermittent, intermittent was found to reduce power usage by seventy-fold for the
same compressor power. Intermittent consumes less energy, has lower operating costs,
use less time and maintenance, and produces higher efficiency in ammonium, TN and
organic matter (chemical oxygen demand (COD)) reduction due to its ability to create
suitable conditions for nitrification and denitrification (Zhou et al., 2018). Uggetti et
al. (2016) calculated that the energy consumption for 24h continuous aeration with a
1.5 kWh compressor is 13.6 kWh/m2.d, while the intermittent aeration required 8
pulses per day, which means 20 minutes of aeration per day, and the power usage is
0.18 kWh/m2.d. Removal efficiency increases with increasing temperature because it
may enhance the dissolved organic matter removal measured by COD and DOC from
2 to 13% (Labella et al., 2015). Nitrogen and phosphorous removal is affected by a
positive relationship with increasing temperature due to microbial reactions such as
nitrification, denitrification and organic matter decomposition which respond
positively to higher temperatures, while TKN removal is slightly increased at a low
temperature and NH+4 removal is practically constant (Stefanakis and Tsihrintzis,
2012). The pH values slightly change in the artificial aeration bed regardless of the

Literature Review Chapter 2
21
existence of plants and the season, while they may change dramatically in non-
artificial beds (Zhang et al., 2010).
An aerobic bio-filter’s expected working lifetime is five years before renewal for
phosphorus removal (Heistad et al., 2006). Daily inspection and maintenance is
required to prevent any clogging of the aerated pond’s the diffused air system (blower
and pipeline) which provides air to the bottom of the pond (U.S.EPAgency, 2011).
Other techniques (Algae and Woodchips)
Algae can be used to treat agricultural runoff, agro-industrial waste and human
wastewater. Algae are a diverse and complex group of photosynthetic organisms, like
Chlorella and (Lee, 2008). Abdel-Raouf et al. (2012) stated that using algae as a water
treatment method started 75 years ago, especially in developed countries such as
Australia and the USA. Algae grows rapidly, with the availability of sunlight and
water, can convert CO2 lipids through photosynthesis. Through the same process, algae
convert nutrients such as N and P (available in farm water) to a complex organic
structure (Lannan, 2011). Abdel-Raouf et al. (2012) consider algae an efficient means
of removing N and P within one hour because they have the capability to use N and P
to grow and remove toxic organic components as well as heavy metals so these cannot
create secondary pollution. Figure 2-4 demonstrates the dense algal bloom growth
along the shallow shoreline under the correct conditions of sunlight, excess runoff
caused by rainfall, runoff in which industrial and urban waste can wash some nutrients
from fertilizers (N, P, K) into water system (Roberts, 2008). In January 2019, the mass
mortality of cultured fish in the Lower Darling River in NSW in Australia was caused
by natural events. High temperatures can reduce dissolved oxygen levels, especially
in summer, along with some algae and acidic runoff leading to fish death events
(MDBA 2019).

Literature Review Chapter 2
22
Hence, some studies propose the use of a paddle wheel (raceway ponds) in the closed
loop raceway channel to help keep the water moving all the time and prevent
sedimentation, as illustrated in Figure 2-5 A and B (Chisti 2007; MOANA 2016).
Figure 2-4: Algal blooms pond (Roberts, 2008)

Literature Review Chapter 2
23
(A) (B)
The benefits of using algae to treat water contamination is their rapid growth and high
nutrient removal within a short period. Some researchers at the Rochester Institute of
Technology named the algae treatment process as double green because it removes
NO3, PO4, and some toxic substances from water and, at the same time, the grown
algae can be used to produce biofuel (Gawlowicz, 2011). However, Abdel-Raouf et al.
(2012) highlighted some drawbacks of using algae for treating agricultural runoff such
as the dependence of the treatment on the type of nutrients, operating cost and bacterial
decomposition of dead algae. The bacteria use oxygen for decomposing dead algae
and release toxic and odorous compounds (Srivastava et al., 2013).
Algae can treat agricultural runoff from toxic minerals such as lead, arsenic, cadmium,
and it is also capable of removing BOD and COD, some nutrients (e.g. N, P) and
heavy metals (Kumar and Gaur, 2011). Lannan (2011) reported the removal of nitrate
by 71.4%, ammonia by 81.3% and phosphate by 82.6% within three days of algae
growth.
Figure 2-5: (A) Raceway of algae pond grown area based on (Chisti 2007). (B) Paddlewheel within
the flow-way (MOANA 2016)

Literature Review Chapter 2
24
The availability and quick growth of algae make this method attractive for treating
agricultural runoff. However, the high cost associated with removing algae using
screening/filtration and pumping are serious concerns to be considered (Rickert and
McShane, 2015). The capital cost of a station including earthworks for pond
construction, paddlewheel mixing and pH controlled CO2 addition, is $ 17.03 AUD
/m2 (Craggs et al., 2012).
Some factors affect nutrient removal, such as a higher initial algae density expected
for a better removal rate. Abdel-Raouf et al. (2012) conducted a study that may lead
to self-shading and minimising photosynthetic efficiency. The US EPAgency (2011)
reported that the most effective and active algae for water treatment grows in water
between 30-35oC. Craggs et al. (2012) showed that reducing pH to the level of less
than 8.5 by adding CO2 to wastewater treatment, may boost nutrient removal through
increased algal production. Algae may affected by light and dark photoperiods which
are required for maintenance because some of them might die with a long light period
(Andersen, 2005). Unsuitable light: the dark system may impact negatively on the
algae’s growth. For example, most algae required 12:12 to 16:8 hours light: dark per
day to stay active. Harvesting is the most important part of maintenance; recovering
the small cell sized algae (0.2-30 µm), may cost consume 20-30% of the total biomass
production costs (Christenson and Sims, 2011).
Another technique for treating agriculture runoff is solid materials such as woodchip
(Christianson, 2016). Woodchip is considered a relatively new method for removing
NO-3 -N from agricultural runoff as it was implemented not more than 20 years ago.
The technique is still under testing, so there is no proof that the method has the
capability of working under different circumstances for a long time with the same
efficiency as other methods (Hoover et al., 2016, von Ahnen et al., 2016). This process
is applied by filling a large groove between the farm and the drainage tail with
woodchip and running the water through the gutter. This method has been
implemented in some European countries, the USA and New Zealand.

Literature Review Chapter 2
25
Figure 2-6 A shows a conventional and controlled drainage with wood chips structure
to control the farm flow before the disposal of the water back to the river system in a
schematic. Figure 2-6 B illustrates a real farm field and how to prepare the woodchips
layer to treat farm water before discharging to the river system.
(A) (B)
This method has some benefits such as low-cost of active materials due to the
abundance of woodchip, high carbon-nitrogen ratio, high sturdiness, and simplicity of
operation and maintenance (Lopez-Ponnada et al., 2017, Meffe et al., 2016). The
position of woodchip bioreactors at the edge of the farm is another advantage of this
method as it takes less area from the farm and doesn’t affect the yield (Christianson
and Helmers, 2011). However, Christianson and Helmers (2011) highlighted some
drawbacks to using woodchip reactors to treat agricultural runoff such as colouring the
treated water due to the leach of organic materials from the wood (Rambags et al.,
2016). There is also the risk of producing toxic organic-heavy metal complexes such
as methylmercury or odorous gases such as hydrogen sulphide gas. Another
disadvantage of the woodchip method is the production of GHG such as nitrous oxide
from the denitrification process. These negative effects might be alleviated through
flow monitoring and on-line measurements of C and N concentration in the water, but
this may make the method a costly option for treating agricultural runoff.
Figure 2-6: (A) Schematic of wood chips bioreactor (Van Driel et al., 2006). (B) Wood chips bioreactor
in field scale based on Christianson (2016)

Literature Review Chapter 2
26
The woodchip method could also remove nitrate and phosphorous and some microbes
and viruses from farm flow runoff (Rambags et al., 2016). Nitrate is removed by the
woodchip bioreactor through denitrification (Moorman et al., 2010, Robertson, 2010).
The average nitrate removal rate using woodchip was reported to be around 18.9
g/m3/d1 and it decreases with increasing effluent, while P removal is much less at about
0.89 g/m3/d (Hua et al., 2016).
It is considered an economical way to remove nitrate and other contaminants from
agricultural runoff, due to the availability of active materials. However, this relies on
the type of active elements. For example, Wildwood media has a long working life of
around seven years with around 40% effects (Robertson, 2010), while wheat straw has
only a half-year working life (Saliling et al., 2007). A study done for six bioreactors at
Iowa University (in the USA) reported that the total installation cost for each
bioreactor is between $5,345.0 AUD and $14,390.0 AUD, including the structure,
contractor, woodchips and supplies (Christianson, 2011). The cost range for each
hectare is $240.0 AUD/ha to $715.00 AUD/ha and, in terms of the efficiency of N
removal, the range is between $1.1 AUD/kg N to $5.75 AUD/kg N removal. Lopez-
Ponnada et al. (2017) stated that nitrification can be affected by low temperatures and
low alkaline levels that will impact TN removal and NH+4. Christianson (2011)
reported that there is annual maintenance for the bioreactor and the control structures
which must be replaced every eight years. For example, a bioreactor with 13m L ×
1.2m W × 1.1m D is able to remove 11.3 kg N yearly from agricultural run-off. This
denitrification bioreactor system can continue for 15 years, but there is no clear study
regarding the long life of NO-3 removal (Schipper et al., 2010).

Literature Review Chapter 2
27
Biochar (BC) filtration
BC is defined as an organic material carbonised under thermochemical conversion
with no or little oxygen to produce a porous carbonaceous solid material which is
suitable for the storage of carbon for a long time and use as a soil amendment
(Shackley et al., 2010). BC use dates back 2500 years to civilisations in the Amazon
Basin of South America, especially in regions called terra-preta, which in Portuguese
means black land, because they have high fertility and high concentrations of organic
matter (charcoal) (Glaser et al., 2001). Plant and animal residue were burned and
buried in pits so very little oxygen can enters the process. It can also be found in
smaller quantities in other soils around the world due natural vegetation fires (USBI,
2016). From these ancient methods, scientists have developed the technology of
producing BC from plant waste and animal bone under similar low oxygen conditions
(pyrolysis) to obtain a better quality of BC. Carbonized biomass that possesses low
oxygen and high carbon content can be an ideal starting biomass for BC production
(Macdonald et al., 2015). BC is considered to be a multifunctional material. It can
mitigate GHG (Bolan et al., 2012), improve soil fertiliser uptake (Awad et al., 2012),
sequester carbon (Joseph et al., 2009), and filter and remove contaminants from water
(Ahmad et al., 2012). BC can also be used to immobilize bacteria as a high sorbent to
remediate polluted soil with organic contaminants which is called the immobilized
microorganism technique (Zhang et al., 2013).
Figure 2-7 demonstrates the different absorption mechanisms of BC such as a potential
to absorb, oxidise and retain nutrients due to its porous nature (Bornemann et al.,
2007). BC can be used as a sorbent char or soil amendment capturing nutrients such
as Nitrogen (N), Phosphorus (P) and Potassium (K). The potential of BC for such uses
is attributed to its cation exchange capacity (CEC), porosity, specific surface area, pH,
redox reactivity, functional groups and acid neutral capacity. The increased charge
density per unit area typically causes an increase in CEC on the BC surface and this
leads to an increase in the oxidation of the surface and an accompanying increase in
the adsorption of cations (Atkinson et al., 2010).
There is an abundance of functional groups, on the BC surface, that can provide
electrostatic attraction, ion-exchange and surface complexation effects with heavy
metals and other organic materials (Tan et al., 2015). For example, the mechanism of

Literature Review Chapter 2
28
Cr (VI) adsorption using BC takes place through three pathways: (i) positive charge of
BC surface attracts negative species and vice versa (Qiu et al., 2008), (ii) hydrogen
ions bonds with electron donors from BC and (iii) converted species such as
Chromium (Cr) from Cr (VI) to Cr (Dong et al., 2011). The third is divided into two
parts: one released into the medium and the other complexed with the functional
groups on the surface of the BC. The micropore structure of BC surfaces can facilitate
adsorption through pore-filling effects without the formation of chemical bonds (Han
et al., 2013, Inyang et al., 2014) allowing the adsorption of organic pollutants, such as
phenol and methylene blue, from agriculture runoff.
Precipitation is another BC mechanism that removes heavy metal which may occur
under a high pH. The minerals react with the BC surface through metallic ions and
form insoluble metallic precipitation (Inyang et al., 2016).
BC characterisation relies on many factors such as feedstock source (Corn Stover,
animal litters, Woodchips, poultry manure, Bagasse and hardwood), processing
temperature, pyrolysis type, heat transfer and residence time in the kiln. BC can be
produced through different pyrolysis processes such as conventional pyrolysis, fast
pyrolysis, gasification, hydrothermal carbonization, torrefaction and rectification
processes (Mohan et al., 2014). Traditional pyrolysis (slow pyrolysis) was used
thousands of years ago and is still performed using a similar method which starts with
the heating of biomass in moderate temperature rising to around 500°C with a lack of
air for a long residence time of hours to days. Fast pyrolysis relies on the quick heat
transfer of dry feedstock with rapid increases in temperature of up to 1000°C for 1-5s
of vapour residence (Lima et al., 2010). An alternative technique to traditional
carbonization is hydrothermal carbonization (HTC) which can convert the biomass to
char and this occurs underwater at moderate temperature (130-250°C) and pressure
(10-30 bar) (Titirici et al., 2012). Torrefaction and rectification processes are used to
produce BC between 230-280°C to create non-sorbent BCs. In general, the presence
of many types of functional groups on the surface of any BC depends on the particular
pyrolysis process, temperature and pH of the solution which can be specified through
CEC assessment (Harvey et al., 2011). Gasification is another BC production method.
In the gasification method, there is a relatively small amount of BC produced with
85% of gas yield and only a small amount of biomass combustion in an oxidising
atmosphere (Higman and Burgt, 2008). For instance, high temperature (>550°C) and

Literature Review Chapter 2
29
slow pyrolysis for macadamia shells can produce highly effective BC and high
Brunauer– Emmett– Teller surface areas (>400 m2/g) (Tilman et al., 2006, Keiluweit
et al., 2010). Gasification is probably the most attractive of the other BC producing
methods as it has triple green effects: waste recycling, BC production and generation
of useful gases.
Figure 2-7: Different absorption mechanisms on biochar
BC has many notable benefits such as cost-effectiveness being from cheap feedstock
(waste), environmentally friendliness as it is produced with minimal oxygen and it
does not release GHG. Pyrolysis and gasification processes produce useful materials
such as bio-oils and gases with high calorific values such as methane. As mentioned
previously, BC has many important applications such as improving the retention of
nutrients and water holding capacity (moister content) of the soil and carbon
sequestration in the form of carbon dioxide (Macdonald et al., 2015). Talberg (2009)
stated that BC could be produced using small or large units and this is another
significant benefit. The carbon in BC stays stable longer than the raw material itself,
NH+
4
CO-3
Physical Absorption in Pores
Electrostatic Interaction
Ion & Cation Exchange
Precipitation
Chemical Adsorption on the Surface
NH+
4
CO-3
NH+
4
CO-3
NH+
4
CO-3
NH+
4
CO-3

Literature Review Chapter 2
30
because of the steady aryl structures formed during the pyrolysis process. They
increase the lifetime of macadamia biochar (MBC) for 1000s of years and this
highlights its potential for reuse several times (Burns, 2014). BC can be used as a
perfect adsorbent due to its high surface area and C content that is rich with functional
groups and CEC (Zhao et al., 2018). BC has a few drawbacks mainly related to its use
as soil amendments as it may negatively impact the denitrification process due to its
high C: N ratio (Strock et al., 2017). Also if applied BC to the soil with lack of N
supplied that will immobilize N and affect negatively on the crop productivity(Shareef
and Zhao, 2016).
MBC can effectively remove N-nutrients in the form of NO-3, NO2, N2O and NH+
4
(Major et al., 2010) and P-nutrients, minimize Aluminium (Al) (Steiner et al., 2008),
sequesters C (Lehmann, 2007) and absorb CO2 (Sohi et al., 2010, Spokas et al., 2012),
and decrease Copper (Cu) (Ippolito et al., 2012). MBC can also absorb some ions due
to ion exchange such as Potassium (K), Calcium (Ca), Magnesium (Mg) and Sodium
(Na) (Wrobel-Tobiszewska et al., 2017). Kumar (2017) suggested that MBC (as a
carbon source) can minimise iron oxides (FeO) to metallic iron (Fe), which is
considered a sustainable and cleaner output of iron. The reaction equations are:
3Fe2O3(s) + C(s) ↔ 2Fe3O4(s) + CO (g) (1)
Fe3O4(s) + CO (g) ↔ 3FeO(s) + CO2 (g) (2)
C(s) + CO2 (g) ↔ 2CO (g) (3)
FeO(s) + CO (g) ↔ Fe(s) + CO2 (g) (4)
It can also remediate organic and inorganic contaminants organic pollutants can be dye
pollutants from the dye industry, Phenols, solvents, miscellaneous and pesticides.
Inorganic pollution can be divided to (Abdel-Raouf et al.) cations, anions such as
Chromium (Cr), Copper (Cu), Lead (Craggs et al.), Cadmium (Cd), Mercury (Hg),
Iron (Fe), fluoride (F), Zinc (Zn), and Arsenic (As) ions.

Literature Review Chapter 2
31
BC seems to be the most cost-effect technique for treating agricultural runoff, or any
contaminated water for that matter. BC is produced from waste materials and this saves
the cost of handling waste. In addition, the processes through which BC is made,
produce other useful products such as methane gas and oils. Kumar (2017) reported
that MBC could be used as a carbon resource to reduce the use of fossil-fuel in iron-
making factories which are a renewable, environmental and sustainable resource. BC
also has a long working life that allowing reuse for many applications such as filtration.
Figure 2-8 shows how around 50% of the pyrolysis biomass can be returned to the soil
as an amendment in the form of biochar, while the remainder can produce energy
through gas capture.
Nowadays, an activated BC is considered to be an effective alternative material to AC
because of its capability to adsorb different sorts of contaminants and its lower cost
(Ahmad et al., 2014). The total cost of one tonne of BC production is around $346
AUD, while commercial AC available at $2,110 AUD per tonne which means that it
is six times the BC cost (Maroušek et al., 2017). The main factors that may affect BC
production cost are the raw feedstock prices (switch-grass $91 AUD/t, water oak wood
$63 AUD/t and bio-solid 84 AUD/t (Alhashimi and Aktas, 2017)), power energy for
the kiln (electricity $0.17 AUD/kWh), pyrolysis temperature and time, and the
Figure 2-8: Pyrolysis biomass to produce biochar (Lehmann 2007)

Literature Review Chapter 2
32
percentage of BC production (Li and Chen, 2018). Also, Alhashimi & Aktas (2017)
compared the rate of energy demand and potential global warming impact between the
BC and the AC, and calculated per 1 kg production as 6.1MJ/kg and 97 MJ/kg
respectively, while the average greenhouse emissions (calculated by converting their
emission to the equivalent amount of CO2) were calculated to be 0.9 kg CO2eq/kg for
BC and 6.6 kg CO2eq/kg for AC.

Literature Review Chapter 2
33
Overall evaluation of available treatment technologies
In this section, overall evaluation is developed for treatment technologies taking into
consideration important factors such as cost/energy of operation, removal capability,
maintenance capability, regeneration and working lifetime. In recent years, scientists
have focused on some factors that may impact the feasibility of agricultural runoff
treatment techniques. The most important factors are cost, environmental effect,
efficiency and sustainability respectively (Chong et al., 2010, Gómez-Pastora et al.,
2017).
In terms of the cost/energy factors for the CW method, O'Geen et al. (2010) and Tanner
& Kadlec (2013) stated that land and constructions is the major portion of total cost at
around $60,870.0 AUD/ha for small scale, and the maintenance twice a year at about
$102.26 per ha per year. Energy consumption studies are small in number but different
systems have been shown to have low energy consumption (Zhang et al., 2009). In
addition, it has a high capability to remove pesticides from agriculture runoff but a low
capability for NG removal as Ballantine and Tanner (2010) stated. Knowles (2012)
calculated that CW also has a long lifetime (about 25 years) but it requires regeneration
every eight years which may cost around $90,000.00 AUD for 300 m2.
For the filtration method, the EPA reported that a sand filtration facility with activated
carbon adsorbent with a capacity of 3785 m3/day may cost around $2 M AUD for land,
construction and materials. Ko et al. (2004) stated that the facilities required 8 cents
for each kW/h energy to operate the system and it consumed around 2.1 TJ to operate
and maintain the facility over one year.
However, aeration can increase CWs oxygenation capacity and improve its
performance. Wu et al. (2014) reported that this will increase operation and
maintenance costs. Craggs et al. (2012) stated that the capital cost of the station
including earthworks for ponds construction, the paddlewheel mixing and pH
controlled CO2 addition is $ 17.03 AUD /m2. While, Christianson (2011) found that
the cost range for each hectare is $240.0 AUD to $715.00 AUD including the structure,
contractor, woodchips and supplies.
In BC’s case, Maroušek et al. (2017) analysis found that the production of one tonne
is around $346 AUD, while commercial AC is available at $2,110 AUD, which is six

Literature Review Chapter 2
34
times the BC cost. In addition, around $50 AUD per tonne as direct revenue can be
obtained from selling the heat produced through the pyrolysis process due to synthesis
gas (Meyer et al., 2011).
For the maintenance of CWs, dredging and cleaning the media due to the
sedimentation and harvesting every six months can be fairly costly. For the filtration
method, maintenance entails cleaning the tank and the whole media used as a filter
after saturation due to clogging, and may also include digging up sediments settled in
the basins (Myers, 2015). For the aeration method, maintenance includes daily
inspection of the aerated ponds to prevent any clogging of the diffused air system
(blower and pipeline) which provides air to the bottom of the pond (US EPA 2011).
This maintenance is high cost and requires continuous monitoring of the entire system
and may cause loss of soil nutrients. Harvesting is the most important part of
maintenance to recover the small cell size of algae (0.2-30 µm), which may cost 20-
30% of the total biomass production costs (Christenson & Sims 2011). For wood chips,
the low maintenance requires once a year nutrient removal which results in low cost
(Choudhury, 2017). However, using BC as a filter to reduce nutrients, requires
minimum maintenance and low cost for a long period of treatment due to BC behaviour
and material (from waste) replacement cost if required and backflushing for reuse.
CWs have a high ability to remove pesticides, biological oxygen demand (BOD) and
chemical oxygen demand (COD), but are inefficient at removing N and P nutrients.
Xiong et al. (2011) found that CW can help to remove about 35% nitrate, 50%
ammonium and 55% TN through nitrification and denitrification. An aeration system
can efficiently remove suspended solids and carbon from farm effluents (Bolan et al.,
2004) but it is inefficient for nutrient (N, P and K) removal. Algae can treat agricultural
runoff from toxic minerals such as lead, arsenic, cadmium, and it is also capable of
removing BOD and COD, some nutrients (e.g. N, P) and heavy metals (Kumar and
Gaur, 2011). Lannan (2011) reported the removal of nitrate by 71.4%, ammonia by
81.3% and phosphate by 82.6% within three days of algae growth. The woodchip
method can remove nitrate and phosphorous and some microbes and viruses from farm
flow runoff (Rambags et al., 2016). However, MBC can effectively remove N-
nutrients in the form of NO-3, NO2, N2O and NH+
4 (Major et al., 2010) P-nutrients,
minimize Aluminium (Al) (Steiner et al., 2008), sequester C (Lehmann, 2007) and
absorb CO2 (Sohi et al., 2010, Spokas et al., 2012), and decrease Copper (Cu) (Ippolito

Literature Review Chapter 2
35
et al., 2012). MBC can absorb some ions due to ion exchange such as Potassium (K),
Calcium (Ca), Magnesium (Mg) and Sodium (Na) (Wrobel-Tobiszewska et al., 2017).
Kumar (2017) suggested that MBC (as a carbon source) can minimise iron oxides
(FeO) to metallic iron (Fe), which is considered a more sustainable and cleaner output
of iron. BC, after saturation can be used as a soil amendment with useful nutrients.
Based on the evaluation of the common techniques for nutrients removal provided
above, it is fair to state the biochar treatment technology is identified as the most
feasible option for treating agricultural runoff in terms of the considered factors
compared to the other techniques. Gómez-Pastora et al. (2017) determined that the
important factors for treatment techniques should include environmentally
friendliness, low cost (originally from waste), high efficiency and sustainability.
Table 2: Advantage and disadvantages of different treatment methods
No. Treatment
Type
Advantage Disadvantage
1 Constructed
wetland
High capability to remove
pesticides from non-point
pollution agricultural runoff.
Cannot entirely remove NG
from agricultural runoff.
Convert nitrogen group into
various N forms.
Odor & mosquito production.
High ability to remove biological
oxygen demand (BOD) and
chemical oxygen demand (COD).
High maintenance, large land
requirements and high
installation cost.
2 Filtration
High reduction of BOD,
suspended solids and pathogens.
Requires expert design and
construction, particularly and
require maintenance.
Ability to nitrify due to good
oxygen transfer.
Lack of ability to remove
dissolved fluids.
Low operating costs. Inefficient in removing
nitrogen group.
3 Aeration
Aeration can minimize N2O
emissions and reducing total
nitrogen.
Lack of ability to remove NO-
3−N concentration.

Literature Review Chapter 2
36
Efficiently remove suspended
solids and carbon.
Inefficient for nutrient (N, P
and K) removal.
Has a capability to remove 95%
of Total Suspended Solids (TSS).
High cost due to installation,
pumping, and maintenance.
4 Algae
Convert nutrients such as N and
P to a complex organic structure.
Harvesting of dilute cultures.
Remove heavy metals Control problem in open pond.
CO2 emissions reduction. Light availability is a major
factor affecting microalgal
performance.
5 Woodchip
Low-cost of materials due to the
abundance of woodchip.
Colouring the treated water due
to the leach of organic
materials.
High carbon-nitrogen ratio. Risk of producing toxic
organic-heavy metal complexes
such as methylmercury.
Simplicity of operation and
maintenance.
Produce of GHG such as
nitrous oxide from the
denitrification process.
6 BC
Cheap feedstock from
macadamia nutshell waste
Applied BC to the soil with
lack of N supplied that will
immobilize N and affect
negatively on the crop
productivity
Environmentally friendliness as it
is produced with minimal oxygen
Sorption of pesticides and
herbicides by the biochar can
reduce their efficacy
Improving the retention of
nutrients, moister content and
carbon sequestration in the form
of carbon dioxide.
The fine ash associated with
biochar is the perfect source for
dust, posing a risk for
respiratory diseases.

Literature Review Chapter 2
37
2.4 Agricultural runoff
Agricultural runoff and its contaminants, such as salts and nitrates, are one of the main
problems that affect freshwater quality (United States Environmental Protection
Agency, 1994). Agricultural runoff is the surplus water from farms after the irrigation
or other activities. This water comes from different sources such as rain, melting snow
and irrigation, and some of this water finds its way into surface water and eventually
into groundwater. It can carry some pesticide and fertilizer residue while it is moving
along the soil surface and can pollute the water that it comes into contact with by
adding contaminant loads in the form of soil particles (suspended particles), dissolved
organic, nutrients or salts (e.g. NO-3 and NH+
4) (Town, 2017). Many methods can be
used to treat water from these contaminants, for instance CWs, filtration and aeration.
CWs is an artificial engineering design with specific elements such as soil and
vegetation that sequester pesticides from the runoff. The design of CW depends on
pesticides to be treated (Vymazal, 2007). The plants growing in CWs have a major
role in removing contaminants and oxidizing ammonium to nitrate as shown in the
equation below:
NH+4 + 2O-
2 ⇒ NO-3 + 2H+ + H2O (5)
According to Vymazal and Březinová (2015), once a year nutrient removal CW has
been considered to be an effective method to remove pesticides from agricultural
runoff and drainage but, it is high cost and inefficient for removal of the urea group
(NO-3 & NH+
4) and NaCl. Another method for treating water is aeration which has
been applied in conjunction with CW to enhance the ability of the latter to remove
contaminants from agricultural runoff (Uggetti et al., 2016). There are two types of
aeration i.) continuous and ii.) intermittent. The oxidation efficiency of NH+4 in aerated
CW relies on the concentration of dissolved oxygen applied to the bottom of the soil
surface in CW. The intermittent strategy is set at a minimum limit for oxygen
concentration so it can be controlled when the oxygen level drops below the required
level and this, in turn, reduces the cost of the aeration process. With the continues
strategy, the oxygen level can exceed the required limit (Labella et al., 2015).

Literature Review Chapter 2
38
Filtration is another method that can be used to treat agricultural runoff. The
application of filtration dates back to 4000BC in ancient Greek and India. These
civilisations were more concerned about the turbidity of water, contaminants and
microorganism in the water (Engineers, 1985). They used a basic method of filtering
the water through sand and gravel and boiling it. This method is still in use, but with
new materials that have a higher capacity for removing contaminants. One common
example of these filters is the multilayer filter. Each layer is responsible for removing
specific contaminants (suspended or dissolved) (Färm, 2002a).
2.5 CDI techniques
CDI is an electrochemical technique for removing contaminants from water. This
technology started in the 1960s and the scientists have continued to work on it up to
the 1990s when they began to use carbon with it to enhance the ability of carbon (high
surface area and high porosity) to adsorb contaminant ions (Suss et al., 2015). This
method requires two electrodes with different charges (positive and negative) on
opposite sides while the water flows between the two electrodes. DC voltage applied
across the two electrodes (work like capacitor plates) in a CDI cell. The anions
(negatively charged ions) are attracted to the cathode (positive electrode), whereas the
cations (positively charged ions) are attracted to the anode (negative electrode)
(Anderson et al., 2010). CDI technology can also solve the salinity problem in water
in the range of 800–10,000 mg/L. Many technologies can be used to remove
contaminants however, most of them are relatively expensive in comparison to CDI.
For instance, reverse osmosis and electrodialysis need about 2.25 Wh/L (8.5 Wh/gal)
and 2.03 Wh/L (7.7 Wh/gal), respectively, while CDI requires only 0.13–0.59 Wh/L
(0.5–2.25 Wh/gal) (Welgemoed and Schutte, 2005). CDI was found to improve the
capability of BC adsorption for NG in agricultural runoff (Shi et al., 2016). It also can
be used to regenerate filters after the electrodes are saturated with contaminants by a
reverse charge. Then the filters are flushed with clean water. Figure 2-9 describes how
the CDI technique works.

Literature Review Chapter 2
39
+ -
-+-+-+-+-+-+-+-+--+--
+-+-+-+-+-+-+-+-+-+-+
+-+-+-+-+-+---+++--
+-+-+-+-+-+-+-+-+-+
-+-+-+-+-+-+-+-+-+-
+++
++
+++++++++++++++++++++++++++++++++++
+
+
+
+-
-
-
-- -
-
------------------------------------------------------------
Contaminated water flowCleaned
Water outlet
ElectrodesPlastic support
Power supply
Ions attached to
surface electrodes
Figure 2-9: Schematic of CDI technique
CDI is a novel technology used for different water treatment applications, but mainly
desalination with different forms of carbon electrodes such as conventional, porous-
carbon and graphene (Ahmed & Tewari 2018). It considered to be a better technique
than other existing technologies such as reverse osmosis with regard to ion removal
efficiency, environmentally friendliness and energy consumption. In addition, the
possibility of energy recovery through the CDI desorption operation is the most
attraction feature for this researcher.

Literature Review Chapter 2
40
2.6 Regeneration
Regeneration may help filters remove more nutrients from contaminated water during
the second cycle. Many techniques can be used to refresh filters such as the well-
known back-flush with clean water. This can remove some of the ions from the filters,
but it is considered an inefficient method. Reverse polarity back-flush is another
technique that can be used to remove contaminants from the column after saturation.
This method can use one layer for CDI, although there are some ions that may reabsorb
to the opposite electrode (Uzun and Debik, 2019). Scientists have improved this
method by adding an ion selective membrane after each electrode to prevent the ions
being adsorbed by the opposite electrode and vice versa. Tab water (TW) will be
examined and compared with the DI.W as a practical alternative for nutrient recovery
on farms.
The conventional method for nutrient recovery, which is reverse polarity, has been
excluded from this study because it uses multilayer column cells that will allow most
of the ions to reabsorb at the opposite electrode during back-flush (Uzun & Debik
2019). Instead of this method, this study will use a novel technique from World War
ӀӀ (to reduce the magnetic signature of the ships) to recover nutrients (Kephart et al.
2011). This technique was called degaussing and the name comes from the unit of
magnetism (Sukow et al., 2010).
In this study, we used a non-sinusoidal periodic waveform or pulse wave (square
wave), similar to the degaussing technique because it can effectively dislodge absorbed
nutrients with a constant frequency and equal duration between maximum and
minimum. As shown in figure 2-10, a sample of square waves with duty cycles of Ton
and Toff at frequency of 100Hz and VL at 1.2V is used to degauss nitrate from a
saturated column. This technique can help to release the ions previously adsorbed in
the chemical and physical mechanism.

Literature Review Chapter 2
41
vL
Ton Toff
Figure 2-10: Square waves with duty cycle of 0.5 (El Hawary, 1986)

Literature Review Chapter 2
42
2.7 Conclusions
The literature pertaining relevant to treating agriculture runoff was critically analysed.
The current methods for treating agriculture runoff such as CW, filtration and aeration
were found to be inadequate for removing nitrate ions and expensive for construction
and maintenance. This study proposes the use of a BC filter for removing nitrate ion
as a part of nitrogen (N) compounds from agricultural runoff. N compounds were
chosen in this study due to their abundance in agricultural runoff and their negative
impact on surface and groundwater quality. Given the porous and chemically active
structure of BC originally from waste, adsorption capability, interactions (electrostatic
mechanism), significantly decrease runoff impacts, recovering nutrients at the same
time for reuse in a cost-effective and environmentally friendliness manner without
chemical substances use are the most important advantages for using BC in this study.

Biochar Characterisation and Nitrate removal capability tests Chapter 3
43
CHAPTER 3
Biochar Characterisation and contaminant removal
capability
3.1 Introduction
Different technologies for treating agricultural runoff, with a focus on nitrate, were
critically reviewed in the previous chapter. BC was found to be the most promising
option for this treatment owing to its cost-effectiveness, being environmentally
friendliness and its capacity to influence nutrient retention. Therefore, macadamia
biochar (MBC) as a biochar (BC) module was chosen for investigation into its
capability to minimise NO-3 from agricultural run-off.
In this chapter, the effect of MBC on the nitrates removal capability in synthetic
samples scrutinized through batch and column experiments. The performance of MBC
prepared at two different pyrolysis temperatures of 900 and 1000°C were investigated.
The effect of the flow direction (upward and downward) on the removal efficiency in
the column experiment was examined. The column experiments were used three NO-
3 concentrations with three levels of flow rate to determine the best removal
parameters. The long-term performance of MBC was tested for a month. Experimental
design and statistical analysis were employed to ensure the repeatability of the
experimental work.

Biochar Characterisation and Nitrate removal capability tests Chapter 3
44
3.2 Materials and Methods
Solution preparation
A stock of synthetic solution was prepared by dissolving 135.4 mg Sodium Nitrate
(M.W. =84.99, Analytical Reagent) in 1 L of distilled water to produce 100 mg/L of
nitrate concentration (stock solution). This stock solution was prepared to save time,
reduce storage space, conserve materials and improve the accuracy of the solution
preparation and reagents (GHOSAL and AVASTHI, 2018). Three concentrations of
5, 10 and 15 mg/L of nitrate were applied in this study. The concentration range was
chosen to cover the minimum and maximum nitrate levels expected in agricultural
runoff. In most parts of the world, for example China and the USA, the maximum
nitrate concentration in many sites reaches up to 15 mg/L, while the lower limit is
about 3-5 mg/L (Beutel et al. 2009; Lang et al. 2013). Another study of 360 stormwater
sites around the USA reported that the median limit was around 14 mg/L (Ghane et al.
2016). In addition, a report of the Department of Primary Industries in Australia
indicated that the suitable NO-3 for most plants is less than 10 mg/L (NSWPrimefact,
2014). This data informed the selection of concentration levels: a minimum level of 5
mg/L and maximum level of 15 mg/L, and their midpoint of 10 mg/L. These were
considered to be best levels for obtaining the most accurate results (Beutel et al. 2009).
Biomass preparation
The feedstock was prepared from macadamia (Bauple) nutshell as a BC module due
to its availability, affordability, being environmentally friendliness as it is a recycled
product of agricultural waste, and having a high surface area compared to other shells
such as pistachio, pecan, hazelnut and almond (Bae & Su 2013). Macadamia nutshell
was placed into a stainless steel square container with lid 17.78W×16.51D×10.16H
cm, then set it in a kiln (Rio Grande PMC Model #703-118). The kiln was programmed
for the slow pyrolysis process under lack of oxygen conditions to drive the internal
chamber to two temperatures 900 and 1000°C at a rate 600°C/h and holding time at
the climax temperature for an hour before cooling down to room temperature.
Macadamia nutshell normally loses about 65% of mass between 260-400°C due to the
conversion to BC (Kumar (2017). Using higher temperatures to pyrolyse the biomass

Biochar Characterisation and Nitrate removal capability tests Chapter 3
45
has the advantage of reducing volatiles and obtaining more stable carbon with through
a high surface area (Nick 2018). After pyrolysis was completed, MBC was cooled and
later was gently crushed using a Weston hand grinder. The crushed MBC was then
sieved through 1.18-2.30 mm sieve as this size range was found to be effective for
sorption (Shackley et al. 2010). After that, the MBC, obtained from the above steps,
was rinsed with distilled water for two hours to remove any impurities such as ash.
Following this step, the BC was autoclaved at 121°C and pressure of 2.50 bars for
steam sterilization using a Hirayama Manufacturing Corporation autoclave (Model
HV-50L). The final product was then stored in plastic containers to be used in
adsorption experiments.
Column preparation
A plastic column with a height of 12.20 cm and an internal diameter of 3.85 cm was
used for carrying out the column experiments. The column was rinsed with DI.W,
sterilised with Ethanol (C2H6O). Circular fibreglass mesh was laid at the bottom of the
column. The column was packed with 60 g of MBC prepared at 1000°C pyrolysis
temperature based on preliminary experiments which will be explained later in Section
3.3.1.1. Once the column was packed with the MBC, the top of biochar was covered
with filter paper of 0.45 µm size to prevent MBC particles from leaving with the flow
of the solution. The two ends of the column were covered with plastic caps and sealed
with commercial silicon. The two caps had openings to accommodate the hosing of
the feed and discharge lines as shown in Figure 3-1.

Biochar Characterisation and Nitrate removal capability tests Chapter 3
46
Figure 3-1: Schematic diagram of MBC column
Plastic
cap
Opening end
Filter paper
Experimental
column
MBC particles
Fibreglass screen
Plastic cap
Opening end

Biochar Characterisation and Nitrate removal capability tests Chapter 3
47
Analytical measurements
Morphology and elemental composition
Scanning Electron Microscopy (Phenom SEM) JEOL (JCM-6000 Benchtop SEM)
was used for visual comparison between the raw and pyrolysed macadamia nutshell,
the structures, pore sizes and their distribution on the surface of the materials. SEM
images were taken at around ×1000 magnification power, secondary electron image
(SEI) in a chamber pumped to high vacuum mode around 10-2 pa pressure in ten
minutes and accelerating voltage of 5 kV.
Functional groups
Shimadzu 206-97505D/2015 Fourier Transform Infrared Spectroscopy (FTIR) was
used to examine the BC structure at different conditions (pyrolysis temperatures and
before and after adsorption). FTIR measurements were utilised to monitor the change
in functional groups available on the BC surface as it is considered a sensitive tool for
detecting any change that might happen in the composition of the functional groups on
the surface of the biomass (Shen et al., 2010). Based on potassium bromide (KBr) and
optics defined by the FTIR, the average record spectra was chosen from the upper
limit bands at 4000 cm-1 to the lower bands at 400 cm-1 (Coates, 2000). Each band
number was assigned to a specific chemical band and could help in understanding the
MBC removal mechanisms of nitrate. The applied FTIR measurement conditions were
as follows: % transmittance mode, no. of scans = 45, apodization is happ-genzel, and
resolution of 4 cm-1.
A 2 mg MBC sample was pulverized using a mortar and pestle and mixed with 200
mg Potassium bromide (KBR) to 0.1 wt.%. The mixture was pressed into a pellet of
15 mm inner diameter and 1 mm thick using manual a hydraulic press approximately
8-9 kPa for 0.5 min (Yang et al., 2017). The pellet was then placed in the FTIR
instrument for a scanning test.

Biochar Characterisation and Nitrate removal capability tests Chapter 3
48
Ion Chromatography system (ICS-2000)
An Ion Chromatography System ICS-2000 instrument was used to analyse nitrate
concentration in the samples before and after treatment. ICS-2000 works on comparing
the samples to a three points calibration curve applying the standard method 4110B
(Dionex, 2006). Five millilitres plastic vials with filter cap (20 µm) were used for
storing the samples. The results obtained from ICS in terms of NO-3 ̶ N were converted
to NO-3 by multiplying by a factor of 4.428.
Kinetic experiments
In this study, a batch experiment and a column experiment were used to check the
adsorption capability of the BC. All experiments were conducted in triplicate and a
blank sample (before adsorption) analysed as a reference for each test.
For the batch experiment, 10 mL from the stock solution prepared in Section 3.2.1 was
utilised with 90 ml of distilled water to obtain a 10 ppm nitrate solution. This 100 ml
solution was placed in 250 ml Pyrex beaker with 1 g of MBC prepared at 900°C and
another beaker for 1000°C at an initial pH of 5.5 and a temperature of 20.9°C to
compare the two. The solution was stirred for 48 hours to obtain the best equilibrium
contact time between the solution and MBC particles which estimate the maximum
potential of the MBC for effective removal of nitrate. These experiments were
conducted in triplicate and samples were collected at 5, 15, 30, 60, 120, 180, 240, 300
and 360 minutes (Wang et al. 2017). Samples were filtered directly using a 0.45 µm
paper filter to stop any reaction between the solution and MBC by removing any solid
particles present in the samples.
Column experiment
A plastic column prepared in Section 3.2.3 was used with the same procedure of
cleaning, sterilising and the amount of the 1000°C MBC. After the column was packed
with MBC, it was rinsed with DI.W several times until the leachate pH settled
indicating that the column was clean and ready for the experiments (Inyang et al.

Biochar Characterisation and Nitrate removal capability tests Chapter 3
49
2013). This state of cleanliness also ensured that a minimal amount of elements would
be released from the biochar. In this process, upward and downward flow through the
column packed with 30 gm of MBC was utilised for preliminary experiments as will
be explained later in Section 3.3.2.
All of the experiments discussed below were conducted in triplicate to obtain the
optimum nitrate removal concentration and flow rate per gram MBC and the results
are displayed by the mean values. 20 litre sterilised plastic containers were used to
carry the feed solution with three different NO-3 concentrations (5, 10 and 15 ppm) and
filtered solution. The feed was single-pass pumped into the column through silicon
tubing at three different flow rates (2, 5 and 10 ml/min) using a peristaltic pump model
MasterFlex model no. 7520-47, USA and ISMATEC ecoline Model ISM1076A,
Germany. Samples were collected periodically at 5, 15, 30, 60, 120, 180, 240, 300 and
360 minutes to obtain the optimum removal time. Other studies have measured the
concentration of effluent at different intervals of set time to find the saturation point
(Chang et al. 2006). Nitrate was measured using ICS-2000 as explained in the previous
section. Equations 3-1 and 3-2 were used to calculate the percentage of the nitrate
removal for each gram of MBC respectively.
Nitrate removal (%) = Nitrate conc. in feed water −Nitrate Conc. in column leachate
Nitrate conc. in feed water (6)
mg of nitrate removal per g BC =
Nitrate conc. in feed water −Nitrate Conc. in column leachate
Nitrate conc. in feed water × Volume of the solution (7)

Biochar Characterisation and Nitrate removal capability tests Chapter 3
50
Figure 3-2 shows the schematic of the plastic columns filled with MBC used for the
nitrate removal experiment applying upward flow in the University’s chemical
laboratory.
Figure 3-2: Schematic of MBC column experiment
Plastic
cap
Opening for
outlet
Filter paper
Experimental
column
MBC particles
Fibreglass
screen Plastic cap
Opening for
feed inlet
Plastic
container
Peristaltic pump
Flow
Feed container
Filtered solution
Flow

Biochar Characterisation and Nitrate removal capability tests Chapter 3
51
Statistical analyses
Statistical analysis was implemented in two stages: design of experiments and data
analysis. Experimental designs and data analyses were carried out using MINITAB
17 software. The order of the experiments was randomized to obtain a normal
distribution of the experimental errors. Three nitrate concentration levels and three
flow rate levels were chosen. Each experiment was conducted in triplicate and, for
each experiment, samples were taken after six hours to find the maximum adsorption
condition in this period. Factorial design of 32 was performed for nitrate removal and
the factors of concentration and flow rates were used in Minitab 17. The optimum
nitrate removal concentration and flow rate per gram of MBC was found using three
levels of nitrate concentration (5, 10 and 15 mg/L) and three levels of flow rate (2, 5
and 10 ml/min) after 6 hours with a one pass solution of upward flow through the
column of MBC pyrolysed at 1000oC. The experiment’s analysis program will be
explained in the preliminary experiments in Section 3.3.3.

Biochar Characterisation and Nitrate removal capability tests Chapter 3
52
3.3 Results and discussions
Preliminary results
Effect of the pyrolysis temperature
Figure 3-3 shows the average nitrate removed for the three experiments in the first six
hours using MBC prepared under two different temperatures (900 and 1000°C). In the
first hour, NO-3 removal measured by milligram nitrate removal per gram MBC
increased for the two kinds of MBC (900 and 1000°C) with time. At around 60
minutes, they began at equilibrium status around 0.095 and 0.057 mg of nitrate
removal per gram of MBC for 1000 and 900°C respectively. After 24 hours, the results
of the 900°C was still around 0.059 mg/g while 0.097 mg/g for 1000°C. Higher nitrate
removal was obtained with the application of 1000°C of MBC.
Figure 3-3 above demonstrates that the first few minutes for the 1000°C MBC was a
higher removal than 900°C at around doubled. After six hours the 1000°C MBC was
still the highest at 0.096 mg nitrate per g MBC. This proves that the nitrate removal
Figure 3-3: Nitrate removal with 10 mg/L NO-3 concentration
0.00
0.02
0.04
0.06
0.08
0.10
0.12
0.14
0 30 60 90 120 150 180 210 240 270 300 330 360
mg n
itra
te r
emoval
/g M
BC
Time (min)
900
1000

Biochar Characterisation and Nitrate removal capability tests Chapter 3
53
capability of 1000°C MBC is much higher than the 900°C MBC. Mainly after first-
hour MBC of 900°C and 1000°C start to saturate.
These results concur with the SEM images in Figure 3-4 below. Figure 3-4A and B
clearly shows that the raw macadamia nutshell surface structure had closed its pores.
In comparison, the macadamia nutshell after pyrolysis, Figure 3-4C and D, shows
obvious the pores for MBCs pyrolysed at both 900°C and 1000°C respectively. The
latter figures demonstrates that the pore size after applying pyrolysis to the raw
macadamia nutshell for the 1000°C (Figure 3-4D) gives more, larger and more uniform
porosity than the 900°C MBC (Figure 3-4C) under the same conditions and
magnification of ×1000 (resolution of 20 µm).

Biochar Characterisation and Nitrate removal capability tests Chapter 3
54
(A) (B)
(C) (D)
Figure 3-4: A & B SEM for raw macadamia nut shell and pyrolysis MBC C. 900°C and D. 1000°C
Biochar Characterisation and Nitrate removal capability tests Chapter 3
55
Figure 3-5 A and B shows the weight and atomic percentage before and after the
pyrolysis process using Generation 5 SEM instrument, The Phenom ProX Desktop
scanning electron microscope. Obviously, there is a difference in terms of the weight
and atomic percentages of the main elements of carbon and oxygen as well as Na, Ca
and K present for the raw macadamia nutshell and MBC. It is clear that the carbon
percentages increased while the oxygen, in the form of gas percentage, decreased in
both weight and aromatic percentage when the mass moved from raw to pyrolyzed
macadamia nutshell (MBC). This is the result of the strong carbon availability and
stability in the BC structure. In terms of mass, the weight of the raw macadamia nut
shell placed in the container of the kiln was around 370 grams and after pyrolysis, the
weight was reduced to around 32% at 110 g.
(A)
(B)
Summarising Figures 3-4 and 3-5, raw macadamia nutshell in Figure 3-4 appears with
some cracks, but without any porous structure on the surface area. In terms of
composition, the shells had 52.18 and 47.61 percentage of C and oxygen respectively.
In the pyrolysis process, the carbon percentage was increased, driving off all the
volatile materials including the oxygen contained in the raw shells. The carbonisation
Figure 3-5: Weight & atomic percentage A. raw macadamia nut shell and B. macadamia biochar
0
10
20
30
40
50
60
70
C O Na Ca
Per
centa
ge
Weight
percentageAtomic
percentage
0
10
20
30
40
50
60
70
80
90
100
C O Na Ca
Weight
percentageAtomic
percentage

Biochar Characterisation and Nitrate removal capability tests Chapter 3
56
process can cause the volatilisation of noncarbonated elements and development of
pore structures as shown in Figure 3-4C and D. A similar process of change in porous
structure and volatile compounds was reported in another study that used macadamia
nutshell waste and pyrolysis at 700°C (Junior et al. 2014; Martins et al. 2015).
Pyrolysis of macadamia nutshells has also been found to increase water and nutrient
retention as the pyrolysis temperature increases (Shafie et al., 2012).

Biochar Characterisation and Nitrate removal capability tests Chapter 3
57
A FTIR test was used to define the mechanism of MBC removal by examining the
functional groups present on their surfaces. Generally, the functional groups of acidity
and basicity surface increase with increased pyrolysis temperatures (Kameyama et al.,
2016). In Figure 3-6 below, a comparison between the MBC at 900 and 1000°C is
made. Both have the same peaks positions which means they have similar functional
groups that allow them to adsorb similar elements (Mandal et al., 2016). For 1000°C,
some peaks are not as sharp as 900°C and that indicate the water peak in 3454.51 cm-
1 reduced at the higher temperature. The reduction in the functional group with
increasing temperature is evident through the composition analyses where the oxygen
falls due to include the oxygen in a most functional group such as OH and COOH.
However, as the functional group falls with higher pyrolysis temperatures, the porosity
of char surface increases and conductivity might also increase which will offset the
reduction in the functional group.
Figure 3-6: FTIR analysis for 900 and 1000°C MBC

Biochar Characterisation and Nitrate removal capability tests Chapter 3
58
Effect of flow direction on nitrate adsorption
As explained in Section 3.2.4.5, peristaltic pumps were used to feed the columns (in a
single-passed configuration) with the nitrate solution used in Section 3.2.4.4, but in
two directions (upward and downward) at a flow rate of 10 ml/min. This experiment
utilised the same electro conductivity (EC) of around 20 µS/cm, ambient temperature
(T) around 16.5°C and pH around 6.
Figure 3-7 demonstrates that the trend for the first six hours of upward flow is very
much higher than the downward flow regarding nitrate removal through the two
columns and at the same time and in the same conditions. The upward started at around
80% at five minutes, while the downward started at around 12%. For the upward flow,
the saturation started around the fourth hour at 20%, while for the downward it started
earlier at around 5%. These results show that up-flow is a much more efficient method
than the down-flow in terms of removal percentage. In addition, the upward flow has
a greater uniform distribution of solution on each particle of the MBC with HRT 6.42
minutes from the inlet to outlet, which increases the contact time. The down-flow
Figure 3-7: Upward and downward flow column adsorption experiment for 6 hours
0
10
20
30
40
50
60
70
80
90
0 30 60 90 120 150 180 210 240 270 300 330 360
NO
- 3R
emoval
per
cen
tage
%
Time
Up
Down

Biochar Characterisation and Nitrate removal capability tests Chapter 3
59
creates a channel between the MBC particles for easy flow which reduces contact time
to 2.05 minutes.
Figure 3-8 presents the FTIR spectra of particulate matter from MBC before (1000)
and after (1000_Ads) nitrate adsorption. The intensity of some peaks after nitrate
adsorption was substantially decreased or shifted in wavenumber (cm-1) compared to
those before adsorption due to the chemical bonds emerging. This means that there
may be an involvement of some functional groups on the surface of the MBC in nitrate
adsorption (Hafshejani et al., 2016). The peak intensity of 3454.51 cm-1 which is
ascribed to a C-OH group within a group frequency (4000-1450cm-1) is stretching
vibrations and board (Baitimirova et al., 2013). The intensity decreased after
adsorption indicating that the surface hydroxyl groups were involved in nitrate
adsorption and chemically connected to the water. Another peak around, 2368.59 cm-
1, shows the stretching vibration of –C≡C– and –C–H bonds due to an alkynes group
which can be attributed to the MBC component. The peak at about 1101.35 cm-1 also
fell after adsorption and this refers to the ring skeletal C–O (a secondary alcohol)
stretching (Shen et al., 2010). The decline in the peak after nitrate adsorption indicates
an interaction between the functional group and NO-3 because of the powerful aromatic
C–O linkages. The prominent peak at 975.98 cm-1 belongs to the aromatic CH plane
deformation (Ma, 2017). In addition, the decline from the peak of 480.28 cm-1 after
nitrate adsorption, indicates an interaction with the MBC functional group due to
vibrations from carbohydrate and lignin (Schenzel and Fischer, 2001, Ma, 2017).
Based on the aforementioned results, the falls from all peaks before nitrate adsorption
can be ascribed to the interaction between the MBC functional groups and NO-3 ions
to form new chemical bonds.

Biochar Characterisation and Nitrate removal capability tests Chapter 3
60
Figure 3-8: Compare between MBC1000°C before and after nitrate adsorption

Biochar Characterisation and Nitrate removal capability tests Chapter 3
61
To sum up the finding of the preliminary experiments in the previous sections, the
analysis of batch triplicate experiments and SEM images shows that MBC at 1000°C
pyrolysis temperature was found to cause better nitrate removal than 900°C. In
addition, the upward flow column was found to be performing better in comparison to
the downward flow column in terms of NO-3 removal.
Therefore, in the next experiments for MBC 1000°C with upward flow different
concentrations and flow rates were applied to the same column conditions to find the
optimum condition for nitrate removal using MBC in six hours.
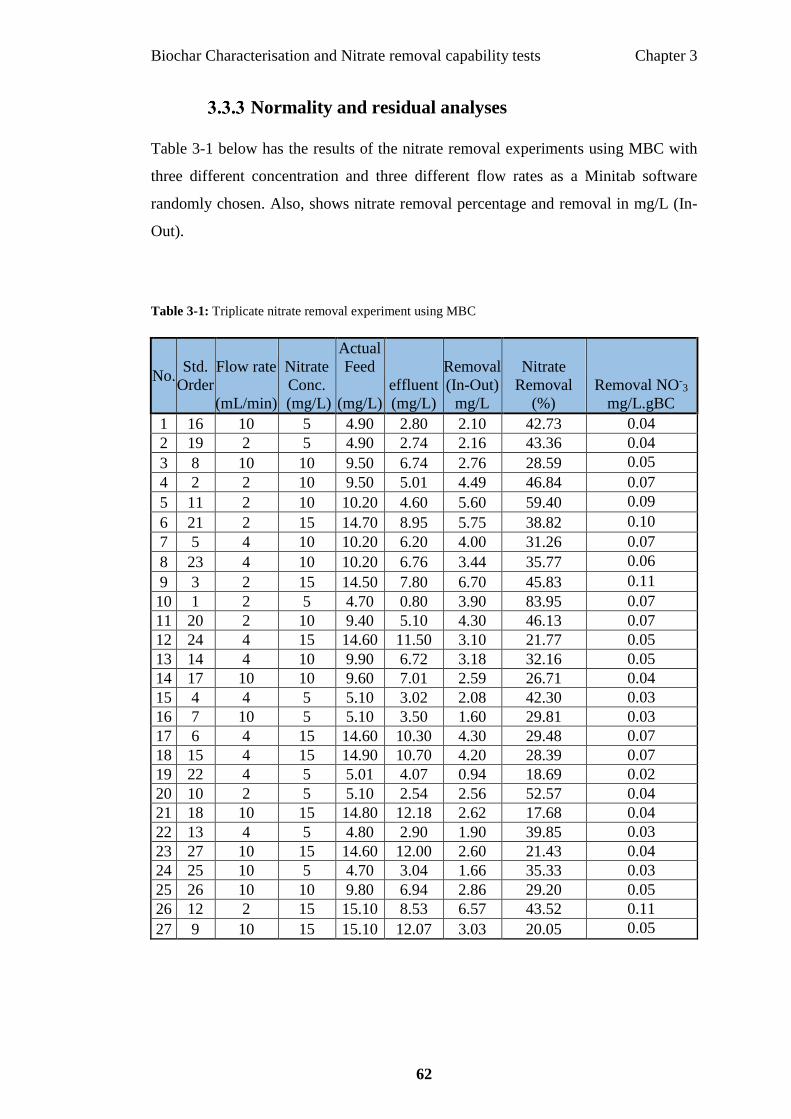
Biochar Characterisation and Nitrate removal capability tests Chapter 3
62
Normality and residual analyses
Table 3-1 below has the results of the nitrate removal experiments using MBC with
three different concentration and three different flow rates as a Minitab software
randomly chosen. Also, shows nitrate removal percentage and removal in mg/L (In-
Out).
Table 3-1: Triplicate nitrate removal experiment using MBC
No. Std.
Order
Flow rate
(mL/min)
Nitrate
Conc.
(mg/L)
Actual
Feed
(mg/L)
effluent
(mg/L)
Removal
(In-Out)
mg/L
Nitrate
Removal
(%)
Removal NO-3
mg/L.gBC
1 16 10 5 4.90 2.80 2.10 42.73 0.04
2 19 2 5 4.90 2.74 2.16 43.36 0.04
3 8 10 10 9.50 6.74 2.76 28.59 0.05
4 2 2 10 9.50 5.01 4.49 46.84 0.07
5 11 2 10 10.20 4.60 5.60 59.40 0.09
6 21 2 15 14.70 8.95 5.75 38.82 0.10
7 5 4 10 10.20 6.20 4.00 31.26 0.07
8 23 4 10 10.20 6.76 3.44 35.77 0.06
9 3 2 15 14.50 7.80 6.70 45.83 0.11
10 1 2 5 4.70 0.80 3.90 83.95 0.07
11 20 2 10 9.40 5.10 4.30 46.13 0.07
12 24 4 15 14.60 11.50 3.10 21.77 0.05
13 14 4 10 9.90 6.72 3.18 32.16 0.05
14 17 10 10 9.60 7.01 2.59 26.71 0.04
15 4 4 5 5.10 3.02 2.08 42.30 0.03
16 7 10 5 5.10 3.50 1.60 29.81 0.03
17 6 4 15 14.60 10.30 4.30 29.48 0.07
18 15 4 15 14.90 10.70 4.20 28.39 0.07
19 22 4 5 5.01 4.07 0.94 18.69 0.02
20 10 2 5 5.10 2.54 2.56 52.57 0.04
21 18 10 15 14.80 12.18 2.62 17.68 0.04
22 13 4 5 4.80 2.90 1.90 39.85 0.03
23 27 10 15 14.60 12.00 2.60 21.43 0.04
24 25 10 5 4.70 3.04 1.66 35.33 0.03
25 26 10 10 9.80 6.94 2.86 29.20 0.05
26 12 2 15 15.10 8.53 6.57 43.52 0.11
27 9 10 15 15.10 12.07 3.03 20.05 0.05

Biochar Characterisation and Nitrate removal capability tests Chapter 3
63
A normal distribution is the key assumption of the statically analysis that shown the
data from experiments are normally distributed (Srinivasan and Viraraghavan, 2010).
Table 3-2 presents the parameters estimation of the fitted model for the mg of NO-3
removal capability per gram of MBC. More details in the appendix A.
Table 3-2: Analysis of Variance (ANOVA) for NO-3 Removal using Adjusted SS for Tests
Source DF Adj SS Adj MS F-Value P-Value
Model 8 0.000060 0.000008 21.79 0.000
Linear 4 0.000055 0.000014 39.43 0.000
Flow rate (mL/min) 2 0.000028 0.000014 40.12 0.000
Nitrate Conc. (mg/L) 2 0.000027 0.000013 38.74 0.000
2-Way Interactions 4 0.000006 0.000001 4.16 0.015
Flow rate (mL/min)*Nitrate Conc. (mg/L) 4 0.000006 0.000001 4.16 0.015
Error 18 0.000006 0.000000
Total 26 0.000067
Model Summary:
S R-sq R-sq(adj) R-sq(pred)
0.0005881 90.64% 86.48% 78.94%

Biochar Characterisation and Nitrate removal capability tests Chapter 3
64
The normality of data was verified in terms of standardized residual as a part of the
statically analysis (normal probability plot). Data normality form will be checked by
drawing a normal probability plot of residuals in this experiment. Figure 3-9 shows
how data fall fairly close to the fitted regression line. As observed clearly from this
figure, the normal probability plot of the residuals for the nitrate removal is normality
distributed population by falling all data experiments closest to the fitted line (Al-
Juboori et al., 2015).
Figure 3-9: Normal distribution plot of residual for nitrate removal experiments

Biochar Characterisation and Nitrate removal capability tests Chapter 3
65
Figure 3-10 demonstrates the results of the diversity of the experiments with residuals
and the irregular pattern for that removing nitrate residuals with fitted value. This
approved the data was collected in a random distribution throughout the experiments
which obviously shows randomly distributed around the zero line (Ryan et al., 2012).
Figure 3-10: Residual vs. fitted value for nitrate removal experiments

Biochar Characterisation and Nitrate removal capability tests Chapter 3
66
The proportional shape in figure 3-11 shown the histogram below of the residuals vs.
frequency is another figure can show how the residuals of removing nitrate are
normally distributed.
Figure 3-11: Residual vs. frequency for nitrate removal experiments
0.001000.000750.000500.000250.00000-0.00025-0.00050-0.00075
7
6
5
4
3
2
1
0
Residual
Fre
qu
en
cy
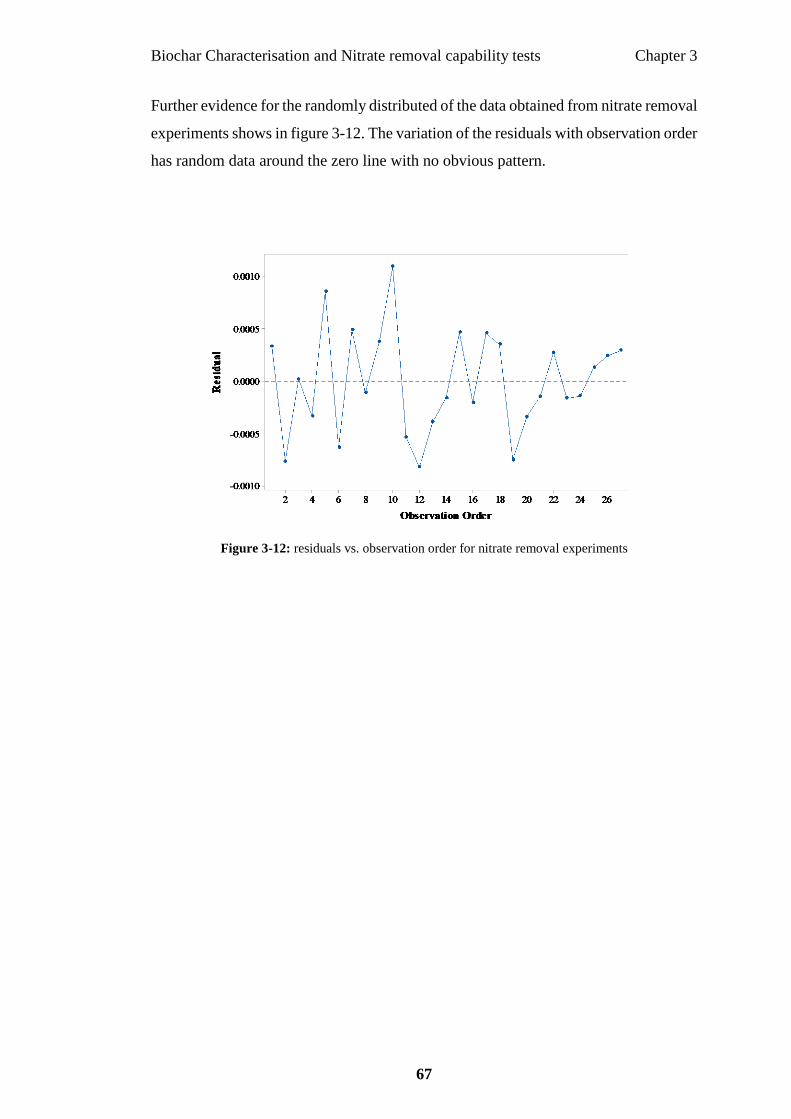
Biochar Characterisation and Nitrate removal capability tests Chapter 3
67
Further evidence for the randomly distributed of the data obtained from nitrate removal
experiments shows in figure 3-12. The variation of the residuals with observation order
has random data around the zero line with no obvious pattern.
Figure 3-12: residuals vs. observation order for nitrate removal experiments

Biochar Characterisation and Nitrate removal capability tests Chapter 3
68
Analysis of surface and contour plots
Many factors may be considered to obtain the optimum case of maximum removal of
nitrate by using MBC and how it responses to each case and examine how the response
conduct with each selected levels of each factor (Boubakri et al., 2014). To determine
the required response values and operation conditions, this study utilised the response
of the surface plots like surface and contour plots (Montgomery, 2013). The response
in the contour plots showed in the two-dimensional plane and it is obvious when each
contour line present a group from the same response values connected to each other.
However contour plots produced a clear idea about data response, still, the surface
plots displayed response values in three-dimensional view which can offer a wide
exemplification. In both plots (contour and surface) can help to find the factors that
have the main effects for each response through kept the variables constant except two
of them and check the plots responses.

Biochar Characterisation and Nitrate removal capability tests Chapter 3
69
(A)
(B)
Figure 3-13: Nitrate removal by using MBC A. Surface plot B. Contour plot
Flow rate (mL/min)
Nit
rate
Con
c. (
mg/L
)
1098765432
15.0
12.5
10.0
7.5
5.0
>
–
–
–
–
–
–
< 0.0016
0.0016 0.0024
0.0024 0.0032
0.0032 0.0040
0.0040 0.0048
0.0048 0.0056
0.0056 0.0064
0.0064
MBC)
Removal (mg/g
Nitrate
24
68
0.002
0.004
2
510
10
15
0.006
0.008
(mg/g MBC) lavomeR
oC etartiN n )L/gm( .c
)nim/Lm(low rate F

Biochar Characterisation and Nitrate removal capability tests Chapter 3
70
Figure 3-13 shows the combined impact of three different concentrations and flow
rates on nitrate removal by using MBC. NO-3 removal increased when influent rate
become 2 ml/min and the concentration around 14-15 mg/L. It is obvious from the
contour plot that the maximum adsorption happened under the 15 mg/L nitrate
concentration and 2 ml/min flow rates after random experiments with various cases
replicated for three times. This results matched with the experiments results at around
0.007 mg of NO-3/ g of MBC for an experiment number 6, 9 and 26 in table 3-1. More
clear for the surface plot and easy to recognise the minimum nitrate removal around
the 0.003 mg of NO-3/g of MBC happened in the case of 5-6 mg/L concentration and
7-10 ml/min flow rate which is in correlation with experimental results about 0.003
mg/g for the experiment number 1, 16 and 24 (table 3). The previous study by Boubakri
et al. (2014) showed that the highest removal efficiency happened at high
concentration and low flow rate similar to the results obtained from this study
(Ebrahimi-Gatkash et al., 2017). Therefore, this technique performed better removal
with increasing nitrate concentration.

Biochar Characterisation and Nitrate removal capability tests Chapter 3
71
Maximum adsorption time
The aim of the column experiment is to find the parameters required to design the
adsorption column suitable for industrial purposes. Recent studies found that the
capability of BC to reduce some nutrients relies on the character of the BC feedstock
(Dempster et al., 2012). This removal capacity decline with time due to increasing C:
N ratio of the BC from different raw material. Figure 3-14 presents the breakthrough
curve for column prepared in section 3.2.3 and solution as found in section 3.3.3.1 for
single-passed.
The area above the breakthrough curve represents the bed capacity (BC) and is given
by the equation below (Karunarathne and Amarasinghe, 2013).
BC = G ∫ (Co − C) × dt𝑇
0 (8)
Where G is the solution rate in L/min, C0 and C are the inlets and outlet nitrate
concentration in mg/L at time t, respectively and T in minutes is the actual time
required for full bed exhaustion.
Figure 3-14: Breakthrough curve for nitrate adsorption using MBC. Ideal breakthrough curve
(IBC) at flow rate of 2 mL/min
0
1
2
3
4
5
6
7
8
9
10
11
12
13
14
15
0 30 60 90 120 150 180 210 240 270 300 330 360
Ou
tlet
Conce
ntr
atio
n (
mg/L
)
Time (min)
MBC IBC

Biochar Characterisation and Nitrate removal capability tests Chapter 3
72
Table 3-3: Nitrate adsorption in fixed bed column 2 mL/min flow rate and 15 mg/L initial
concentration
Adsorbent
weight (g)
Ts
(min)
Tb (min) at
C/C0=0.20
LUB
(cm)
Amount adsorbed
at Tb
Amount adsorbed at
full
bed exhaustion
Total
(mg)
mg/g Total (mg) mg/g
60 330 25 11.27 0.63 0.01 3.59 0.06
Ideal breakthrough curve (IBC) has been drawn in figure 3-14. In industrial practice,
the operation of the column adsorption continues until reach low concentration of
removal was chosen before that called breakpoint concentration at the maximum
concentration of the effluent can reach. In this case, it happened around 12.50 mg/L.
At this point the column is not fully saturated and can calculate the length of the unused
bed (LUB) by using the equation below:
𝐿𝑈𝐵 =𝑍
𝑇𝑠 (𝑇𝑠 − 𝑇𝑏) (9)
Where Z is the height of the column, Ts the time required for full bed exhaustion at
infinite rapid adsorption and Tb is the breakthrough time. BC calculation is then
given by:
BC = G (Co − C∗)Ts (10)
Where C* is the equilibrium concentration of the effluent 60% of the lowest
concentration (5 mg/L) may found in the agricultural runoff which is in this case 3
mg/L and table 3-3 tabulated the calculation of all parameters in the equations above.
These results found that the effective length of the column used was 11.27 cm and the
maximum nitrate removal before the bed exhausted was 3.59 mg after 330 min.
Biochar Characterisation and Nitrate removal capability tests Chapter 3
73
3.4 Chapter summary
The use of the MBC as environmentally friendly and cheapest sorbent investigated in
this chapter. Two types of the MBC (1000, 900oC) utilised to remove NO-3 ions from
agricultural runoff. Batch and column experiments done with triplicate each
experiment to obtain the optimum adsorption condition through changing the flowrate,
concentration and flow direction. Characterisation of the MBC was done by some
devices to check the differences between the two sorts of the BC used in this study.
The outcomes of the experimental in this chapter are summarised below:
1. 1000°C MBC used in this experiment has more porosity and functional groups
as clearly shown by SEM and FTIR sections and has more nitrate adsorption
capability than the 900°C.
2. The upward flow through the MBC column experiment has more efficient
direction than the downward regarding nitrate adsorption.
3. Investigated further in-depth within industries concentrations and suitable flow
rates using Minitab software to manage and analyse the result of the randomly
chosen samples was the effect on finding the maximum adsorption condition.
4. Triplicate the sample tests and analysed the results found that the low flow rate
and high concentration performed the best around 0.007 mg NO-3 per g MBC.
However, the intermediate removal at 0.029 mg/g with 10 mg/L and 10 ml/min
for concentration and flow rate respectively. In general, for the MBC
adsorption case the higher the flow the lower performance and higher
concentration the better removal.
5. Working lifetime examined with time and found that the maximum nitrate
adsorption was 3.59 mg after 330 min before the column exhausted and the
LUB was 11.27 cm.
To fairly better assist the usability of MBC for the application of nutrients removal,
further improvement for nitrate removal by MBC using the new technique.
Regeneration and nutrients recovery from saturated MBC will be investigated in the
next chapter.

Applying CDI technique to promote BC removal efficiency Chapter 4
74
CHAPTER 4
Application of the CDI technique to promote contaminant
removal efficiency of MBC
4.1 Introduction
In this chapter, the optimum nitrate removal conditions will be investigated with the
aid of capacitive deionisation (CDI) for further improvement. Biochar regeneration
and nutrient recovery with back-flush deionised water (DI.W) and tap water (TW) and
degaussing technique with DI.W will also be explored in this chapter.
4.2 Materials and Methods
Solution preparation
The same stock solution prepared in section 3.2.1 was used in the experimental
investigation presented in this chapter to prepare the diluted solution with an optimum
concentration of 15 mg/L obtained from section 3.3.3.1.
Preparation of carbon electrode
Carbon was widely used for the CDI application electrode because it has a low contact
resistance, low cost, high electrical conductivity and good process capability (Porada
et al. 2013).
Carbon electrodes were extracted from new Eveready heavy duty battery 6V in this
experiment. The electrodes were cleaned then sterilised with Ethanol (C2H6O) and
covered with copper caps. The electrodes were connected to two power supplies
GwInstek model GPC-3030D and Farnell Stabilised model L30-2.

Applying CDI technique to promote BC removal efficiency Chapter 4
75
Experimental procedure for further adsorption
improvement using CDI
The plastic column prepared in section 3.2.3 was utilised in this experiment. Six holes
were made on two sides of the column for embedding the electrodes into the biochar.
The CDI column setup is presented in Figure 4-1. The three right holes were made at
a distance of 1, 5 and 9 cm from the bottom of the column, while the three left holes
distance from the bottom were 3, 7 and 11 cm, respectively. The column was packed
with 46.3 g of MBC in stages where each electrode was inserted into the column at the
set depth and covered with biochar. A fibreglass screen was laid on top of each layer
to separate them and prevent the transport of nitrate across the layers as shown in
Figure 4-1. Each electrode was glued to the column with commercial silicon to prevent
leakages. The same process was repeated for the rest of the biochar layers and
electrodes. Once the column is packed with MBC and the six carbon electrodes, the
top of the column was covered with doubled fibreglass screen to prevent the MBC
particles to leave with the flow of the solution. The column was closed with two plastic
caps from the bottom and the top. The caps have openings for accommodating the
hosing of the feed and discharge lines as demonstrated in Figure 4-1. The electrodes
were connected to power supply (Farnell, Stabilised power supply L30-2) to provide
each electrode with a voltage of 1.2 V and current of 0.2 A. The applied CDI
parameters were chosen at these levels to avoid the occurrence of some problems such
as the increase of pH and scale deposition on the electrodes (Lee et al., 2010), water
electrolysis near the electrode and reduction energy consumption (Park et al., 2007).

Applying CDI technique to promote BC removal efficiency Chapter 4
76
Inlet Solution
Outlet Solution
Biochar
Screen
Carbon
Electrode
1.00
cm
5.00
9.00
11.0
0
12.0
0
NO-3
Solution
peristaltic pump
Filtered Solution
Power
Supply
+ -
Figure 4-1: MBC column with CDI technique (3cells) for nitrate removal test

Applying CDI technique to promote BC removal efficiency Chapter 4
77
The prepared columns were rinsed with DI.W several times until the leachate pH
settles indicating that the column is clean and ready for the experiments (Inyang et al.
2013) and there is a minimal amount of elements released from the biochar. The
supplied feed solution (prepared in section 4.2.1) was pumped through the column
applying the optimum parameters found in the previous chapter. At the same time, the
power supplies were turned on to start the electro-sorption process. The solution was
single-passed upward through the column for 6 hours and samples were taken at 5, 15,
30, 60, 120, 180, 240, 300 and 360 min to find the best removal timeframe as this
would help the industry in setting the effective operating conditions. Some studies
measured the concentration of effluent at different intervals of a set time to find the
saturation point (Chang et al. 2006). Nitrate removal increase with increasing the
current which may speed up the oxidation-reduction reaction rate at the electrode and
converted to N2 or NH3 gas (Vanlangendonck et al., 2005, Emamjomeh and
Sivakumar, 2005). The equations below show the possible reactions at the cathode
(Paidar et al., 1999).
𝑁𝑂3− + 3𝐻2 𝑂 + 5𝑒− →
1
2 𝑁2 + 6𝑂𝐻− (11)
𝑁𝑂3− + 6𝐻2 𝑂 + 8𝑒− → 𝑁𝐻3 + 9𝑂𝐻− (12)
𝑁𝑂3− + 𝐻2 𝑂 + 2𝑒− → 𝑁𝑂2
− + 2𝑂𝐻− (13)
Applying CDI technique to promote BC removal efficiency Chapter 4
78
Experimental procedure for regeneration and nitrate
recovery using back flush with DI.W and TW
The most common method for regenerating filters is back flush with water through the
filter after the bed is exhausted with contaminants. It is noteworthy that two types for
flushing water were applied in the regeneration step; DI.W for simulating lab
environment and TW for simulating practical real-life application. Flush water was
fed into the column from the bottom in an upward direction as this ensures uniform
contact with MBC as explained in section 3.3.2 with the optimum flow rate of 2 ml/min
was applied in this experiment. Samples were collected after 5, 15, 30, 60, 120, 180,
240, 300 and 360 minutes to check the efficiency of this method for nitrate recovery
with treatment time.
Experimental procedure for regeneration and nitrate
recovery using a degaussing technique with backflush
Another regeneration technique, similar to the degaussing idea used in WWӀӀ, will be
applied for CDI column after saturated with nitrate to remove the ions from the
electrodes and MBC particles. By using Thurlby Thandar Instruments TG215 and set
at frequency100 Hz, volt 7.5 Vp-p and current 0.2 A then connected the negative side
to the first negative electrode and the positive side with the last positive electrode on
the cells in the column as recommended as shown in figure 4-2.

Applying CDI technique to promote BC removal efficiency Chapter 4
79
Inlet D.W
Outlet
Biochar
Screen
Carbon
Electrode
1.0
0cm
5.0
0
9.0
0
11
.00
12
.00
D.W
peristaltic pump
Power Supply
(Generator)
+ -
Nutrient Recovery
Figure 4-2: MBC column with degaussing technique (3cells) for nitrate recovery

Applying CDI technique to promote BC removal efficiency Chapter 4
80
Nitrate removal with the regenerated MBC column
After degaussed the column and recovered nitrate ions in the previous section,
regeneration efficiency will be investigated test in this reabsorptions test. The same
adsorption process explained in 4.2.3 was repeated for the regenerated MBC column
after nitrate was recovered from saturated MBC particles. CDI technique was applied
to the column with three cells to investigate the capability of reabsorption nitrate.
Analytical methods
As explained in section 3.3.4, Ion chromatography ICS-2000 was applied for nitrate
measurements. It worth mentioning that all experiments were conducted in triplicate.

Applying CDI technique to promote BC removal efficiency Chapter 4
81
4.3 Results and discussions
All the results presented in the following sections are expressed in mean values and
the errors are depicted in the form of error bars.
Effect of CDI technique on the MBC adsorption
capability
The difference between the performance of MBC with and without CDI was
investigated in this study and the results for three days are shown in Figures 4-3. Figure
4-3A for the first few minutes showed the removal of MBC presented in mg/L of outlet
concentration around 1.50 mg/L then at 30 minutes became around 3.50 mg/L, while
after added the CDI technique to MBC was at 1.10 after 30 minutes. Which means
adding CDI technique can improve the nitrate removal by three times more than using
MBC alone. Ce/Co was around 0.11 and it became 0.22 after 30 minutes, while with
MBC-CDI nitrate removal was around 0.06 - 0.076 for the same period of time (around
93% of the initial influent concentration 15 mg/L). Similar to the results obtain from
the previous study at 5 mg of nitrate per litre and 150 g of activated carbon then obtain
at equilibrium time after 10 hours around 0.12 mg NO-3/g BC (Erickson et al., 2016).
This study found at 330 min MBC achieved the equilibrium removal rate around 0.03
mg NO-3 per g MBC (section 3.3.4), around 12.50 mg/L effluent concentration, and
with CDI was improved the removal rate and the equilibrium time became at 72 hours
and the effluent concentration was around 12 mg/L (80% of the influent concentration)
as shown in figure 4-3B. In addition, applying CDI increased the removal by 3 times
in comparison to MBC alone after six hours at Ce/Co 0.3 and 0.9 respectively. Studies
investigated the use of electro-assisted biochar technique for nitrate removal by using
column tests seems to be very limited (Nur et al., 2015). The available studies such as
the one conducted by Mahatheva Kalaruban agree with the present study finding as
both witnessed an improvement in nitrate removal (Kalaruban, 2017). However, the
improvement reported by Mahatheva Kalaruban was only about 10%, in this study
around 300% and this could be attributed to the different configurations of the systems
applied.

Applying CDI technique to promote BC removal efficiency Chapter 4
82
The common NO-3 removal mechanisms using BC are functional groups and ion
exchange mechanisms and to the lesser extent the physical adsorption which is highly
influenced by micro-pore volumes and surface area (Chintala et al., 2013, Kameyama
et al., 2012). It is likely that the electrostatic interactions mechanisms are also involved
in the removal in this study as electro-sorption capacity increases with increasing
thermal pyrolysis temperature of biomass material. High temperature leads to higher
graphitisation levels and minimises the electric resistance of the MBC surface and rise
specific surface area (micro-porosity development, see Figure 3-4). As MBC given in
this study was prepared at a high temperature of 1000⁰C (Lado et al., 2016).
In terms of removal mechanisms, the case with CDI can be slightly different as the
electrostatic interaction is the prominent mechanisms. The capacitance of the CDI
electrode was limited, however large surface area of the used BC may have enhanced
the removal efficiency when combined with CDI. High surface area and good mass
transfer were found to be the key points for better adsorption and electro-catalysis
applications and this can explain a higher removal for CDI with MBC compared with
the latter alone as studied by (Dehkhoda et al., 2016, Ahmed and Tewari, 2018).
(A) (B)
Figure 4-3: Nitrate removal by natural MBC vs MBC-CDI for A. six hours and B. three days
0123456789
101112131415
0 6 12 18 24 30 36 42 48 54 60 66 72Time (hr)
MBC
MBC-CDI
IBC
0123456789
101112131415
0 60 120 180 240 300 360
Ou
tlet
Co
nce
ntr
atio
n (
mg
/L)
Time (min)
MBC
MBC-CDI
IBC

Applying CDI technique to promote BC removal efficiency Chapter 4
83
Desorption and nitrates recovery by flushing deionised
water
In this experiment, the capability of backflushing with DI.W on nitrate recovery from
a saturated column was investigated. The flow rate applied was 2 ml/min as
recommended by (Oyarzun et al., 2018). Figure 4-4 shows the results for two cycles
(BF_DI.W_1 and BF_DI.W_2) along the first six hours of the flushing with DI.W
Around 50% of the NO-3 was recovered in the first hour then reduced gradually to the
3 mg/L outlet concentration after six hours. After 24 hours more than 90%
accumulative recovery was achieved at 0.80 mg/L effluent concentration. The results
obtained are in agreement with the reported results by Chintalaet al. (2013) who used
1:50ml saturated materials (corn stover and switchgrass biochar) solid to DI.W ratio
to desorb the nitrate ions then placed the solution into a beaker and shook up for 24
hours then samples filtered, placed in centrifuge tube and tested. This study was found
that desorption increased with increasing the initial concentration of nitrate and after
around one hour more than 90% recovered. Although this method was faster than
desorption in the column with up-flow DI.W, it requires some technology such as
centrifuge device which is not accessible for the general public.

Applying CDI technique to promote BC removal efficiency Chapter 4
84
The results of adsorption and desorption experiments suggest that the adsorption of
nitrate onto MBC is a faster process than desorption. This might be an attractive trait
for MBC in soil amendment application, but it may be regarded as a disadvantage for
MBC in filtration applications. Hence, exploring ways of speeding up the regeneration
and nitrate recovery form MBC is important. This study proposes the use of degaussing
coupled with the backflush for regeneration and nitrate recover which will be
addressed in the following sections.
Figure 4-4: Nitrate recovery by using deionised water
0
1
2
3
4
5
6
7
8
0 30 60 90 120 150 180 210 240 270 300 330 360
Outl
et c
once
ntr
atio
n (
mg/L
)
Time (min)
BF_D.W_1
BF_D.W_2

Applying CDI technique to promote BC removal efficiency Chapter 4
85
Desorption and nitrates recovery using Degaussing with
DI.W
Figure 4-5 presents the comparison between nitrate recoveries with average replicate
degaussing coupled with DI.W backflush and flushed up-ward the DI.W alone. The
experiment of degaussed nitrate from saturated column include MBC particles and
carbon electrodes have resulted in a very similar unsymmetrical shape, with a rapid
nitrate concentration increase for the first 30 minutes, followed by a flatter diminution.
The maximum effluent of nitrate concentration peak was achieved in about 30 min for
all the cycles. For the first cycle, more than 70% recovery at 11 mg/L, while around 6
mg/L for the DI.W in the previous section. For the second and third cycle became
lower at the same time (30 min) at 9 and 7 mg/L. Then for the three cycles start to
decline and the residue nitrate concentration approaches to 2.52, 1.77 and 1.34 mg/L
after six hours for the first, second and third cycles respectively. After 24 hours the
percentage of the nitrate recaptured was very close around 95 and 94% for degaussing
with DI.W and DI.W alone cumulative respectively, but the improvement was notable
within the first hour and that makes the degaussing quicker method and can recover
more nitrate in the same time comparing with DI.W method in section 4.3.2.

Applying CDI technique to promote BC removal efficiency Chapter 4
86
Figure 4-5: Nitrate recovery by using degaussing technique
0
2
4
6
8
10
12
0 60 120 180 240 300 360
Outl
et c
once
ntr
atio
n m
g/L
Time (min)
Deg_Cycle_1
Deg_Cycle_2
Deg_Cycle_3

Applying CDI technique to promote BC removal efficiency Chapter 4
87
Table 4-1: Percentage of desorption using degaussing technique
Time
(min)
Cycle_1 Cycle_2 Cycle_3
Ce(mg/L)
% of
desorption
Ce(mg/L)
% of
desorption
Ce(mg/L)
% of
desorption
0 0 0 0 0 0 0
5 9.03 60 7.27 48 6.32 42
15 10.26 68 8.63 58 7.24 48
30 11.02 73 9.12 61 7.99 53
60 7.54 50 6.99 47 5.39 36
120 4.86 32 4.68 31 3.65 24
180 4.01 27 4.03 27 3.14 21
240 3.35 22 3.27 22 2.02 13
300 2.79 19 2.24 15 1.60 11
360 2.52 17 1.77 12 1.34 9
Table 4-1 shows that the maximum desorption for the first, second and third cycles at
73, 61 and 53% respectively in the first 30 minutes. After six hours the three cycles
become less than 20% at 2.52, 1.77 and 1.34 mg/L for the first, second and third cycles
respectively.

Applying CDI technique to promote BC removal efficiency Chapter 4
88
Tap water used for nitrate recovery
Figure 4-6 shows that the two cycles (T.W_1 and T.W_2) for nitrate recovery used
TW for the first six hours treating time.
Obliviously, the maximum amount of NO-3 recovered between the first and the second
hours by using TW with around 40% for the first cycle, while around 25% for the
second cycle. Then the first and second cycles decreased to around 3 and 2.8 mg/L
effluent concentration after six hours at 20% of desorption. However, after 24 hours
the differences between the two cycles became very close at 2.11 and 2.19 mg/L for
the first and second respectively. Although the rare study used TW for nutrients
recovery, a previous study used a column saturated with lead (Pb) and obtained 22%
recovery with a flow rate 25 ml/min and 20 mg/L concentration (Dimitrova, 2002).
Despite the previous study was used hi flow rate and concentration compared to the
new study with a different ion, higher percentage obtained for nitrate recovery using
the same technique in a similar period.
Figure 4-6: Tap water used for desorption nitrate ions
0
1
2
3
4
5
6
7
8
0 30 60 90 120 150 180 210 240 270 300 330 360
Outl
et c
on
cen
trat
ion
mg/L
Time (min)
T.W_1
T.W_2

Applying CDI technique to promote BC removal efficiency Chapter 4
89
To get a better understanding of the performance of the applied recovery techniques
used in this study, Nitrate recovery with all three techniques was plotted and presented
in figure 4-7. First of all, the three techniques were worked well and recovered nitrate
ions after column saturated. The degaussing technique with DI.W was the most
powerful method founded due to the ability to recover more nitrate ions in efficient
time, while TW was the lowest. the maximum nitrate recovery occurred around 30
minutes, around 70% of nitrate was recovered at 11 mg/L effluent concentration for
the degaussing method, while DI.W was around 48% after one hour and comparing to
the TW one was around 35% at 5.3 mg/L outlet concentration. Then the curves started
to decline after 30 minutes and one hour for the degaussing and the both DI.W and
TW respectively. After the second hours, nitrate concentration in the outlet flow was
very close for all recovery techniques around 5 mg/L, then continue to descend to
about 3 mg/L after the sixth hours at 20%.
A study of desorption nitrate from saturated woodchips with nitrate ions used 400 ml
of 0.001M KCL solution and placed on the shaker after rinsed the samples with Nano-
pure water three times. Samples taken after six hours showed that around 60%
desorbed from the woodchips then after three days decreased to zero per cent and will
be ready to reuse the filter (Hua et al., 2016). Mostly regenerated the filters and
nutrients recovery were used chemicals in the process, while a present study conducted
0
2
4
6
8
10
12
0 30 60 90 120 150 180 210 240 270 300 330 360
Eff
luen
t co
nce
ntr
atio
n m
g/L
Time (min)
Deg_Cycle_1
D.W_Cycle_1
T.W_Cycle_1
Figure 4-7: Three techniques used for nitrate recovery

Applying CDI technique to promote BC removal efficiency Chapter 4
90
to be chemical free and environmentally friendly with or without a small amount of
energy (1.2 V). Although some studies used the chemical in the recovery process, the
results obtained in this study were better at around 75% recovery after six hours.
Nitrate removal with regenerated filter
After the completion of desorption tests, the reusability of the filter for nitrate removal
was examined. Figure 4-8 presents the results of nitrate removal used fresh CDI and
MBC filter with two regenerated filters after desorption process used the degaussing
technique with DI.W process. The results presented NO-3 effluent was increased by
around doubled for the second regeneration filter comparing with the fresh filter within
the first 30 min. Outlet concentration of nitrate was increased after six hours at 4.5, 8.2
and 9.6 mg/L for the fresh, regeneration one and two respectively. After 36 hours, the
trend of the three methods were close to each other at around 10.5 mg/L of nitrate
effluent concentration. The effluent nitrate concentration at full bed exhaustion
(around 80% removal efficiency) was at 72, 60 and 48 hours for the fresh, regenerated
one and regenerated two filters. That means the capability of reusing the filter for
removal nitrate after used the degaussing method was successful.

Applying CDI technique to promote BC removal efficiency Chapter 4
91
(A) (B)
This proves that the MBC filter can effectively be reused for nitrate removal at least
three times after the degaussing with DI.W was used to recover nitrate ions which can
practically be used as fertiliser at the same time regenerate the filter.
The results obtained in this study are in line with the trends reported in the literature.
Cui et al. (2019) found that regenerating biochar synthesized with chitosan and FeCl3
(LC-CF) saturated with nitrate using 0.1 M NaCl resulted in a slight declined in
adsorption (Cui et al., 2019). This decline continued and reached about 5% as opposed
to fresh biochar after the fifth cycle. Although the previous study used some chemical
during sorption and desorption process, a present technique applied in this study has
zero usage of chemicals during the adsorption and desorption process and this makes
it more reliable and environmentally friendly.
0
1
2
3
4
5
6
7
8
9
10
11
0 60 120 180 240 300 360
Ou
tlet
Co
nce
ntr
atio
n (
mg/L
)
Time (min)
CDI_FreshCDI_Reg_1CDI_Reg_2
0
2
4
6
8
10
12
14
0 12 24 36 48 60 72
Time (hour)
CDI_FreshCDI_Reg_1CDI_Reg_2
Figure 4-8: Nitrate removal by fresh and regeneration filter of MBC with CDI A. six & B. 72 hours
Applying CDI technique to promote BC removal efficiency Chapter 4
92
4.4 Economic Analysis
Production of MBC (as a by-product) or other similar feedstock, can be used in a
gasification process to primarily provide energy, approximately 9MJ/kg, as well as
making high quality char at negligible cost. Alternatively, it is possible to purchase
commercially available, activated carbon (coconut biochar) for around $3000/Tonne.
In the case of using MBC the calculations will be as below:
Removal rate analysis:
Given: after 48 hours was achieved around 95% nitrate removal, this implies
14.25 mg/L was adsorbed from the 5.76 L of stock solution at an original
concentration of 15mg/L.
This gives a total of 82.1mg of nitrate absorbed by 46.3gr of MBC, giving an
overall removal rate of 1.77g of nitrate / kg of MBC using CDI.
Similarly, without CDI being used, MBC showed an overall removal rate
before the bed exhausted was 0.029g / kg of MBC.
-For MBC-CDI adsorption technique:
𝑃𝑜𝑤𝑒𝑟 = 0.2𝐴 × 1.2𝑉 = 0.24𝑊
48ℎ𝑟 × 0.24𝑊 = 11.25𝑊. ℎ𝑟
𝐸𝑛𝑒𝑟𝑔𝑦 = 11.25𝑊. ℎ𝑟 × 3600𝐽 = 41.47𝐽
At Queensland energy price = $0.27kW.hr
𝐸𝑛𝑒𝑟𝑔𝑦 𝑐𝑜𝑠𝑡 = 11.25𝑊. ℎ𝑟 ×$0.00027
(𝑊. ℎ𝑟)= $0.00311 𝐴𝑈𝑆
Or, the cost of using the MBC-CDI technique to adsorb 95% of nitrate in solution is
around $1.76/kg nitrate removed from solution (assuming linear scalability).
-For degaussing technique calculation:
𝑃𝑜𝑤𝑒𝑟 = 0.062𝐴 × 0.5𝑉 = 0.03𝑊
6ℎ𝑟 × 0.03𝑊 = 0.18 𝑊. ℎ𝑟
𝐸𝑛𝑒𝑟𝑔𝑦 𝑐𝑜𝑠𝑡 = 0.18𝑊. ℎ𝑟 ×$0.00027
𝑊. ℎ𝑟= $0.000486𝐴𝑈𝑆
The cost of using degaussing technique for 6hr to refresh more that 85% of saturated
column of biochar with nitrate solution of 15mgL.

Applying CDI technique to promote BC removal efficiency Chapter 4
93
Giving an energy cost of $0.00105/kg char used to refresh 85% of the capacity.
4.5 Chapter summary
Using CDI technique to enhance MBC column capability to remove nitrate was
investigated in this chapter. Desorption NO-3 after saturated the column test by using
DI.W and TW alone as well as degaussing technique with DI.W was examined above.
The experimental outcomes for this chapter epitomised below:
1. CDI with MBC has more efficient in terms of removal nitrate comparing with
MBC by itself around 12 mg/L outlet of nitrate concentration (full bed
exhaustion) at 72 hours and 330 minutes respectively.
2. Regards the desorption process, degaussing with DI.W (three cycles) is the
most effective method in terms of quantity and rapidity comparing to DI.W
flush and TW flush (two cycles). The differences in the efficiency of desorption
NO-3 between degaussing technique and the two others at the first 30 minutes
was around 70, 40 and 30%, while after six hours became around 3 mg/L for
the nitrate effluent concentration for all three techniques.
3. After desorbing nitrate from the saturated column, the regeneration process
aimed to reuse the same CDI technique with MBC column filter found that the
results for the fresh column at the first hour was around 91% removal then 80%
and 70% for the regenerated one and two respectively. The differences between
the fresh and the regenerated filter were about 5% for the first hour and after
24 hours. The full bed exhausted after 72, 60 and 48 hours for the fresh,
regenerated one and two respectively.
4. To conclude this chapter, using CDI technique with MBC was improving the
removal capability in terms of nitrate ions at the same time improving the
regeneration process after degaussing with DI.W technique was presented
confidant results for three cycles. Desorption through the degaussing was the
best in terms of the amount of nitrate recovered in less time.

Conclusion and future work Chapter 5
94
CHAPTER 5
Conclusions and future work
Many techniques designed to reduce agricultural run-off have been suggested by a
large number of researchers, including constructed wetlands, filtration, aeration, algae
and the woodchip bioreactors. As demonstrated in Chapter 2, most of these suggested
techniques have shortcomings that restrict their practical implementation on-farm.
Biochar filters offer an effective improvement of water quality, through its potential
to remove nutrient contaminants from agricultural runoff before they enter the riparian
zone. However, BC suffers from rapid saturation which, in turn, diminishes its
performance capability and increases operational costs. In this study, capacitive
deionisation technologies have been proposed, as a new treatment technique to reduce
contamination and increase the effectiveness of multi-media based BC filters, whilst
also allowing filter regeneration and reclamation of the nutrients.
The experimental results presented in Chapter 3 show that the higher pyrolysis
temperature (1000°C) increased nitrate removal at 0.1 mg/ g MBC by approximately
double the 900°C pyrolyzed MBC. Nitrate was used in this study as a sample
contaminant that exists normally in agriculture runoff. These results are supported by
the SEM and FTIR analysis which showed that the 1000°C MBC is more effective
than the 900°C MBC, due to higher levels of activation. In addition, the up-flow
column approach was five times more effective than the down-flow column after a 30
minute interval. For the design of the experiment, three concentrations and flow rates
were analysed. The highest removal was achieved with the highest concentration and
lowest flow rate, and these conditions were chosen for the subsequent experiment
which tested for a greater removal capability around 6.75 mg/L. Moreover, working
lifetime of BC was examined within three days, and maximum nitrate adsorption was
found to be 3.59 mg after 5.5hrs before the column was exhausted. At this point, the
LUB was 11.27 cm.
The experimental results presented in Chapter 4 confirm that the CDI technique further
enhances macadamia biochar nitrate removal by three times compared to the natural
ability of the char after six hours. The breakthrough curve was found to be after 5.5hrs
and 72 hrs for the natural MBC and CDI enhanced MBC filters, respectively.

Conclusion and future work Chapter 5
95
Replication with other char types is required to make general statements, however this
result alone is certainly promising.
Desorption experiment evaluated three techniques (degaussing, deionised water and
tap water backflush). The peak nitrate desorption of 80% was achieved after 30
minutes with the degaussing method, as opposed to 48%, and 35% after 60 mins
respectively for the back-flush with deionised water/tap water approaches.
Regeneration of the filter after saturation with nitrate ions was tested for three cycles
and filter exhaustion time was subsequently found to be after 72, 60 and 48 hours for
the fresh filter, 1st regeneration and 2nd regenerations respectively.
Economic analysis for MBC or other feedstock can be used in a gasification process
to make the char effectively for free and provide energy approximately 9MJ/kg,
alternatively you can buy a commercial activated biochar (coconut biochar) for $4/kg
by tonne.
Overall, this study concludes that CDI combined with MBC particles can be used as
an effective treatment technique to reduce contamination from agricultural runoff in
terms of nitrate ions by enhancing removal, desorption and filter regeneration.
However, the following points are recommended for future work:
1. The effect of the pyrolysis temperatures on nitrate removal using natural MBC
2. The effect of electrical factors such as voltages and frequency on improving
removal, desorption and filter regeneration using the MBC with CDI
technique.
3. Comparison of the degaussing method with other innovative techniques such
as ultrasonic.

References
96
References
ABDEL-RAOUF, N., AL-HOMAIDAN, A. A. & IBRAHEEM, I. B. M. 2012.
Microalgae and wastewater treatment. Saudi Journal of Biological Sciences,
19, 257-275.
AHMAD, M., LEE, S. S., DOU, X., MOHAN, D., SUNG, J.-K., YANG, J. E. &
OK, Y. S. 2012. Effects of pyrolysis temperature on soybean stover-and
peanut shell-derived biochar properties and TCE adsorption in water.
Bioresource technology, 118, 536-544.
AHMAD, M., RAJAPAKSHA, A. U., LIM, J. E., ZHANG, M., BOLAN, N.,
MOHAN, D., VITHANAGE, M., LEE, S. S. & OK, Y. S. 2014. Biochar as a
sorbent for contaminant management in soil and water: a review.
Chemosphere, 99, 19-33.
AHMED, M. A. & TEWARI, S. 2018. Capacitive deionization: Processes, materials
and state of the technology. Journal of Electroanalytical Chemistry.
AL-JUBOORI, R. A., ARAVINTHAN, V. & YUSAF, T. 2015. Impact of pulsed
ultrasound on bacteria reduction of natural waters. Ultrasonics
sonochemistry, 27, 137-147.
AL-SHUJAIRI, S. 2013. Develop and apply water quality index to evaluate water
quality of Tigris and Euphrates Rivers in Iraq. International Journal of
Modern Engineering Research, 3, 2119-2126.
ALHASHIMI, H. A. & AKTAS, C. B. 2017. Life cycle environmental and economic
performance of biochar compared with activated carbon: A meta-analysis.
Resources, Conservation and Recycling, 118, 13-26.
ALLRED, B. J. 2017. Batch test screening of industrial product/byproduct filter
materials for agricultural drainage water treatment. Water, 9, 791.
ANDERSEN, R. A. 2005. Algal culturing techniques, Elsevier.
ANDERSON, M. A., CUDERO, A. L. & PALMA, J. 2010. Capacitive deionization
as an electrochemical means of saving energy and delivering clean water.
Comparison to present desalination practices: Will it compete?
Electrochimica Acta, 55, 3845-3856.
ASTROM, G. 1999. Method and apparatus for cleaning filter material in a filter
apparatus utilizing a suction generating nozzle. Google Patents.

References
97
ATKINSON, C. J., FITZGERALD, J. D. & HIPPS, N. A. 2010. Potential
mechanisms for achieving agricultural benefits from biochar application to
temperate soils: a review. Plant and soil, 337, 1-18.
AWAD, Y. M., BLAGODATSKAYA, E., OK, Y. S. & KUZYAKOV, Y. 2012.
Effects of polyacrylamide, biopolymer, and biochar on decomposition of soil
organic matter and plant residues as determined by 14 C and enzyme
activities. European Journal of Soil Biology, 48, 1-10.
BAITIMIROVA, M., KATKEVICS, J., BAUMANE, L., BAKIS, E. & VIKSNA, A.
Characterization of functional groups of airborne particulate matter. IOP
Conference Series: Materials Science and Engineering, 2013. IOP Publishing,
012025.
BALLANTINE, D. J. & TANNER, C. C. 2010. Substrate and filter materials to
enhance phosphorus removal in constructed wetlands treating diffuse farm
runoff: a review. New Zealand Journal of Agricultural Research, 53, 71-95.
BLANCHFIELD, D. S. 2011. Water treatment. In: BLANCHFIELD, D. S. (ed.)
Environmental Encyclopedia. Detroit: Gale.
BOLAN, N. S., KUNHIKRISHNAN, A., CHOPPALA, G., THANGARAJAN, R. &
CHUNG, J. 2012. Stabilization of carbon in composts and biochars in
relation to carbon sequestration and soil fertility. Science of the Total
Environment, 424, 264-270.
BOLAN, N. S., WONG, L. & ADRIANO, D. 2004. Nutrient removal from farm
effluents. Bioresource technology, 94, 251-260.
BORNEMANN, L. C., KOOKANA, R. S. & WELP, G. 2007. Differential sorption
behaviour of aromatic hydrocarbons on charcoals prepared at different
temperatures from grass and wood. Chemosphere, 67, 1033-1042.
BOUBAKRI, A., HELALI, N., TLILI, M. & AMOR, M. B. 2014. Fluoride removal
from diluted solutions by Donnan dialysis using full factorial design. Korean
Journal of Chemical Engineering, 31, 461-466.
BOURAOUI, F. & GRIZZETTI, B. 2014. Modelling mitigation options to reduce
diffuse nitrogen water pollution from agriculture. Science of the Total
Environment, 468, 1267-1277.
BOYLE, W. C. 2002. A Brief History of Aeration of Wastewater. Environmental
and Water Resources History.
BROWNING, P., GONG, M., HU, T., MARX, C. & NATAKE, T. 2014. Water
Pollution Mitigation through Constructed Wetland [Online]. Duke
University-USA. Available: https://sites.duke.edu/mpecosystem/scoring-

References
98
matrix/chemical-manufacturing-industry/water-pollution-mitigation/
[Accessed 2017].
BURNS, K. J. 2014. The Effects of Biochar Additions on Soil Structure and Changes
to Aged Biochar Particles in Soil. University of Western Australia.
BUTTERWORTH, E., DOTRO, G., JONES, M., RICHARDS, A., ONUNKWO, P.,
NARROWAY, Y. & JEFFERSON, B. 2013. Effect of artificial aeration on
tertiary nitrification in a full-scale subsurface horizontal flow constructed
wetland. Ecological engineering, 54, 236-244.
CALHEIROS, C. S., QUITÉRIO, P. V., SILVA, G., CRISPIM, L. F., BRIX, H.,
MOURA, S. C. & CASTRO, P. M. 2012. Use of constructed wetland systems
with Arundo and Sarcocornia for polishing high salinity tannery wastewater.
Journal of environmental management, 95, 66-71.
CARPENTER, S. R., CARACO, N. F., CORRELL, D. L., HOWARTH, R. W.,
SHARPLEY, A. N. & SMITH, V. H. 1998. Nonpoint pollution of surface
waters with phosphorus and nitrogen. Ecological applications, 8, 559-568.
CHANCE, L. M. G. & WHITE, S. A. 2018. Aeration and plant coverage influence
floating treatment wetland remediation efficacy. Ecological engineering, 122,
62-68.
CHINTALA, R., MOLLINEDO, J., SCHUMACHER, T. E., PAPIERNIK, S. K.,
MALO, D. D., CLAY, D. E., KUMAR, S. & GULBRANDSON, D. W. 2013.
Nitrate sorption and desorption in biochars from fast pyrolysis. Microporous
and Mesoporous Materials, 179, 250-257.
CHONG, M. N., JIN, B., CHOW, C. W. & SAINT, C. 2010. Recent developments in
photocatalytic water treatment technology: a review. Water research, 44,
2997-3027.
CHOUDHURY, T. 2017. Woodchip Biofilters for Treatment of Particulate
Phosphorus in Agricultural Runoff. University of Waterloo.
CHRISTENSON, L. & SIMS, R. 2011. Production and harvesting of microalgae for
wastewater treatment, biofuels, and bioproducts. Biotechnology advances, 29,
686-702.
CHRISTIANSON, L. 2016. Reducing water pollution with microbes and wood chips
[Online]. The Conversation. Available: https://theconversation.com/reducing-
water-pollution-with-microbes-and-wood-chips-58852 [Accessed].
CHRISTIANSON, L. E. 2011. Design and performance of denitrification bioreactors
for agricultural drainage.

References
99
CHRISTIANSON, L. E. & HELMERS, M. J. 2011. Woodchip bioreactors for nitrate
in agricultural drainage.
CLARK, P. A., PINEDO, C. A., FADUS, M. & CAPUZZI, S. 2012. Slow-sand
water filter: Design, implementation, accessibility and sustainability in
developing countries. Medical science monitor: international medical journal
of experimental and clinical research, 18, RA105.
COATES, J. 2000. Interpretation of infrared spectra, a practical approach.
Encyclopedia of analytical chemistry, 12, 10815-10837.
CONSERVATION, E. 2007. Wastewater Management Fact Sheet.
CRAGGS, R., SUTHERLAND, D. & CAMPBELL, H. 2012. Hectare-scale
demonstration of high rate algal ponds for enhanced wastewater treatment
and biofuel production. Journal of Applied Phycology, 24, 329-337.
CUI, X., LI, H., YAO, Z., SHEN, Y., HE, Z., YANG, X., NG, H. Y. & WANG, C.-
H. 2019. Removal of nitrate and phosphate by chitosan composited beads
derived from crude oil refinery waste: Sorption and cost-benefit analysis.
Journal of Cleaner Production, 207, 846-856.
DAVIS, A. P., SHOKOUHIAN, M., SHARMA, H. & MINAMI, C. 2001.
Laboratory study of biological retention for urban stormwater management.
Water Environment Research, 73, 5-14.
DEHKHODA, A. M., GYENGE, E. & ELLIS, N. 2016. A novel method to tailor the
porous structure of KOH-activated biochar and its application in capacitive
deionization and energy storage. Biomass and Bioenergy, 87, 107-121.
DEMPSTER, D. N., GLEESON, D. B., SOLAIMAN, Z. M., JONES, D. L. &
MURPHY, D. V. 2012. Decreased soil microbial biomass and nitrogen
mineralisation with Eucalyptus biochar addition to a coarse textured soil.
Plant and Soil, 354, 311-324.
DIMITROVA, S. 2002. Use of granular slag columns for lead removal. Water
Research, 36, 4001-4008.
DIONEX 2006. ICS-2000 ION CHROMATOGRAPHY SYSTEM OPERATOR’S
MANUAL.
DONG, X., MA, L. Q. & LI, Y. 2011. Characteristics and mechanisms of hexavalent
chromium removal by biochar from sugar beet tailing. Journal of hazardous
materials, 190, 909-915.

References
100
EBRAHIMI-GATKASH, M., YOUNESI, H., SHAHBAZI, A. & HEIDARI, A.
2017. Amino-functionalized mesoporous MCM-41 silica as an efficient
adsorbent for water treatment: batch and fixed-bed column adsorption of the
nitrate anion. Applied Water Science, 7, 1887-1901.
EL HAWARY, M. E. 1986. Principles of electric machines with power electronic
applications.
EMAMJOMEH, M. & SIVAKUMAR, M. 2005. Electrocoagulation (EC) technology
for nitrate removal.
ENGINEERS, J. M. M. C. 1985. Water treatment principles and design. Water
treatment principles and design.
ERICKSON, A. J., GULLIVER, J. S., ARNOLD, W. A., BREKKE, C. & BREDAL,
M. 2016. Abiotic capture of stormwater nitrates with granular activated
carbon. Environmental Engineering Science, 33, 354-363.
FÄRM, C. 2002a. Metal sorption to natural filter substrates for storm water
treatment—column studies. Science of the total environment, 298, 17-24.
FÄRM, C. 2002b. Metal sorption to natural filter substrates for storm water
treatment—column studies. Science of the total environment, 298, 17-24.
FLETCHER, T. & DELETIC, A. 2007. Statistical evaluation and optimisation of
stormwater quality monitoring programmes. Water Science and Technology,
56, 1-9.
GAWLOWICZ, S. 2011. The Green Machine: Algae Clean Wastewater, Convert to
Biodiesel
RIT researchers take algae out of the lab [Online]. USA: Rochester Institute of
Technology. Available: https://www.rit.edu/news/story.php?id=48113
[Accessed].
GHOSAL, S. & AVASTHI, A. S. 2018. Fundamentals of bioanalytical techniques
and instrumentation, PHI Learning Pvt. Ltd.
GLASER, B., HAUMAIER, L., GUGGENBERGER, G. & ZECH, W. 2001.
The'Terra Preta'phenomenon: a model for sustainable agriculture in the
humid tropics. Naturwissenschaften, 88, 37-41.
GÓMEZ-PASTORA, J., DOMINGUEZ, S., BRINGAS, E., RIVERO, M. J., ORTIZ,
I. & DIONYSIOU, D. D. 2017. Review and perspectives on the use of
magnetic nanophotocatalysts (MNPCs) in water treatment. Chemical
Engineering Journal, 310, 407-427.

References
101
HAFSHEJANI, L. D., HOOSHMAND, A., NASERI, A. A., MOHAMMADI, A. S.,
ABBASI, F. & BHATNAGAR, A. 2016. Removal of nitrate from aqueous
solution by modified sugarcane bagasse biochar. Ecological Engineering, 95,
101-111.
HAN, Y., BOATENG, A. A., QI, P. X., LIMA, I. M. & CHANG, J. 2013. Heavy
metal and phenol adsorptive properties of biochars from pyrolyzed
switchgrass and woody biomass in correlation with surface properties.
Journal of environmental management, 118, 196-204.
HARVEY, O. R., HERBERT, B. E., RHUE, R. D. & KUO, L.-J. 2011. Metal
interactions at the biochar-water interface: energetics and structure-sorption
relationships elucidated by flow adsorption microcalorimetry. Environmental
science & technology, 45, 5550-5556.
HATT, B. E., FLETCHER, T. D. & DELETIC, A. 2009. Hydrologic and pollutant
removal performance of stormwater biofiltration systems at the field scale.
Journal of Hydrology, 365, 310-321.
HAUSTEIN, C. H. 2014. Oxidation-reduction reaction. In: LERNER, K. L. &
LERNER, B. W. (eds.) The Gale Encyclopedia of Science. 5th ed. ed.
Farmington Hills, MI: Gale.
HAVERSTOCK, M., MADANI, A., BALDÉ, H., VANDERZAAG, A. &
GORDON, R. 2017. Performance of an Agricultural Wetland-Reservoir-
Irrigation Management System. Water, 9, 472.
HEALY, M. G., RODGERS, M. & MULQUEEN, J. 2007. Treatment of dairy
wastewater using constructed wetlands and intermittent sand filters.
Bioresource technology, 98, 2268-2281.
HEISTAD, A., PARUCH, A. M., VRÅLE, L., ADAM, K. & JENSSEN, P. D. 2006.
A high–performance compact filter system treating domestic wastewater.
Ecological Engineering, 28, 374-379.
HIGMAN, C. & BURGT, M. V. D. 2008. Gasification, Burlington, UNITED
STATES, Elsevier Science.
HOOVER, N. L., BHANDARI, A., SOUPIR, M. L. & MOORMAN, T. B. 2016.
Woodchip denitrification bioreactors: Impact of temperature and hydraulic
retention time on nitrate removal. Journal of environmental quality, 45, 803-
812.
HOWELL, J., CHUA, H. & ARNOT, T. 2004. In situ manipulation of critical flux in
a submerged membrane bioreactor using variable aeration rates, and effects
of membrane history. Journal of Membrane Science, 242, 13-19.

References
102
HUA, G., SALO, M. W., SCHMIT, C. G. & HAY, C. H. 2016. Nitrate and
phosphate removal from agricultural subsurface drainage using laboratory
woodchip bioreactors and recycled steel byproduct filters. Water research,
102, 180-189.
HUANG, J., RENEAU JR, R. & HAGEDORN, C. 2000. Nitrogen removal in
constructed wetlands employed to treat domestic wastewater. Water
Research, 34, 2582-2588.
INYANG, M., GAO, B., ZIMMERMAN, A., ZHANG, M. & CHEN, H. 2014.
Synthesis, characterization, and dye sorption ability of carbon nanotube–
biochar nanocomposites. Chemical Engineering Journal, 236, 39-46.
INYANG, M. I., GAO, B., YAO, Y., XUE, Y., ZIMMERMAN, A., MOSA, A.,
PULLAMMANAPPALLIL, P., OK, Y. S. & CAO, X. 2016. A review of
biochar as a low-cost adsorbent for aqueous heavy metal removal. Critical
Reviews in Environmental Science and Technology, 46, 406-433.
IPPOLITO, J., STRAWN, D., SCHECKEL, K., NOVAK, J., AHMEDNA, M. &
NIANDOU, M. 2012. Macroscopic and molecular investigations of copper
sorption by a steam-activated biochar. Journal of environmental quality, 41,
1150-1156.
JAMIESON, T. S., STRATTON, G. W., GORDON, R. & MADANI, A. 2003. The
use of aeration to enhance ammonia nitrogen removal in constructed
wetlands. Canadian Biosystems Engineering / Le Genie des biosystems au
Canada, 45, 1.9-1.14.
JOSEPH, S., PEACOCKE, C., LEHMANN, J. & MUNROE, P. 2009. Developing a
biochar classification and test methods. Biochar for environmental
management: science and technology, 1, 107-126.
KADLEC, R. H. & WALLACE, S. 2008. Treatment wetlands, CRC press.
KALARUBAN, M. 2017. Nitrate removal from water using surface-modified
adsorbents.
KAMEYAMA, K., MIYAMOTO, T., IWATA, Y. & SHIONO, T. 2016. Influences
of feedstock and pyrolysis temperature on the nitrate adsorption of biochar.
Soil Science and Plant Nutrition, 62, 180-184.
KAMEYAMA, K., MIYAMOTO, T., SHIONO, T. & SHINOGI, Y. 2012. Influence
of sugarcane bagasse-derived biochar application on nitrate leaching in
calcaric dark red soil. Journal of Environmental Quality, 41, 1131-1137.

References
103
KARUNARATHNE, H. & AMARASINGHE, B. 2013. Fixed bed adsorption
column studies for the removal of aqueous phenol from activated carbon
prepared from sugarcane bagasse. Energy Procedia, 34, 83-90.
KEILUWEIT, M., NICO, P. S., JOHNSON, M. G. & KLEBER, M. 2010. Dynamic
molecular structure of plant biomass-derived black carbon (biochar).
Environmental science & technology, 44, 1247-1253.
KNOWLES, P. 2012. Clogging in horizontal subsurface flow constructed wetlands.
Aston University.
KO, J.-Y., DAY, J. W., LANE, R. R. & DAY, J. N. 2004. A comparative evaluation
of money-based and energy-based cost–benefit analyses of tertiary municipal
wastewater treatment using forested wetlands vs. sand filtration in Louisiana.
Ecological Economics, 49, 331-347.
KRÖPFELOVÁ, L. 2008. Wastewater treatment in constructed wetlands with
horizontal subsurface flow, 14. Springer.
KUMAR, D. & GAUR, J. 2011. Metal biosorption by two cyanobacterial mats in
relation to pH, biomass concentration, pretreatment and reuse. Bioresource
technology, 102, 2529-2535.
LABELLA, A., CANIANI, D., HUGHES-RILEY, T., MORRIS, R. H., NEWTON,
M. I., HAWES, P., PUIGAGUT, J., GARCÍA, J. & UGGETTI, E. 2015.
Assessing the economic suitability of aeration and the influence of bed
heating on constructed wetlands treatment efficiency and life-span.
Ecological Engineering, 83, 184-190.
LADO, J. J., ZORNITTA, R. L., CALVI, F. A., TEJEDOR-TEJEDOR, M. I.,
ANDERSON, M. A. & RUOTOLO, L. A. 2016. Study of sugar cane bagasse
fly ash as electrode material for capacitive deionization. Journal of analytical
and applied pyrolysis, 120, 389-398.
LANNAN, E. 2011. Scale-up of algae growth system to cleanse wastewater and
produce oils for biodiesel production. Rochester Institute of Technology.
LE, L. T. T. 2017. Removal of Phosphorus in Agricultural Run-off Water by
Utilization of Lignocellulosic Biomass Filters: utilization of common reed as
an adsorbent.
LEACH, A. M., GALLOWAY, J. N., BLEEKER, A., ERISMAN, J. W., KOHN, R.
& KITZES, J. 2012. A nitrogen footprint model to help consumers
understand their role in nitrogen losses to the environment. Environmental
Development, 1, 40-66.

References
104
LEE, J.-H., BAE, W.-S. & CHOI, J.-H. 2010. Electrode reactions and
adsorption/desorption performance related to the applied potential in a
capacitive deionization process. Desalination, 258, 159-163.
LEE, R. E. 2008. Phycology, Cambridge University Press.
LEHMANN, J. 2007. Bio‐energy in the black. Frontiers in Ecology and the
Environment, 5, 381-387.
LI, S. & CHEN, G. 2018. Thermogravimetric, thermochemical, and infrared spectral
characterization of feedstocks and biochar derived at different pyrolysis
temperatures. Waste Management, 78, 198-207.
LIMA, I. M., BOATENG, A. A. & KLASSON, K. T. 2010. Physicochemical and
adsorptive properties of fast‐pyrolysis bio‐chars and their steam activated
counterparts. Journal of chemical technology and biotechnology, 85, 1515-
1521.
LIU, H., SUN, X., YIN, C. & HU, C. 2008. Removal of phosphate by mesoporous
ZrO2. Journal of hazardous materials, 151, 616-622.
LOPEZ-PONNADA, E. V., LYNN, T. J., PETERSON, M., ERGAS, S. J. &
MIHELCIC, J. R. 2017. Application of denitrifying wood chip bioreactors for
management of residential non-point sources of nitrogen. Journal of
Biological Engineering, 11, 16.
LUEDERITZ, V., ECKERT, E., LANGE-WEBER, M., LANGE, A. & GERSBERG,
R. M. 2001. Nutrient removal efficiency and resource economics of vertical
flow and horizontal flow constructed wetlands. Ecological Engineering, 18,
157-171.
MA, Z. 2017. Characterization of Biomass Materials for Understanding the
Processing.
MACDONALD, L., WILLIAMS, M., OLIVER, D. & KOOKANA, R. 2015.
Biochar and hydrochar as low-cost sorbents for removing contaminants from
water. Water: Journal of the Australian Water Association, 42, 142.
MAJOR, J., LEHMANN, J., RONDON, M. & GOODALE, C. 2010. Fate of soil‐
applied black carbon: downward migration, leaching and soil respiration.
Global Change Biology, 16, 1366-1379.
MANDAL, S., THANGARAJAN, R., BOLAN, N. S., SARKAR, B., KHAN, N.,
OK, Y. S. & NAIDU, R. 2016. Biochar-induced concomitant decrease in
ammonia volatilization and increase in nitrogen use efficiency by wheat.
Chemosphere, 142, 120-127.

References
105
MAROUŠEK, J., VOCHOZKA, M., PLACHÝ, J. & ŽÁK, J. 2017. Glory and
misery of biochar. Clean Technologies and Environmental Policy, 19, 311-
317.
MARTIN, C. H. 1927. Biological studies of two hymenopterous parasites of aquatic
insect eggs, Science Press.
MATEO-SAGASTA, J., ZADEH, S. M., TURRAL, H. & BURKE, J. 2017. Water
pollution from agriculture: a global review. Executive summary, Rome, Italy:
FAO Colombo, Sri Lanka: International Water Management Institute
(IWMI). CGIAR Research Program on Water, Land and Ecosystems (WLE).
MEFFE, R., DE MIGUEL, Á., HERNÁNDEZ, V. M., LILLO, J. & DE
BUSTAMANTE, I. 2016. Soil amendment using poplar woodchips to
enhance the treatment of wastewater-originated nutrients. Journal of
environmental management, 180, 517-525.
MEYER, S., GLASER, B. & QUICKER, P. 2011. Technical, economical, and
climate-related aspects of biochar production technologies: a literature
review. Environmental science & technology, 45, 9473-9483.
MOHAN, D., SARSWAT, A., OK, Y. S. & PITTMAN, C. U. 2014. Organic and
inorganic contaminants removal from water with biochar, a renewable, low
cost and sustainable adsorbent–a critical review. Bioresource technology,
160, 191-202.
MONTGOMERY, D. 2013. Design and analysis of experiments, USA, SAS
Institute.
MOORMAN, T. B., PARKIN, T. B., KASPAR, T. C. & JAYNES, D. B. 2010.
Denitrification activity, wood loss, and N 2 O emissions over 9 years from a
wood chip bioreactor. Ecological engineering, 36, 1567-1574.
MYERS, R. L. 2015. Treatment of Agricultural Stormwater Runoff by a Cascading
System of Floodway Stormwater Containment Basins.
NAVARRO-ORTEGA, A., ACUÑA, V., BELLIN, A., BUREK, P., CASSIANI, G.,
CHOUKR-ALLAH, R., DOLÉDEC, S., ELOSEGI, A., FERRARI, F. &
GINEBREDA, A. 2015. Managing the effects of multiple stressors on aquatic
ecosystems under water scarcity. The GLOBAQUA project. Science of the
Total Environment, 503, 3-9.
NICK, T. 2018. Benefits of Biochar and its Applications for Runoff Water
Management: Literature Review and Laboratory Report.
NSWPRIMEFACT. 2014. Farm water quality and treatment [Online]. NSW:
Department of Primary Industries. Available:

References
106
https://www.dpi.nsw.gov.au/__data/assets/pdf_file/0013/164101/Farm-water-
quality-and-treatment.pdf [Accessed].
NUR, T., SHIM, W. G., LOGANATHAN, P., VIGNESWARAN, S. &
KANDASAMY, J. 2015. Nitrate removal using Purolite A520E ion exchange
resin: batch and fixed-bed column adsorption modelling. International
Journal of Environmental Science and Technology, 12, 1311-1320.
O'GEEN, A., BUDD, R., GAN, J., MAYNARD, J., PARIKH, S. & DAHLGREN, R.
2010. Mitigating nonpoint source pollution in agriculture with constructed
and restored wetlands. Advances in Agronomy. Elsevier.
OAKES, W. C., LEONE, L. L., GUNN, C. J., DILWORTH, J., POTTER, M.,
YOUNG, M., DIEFES, H. & FLORI, R. 2000. Engineering your future,
Great Lakes Press.
OUELLET-PLAMONDON, C., CHAZARENC, F., COMEAU, Y. & BRISSON, J.
2006. Artificial aeration to increase pollutant removal efficiency of
constructed wetlands in cold climate. Ecological Engineering, 27, 258-264.
OYARZUN, D. I., HEMMATIFAR, A., PALKO, J. W., STADERMANN, M. &
SANTIAGO, J. G. 2018. Adsorption and capacitive regeneration of nitrate
using inverted capacitive deionization with surfactant functionalized carbon
electrodes. Separation and Purification Technology, 194, 410-415.
PAIDAR, M., ROUŠAR, I. & BOUZEK, K. 1999. Electrochemical removal of
nitrate ions in waste solutions after regeneration of ion exchange columns.
Journal of applied electrochemistry, 29, 611-617.
PARK, K.-K., LEE, J.-B., PARK, P.-Y., YOON, S.-W., MOON, J.-S., EUM, H.-M.
& LEE, C.-W. 2007. Development of a carbon sheet electrode for
electrosorption desalination. Desalination, 206, 86-91.
POE, A. C., PIEHLER, M. F., THOMPSON, S. P. & PAERL, H. W. 2003.
Denitrification in a constructed wetland receiving agricultural runoff.
Wetlands, 23, 817-826.
QIU, Y., CHENG, H., XU, C. & SHENG, G. D. 2008. Surface characteristics of
crop-residue-derived black carbon and lead (II) adsorption. Water Research,
42, 567-574.
RAMBAGS, F., TANNER, C. C., STOTT, R. & SCHIPPER, L. A. 2016. Fecal
Bacteria, Bacteriophage, and Nutrient Reductions in a Full-Scale Denitrifying
Woodchip Bioreactor. Journal of Environmental Quality, 45, 847-854.
REICHENBERGER, S., BACH, M., SKITSCHAK, A. & FREDE, H.-G. 2007.
Mitigation strategies to reduce pesticide inputs into ground-and surface water

References
107
and their effectiveness; a review. Science of the Total Environment, 384, 1-
35.
RICKERT, A. & MCSHANE, T. 2015. Remediation of Agricultural Runoff using
High Rate Algal Ponds [Online]. BURDEKIN BOWEN INTEGRATED
FLOODPLAIN MANAGEMENT ADVISORY COMMITTEE INC.
Available:
http://bbifmac.org.au/files/7414/7641/9308/HRAP_presentation.pdf
[Accessed].
ROBERTS, W. 2008. Algal Bloom Infographic [Online]. Available:
https://www.dreamstime.com/stock-illustration-harmful-algal-bloom-
infographic-large-format-ecological-illustration-descriptive-text-depicts-
causes-effects-image48960570 [Accessed 01/07/2018].
ROBERTSON, W. 2010. Nitrate removal rates in woodchip media of varying age.
Ecological Engineering, 36, 1581-1587.
RYAN, B. F., JOINER, B. L. & CRYER, J. D. 2012. MINITAB Handbook: Update
for Release, Cengage Learning.
S.SEAL. 2014.
Iraq to change the provincial map to be 30 provinces [Online]. Available:
http://www.iraqdirectory.com/en/2014/01/12/26049/iraq-to-change-the-
provincial-map-to-be-30-provinces.aspx [Accessed].
SAEED, T. & SUN, G. 2012. A review on nitrogen and organics removal
mechanisms in subsurface flow constructed wetlands: dependency on
environmental parameters, operating conditions and supporting media.
Journal of environmental management, 112, 429-448.
SALILING, W. J. B., WESTERMAN, P. W. & LOSORDO, T. M. 2007. Wood chips
and wheat straw as alternative biofilter media for denitrification reactors
treating aquaculture and other wastewaters with high nitrate concentrations.
Aquacultural Engineering, 37, 222-233.
SAMUEL, M. P., SENTHILVEL, S. & MATHEW, A. C. 2014. Performance
evaluation of environmentally compatible stormwater filtration systems.
International Journal of Environmental Science and Technology, 11, 1327-
1342.
SCHENZEL, K. & FISCHER, S. 2001. NIR FT Raman spectroscopy–a rapid
analytical tool for detecting the transformation of cellulose polymorphs.
Cellulose, 8, 49-57.

References
108
SCHIPPER, L. A., ROBERTSON, W. D., GOLD, A. J., JAYNES, D. B. &
CAMERON, S. C. 2010. Denitrifying bioreactors—an approach for reducing
nitrate loads to receiving waters. Ecological engineering, 36, 1532-1543.
SHACKLEY, S., SOHI, S., BROWNSORT, P., CARTER, S., COOK, J.,
CUNNINGHAM, C., GAUNT, J., HAMMOND, J., IBARROLA, R. &
MAŠEK, O. 2010. An assessment of the benefits and issues associated with
the application of biochar to soil. Department for Environment, Food and
Rural Affairs, UK Government, London.
SHAFIE, S. T., SALLEH, M. M., HANG, L. L., RAHMAN, M. & GHANI, W.
2012. Effect of pyrolysis temperature on the biochar nutrient and water
retention capacity. Journal of Purity, Utility Reaction and Environment, 1,
293-307.
SHAO, L., WU, Z., ZENG, L., CHEN, Z., ZHOU, Y. & CHEN, G. 2013. Embodied
energy assessment for ecological wastewater treatment by a constructed
wetland. Ecological modelling, 252, 63-71.
SHAREEF, T. M. E. & ZHAO, B. 2016. The Fundamentals of Biochar as a Soil
Amendment Tool and Management in Agriculture Scope: An Overview for
Farmers and Gardeners. Journal of Agricultural Chemistry and Environment,
6, 38.
SHEN, Y.-S., WANG, S.-L., HUANG, S.-T., TZOU, Y.-M. & HUANG, J.-H. 2010.
Biosorption of Cr (VI) by coconut coir: spectroscopic investigation on the
reaction mechanism of Cr (VI) with lignocellulosic material. Journal of
hazardous materials, 179, 160-165.
SHI, W., LI, H., CAO, X., LEONG, Z. Y., ZHANG, J., CHEN, T., ZHANG, H. &
YANG, H. Y. 2016. Ultrahigh performance of novel capacitive deionization
electrodes based on a three-dimensional graphene architecture with
nanopores. Scientific reports, 6, 18966.
SHIKLOMANOV, I. A. 1998. World water resources: a new appraisal and
assessment for the 21st century: a summary of the monograph World water
resources, Unesco.
SHILTON, A., PRATT, S., DRIZO, A., MAHMOOD, B., BANKER, S.,
BILLINGS, L., GLENNY, S. & LUO, D. 2005. ‘Active’filters for upgrading
phosphorus removal from pond systems. Water Science and Technology, 51,
111-116.
SILBERBUSH, M. & LIPS, S. 1988. Nitrogen concentration, ammonium/nitrate
ratio and NaCl interaction in vegetative and reproductive growth of peanuts.
Physiologia Plantarum, 74, 493-498.
References
109
SOHI, S. P., KRULL, E., LOPEZ-CAPEL, E. & BOL, R. 2010. A review of biochar
and its use and function in soil. Advances in agronomy. Elsevier.
SPOKAS, K. A., CANTRELL, K. B., NOVAK, J. M., ARCHER, D. W., IPPOLITO,
J. A., COLLINS, H. P., BOATENG, A. A., LIMA, I. M., LAMB, M. C. &
MCALOON, A. J. 2012. Biochar: a synthesis of its agronomic impact beyond
carbon sequestration. Journal of environmental quality, 41, 973-989.
SRINIVASAN, A. & VIRARAGHAVAN, T. 2010. Oil removal from water by
fungal biomass: a factorial design analysis. Journal of Hazardous Materials,
175, 695-702.
SRIVASTAVA, A., SINGH, S., AHN, C.-Y., OH, H.-M. & ASTHANA, R. K. 2013.
Monitoring Approaches for a Toxic Cyanobacterial Bloom. Environmental
Science & Technology, 47, 8999-9013.
STEFANAKIS, A. I. & TSIHRINTZIS, V. A. 2012. Effects of loading, resting
period, temperature, porous media, vegetation and aeration on performance of
pilot-scale vertical flow constructed wetlands. Chemical engineering journal,
181, 416-430.
STEINER, C., GLASER, B., GERALDES TEIXEIRA, W., LEHMANN, J., BLUM,
W. E. & ZECH, W. 2008. Nitrogen retention and plant uptake on a highly
weathered central Amazonian Ferralsol amended with compost and charcoal.
Journal of Plant Nutrition and Soil Science, 171, 893-899.
STRATEGY, N. 2014. 9.9 SAND FILTERS.
STROCK, J., RANAIVOSON, A., FEYEREISEN, G., SPOKAS, K., MULLA, D. &
ROSER, M. 2017. Nutrient Removal in Agricultural Drainage Ditches,
Minnesota Department of Agriculture.
SUKOW, D. W., GAVRIELIDES, A., ERNEUX, T., MOONEYHAM, B., LEE, K.,
MCKAY, J. & DAVIS, J. 2010. Asymmetric square waves in mutually
coupled semiconductor lasers with orthogonal optical injection. Physical
Review E, 81, 025206.
SUSS, M. E., PORADA, S., SUN, X., BIESHEUVEL, P. M., YOON, J. &
PRESSER, V. 2015. Water desalination via capacitive deionization: what is it
and what can we expect from it? Energy & Environmental Science, 8, 2296-
2319.
TALLEC, G., GARNIER, J., BILLEN, G. & GOUSAILLES, M. 2008. Nitrous oxide
emissions from denitrifying activated sludge of urban wastewater treatment
plants, under anoxia and low oxygenation. Bioresource Technology, 99,
2200-2209.

References
110
TAN, X., LIU, Y., ZENG, G., WANG, X., HU, X., GU, Y. & YANG, Z. 2015.
Application of biochar for the removal of pollutants from aqueous solutions.
Chemosphere, 125, 70-85.
TANNER, C., NGUYEN, M. & SUKIAS, J. 2005. Nutrient removal by a
constructed wetland treating subsurface drainage from grazed dairy pasture.
Agriculture, ecosystems & environment, 105, 145-162.
TANNER, C. C. & KADLEC, R. H. 2013. Influence of hydrological regime on
wetland attenuation of diffuse agricultural nitrate losses. Ecological
engineering, 56, 79-88.
TILMAN, D., HILL, J. & LEHMAN, C. 2006. Carbon-negative biofuels from low-
input high-diversity grassland biomass. Science, 314, 1598-1600.
TITIRICI, M.-M., WHITE, R. J., FALCO, C. & SEVILLA, M. 2012. Black
perspectives for a green future: hydrothermal carbons for environment
protection and energy storage. Energy & Environmental Science, 5, 6796-
6822.
TOWN, T. 2017. Agricultural Runoff. ENVIRONMENTAL HEALTH CONCERNS
AND TOXIC CHEMICALS WHERE YOU LIVE, WORK, AND PLAY.
U.S.EPAGENCY. 2011. Principles of Design and Operations of Wastewater
Treatment Pond Systems for Plant Operators, Engineers,
and Managers [Online]. Available: https://www.epa.gov/sites/production/files/2014-
09/documents/lagoon-pond-treatment-2011.pdf [Accessed].
U.S_EPA, E. P. A. 2005. Protecting Water Quality From Agricultural Runoff
[Online]. USA. Available:
https://webcache.googleusercontent.com/search?q=cache:a__uqU5kjWMJ:htt
ps://www.epa.gov/sites/production/files/2015-
09/documents/ag_runoff_fact_sheet.pdf+&cd=1&hl=en&ct=clnk&gl=au
[Accessed 2018].
UGGETTI, E., HUGHES-RILEY, T., MORRIS, R. H., NEWTON, M. I., TRABI, C.
L., HAWES, P., PUIGAGUT, J. & GARCÍA, J. 2016. Intermittent aeration to
improve wastewater treatment efficiency in pilot-scale constructed wetland.
Science of the Total Environment, 559, 212-217.
UGURLU, A. & OZTURKCU, S. D. 2018. Treatment of Nitrocellulose Industry
Watewaters by Upflow Denitrification Filter: Effect of Packing Media and
Recirculation. Environmental Processes, 5, 81-94.
UNITED STATES ENVIRONMENTAL PROTECTION AGENCY, E. 1994. Water
Quality Standards Handbook.
References
111
UNITED STATES ENVIRONMENTAL PROTECTION AGENCY, E. 2000.
History of Drinking Water Treatment [Online]. Available:
https://nepis.epa.gov/Exe/ZyNET.exe/P1002SMN.txt?ZyActionD=ZyDocum
ent&Client=EPA&Index=2000%20Thru%202005&Docs=&Query=&Time=
&EndTime=&SearchMethod=1&TocRestrict=n&Toc=&TocEntry=&QField
=&QFieldYear=&QFieldMonth=&QFieldDay=&UseQField=&IntQFieldOp
=0&ExtQFieldOp=0&XmlQuery=&File=D%3A%5CZYFILES%5CINDEX
%20DATA%5C00THRU05%5CTXT%5C00000019%5CP1002SMN.txt&Us
er=ANONYMOUS&Password=anonymous&SortMethod=h%7C-
&MaximumDocuments=1&FuzzyDegree=0&ImageQuality=r75g8/r75g8/x1
50y150g16/i425&Display=hpfr&DefSeekPage=x&SearchBack=ZyActionL&
Back=ZyActionS&BackDesc=Results%20page&MaximumPages=1&ZyEntr
y=1 [Accessed].
UNITED STATES ENVIRONMENTAL PROTECTION AGENCY, E. 2010. Waste
and Cleanup Risk Assessment Glossary [Online]. Office of Land and
Emergency Management Available:
https://ofmpub.epa.gov/sor_internet/registry/termreg/searchandretrieve/glossa
riesandkeywordlists/search.do?details=&glossaryName=Waste%20and%20C
leanup%20Risk%20Assess#formTop [Accessed 18/12 2017].
USBI. 2016. Biochar Then & Now [Online]. Building the Future from the Ground
Up. Available: http://biochar-us.org/biochar-then-now [Accessed].
USGS. 2016. How much water is there on, in, and above the Earth? [Online]. USA:
USA. gov. Available: https://water.usgs.gov/edu/earthhowmuch.html
[Accessed 27/04 2017].
UZUN, H. I. & DEBIK, E. 2019. Economical approach to nitrate removal via
membrane capacitive deionization. Separation and Purification Technology,
209, 776-781.
VAN DRIEL, P., ROBERTSON, W. & MERKLEY, L. 2006. Denitrification of
agricultural drainage using wood-based reactors. Transactions of the ASABE,
49, 565-573.
VANLANGENDONCK, Y., CORBISIER, D. & VAN LIERDE, A. 2005. Influence
of operating conditions on the ammonia electro-oxidation rate in wastewaters
from power plants (ELONITA™ technique). Water research, 39, 3028-3034.
VON AHNEN, M., PEDERSEN, P. B., HOFFMANN, C. C. & DALSGAARD, J.
2016. Optimizing nitrate removal in woodchip beds treating aquaculture
effluents. Aquaculture, 458, 47-54.
VYMAZAL, J. 2007. Removal of nutrients in various types of constructed wetlands.
Science of the total environment, 380, 48-65.

References
112
VYMAZAL, J. 2010. Constructed wetlands for wastewater treatment: five decades
of experience. Environmental science & technology, 45, 61-69.
VYMAZAL, J. 2013a. Emergent plants used in free water surface constructed
wetlands: a review. Ecological engineering, 61, 582-592.
VYMAZAL, J. 2013b. The use of hybrid constructed wetlands for wastewater
treatment with special attention to nitrogen removal: a review of a recent
development. Water research, 47, 4795-4811.
VYMAZAL, J. & BŘEZINOVÁ, T. 2015. The use of constructed wetlands for
removal of pesticides from agricultural runoff and drainage: a review.
Environment international, 75, 11-20.
WANG, L. & LI, T. 2015. Effects of seasonal temperature variation on nitrification,
anammox process, and bacteria involved in a pilot-scale constructed wetland.
Environmental Science and Pollution Research, 22, 3774-3783.
WARD, F. & MONDAY, J. 2007. Canadian Content Forums> Themes> Science &
Environment> Climate Change> How the GW myth is perpetuated.
WATER_ONLINE. 2017. About Nutrient Removal [Online]. Water Online.
Available: https://www.wateronline.com/solution/nutrient-removal [Accessed
2017].
WELGEMOED, T. & SCHUTTE, C. 2005. Capacitive deionization technology™:
an alternative desalination solution. Desalination, 183, 327-340.
WROBEL-TOBISZEWSKA, A., BOERSMA, M., SARGISON, J., ADAMS, P.,
SINGH, B., FRANKS, S., BIRCH, C. & CLOSE, D. 2017. Nutrient changes
in potting mix and Eucalyptus nitens leaf tissue under macadamia biochar
amendments. Journal of Forestry Research, 1-11.
WU, H., FAN, J., ZHANG, J., NGO, H. H., GUO, W., HU, Z. & LIANG, S. 2015.
Decentralized domestic wastewater treatment using intermittently aerated
vertical flow constructed wetlands: impact of influent strengths. Bioresource
technology, 176, 163-168.
WU, S., KUSCHK, P., BRIX, H., VYMAZAL, J. & DONG, R. 2014. Development
of constructed wetlands in performance intensifications for wastewater
treatment: a nitrogen and organic matter targeted review. Water research, 57,
40-55.
XIONG, J., GUO, G., MAHMOOD, Q. & YUE, M. 2011. Nitrogen removal from
secondary effluent by using integrated constructed wetland system.
Ecological Engineering, 37, 659-662.

References
113
YANG, J., LI, H., ZHANG, D., WU, M. & PAN, B. 2017. Limited role of biochars
in nitrogen fixation through nitrate adsorption. Science of The Total
Environment, 592, 758-765.
YANG, L., CHANG, H.-T. & HUANG, M.-N. L. 2001. Nutrient removal in gravel-
and soil-based wetland microcosms with and without vegetation. Ecological
engineering, 18, 91-105.
ZADEH, S. M., HUNT, D. V., LOMBARDI, D. R. & ROGERS, C. D. 2013. Shared
Urban Greywater Recycling Systems: Water Resource Savings and Economic
Investment. Sustainability, 5, 2887-2912.
ZHAI, J., XIAO, J., RAHAMAN, M. H., JOHN, Y. & XIAO, J. 2016. Seasonal
variation of nutrient removal in a full-scale artificial aerated hybrid
constructed wetland. Water, 8, 551.
ZHANG, D., GERSBERG, R. M. & KEAT, T. S. 2009. Constructed wetlands in
China. Ecological Engineering, 35, 1367-1378.
ZHANG, L.-Y., ZHANG, L., LIU, Y.-D., SHEN, Y.-W., LIU, H. & XIONG, Y.
2010. Effect of limited artificial aeration on constructed wetland treatment of
domestic wastewater. Desalination, 250, 915-920.
ZHANG, X., WANG, H., HE, L., LU, K., SARMAH, A., LI, J., BOLAN, N. S., PEI,
J. & HUANG, H. 2013. Using biochar for remediation of soils contaminated
with heavy metals and organic pollutants. Environmental Science and
Pollution Research, 20, 8472-8483.
ZHAO, B., O'CONNOR, D., ZHANG, J., PENG, T., SHEN, Z., TSANG, D. C. &
HOU, D. 2018. Effect of pyrolysis temperature, heating rate, and residence
time on rapeseed stem derived biochar. Journal of Cleaner Production, 174,
977-987.
ZHOU, X., JIA, L., LIANG, C., FENG, L., WANG, R. & WU, H. 2018.
Simultaneous enhancement of nitrogen removal and nitrous oxide reduction
by a saturated biochar-based intermittent aeration vertical flow constructed
wetland: Effects of influent strength. Chemical Engineering Journal, 334,
1842-1850.
ZOU, Y., HU, Z., ZHANG, J., FANG, Y., LI, M. & ZHANG, J. 2017. Mitigation of
N2O Emission from Aquaponics by Optimizing the Nitrogen Transformation
Process: Aeration Management and Exogenous Carbon (PLA) Addition.
Journal of agricultural and food chemistry, 65, 8806-8812.

Appendix A
114

Appendix A
115
Appendix A
General Factorial Regression: Nitrate Removal (mg/g ... e Conc. (mg/L)
Factor Information
Factor Levels Values
Flow rate (mL/min) 3 2, 4, 10
Nitrate Conc. (mg/L) 3 5, 10, 15
Analysis of Variance
Source
D
F Adj SS Adj MS
F-
Value
P-
Value
Model 8 0.00006
0
0.00000
8
21.79 0.000
Linear 4 0.00005
5
0.00001
4
39.43 0.000
Flow rate (mL/min) 2 0.00002
8
0.00001
4
40.12 0.000
Nitrate Conc. (mg/L) 2 0.00002
7
0.00001
3
38.74 0.000
2-Way Interactions 4 0.00000
6
0.00000
1
4.16 0.015
Flow rate (mL/min)*Nitrate Conc.
(mg/L)
4 0.00000
6
0.00000
1
4.16 0.015
Error 18 0.00000
6
0.00000
0
Total 26 0.00006
7
Model Summary
S R-sq R-sq(adj) R-sq(pred)
0.0005881 90.64% 86.48% 78.94%

Appendix A
116
Coefficients
Term Coef
SE
Coef
T-
Value
P-
Value
VI
F
Constant 0.00359
5
0.00011
3
31.76 0.000
Flow rate (mL/min)
2 0.00138
7
0.00016
0
8.66 0.000 1.3
3
4 -
0.00037
8
0.00016
0
-2.36 0.030 1.3
3
Nitrate Conc. (mg/L)
5 -
0.00135
5
0.00016
0
-8.46 0.000 1.3
3
10 0.00034
3
0.00016
0
2.14 0.046 1.3
3
Flow rate (mL/min)*Nitrate Conc.
(mg/L)
2 5 -
0.00056
2
0.00022
6
-2.48 0.023 1.7
8
2 10 -
0.00020
7
0.00022
6
-0.92 0.372 1.7
8
4 5 -
0.00011
3
0.00022
6
-0.50 0.625 1.7
8
4 10 0.00021
7
0.00022
6
0.96 0.351 1.7
8

Appendix A
117
Regression Equation
Nitrate Removal (mg/g
MBC)
= 0.003595 + 0.001387 Flow rate (mL/min)_2
- 0.000378 Flow rate (mL/min)_4
- 0.001009 Flow rate (mL/min)_10
- 0.001355 Nitrate Conc. (mg/L)_5
+ 0.000343 Nitrate Conc. (mg/L)_10
+ 0.001012 Nitrate Conc. (mg/L)_15
- 0.000562 Flow rate (mL/min)*Nitrate Conc. (mg/L)
_2 5
- 0.000207 Flow rate (mL/min)*Nitrate Conc. (mg/L)
_2 10
+ 0.000769 Flow rate (mL/min)*Nitrate Conc. (mg/L)
_2 15
- 0.000113 Flow rate (mL/min)*Nitrate Conc. (mg/L)
_4 5
+ 0.000217 Flow rate (mL/min)*Nitrate Conc. (mg/L)
_4 10
- 0.000104 Flow rate (mL/min)*Nitrate Conc. (mg/L)
_4 15
+ 0.000674 Flow rate (mL/min)*Nitrate Conc. (mg/L)
_10 5
- 0.000009 Flow rate (mL/min)*Nitrate Conc. (mg/L)
_10 10
- 0.000665 Flow rate (mL/min)*Nitrate Conc. (mg/L)
_10 15
Fits and Diagnostics for Unusual Observations
Obs
Nitrate
Removal
(mg/g MBC) Fit Resid
Std
Resid
10 0.004160 0.003065 0.001095 2.28 R
R Large residual
Means
Term Fitted Mean SE Mean
Flow rate (mL/min)
2 0.004981 0.000196
4 0.003217 0.000196
10 0.002586 0.000196
Nitrate Conc. (mg/L)
5 0.002240 0.000196
10 0.003937 0.000196
15 0.004607 0.000196
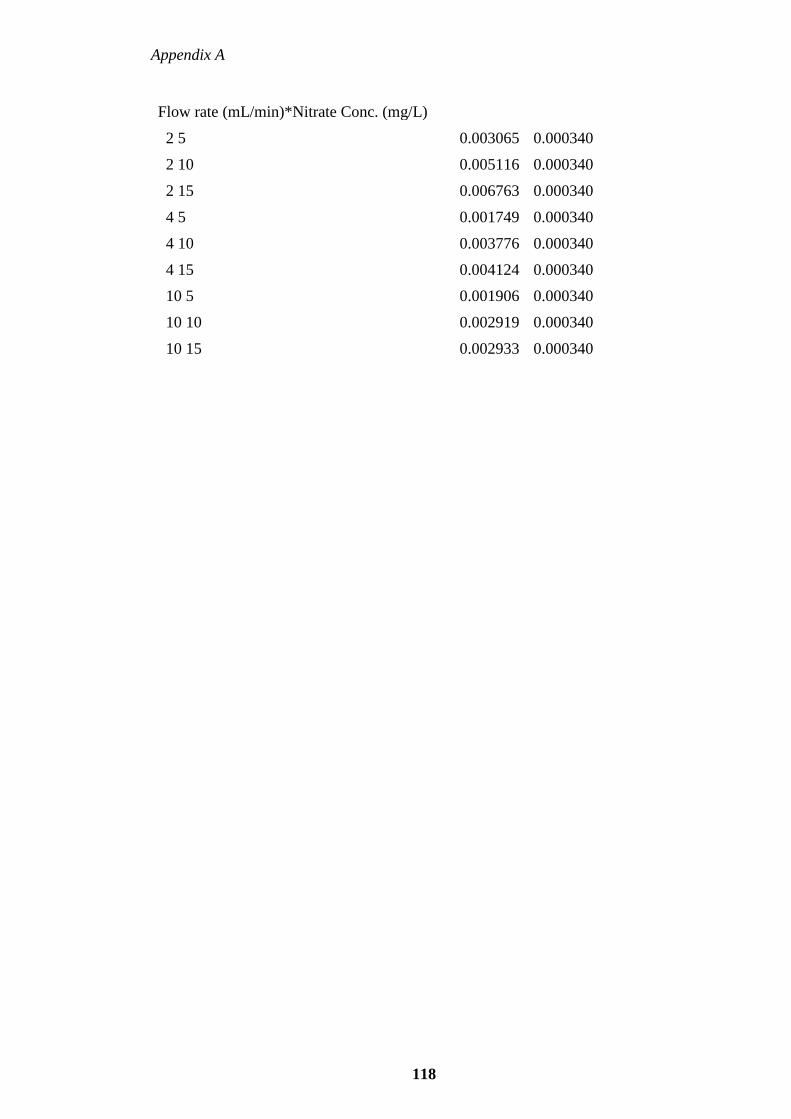
Appendix A
118
Flow rate (mL/min)*Nitrate Conc. (mg/L)
2 5 0.003065 0.000340
2 10 0.005116 0.000340
2 15 0.006763 0.000340
4 5 0.001749 0.000340
4 10 0.003776 0.000340
4 15 0.004124 0.000340
10 5 0.001906 0.000340
10 10 0.002919 0.000340
10 15 0.002933 0.000340