Treatment effect measures when using recurrent event ... · Draft qualification opi nion of...
16
Official address Domenico Scarlattilaan 6 ● 1083 HS Amsterdam ● The Netherlands An agency of the European Union Address for visits and deliveries Refer to www.ema.europa.eu/how-to-find-us Send us a question Go to www.ema.europa.eu/contact Telephone +31 (0)88 781 6000 © European Medicines Agency, 2019. Reproduction is authorised provided the source is acknowledged. 18 June 2019 1 EMA/CHMP/SAWP/291384/2019 2 Committee for Medicinal Products for Human Use (CHMP) 3 4 Draft qualification opinion of clinically interpretable 5 treatment effect measures based on recurrent event 6 endpoints that allow for efficient statistical analyses 7 8 9 Draft agreed by Scientific Advice Working Party 11-14 February 2019 Adopted by CHMP for release for consultation 23 -26 April 2019 1 Start of public consultation 19 June 2019 2 End of consultation (deadline for comments) 09 October 2019 3 10 Comments should be provided using this template. The completed comments form should be sent to 11 [email protected] 12 13 Keywords Recurrent Events, Estimand, Chronic Heart Failure, Mortality 14 1 Last day of relevant Committee meeting. 2 Date of publication on the EMA public website. 3 Last day of the month concerned.
Transcript of Treatment effect measures when using recurrent event ... · Draft qualification opi nion of...

Official address Domenico Scarlattilaan 6 ● 1083 HS Amsterdam ● The Netherlands
An agency of the European Union Address for visits and deliveries Refer to www.ema.europa.eu/how-to-find-us Send us a question Go to www.ema.europa.eu/contact Telephone +31 (0)88 781 6000
© European Medicines Agency, 2019. Reproduction is authorised provided the source is acknowledged.
18 June 2019 1 EMA/CHMP/SAWP/291384/2019 2 Committee for Medicinal Products for Human Use (CHMP) 3 4
Draft qualification opinion of clinically interpretable 5
treatment effect measures based on recurrent event 6
endpoints that allow for efficient statistical analyses 7 8 9
Draft agreed by Scientific Advice Working Party 11-14 February 2019
Adopted by CHMP for release for consultation 23 -26 April 20191
Start of public consultation 19 June 20192
End of consultation (deadline for comments) 09 October 20193
10 Comments should be provided using this template. The completed comments form should be sent to 11 [email protected] 12
13 Keywords Recurrent Events, Estimand, Chronic Heart Failure, Mortality
14
1 Last day of relevant Committee meeting. 2 Date of publication on the EMA public website. 3 Last day of the month concerned.
Draft qualification opinion of clinically interpretable treatment effect measures based on recurrent event endpoints that allow for efficient statistical analyses
EMA/CHMP/SAWP/291384/2019 Page 2/16
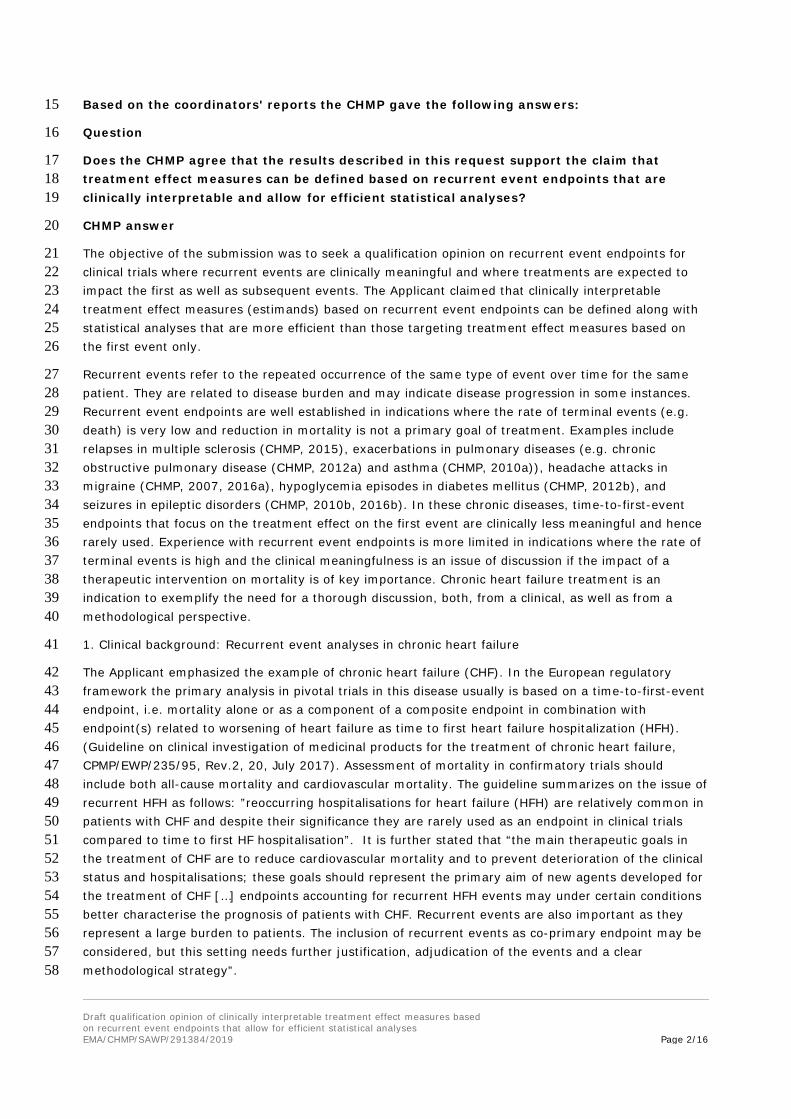
Based on the coordinators' reports the CHMP gave the following answers: 15
Question 16
Does the CHMP agree that the results described in this request support the claim that 17 treatment effect measures can be defined based on recurrent event endpoints that are 18 clinically interpretable and allow for efficient statistical analyses? 19
CHMP answer 20
The objective of the submission was to seek a qualification opinion on recurrent event endpoints for 21 clinical trials where recurrent events are clinically meaningful and where treatments are expected to 22 impact the first as well as subsequent events. The Applicant claimed that clinically interpretable 23 treatment effect measures (estimands) based on recurrent event endpoints can be defined along with 24 statistical analyses that are more efficient than those targeting treatment effect measures based on 25 the first event only. 26
Recurrent events refer to the repeated occurrence of the same type of event over time for the same 27 patient. They are related to disease burden and may indicate disease progression in some instances. 28 Recurrent event endpoints are well established in indications where the rate of terminal events (e.g. 29 death) is very low and reduction in mortality is not a primary goal of treatment. Examples include 30 relapses in multiple sclerosis (CHMP, 2015), exacerbations in pulmonary diseases (e.g. chronic 31 obstructive pulmonary disease (CHMP, 2012a) and asthma (CHMP, 2010a)), headache attacks in 32 migraine (CHMP, 2007, 2016a), hypoglycemia episodes in diabetes mellitus (CHMP, 2012b), and 33 seizures in epileptic disorders (CHMP, 2010b, 2016b). In these chronic diseases, time-to-first-event 34 endpoints that focus on the treatment effect on the first event are clinically less meaningful and hence 35 rarely used. Experience with recurrent event endpoints is more limited in indications where the rate of 36 terminal events is high and the clinical meaningfulness is an issue of discussion if the impact of a 37 therapeutic intervention on mortality is of key importance. Chronic heart failure treatment is an 38 indication to exemplify the need for a thorough discussion, both, from a clinical, as well as from a 39 methodological perspective. 40
1. Clinical background: Recurrent event analyses in chronic heart failure 41
The Applicant emphasized the example of chronic heart failure (CHF). In the European regulatory 42 framework the primary analysis in pivotal trials in this disease usually is based on a time-to-first-event 43 endpoint, i.e. mortality alone or as a component of a composite endpoint in combination with 44 endpoint(s) related to worsening of heart failure as time to first heart failure hospitalization (HFH). 45 (Guideline on clinical investigation of medicinal products for the treatment of chronic heart failure, 46 CPMP/EWP/235/95, Rev.2, 20, July 2017). Assessment of mortality in confirmatory trials should 47 include both all-cause mortality and cardiovascular mortality. The guideline summarizes on the issue of 48 recurrent HFH as follows: ”reoccurring hospitalisations for heart failure (HFH) are relatively common in 49 patients with CHF and despite their significance they are rarely used as an endpoint in clinical trials 50 compared to time to first HF hospitalisation”. It is further stated that “the main therapeutic goals in 51 the treatment of CHF are to reduce cardiovascular mortality and to prevent deterioration of the clinical 52 status and hospitalisations; these goals should represent the primary aim of new agents developed for 53 the treatment of CHF […] endpoints accounting for recurrent HFH events may under certain conditions 54 better characterise the prognosis of patients with CHF. Recurrent events are also important as they 55 represent a large burden to patients. The inclusion of recurrent events as co-primary endpoint may be 56 considered, but this setting needs further justification, adjudication of the events and a clear 57 methodological strategy”. 58

Draft qualification opinion of clinically interpretable treatment effect measures based on recurrent event endpoints that allow for efficient statistical analyses
EMA/CHMP/SAWP/291384/2019 Page 3/16
In this aspect the ability to appropriately estimate the effect of treatment on recurrent hospitalization 59 is of importance. 60
The controversy on this issue relates to clinical meaningfulness of an assessment of the recurrent 61 event, in case of no, or a negative correlation between mortality and the recurrent event, 62 methodological issues and the loss of information on mortality if studies become smaller when 63 designed based on recurrent events, only. These three issues are discussed here with a main focus on 64 the possible impact on the mortality assessment in chronic heart failure. 65
Mortality 66
Reduction of mortality is one of the main therapeutic goals in CHF. Current treatment algorithms in 67 clinical guidelines are based on robust knowledge on the effect of interventions on all-cause mortality, 68 cardiovascular mortality and hospitalization for heart failure (e.g. 2016 ESC Guidelines for the 69 diagnosis and treatment of acute and chronic heart failure, European Heart Journal 70 doi:10.1093/eurheartj/ehw128). Robust information on all-cause and cardiovascular mortality is crucial 71 for allocation of a new therapy in the context of other licensed medicinal products. 72
Although mortality rates in CHF have decreased over the last decades, all-cause mortality remains 73 high. In the European ESC-HF pilot study, covering a period between October 2009 to May 2010, 12-74 month all-cause mortality rates for hospitalized (acute heart failure) and stable/ambulatory HF patients 75 were 17% and 7%, respectively, with 12-month hospitalization rates of 44% and 32%, respectively. 76 Similar numbers were observed in the PARADIGM HF trial (Murray et al., N Engl J Med 2014; 371: 993 77 and EPAR EMEA/H/C/004062/0000, run in 2009 through 2012, stopped 2014) that may serve as an 78 example for mortality rates in present clinical heart failure studies. 17.0% and 19.8% of the patients 79 died in the LCZ696 and the Enalapril group, respectively, after a median follow-up of 27 months. The 80 rate per 100 patient years (95% CI) was: all-cause mortality 7.6 (7.1, 8.2) vs. 9.0 (8.3; 9.7), CV 81 death: 6.0 (5.5; 6.5) vs. 7.5 (7.0; 8.1) and first HFH 6.2 (5.7; 6.7) vs. 7.8 (7.2; 8.4), respectively. 82 The significant treatment effect was observed for CV death and all cause-mortality, first HFH and for 83 the primary endpoint, the composite of CV mortality and first HFH. The statistically significant result 84 was to a large degree based on efficacy in earlier stages of the disease (NYHA I – II). The study is an 85 example for a reasonably sized study (8442 patients) able to provide the data needed for assessment 86 of effects on mortality and hospitalization for patients as included in this study. 87
It should be emphasized that in heart failure studies acquiring robust data on mortality is not only 88 essential for the overall group of patients included. The SHIFT study (ivabradine, EPAR 89 EMA/194513/2012) is an example that shows that meaningful data are also required for subgroups. In 90 this pivotal trial, the primary endpoint (composite for cardiovascular death or first event HFH) showed 91 a statistically significant benefit of ivabradine over placebo for the whole study population with 92 consistent trends for mortality endpoints. However, predefined subgroup analyses by baseline heart 93 rate (< 77 bpm, vs. ≥ 77 bpm) showed numerically increased rates of cardiovascular mortality and all-94 cause mortality in patients with lower baseline heart rate. These subgroup analyses contributed to the 95 decision to restrict the indication to patients with a baseline HR ≥ 75 bpm. Reduction in variability in 96 estimates, mainly discussed from the background of an opportunity to reduce the overall sample-size 97 of a trial may thus limit the opportunity of risk-benefit assessment in an indication that suffers from 98 high unexplained variability that should be acknowledged. 99
In general, a medicinal product can be approved based on a beneficial effect on hospitalization rates, 100 even if studies fail to show a mortality benefit. As a prerequisite the data have to provide sufficient 101 reassurance that mortality is not increased to a relevant degree in the overall population and in 102 subgroups. The key example is digoxin. In a placebo controlled study including 6800 patients digoxin 103

Draft qualification opinion of clinically interpretable treatment effect measures based on recurrent event endpoints that allow for efficient statistical analyses
EMA/CHMP/SAWP/291384/2019 Page 4/16
had no effect on all-cause mortality (RR 0.99; 95 % CI 0.91 to 1.07, The Digitalis Investigation Group 104 (DIG), N Engl J Med 1997; 336: 525-533), but significantly improved first HFH rate (26.8 % vs. 34.7 105 %; RR 0.72; 95 % CI 0.66 to 0.79; P<0.001). The trial was large enough to exclude an increase in all-106 cause mortality by more than 7% which may be sufficient for a well-established drug. However, careful 107 analysis of the mortality is crucial in such a case since an overall neutral effect on mortality despite of 108 a HFH benefit may well be the result of divergent effects on mortality in subgroups. This has been 109 discussed for the DIG trial. In a post-hoc subgroup analysis in male patients all-cause mortality was 110 decreased at lower digoxin levels, neutral at intermediate digoxin levels and increased in patients with 111 higher digoxin plasma levels. Similarly, in the Val-HEFT study, comparing valsartan with placebo, a 112 beneficial effect was observed on first event HFH (RR 0.87; 97.5 % CI, 0.77 to 0.97; p=0.009) 113 whereas the effect on all-cause mortality was neutral (deaths during the entire trial: RR 1.02 (0.88 – 114 1.18)). In Val-HEFT, the neutral effect on mortality was the net result of a significantly increased 115 mortality in patients receiving in addition ACE inhibitors and beta blockers, and a significantly 116 decreased mortality in the other patients. 117
Exclusion of an increase in mortality is of particular importance in CHF, considering examples of agents 118 with a detrimental effect. E.g. in a study with 1088 patients with severe CHF Milrinone increased all-119 cause mortality and cardiovascular mortality by 28% and 34%, respectively. The number of patients 120 with worsening heart failure, functional deterioration or requiring additional therapy was not different 121 between the groups, hospitalization rate was only slightly higher in the milrinone group (44 percent vs. 122 39 percent; p = 0.041; Packer M et al., N Engl J Med 1991; 325:1468). Xamoterol improved 123 breathlessness in a study with 516 patients with NYHA class III and IV heart failure but increased 124 mortality (ITT: 32 (9.1%) vs. 6 (3.7%), p = 0.02, THE XAMOTEROL IN SEVERE HEART FAILURE 125 STUDY GROUP, Lancet. 1990; 336:1). Exclusion of an increase in mortality is a key aspect of the 126 assessment of chronic treatment of CHF. 127
Recurrent HFH events 128
Recurrent hospitalizations represent a considerable disease burden in patients with heart failure. After 129 diagnosis of heart failure 83% of patients were hospitalized at least once, 67% ≥2, 54% ≥3 and 43% 130 ≥4 times in a US based study (period 1987–2006, Dunley SM et al., JACC 2009; 54: 1695). Most of 131 these hospitalizations were due to non-CV reasons (61.9%), HFH made up for 16.5%, and 132 hospitalizations for other CV reasons for 21.6%. Male sex and co-morbidities (diabetes mellitus, 133 chronic obstructive pulmonary disease, anemia, and creatinine clearance <30 mL/min) were 134 independent predictors of all-cause hospitalization. 135
Once hospitalized for heart failure, the rate of recurrent HFH is much higher. After discharge from a HF 136 related hospital stay (Canada, 1999 – 2001, Chun S et al., Circ Heart Fail 2012; 5; 414) 61.3% of the 137 patients were re-hospitalized for heart failure and 66.5% for a cardiovascular event within the first 138 year of discharge. Differences in expected HFH rates related to whether patients have been 139 hospitalized for HF recently or not have to be taken into account. 140
The study showed some peculiarities when assessing recurrent HFH events. Hospitalization rates were 141 not linearly distributed over time, they clustered at early post-discharge and pre-fatal time. The clinical 142 meaningfulness of recurrent pre-fatal HFH events beyond a statistical booster of mortality remains to 143 be clarified. Furthermore, HFH rate depended on the underlying disease. In ischemic heart failure, 144 where the hospitalization rate was higher, a clear differentiation between heart failure related and 145 ischemia related hospitalization may not be feasible in every case. Recurrent event analyses are 146 currently not accepted in the regulatory context in cardiovascular trials aiming at the prevention of 147 MACE related to ischemic diseases. 148

Draft qualification opinion of clinically interpretable treatment effect measures based on recurrent event endpoints that allow for efficient statistical analyses
EMA/CHMP/SAWP/291384/2019 Page 5/16
Whereas it has been considered that recurrent HFH events may better characterize the prognosis of 149 patients under certain conditions (CPMP/EWP/235/95, Rev.2, 20, July 2017) it cannot be assumed a 150 priori for a new therapeutic agent that HFH is predictive for mortality. HFH or signs and symptoms of 151 heart failure did not exactly mirror the effect of a treatment on mortality in the above mentioned two 152 studies with milrinone and xamoterol. Also the DIG study is an example of discrepant results for both 153 parameters. Furthermore, models predicting mortality in patients with heart failure were reported to 154 have a higher discriminative ability than those designed to predict hospitalization (Rahimi K et al., 155 JACC heart failure 2014; 2: 440 ff; Outwerkerk W JACC heart failure 2014; 2; 429). Among the 156 possible reasons is that hospitalization is more dependent on health care supply indicating that HFH 157 and mortality are not interchangeable parameters for outcome. 158
In summary, the main therapeutic goals in the treatment of CHF are to reduce cardiovascular mortality 159 and to prevent deterioration of the clinical status and hospitalizations; these goals should represent the 160 primary aim of new agents developed for the treatment of CHF. Recurrent events may represent a 161 large burden to patients and endpoints accounting for recurrent HFH events may under certain 162 conditions better characterise the prognosis of patients with CHF (c.f. CPMP/EWP/235/95, Rev.2, 20, 163 July 2017). Among the challenges when clinically interpreting recurrent event HFH are disease specific 164 differences, clustering of events and factors like health care supply that may have an impact on the 165 event rate. Studies may become smaller when sample sizes are calculated based on recurrent HFH. 166 This has a relevant impact on data available for mortality assessment. Moreover, using a composite of 167 first event HFHs and mortality promotes inclusion of patients at a relevant risk of dying in order to get 168 a sufficient number of endpoint events whereas planning a study based on recurrent HFH as a 169 component of a primary endpoint may stipulate inclusion of patients at lower risk witch may further 170 decrease the robustness of information on mortality. The impact of a new therapeutic agent on 171 mortality, either as a measure of efficacy or at least in order to provide robust reassurance that there 172 is no detrimental effect, is key information expected from a pivotal trial in chronic heart failure. Such 173 data is needed not only for the overall population but also for relevant subgroups. Examples exist, 174 where it was possible to achieve this information with a reasonably sized clinical program based on the 175 requirements as outlined in CPMP/EWP/235/95, Rev.2. Considering requirements to rule out an excess 176 of mortality, the number of patients needed in a study using recurrent HFH events as a component of a 177 primary endpoint may in the end not be lower than in a study designed according to the current 178 guideline. 179
Although not within the scope of this methodological qualification opinion, the application of recurrent 180 HFH in areas, where robust data on mortality are less important (e.g. phase 2 trials, extrapolation 181 exercises), or in rare diseases, where information on mortality primarily depends on the number of 182 patients available and not on the study design, is endorsed by CHMP. The CHAMPION trial (Abraham 183 WT et al., The Lancet 2011; 377: 658) may serve as an example of a small scale study for a medical 184 device in patients where the impact of an implantable haemodynamic monitoring system of recurrent 185 HFH was explored over a 6 month period in patients with NYHA III. These programs may substantially 186 benefit from the development of recurrent HHF analyses in such areas. 187
2. Methodological issues 188
2.1 Calculation of HHF rate for a treatment-group: 189
Before going into an in-depth discussion on estimands and corresponding estimates a simplified 190 example is presented to illustrate and discuss two different effect measures: The exposure-weighted 191 and the patient-weighted event rate. 192
193

Draft qualification opinion of clinically interpretable treatment effect measures based on recurrent event endpoints that allow for efficient statistical analyses
EMA/CHMP/SAWP/291384/2019 Page 6/16
Patient HHF Follow-up (years)
HHF per year
Ann 0 3.0 0
Bill 1 3.0 0.333
Caren 3 1.5 2
Dave 0 3.0 0
Total 4 10.5 2.333
Average per patient
1 10.5 / 4 = 2.625 2.333 / 4=0.583
Average HHF per year of exposure
4/10.5=0,38
Exposure-weighted rate 194
The exposure (or exposure and follow-up-time) weighted annualised rate for a treatment group (the 195 number of events per year of observation in that group) can be expressed in many ways, all of which 196 lead to the same answer. 197
It can be thought of as the total number of events observed in that group divided by the total follow-198 up time. In the example this gives 4/10.5, i.e. 0.38 events per year. 199
It could also be thought of as the average number of HHF events per patient, divided by the average 200 follow-up – so in the example 1/2.625, or 0.38 events per year. 201
And it could also be seen as the weighted average of the event rates for each patient, with the weights 202 being the proportion of the follow-up time contributed by that patient i.e. patients who were followed-203 up for longer are given more weight in the analysis. In the example this give (0x3/10.5) + 204 (0.333x3/10.5) + (2x1.5/10.5) + (0x3/10.5) = (1/10.5)+(3/10.5) = 0.38 events per year. 205
Patient-weighted rate 206
The patient weighted annualised rate is the average of the rates observed for each patient, with each 207 patient being given equal weight, regardless of exposure. In the example this gives (0+0.333+2+0)/4 208 = 0.583 events per year. 209
Comparison 210
The two approaches will lead to identical answers if the duration of observation is the same for all 211 patients. 212
The two approaches will on average give the same answer if follow-up duration is independent of HHF 213 e.g. the number of HHF events is no indicator of the likely duration of follow-up or survival. However, 214 in this scenario the patient-weighted rate would be more variable, because of some very high 215 individual patient rate-estimates from patients with one or more events, but short follow-up time. 216
The two approaches will give systematically different answers when the duration of follow-up is related 217 to HHF events. An example of this would be if patients with high HHF rates are also more likely to die 218 and therefore generally have shorter follow-up. This would lead to the patient-weighted rate being 219 higher than the exposure-weighted rate, as the patient weighted approach would give all patients 220
Draft qualification opinion of clinically interpretable treatment effect measures based on recurrent event endpoints that allow for efficient statistical analyses
EMA/CHMP/SAWP/291384/2019 Page 7/16
equal weight, while the exposure rated approach would generally give less weight to patients with 221 higher HHF rates. 222
When interpreting these different rates, the exposure-weighted rate seems to be of some relevance to 223 the population as a whole – e.g. if a hospital was estimating the admission rates they should expect for 224 HF, the exposure-based approach might provide useful information in terms of events per year that 225 they might see. However, for a patient considering what annual rate they as an individual might expect 226 while they are alive, the patient-weighted rate would be the most informative, as every individual 227 patient studied would have an equal chance of representing them – there is not more chance that they 228 would be like one of the patients with long follow-up. 229
2.2. Calculation of the treatment effect on HHF rate 230
In this discussion the treatment comparison is made by taking the ratio of the events per year 231 observed in each treatment group, the rate ratio (RR). This could be done using the exposure-232 weighted rate or the patient-weighted rate. 233
As noted above if follow-up time is the same for all patients, the estimate in each group will be the 234 same regardless of the use of exposure or patient-weighted methodology, therefore the ratio, and 235 hence the estimate of the treatment effect would also be the same. Similarly, the two approaches will 236 on average give the same answer if follow-up time is independent of HHF. 237
However, there will be systematic differences between the two in other situations: 238
If a treatment, on average, delivers an x% HHF rate reduction for every patient, then the expected 239 estimate from the patient weighted approach will be an x% reduction, regardless of follow-up time and 240 the relationship between follow-up time and treatment and HHF. 241
The average estimate given by the exposure-rated analysis will vary depending on the relationships 242 between HHF rate, treatment and follow-up duration. For example, if high HHF rates are associated 243 with early death, and a treatment has a positive effect on HHF, then the active treatment will manage 244 to keep the higher HHF patients on treatment for longer than the control, making the beneficial effect 245 seem smaller in the exposure-weighted analysis. This would be offset if the treatment had a 246 detrimental effect on death outside the relationship between death and HHF, meaning the effect could 247 then seem more favourable for the exposure-related analysis. 248
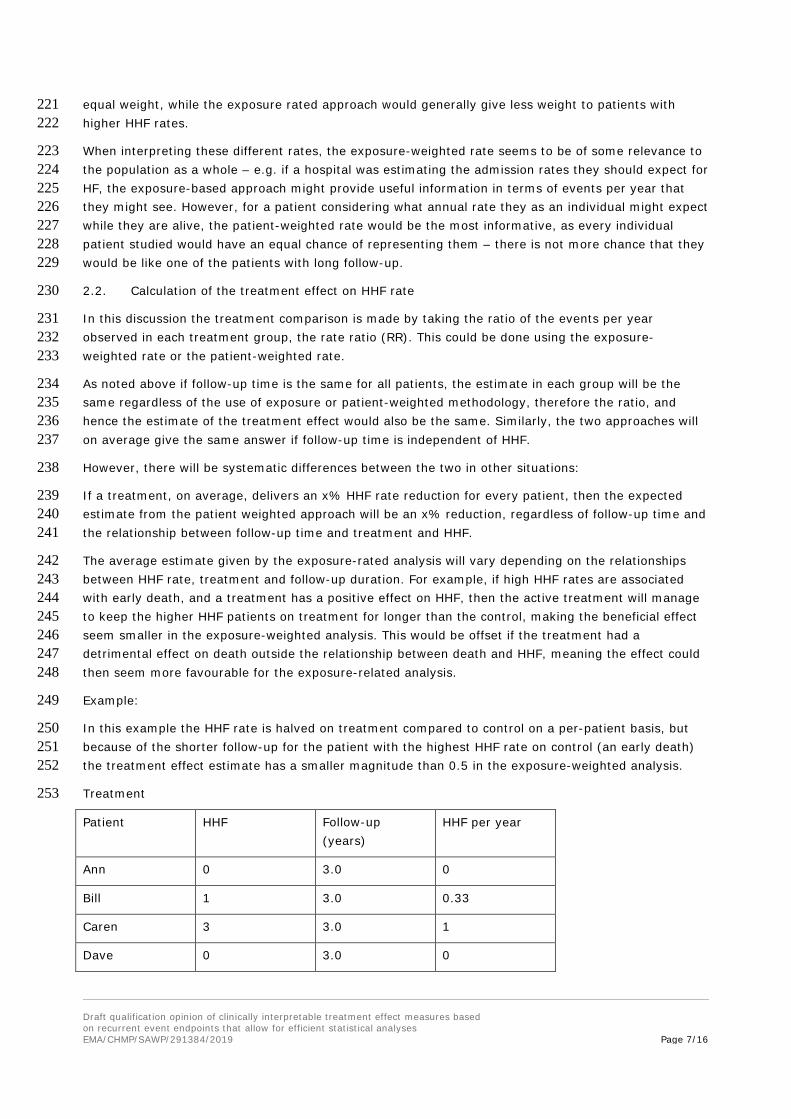
Example: 249
In this example the HHF rate is halved on treatment compared to control on a per-patient basis, but 250 because of the shorter follow-up for the patient with the highest HHF rate on control (an early death) 251 the treatment effect estimate has a smaller magnitude than 0.5 in the exposure-weighted analysis. 252
Treatment 253
Patient HHF Follow-up (years)
HHF per year
Ann 0 3.0 0
Bill 1 3.0 0.33
Caren 3 3.0 1
Dave 0 3.0 0

Draft qualification opinion of clinically interpretable treatment effect measures based on recurrent event endpoints that allow for efficient statistical analyses
EMA/CHMP/SAWP/291384/2019 Page 8/16
Total 4 12 1.33
Average per patient
1 3.0
Control 254
Patient HHF Follow-up (years)
HHF per year
Arthur 0 3.0 0
Brenda 2 3.0 0.67
Colin 3 1.5 2
Doreen 0 3.0 0
Total 5 10.5 2.67
Average per patient
1.25 2.625
Annualised HHF rates: 255
Exposure weighted: Treatment 0.333 per year, Control 0.476 per year; ratio 0.7 256
Patient weighted: Treatment 0.333 per year, Control 0.667 per year; ratio 0.5 257
Particularly, if the frequency of HHF is considered to be of value independently of the outcome on 258 mortality in the patient weighted approach two treatments would be considered equally effective, if all 259 patients in treatment group A survive one year with three HHF each and those in treatment group B 260 survive for two years with six HHF each. Interestingly the conclusion is identical if the exposure 261 weighted approach is used. Obviously, the HTA-conclusion that both treatments lead to the same 262 burden for the health care system, is incorrect, as treatment B incurs higher costs for the system. It 263 may also be difficult to justify to patients that treatment A should be used. 264
Intercurrent events, particularly if terminal / absorbing or impacting differentially (i.e. to a different 265 degree on treated and control patients) on duration of observation by other mechanisms, cause 266 obvious problems with the independent interpretation of treatment effect estimates for differences in 267 recurrent events. 268
2.3. Applicant proposal 269
The Applicant’s proposals are based on the exposure-weighted rate approach. The reason for this 270 preference is related to the drawbacks of the patient-weighted approach of the high influence of 271 patients who die early leading to high variability and a skewed distribution of results. In addition, they 272 state that none of the established estimators and statistical tests for recurrent events data in the 273 literature target the patient-weighted estimate. However, high variability per se indicates lower 274 confidence for decision making and may be an argument on its own that simply more information is 275 needed to provide robust conclusions (i.e. regarding relevant subgroups of different risks and 276 secondary endpoints). 277
Four different methods for recurrent event analysis were looked at and compared with Cox regression 278 – which looks at time to first event. NB refers to negative binomial regression, which targets an 279 estimand based on the number of recurrent events. When there is complete follow-up NB provides an 280

Draft qualification opinion of clinically interpretable treatment effect measures based on recurrent event endpoints that allow for efficient statistical analyses
EMA/CHMP/SAWP/291384/2019 Page 9/16
estimate of the RR which is the ratio of the average event numbers in the two groups. LWYY is the 281 Anderson-Gill method, which gives the same point estimate as negative binomial regression. The other 282 two methods, Wei (WLW) and Prentice (PWP) do not have such a clear interpretation. None of these 283 directly offers an opportunity to model terminal intercurrent events. 284
Two main settings were considered in simulation studies, those without a terminal event (or more 285 realistically where terminal events are rare) and those with such an event (usually death). Terminal 286 events are events, the occurrence of which means the recurrent event can no longer be observed and 287 obviously represent an important aspect of drug treatment and assessment of outcome on its own. 288
2.3.1. Scenarios without a terminal event (or where terminal event rates are low) 289
For the first scenario both non-informative treatment discontinuation and informative treatment 290 discontinuation were considered. The simulated trial had a fixed 2-year follow-up for every patient. 291 Informative discontinuation meant that patients were more likely to discontinue prematurely if they 292 had high rates of recurrent events, with non-informative discontinuation there is no link. For both it 293 was assumed that after discontinuation from active treatment patients were followed up and event 294 rates went back to the control rate. It is noted that informative discontinuation does not necessarily 295 require correlation with a higher frequency in the event of interest. 296
Two estimands were considered – one based on a hypothetical strategy to address discontinuation of 297 treatment (the RR if patients remained on treatment) and the other based on the treatment policy 298 strategy (the RR regardless of whether patients remain on treatment). Simulations were used to 299 compare methods under different conditions. As these are simulations the model parameters were 300 known so the true values of the estimands could also be calculated. This qualification opinion doesn’t 301 aim to address which estimand is more acceptable for regulatory decision making. However, the 302 general concern regarding the hypothetical strategy applied to treatment discontinuation should be 303 noted, where it is not understood why a patient who discontinued in the trial, for example because of a 304 severe toxicity, would have continued with the medication outside the trial. In earlier phase trials 305 where the purpose is not to gain a regulatory approval the strategy is easier to understand. 306
Regarding type I error, table 7A shows there is possibly a small loss of control with small sample sizes 307 (n=50) for recurrent event methods: values generally exceed 0.025 for all methods, while Cox 308 regression looks fine, but with larger sample sizes there are no apparent issues in the presented 309 simulations. 310
Table 7A: Mean treatment effects estimates (geometric mean) and Type I error rates (1-sided tests, 311 nominal significance level α=0.025) under four scenarios, with treatment effect size RR=1, baseline 312 recurrent event rate λ_0=0.5, and dispersion parameter θ=0.25. 313

Draft qualification opinion of clinically interpretable treatment effect measures based on recurrent event endpoints that allow for efficient statistical analyses
EMA/CHMP/SAWP/291384/2019 Page 10/16
314
Tables 5 and 6 show the true value of the exposure-weighted estimand under each of the simulated 315 scenarios, and how the estimates from each of the methods compare to this, shown by the ratio of 316 estimate to estimand in table 5. Values of estimate/estimand greater than 1.00 in table 5 represent an 317 on average conservative estimate i.e. estimates less favourable (or more harmful) than the true value. 318 The true treatment effect while patients remain on treatment is 0.65 in these examples. 319
320

Draft qualification opinion of clinically interpretable treatment effect measures based on recurrent event endpoints that allow for efficient statistical analyses
EMA/CHMP/SAWP/291384/2019 Page 11/16
321
Informative discontinuation means that an effective treatment would keep the patients with a higher 322 event rate on treatment longer allowing them to contribute more events, which explains the 323 conservative estimation in scenario 2. Otherwise there is no suggestion of bias for NB or LWYY. WLW 324 seems to be biased in favour of treatment while PWP is conservative. 325
Considering the treatment-policy approach, the treatment effect from this approach is less impressive 326 than the 0.65 if patients would remain on treatment, as would be expected given it considers periods 327 where patients are off-treatment. With that in mind an estimate using a treatment policy approach 328 could be used as a conservative estimate of the hypothetical estimand when there are concerns around 329 the assumptions that need to be made for the estimates that actually target the hypothetical estimand. 330
An interesting feature of the treatment policy estimand is that the true value of the estimand is 331 dependent on the choice of design. The trials simulated here had a 2-year follow-up. If a longer follow-332 up was specified the true value of the treatment policy estimand would get closer to 1.0 (as the 333 duration of follow-up increases for patients off-treatment) while for the hypothetical estimand it would 334 remain unchanged. When such results are reported it would need to be made clear that the ratios 335 being presented are relevant for the follow-up time specified and usually median observation times per 336 treatment group should be reported, as well. However, this is a general feature of treatment policy 337 estimands and the estimation of parameters of (semi-)parametric survival-functions and is not specific 338 to the recurrent event setting. 339
340

Draft qualification opinion of clinically interpretable treatment effect measures based on recurrent event endpoints that allow for efficient statistical analyses
EMA/CHMP/SAWP/291384/2019 Page 12/16
Figure 7 shows that there is a substantial increase in power for the recurrent event methods, 341 compared to the first event only Cox model. 342
343
Overall, aside from an issue with type I error control for small sample sizes, which should be 344 investigated further, it can be agreed that methods such as negative binomial regression are more 345 efficient than time to first events approaches in a situation where the rate of terminal events is 346 negligibly low. The provided simulations demonstrate increased power, and the estimates of the RR 347 reflect the true treatment effect, except for being conservative for the effect in scenario 2 where the 348 rate of withdrawal from treatment is positively correlated with the rate of recurrent events. Obviously, 349 this correlation may have a different impact on the control of the type-1-error, if non-inferiority (or 350 equivalence) is supposed to be demonstrated. 351
2.3.2. Scenarios with a terminal event 352
Terminal events complicate the estimation of the reduction in recurrent events, as after the terminal 353 event occurs the patients can no longer experience the recurrent events. 354

Draft qualification opinion of clinically interpretable treatment effect measures based on recurrent event endpoints that allow for efficient statistical analyses
EMA/CHMP/SAWP/291384/2019 Page 13/16
Two statistics (referred to as estimands) were considered here. Firstly, a ratio of the number of 355 recurrent events (in this case hospitalisations) and secondly, the ratio of events when counting the 356 terminal even (death) as an additional event. 357
358
From table 11, looking at the rows where HRCV =1.0 we can see that the type I error control of all 359 methods seems good under the global null-hypothesis, where there is no effect on the terminal or the 360 recurrent event, as the type I error values are all approximately 0.05. But type I error control for the 361 test of whether the treatment has an effect on the recurrent event can be lost when there is no effect 362 on the recurrent event (the target of estimand 1) but there is an effect on the terminal event. (In this 363 table that is mainly because of false-positive results in favour of the control treatment. However, if a 364 row for HRCV values > 1.0 had been included similar results would have been seen because of false-365 positive results in favour of the test treatment.) 366
When considering the next table, we should recall that the true value of the estimand is based on the 367 exposure-weighted approach. As noted previously, such an approach means that the magnitude of the 368 treatment effect on HHF varies dependent on factors such as the effect of treatment on the terminal 369 event. The results presented by the consortium confirm that assertion. 370

Draft qualification opinion of clinically interpretable treatment effect measures based on recurrent event endpoints that allow for efficient statistical analyses
EMA/CHMP/SAWP/291384/2019 Page 14/16
371
In table 8 the true risk ratio for hospitalization rates as used in the simulation is 0.7 for each individual 372 treated patient but depending on the rates of terminal events the value of the estimand alters, 373 indicating a larger beneficial effect of treatment if the treatment has an adverse effect on the terminal 374 events. Similarly, for treatments which are reducing the rate of terminal events the effect on recurrent 375 events seems less impressive. 376
This pattern does not occur so markedly with estimand 2 in the above tables, but estimand 2 is a 377 combined estimate of the effect of CVD and HHF with no clear clinical interpretation (because CVD has 378 the same weight as one HHF). 379
Ideally an analysis of the data from a trial where there are recurrent and terminal events would deliver 380 estimates of the treatment effect on both aspects; an estimate of effect of the treatment on the 381 recurrent event, and the effect on the terminal event. The simulations show a scenario where the 382 effect of treatment for an individual patient is that on average they would expect an reduction of 0.7 in 383 their event rate while they are alive, yet the estimand being targeted (based on the exposure-rated 384 approach) does not deliver this, and the value varies depending on the treatment effect on the 385 terminal events. 386
In terms of the estimators being used, LWYY does well in the presented simulations, in that it produces 387 good estimates of the true value of the exposure-weighted treatment effect, but it is questioned 388 whether this in appropriate target for estimation. 389
Equal weighted (per patient) estimand 390
A possible alternative approach to address these issues might be to instead target a patient-weighted 391 approach. As discussed above this would be expected to deliver on average a consistent estimate of 392 the treatment effect on recurrent events regardless of the effect on terminal events. 393
Table A*: Terminal event case: Approximated estimand values as well as Monte Carlo standard errors 394 (SE) under 30 scenarios. Simulated data for 200.000 patients are generated with 〖RR〗_HHF=0.7, 395 〖HR〗_CV=0.67;0.8;1.0;1.25;1.5. 396

Draft qualification opinion of clinically interpretable treatment effect measures based on recurrent event endpoints that allow for efficient statistical analyses
EMA/CHMP/SAWP/291384/2019 Page 15/16
397
The second column of table A* shows that when this is done it does appear that the patient-weighted 398 estimand provides estimates close to 0.7 for HHF for all values of the effect on the terminal event, 399 irrespective of follow-up time. (This table differs from previous tables in that there are no 400 discontinuations other than deaths – so we get a value of 0.7 for the exposure-weighted approach 401 when there is no treatment effect on death). 402
The exposure-weighted estimand changes with the effect on the terminal event, but also changes with 403 the duration of follow-up, meaning interpretation would also need to take into account changes in 404 study design. 405
Whereas the exposure-weighted estimand seems to provide an estimate of the total population 406 reduction in recurrent events that might be expected in a particular follow-up time in a certain patient 407 population, the equal patient-weighted approach seems to target the average reduction in event rate 408 for individual patients. While the former might have some relevance in a health economics type 409 scenario when considering the impact on the number of hospitalisations a system might have to cope 410 with and how this could be reduced, the latter seems more relevant when describing the impact of 411 treatment on a particular patient. 412
However, there are clear limitations with the patient-weighted approach. The Applicant notes that none 413 of the investigated analysis methods targets the estimand. They also express concern over the likely 414 increased variability of such an estimate, which would necessitate large sample sizes, and potentially 415 lose the efficiency hoped to be gained by using a recurrent events analysis, and its skewed 416 distribution, these issues mainly caused by the weight given to patients who have short follow-up. 417 CHMP considers that this is evidence of population heterogeneity which needs to be understood for 418 decision making about efficacy of the drug under consideration. Patients with short follow-up likely are 419 informative regarding the terminal event and should not be down-weighted with the aim to reduce 420 variability. 421

Draft qualification opinion of clinically interpretable treatment effect measures based on recurrent event endpoints that allow for efficient statistical analyses
EMA/CHMP/SAWP/291384/2019 Page 16/16
The CHMP would ideally like to see an analysis which delivers an estimate which appropriately 422 summarises the expected effect of the treatment for the average patient on their annual event rate for 423 the recurrent event. A patient-weighted estimand would achieve that. However, the use of such an 424 estimand is difficult as stated by the Applicant there are currently no methods in the literature that 425 target this estimand, and the difficulties that exist in pursuing such an approach are clear, though 426 more research in this direction could be fruitful. The target of estimation of the exposure-weighted 427 estimand is not agreed to be appropriate. However, if the performance of the methods targeting this 428 estimand were instead looked at in terms of their performance in estimating the patient-weighted 429 estimand, it seems as if approaches that appropriately estimate this estimand are conservative in the 430 situation where the treatment effect on the terminal event is not negative. In that context, it might be 431 possible to support the use of approaches to analysis such as NB and LWYY, but only in situations 432 where there is well established knowledge that the effect on the terminal event is not negative. 433
3. Conclusion- qualification opinion statement 434
For scenarios where there are no terminal events it can be agreed that the methodology proposed 435 provides clinically interpretable treatment effect measures that are more efficient than those targeting 436 treatment effect measure based on the first event only. This conclusion is consistent with the fact that 437 such methods are routinely used in certain disease areas, for example negative binomial analysis is 438 used when looking at annualized relapse rate in multiple sclerosis. 439
Clinical considerations regarding meaningfulness and the loss of information on mortality if studies 440 become smaller when designed based on recurrent events are summarized in section 1 of this 441 document. Methodological considerations in the scenario where there are terminal events are 442 summarized here: the targeted effect on the recurrent event in the exposure-weighted approach alters 443 dependent on the effect on the terminal event, meaning the effects are not clinically interpretable in 444 the way CHMP would ideally require for an individual patient. The effect also alters with other design 445 properties such as the duration of follow-up. There is also a loss of type I error for the individual 446 assessment of the treatment effect on the recurrent event in situations, where the global null-447 hypothesis is not true and the treatment effect regarding mortality is not neutral. 448
The CHMP could envisage as an option to provide a basis for decision making an analysis which 449 delivers separate estimates which appropriately summarise the expected effect of the treatment on the 450 annual event rate for the recurrent event while alive, and the effect on the terminal event. These 451 estimates should be unbiased from a statistical perspective. 452
Use of an approach for the recurrent event analysis where patients are given equal weight in the 453 analysis regardless of the duration of follow-up may have the potential to achieve this objective. There 454 are limitations with this approach, in that it would likely lead to high variability which could reduce the 455 efficiency advantages the use of recurrent event approaches hopes to obtain, but, as elaborated 456 above, this may simply indicate that more information is needed for proper decision making. There are 457 also currently no established methods in the literature which target this estimand. However, based on 458 the information provided this seems to be a possibly fruitful path to investigate and the CHMP would 459 encourage research into devising efficient methods of estimation that target such an estimand. 460