Treasury’s Opportunity to Increase HAMP’s Effectiveness by ......
16
Treasury’s Opportunity to Increase HAMP’s Effectiveness by Reaching More Homeowners in States Underserved by HAMP Special Inspector General for the Troubled Asset Relief Program April 29, 2015 T R O U B L E D A S SE T R E L I E F P R O G R A M S P E C I A L I N S P E C T O R G E N E R A L
Transcript of Treasury’s Opportunity to Increase HAMP’s Effectiveness by ......

Treasury’s Opportunity to Increase HAMP’s Effectiveness by Reaching More Homeowners in
States Underserved by HAMP
Special Inspector General for the Troubled Asset Relief ProgramApril 29, 2015
TROUBLED ASSET RELIEF PROGRA
M
SPEC
IAL INSPECTOR GENERAL

SPECIAL INSPECTOR GENERAL I TROUBLED ASSET RELIEF PROGRAM2

INTRODUCTIONTARP’s signature foreclosure prevention program, the Home Affordable Modification Program (“HAMP”), has struggled to reach the expected number of homeowners Treasury envisioned for the program. According to Treasury, TARP’s housing support programs were intended to “help bring relief to responsible homeowners struggling to make their mortgage payments, while preventing neighborhoods and communities from suffering the negative spillover effects of foreclosure.”1 Treasury announced that HAMP itself aimed “to help as many as three to four million financially struggling homeowners avoid foreclosure by modifying loans to a level that is affordable for borrowers now and sustainable over the long term.”2 The only long-term sustainable help provided through HAMP is a permanent mortgage modification, which becomes effective after the homeowner successfully completes a trial period plan. Through December 31, 2014, according to Treasury data, 1,514,687 homeowners have been able to get into a more affordable permanent HAMP modification (of which, 452,322 homeowners, or 29%, subsequently redefaulted on their HAMP modifications), while there have been 6,165,544 foreclosures nationwide over the same period based on CoreLogic data.3
Treasury has made a push to increase the number of homeowners to be helped in HAMP, including extending the deadline by which homeowners must apply for HAMP three times (currently through at least December 2016), providing Treasury with an opportunity to increase the effectiveness of HAMP and homeowners’ ability to participate.4 However, as SIGTARP has repeatedly advised, extending HAMP’s timeframe without eliminating barriers to homeowners getting help from HAMP will not increase HAMP’s effectiveness. To make the most of this opportunity, Treasury must quickly identify those areas where HAMP has underperformed and the barriers that have prevented homeowners in those areas from getting HAMP assistance. Then, Treasury must act to reduce or eliminate those barriers.
To increase the effectiveness of HAMP through meaningful change, SIGTARP has consistently reported on barriers homeowners face in getting into HAMP and in staying in HAMP. In its initial audit of HAMP, for example, SIGTARP recommended among other things that Treasury establish clear goals and performance metrics for the program and undertake a sustained public service announcement and publicity campaign to reach additional borrowers that may be helped by HAMP.i SIGTARP has also made numerous recommendations that Treasury should implement to monitor and ensure that mortgage servicers participating in HAMP are meeting their obligations and achieving program objectives, including recommending that Treasury set and enforce clear benchmarks for acceptable servicer performance under HAMP,ii that Treasury
i For more information, see SIGTARP’s audit report, “Factors Affecting Implementation of the Home Affordable Modification Program,” 3/25/2010, www.sigtarp.gov/Audit%20Reports/Factors_Affecting_Implementation_of_the_Home_Affordable_Modification_Program.pdf.
ii SIGTARP, Letter to Treasury, 8/31/2011, reprinted in SIGTARP, Quarterly Report to Congress, 10/27/2011, at p. 298, www.sigtarp.gov/Quarterly%20Reports/October2011_Quarterly_Report_to_Congress.pdf; SIGTARP, Letter to Treasury, 2/2/2012, reprinted in SIGTARP, Quarterly Report to Congress, 4/24/2012, at p.319, www.sigtarp.gov/Quarterly%20Reports/April_25_2012_Report_to_Congress.pdf.
QUARTERLY REPORT TO CONGRESS I JANUARY 28, 2015 1
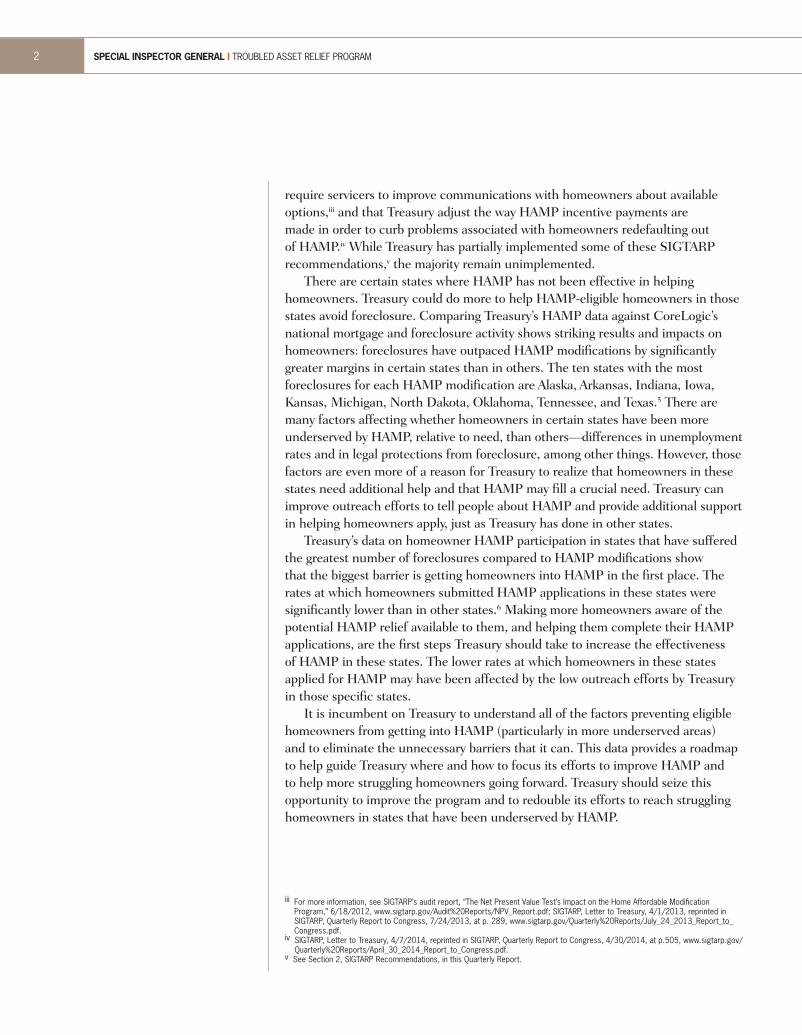
require servicers to improve communications with homeowners about available options,iii and that Treasury adjust the way HAMP incentive payments are made in order to curb problems associated with homeowners redefaulting out of HAMP.iv While Treasury has partially implemented some of these SIGTARP recommendations,v the majority remain unimplemented.
There are certain states where HAMP has not been effective in helping homeowners. Treasury could do more to help HAMP-eligible homeowners in those states avoid foreclosure. Comparing Treasury’s HAMP data against CoreLogic’s national mortgage and foreclosure activity shows striking results and impacts on homeowners: foreclosures have outpaced HAMP modifications by significantly greater margins in certain states than in others. The ten states with the most foreclosures for each HAMP modification are Alaska, Arkansas, Indiana, Iowa, Kansas, Michigan, North Dakota, Oklahoma, Tennessee, and Texas.5 There are many factors affecting whether homeowners in certain states have been more underserved by HAMP, relative to need, than others—differences in unemployment rates and in legal protections from foreclosure, among other things. However, those factors are even more of a reason for Treasury to realize that homeowners in these states need additional help and that HAMP may fill a crucial need. Treasury can improve outreach efforts to tell people about HAMP and provide additional support in helping homeowners apply, just as Treasury has done in other states.
Treasury’s data on homeowner HAMP participation in states that have suffered the greatest number of foreclosures compared to HAMP modifications show that the biggest barrier is getting homeowners into HAMP in the first place. The rates at which homeowners submitted HAMP applications in these states were significantly lower than in other states.6 Making more homeowners aware of the potential HAMP relief available to them, and helping them complete their HAMP applications, are the first steps Treasury should take to increase the effectiveness of HAMP in these states. The lower rates at which homeowners in these states applied for HAMP may have been affected by the low outreach efforts by Treasury in those specific states.
It is incumbent on Treasury to understand all of the factors preventing eligible homeowners from getting into HAMP (particularly in more underserved areas) and to eliminate the unnecessary barriers that it can. This data provides a roadmap to help guide Treasury where and how to focus its efforts to improve HAMP and to help more struggling homeowners going forward. Treasury should seize this opportunity to improve the program and to redouble its efforts to reach struggling homeowners in states that have been underserved by HAMP.
iii For more information, see SIGTARP’s audit report, “The Net Present Value Test’s Impact on the Home Affordable Modification Program,” 6/18/2012, www.sigtarp.gov/Audit%20Reports/NPV_Report.pdf; SIGTARP, Letter to Treasury, 4/1/2013, reprinted in SIGTARP, Quarterly Report to Congress, 7/24/2013, at p. 289, www.sigtarp.gov/Quarterly%20Reports/July_24_2013_Report_to_Congress.pdf.
iv SIGTARP, Letter to Treasury, 4/7/2014, reprinted in SIGTARP, Quarterly Report to Congress, 4/30/2014, at p.505, www.sigtarp.gov/Quarterly%20Reports/April_30_2014_Report_to_Congress.pdf.
v See Section 2, SIGTARP Recommendations, in this Quarterly Report.
SPECIAL INSPECTOR GENERAL I TROUBLED ASSET RELIEF PROGRAM2

HAMP HAS UNDERSERVED HOMEOWNERS IN CERTAIN STATES Since TARP was created, approximately 1.5 million homeowners have received a permanent modification of their mortgages through HAMP as of December 31, 2014, although more than 452,000 of them have subsequently fallen out of the program by redefaulting.7 During the same period, CoreLogic data shows there have been approximately 6.2 million foreclosures nationwide.8 This means that, nationally, there have been about 4.1 foreclosures for every HAMP modification. However, struggling homeowners in some states have significantly lower participation in HAMP.
Given Treasury’s stated goal for HAMP of preventing foreclosures, foreclosure actions can serve as a measure of homeowners’ need for HAMP assistance. Comparing the state-by-state ratios of foreclosures to the number of permanent HAMP modifications since October 1, 2008, can show whether HAMP reached all the parts of the country where it was needed. Figure 3.1 shows how the ratio of foreclosures to HAMP modifications has varied across the country and identifies the parts of the country that have been underserved by HAMP.
4.2
6.0
4.1
2.6
8.3
7.3
5.64.0
6.1 3.9
5.5
6.4
11.9
1.7
7.2
7.5
13.1
7.4
3.8
8.1
7.0
8.4
5.0
2.4 5.1 6.2
4.6
4.9
2.9 7.8
8.9
6.6
4.2
8.0
5.4
5.5
3.32.7
3.3
1.6
1.50.7
2.5
3.0
1.62.21.71.92.61.82.3
More than Twelve
Four (National Average)
Two to Four
Fewer than Two
Eight to Twelve
Four to Eight
Notes: Foreclosures include completed foreclosure sales since October 1, 2008 and active foreclosures in process. HAMP Modi�cations include permanent HAMP Tier 1, Tier 2, FHA HAMP, and RD HAMP Modi�cations, but not VA HAMP modi�cations (fewer than 1,000 in total), which are not included in Treasury’s HAMP data.
Sources: SIGTARP analysis of Core Logic foreclosures data and Treasury HAMP data, as of 12/31/2014.
Foreclosures for each HAMP modi�cation
FIGURE 3.1
FORECLOSURES PER HAMP MODIFICATION
As shown in Figure 3.1, Oklahoma homeowners have been the most underserved by HAMP, with more than 13 foreclosures for every HAMP modification. Homeowners in Vermont, by contrast, faired the best according to this measure, with fewer than one foreclosure for every HAMP modification. In general, homeowners in the Midwest, Great Plains, and South tended to get
QUARTERLY REPORT TO CONGRESS I JANUARY 28, 2015 3

into HAMP at lower rates than homeowners in the Northeast and West Coast. Struggling homeowners in the most HAMP-underserved states applied for HAMP less frequently than homeowners in other states.
HOMEOWNERS IN THE STATES MOST UNDERSERVED BY HAMP HAVE LOW HAMP APPLICATION RATESSubmitting a HAMP application is the necessary first step for struggling homeowners seeking HAMP assistance to avoid foreclosure. Based on Treasury’s HAMP data, homeowners in the ten states with the highest ratio of foreclosures per HAMP modification since October 2008 applied for HAMP at significantly lower rates than the national average.9 Table 3.1 compares the rates at which homeowners in those states applied for HAMP against the national average, and shows that homeowners in the states most underserved by HAMP faced greater barriers to getting into HAMP in the first place. Because differing economic conditions across the states are likely to have affected the size of the pool of potentially HAMP-eligible homeowners, Table 3.1 presents the number of applications in comparison to the number of foreclosures in each state.
TABLE 3.1
FORECLOSURES PER HAMP APPLICATION – MOST “UNDERSERVED” STATES
State
HAMP Applications Received
Permanent HAMP Modifications Foreclosures
Foreclosures Per HAMP Modification
Foreclosures per HAMP Application
OK 28,158 4,639 60,628 13.1 2.2
ND 1,775 249 2,971 11.9 1.7
MI 202,143 43,734 387,188 8.9 1.9
AR 23,170 4,152 35,001 8.4 1.5
AK 3,615 736 6,133 8.3 1.7
IA 23,913 4,254 34,599 8.1 1.4
TN 85,330 18,981 151,494 8.0 1.8
IN 86,017 17,439 135,719 7.8 1.6
KS 22,742 4,261 31,830 7.5 1.4
TX 286,506 52,572 387,251 7.4 1.4
Other States 5,486,762 1,363,670 4,932,730 3.6 0.9
Total 6,250,131 1,514,687 6,165,544 4.1 1.0Sources: SIGTARP analysis of CoreLogic foreclosures data and Treasury HAMP data, as of 12/31/2014. Foreclosures include completed foreclosure sales since October 1, 2008 and active foreclosures in process.
SPECIAL INSPECTOR GENERAL I TROUBLED ASSET RELIEF PROGRAM4

Nationwide, homeowners have submitted about one HAMP application for every foreclosure, but the rates were significantly lower in the states most underserved by HAMP. In Oklahoma, for example, two homeowners faced foreclosure for every one submitting a HAMP application–less than half the national rate.
If more homeowners in these states had applied, more may have been able to avoid foreclosure. For example, had Michigan homeowners submitted HAMP applications as frequently as the national average, the number of HAMP modifications in the state could have potentially doubled, possibly helping tens of thousands of additional homeowners avoid foreclosure.10
A number of factors, including (but not limited to) differences in foreclosure processes and timelines among the states, local economic and housing market conditions, and the efforts of state and local government and non-profits to prevent foreclosures, may contribute to the differences in application rates by homeowners in different states. However, low application rates may also suggest that not enough eligible homeowners in these states were made aware of potential HAMP relief and of how to apply, and/or that fewer were able to submit a completed HAMP application. The limited scope and effectiveness of Treasury’s outreach efforts in these underserved states may have also played a significant role.
TREASURY NEEDS TO DO MUCH MORE TO REACH HAMP-ELIGIBLE HOMEOWNERS IN THE STATES MOST UNDERSERVED BY HAMP The lower rates of homeowner applications in the states that have been underserved by HAMP may have been affected by the limited scope and extent of outreach efforts undertaken by Treasury. Based on information provided by Treasury, the states that have been among the most underserved by HAMP have also received the least outreach about HAMP from Treasury. Regardless of the reason Treasury has not focused on these states to date, going forward these states clearly present opportunities for Treasury to find more struggling homeowners to apply for and enter HAMP, and help them avoid foreclosure.
In its March 2010 audit of HAMP, SIGTARP recommended, among other things, that Treasury undertake a sustained public service announcement (“PSA”) and publicity campaign to reach additional borrowers who could benefit from the program, and to arm the public with complete, accurate information about HAMP.vi Since that time, according to Treasury, its efforts to reach homeowners have comprised conducting direct outreach events, establishing the MHA Outreach and Borrower Intake Project, and conducting PSA and paid advertising campaigns about HAMP, as well as internet search engine marketing and the use
vi SIGTARP, “Factors Affecting Implementation of the Home Affordable Modification Program,” 3/25/2010, www.sigtarp.gov/Audit%20Reports/Factors_Affecting_Implementation_of_the_Home_Affordable_Modification_Program.pdf.
QUARTERLY REPORT TO CONGRESS I JANUARY 28, 2015 5

of various websites and social media efforts.11 Treasury’s data confirms that the states most underserved by HAMP have also been among those who have received the least direct Treasury outreach. Additional efforts by Treasury in these areas could make a difference.
Table 3.2 compiles the information Treasury has provided to SIGTARP about its HAMP outreach efforts to date.
TABLE 3.2
SUMMARY OF TREASURY’S HOMEOWNER OUTREACH EFFORTS
State
Treasury’s Homeowner Events
Treasury’s Homeowner Event Attendance
NeighborWorks Outreach and Counseling Project Expenditures*
Paid Radio Advertising Campaigns
AL 1 377 $0 10
AK 0 0 $0 0
AZ 6 6,970 $14,900 3
AR 0 0 $0 2
CA 18 17,557 $341,690 8
CO 1 484 $10,650 0
CT 0 0 $38,257 2
DC 2 1,319 $630,294 1
DE 0 0 $44,190 2
FL 17 13,690 $145,776 3
GA 6 9,151 $149,747 12
HI 0 0 $24,267 0
ID 0 0 $16,495 0
IL 3 1,978 $138,605 4
IN 1 327 $94,680 2
IA 0 0 $0 0
KS 0 0 $0 0
KY 0 0 $11,363 1
LA 1 286 $2,500 5
ME 0 0 $9,716 0
MD 4 2,837 $285,089 4
MA 3 1,681 $738,320 3
MI 5 2,122 $156,083 7
MN 1 620 $103,725 1
MS 0 0 $0 10
MO 2 1,174 $14,338 2
MT 0 0 $0 0
NE 0 0 $0 0
Continued on next page
SPECIAL INSPECTOR GENERAL I TROUBLED ASSET RELIEF PROGRAM6

SUMMARY OF TREASURY’S HOMEOWNER OUTREACH EFFORTS (CONTINUED)
State
Treasury’s Homeowner Events
Treasury’s Homeowner Event Attendance
NeighborWorks Outreach and Counseling Project Expenditures*
Paid Radio Advertising Campaigns
NV 6 5,720 $0 2
NH 0 0 $17,650 0
NJ 1 764 $95,376 6
NM 0 0 $0 0
NY 2 2,938 $175,477 6
NC 1 588 $88,954 8
ND 0 0 $0 0
OH 3 1,175 $40,804 8
OK 0 0 $9,485 1
OR 2 882 $0 0
PA 3 1,020 $158,728 5
RI 0 0 $34,809 1
SC 1 372 $56,354 2
SD 0 0 $0 0
TN 1 268 $0 6
TX 3 2,183 $93,857 16
UT 0 0 $7,700 0
VT 0 0 $0 0
VA 2 952 $110,401 4
WA 1 796 $0 2
WV 0 0 $0 4
WI 1 512 $63,145 1
WY 0 0 $0 0
Total 98 78,743 $3,923,423 154* Reported expenditures for the “MHA Outreach and Borrower Intake Project.” Treasury, response to
SIGTARP data call, 4/6/2015.
Source: Treasury response to SIGTARP inquiry regarding the Making Home Affordable Program’s homeowner outreach efforts. Shaded states are the ten states with the greatest ratio of foreclosures to HAMP modifications since October 1, 2008.
While Treasury posts information that would be helpful for homeowners on the HAMP website, known as the Making Home Affordable website (www.makinghomeaffordable.gov), many struggling homeowners may lack access to the internet, or may not know to look up the website. One barrier in HAMP-underserved states may be that HAMP-eligible homeowners may not even know about HAMP. Even if homeowners in HAMP-underserved states know about HAMP, they may need help to understand how to apply for HAMP.
QUARTERLY REPORT TO CONGRESS I JANUARY 28, 2015 7
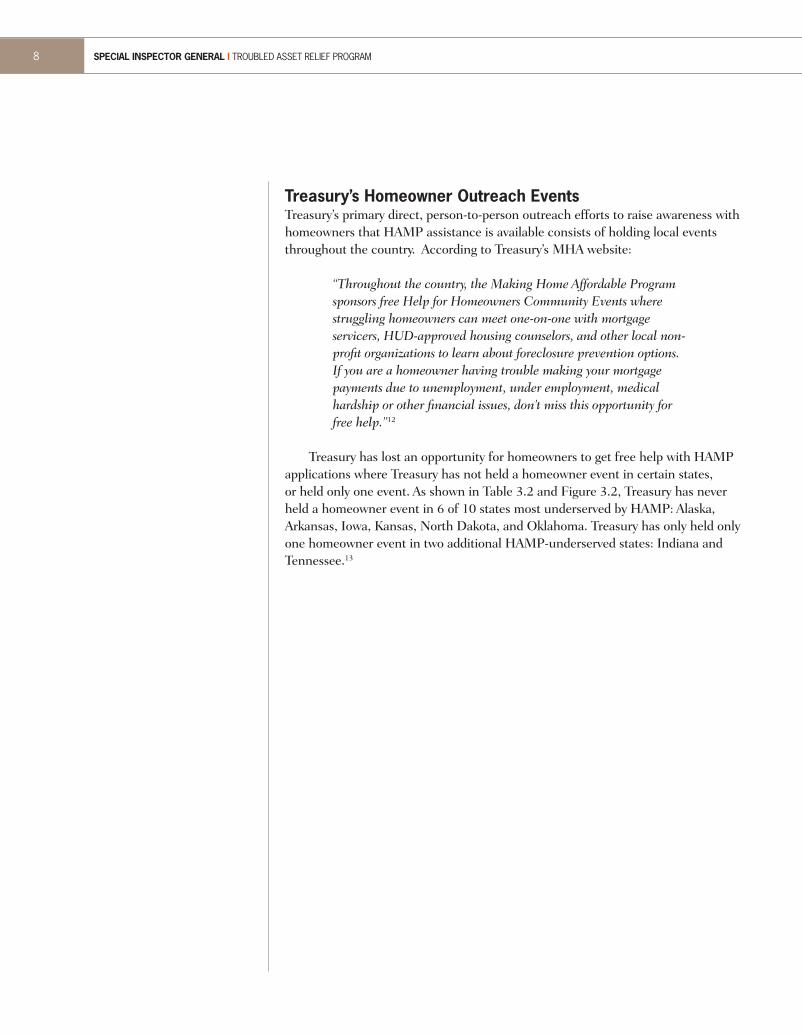
Treasury’s Homeowner Outreach EventsTreasury’s primary direct, person-to-person outreach efforts to raise awareness with homeowners that HAMP assistance is available consists of holding local events throughout the country. According to Treasury’s MHA website:
“Throughout the country, the Making Home Affordable Program sponsors free Help for Homeowners Community Events where struggling homeowners can meet one-on-one with mortgage servicers, HUD-approved housing counselors, and other local non-profit organizations to learn about foreclosure prevention options. If you are a homeowner having trouble making your mortgage payments due to unemployment, under employment, medical hardship or other financial issues, don’t miss this opportunity for free help.”12
Treasury has lost an opportunity for homeowners to get free help with HAMP applications where Treasury has not held a homeowner event in certain states, or held only one event. As shown in Table 3.2 and Figure 3.2, Treasury has never held a homeowner event in 6 of 10 states most underserved by HAMP: Alaska, Arkansas, Iowa, Kansas, North Dakota, and Oklahoma. Treasury has only held only one homeowner event in two additional HAMP-underserved states: Indiana and Tennessee.13
SPECIAL INSPECTOR GENERAL I TROUBLED ASSET RELIEF PROGRAM8

Notes: States with red shading are the ten most underserved states in terms of Foreclosures per HAMP Modi�cation.
Source: Treasury Response to SIGTARP Inquiry.
1
0
2
18
0
0
60
6 0
1
0
0
0
0
0
0
3
1
0
2
0
1
0 1 6
17
1
3 1
5
3
0
1
1
1
20
3
2
00
0
0
3
0
0
1
0
4
2
FIGURE 3.2
TREASURY SPONSORED HOMEOWNER OUTREACH EVENTS BY STATE
HAMP has an opportunity to be more effective in reaching more HAMP-eligible homeowners if Treasury holds its first-ever HAMP homeowner events in Alaska, Arkansas, Iowa, Kansas, North Dakota, and Oklahoma, and holds its second-ever homeowner events in Indiana and Tennessee. Homeowners have attended the events Treasury did hold in these states. There were 327 homeowners who attended Treasury’s one HAMP event in Indiana and 268 homeowners who attended Treasury’s one HAMP event in Tennessee.
HAMP’s effectiveness in getting more homeowners to apply could be significantly increased if Treasury held more than one homeowner event in HAMP-underserved states to reach different areas of that state with high foreclosure rates.
Homeowner Counseling to Help Apply for HAMPTreasury has provided counseling to help homeowners apply for HAMP through two avenues, one of which Treasury has ended. First, Treasury provides homeowner HAMP application counseling at its homeowner events. Face-to-face counseling with a HUD-approved counselor, made available to homeowners by Treasury at homeowner events, can be critical to getting homeowners to actually apply for HAMP. This is why it is so important that Treasury hold homeowner events in states like Arkansas, Iowa, Kansas, North Dakota, Oklahoma, Alaska, Indiana, and Tennessee. While free HUD counseling for HAMP is available to all homeowners applying for HAMP, not all homeowners may know that. Homeowner events in
QUARTERLY REPORT TO CONGRESS I JANUARY 28, 2015 9
these states that include HUD counselors could make a difference and help more homeowners apply for HAMP.
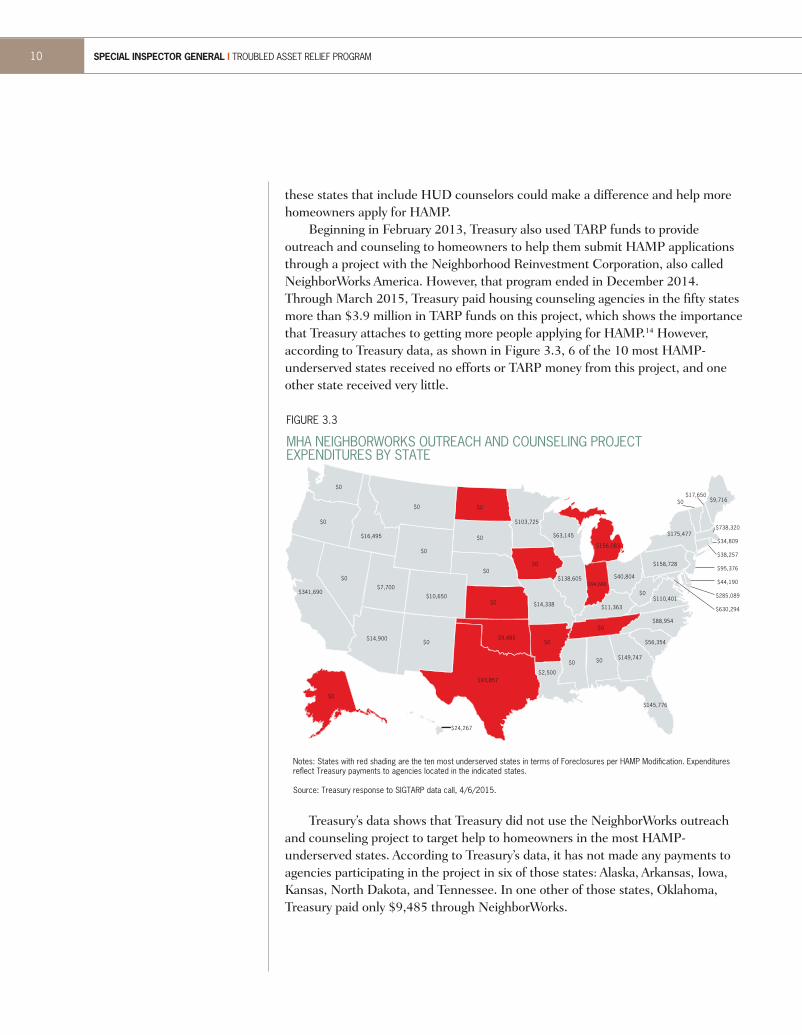
Beginning in February 2013, Treasury also used TARP funds to provide outreach and counseling to homeowners to help them submit HAMP applications through a project with the Neighborhood Reinvestment Corporation, also called NeighborWorks America. However, that program ended in December 2014. Through March 2015, Treasury paid housing counseling agencies in the fifty states more than $3.9 million in TARP funds on this project, which shows the importance that Treasury attaches to getting more people applying for HAMP.14 However, according to Treasury data, as shown in Figure 3.3, 6 of the 10 most HAMP-underserved states received no efforts or TARP money from this project, and one other state received very little.
Notes: States with red shading are the ten most underserved states in terms of Foreclosures per HAMP Modi�cation. Expenditures re�ect Treasury payments to agencies located in the indicated states.
Source: Treasury response to SIGTARP data call, 4/6/2015.
$0
$0
$0
$341,690
$0
$16,495
$0
$7,700
$14,900$0
$10,650
$0
$0
$0
$0
$0
$9,485
$93,857
$103,725
$0
$14,338
$0
$2,500
$0 $0 $149,747
$145,776
$63,145
$138,605$94,680
$156,083
$40,804
$11,363
$0
$56,354
$88,954
$110,401$0
$158,728
$175,477
$9,716$0
$24,267
$17,650
$738,320
$34,809
$38,257
$95,376
$44,190
$285,089
$630,294
FIGURE 3.3
MHA NEIGHBORWORKS OUTREACH AND COUNSELING PROJECT EXPENDITURES BY STATE
Treasury’s data shows that Treasury did not use the NeighborWorks outreach and counseling project to target help to homeowners in the most HAMP-underserved states. According to Treasury’s data, it has not made any payments to agencies participating in the project in six of those states: Alaska, Arkansas, Iowa, Kansas, North Dakota, and Tennessee. In one other of those states, Oklahoma, Treasury paid only $9,485 through NeighborWorks.
SPECIAL INSPECTOR GENERAL I TROUBLED ASSET RELIEF PROGRAM10

Treasury’s Media Outreach EffortsTreasury’s efforts to reach homeowners have also benefitted from donated advertisements, such as the Foreclosure Prevention Assistance PSA campaign run with the assistance of The Ad Council.vii Table 3.3 lists the airings and publications of the Foreclosure Prevention Assistance announcements by media type, based on Treasury data.
TABLE 3.3
TREASURY’S HAMP PUBLIC SERVICE ANNOUNCEMENT CAMPAIGNS
Media TypeAdvertisement Airings/
Publications
Local Broadcast Television 928,253
Network Cable Television 16,829
Radio 2,443,794
Out of Home* 18,683
Print 638
Public Relations 1,377
Total 3,409,574
* Includes advertisements on billboards, street furniture, mass transit, etc.
Source: Treasury, Response to SIGTARP inquiry, March 12, 2015, regarding the Making Home Affordable Program’s homeowner outreach efforts.
Although Treasury’s PSA efforts appear to have involved more than 3 million advertisements, those advertisements have been distributed across the nation through the Ad Council. It is uncertain whether or not these campaigns increased the number of homeowners able to participate in HAMP overall. But it is clear that these efforts have neither targeted the states most underserved by HAMP nor, based on Treasury’s data, been sufficient to increase the number of homeowners in those states who successfully get into HAMP relative to foreclosure activity.
According to Treasury, it also uses paid radio advertising to reach out to homeowners, and reports that it has run 154 paid radio advertisement campaigns for HAMP across the country.
vii According to its website, the Ad Council is a private, not for profit organization that “produces, distributes and promotes campaigns that improve everyday lives….” www.adcouncil.org/About-Us, accessed 4/9/2015.
QUARTERLY REPORT TO CONGRESS I JANUARY 28, 2015 11

Notes: States with red shading are the ten most underserved states in terms of Foreclosures per HAMP Modi�cation. The chart assigns ad campaigns to the largest city in the relevant media market; each campaign may thus reach potential homeowners in adjacent or other jurisdictions.
Source: Treasury Response to SIGTARP Inquiry.
2
0
0
8
0
0
20
3 0
0
0
0
0
0
0
1
16
1
0
2
2
5
0 10 12
3
1
4 2
7
8
1
6
2
8
44
5
6
00
0
0
3
1
2
6
2
4
1
FIGURE 3.4
MHA PAID RADIO AD CAMPAIGNS BY STATE
As shown in Table 3.2 and Figure 3.4, however, to date Treasury has not supplemented the PSA effort by using paid advertisements to increase outreach in the most underserved states. Treasury has run no paid radio advertisement campaigns for HAMP in 4 of the 10 states most underserved by HAMP: Alaska, Iowa, Kansas, and North Dakota. Treasury paid to run one campaign in Oklahoma and two in Indiana. In addition, outside of a single paid radio campaign run in Memphis, TN, between May 19, 2014, and June 21, 2014, Treasury has run no paid radio advertisements within the last year in the ten most underserved states.
While it may not be possible to know all the reasons why HAMP has not been as effective in preventing foreclosures in Alaska, Arkansas, Indiana, Iowa, Kansas, Michigan, North Dakota, Oklahoma, Tennessee, and Texas, one thing is clear: HAMP applications have been low in these states. Treasury should do all that it can to increase HAMP outreach in these states and provide the counseling needed to help more homeowners apply for HAMP.
SPECIAL INSPECTOR GENERAL I TROUBLED ASSET RELIEF PROGRAM12

1. Treasury Press Release, “Relief for Responsible Homeowners One Step Closer Under New Treasury Guidelines,” 3/4/2009, www.treasury.gov/press-center/press-releases/Pages/tg48.aspx, accessed 1/5/2015.
2. Treasury, “Home Affordable Modification Program: Overview,” no date, www.hmpadmin.com/portal/programs/hamp.jsp, accessed 4/9/2015.3. Treasury, “FHA & RD HAMP Trial Starts – Program Summary – December 2014,” accessed 1/22/2015; “HAMP 1MP: Program Volumes -
Program Summary - December 2014,” accessed 1/22/2015. CoreLogic foreclosures include foreclosures completed between October 1, 2008 and December 1, 2014, as well as mortgages in active foreclosure as of December 31, 2014.
4. Treasury, Treasury Notes, “Expanding our efforts to help more homeowners and strengthen hard-hit communities,” 1/27/2012, www.treasury.gov/connect/blog/Pages/Expanding-our-efforts-to-help-more-homeowners-and-strengthen-hard-hit-communities.aspx, accessed4/9/2015; Treasury, “Obama Administration Extends Deadline for Making Home Affordable Program,” 5/30/2013, www.makinghomeaffordable.gov/about-mha/latest-news/Pages/Obama-Administration-Extends-Deadline-for-Making-Home-Affordable-Program.aspx, accessed 4/9/2015; Treasury Press Release, “Secretary Lew Unveils New Efforts to Assist Struggling and Prospective Homeowners, Provide More Affordable Options for Renters,” 6/26/2014, www.treasury.gov/press-center/press-releases/Pages/jl2444.aspx, accessed 4/9/2015.
5. CoreLogic foreclosures data; Treasury HAMP data.6. CoreLogic foreclosures data; Treasury HAMP data.7. Treasury, “FHA & RD HAMP Trial Starts – Program Summary – December 2014,” accessed 1/22/2015; “HAMP 1MP: Program Volumes -
Program Summary - December 2014,” accessed 1/22/2015. 8. CoreLogic foreclosures data. 9. CoreLogic foreclosures data; Treasury HAMP data.10. CoreLogic foreclosures data; Treasury HAMP data.11. Treasury, Response to SIGTARP inquiry regarding the Making Home Affordable Program’s homeowner outreach efforts.12. Treasury, Making Home Affordable Program – Homeowner Events website, www.makinghomeaffordable.gov/tools/homeowner-events/Pages/
default.aspx, accessed 4/1/2015.13. Treasury, response to SIGTARP inquiry regarding the Making Home Affordable Program’s homeowner outreach efforts.14. Treasury, response to SIGTARP data call, 4/6/2015.
QUARTERLY REPORT TO CONGRESS I JANUARY 28, 2015 13

SIGTARP HOTLINEIf you are aware of fraud, waste, abuse, mismanagement, or misrepresentations associated with the Troubled Asset Relief Program, please contact the SIGTARP Hotline.By Online Form: www.SIGTARP.govBy Phone: Call toll free: (877) SIG-2009By Fax: (202) 622-4559By Mail: Hotline: Office of the Special Inspector General for the Troubled Asset Relief Program 1801 L Street., NW, 3rd Floor Washington, D.C. 20220
PRESS INQUIRIESIf you have any inquiries, please contact our Press Office: Troy Gravitt Director of Communications [email protected] 202-927-8940
LEGISLATIVE AFFAIRSFor Congressional inquiries, please contact our Legislative Affairs Office: Joseph Cwiklinski Director of Legislative Affairs [email protected] 202-927-9159
OBTAINING COPIES OF TESTIMONY AND REPORTSTo obtain copies of testimony and reports, please log on to our website at www.SIGTARP.gov.
TROUBLED ASSET RELIEF PROGRA
M
SPEC
IAL INSPECTOR GENERAL