TREASURY BOARD - Virginia
104
Transcript of TREASURY BOARD - Virginia

TREASURY BOARD COMMONWEALTH OF VIRGINIA
July 10, 2019 9:00 a.m.
Treasury Board Conference Room James Monroe Building
101 N. 14th Street, 3rd Floor Richmond, Virginia
Members Present: Manju S. Ganeriwala, Chairwoman
Neil Amin Craig Burns James Carney Douglas Densmore
Members Absent: Lou Mejia David Von Moll Others Present: Don Ferguson Office of the Attorney General
Susan Bagato Auditor of Public Accounts Scott Detar Bank of America Merrill Lynch Kevin Larkin Bank of America Markita Heard JP Morgan Eric Ballou Kaufman & Canoles Megan Gilliland Kaufman & Canoles T.W. Bruno McGuire Woods Anne Curtis Saunders McGuire Woods James Johnson The Optimal Service Group Bryce Lee The Optimal Service Group Karen Logan The Optimal Service Group Nelson Bush PFM Asset Management LLC Steven Peyser PRAG Adam Rosatelli Senate Finance Committee Anand Dharan Wellington Management Jason Law Wellington Management Joseph Marvan Wellington Management Jared Synnestvedt Wellington Management Patrick Dixon Wells Fargo Janet Aylor Department of the Treasury Neil Boege Department of the Treasury Tracey Edwards Department of the Treasury Leslie English Department of the Treasury Kathy Green Department of the Treasury Debora Greene Department of the Treasury Brad Jones Department of the Treasury Laura Lingo Department of the Treasury Kristin Reiter Department of the Treasury David Swynford Department of the Treasury
2
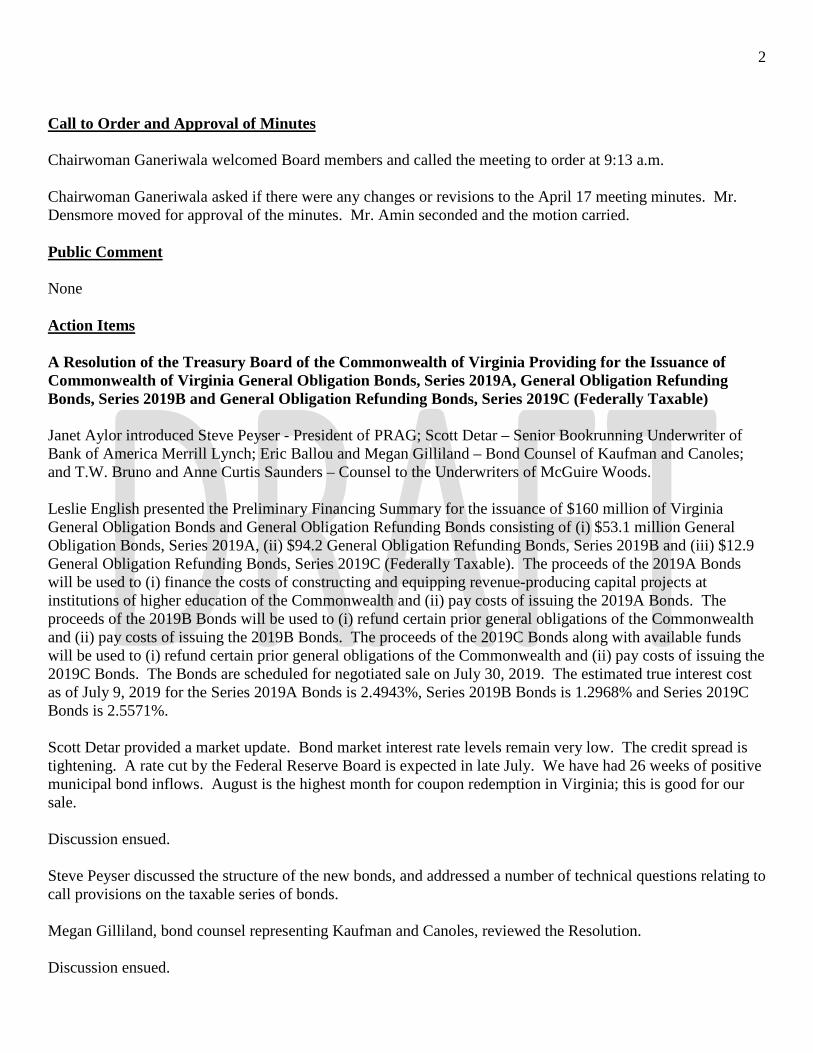
Call to Order and Approval of Minutes Chairwoman Ganeriwala welcomed Board members and called the meeting to order at 9:13 a.m. Chairwoman Ganeriwala asked if there were any changes or revisions to the April 17 meeting minutes. Mr. Densmore moved for approval of the minutes. Mr. Amin seconded and the motion carried. Public Comment None Action Items A Resolution of the Treasury Board of the Commonwealth of Virginia Providing for the Issuance of Commonwealth of Virginia General Obligation Bonds, Series 2019A, General Obligation Refunding Bonds, Series 2019B and General Obligation Refunding Bonds, Series 2019C (Federally Taxable) Janet Aylor introduced Steve Peyser - President of PRAG; Scott Detar – Senior Bookrunning Underwriter of Bank of America Merrill Lynch; Eric Ballou and Megan Gilliland – Bond Counsel of Kaufman and Canoles; and T.W. Bruno and Anne Curtis Saunders – Counsel to the Underwriters of McGuire Woods. Leslie English presented the Preliminary Financing Summary for the issuance of $160 million of Virginia General Obligation Bonds and General Obligation Refunding Bonds consisting of (i) $53.1 million General Obligation Bonds, Series 2019A, (ii) $94.2 General Obligation Refunding Bonds, Series 2019B and (iii) $12.9 General Obligation Refunding Bonds, Series 2019C (Federally Taxable). The proceeds of the 2019A Bonds will be used to (i) finance the costs of constructing and equipping revenue-producing capital projects at institutions of higher education of the Commonwealth and (ii) pay costs of issuing the 2019A Bonds. The proceeds of the 2019B Bonds will be used to (i) refund certain prior general obligations of the Commonwealth and (ii) pay costs of issuing the 2019B Bonds. The proceeds of the 2019C Bonds along with available funds will be used to (i) refund certain prior general obligations of the Commonwealth and (ii) pay costs of issuing the 2019C Bonds. The Bonds are scheduled for negotiated sale on July 30, 2019. The estimated true interest cost as of July 9, 2019 for the Series 2019A Bonds is 2.4943%, Series 2019B Bonds is 1.2968% and Series 2019C Bonds is 2.5571%. Scott Detar provided a market update. Bond market interest rate levels remain very low. The credit spread is tightening. A rate cut by the Federal Reserve Board is expected in late July. We have had 26 weeks of positive municipal bond inflows. August is the highest month for coupon redemption in Virginia; this is good for our sale. Discussion ensued. Steve Peyser discussed the structure of the new bonds, and addressed a number of technical questions relating to call provisions on the taxable series of bonds. Megan Gilliland, bond counsel representing Kaufman and Canoles, reviewed the Resolution. Discussion ensued.
3
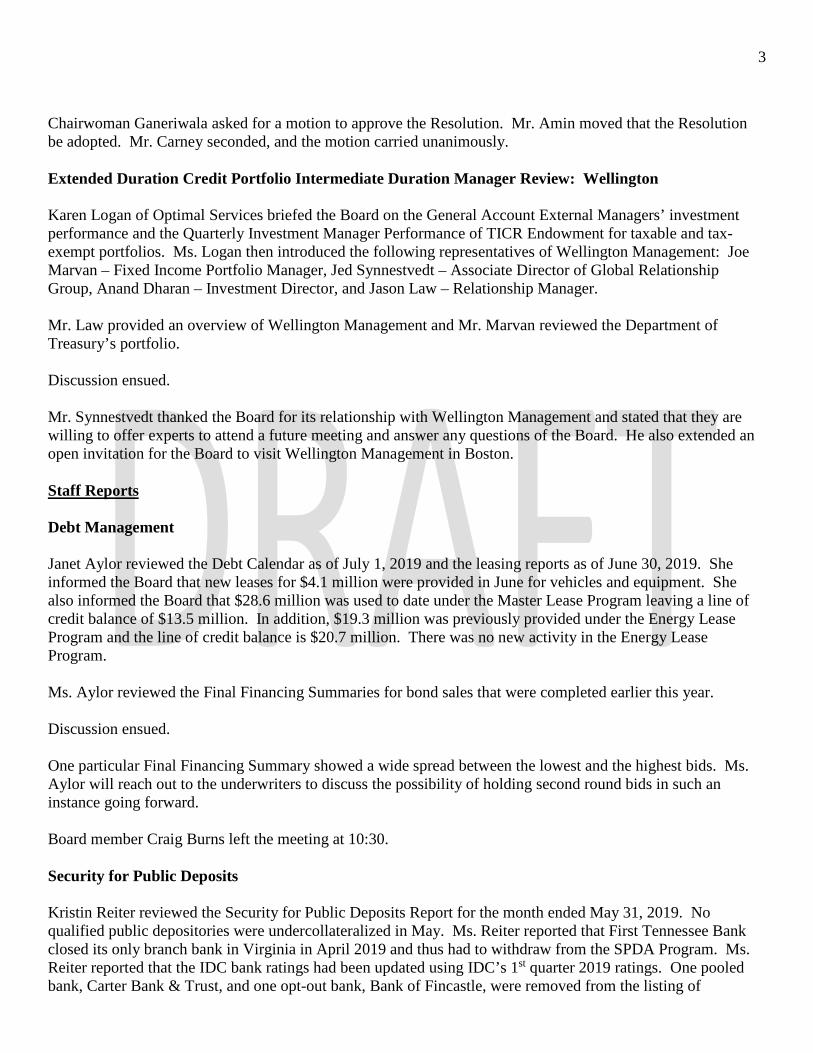
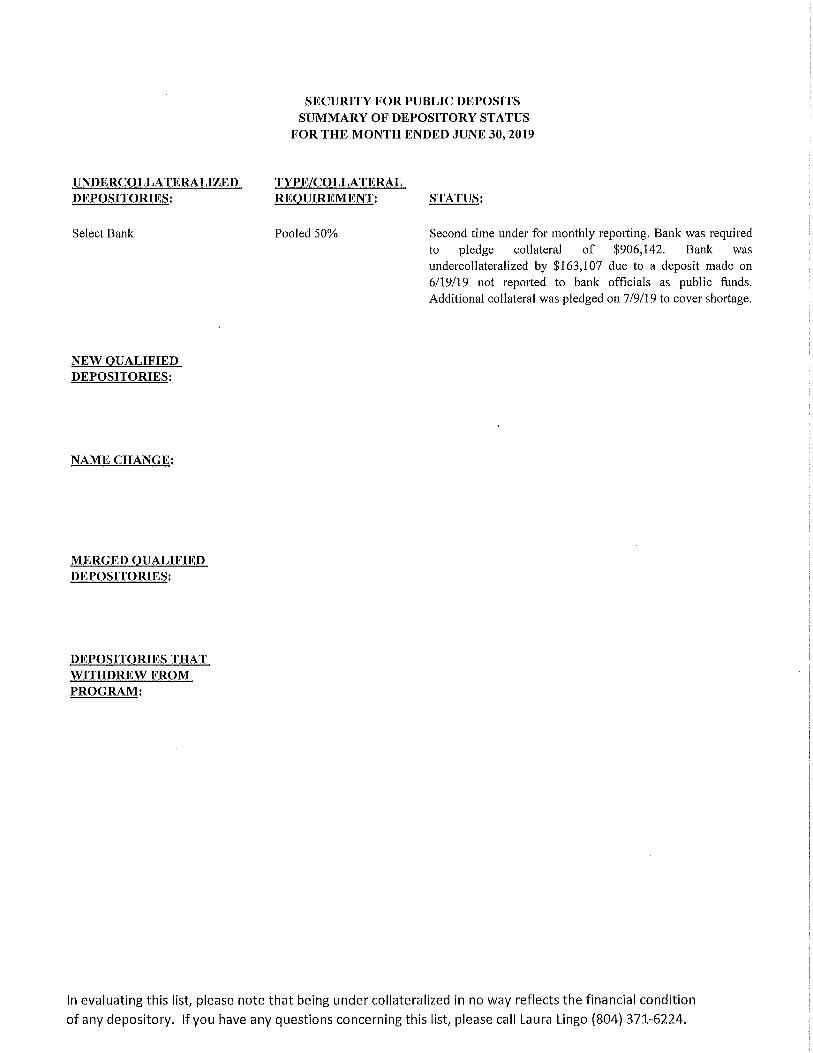
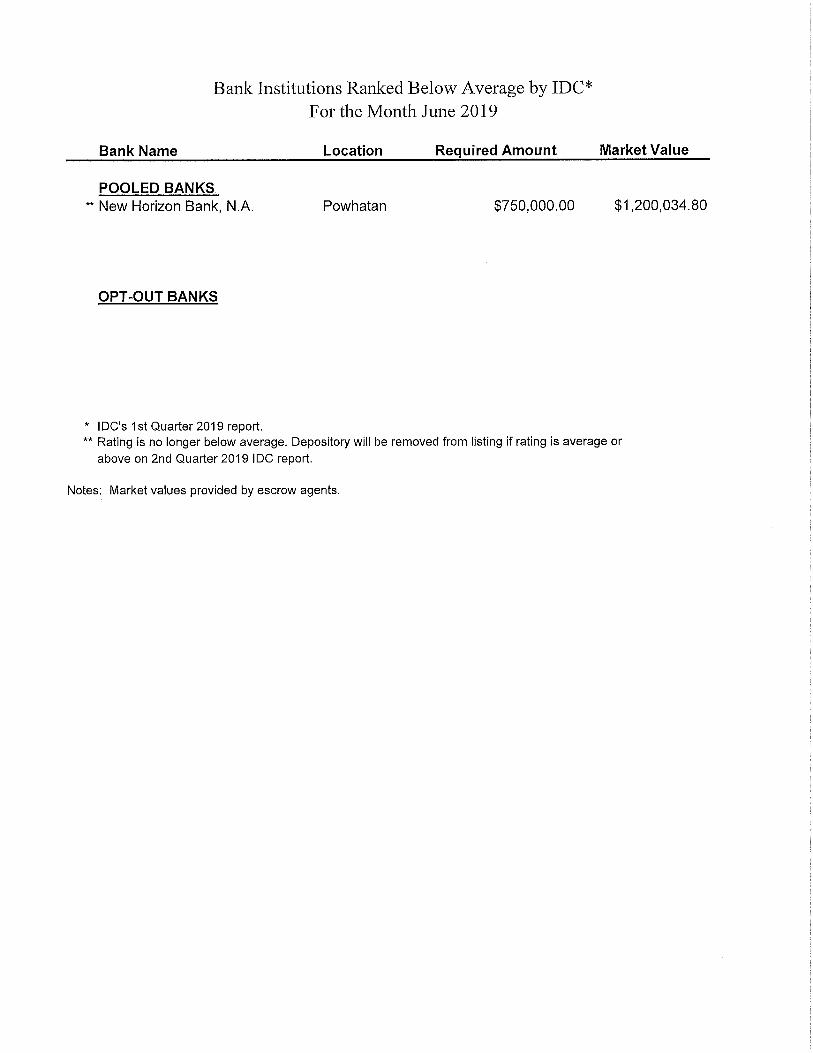
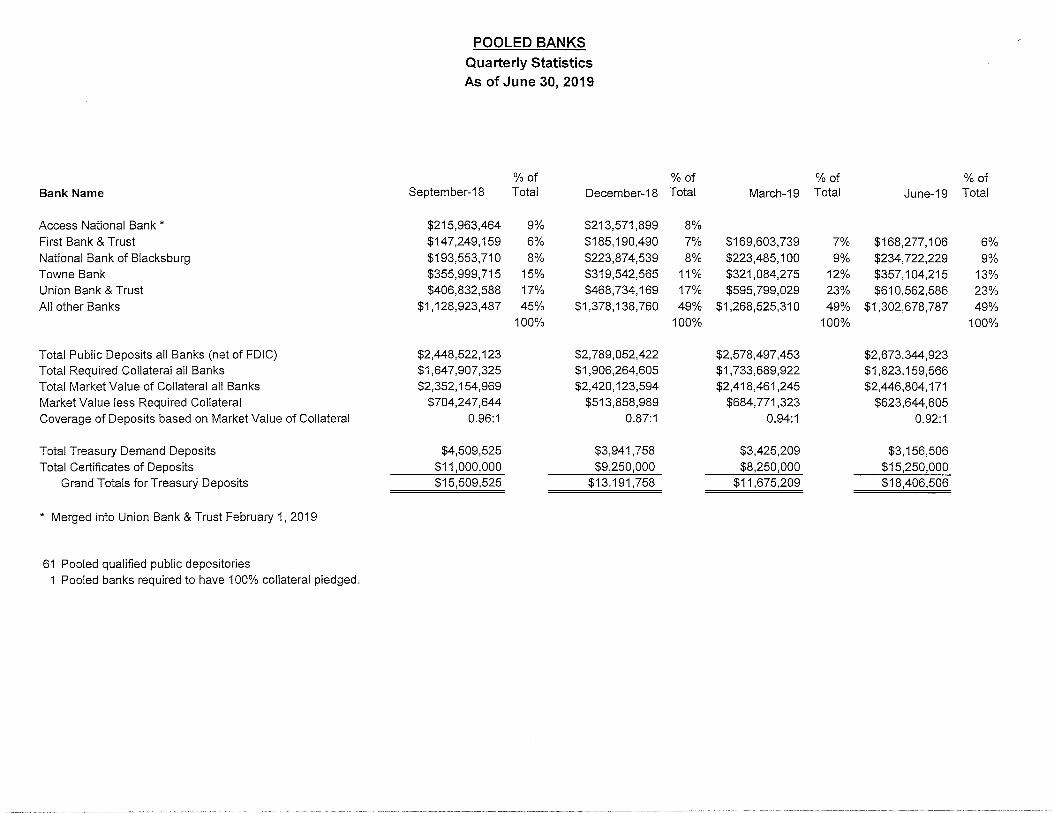
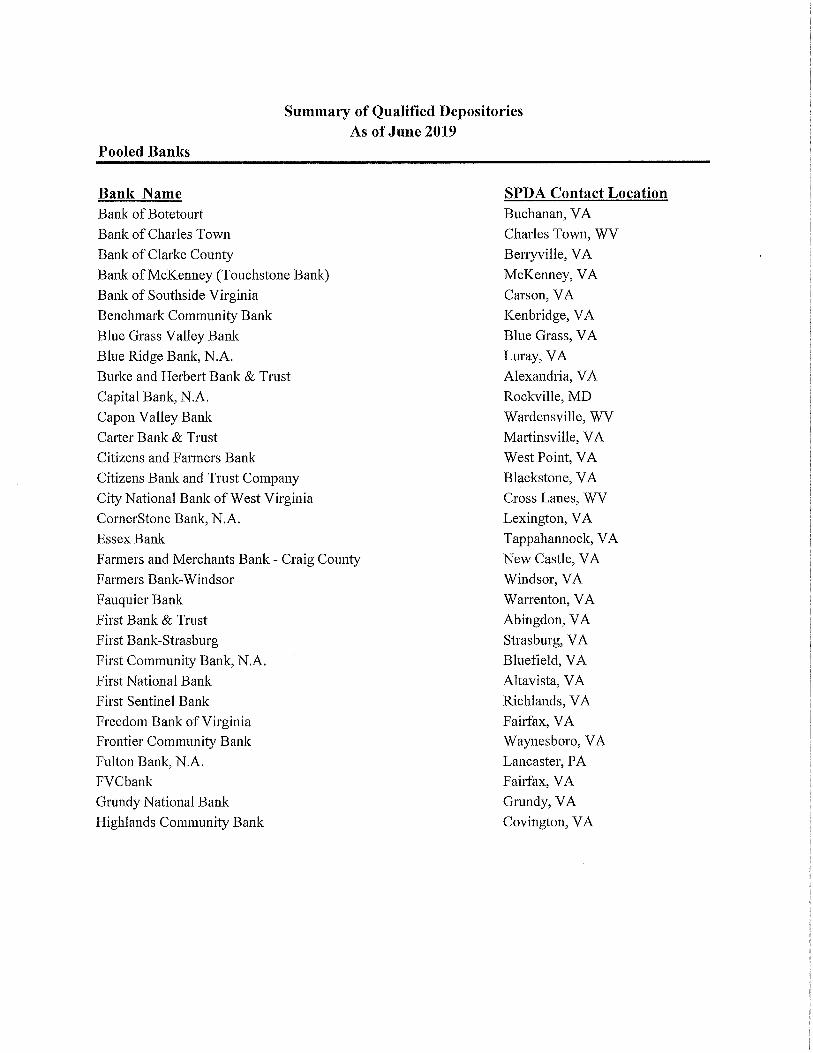
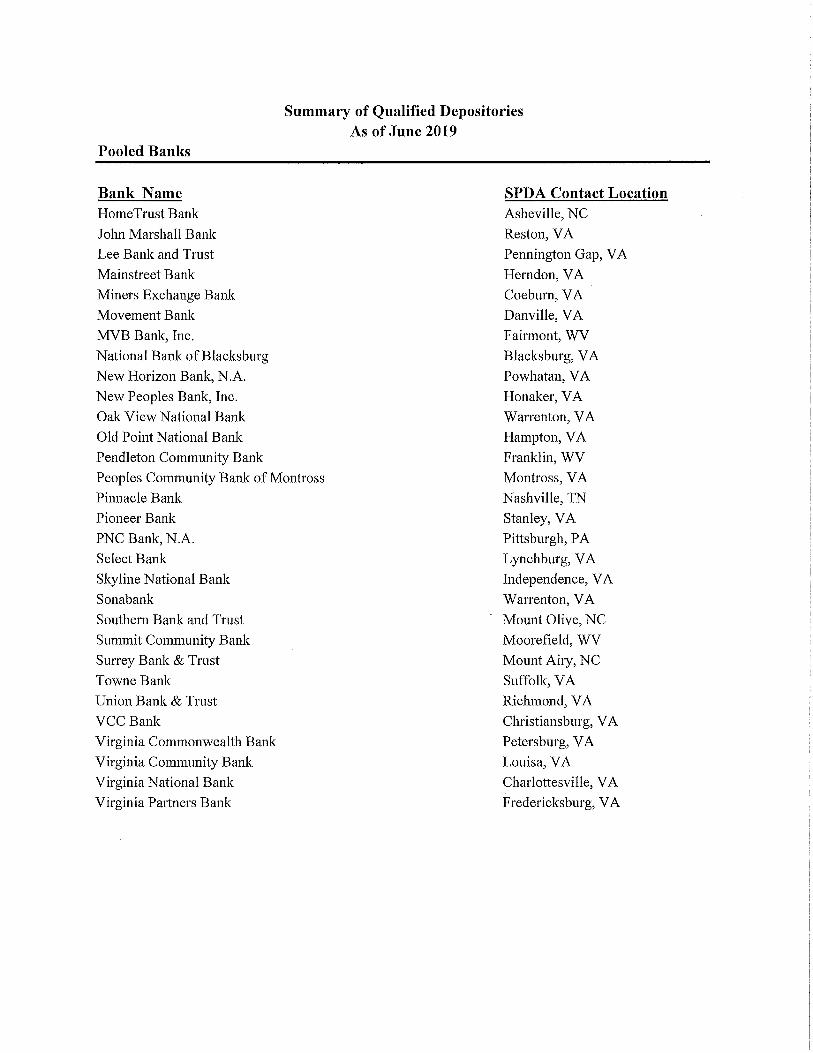
Chairwoman Ganeriwala asked for a motion to approve the Resolution. Mr. Amin moved that the Resolution be adopted. Mr. Carney seconded, and the motion carried unanimously. Extended Duration Credit Portfolio Intermediate Duration Manager Review: Wellington Karen Logan of Optimal Services briefed the Board on the General Account External Managers’ investment performance and the Quarterly Investment Manager Performance of TICR Endowment for taxable and tax-exempt portfolios. Ms. Logan then introduced the following representatives of Wellington Management: Joe Marvan – Fixed Income Portfolio Manager, Jed Synnestvedt – Associate Director of Global Relationship Group, Anand Dharan – Investment Director, and Jason Law – Relationship Manager. Mr. Law provided an overview of Wellington Management and Mr. Marvan reviewed the Department of Treasury’s portfolio. Discussion ensued. Mr. Synnestvedt thanked the Board for its relationship with Wellington Management and stated that they are willing to offer experts to attend a future meeting and answer any questions of the Board. He also extended an open invitation for the Board to visit Wellington Management in Boston. Staff Reports Debt Management Janet Aylor reviewed the Debt Calendar as of July 1, 2019 and the leasing reports as of June 30, 2019. She informed the Board that new leases for $4.1 million were provided in June for vehicles and equipment. She also informed the Board that $28.6 million was used to date under the Master Lease Program leaving a line of credit balance of $13.5 million. In addition, $19.3 million was previously provided under the Energy Lease Program and the line of credit balance is $20.7 million. There was no new activity in the Energy Lease Program. Ms. Aylor reviewed the Final Financing Summaries for bond sales that were completed earlier this year. Discussion ensued. One particular Final Financing Summary showed a wide spread between the lowest and the highest bids. Ms. Aylor will reach out to the underwriters to discuss the possibility of holding second round bids in such an instance going forward. Board member Craig Burns left the meeting at 10:30. Security for Public Deposits Kristin Reiter reviewed the Security for Public Deposits Report for the month ended May 31, 2019. No qualified public depositories were undercollateralized in May. Ms. Reiter reported that First Tennessee Bank closed its only branch bank in Virginia in April 2019 and thus had to withdraw from the SPDA Program. Ms. Reiter reported that the IDC bank ratings had been updated using IDC’s 1st quarter 2019 ratings. One pooled bank, Carter Bank & Trust, and one opt-out bank, Bank of Fincastle, were removed from the listing of

4
depositories with below average ratings. As of May 2019, no qualified public depositories were rated below average by IDC. State Non-Arbitrage Program Nelson Bush reviewed the SNAP report as of June 30, 2019. The fund’s assets were valued at $4.3 billion. The monthly yield was 2.5%, decreasing from May’s yield of 2.55%. The weighted average maturity of the fund was 46 days. Mr. Bush reported that Chesapeake Hospital Authority is a new Program participant. Mr. Bush reported that this is SNAP’s 30th anniversary. In the last 15 years, SNAP has helped Virginia invest $43 billion. In the last 10 years, it has returned $712 million investment earnings. On September 17, they will hold a SNAP users’ meeting in Charlottesville. Investments Neil Boege reviewed the Investment reports for the month ended June 30, 2019. US Treasury yields continued to decline during June. The General Account portfolio was valued at $8.9 billion. The average yield on the Primary Liquidity portion of the General Account was 2.51%, down from May’s average yield of 2.53%. The Extended Duration portion of the portfolio had a yield to maturity of 2.40%, down from May’s yield to maturity of 2.60%. This resulted in the composite yield being 2.49% for the month, down from May’s yield to maturity of 2.54%. Mr. Boege then reported on the LGIP portfolio, which was in compliance for all measures for the month of June and was valued at $4.7 million. The average yield on the portfolio was 2.49%, down from May’s average yield of 2.58%. The average maturity was 39 days, down six days from the previous month. Mr. Boege then reviewed the LGIP Extended Maturity portfolio, which was in compliance for all measures for the month of June. The net asset value yield to maturity was 2.41%, down from May’s net asset value yield to maturity of 2.46%. The average duration was 0.88 years. Other Business Chairwoman Ganeriwala stated that the next Treasury Board meeting is scheduled for August 15, 2019. The meeting adjourned at 10:51 a.m. Respectfully submitted, ____________________________ Vernita Boone, Secretary Commonwealth of Virginia Treasury Board

FINAL FINANCING SUMMARY $158,620,000
Commonwealth of Virginia $54,325,000 General Obligation Bonds, Series 2019A (Negotiated)
$93,760,000 General Obligation Refunding Bonds, Series 2019B (Negotiated) $10,535,000 General Obligation Refunding Bonds, Series 2019C (Competitive) (Federally Taxable)
July 30, 2019
Page 1 of 5
Title: $158,620,000 Commonwealth of Virginia General Obligation Bonds and General Obligation Refunding Bonds consisting of (i) $54,325,000 General Obligation Bonds, Series 2019A (Negotiated) (the “2019A Bonds”), (ii) $93,760,000 General Obligation Refunding Bonds, Series 2019B (Negotiated) (the “2019B Bonds”) and (iii) $10,535,000 General Obligation Refunding Bonds, Series 2019C (Competitive) (Federally Taxable) (the “2019C Bonds” and together with the 2019A Bonds and the 2019B Bonds, the “Bonds”).
Issuer: Commonwealth of Virginia, by and through the Treasury Board Constitutional Reference: Article X, Section 9(a)(3) and 9(c) Legislative Reference: For the 2019A Bonds, Chapters 452 and 611 of the 2017 Virginia Acts of
Assembly, Chapters 730 and 731 of the 2016 Virginia Acts of Assembly, and Chapters 213 and 487 of the 2014 Virginia Acts of Assembly.
For the 2019B Bonds, Chapters 265 and 408 of the 1992 Virginia Acts of
Assembly. For the 2019C Bonds, Chapters 827, 859, 854 and 884 of the 2002 Virginia Acts
of Assembly, and Section 2.2-2419 of the Code of Virginia of 1950, as amended. Purpose: The proceeds of the 2019A Bonds will be used to (i) finance the costs of
constructing and equipping revenue-producing capital projects at institutions of higher education of the Commonwealth (see attached 9(c) project list) and (ii) pay costs of issuing the 2019A Bonds.
The proceeds of the 2019B Bonds will be used to (i) refund certain prior general
obligations of the Commonwealth and (ii) pay costs of issuing the 2019B Bonds. The proceeds of the 2019C Bonds along with available funds will be used to (i)
refund certain prior general obligations of the Commonwealth and (ii) pay costs of issuing the 2019C Bonds.
Security: The Bonds will be secured by: (i) with respect to 9(c) projects only the pledge of
net revenues derived from revenue producing capital projects at the applicable institution of higher education and certified as to their sufficiency by the Governor and (ii) with respect to 9(b) and 9(c) projects the Bonds will be secured by the full faith and credit of the Commonwealth.

FINAL FINANCING SUMMARY $158,620,000
Commonwealth of Virginia $54,325,000 General Obligation Bonds, Series 2019A (Negotiated)
$93,760,000 General Obligation Refunding Bonds, Series 2019B (Negotiated) $10,535,000 General Obligation Refunding Bonds, Series 2019C (Competitive) (Federally Taxable)
July 30, 2019
Page 2 of 5
Method of Sale: 2019A Bonds and 2019B Bonds: Negotiated. The underwriters were selected from the Commonwealth's pre-
approved pool of underwriters and pursuant to a supplemental information request process.
2019C Bonds: Competitive, using electronic bidding via Parity.
Pricing Date: July 30, 2019 Dated Date: Date of Delivery Delivery Date: On or about August 14, 2019 Bond Structure: For the 2019A Bonds, serial bonds paying current interest and maturing annually in
the years 2020 through 2039.
For the 2019B Bonds, serial bonds paying current interest and maturing annually in the years 2020 through 2024.
For the 2019C Bonds, serial bonds paying current interest and maturing annually in the years 2020 through 2029.
Principal Payment The Bonds will pay annually on June 1, beginning June 1, 2020. Dates: Interest Payment Semiannually on June 1 and December 1, beginning December 1, 2019. Dates: Redemption Provisions: The 2019A Bonds maturing on or after June 1, 2030 are subject to optional
redemption by the Treasury Board on or after June 1, 2029, from any money available for such purpose, in whole or in part (if in part, in any integral multiple of $5,000) at par, plus accrued interest to the redemption date.
The 2019B Bonds are not subject to optional redemption. The 2019C Bonds may be redeemed prior to their respective maturities in whole
or in part (if in part, in any integral multiple of $5,000) at any time at the Make-Whole Redemption Price.

FINAL FINANCING SUMMARY $158,620,000
Commonwealth of Virginia $54,325,000 General Obligation Bonds, Series 2019A (Negotiated)
$93,760,000 General Obligation Refunding Bonds, Series 2019B (Negotiated) $10,535,000 General Obligation Refunding Bonds, Series 2019C (Competitive) (Federally Taxable)
July 30, 2019
Page 3 of 5
Denomination: $5,000 or multiples thereof. Registration Provisions: Book-Entry Only Underwriters: 2019A Bonds and 2019B Bonds: Book-Running Senior Manager: Bank of America, N.A. Co-Managers: Citigroup Global Markets, Inc. Davenport & Company LLC Raymond James Siebert Cisneros Shank & Co., L.L.C.
2019C Bonds: Janney Montgomery Scott LLC Summary of Bids for the 2019C Bonds:
Underwriter Bid TIC Janney Montgomery Scott 2.220608% Piper Jaffray 2.241329% Raymond James 2.242998% Davenport 2.266365% Wells Fargo 2.267007% Morgan Stanley 2.286598% Fidelity 2.287909% SunTrust 2.288826% BNYMellon 2.292704% Fifth Third 2.308718% Citigroup 2.344744% BOK Financial 2.356112% BAML 2.366147% Barclays 2.371015% J.P. Morgan 2.429347% Northland Securities 2.438959%
Estimated True 2019A Bonds: 2.5158% Interest Cost: 2019B Bonds: 1.3488% 2019C Bonds: 2.4305% (as of June 26, 2019, as reported in the Preliminary Financing Summary dated July
10, 2019)

FINAL FINANCING SUMMARY $158,620,000
Commonwealth of Virginia $54,325,000 General Obligation Bonds, Series 2019A (Negotiated)
$93,760,000 General Obligation Refunding Bonds, Series 2019B (Negotiated) $10,535,000 General Obligation Refunding Bonds, Series 2019C (Competitive) (Federally Taxable)
July 30, 2019
Page 4 of 5
Maximum True Treasury Board Resolution Interest Cost: 2019A Bonds: 3.50% 2019B Bonds: 2.50% 2019C Bonds: 3.50% True Interest Cost: 2019A Bonds: 2.2670% Interest Cost: 2019B Bonds: 1.1442% 2019C Bonds: 2.2199%
(based on final sizing) Savings on Refunded Bonds: Series 2019B Bonds: Net Total Savings: $6,857,458 Net PV Savings: $6,718,082 Ratio of Net PV Savings to Refunded Par: 6.7529% Series 2019C Bonds: Net Total Savings: $2,662,046 Net PV Savings: $ 949,402 Ratio of Net PV Savings to Refunded Par: 4.0034% Ratings: Moody's Investors Service, Inc.: Aaa Standard & Poor's: AAA Fitch Ratings, Inc.: AAA Bond Counsel: Kaufman & Canoles, P.C., Richmond, Virginia Financial Advisors: Public Resources Advisory Group, New York, New York Estimated Costs of Issuance: $225,000, excluding underwriters’ discount.
Cost of Issuance Estimate Moody's $ 35,000 S&P 32,500 Fitch 35,000 Financial Advisor 58,500 Bond Counsel 50,000 Printers 1,500 Verification Agent 1,000 Bond Buyer 1,811 BondLink 5,000 Contingency 4,689 Total $ 225,000
FINAL FINANCING SUMMARY $158,620,000
Commonwealth of Virginia $54,325,000 General Obligation Bonds, Series 2019A (Negotiated)
$93,760,000 General Obligation Refunding Bonds, Series 2019B (Negotiated) $10,535,000 General Obligation Refunding Bonds, Series 2019C (Competitive) (Federally Taxable)
July 30, 2019
Page 5 of 5
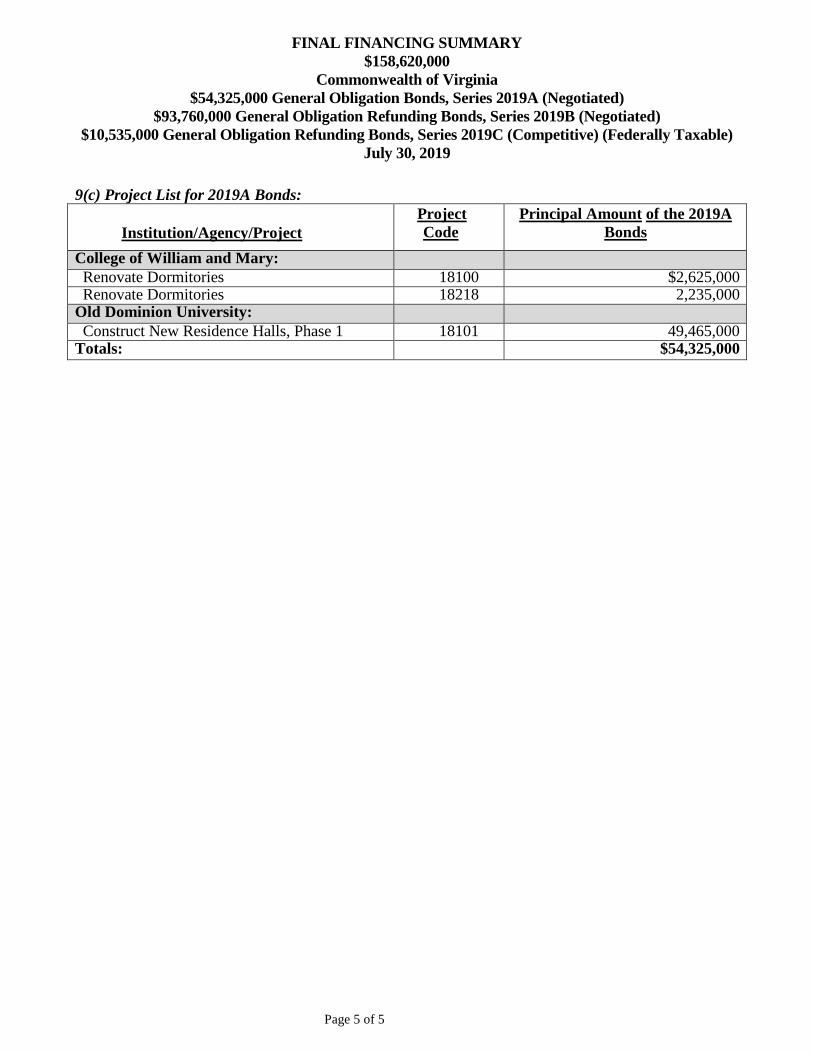
9(c) Project List for 2019A Bonds:
Institution/Agency/Project Project Code
Principal Amount of the 2019A Bonds
College of William and Mary: Renovate Dormitories 18100 $2,625,000 Renovate Dormitories 18218 2,235,000 Old Dominion University: Construct New Residence Halls, Phase 1 18101 49,465,000 Totals: $54,325,000

FINAL METHOD
SALE DATE ISSUER PURPOSE AMOUNT MATURITY OF SALE
August 2019
September 2019
17 ** Virginia Housing Development Authority Rental Housing Bonds, 2019 Series D - Non-AMT $20,000,000 ** 2054 Competitive
17 ** Virginia Housing Development Authority Rental Housing Bonds, 2019 Series E - Taxable $50,000,000 ** 2054 Competitive
October 2019
16 ** Virginia Public School Authority Special Obligation School Financing Bonds, Prince William County TBD ** TBD TBD
22 ** Virginia Public School Authority School Financing Revenue Bonds (1997 Resolution) Series 2019C TBD ** TBD Competitive
30 ** Virginia Resources Authority Virginia Pooled Financing Program, Series 2019C TBD ** TBD Negotiated
November 2019
6 ** Virginia College Building Authority Educational Facilities Revenue Bonds (Public Higher Ed Financing Program TBD ** TBD Competitive
Series 2019A & B
TBD ** Virginia College Building Authority Educational Facilities Revenue Refunding Bonds (21st Century College and TBD ** 2030 Competitive
Equipment Programs), Series 2019B
December 2019
January 2020
* Division of Debt Management participating
** Preliminary, subject to change
Prepared for the Commonwealth Treasury Board.
This Calendar may be found on the Department of the Treasury's Web Site "www.trs.virginia.gov"
COMMONWEALTH OF VIRGINIA
TREASURY BOARD
VIRGINIA DEBT CALENDAR
As of August 1, 2019
The information contained herein, while not guaranteed by the Commonwealth of Virginia Treasury Board, has been obtained from sources which the Treasury Board believes to be reliable and accurate.
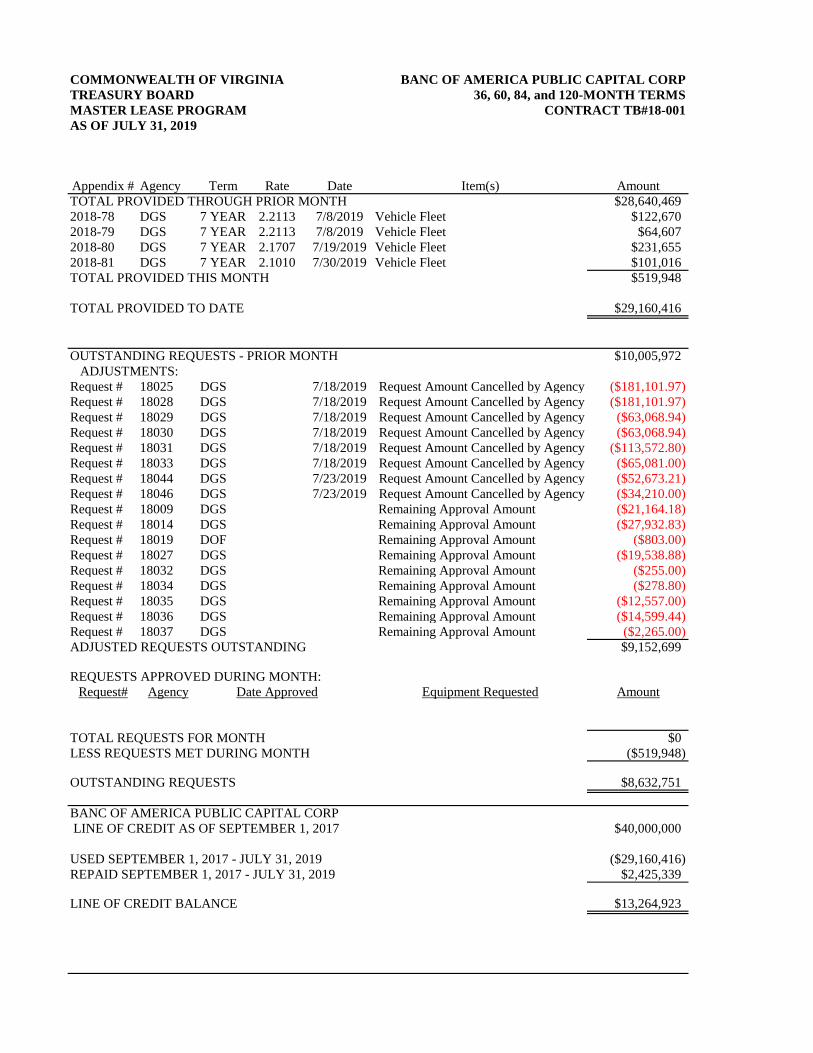
COMMONWEALTH OF VIRGINIA BANC OF AMERICA PUBLIC CAPITAL CORP
TREASURY BOARD 36, 60, 84, and 120-MONTH TERMS
MASTER LEASE PROGRAM CONTRACT TB#18-001
AS OF JULY 31, 2019
Appendix # Agency Term Rate Date Item(s) Amount
TOTAL PROVIDED THROUGH PRIOR MONTH $28,640,469
2018-78 DGS 7 YEAR 2.2113 7/8/2019 Vehicle Fleet $122,670
2018-79 DGS 7 YEAR 2.2113 7/8/2019 Vehicle Fleet $64,607
2018-80 DGS 7 YEAR 2.1707 7/19/2019 Vehicle Fleet $231,655
2018-81 DGS 7 YEAR 2.1010 7/30/2019 Vehicle Fleet $101,016
TOTAL PROVIDED THIS MONTH $519,948
TOTAL PROVIDED TO DATE $29,160,416
OUTSTANDING REQUESTS - PRIOR MONTH $10,005,972
ADJUSTMENTS:
Request # 18025 DGS 7/18/2019 Request Amount Cancelled by Agency ($181,101.97)
Request # 18028 DGS 7/18/2019 Request Amount Cancelled by Agency ($181,101.97)
Request # 18029 DGS 7/18/2019 Request Amount Cancelled by Agency ($63,068.94)
Request # 18030 DGS 7/18/2019 Request Amount Cancelled by Agency ($63,068.94)
Request # 18031 DGS 7/18/2019 Request Amount Cancelled by Agency ($113,572.80)
Request # 18033 DGS 7/18/2019 Request Amount Cancelled by Agency ($65,081.00)
Request # 18044 DGS 7/23/2019 Request Amount Cancelled by Agency ($52,673.21)
Request # 18046 DGS 7/23/2019 Request Amount Cancelled by Agency ($34,210.00)
Request # 18009 DGS Remaining Approval Amount ($21,164.18)
Request # 18014 DGS Remaining Approval Amount ($27,932.83)
Request # 18019 DOF Remaining Approval Amount ($803.00)
Request # 18027 DGS Remaining Approval Amount ($19,538.88)
Request # 18032 DGS Remaining Approval Amount ($255.00)
Request # 18034 DGS Remaining Approval Amount ($278.80)
Request # 18035 DGS Remaining Approval Amount ($12,557.00)
Request # 18036 DGS Remaining Approval Amount ($14,599.44)
Request # 18037 DGS Remaining Approval Amount ($2,265.00)
ADJUSTED REQUESTS OUTSTANDING $9,152,699
REQUESTS APPROVED DURING MONTH:
Request# Agency Date Approved Equipment Requested Amount
TOTAL REQUESTS FOR MONTH $0
LESS REQUESTS MET DURING MONTH ($519,948)
OUTSTANDING REQUESTS $8,632,751
BANC OF AMERICA PUBLIC CAPITAL CORP
LINE OF CREDIT AS OF SEPTEMBER 1, 2017 $40,000,000
USED SEPTEMBER 1, 2017 - JULY 31, 2019 ($29,160,416)
REPAID SEPTEMBER 1, 2017 - JULY 31, 2019 $2,425,339
LINE OF CREDIT BALANCE $13,264,923

COMMONWEALTH OF VIRGINIA APPROVED REQUESTS - BANC OF AMERICA PUBLIC CAPITAL CORP
TREASURY BOARD
MASTER LEASING PROGRAM
AS OF JULY 31, 2019
Date Payment Request Lease Appendix Partial/ Remaining
Request # Agency Approved Equipment Requested Term Mode Amount Amount Number Final Authorization
18001 VSP 10/17/2017 Quantar Site Repeaters 10 Year Monthly 5,336,980.00 5,336,980.00 2018-04 Final 0.00
18002 DGS 10/13/2017 ANKOM A200 Analyzer 5 Year Semi-Annual 16,841.00 16,841.00 2018-10 Final 0.00
18003 DGS 10/13/2017 Lab Density Meter 5 Year Semi-Annual 40,653.00 40,653.00 2018-07 Final 0.00
18004 DGS 10/13/2017 Gas Chromotograph 5 Year Semi-Annual 122,366.77 122,366.77 2018-02 Final 0.00
18005 DGS 10/13/2017 ANKOM HCI Hydrolysis 5 Year Semi-Annual 36,442.25 35,982.25 2018-11 Final 0.00
18006 DGS 10/13/2017 Mini Flash 5 Year Semi-Annual 47,320.00 47,320.00 2018-20 Final 0.00
18007 DGS 10/13/2017 Environmental Analyzer 5 Year Semi-Annual 53,797.93 53,797.92 2018-01 Final 0.00
18008 VCUHSA 10/26/2017 New MRI 5 Year Monthly 2,450,000.00 0.00 2,450,000.00
18009 DGS 11/30/2017 181 Vehicle Fleet 7 Year Monthly 3,231,359.33 229,499.61 2018-05 Partial
286,559.95 2018-08 Partial
402,480.72 2018-09 Partial
261,032.86 2018-14 Partial
235,695.00 2018-15 Partial
329,973.00 2018-16 Partial
377,112.00 2018-17 Partial
377,112.00 2018-18 Partial
259,505.68 2018-21 Partial
74,094.36 2018-28 Partial
172,947.03 2018-30 Partial
54,407.14 2018-35 Partial
149,775.80 2018-37 Final 0.00
18010 CNU 11/30/2017 L6060 HSTC Tractor 5 Year Monthly 37,350.00 37,350.00 2018-32 Partial 0.00
18011 VDEP 12/21/2017 XEROX Copier 5 Year Monthly 119,533.00 119,533.00 2018-33 Final 0.00
18012 DOF 1/11/2018 23 - 10 Wheel Cab Chassis & 23 Bulldozers 10 Year Monthly 6,700,000.00 1,813,044.00 2018-03 Partial
542,820.00 2018-06 Partial
812,100.00 2018-12 Partial
144,261.39 2018-13 Partial
329,740.32 2018-19 Partial
1,422,005.00 2018-25 Partial
247,371.00 2018-26 Partial 1,388,658.29
18013 DOF 1/11/2018 34 3/4 Ton Pickup Vehicle Outfitting 5 Year Monthly 74,284.56 47,697.90 2018-23 Partial
26,586.66 2018-40 Final 0.00
18014 DGS 1/11/2018 62 Vehicle Fleet 7 Year Monthly 1,431,073.27 386,407.46 2018-22 Partial
321,592.59 2018-24 Partial
385,557.99 2018-29 Partial
285,213.40 2018-31 Partial
24,369.00 2018-36 Final 0.00
18015 DOF 3/20/2018 (9) 1/2 Ton Pick-up Trucks 5 Year Monthly 305,000.00 170,867.90 2018-42 Partial
68,347.16 2018-43 Partial 65,784.94
18016 DOF 3/20/2018 (4) Fire Plows 10 Year Monthly 72,500.00 70,780.00 2018-32 Final 0.00
18017 VEDM 5/10/2018 (2) 2018 Chevrolet Tahoe Truck 5 Year Semi-Annual 75,193.81 75,193.81 2018-27 Final 0.00
18018 DFS 6/11/2018 (4) New Quadrupole Time of Flight 7 Year Semi-Annual 1,638,145.12 1,638,145.12 2018-39 Final 0.00
18019 DOF 6/11/2018 (20) Utility Task Vehicles (UTV) w/ trailers 5 Year Monthly 476,455.20 126,980.00 2018-45 Partial
Page 1

COMMONWEALTH OF VIRGINIA APPROVED REQUESTS - BANC OF AMERICA PUBLIC CAPITAL CORP
TREASURY BOARD
MASTER LEASING PROGRAM
AS OF JULY 31, 2019
Date Payment Request Lease Appendix Partial/ Remaining
Request # Agency Approved Equipment Requested Term Mode Amount Amount Number Final Authorization
348,672.20 2018-69 Final 0.00
18020 DOF 6/14/2018 (4) 3/4 Ton pick-ups 5 Year Monthly 150,000.00 123,419.56 2018-44 Partial 26,580.44
18021 DGS 7/16/2018 (2) Applied Biosystems Genetic Analyzers 5 Year Semi-Annual 569,958.40 569,958.40 2018-41 Final 0.00
18022 VDEM 8/1/2018 (1) Ford F-350 Super Duty Truck 5 Year Semi-Annual 43,921.00 43,921.00 2018-38 Final 0.00
18023 NSU 8/23/2018 Football Stadium Turf & Storm Drainage System 5 Year Semi-Annual 1,200,895.00 0.00 1,200,895.00
18024 DGS 9/19/2018 New Gas Chromatograph & Mass Spectrometer 3 Year Semi-Annual 93,029.85 0.00 93,029.85
18025 DGS 10/19/2018 New Gas Chromatograph & Mass Spectrometer 5 Year Monthly 0.00 0.00 0.00
18026 DGS 10/19/2018 Liquid Chromatograph with Diade Array Detector 5 Year Monthly 0.00 0.00 0.00
18027 DGS 10/19/2018 Liquid Chromatograph with Post Column Reactor 5 Year Monthly 109,920.44 90,381.56 2018-74 Final 0.00
18028 DGS 10/19/2018 New Gas Chromatograph & Mass Spectrometer 5 Year Monthly 0.00 0.00 0.00
18029 DGS 10/19/2018 Gas Chromatograph with Dual Electron Detectors 5 Year Monthly 0.00 0.00 0.00
18030 DGS 10/19/2018 Gas Chromatograph with Dual Electron Detectors 5 Year Monthly 0.00 0.00 0.00
18031 DGS 10/19/2018 LB 4200 Alpha/Beta Counter 5 Year Monthly 0.00 0.00 0.00
18032 DGS 10/19/2018 HACH Micro-Dist System w/Cyanide Analysis Manifold 5 Year Monthly 13,585.00 13,330.44 2018-56 Final 0.00
18033 DGS 10/19/2018 Integrion Ion Chromatograph 5 Year Monthly 0.00 0.00 0.00
18034 DGS 10/19/2018 Total Organix Carbon Analyzer 5 Year Monthly 33,396.50 33,117.70 2018-57 Final 0.00
18035 DGS 10/19/2018 LB 4200 Alpha/Beta Counter 5 Year Monthly 113,572.80 101,015.80 2018-81 Final 0.00
18036 DGS 10/19/2018 Metrohm Omnis System 5 Year Monthly 116,557.00 101,957.56 2018-61 Final 0.00
18037 DGS 10/24/2018 New ERAVAP Vapor Pressure Tester 3 Year Semi-Annual 37,413.71 35,148.71 2018-47 Final 0.00
18038 VDACS 10/25/2018 (2) Life Technologies 7500 Real-Time PCR System 3 Year Annually 84,630.00 0.00 0.00
18039 CNU 11/15/2018 New Video Wall 5 Year Monthly 120,009.04 120,009.04 2018-68 Final 0.00
18040 DGS 11/28/2018 Vehicle Fleet 7 Year Monthly 7,364,402.11 33,304.76 2018-46 Partial
355,731.03 2018-49 Partial
302,064.36 2018-50 Partial
311,503.00 2018-52 Partial
346,968.28 2018-53 Partial
450,210.32 2018-54 Partial
392,549.20 2018-58 Partial
457,219.00 2018-59 Partial
477,386.06 2018-62 Partial
344,404.34 2018-63 Partial
265,350.00 2018-64 Partial
353,800.00 2018-65 Partial
290,098.71 2018-66 Partial
176,900.00 2018-67 Partial
137,943.00 2018-70 Partial
265,123.00 2018-71 Partial
203,908.92 2018-72 Partial
137,943.00 2018-73 Partial
184,504.67 2018-75 Partial
138,548.65 2018-77 Partial
122,670.00 2018-78 Partial
231,655.00 2018-80 Partial 1,384,616.81
Page 2

COMMONWEALTH OF VIRGINIA APPROVED REQUESTS - BANC OF AMERICA PUBLIC CAPITAL CORP
TREASURY BOARD
MASTER LEASING PROGRAM
AS OF JULY 31, 2019
Date Payment Request Lease Appendix Partial/ Remaining
Request # Agency Approved Equipment Requested Term Mode Amount Amount Number Final Authorization
18041 UVAW 11/28/2018 IT Infrastructure 5 Year Monthly 3,295,091.03 3,032,790.56 2018-76 Partial 262,300.47
18042 DGS 11/29/2018 Vehicle Fleet 7 Year Monthly 1,194,002.97 60,838.24 2018-48 Partial
348,767.52 2018-51 Partial
54,595.80 2018-60 Partial
64,606.78 2018-79 Partial 665,194.63
18043 VDACS 1/9/2019 (1) New Large Capacity Truck 5 Year Annually 221,691.00 0.00 221,691.00
18044 DGS 1/17/2019 (1) New ERASPEC FTIR Instrument 5 Year Semi-Annual 0.00 0.00 0.00
18045 VIDC 1/25/2019 Computer Equipment and Hardware 5 Year Annually 874,000.00 0.00 874,000.00
18046 DGS 2/8/2019 New Element Analyzer 7 Year Monthly 0.00 0.00 0.00
18047 VDACS 2/25/2019 (2) Life Technologies 7500 Real-Time PCR System 3 Year Annually 78,000.00 78,000.00 2018-55 Final 0.00
TOTALS 37,979,371 29,160,416 8,632,751
Page 3

COMMONWEALTH OF VIRGINIA BANC OF AMERICA PUBLIC CAPITAL CORP
TREASURY BOARD 144-MONTH TERMS
ENERGY LEASE PROGRAM 180-MONTH TERMS
AS OF JULY 31, 2019 Contract TB18-002
Appendix # Agency Term Rate Date Item(s) Amount
TOTAL PROVIDED THROUGH PRIOR MONTH $19,362,660
TOTAL PROVIDED THIS MONTH $0
TOTAL PROVIDED TO DATE $19,362,660
OUTSTANDING REQUESTS - PRIOR MONTH $735,411
ADJUSTMENTS:
$0
ADJUSTED REQUESTS OUTSTANDING $735,411
REQUESTS APPROVED DURING MONTH:
Request# Agency Date Approved Equipment Requested Amount
TOTAL REQUESTS FOR MONTH $0
LESS REQUESTS MET DURING MONTH $0
OUTSTANDING REQUESTS $735,411
BANC OF AMERICA PUBLIC CAPITAL CORP
LINE OF CREDIT AS OF OCTOBER 1, 2017 $40,000,000
USED OCTOBER 1, 2017 - JULY 31, 2019 ($19,362,660)
REPAID OCTOBER 1, 2017 - JULY 31, 2019 153,597.35
LINE OF CREDIT BALANCE $20,790,937

COMMONWEALTH OF VIRGINIA APPROVED REQUESTS - BANC OF AMERICA PUBLIC CAPITAL CORP
TREASURY BOARD
ENERGY LEASING PROGRAM
AS OF JULY 31, 2019
Date Payment Request Lease Appendix Partial/ Remaining
Request # Agency Approved Equipment Requested Term Mode Amount Amount Number Final Authorization
18001 DGS 2/9/2018 Energy Efficiency Equipment 15 Years Semi-annual $2,812,940 $2,812,940 2018-01 Final $0
18002 DOC 6/27/2018 Energy Efficiency Equipment 15 Years Annual $14,489,720 $14,489,720 2018-02 TE Final $0
18002 DOC 6/27/2018 Energy Efficiency Equipment 15 Years Annual $2,060,000 $2,060,000 2018-02 TAX Final $0
18003 DMA 3/14/2019 Energy Efficiency Equipment 15 Years Annual $735,411 $0 $735,411
$0
TOTALS $20,098,071 $19,362,660 $735,411
Page 1


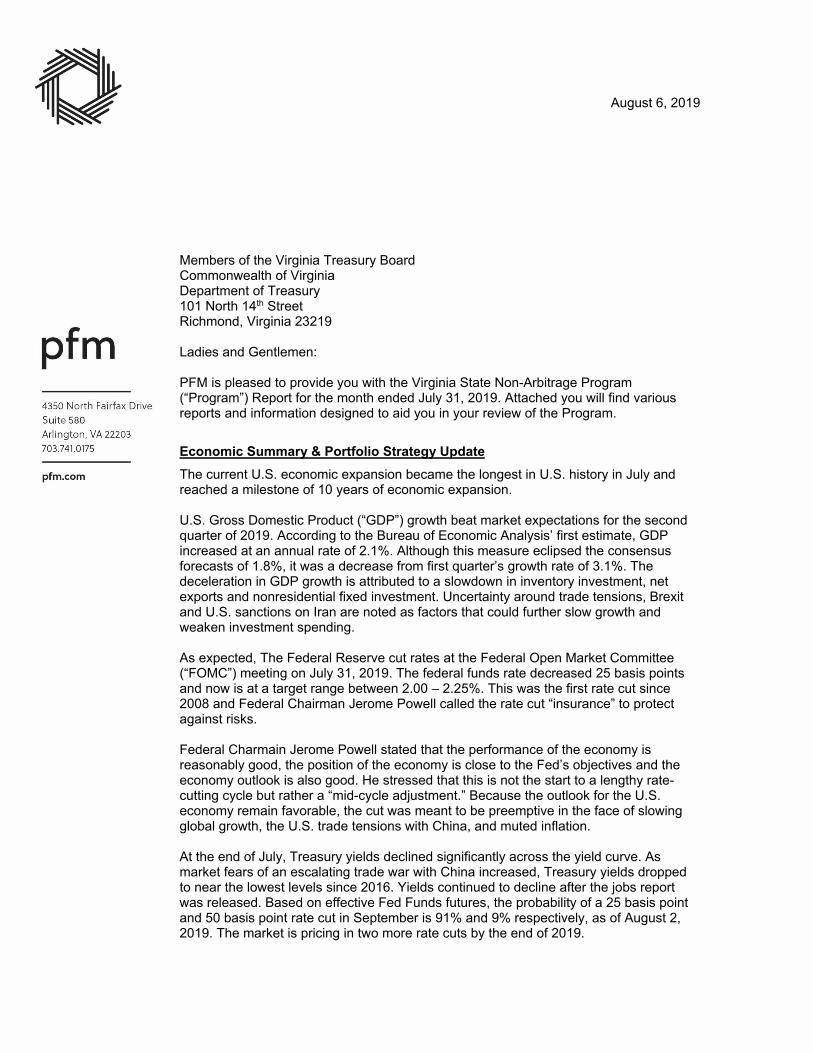
August 6, 2019
Members of the Virginia Treasury Board Commonwealth of Virginia Department of Treasury 101 North 14th Street Richmond, Virginia 23219 Ladies and Gentlemen: PFM is pleased to provide you with the Virginia State Non-Arbitrage Program (“Program”) Report for the month ended July 31, 2019. Attached you will find various reports and information designed to aid you in your review of the Program.
Economic Summary & Portfolio Strategy Update The current U.S. economic expansion became the longest in U.S. history in July and reached a milestone of 10 years of economic expansion. U.S. Gross Domestic Product (“GDP”) growth beat market expectations for the second quarter of 2019. According to the Bureau of Economic Analysis’ first estimate, GDP increased at an annual rate of 2.1%. Although this measure eclipsed the consensus forecasts of 1.8%, it was a decrease from first quarter’s growth rate of 3.1%. The deceleration in GDP growth is attributed to a slowdown in inventory investment, net exports and nonresidential fixed investment. Uncertainty around trade tensions, Brexit and U.S. sanctions on Iran are noted as factors that could further slow growth and weaken investment spending. As expected, The Federal Reserve cut rates at the Federal Open Market Committee (“FOMC”) meeting on July 31, 2019. The federal funds rate decreased 25 basis points and now is at a target range between 2.00 – 2.25%. This was the first rate cut since 2008 and Federal Chairman Jerome Powell called the rate cut “insurance” to protect against risks. Federal Charmain Jerome Powell stated that the performance of the economy is reasonably good, the position of the economy is close to the Fed’s objectives and the economy outlook is also good. He stressed that this is not the start to a lengthy rate-cutting cycle but rather a “mid-cycle adjustment.” Because the outlook for the U.S. economy remain favorable, the cut was meant to be preemptive in the face of slowing global growth, the U.S. trade tensions with China, and muted inflation. At the end of July, Treasury yields declined significantly across the yield curve. As market fears of an escalating trade war with China increased, Treasury yields dropped to near the lowest levels since 2016. Yields continued to decline after the jobs report was released. Based on effective Fed Funds futures, the probability of a 25 basis point and 50 basis point rate cut in September is 91% and 9% respectively, as of August 2, 2019. The market is pricing in two more rate cuts by the end of 2019.
Virginia Treasury Board August 6, 2019
Page 2 of 4
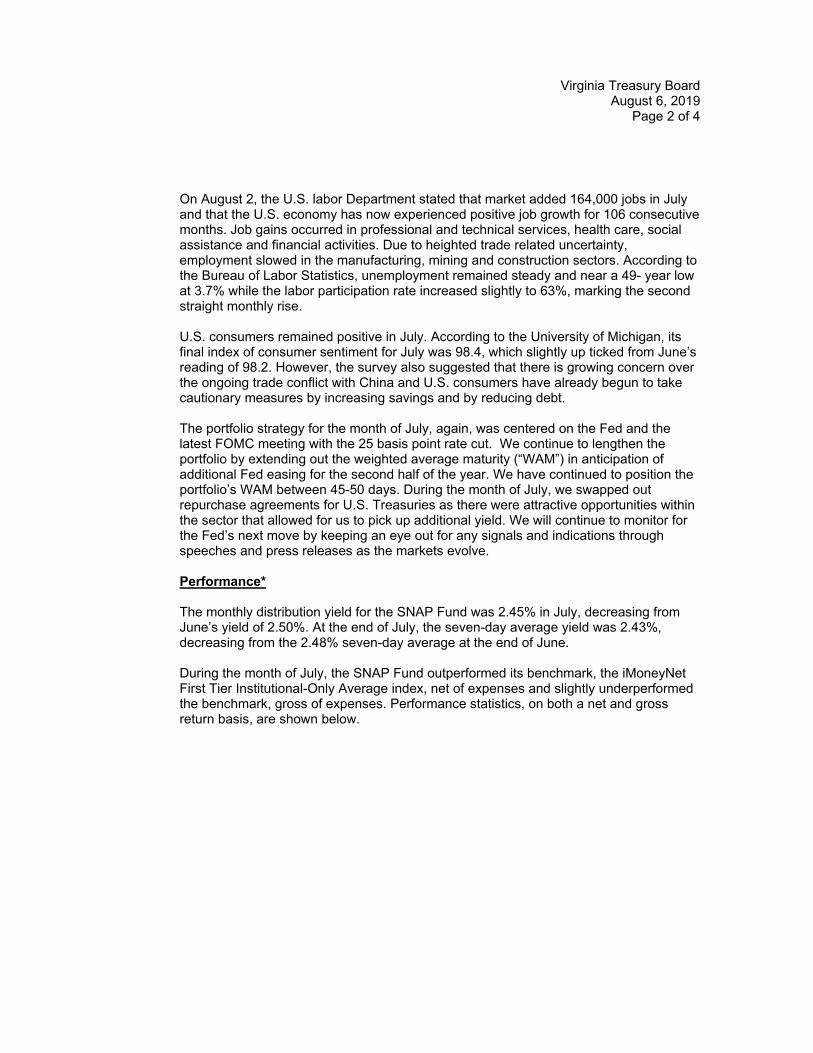
On August 2, the U.S. labor Department stated that market added 164,000 jobs in July and that the U.S. economy has now experienced positive job growth for 106 consecutive months. Job gains occurred in professional and technical services, health care, social assistance and financial activities. Due to heighted trade related uncertainty, employment slowed in the manufacturing, mining and construction sectors. According to the Bureau of Labor Statistics, unemployment remained steady and near a 49- year low at 3.7% while the labor participation rate increased slightly to 63%, marking the second straight monthly rise. U.S. consumers remained positive in July. According to the University of Michigan, its final index of consumer sentiment for July was 98.4, which slightly up ticked from June’s reading of 98.2. However, the survey also suggested that there is growing concern over the ongoing trade conflict with China and U.S. consumers have already begun to take cautionary measures by increasing savings and by reducing debt. The portfolio strategy for the month of July, again, was centered on the Fed and the latest FOMC meeting with the 25 basis point rate cut. We continue to lengthen the portfolio by extending out the weighted average maturity (“WAM”) in anticipation of additional Fed easing for the second half of the year. We have continued to position the portfolio’s WAM between 45-50 days. During the month of July, we swapped out repurchase agreements for U.S. Treasuries as there were attractive opportunities within the sector that allowed for us to pick up additional yield. We will continue to monitor for the Fed’s next move by keeping an eye out for any signals and indications through speeches and press releases as the markets evolve. Performance* The monthly distribution yield for the SNAP Fund was 2.45% in July, decreasing from June’s yield of 2.50%. At the end of July, the seven-day average yield was 2.43%, decreasing from the 2.48% seven-day average at the end of June. During the month of July, the SNAP Fund outperformed its benchmark, the iMoneyNet First Tier Institutional-Only Average index, net of expenses and slightly underperformed the benchmark, gross of expenses. Performance statistics, on both a net and gross return basis, are shown below.
Virginia Treasury Board August 6, 2019
Page 3 of 4
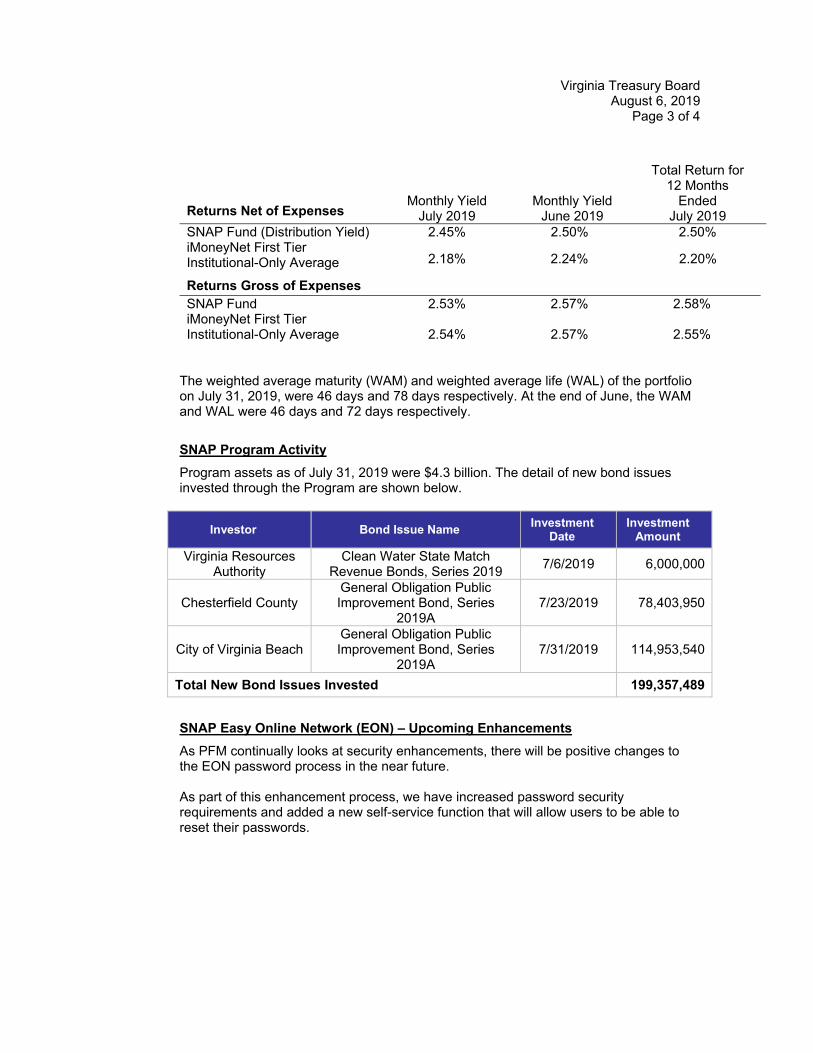
The weighted average maturity (WAM) and weighted average life (WAL) of the portfolio on July 31, 2019, were 46 days and 78 days respectively. At the end of June, the WAM and WAL were 46 days and 72 days respectively.
SNAP Program Activity
Program assets as of July 31, 2019 were $4.3 billion. The detail of new bond issues invested through the Program are shown below.
Investor Bond Issue Name Investment
Date Investment
Amount
Virginia Resources Authority
Clean Water State Match Revenue Bonds, Series 2019
7/6/2019 6,000,000
Chesterfield County General Obligation Public Improvement Bond, Series
2019A 7/23/2019 78,403,950
City of Virginia Beach General Obligation Public Improvement Bond, Series
2019A 7/31/2019 114,953,540
Total New Bond Issues Invested 199,357,489
SNAP Easy Online Network (EON) – Upcoming Enhancements
As PFM continually looks at security enhancements, there will be positive changes to the EON password process in the near future. As part of this enhancement process, we have increased password security requirements and added a new self-service function that will allow users to be able to reset their passwords.
Returns Net of Expenses Monthly Yield
July 2019 Monthly Yield
June 2019
Total Return for 12 Months
Ended July 2019
SNAP Fund (Distribution Yield) 2.45% 2.50% 2.50% iMoneyNet First Tier Institutional-Only Average 2.18% 2.24% 2.20%
Returns Gross of Expenses SNAP Fund 2.53% 2.57% 2.58% iMoneyNet First Tier Institutional-Only Average
2.54%
2.57%
2.55%

Virginia Treasury Board August 6, 2019
Page 4 of 4
Additional Information
PFM continues to provide oversight over the financial institutions that provide service to the Program and will keep Treasury Staff and the Treasury Board informed of any deviation in level of service. Please feel free to contact me if you have any questions. Sincerely, PFM Asset Management LLC
Nelson L. Bush Managing Director * The gross performance information represents the investment returns of the SNAP Fund before deducting fees and expenses, and does not reflect actual investment returns that investors in the SNAP Fund would experience. Gross performance is shown solely for purposes of comparison to the gross performance of certain indices. All of the yields and returns represent past performance, which is not a guarantee of future results that may be achieved by the SNAP Fund. The yield for a stable value fund more closely reflects the current earnings of the fund than its total return.
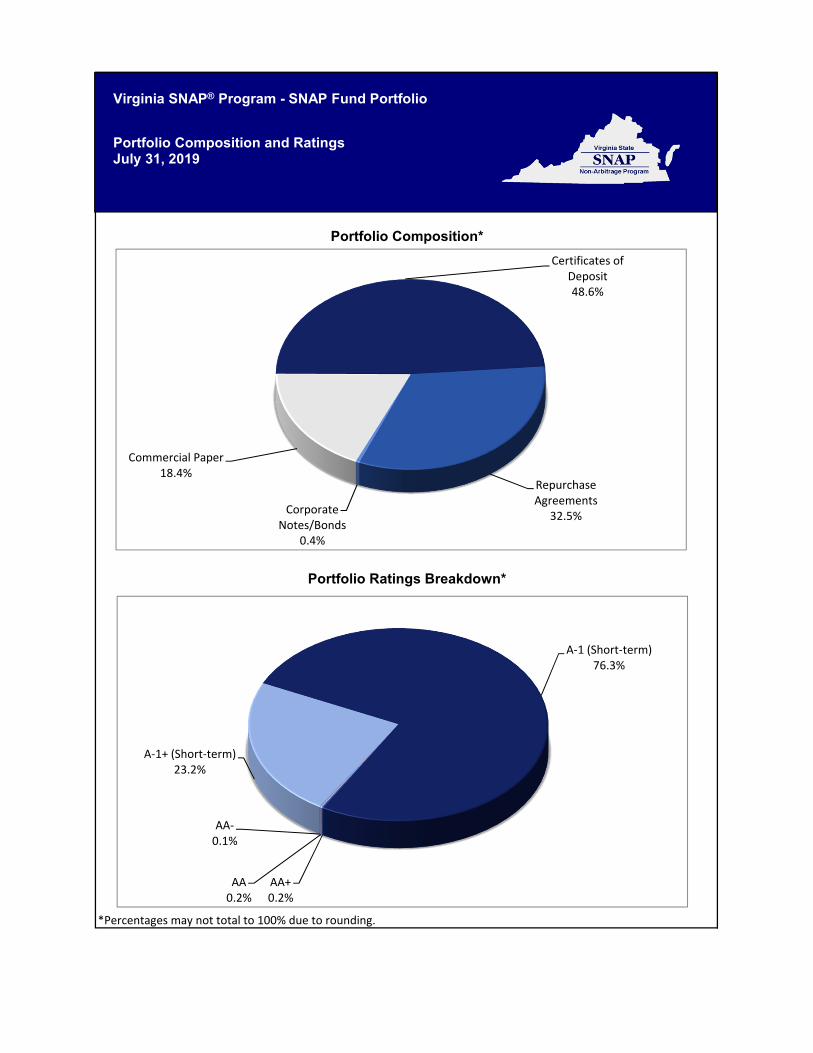
*Percentages may not total to 100% due to rounding.
Portfolio Composition*
Portfolio Ratings Breakdown*
Commercial Paper18.4%
Certificates of Deposit48.6%
Repurchase Agreements
32.5%Corporate
Notes/Bonds0.4%
AA+0.2%
AA0.2%
AA‐0.1%
A‐1+ (Short‐term)23.2%
A‐1 (Short‐term)76.3%
Virginia SNAP® Program - SNAP Fund Portfolio
Portfolio Composition and RatingsJuly 31, 2019
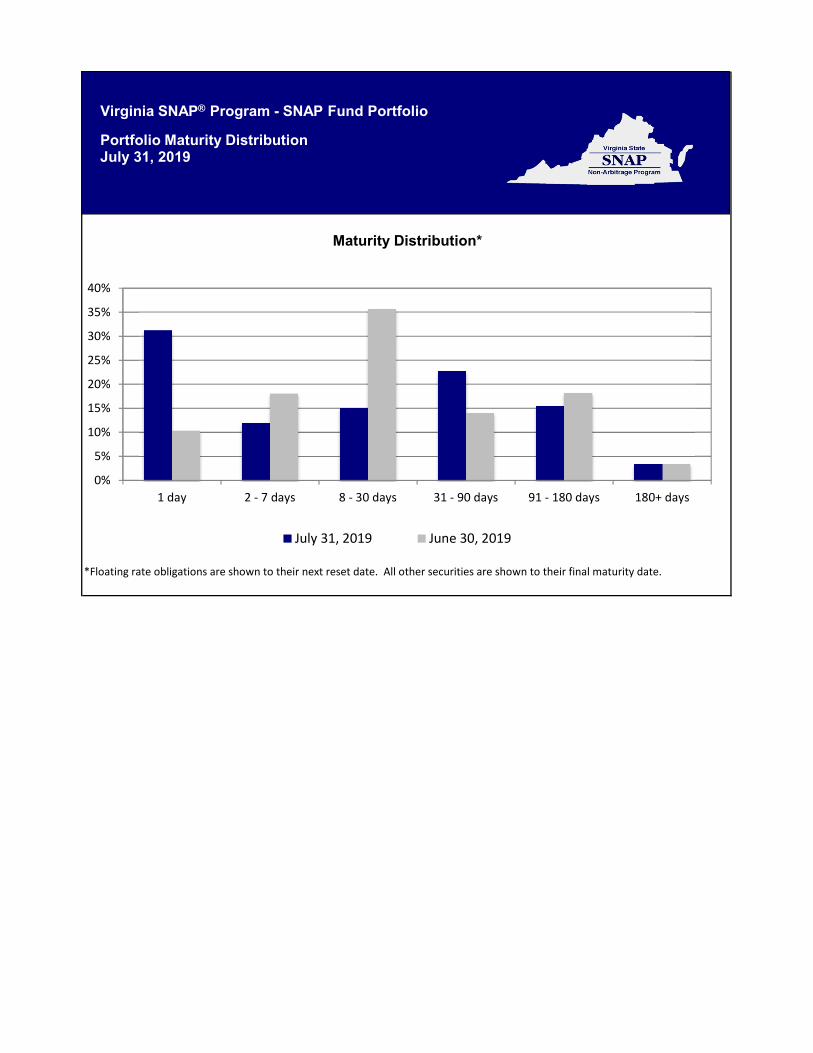
*Floating rate obligations are shown to their next reset date. All other securities are shown to their final maturity date.
Maturity Distribution*
0%
5%
10%
15%
20%
25%
30%
35%
40%
1 day 2 ‐ 7 days 8 ‐ 30 days 31 ‐ 90 days 91 ‐ 180 days 180+ days
July 31, 2019 June 30, 2019
Virginia SNAP® Program - SNAP Fund Portfolio
Portfolio Maturity DistributionJuly 31, 2019

July 31, 2019 June 30, 2019 Net ChangeDistribution Yield (Gross) 2.53% 2.57% (0.04%)Distribution Yield (Net) 2.45% 2.50% (0.05%)Average Maturity* 46 days 46 days 0 daysNet Assets $4,248,626,394 $4,287,405,585 ($38,779,191)Number of Accounts 810 818 (8)
1. MMKT is iMoneyNet U.S. Prime First Tier Institutional Average Money Market Funds Net Yields
2. SNAP Fund Net Monthly Distribution Yield
*Average Maturity of SNAP Fund
Net Performance Comparison
0.00%
0.50%
1.00%
1.50%
2.00%
2.50%
3.00%
Aug-17 Sep-17 Oct-17 Nov-17 Dec-17 Jan-18 Feb-18 Mar-18 Apr-18 May-18 Jun-18 Jul-18 Aug-18 Sep-18 Oct-18 Nov-18 Dec-18 Jan-19 Feb-19 Mar-19 Apr-19 May-19 Jun-19 Jul-19
MMKT ¹ SNAP ²
Virginia SNAP® Program - SNAP Fund Portfolio
Investment OverviewJuly 31, 2019
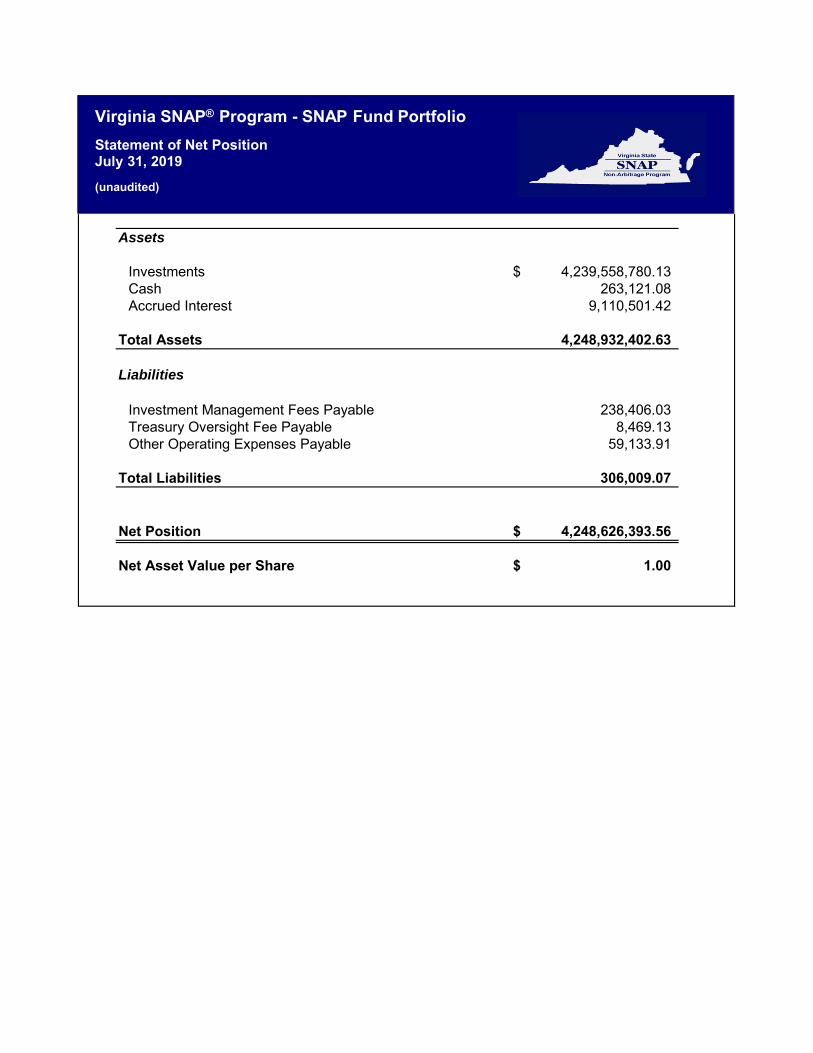
Assets
Investments 4,239,558,780.13$ Cash 263,121.08 Accrued Interest 9,110,501.42
Total Assets 4,248,932,402.63
Liabilities
Investment Management Fees Payable 238,406.03 Treasury Oversight Fee Payable 8,469.13 Other Operating Expenses Payable 59,133.91
Total Liabilities 306,009.07
Net Position 4,248,626,393.56$
Net Asset Value per Share 1.00$
Virginia SNAP® Program - SNAP Fund Portfolio
Statement of Net PositionJuly 31, 2019
(unaudited)
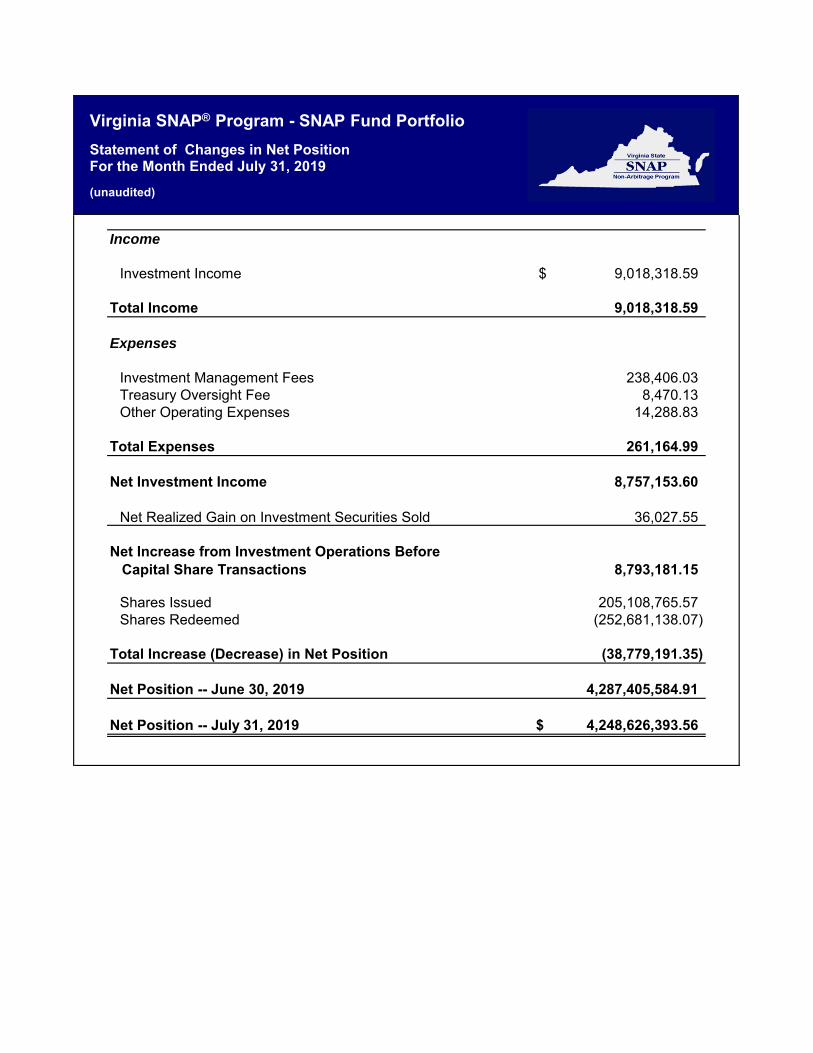
Income
Investment Income 9,018,318.59$
Total Income 9,018,318.59
Expenses
Investment Management Fees 238,406.03 Treasury Oversight Fee 8,470.13 Other Operating Expenses 14,288.83
Total Expenses 261,164.99
Net Investment Income 8,757,153.60
Net Realized Gain on Investment Securities Sold 36,027.55
Net Increase from Investment Operations Before Capital Share Transactions 8,793,181.15
Shares Issued 205,108,765.57 Shares Redeemed (252,681,138.07)
Total Increase (Decrease) in Net Position (38,779,191.35)
Net Position -- June 30, 2019 4,287,405,584.91
Net Position -- July 31, 2019 4,248,626,393.56$
Virginia SNAP® Program - SNAP Fund Portfolio
Statement of Changes in Net PositionFor the Month Ended July 31, 2019
(unaudited)

Page 1
To: Virginia Treasury Board Members From: PFM Asset Management LLC Subject: Virginia SNAP Fund (the “Fund”)
Compliance Checklist for the Month Ended July 31, 2019 I. Determination of Amortized Cost-Based and Market-Based Net Asset Value (NAVs)
A. Have the net asset values per share of each portfolio security been computed based upon
available market quotations (or an appropriate substitute which reflects current market conditions) at least weekly?
Date of Pricing 7/4/2019 7/11/2019 7/18/2019 7/25/2019
Average Maturity
47.5 Days 56.3 Days 53.7 Days 50.0 Days
Net Assets at Market
4,249.53 4,236.26 4,200.38 4,255.30
Shares Outstanding
4,248.26 4,235.07 4,199.29 4,254.24
NAV as of Pricing Date
1.00030 1.00028 1.00026 1.00025
Deviation from $1.00
0.00030 0.00028 0.00026 0.00025
B. Did the deviation of the market-based net asset value per share exceed 0.25%?
Yes No
If deviation was in excess of 0.25%: 1. Was the market-based NAV computation performed on a daily basis until the
deviation fell below 0.25%? Yes No Not Applicable
2. Was the Board informed of the situation and told what action, if any, was being taken?
Yes No Not Applicable

Page 2
C. Did deviation of the market-based net asset value per share exceed 0.3750%?
Yes No
If the deviation was in excess of 0.3750%, was a meeting of the Board was held to determine what action, if any, should be initiated by the Board? Please note action below.
D. Was the portfolio periodically stress tested?
Yes No
E. Is the Advisor completing a periodic stress test of the Fund and reporting any deviation of the market-based net asset value per share that exceeds 0.3750%?
Yes No II. Credit Quality
A. Were all corporate notes and bonds rated AA or above by both Standard & Poor’s (“S&P”)
and Moody’s Investors Services (“Moody’s”)? Yes No Not Applicable
B. Was all commercial paper rated in the top short term rating category by at least two
nationally recognized statistical ratings organizations?
Yes No Not Applicable
C. Were all bankers’ acceptances rated in the top short-term category by at least two nationally recognized statistical ratings organizations?
Yes No Not Applicable
D. Were all bank deposit notes and certificates of deposit, whether maturing in one year or
less (short-term rating applies) or greater than one year but not to exceed 13 months (long-term rating applies), rated in one of the two highest rating categories by both S&P and Moody’s?
Yes No Not Applicable
E. Was at least 50% of the portfolio composed of securities rated at least A-1+ by S&P? (Note: Securities rated A-1 that mature within 5 business days are considered A-1+ for S&P’s AAAm requirements.)
Yes No Not Applicable
Page 3
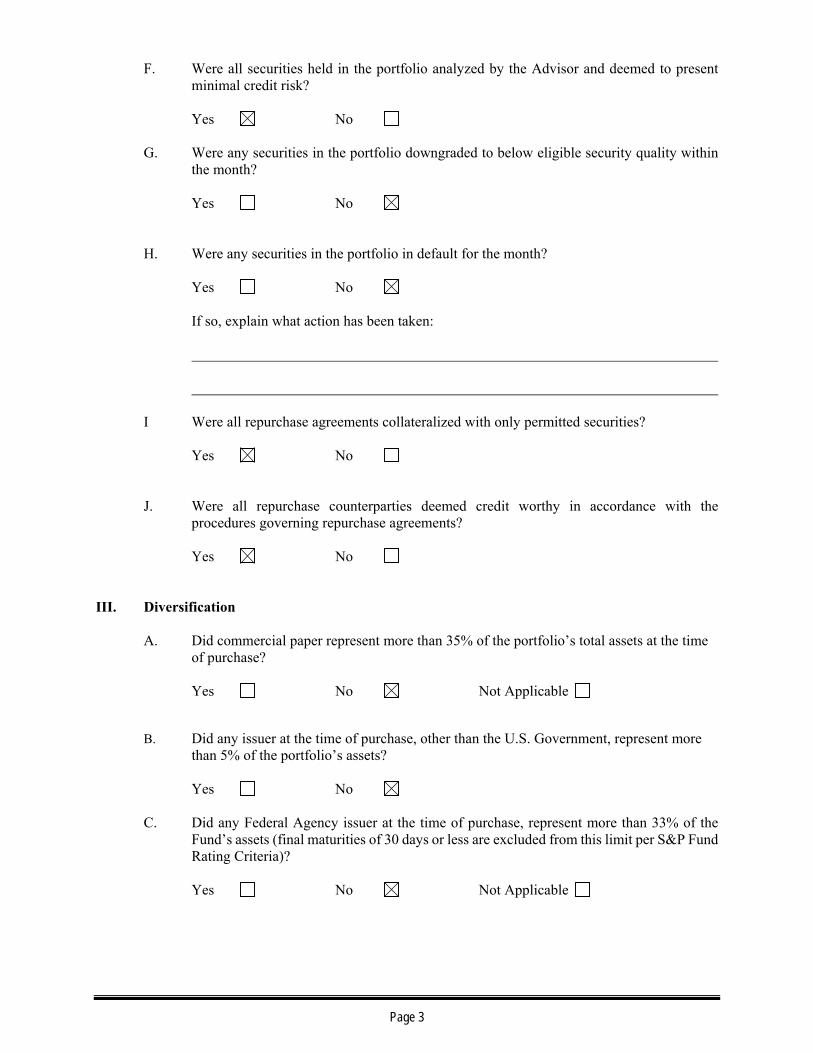
F. Were all securities held in the portfolio analyzed by the Advisor and deemed to present minimal credit risk?
Yes No
G. Were any securities in the portfolio downgraded to below eligible security quality within the month?
Yes No
H. Were any securities in the portfolio in default for the month?
Yes No
If so, explain what action has been taken: I Were all repurchase agreements collateralized with only permitted securities? Yes No J. Were all repurchase counterparties deemed credit worthy in accordance with the
procedures governing repurchase agreements? Yes No
III. Diversification A. Did commercial paper represent more than 35% of the portfolio’s total assets at the time
of purchase?
Yes No Not Applicable B. Did any issuer at the time of purchase, other than the U.S. Government, represent more
than 5% of the portfolio’s assets? Yes No
C. Did any Federal Agency issuer at the time of purchase, represent more than 33% of the
Fund’s assets (final maturities of 30 days or less are excluded from this limit per S&P Fund Rating Criteria)?
Yes No Not Applicable

Page 4
IV. Maturity A. Did the dollar weighted average maturity of the portfolio exceed 60 days?
Yes No
B. Did the dollar weighted average life of the portfolio exceed 120 calendar days? Yes No
C. The maximum remaining maturity of all securities in the portfolio does not exceed 397 calendar days, other than U.S. Government or federal agency obligations under repurchase agreements, or unless subject at the time of purchase to an irrevocable agreement on the part of the responsible person to purchase the security within 397 days.
Yes No
D. The maximum maturity of any single issue of commercial paper in the portfolio did not exceed 270 days at the time of purchase.
Yes No Not Applicable
E. The maximum maturity of any single banker’s acceptance in the portfolio did not exceed
180 days at the time of purchase.
Yes No Not Applicable F. Did the Fund acquire any security other than a Daily Liquid Asset, if immediately after
the acquisition, the Fund would have been invested in less than 10% Daily Liquid Assets?
Yes No
G. Did the Fund acquire any security other than a Weekly Liquid Asset, if immediately after
the acquisition, the Fund would have been invested in less than 30% Weekly Liquid Assets?
Yes No
H. Did the Fund acquire any security, when at the time of purchase; the security represented
more than 5% in illiquid securities?
Yes No

SNAP Fund Shares Outstanding 4,248,626,394
Individual PortfoliosCity of Norfolk 2008 Water Revenue DSRF 947,961 City of Norfolk 2010 Water Revenue DSRF 1,331,004 Northern Virginia Transportation Authority 2014 DSRF 2,167,109 Northern Virginia Transportation Commission 2018 VRA DSRF 2,019,202 City of Virginia Beach Storm Water DSRF 5,129,345 Spotsylvania County 2010A W&S DSRF 2,825,696 Spotsylvania County 2010B W&S DSRF 2,540,669
16,960,987$
TOTAL 4,265,587,380$
Virginia SNAP® Program
Summary of AssetsJuly 31, 2019

Date7-Day Yield Fund Purchases Fund Redemptions
Net Fund Activity Fund Balance
7/1/2019 2.48% $0 $10,228,135 -$10,228,135 $4,277,177,450
7/2/2019 2.48% $0 $27,740,424 -$27,740,424 $4,249,437,026
7/3/2019 2.48% $25,955 $1,206,074 -$1,180,119 $4,248,256,908
7/4/2019 2.48% $0 $0 $0 $4,248,256,908
7/5/2019 2.48% $0 $6,025,450 -$6,025,450 $4,242,231,458
7/8/2019 2.48% $0 $643,068 -$643,068 $4,241,588,390
7/9/2019 2.48% $6,000,000 $10,572,349 -$4,572,349 $4,237,016,040
7/10/2019 2.47% $0 $1,882,423 -$1,882,423 $4,235,133,617
7/11/2019 2.47% $0 $66,953 -$66,953 $4,235,066,665
7/12/2019 2.46% $1,542,336 $12,557,179 -$11,014,843 $4,224,051,822
7/15/2019 2.44% $0 $5,861,266 -$5,861,266 $4,218,190,556
7/16/2019 2.43% $0 $5,566,181 -$5,566,181 $4,212,624,375
7/17/2019 2.43% $0 $5,907,543 -$5,907,543 $4,206,716,832
7/18/2019 2.43% $0 $7,422,498 -$7,422,498 $4,199,294,334
7/19/2019 2.44% $762,048 $11,715,664 -$10,953,616 $4,188,340,718
7/22/2019 2.44% $0 $9,534,064 -$9,534,064 $4,178,806,653
7/23/2019 2.44% $78,403,950 $769,508 $77,634,442 $4,256,441,095
7/24/2019 2.43% $0 $1,577,459 -$1,577,459 $4,254,863,636
7/25/2019 2.43% $0 $621,612 -$621,612 $4,254,242,024
7/26/2019 2.43% $776,672 $17,919,847 -$17,143,175 $4,237,098,848
7/29/2019 2.42% $0 $7,146,695 -$7,146,695 $4,229,952,153
7/30/2019 2.42% $0 $15,051,227 -$15,051,227 $4,214,900,926
7/31/2019 2.43% $126,390,987 $92,665,519 $33,725,468 $4,248,626,394
TOTALS: $213,901,947 $252,681,138 -$38,779,191
Average Fund Balance: $4,232,100,645
Average Net Fund Activity: -$1,686,052
Total Fund Purchases $213,901,947Total Fund Redemptions $252,681,138
Fund Flows
Virginia SNAP® Program - SNAP Fund PortfolioMonth Ended July 31, 2019
SNAP Fund Trade Activity
$0
$500,000,000
$1,000,000,000
$1,500,000,000
$2,000,000,000
$2,500,000,000
$3,000,000,000
$3,500,000,000
$4,000,000,000
$4,500,000,000
$0
$20,000,000
$40,000,000
$60,000,000
$80,000,000
$100,000,000
$120,000,000
$140,000,000
7/1 7/3 7/5 7/7 7/9 7/11 7/13 7/15 7/17 7/19 7/21 7/23 7/25 7/27 7/29 7/31
Fu
nd
Ba
lan
ce
Pu
rch
ase
s a
nd
Re
de
mpt
ion
s
Fund Balance Fund Purchases Fund Redemptions

Schedule of Investments July 31, 2019For the Month Ending
SNAP® Fund Portfolio Virginia State Non-Arbitrage Program®
{VA SNAP POOL_2019-07-31}
Yield to Date for Date for(1) (2)
Maturity
Maturity
DateWALWAMMaturityCUSIP Category of Investment / Issuer Principal Value(3)
Maturity Final
(4)
U.S. Treasury Repurchase Agreement
RP9N1ITR7 2.39% 08/01/2019 08/01/2019 150,000,000.00BNP PARIBAS 08/01/2019 150,000,000.00
RPE300L36 2.53% 08/01/2019 08/01/2019 280,000,000.00BNP PARIBAS 08/01/2019 280,000,000.00
RP9J2NUE1 2.29% 08/07/2019 08/07/2019 100,000,000.00BNP PARIBAS 09/16/2019 100,000,000.00
RP9J2RGJ7 2.45% 08/01/2019 08/01/2019 100,000,000.00CREDIT AGRICOLE CIB/US 08/01/2019 100,000,000.00
RP1E2IIL9 2.24% 08/07/2019 08/07/2019 100,000,000.00CREDIT AGRICOLE CIB/US 09/03/2019 100,000,000.00
730,000,000.00 730,000,000.00 Category of Investment Sub-Total
U.S. Government Agency Repurchase Agreement
RPED00KJ0 2.52% 08/01/2019 08/01/2019 500,800,000.00CREDIT AGRICOLE CIB/US 08/01/2019 500,800,000.00
RP9N1LMH9 2.44% 08/01/2019 08/01/2019 75,000,000.00GOLDMAN SACHS & CO 08/01/2019 75,000,000.00
RP9J2NU76 2.36% 08/07/2019 08/07/2019 75,000,000.00GOLDMAN SACHS & CO 08/08/2019 75,000,000.00
650,800,000.00 650,800,000.00 Category of Investment Sub-Total
Other Instrument - Corporate Note
037833CK4 2.23% 02/07/2020 02/07/2020 6,900,000.00APPLE INC 02/07/2020 6,888,506.26
166764AG5 2.21% 06/24/2020 06/24/2020 8,200,000.00CHEVRON CORP 06/24/2020 8,215,863.65
89236TCF0 2.26% 03/12/2020 03/12/2020 3,730,000.00TOYOTA MOTOR CREDIT CORP 03/12/2020 3,727,480.74
18,830,000.00 18,831,850.65 Category of Investment Sub-Total
Non-Financial Company Commercial Paper
30229BXA0 2.29% 10/10/2019 10/10/2019 50,000,000.00EXXON MOBIL CORP 10/10/2019 49,779,305.60
30229BXN2 2.29% 10/22/2019 10/22/2019 30,000,000.00EXXON MOBIL CORP 10/22/2019 29,844,883.40
80,000,000.00 79,624,189.00 Category of Investment Sub-Total
Financial Company Commercial Paper
02665KW52 2.50% 09/05/2019 09/05/2019 77,900,000.00AMERICAN HONDA FINANCE 09/05/2019 77,712,174.25
06366HXN2 2.57% 10/22/2019 10/22/2019 25,000,000.00BANK OF MONTREAL CHICAGO 10/22/2019 24,855,646.02
09659CVV7 2.56% 08/29/2019 08/29/2019 50,000,000.00BNP PARIBAS NY BRANCH 08/29/2019 49,901,222.31
09659CX78 2.36% 10/07/2019 10/07/2019 40,000,000.00BNP PARIBAS NY BRANCH 10/07/2019 39,825,800.00
Page 1

Schedule of Investments July 31, 2019For the Month Ending
SNAP® Fund Portfolio Virginia State Non-Arbitrage Program®
{VA SNAP POOL_2019-07-31}
Yield to Date for Date for(1) (2)
Maturity
Maturity
DateWALWAMMaturityCUSIP Category of Investment / Issuer Principal Value(3)
Maturity Final
(4)
Financial Company Commercial Paper
22533UY64 2.57% 11/06/2019 11/06/2019 50,000,000.00CREDIT AGRICOLE CIB NY 11/06/2019 49,657,805.64
44988KHB8 2.61% 08/05/2019 11/04/2019 18,000,000.00(5)ING (US) FUNDING LLC 11/04/2019 18,000,000.00
44988KHE2 2.46% 08/08/2019 11/08/2019 20,000,000.00(5)ING (US) FUNDING LLC 11/08/2019 20,000,000.00
46640EHX9 2.47% 10/11/2019 10/11/2019 25,000,000.00(5)JP MORGAN SECURITIES LLC 10/11/2019 25,000,000.00
46640EJF6 2.41% 08/22/2019 11/22/2019 50,000,000.00(5)JP MORGAN SECURITIES LLC 11/22/2019 50,000,000.00
62479MYF4 2.77% 11/15/2019 11/15/2019 15,000,000.00MUFG BANK LTD/NY 11/15/2019 14,880,308.64
62479MZ97 2.75% 12/09/2019 12/09/2019 25,000,000.00MUFG BANK LTD/NY 12/09/2019 24,757,153.17
62479MZD8 2.72% 12/13/2019 12/13/2019 36,000,000.00MUFG BANK LTD/NY 12/13/2019 35,642,220.00
62479LD36 2.28% 04/03/2020 04/03/2020 24,000,000.00MUFG BANK LTD/NY 04/03/2020 23,632,639.96
63873KY43 2.59% 11/04/2019 11/04/2019 50,000,000.00NATIXIS NY BRANCH 11/04/2019 49,662,222.46
63873KYF8 2.42% 11/15/2019 11/15/2019 25,000,000.00NATIXIS NY BRANCH 11/15/2019 24,824,069.40
63873KYN1 2.26% 11/22/2019 11/22/2019 50,000,000.00NATIXIS NY BRANCH 11/22/2019 49,648,444.42
89233AU49 2.41% 08/20/2019 11/19/2019 55,000,000.00(5)TOYOTA MOTOR CREDIT CORP 11/19/2019 55,000,000.00
89233AW70 2.35% 10/16/2019 01/10/2020 20,000,000.00(5)TOYOTA MOTOR CREDIT CORP 01/10/2020 20,000,000.00
89233GAA4 2.62% 01/10/2020 01/10/2020 50,000,000.00TOYOTA MOTOR CREDIT CORP 01/10/2020 49,421,749.80
705,900,000.00 702,421,456.07 Category of Investment Sub-Total
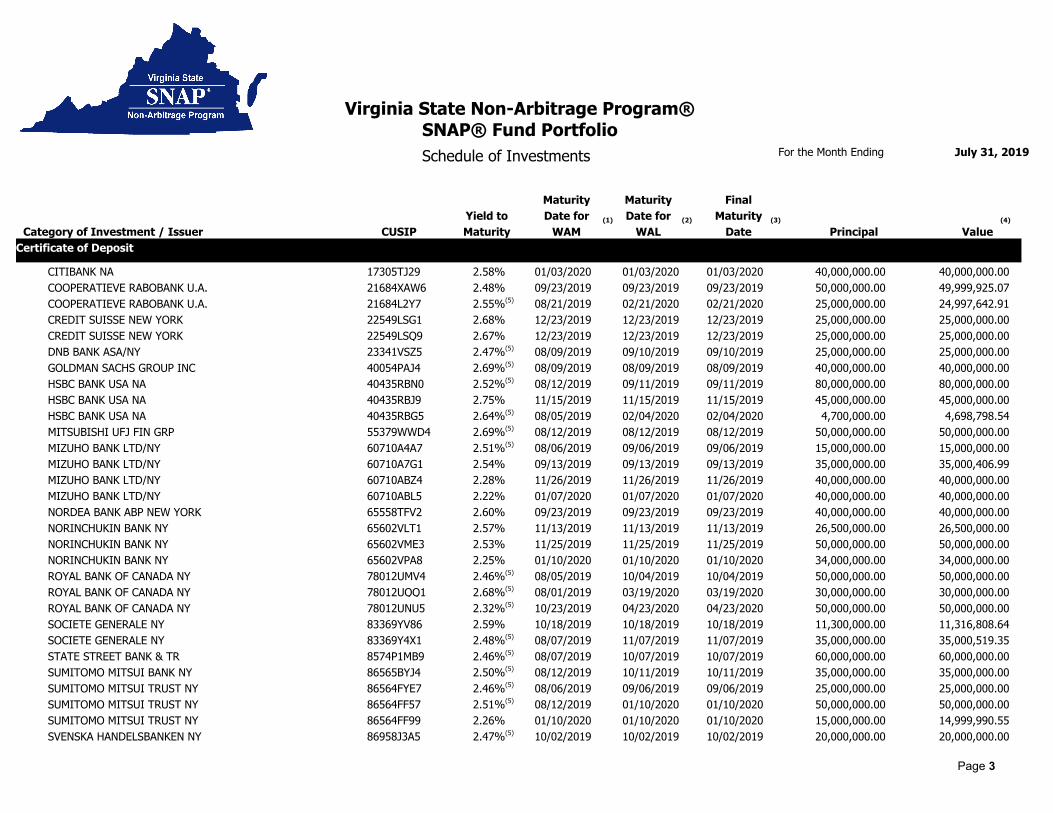
Certificate of Deposit
05252WQN6 2.58% 09/13/2019 09/13/2019 25,000,000.00(5)AUST & NZ BANKING GROUP 09/13/2019 25,000,000.00
06050FDM1 2.43% 08/15/2019 10/15/2019 65,000,000.00(5)BANK OF AMERICA NA 10/15/2019 65,000,000.00
06370RR43 2.31% 10/09/2019 10/09/2019 75,000,000.00BANK OF MONTREAL CHICAGO 10/09/2019 75,000,000.00
06417MAB1 2.64% 08/01/2019 04/09/2020 50,000,000.00(5)BANK OF NOVA SCOTIA HOUSTON 04/09/2020 50,000,000.00
05586FPW1 2.47% 10/08/2019 10/08/2019 30,000,000.00(5)BNP PARIBAS 10/08/2019 30,000,000.00
13606BUG9 2.80% 09/20/2019 09/20/2019 30,300,000.00(5)CANADIAN IMP BK COMM NY 09/20/2019 30,317,113.75
13606BH90 2.30% 10/25/2019 10/25/2019 17,000,000.00CANADIAN IMP BK COMM NY 10/25/2019 17,029,133.54
13606BD78 2.57% 09/18/2019 03/18/2020 14,000,000.00(5)CANADIAN IMP BK COMM NY 03/18/2020 14,009,887.32
13606B3V6 2.65% 08/01/2019 04/17/2020 30,000,000.00(5)CANADIAN IMP BK COMM NY 04/17/2020 30,000,000.00
13606B2Y1 2.65% 08/01/2019 07/01/2020 40,000,000.00(5)CANADIAN IMP BK COMM NY 07/01/2020 40,000,000.00
17305TG71 2.57% 10/21/2019 10/21/2019 70,000,000.00CITIBANK NA 10/21/2019 70,000,000.00
17305TJ94 2.22% 12/06/2019 12/06/2019 20,000,000.00CITIBANK NA 12/06/2019 20,000,000.00
Page 2
Schedule of Investments July 31, 2019For the Month Ending
SNAP® Fund Portfolio Virginia State Non-Arbitrage Program®
{VA SNAP POOL_2019-07-31}
Yield to Date for Date for(1) (2)
Maturity
Maturity
DateWALWAMMaturityCUSIP Category of Investment / Issuer Principal Value(3)
Maturity Final
(4)
Certificate of Deposit
17305TJ29 2.58% 01/03/2020 01/03/2020 40,000,000.00CITIBANK NA 01/03/2020 40,000,000.00
21684XAW6 2.48% 09/23/2019 09/23/2019 50,000,000.00COOPERATIEVE RABOBANK U.A. 09/23/2019 49,999,925.07
21684L2Y7 2.55% 08/21/2019 02/21/2020 25,000,000.00(5)COOPERATIEVE RABOBANK U.A. 02/21/2020 24,997,642.91
22549LSG1 2.68% 12/23/2019 12/23/2019 25,000,000.00CREDIT SUISSE NEW YORK 12/23/2019 25,000,000.00
22549LSQ9 2.67% 12/23/2019 12/23/2019 25,000,000.00CREDIT SUISSE NEW YORK 12/23/2019 25,000,000.00
23341VSZ5 2.47% 08/09/2019 09/10/2019 25,000,000.00(5)DNB BANK ASA/NY 09/10/2019 25,000,000.00
40054PAJ4 2.69% 08/09/2019 08/09/2019 40,000,000.00(5)GOLDMAN SACHS GROUP INC 08/09/2019 40,000,000.00
40435RBN0 2.52% 08/12/2019 09/11/2019 80,000,000.00(5)HSBC BANK USA NA 09/11/2019 80,000,000.00
40435RBJ9 2.75% 11/15/2019 11/15/2019 45,000,000.00HSBC BANK USA NA 11/15/2019 45,000,000.00
40435RBG5 2.64% 08/05/2019 02/04/2020 4,700,000.00(5)HSBC BANK USA NA 02/04/2020 4,698,798.54
55379WWD4 2.69% 08/12/2019 08/12/2019 50,000,000.00(5)MITSUBISHI UFJ FIN GRP 08/12/2019 50,000,000.00
60710A4A7 2.51% 08/06/2019 09/06/2019 15,000,000.00(5)MIZUHO BANK LTD/NY 09/06/2019 15,000,000.00
60710A7G1 2.54% 09/13/2019 09/13/2019 35,000,000.00MIZUHO BANK LTD/NY 09/13/2019 35,000,406.99
60710ABZ4 2.28% 11/26/2019 11/26/2019 40,000,000.00MIZUHO BANK LTD/NY 11/26/2019 40,000,000.00
60710ABL5 2.22% 01/07/2020 01/07/2020 40,000,000.00MIZUHO BANK LTD/NY 01/07/2020 40,000,000.00
65558TFV2 2.60% 09/23/2019 09/23/2019 40,000,000.00NORDEA BANK ABP NEW YORK 09/23/2019 40,000,000.00
65602VLT1 2.57% 11/13/2019 11/13/2019 26,500,000.00NORINCHUKIN BANK NY 11/13/2019 26,500,000.00
65602VME3 2.53% 11/25/2019 11/25/2019 50,000,000.00NORINCHUKIN BANK NY 11/25/2019 50,000,000.00
65602VPA8 2.25% 01/10/2020 01/10/2020 34,000,000.00NORINCHUKIN BANK NY 01/10/2020 34,000,000.00
78012UMV4 2.46% 08/05/2019 10/04/2019 50,000,000.00(5)ROYAL BANK OF CANADA NY 10/04/2019 50,000,000.00
78012UQQ1 2.68% 08/01/2019 03/19/2020 30,000,000.00(5)ROYAL BANK OF CANADA NY 03/19/2020 30,000,000.00
78012UNU5 2.32% 10/23/2019 04/23/2020 50,000,000.00(5)ROYAL BANK OF CANADA NY 04/23/2020 50,000,000.00
83369YV86 2.59% 10/18/2019 10/18/2019 11,300,000.00SOCIETE GENERALE NY 10/18/2019 11,316,808.64
83369Y4X1 2.48% 08/07/2019 11/07/2019 35,000,000.00(5)SOCIETE GENERALE NY 11/07/2019 35,000,519.35
8574P1MB9 2.46% 08/07/2019 10/07/2019 60,000,000.00(5)STATE STREET BANK & TR 10/07/2019 60,000,000.00
86565BYJ4 2.50% 08/12/2019 10/11/2019 35,000,000.00(5)SUMITOMO MITSUI BANK NY 10/11/2019 35,000,000.00
86564FYE7 2.46% 08/06/2019 09/06/2019 25,000,000.00(5)SUMITOMO MITSUI TRUST NY 09/06/2019 25,000,000.00
86564FF57 2.51% 08/12/2019 01/10/2020 50,000,000.00(5)SUMITOMO MITSUI TRUST NY 01/10/2020 50,000,000.00
86564FF99 2.26% 01/10/2020 01/10/2020 15,000,000.00SUMITOMO MITSUI TRUST NY 01/10/2020 14,999,990.55
86958J3A5 2.47% 10/02/2019 10/02/2019 20,000,000.00(5)SVENSKA HANDELSBANKEN NY 10/02/2019 20,000,000.00
Page 3
Schedule of Investments July 31, 2019For the Month Ending
SNAP® Fund Portfolio Virginia State Non-Arbitrage Program®
{VA SNAP POOL_2019-07-31}
Yield to Date for Date for(1) (2)
Maturity
Maturity
DateWALWAMMaturityCUSIP Category of Investment / Issuer Principal Value(3)
Maturity Final
(4)
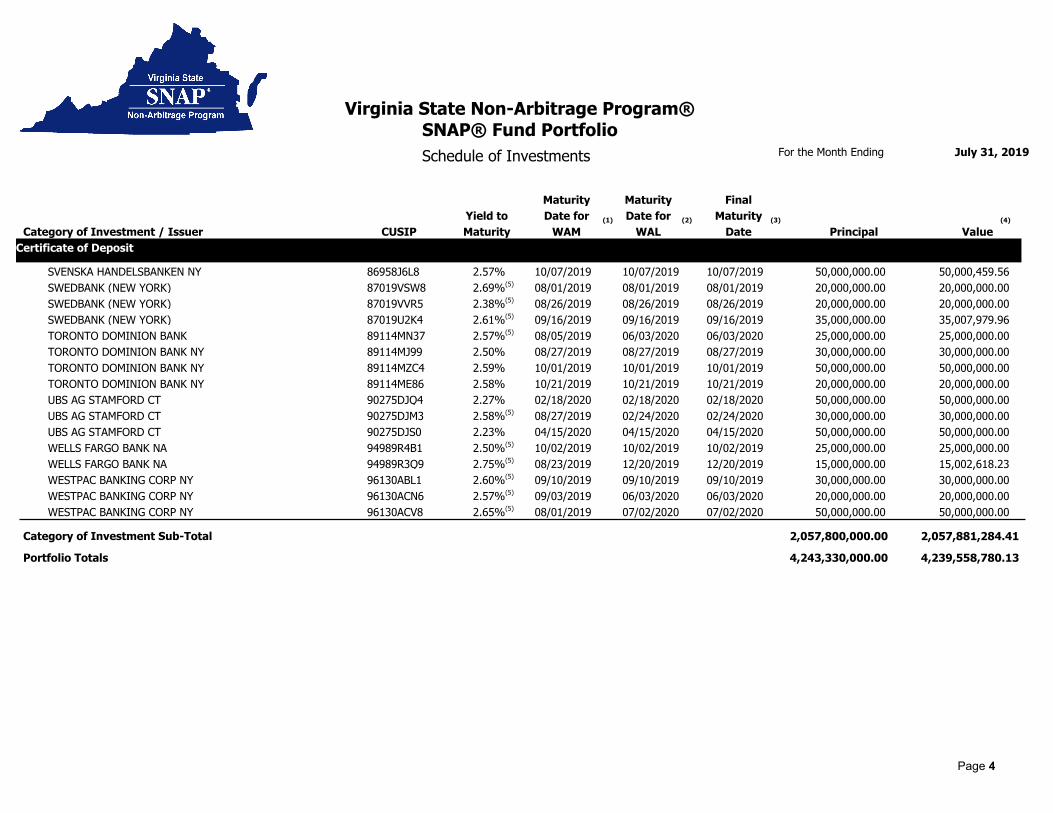
Certificate of Deposit
86958J6L8 2.57% 10/07/2019 10/07/2019 50,000,000.00SVENSKA HANDELSBANKEN NY 10/07/2019 50,000,459.56
87019VSW8 2.69% 08/01/2019 08/01/2019 20,000,000.00(5)SWEDBANK (NEW YORK) 08/01/2019 20,000,000.00
87019VVR5 2.38% 08/26/2019 08/26/2019 20,000,000.00(5)SWEDBANK (NEW YORK) 08/26/2019 20,000,000.00
87019U2K4 2.61% 09/16/2019 09/16/2019 35,000,000.00(5)SWEDBANK (NEW YORK) 09/16/2019 35,007,979.96
89114MN37 2.57% 08/05/2019 06/03/2020 25,000,000.00(5)TORONTO DOMINION BANK 06/03/2020 25,000,000.00
89114MJ99 2.50% 08/27/2019 08/27/2019 30,000,000.00TORONTO DOMINION BANK NY 08/27/2019 30,000,000.00
89114MZC4 2.59% 10/01/2019 10/01/2019 50,000,000.00TORONTO DOMINION BANK NY 10/01/2019 50,000,000.00
89114ME86 2.58% 10/21/2019 10/21/2019 20,000,000.00TORONTO DOMINION BANK NY 10/21/2019 20,000,000.00
90275DJQ4 2.27% 02/18/2020 02/18/2020 50,000,000.00UBS AG STAMFORD CT 02/18/2020 50,000,000.00
90275DJM3 2.58% 08/27/2019 02/24/2020 30,000,000.00(5)UBS AG STAMFORD CT 02/24/2020 30,000,000.00
90275DJS0 2.23% 04/15/2020 04/15/2020 50,000,000.00UBS AG STAMFORD CT 04/15/2020 50,000,000.00
94989R4B1 2.50% 10/02/2019 10/02/2019 25,000,000.00(5)WELLS FARGO BANK NA 10/02/2019 25,000,000.00
94989R3Q9 2.75% 08/23/2019 12/20/2019 15,000,000.00(5)WELLS FARGO BANK NA 12/20/2019 15,002,618.23
96130ABL1 2.60% 09/10/2019 09/10/2019 30,000,000.00(5)WESTPAC BANKING CORP NY 09/10/2019 30,000,000.00
96130ACN6 2.57% 09/03/2019 06/03/2020 20,000,000.00(5)WESTPAC BANKING CORP NY 06/03/2020 20,000,000.00
96130ACV8 2.65% 08/01/2019 07/02/2020 50,000,000.00(5)WESTPAC BANKING CORP NY 07/02/2020 50,000,000.00
2,057,800,000.00 2,057,881,284.41 Category of Investment Sub-Total
4,243,330,000.00 Portfolio Totals 4,239,558,780.13
Page 4
Schedule of Investments July 31, 2019For the Month Ending
SNAP® Fund Portfolio Virginia State Non-Arbitrage Program®
{VA SNAP POOL_2019-07-31}
The maturity date used to calculate weighted-average maturity (WAM) under GASB 79. This takes into account the maturity shortening provisions of GASB 79 regarding
demand features and interest rate adjustments.
Adjustable rate instrument. Rate shown is that which is in effect as of reporting date.(5)
The value in accordance with GASB 79. Unless otherwise noted, the fund utilizes the amortized cost method to value portfolio securities.(4)
The ultimate legal maturity date on which, in accordance with the terms of the security, and without reference to the maturity shortening provisions of GASB 79, the principal
amount must unconditionally be paid.
(3)
The maturity date used to calculate weighted-average life (WAL) under GASB 79. This takes into account the maturity shortening provisions of GASB 79 regarding demand
features without reference to interest rate adjustments.
(2)
(1)
The Fund's Weighted Average Maturity and Weighted Average Life Maturity as of the reporting date are 46 and 78 days, respectively.
This information is for institutional investor use only, not for further distribution to retail investors, and does not represent an offer to sell or a solicitation of an offer to buy or sell any fund or
other security. Investors should consider the investment objectives, risks, charges and expenses before investing in the Virginia State Non-Arbitrage Program (“SNAP®” or the “Program”).
This and other information about the Program is available in the SNAP® Information Statement, which should be read carefully before investing. A copy of the SNAP® Information
Statement may be obtained by calling 1-800-570-SNAP (7627) or is available on the Program’s website at www.vasnap.com . While the SNAP® Fund Portfolio seeks to maintain a stable net
asset value of $1.00 per share, it is possible to lose money investing in the Program. An investment in the Program is not insured or guaranteed by the Federal Deposit Insurance Corporation
or any other government agency. Shares of the SNAP® Fund Portfolio are distributed by PFM Fund Distributors, Inc., member Financial Industry Regulatory Authority (FINRA)
(www.finra.org) and Securities Investor Protection Corporation (SIPC) (www.sipc.org ). PFM Fund Distributors, Inc. is a wholly owned subsidiary of PFM Asset Management LLC.
Page 5
MONTHLY INVESTMENT REPORT
August 2019
Prepared for the Commonwealth Treasury Board
Treasury Yield Curve
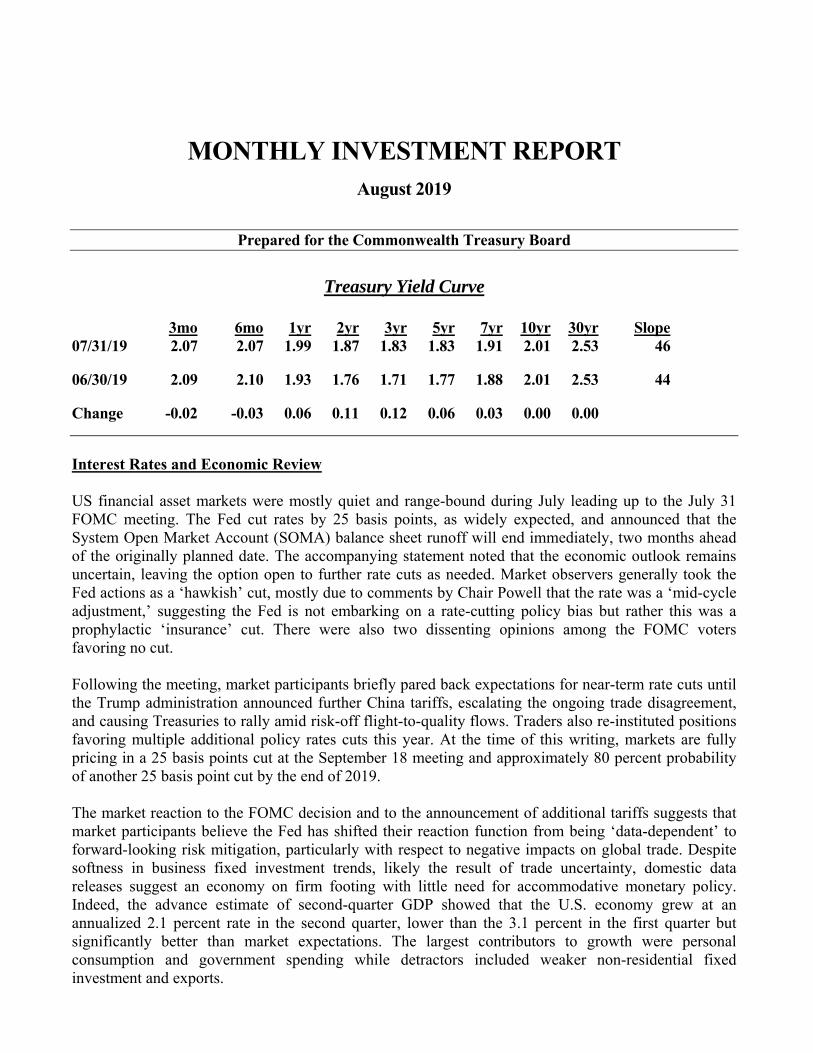
3mo 6mo 1yr 2yr 3yr 5yr 7yr 10yr 30yr Slope 07/31/19 2.07 2.07 1.99 1.87 1.83 1.83 1.91 2.01 2.53 46 06/30/19 2.09 2.10 1.93 1.76 1.71 1.77 1.88 2.01 2.53 44 Change -0.02 -0.03 0.06 0.11 0.12 0.06 0.03 0.00 0.00
Interest Rates and Economic Review US financial asset markets were mostly quiet and range-bound during July leading up to the July 31 FOMC meeting. The Fed cut rates by 25 basis points, as widely expected, and announced that the System Open Market Account (SOMA) balance sheet runoff will end immediately, two months ahead of the originally planned date. The accompanying statement noted that the economic outlook remains uncertain, leaving the option open to further rate cuts as needed. Market observers generally took the Fed actions as a ‘hawkish’ cut, mostly due to comments by Chair Powell that the rate was a ‘mid-cycle adjustment,’ suggesting the Fed is not embarking on a rate-cutting policy bias but rather this was a prophylactic ‘insurance’ cut. There were also two dissenting opinions among the FOMC voters favoring no cut. Following the meeting, market participants briefly pared back expectations for near-term rate cuts until the Trump administration announced further China tariffs, escalating the ongoing trade disagreement, and causing Treasuries to rally amid risk-off flight-to-quality flows. Traders also re-instituted positions favoring multiple additional policy rates cuts this year. At the time of this writing, markets are fully pricing in a 25 basis points cut at the September 18 meeting and approximately 80 percent probability of another 25 basis point cut by the end of 2019. The market reaction to the FOMC decision and to the announcement of additional tariffs suggests that market participants believe the Fed has shifted their reaction function from being ‘data-dependent’ to forward-looking risk mitigation, particularly with respect to negative impacts on global trade. Despite softness in business fixed investment trends, likely the result of trade uncertainty, domestic data releases suggest an economy on firm footing with little need for accommodative monetary policy. Indeed, the advance estimate of second-quarter GDP showed that the U.S. economy grew at an annualized 2.1 percent rate in the second quarter, lower than the 3.1 percent in the first quarter but significantly better than market expectations. The largest contributors to growth were personal consumption and government spending while detractors included weaker non-residential fixed investment and exports.

MONTHLY INVESTMENT REPORT Page 2 of 2 August 2019
At this point, front-end rates are primarily beholden to trade war developments. Constructive moves forward in trade negotiations with China will likely result in a paring back of rate cut expectations and therefore higher front-end rates. Likewise, any exacerbation of tensions will harden expectations for further policy rate cuts resulting in lower front-end rates. Primary Liquidity Portfolio Monthly Review For the month of July, the liquidity portion of the General Account earned 2.54 percent, which was fifty-seven basis points higher than the one-year Treasury constant maturity return. Securities lending contributed $55,888 to income for the month. The average days to maturity at the end of the month was 170 days. Security purchases greater than 90 days-to-maturity included $1 billion money market securities with a weighted average maturity of 148 days and a weighted average yield of 2.26 percent, $10 million US Treasury notes with a maturity of 0.4 years and yield of 2.15 percent and $125 million US government agencies with a weighted average maturity of 4 years and a weighted average yield of 2.42 percent.

General Account Portfolio $9,390,831,000
LGIP Portfolio $6,823,621,000
LGIP EM Portfolio $139,901,000
Tobacco Indemnification & Community Revitalization Endowments $416,993,000
Special and Trust Portfolios $195,747,000
Outside Trustee Portfolios $46,831,000
TOTAL Money Under Management $17,013,924,000
MANAGED INVESTMENT PORTFOLIOS1
July 31, 2019
1 EDCP, Tobacco Indemnification & Community Revitalization Endowment reflect month end market values. LGIP EM portfolios reflects end of month net asset value. Outside Trustee portfolios reflect month-end assets and all other portfolios are shown as monthly average invested balances.
1

Government Securities Jul Jun Change
US Govt MMK Funds 0.2% 0.4% -0.2%
Repurchase Agreements 3.8% 9.1% -5.3%
U.S. Treasury 0.4% 0.3% 0.1%
Agency Securities 24.9% 25.4% -0.5%
AAA Sovereign 1.3% 2.6% -1.3%
Securities for Public Deposit CD's 0.2% 0.2% 0.0%
Sub-Total 30.8% 38.0% -7.2%
Credit SecuritiesCD's, Bank Notes & Bankers Acceptance 35.7% 34.0% 1.7%
Commercial Paper 33.1% 27.1% 6.0%
Corporate Notes 0.4% 0.9% -0.5%Sub-Total 69.2% 62.0% 7.2%
Total 100.00% 100%
Asset allocation calculations are based on end of month balance while portfolio compliance is measured at the time an asset is purchased.
Totals may not add due to rounding.
Asset Allocation and Risk ProfileGeneral Account - Primary Liquidity
July 31, 2019
2

1 Yr. Treasury FISCAL YEAR Constant
2020 Avg. Balance 1 YTM 2Duration (years) EOM Balance 3 YTM 4
Duration (years) Balance
Composite
YTM 5Duration (years) Maturity Yield 6
July 2019 $8,041.1 2.55% 0.47 $1,105.7 2.44% 3.99 $9,146.8 2.54% 0.89 1.96%1 Average daily balance for the Primary Liquidity Pool for the reporting period.
2 Total net earnings for the month ÷ number of days in month*365 ÷ average daily balance
3 Actual month end balance (market value + accrued income)
4 Actual YTM as of month end as reported by external managers.
5 Weighted YTM based on average Balance of Primary Liquidity and External Managers.
6 Federal Reserve Bank H.15 Release Monthly Averages
General Account Investment PortfolioPrimary Liquidity Portfolio Yield to Maturity (YTM)/Duration (years)
Externally Managed Extended Duration Portfolio Yield to Maturity (YTM)/Duration (years)
EXTERNAL MANAGEMENT
EXTENDED DURATION COMPOSITE
3
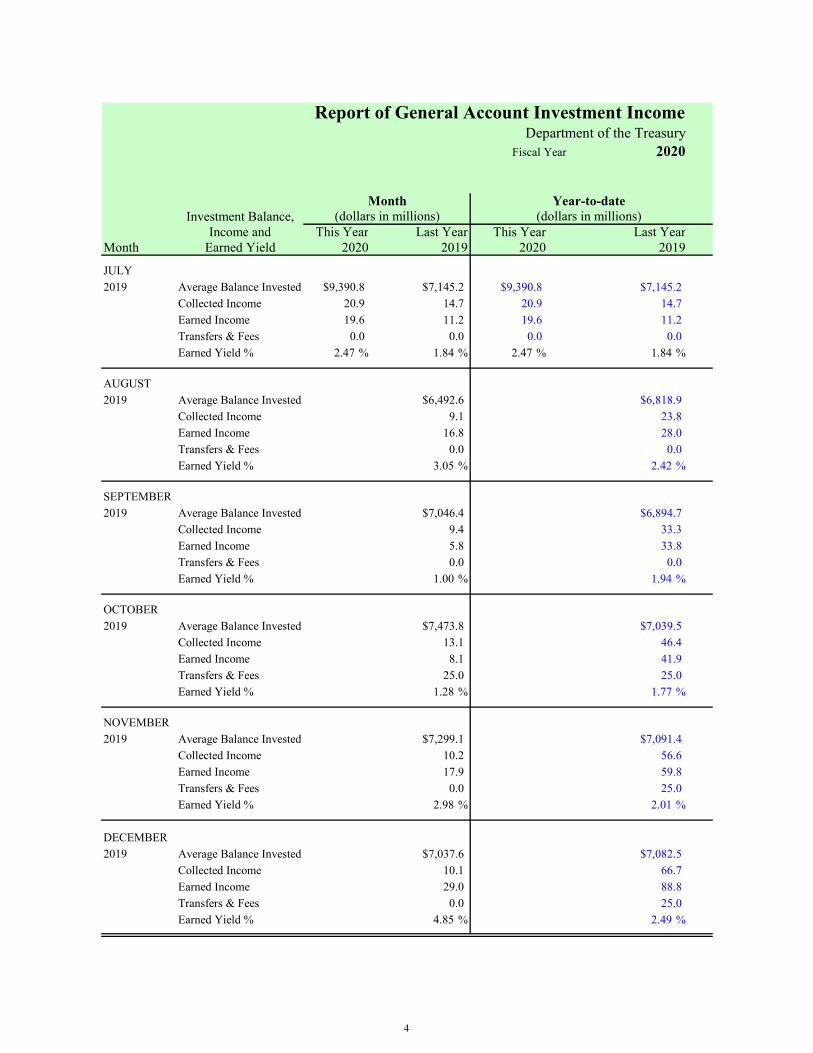
Report of General Account Investment Income
Fiscal Year 2020
Investment Balance,Income and This Year Last Year This Year Last Year
Month Earned Yield 2020 2019 2020 2019
JULY
2019 Average Balance Invested $9,390.8 $7,145.2 $9,390.8 $7,145.2
Collected Income 20.9 14.7 20.9 14.7
Earned Income 19.6 11.2 19.6 11.2
Transfers & Fees 0.0 0.0 0.0 0.0
Earned Yield % 2.47 % 1.84 % 2.47 % 1.84 %
AUGUST
2019 Average Balance Invested $6,492.6 $6,818.9
Collected Income 9.1 23.8
Earned Income 16.8 28.0
Transfers & Fees 0.0 0.0
Earned Yield % 3.05 % 2.42 %
SEPTEMBER
2019 Average Balance Invested $7,046.4 $6,894.7
Collected Income 9.4 33.3
Earned Income 5.8 33.8
Transfers & Fees 0.0 0.0
Earned Yield % 1.00 % 1.94 %
OCTOBER
2019 Average Balance Invested $7,473.8 $7,039.5
Collected Income 13.1 46.4
Earned Income 8.1 41.9
Transfers & Fees 25.0 25.0
Earned Yield % 1.28 % 1.77 %
NOVEMBER
2019 Average Balance Invested $7,299.1 $7,091.4
Collected Income 10.2 56.6
Earned Income 17.9 59.8
Transfers & Fees 0.0 25.0
Earned Yield % 2.98 % 2.01 %
DECEMBER
2019 Average Balance Invested $7,037.6 $7,082.5
Collected Income 10.1 66.7
Earned Income 29.0 88.8
Transfers & Fees 0.0 25.0
Earned Yield % 4.85 % 2.49 %
Department of the Treasury
Year-to-date(dollars in millions)
Month(dollars in millions)
4
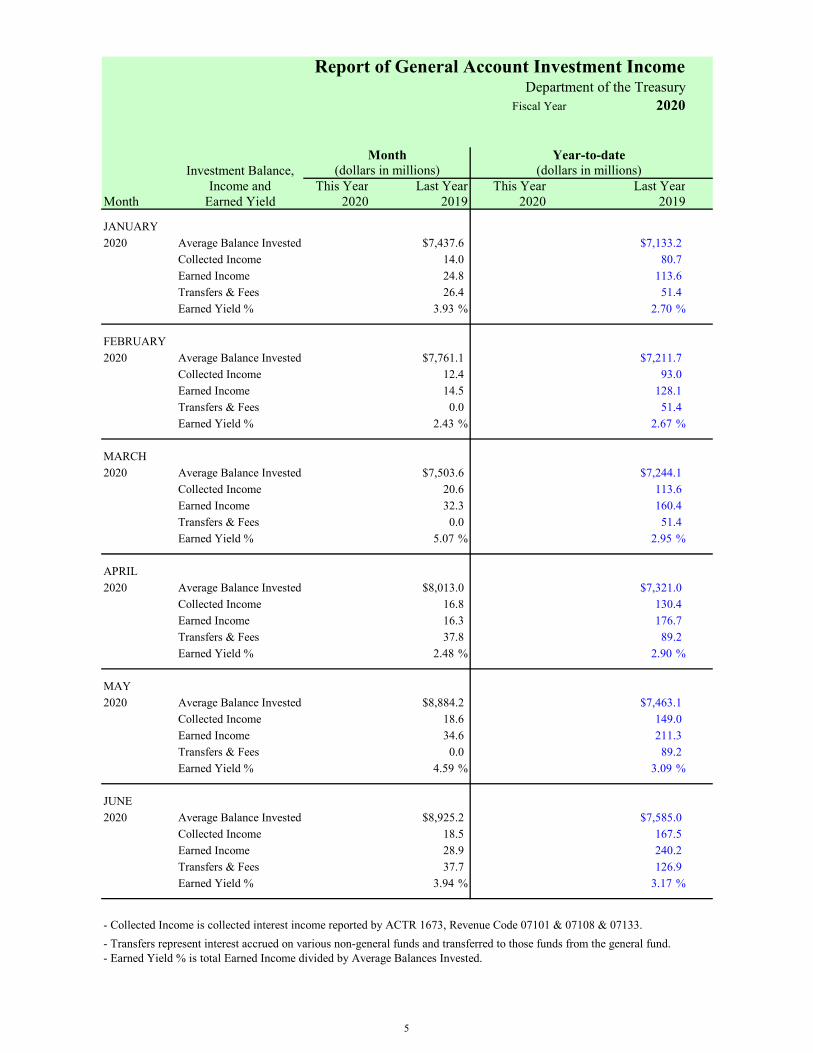
Report of General Account Investment Income
Fiscal Year 2020
Investment Balance,Income and This Year Last Year This Year Last Year
Month Earned Yield 2020 2019 2020 2019
Department of the Treasury
Year-to-date(dollars in millions)
Month(dollars in millions)
JANUARY
2020 Average Balance Invested $7,437.6 $7,133.2
Collected Income 14.0 80.7
Earned Income 24.8 113.6
Transfers & Fees 26.4 51.4
Earned Yield % 3.93 % 2.70 %
FEBRUARY
2020 Average Balance Invested $7,761.1 $7,211.7
Collected Income 12.4 93.0
Earned Income 14.5 128.1
Transfers & Fees 0.0 51.4
Earned Yield % 2.43 % 2.67 %
MARCH
2020 Average Balance Invested $7,503.6 $7,244.1
Collected Income 20.6 113.6
Earned Income 32.3 160.4
Transfers & Fees 0.0 51.4
Earned Yield % 5.07 % 2.95 %
APRIL
2020 Average Balance Invested $8,013.0 $7,321.0
Collected Income 16.8 130.4
Earned Income 16.3 176.7
Transfers & Fees 37.8 89.2
Earned Yield % 2.48 % 2.90 %
MAY
2020 Average Balance Invested $8,884.2 $7,463.1
Collected Income 18.6 149.0
Earned Income 34.6 211.3
Transfers & Fees 0.0 89.2
Earned Yield % 4.59 % 3.09 %
JUNE
2020 Average Balance Invested $8,925.2 $7,585.0
Collected Income 18.5 167.5
Earned Income 28.9 240.2
Transfers & Fees 37.7 126.9
Earned Yield % 3.94 % 3.17 %
- Collected Income is collected interest income reported by ACTR 1673, Revenue Code 07101 & 07108 & 07133.
- Transfers represent interest accrued on various non-general funds and transferred to those funds from the general fund.- Earned Yield % is total Earned Income divided by Average Balances Invested.
5

VA GENERAL ACCOUNT
Audited Market Value - MonthlyAs of Jul 31, 2019
Description Security Coupon Rate Maturity Date Price (Base) Shares/Par Cost (Base) Amortized Cost Traded Market Value
Corporate BondBANK OF 1.75% 09/19 06367TF96 1.7500 11-Sep-2019 99.9280 9,000,000.00 8,987,220.00 8,993,274.17 8,993,520.00
9,000,000.00 8,987,220.00 8,993,274.17 8,993,520.00Agencies
FEDERAL HOME ZERO 08/19 313384JW0 - 01-Aug-2019 100.0000 75,000,000.00 74,472,208.33 75,000,000.00 75,000,000.00FEDERAL HOME ZERO 08/19 313384KH1 - 12-Aug-2019 99.9358 50,000,000.00 49,859,444.44 49,966,388.89 49,967,916.50FEDERAL HOME ZERO 08/19 313384KK4 - 14-Aug-2019 99.9242 100,000,000.00 99,654,666.68 99,919,833.34 99,924,167.00FEDERAL HOME ZERO 08/19 313384KM0 - 16-Aug-2019 99.9125 250,000,000.00 248,971,326.40 249,763,020.82 249,781,250.00FEDERAL HOME ZERO 08/19 313384LB3 - 30-Aug-2019 99.8308 43,016,000.00 42,881,933.47 42,939,766.09 42,943,231.12FEDERAL HOME 1.5% 09/19 3134GA7A6 1.5000 09-Sep-2019 99.9320 25,000,000.00 24,988,750.00 24,999,488.76 24,983,000.00FEDERAL HOME ZERO 09/19 313384LM9 - 09-Sep-2019 99.7703 100,000,000.00 99,496,611.12 99,760,583.34 99,770,333.00FEDERAL 1.75% 09/19 3135G0ZG1 1.7500 12-Sep-2019 99.9410 48,000,000.00 47,607,312.00 47,953,785.40 47,971,680.00FEDERAL FARM ZERO 09/19 313312LU2 00011 - 16-Sep-2019 99.7291 65,000,000.00 63,807,520.83 64,788,208.33 64,823,922.15FEDERAL HOME ZERO 09/19 313384LU1 - 16-Sep-2019 99.7291 100,000,000.00 99,453,638.90 99,717,611.12 99,729,111.00FEDERAL HOME ZERO 10/19 313384NA3 - 16-Oct-2019 99.5567 50,000,000.00 49,395,102.78 49,747,405.56 49,778,333.50FEDERAL HOME ZERO 11/19 313384PG8 - 15-Nov-2019 99.3876 50,000,000.00 49,422,291.67 49,654,027.78 49,693,778.00FEDERAL FARM 1.95% 01/20 3133EH6L2 1.9500 10-Jan-2020 99.9000 75,000,000.00 74,898,750.00 74,977,363.53 74,925,000.00FEDERAL HOME 1.7% 05/20 3130ACN83 1.7000 15-May-2020 99.7450 50,000,000.00 49,878,000.00 49,961,199.53 49,872,500.00FEDERAL FARM 1.68% 10/20 3133EHF57 1.6800 13-Oct-2020 99.5760 30,425,000.00 30,415,233.58 30,421,035.90 30,295,998.00FEDERAL 1.835% 10/20 3136G4QJ5 1.8350 26-Oct-2020 99.6200 25,000,000.00 25,000,000.00 25,000,000.00 24,905,000.00FEDERAL HOME 2.94% 10/20 3130AF5S2 2.9400 29-Oct-2020 100.1800 25,000,000.00 24,970,750.00 24,981,614.24 25,045,000.00FEDERAL HOME 2.25% 11/20 3134GBX56 2.2500 24-Nov-2020 100.2880 50,000,000.00 50,081,000.00 50,037,460.28 50,144,000.00FEDERAL 1.875% 12/20 3130A3UQ5 1.8750 11-Dec-2020 99.8190 50,000,000.00 49,752,400.00 49,884,800.42 49,909,500.00FEDERAL HOME 2.25% 01/21 3130ADFV9 2.2500 29-Jan-2021 99.7250 50,000,000.00 50,000,000.00 50,000,000.00 49,862,500.00FEDERAL FARM 2.5% 03/21 3133EJEM7 2.5000 01-Mar-2021 100.7820 37,105,000.00 36,866,785.00 36,970,457.37 37,395,161.10FEDERAL HOME 2.6% 04/21 3130AGE50 2.6000 16-Apr-2021 100.0060 25,220,000.00 25,231,853.40 25,231,074.56 25,221,513.20FEDERAL FARM 2.7% 05/21 3133EJNS4 2.7000 10-May-2021 101.2310 25,000,000.00 24,970,000.00 24,981,960.11 25,307,750.00FEDERAL HOME 2.25% 06/21 3130A1W95 2.2500 11-Jun-2021 100.5360 25,000,000.00 25,115,000.00 25,111,467.50 25,134,000.00FEDERAL FARM 2.85% 09/21 3133EJZU6 2.8500 20-Sep-2021 101.8170 71,500,000.00 71,236,423.50 71,308,337.14 72,799,155.00FEDERAL FARM 1.4% 10/21 3133EGYQ2 1.4000 14-Oct-2021 98.7600 25,000,000.00 24,779,500.00 24,790,207.99 24,690,000.00FEDERAL HOME 2.7% 05/22 3130AGDR3 2.7000 16-May-2022 100.0060 43,860,000.00 43,881,930.00 43,881,062.13 43,862,631.60FEDERAL HOME 2.75% 06/22 3130AEBM1 2.7500 10-Jun-2022 102.3720 50,000,000.00 49,873,000.00 49,907,223.73 51,186,000.00FEDERAL HOME 2.5% 06/22 3134GTUJ0 2.5000 17-Jun-2022 99.9260 50,000,000.00 50,000,000.00 50,000,000.00 49,963,000.00FEDERAL HOME 2.75% 03/23 3130ADRG9 2.7500 10-Mar-2023 102.8600 9,000,000.00 8,961,030.00 8,970,718.51 9,257,400.00FEDERAL HOME 2.75% 06/23 3137EAEN5 2.7500 19-Jun-2023 103.0420 10,000,000.00 9,946,700.00 9,957,941.94 10,304,200.00FEDERAL HOME 3.15% 09/23 3130AEX54 3.1500 28-Sep-2023 101.2200 24,000,000.00 24,000,000.00 24,000,000.00 24,292,800.00FEDERAL HOME 3% 11/23 3130AFWW3 3.0000 28-Nov-2023 100.0370 70,050,000.00 70,141,065.00 70,138,564.37 70,075,918.50FEDERAL 3.375% 12/23 3130A0F70 3.3750 08-Dec-2023 106.0360 52,000,000.00 53,358,120.00 53,210,390.46 55,138,720.00FEDERAL HOME 2.88% 03/24 3130AFYT8 2.8800 06-Mar-2024 100.2990 48,480,000.00 48,465,456.00 48,466,502.65 48,624,955.20FEDERAL HOME 2.55% 07/24 3134GTWT6 2.5500 01-Jul-2024 99.7310 50,000,000.00 50,000,000.00 50,000,000.00 49,865,500.00FEDERAL HOME 2.5% 07/24 3134GTB44 2.5000 15-Jul-2024 99.9510 25,000,000.00 25,000,000.00 25,000,000.00 24,987,750.00FEDERAL HOME 2.5% 07/24 3134GTE74 2.5000 15-Jul-2024 100.0070 25,000,000.00 25,000,000.00 25,000,000.00 25,001,750.00
1,977,656,000.00 1,971,833,803.10 1,976,399,501.79 1,982,434,424.87Government Bond
INTERNATIONAL ZERO 08/19 459052JW7 - 01-Aug-2019 100.0000 50,000,000.00 49,600,027.78 50,000,000.00 50,000,000.00INTERNATIONAL ZERO 08/19 459052KA3 - 05-Aug-2019 99.9715 50,000,000.00 49,700,000.00 49,986,666.67 49,985,725.00INTERNATIONA 1.875% 10/19 459058DW0 1.8750 07-Oct-2019 99.9080 25,000,000.00 24,868,750.00 24,964,924.10 24,977,000.00
125,000,000.00 124,168,777.78 124,951,590.77 124,962,725.00Certificates of Deposit
CANADIAN 2.34% 08/19 13606B2X3 2.3400 01-Aug-2019 100.0003 48,000,000.00 48,000,000.00 48,000,000.00 48,000,141.12TORONTO-DOMIN 2.67% 08/1 89114MTW7 2.6700 01-Aug-2019 100.0008 50,000,000.00 50,000,000.00 50,000,000.00 50,000,392.00BANCO DEL 2.36% 08/19 05971XNW7 2.3600 05-Aug-2019 100.0006 11,000,000.00 11,000,000.00 11,000,000.00 11,000,062.26HSBC BANK USA 2.38% 08/19 40435RDR9 2.3800 05-Aug-2019 100.0004 50,000,000.00 50,000,000.00 50,000,000.00 50,000,193.00HSBC BANK 2.38% 08/19 40435RDS7 2.3800 05-Aug-2019 100.0004 80,000,000.00 80,000,000.00 80,000,000.00 80,000,310.40DNB BANK ASA, 2.45% 08/1 23341VVB4 2.4500 16-Aug-2019 100.0080 80,000,000.00 80,000,000.00 80,000,000.00 80,006,364.00
Page 1 of 4
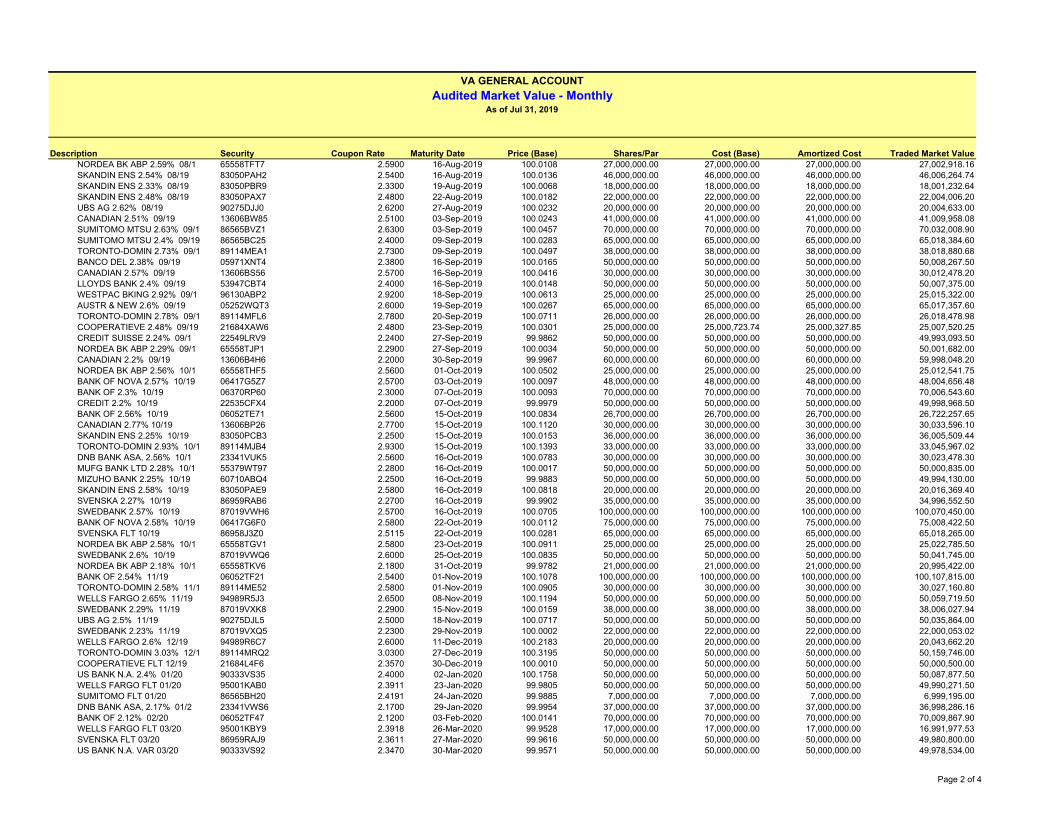
VA GENERAL ACCOUNT
Audited Market Value - MonthlyAs of Jul 31, 2019
Description Security Coupon Rate Maturity Date Price (Base) Shares/Par Cost (Base) Amortized Cost Traded Market ValueNORDEA BK ABP 2.59% 08/1 65558TFT7 2.5900 16-Aug-2019 100.0108 27,000,000.00 27,000,000.00 27,000,000.00 27,002,918.16SKANDIN ENS 2.54% 08/19 83050PAH2 2.5400 16-Aug-2019 100.0136 46,000,000.00 46,000,000.00 46,000,000.00 46,006,264.74SKANDIN ENS 2.33% 08/19 83050PBR9 2.3300 19-Aug-2019 100.0068 18,000,000.00 18,000,000.00 18,000,000.00 18,001,232.64SKANDIN ENS 2.48% 08/19 83050PAX7 2.4800 22-Aug-2019 100.0182 22,000,000.00 22,000,000.00 22,000,000.00 22,004,006.20UBS AG 2.62% 08/19 90275DJJ0 2.6200 27-Aug-2019 100.0232 20,000,000.00 20,000,000.00 20,000,000.00 20,004,633.00CANADIAN 2.51% 09/19 13606BW85 2.5100 03-Sep-2019 100.0243 41,000,000.00 41,000,000.00 41,000,000.00 41,009,958.08SUMITOMO MTSU 2.63% 09/1 86565BVZ1 2.6300 03-Sep-2019 100.0457 70,000,000.00 70,000,000.00 70,000,000.00 70,032,008.90SUMITOMO MTSU 2.4% 09/19 86565BC25 2.4000 09-Sep-2019 100.0283 65,000,000.00 65,000,000.00 65,000,000.00 65,018,384.60TORONTO-DOMIN 2.73% 09/1 89114MEA1 2.7300 09-Sep-2019 100.0497 38,000,000.00 38,000,000.00 38,000,000.00 38,018,880.68BANCO DEL 2.38% 09/19 05971XNT4 2.3800 16-Sep-2019 100.0165 50,000,000.00 50,000,000.00 50,000,000.00 50,008,267.50CANADIAN 2.57% 09/19 13606BS56 2.5700 16-Sep-2019 100.0416 30,000,000.00 30,000,000.00 30,000,000.00 30,012,478.20LLOYDS BANK 2.4% 09/19 53947CBT4 2.4000 16-Sep-2019 100.0148 50,000,000.00 50,000,000.00 50,000,000.00 50,007,375.00WESTPAC BKING 2.92% 09/1 96130ABP2 2.9200 18-Sep-2019 100.0613 25,000,000.00 25,000,000.00 25,000,000.00 25,015,322.00AUSTR & NEW 2.6% 09/19 05252WQT3 2.6000 19-Sep-2019 100.0267 65,000,000.00 65,000,000.00 65,000,000.00 65,017,357.60TORONTO-DOMIN 2.78% 09/1 89114MFL6 2.7800 20-Sep-2019 100.0711 26,000,000.00 26,000,000.00 26,000,000.00 26,018,478.98COOPERATIEVE 2.48% 09/19 21684XAW6 2.4800 23-Sep-2019 100.0301 25,000,000.00 25,000,723.74 25,000,327.85 25,007,520.25CREDIT SUISSE 2.24% 09/1 22549LRV9 2.2400 27-Sep-2019 99.9862 50,000,000.00 50,000,000.00 50,000,000.00 49,993,093.50NORDEA BK ABP 2.29% 09/1 65558TJP1 2.2900 27-Sep-2019 100.0034 50,000,000.00 50,000,000.00 50,000,000.00 50,001,682.00CANADIAN 2.2% 09/19 13606B4H6 2.2000 30-Sep-2019 99.9967 60,000,000.00 60,000,000.00 60,000,000.00 59,998,048.20NORDEA BK ABP 2.56% 10/1 65558THF5 2.5600 01-Oct-2019 100.0502 25,000,000.00 25,000,000.00 25,000,000.00 25,012,541.75BANK OF NOVA 2.57% 10/19 06417G5Z7 2.5700 03-Oct-2019 100.0097 48,000,000.00 48,000,000.00 48,000,000.00 48,004,656.48BANK OF 2.3% 10/19 06370RP60 2.3000 07-Oct-2019 100.0093 70,000,000.00 70,000,000.00 70,000,000.00 70,006,543.60CREDIT 2.2% 10/19 22535CFX4 2.2000 07-Oct-2019 99.9979 50,000,000.00 50,000,000.00 50,000,000.00 49,998,968.50BANK OF 2.56% 10/19 06052TE71 2.5600 15-Oct-2019 100.0834 26,700,000.00 26,700,000.00 26,700,000.00 26,722,257.65CANADIAN 2.77% 10/19 13606BP26 2.7700 15-Oct-2019 100.1120 30,000,000.00 30,000,000.00 30,000,000.00 30,033,596.10SKANDIN ENS 2.25% 10/19 83050PCB3 2.2500 15-Oct-2019 100.0153 36,000,000.00 36,000,000.00 36,000,000.00 36,005,509.44TORONTO-DOMIN 2.93% 10/1 89114MJB4 2.9300 15-Oct-2019 100.1393 33,000,000.00 33,000,000.00 33,000,000.00 33,045,967.02DNB BANK ASA, 2.56% 10/1 23341VUK5 2.5600 16-Oct-2019 100.0783 30,000,000.00 30,000,000.00 30,000,000.00 30,023,478.30MUFG BANK LTD 2.28% 10/1 55379WT97 2.2800 16-Oct-2019 100.0017 50,000,000.00 50,000,000.00 50,000,000.00 50,000,835.00MIZUHO BANK 2.25% 10/19 60710ABQ4 2.2500 16-Oct-2019 99.9883 50,000,000.00 50,000,000.00 50,000,000.00 49,994,130.00SKANDIN ENS 2.58% 10/19 83050PAE9 2.5800 16-Oct-2019 100.0818 20,000,000.00 20,000,000.00 20,000,000.00 20,016,369.40SVENSKA 2.27% 10/19 86959RAB6 2.2700 16-Oct-2019 99.9902 35,000,000.00 35,000,000.00 35,000,000.00 34,996,552.50SWEDBANK 2.57% 10/19 87019VWH6 2.5700 16-Oct-2019 100.0705 100,000,000.00 100,000,000.00 100,000,000.00 100,070,450.00BANK OF NOVA 2.58% 10/19 06417G6F0 2.5800 22-Oct-2019 100.0112 75,000,000.00 75,000,000.00 75,000,000.00 75,008,422.50SVENSKA FLT 10/19 86958J3Z0 2.5115 22-Oct-2019 100.0281 65,000,000.00 65,000,000.00 65,000,000.00 65,018,265.00NORDEA BK ABP 2.58% 10/1 65558TGV1 2.5800 23-Oct-2019 100.0911 25,000,000.00 25,000,000.00 25,000,000.00 25,022,785.50SWEDBANK 2.6% 10/19 87019VWQ6 2.6000 25-Oct-2019 100.0835 50,000,000.00 50,000,000.00 50,000,000.00 50,041,745.00NORDEA BK ABP 2.18% 10/1 65558TKV6 2.1800 31-Oct-2019 99.9782 21,000,000.00 21,000,000.00 21,000,000.00 20,995,422.00BANK OF 2.54% 11/19 06052TF21 2.5400 01-Nov-2019 100.1078 100,000,000.00 100,000,000.00 100,000,000.00 100,107,815.00TORONTO-DOMIN 2.58% 11/1 89114ME52 2.5800 01-Nov-2019 100.0905 30,000,000.00 30,000,000.00 30,000,000.00 30,027,160.80WELLS FARGO 2.65% 11/19 94989R5J3 2.6500 08-Nov-2019 100.1194 50,000,000.00 50,000,000.00 50,000,000.00 50,059,719.50SWEDBANK 2.29% 11/19 87019VXK8 2.2900 15-Nov-2019 100.0159 38,000,000.00 38,000,000.00 38,000,000.00 38,006,027.94UBS AG 2.5% 11/19 90275DJL5 2.5000 18-Nov-2019 100.0717 50,000,000.00 50,000,000.00 50,000,000.00 50,035,864.00SWEDBANK 2.23% 11/19 87019VXQ5 2.2300 29-Nov-2019 100.0002 22,000,000.00 22,000,000.00 22,000,000.00 22,000,053.02WELLS FARGO 2.6% 12/19 94989R6C7 2.6000 11-Dec-2019 100.2183 20,000,000.00 20,000,000.00 20,000,000.00 20,043,662.20TORONTO-DOMIN 3.03% 12/1 89114MRQ2 3.0300 27-Dec-2019 100.3195 50,000,000.00 50,000,000.00 50,000,000.00 50,159,746.00COOPERATIEVE FLT 12/19 21684L4F6 2.3570 30-Dec-2019 100.0010 50,000,000.00 50,000,000.00 50,000,000.00 50,000,500.00US BANK N.A. 2.4% 01/20 90333VS35 2.4000 02-Jan-2020 100.1758 50,000,000.00 50,000,000.00 50,000,000.00 50,087,877.50WELLS FARGO FLT 01/20 95001KAB0 2.3911 23-Jan-2020 99.9805 50,000,000.00 50,000,000.00 50,000,000.00 49,990,271.50SUMITOMO FLT 01/20 86565BH20 2.4191 24-Jan-2020 99.9885 7,000,000.00 7,000,000.00 7,000,000.00 6,999,195.00DNB BANK ASA, 2.17% 01/2 23341VWS6 2.1700 29-Jan-2020 99.9954 37,000,000.00 37,000,000.00 37,000,000.00 36,998,286.16BANK OF 2.12% 02/20 06052TF47 2.1200 03-Feb-2020 100.0141 70,000,000.00 70,000,000.00 70,000,000.00 70,009,867.90WELLS FARGO FLT 03/20 95001KBY9 2.3918 26-Mar-2020 99.9528 17,000,000.00 17,000,000.00 17,000,000.00 16,991,977.53SVENSKA FLT 03/20 86959RAJ9 2.3611 27-Mar-2020 99.9616 50,000,000.00 50,000,000.00 50,000,000.00 49,980,800.00US BANK N.A. VAR 03/20 90333VS92 2.3470 30-Mar-2020 99.9571 50,000,000.00 50,000,000.00 50,000,000.00 49,978,534.00
Page 2 of 4
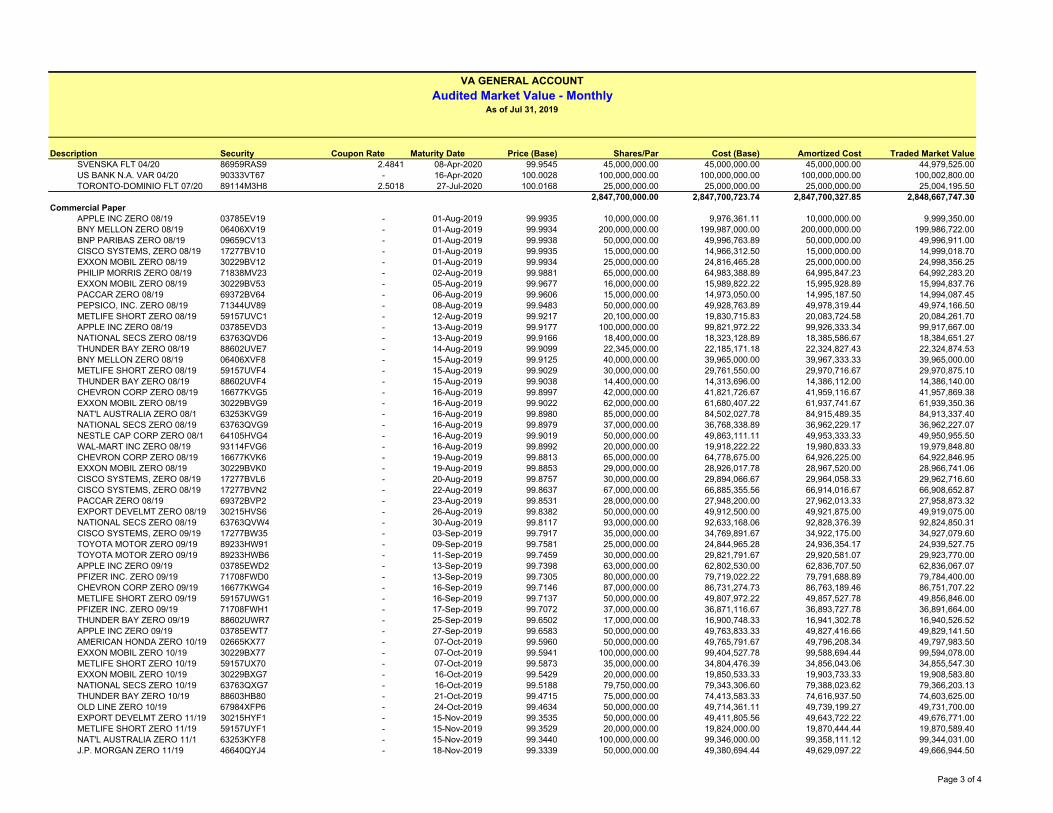
VA GENERAL ACCOUNT
Audited Market Value - MonthlyAs of Jul 31, 2019
Description Security Coupon Rate Maturity Date Price (Base) Shares/Par Cost (Base) Amortized Cost Traded Market ValueSVENSKA FLT 04/20 86959RAS9 2.4841 08-Apr-2020 99.9545 45,000,000.00 45,000,000.00 45,000,000.00 44,979,525.00US BANK N.A. VAR 04/20 90333VT67 - 16-Apr-2020 100.0028 100,000,000.00 100,000,000.00 100,000,000.00 100,002,800.00TORONTO-DOMINIO FLT 07/20 89114M3H8 2.5018 27-Jul-2020 100.0168 25,000,000.00 25,000,000.00 25,000,000.00 25,004,195.50
2,847,700,000.00 2,847,700,723.74 2,847,700,327.85 2,848,667,747.30Commercial Paper
APPLE INC ZERO 08/19 03785EV19 - 01-Aug-2019 99.9935 10,000,000.00 9,976,361.11 10,000,000.00 9,999,350.00BNY MELLON ZERO 08/19 06406XV19 - 01-Aug-2019 99.9934 200,000,000.00 199,987,000.00 200,000,000.00 199,986,722.00BNP PARIBAS ZERO 08/19 09659CV13 - 01-Aug-2019 99.9938 50,000,000.00 49,996,763.89 50,000,000.00 49,996,911.00CISCO SYSTEMS, ZERO 08/19 17277BV10 - 01-Aug-2019 99.9935 15,000,000.00 14,966,312.50 15,000,000.00 14,999,018.70EXXON MOBIL ZERO 08/19 30229BV12 - 01-Aug-2019 99.9934 25,000,000.00 24,816,465.28 25,000,000.00 24,998,356.25PHILIP MORRIS ZERO 08/19 71838MV23 - 02-Aug-2019 99.9881 65,000,000.00 64,983,388.89 64,995,847.23 64,992,283.20EXXON MOBIL ZERO 08/19 30229BV53 - 05-Aug-2019 99.9677 16,000,000.00 15,989,822.22 15,995,928.89 15,994,837.76PACCAR ZERO 08/19 69372BV64 - 06-Aug-2019 99.9606 15,000,000.00 14,973,050.00 14,995,187.50 14,994,087.45PEPSICO, INC. ZERO 08/19 71344UV89 - 08-Aug-2019 99.9483 50,000,000.00 49,928,763.89 49,978,319.44 49,974,166.50METLIFE SHORT ZERO 08/19 59157UVC1 - 12-Aug-2019 99.9217 20,100,000.00 19,830,715.83 20,083,724.58 20,084,261.70APPLE INC ZERO 08/19 03785EVD3 - 13-Aug-2019 99.9177 100,000,000.00 99,821,972.22 99,926,333.34 99,917,667.00NATIONAL SECS ZERO 08/19 63763QVD6 - 13-Aug-2019 99.9166 18,400,000.00 18,323,128.89 18,385,586.67 18,384,651.27THUNDER BAY ZERO 08/19 88602UVE7 - 14-Aug-2019 99.9099 22,345,000.00 22,185,171.18 22,324,827.43 22,324,874.53BNY MELLON ZERO 08/19 06406XVF8 - 15-Aug-2019 99.9125 40,000,000.00 39,965,000.00 39,967,333.33 39,965,000.00METLIFE SHORT ZERO 08/19 59157UVF4 - 15-Aug-2019 99.9029 30,000,000.00 29,761,550.00 29,970,716.67 29,970,875.10THUNDER BAY ZERO 08/19 88602UVF4 - 15-Aug-2019 99.9038 14,400,000.00 14,313,696.00 14,386,112.00 14,386,140.00CHEVRON CORP ZERO 08/19 16677KVG5 - 16-Aug-2019 99.8997 42,000,000.00 41,821,726.67 41,959,116.67 41,957,869.38EXXON MOBIL ZERO 08/19 30229BVG9 - 16-Aug-2019 99.9022 62,000,000.00 61,680,407.22 61,937,741.67 61,939,350.36NAT'L AUSTRALIA ZERO 08/1 63253KVG9 - 16-Aug-2019 99.8980 85,000,000.00 84,502,027.78 84,915,489.35 84,913,337.40NATIONAL SECS ZERO 08/19 63763QVG9 - 16-Aug-2019 99.8979 37,000,000.00 36,768,338.89 36,962,229.17 36,962,227.07NESTLE CAP CORP ZERO 08/1 64105HVG4 - 16-Aug-2019 99.9019 50,000,000.00 49,863,111.11 49,953,333.33 49,950,955.50WAL-MART INC ZERO 08/19 93114FVG6 - 16-Aug-2019 99.8992 20,000,000.00 19,918,222.22 19,980,833.33 19,979,848.80CHEVRON CORP ZERO 08/19 16677KVK6 - 19-Aug-2019 99.8813 65,000,000.00 64,778,675.00 64,926,225.00 64,922,846.95EXXON MOBIL ZERO 08/19 30229BVK0 - 19-Aug-2019 99.8853 29,000,000.00 28,926,017.78 28,967,520.00 28,966,741.06CISCO SYSTEMS, ZERO 08/19 17277BVL6 - 20-Aug-2019 99.8757 30,000,000.00 29,894,066.67 29,964,058.33 29,962,716.60CISCO SYSTEMS, ZERO 08/19 17277BVN2 - 22-Aug-2019 99.8637 67,000,000.00 66,885,355.56 66,914,016.67 66,908,652.87PACCAR ZERO 08/19 69372BVP2 - 23-Aug-2019 99.8531 28,000,000.00 27,948,200.00 27,962,013.33 27,958,873.32EXPORT DEVELMT ZERO 08/19 30215HVS6 - 26-Aug-2019 99.8382 50,000,000.00 49,912,500.00 49,921,875.00 49,919,075.00NATIONAL SECS ZERO 08/19 63763QVW4 - 30-Aug-2019 99.8117 93,000,000.00 92,633,168.06 92,828,376.39 92,824,850.31CISCO SYSTEMS, ZERO 09/19 17277BW35 - 03-Sep-2019 99.7917 35,000,000.00 34,769,891.67 34,922,175.00 34,927,079.60TOYOTA MOTOR ZERO 09/19 89233HW91 - 09-Sep-2019 99.7581 25,000,000.00 24,844,965.28 24,936,354.17 24,939,527.75TOYOTA MOTOR ZERO 09/19 89233HWB6 - 11-Sep-2019 99.7459 30,000,000.00 29,821,791.67 29,920,581.07 29,923,770.00APPLE INC ZERO 09/19 03785EWD2 - 13-Sep-2019 99.7398 63,000,000.00 62,802,530.00 62,836,707.50 62,836,067.07PFIZER INC. ZERO 09/19 71708FWD0 - 13-Sep-2019 99.7305 80,000,000.00 79,719,022.22 79,791,688.89 79,784,400.00CHEVRON CORP ZERO 09/19 16677KWG4 - 16-Sep-2019 99.7146 87,000,000.00 86,731,274.73 86,763,189.46 86,751,707.22METLIFE SHORT ZERO 09/19 59157UWG1 - 16-Sep-2019 99.7137 50,000,000.00 49,807,972.22 49,857,527.78 49,856,846.00PFIZER INC. ZERO 09/19 71708FWH1 - 17-Sep-2019 99.7072 37,000,000.00 36,871,116.67 36,893,727.78 36,891,664.00THUNDER BAY ZERO 09/19 88602UWR7 - 25-Sep-2019 99.6502 17,000,000.00 16,900,748.33 16,941,302.78 16,940,526.52APPLE INC ZERO 09/19 03785EWT7 - 27-Sep-2019 99.6583 50,000,000.00 49,763,833.33 49,827,416.66 49,829,141.50AMERICAN HONDA ZERO 10/19 02665KX77 - 07-Oct-2019 99.5960 50,000,000.00 49,765,791.67 49,796,208.34 49,797,983.50EXXON MOBIL ZERO 10/19 30229BX77 - 07-Oct-2019 99.5941 100,000,000.00 99,404,527.78 99,588,694.44 99,594,078.00METLIFE SHORT ZERO 10/19 59157UX70 - 07-Oct-2019 99.5873 35,000,000.00 34,804,476.39 34,856,043.06 34,855,547.30EXXON MOBIL ZERO 10/19 30229BXG7 - 16-Oct-2019 99.5429 20,000,000.00 19,850,533.33 19,903,733.33 19,908,583.80NATIONAL SECS ZERO 10/19 63763QXG7 - 16-Oct-2019 99.5188 79,750,000.00 79,343,306.60 79,388,023.62 79,366,203.13THUNDER BAY ZERO 10/19 88603HB80 - 21-Oct-2019 99.4715 75,000,000.00 74,413,583.33 74,616,937.50 74,603,625.00OLD LINE ZERO 10/19 67984XFP6 - 24-Oct-2019 99.4634 50,000,000.00 49,714,361.11 49,739,199.27 49,731,700.00EXPORT DEVELMT ZERO 11/19 30215HYF1 - 15-Nov-2019 99.3535 50,000,000.00 49,411,805.56 49,643,722.22 49,676,771.00METLIFE SHORT ZERO 11/19 59157UYF1 - 15-Nov-2019 99.3529 20,000,000.00 19,824,000.00 19,870,444.44 19,870,589.40NAT'L AUSTRALIA ZERO 11/1 63253KYF8 - 15-Nov-2019 99.3440 100,000,000.00 99,346,000.00 99,358,111.12 99,344,031.00J.P. MORGAN ZERO 11/19 46640QYJ4 - 18-Nov-2019 99.3339 50,000,000.00 49,380,694.44 49,629,097.22 49,666,944.50
Page 3 of 4
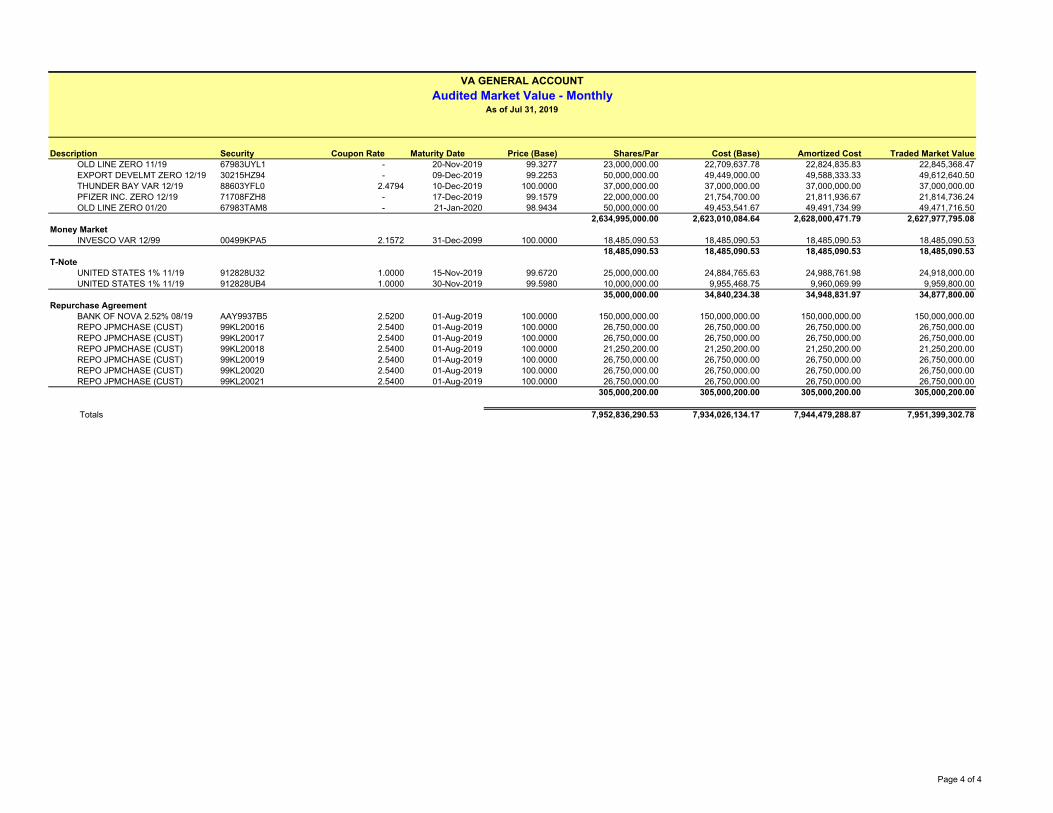
VA GENERAL ACCOUNT
Audited Market Value - MonthlyAs of Jul 31, 2019
Description Security Coupon Rate Maturity Date Price (Base) Shares/Par Cost (Base) Amortized Cost Traded Market ValueOLD LINE ZERO 11/19 67983UYL1 - 20-Nov-2019 99.3277 23,000,000.00 22,709,637.78 22,824,835.83 22,845,368.47EXPORT DEVELMT ZERO 12/19 30215HZ94 - 09-Dec-2019 99.2253 50,000,000.00 49,449,000.00 49,588,333.33 49,612,640.50THUNDER BAY VAR 12/19 88603YFL0 2.4794 10-Dec-2019 100.0000 37,000,000.00 37,000,000.00 37,000,000.00 37,000,000.00PFIZER INC. ZERO 12/19 71708FZH8 - 17-Dec-2019 99.1579 22,000,000.00 21,754,700.00 21,811,936.67 21,814,736.24OLD LINE ZERO 01/20 67983TAM8 - 21-Jan-2020 98.9434 50,000,000.00 49,453,541.67 49,491,734.99 49,471,716.50
2,634,995,000.00 2,623,010,084.64 2,628,000,471.79 2,627,977,795.08Money Market
INVESCO VAR 12/99 00499KPA5 2.1572 31-Dec-2099 100.0000 18,485,090.53 18,485,090.53 18,485,090.53 18,485,090.5318,485,090.53 18,485,090.53 18,485,090.53 18,485,090.53
T-NoteUNITED STATES 1% 11/19 912828U32 1.0000 15-Nov-2019 99.6720 25,000,000.00 24,884,765.63 24,988,761.98 24,918,000.00UNITED STATES 1% 11/19 912828UB4 1.0000 30-Nov-2019 99.5980 10,000,000.00 9,955,468.75 9,960,069.99 9,959,800.00
35,000,000.00 34,840,234.38 34,948,831.97 34,877,800.00Repurchase Agreement
BANK OF NOVA 2.52% 08/19 AAY9937B5 2.5200 01-Aug-2019 100.0000 150,000,000.00 150,000,000.00 150,000,000.00 150,000,000.00REPO JPMCHASE (CUST) 99KL20016 2.5400 01-Aug-2019 100.0000 26,750,000.00 26,750,000.00 26,750,000.00 26,750,000.00REPO JPMCHASE (CUST) 99KL20017 2.5400 01-Aug-2019 100.0000 26,750,000.00 26,750,000.00 26,750,000.00 26,750,000.00REPO JPMCHASE (CUST) 99KL20018 2.5400 01-Aug-2019 100.0000 21,250,200.00 21,250,200.00 21,250,200.00 21,250,200.00REPO JPMCHASE (CUST) 99KL20019 2.5400 01-Aug-2019 100.0000 26,750,000.00 26,750,000.00 26,750,000.00 26,750,000.00REPO JPMCHASE (CUST) 99KL20020 2.5400 01-Aug-2019 100.0000 26,750,000.00 26,750,000.00 26,750,000.00 26,750,000.00REPO JPMCHASE (CUST) 99KL20021 2.5400 01-Aug-2019 100.0000 26,750,000.00 26,750,000.00 26,750,000.00 26,750,000.00
305,000,200.00 305,000,200.00 305,000,200.00 305,000,200.00
Totals 7,952,836,290.53 7,934,026,134.17 7,944,479,288.87 7,951,399,302.78
Page 4 of 4

Account: 3015464900 VA. GENERAL/MERGANSER CAP Created: 7-Aug-2019 08:06:08 AM [CDT]
Audited Market Value - MonthlyAs of Jul 31, 2019
Description Security Coupon Rate Maturity Date Price (Base) Shares/Par Cost (Base) Amortized Cost Traded Market Value
Corporate BondAT&T INC 3% 06/22 00206RCM2 3.0000 6/30/2022 101.5120 1,796,000.00 1,750,710.59 1,760,914.15 1,823,155.52CHUBB INA 2.3% 11/20 00440EAT4 2.3000 11/3/2020 100.0360 2,500,000.00 2,513,375.00 2,503,548.90 2,500,900.00AIRGAS INC 2.9% 11/22 009363AM4 2.9000 11/15/2022 100.9550 500,000.00 507,150.00 506,930.74 504,775.00ALBERTO-CULVE 5.15% 06/20 013078AA8 5.1500 6/1/2020 102.2600 1,000,000.00 1,027,790.00 1,019,943.20 1,022,600.00AMERICA MOVIL 5% 03/20 02364WAV7 5.0000 3/30/2020 101.5870 844,000.00 860,837.80 855,137.96 857,394.28AMERICAN 2.375% 05/20 0258M0DT3 2.3750 5/26/2020 99.9870 1,390,000.00 1,373,014.20 1,383,326.04 1,389,819.30AMERICAN 2.25% 05/21 0258M0EB1 2.2500 5/5/2021 99.9913 510,000.00 503,456.70 504,673.86 509,955.38AMERICAN 2.5% 08/22 025816BM0 2.5000 8/1/2022 100.1840 925,000.00 888,212.75 899,172.76 926,701.63AUTOZONE INC 2.5% 04/21 053332AS1 2.5000 4/15/2021 100.1490 1,000,000.00 992,500.00 996,838.27 1,001,490.00AVALONBAY FLT 01/21 05348EBD0 2.7334 1/15/2021 99.9710 765,000.00 764,255.66 764,255.66 764,778.15BB&T CORP 2.05% 05/21 05531FAV5 2.0500 5/10/2021 99.4830 2,290,000.00 2,248,528.10 2,255,939.06 2,278,160.70BP CAPITAL 2.315% 02/20 05565QCX4 2.3150 2/13/2020 99.9590 2,525,000.00 2,497,805.75 2,517,308.03 2,523,964.75BANK OF 2.503% 10/22 06051GFZ7 2.5030 10/21/2022 100.0520 2,230,000.00 2,233,322.70 2,233,305.84 2,231,159.60BANK OF NEW 2.05% 05/21 06406FAB9 2.0500 5/3/2021 99.6390 1,800,000.00 1,766,088.00 1,785,728.13 1,793,502.00BANK OF NEW 2.3% 09/19 06406HCW7 2.3000 9/11/2019 99.9880 700,000.00 699,867.00 699,996.92 699,916.00BANK OF NOVA 2.45% 03/21 064159HM1 2.4500 3/22/2021 100.2800 1,425,000.00 1,395,659.25 1,406,635.53 1,428,990.00BANK OF NOVA 2.7% 03/22 064159JG2 2.7000 3/7/2022 101.0160 1,200,000.00 1,198,800.00 1,199,254.25 1,212,192.00BLACKROCK INC 5% 12/19 09247XAE1 5.0000 12/10/2019 100.9330 2,485,000.00 2,772,738.15 2,507,997.70 2,508,185.05CATERPILLAR 1.931% 10/21 14912L7D7 1.9310 10/1/2021 99.0780 930,000.00 895,059.10 905,169.82 921,425.40CATERPILLAR 3.15% 09/21 14913Q2N8 3.1500 9/7/2021 102.0270 1,540,000.00 1,560,394.20 1,559,736.82 1,571,215.80CISCO SYSTEMS 2.2% 02/21 17275RBD3 2.2000 2/28/2021 100.1400 2,810,000.00 2,813,540.60 2,811,387.68 2,813,934.00CITIGROUP 2.75% 04/22 172967LG4 2.7500 4/25/2022 100.5853 2,990,000.00 2,898,236.90 2,925,049.86 3,007,501.37COLUMBIA 3.3% 06/20 198280AD1 3.3000 6/1/2020 100.5240 1,140,000.00 1,137,520.20 1,138,835.44 1,145,973.60COMCAST CORP 3.45% 10/21 20030NCQ2 3.4500 10/1/2021 102.5368 1,175,000.00 1,173,813.25 1,174,140.68 1,204,807.17COMMONWEALTH 3.4% 09/21 202795HZ6 3.4000 9/1/2021 102.2360 2,000,000.00 2,001,460.00 2,001,104.75 2,044,720.00COSTCO 1.75% 02/20 22160KAG0 1.7500 2/15/2020 99.6580 2,215,000.00 2,236,175.40 2,218,357.09 2,207,424.70COSTCO 2.15% 05/21 22160KAJ4 2.1500 5/18/2021 100.0640 2,575,000.00 2,570,493.75 2,572,989.36 2,576,648.00CREDIT SUISSE 2.3% 05/19 22546QAN7 2.3000 5/28/2019 0.0000 0.00 0.00 0.00 0.00DTE ENERGY CO 2.6% 06/22 233331BB2 2.6000 6/15/2022 100.2110 1,275,000.00 1,273,572.00 1,273,639.60 1,277,690.25JOHN DEERE 2.35% 01/21 24422ETZ2 2.3500 1/8/2021 100.3230 2,420,000.00 2,401,583.80 2,406,200.39 2,427,816.60DUPONT DE FLT 11/23 26078JAH3 3.6280 11/15/2023 100.7940 2,850,000.00 2,869,095.00 2,869,095.00 2,872,629.00FEDERAL HOME 2.25% 01/21 3130ADFV9 2.2500 1/29/2021 99.7250 3,000,000.00 2,995,680.00 2,997,853.03 2,991,750.00FEDERAL HOME 2.3% 07/21 3134GTZD8 2.3000 7/8/2021 99.8230 3,000,000.00 3,000,000.00 3,000,000.00 2,994,690.00GENERAL 3% 05/21 369550BE7 3.0000 5/11/2021 101.5480 2,025,000.00 2,012,136.55 2,017,254.18 2,056,347.00GENERAL 4.15% 06/23 37045XCL8 4.1500 6/19/2023 103.3535 2,865,000.00 2,862,564.75 2,863,106.97 2,961,078.06GLAXOSMITHKL 2.875% 06/22 377373AJ4 2.8750 6/1/2022 101.4470 2,400,000.00 2,398,128.00 2,398,345.60 2,434,728.00GOLDMAN SACHS FLT 10/22 38148YAB4 3.0355 10/31/2022 100.2820 3,010,000.00 3,011,986.60 3,011,986.60 3,018,488.20HSBC USA INC 2.35% 03/20 40428HPR7 2.3500 3/5/2020 99.9090 2,890,000.00 2,892,283.10 2,890,600.01 2,887,370.10HEWLETT FLT 10/21 42824CBB4 3.0085 10/5/2021 100.0334 1,390,000.00 1,390,000.00 1,390,000.00 1,390,464.26HOME DEPOT 3.25% 03/22 437076BV3 3.2500 3/1/2022 103.0230 2,125,000.00 2,119,177.50 2,120,385.33 2,189,238.75INTERPUBLIC 4% 03/22 460690BH2 4.0000 3/15/2022 102.8850 1,105,000.00 1,104,988.95 1,104,991.75 1,136,879.25JPMORGAN 2.75% 06/20 46625HLW8 2.7500 6/23/2020 100.3286 2,800,000.00 2,847,404.00 2,813,362.86 2,809,200.24MANUFACTURERS FLT 12/20 564759PS1 3.4561 12/28/2020 100.0570 2,040,000.00 2,040,591.60 2,040,591.60 2,041,162.80
Page 1 of 4
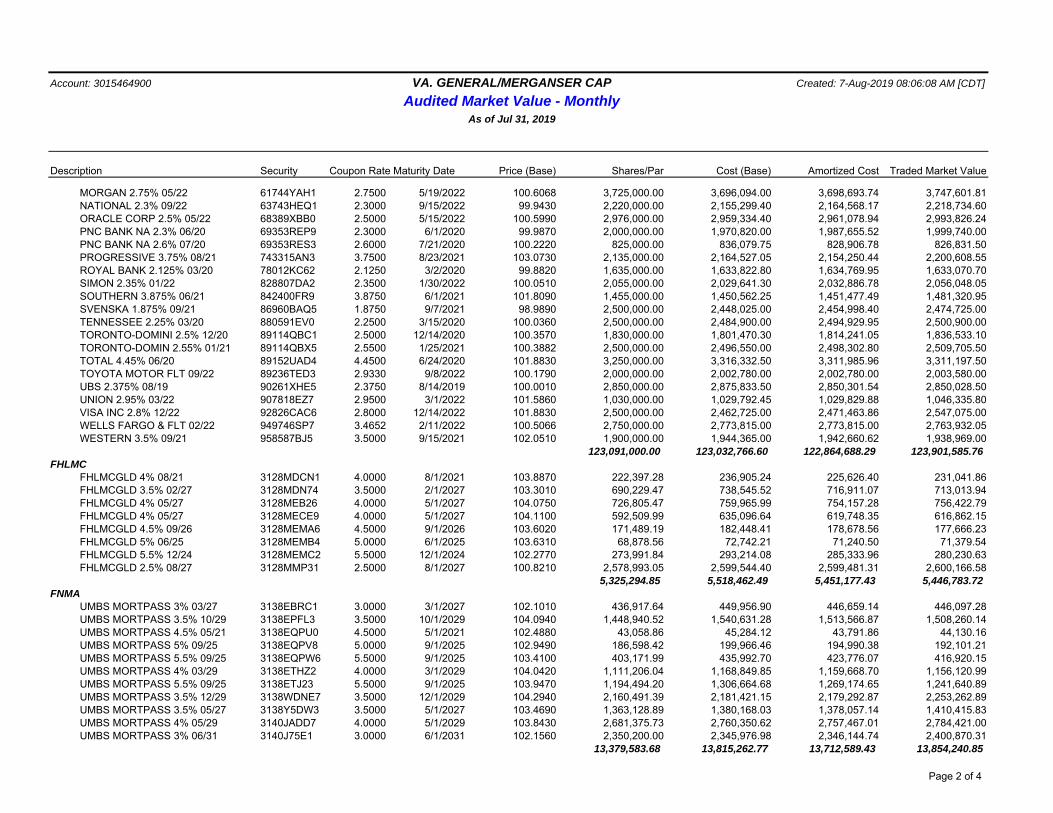
Account: 3015464900 VA. GENERAL/MERGANSER CAP Created: 7-Aug-2019 08:06:08 AM [CDT]
Audited Market Value - MonthlyAs of Jul 31, 2019
Description Security Coupon Rate Maturity Date Price (Base) Shares/Par Cost (Base) Amortized Cost Traded Market Value
MORGAN 2.75% 05/22 61744YAH1 2.7500 5/19/2022 100.6068 3,725,000.00 3,696,094.00 3,698,693.74 3,747,601.81NATIONAL 2.3% 09/22 63743HEQ1 2.3000 9/15/2022 99.9430 2,220,000.00 2,155,299.40 2,164,568.17 2,218,734.60ORACLE CORP 2.5% 05/22 68389XBB0 2.5000 5/15/2022 100.5990 2,976,000.00 2,959,334.40 2,961,078.94 2,993,826.24PNC BANK NA 2.3% 06/20 69353REP9 2.3000 6/1/2020 99.9870 2,000,000.00 1,970,820.00 1,987,655.52 1,999,740.00PNC BANK NA 2.6% 07/20 69353RES3 2.6000 7/21/2020 100.2220 825,000.00 836,079.75 828,906.78 826,831.50PROGRESSIVE 3.75% 08/21 743315AN3 3.7500 8/23/2021 103.0730 2,135,000.00 2,164,527.05 2,154,250.44 2,200,608.55ROYAL BANK 2.125% 03/20 78012KC62 2.1250 3/2/2020 99.8820 1,635,000.00 1,633,822.80 1,634,769.95 1,633,070.70SIMON 2.35% 01/22 828807DA2 2.3500 1/30/2022 100.0510 2,055,000.00 2,029,641.30 2,032,886.78 2,056,048.05SOUTHERN 3.875% 06/21 842400FR9 3.8750 6/1/2021 101.8090 1,455,000.00 1,450,562.25 1,451,477.49 1,481,320.95SVENSKA 1.875% 09/21 86960BAQ5 1.8750 9/7/2021 98.9890 2,500,000.00 2,448,025.00 2,454,998.40 2,474,725.00TENNESSEE 2.25% 03/20 880591EV0 2.2500 3/15/2020 100.0360 2,500,000.00 2,484,900.00 2,494,929.95 2,500,900.00TORONTO-DOMINI 2.5% 12/20 89114QBC1 2.5000 12/14/2020 100.3570 1,830,000.00 1,801,470.30 1,814,241.05 1,836,533.10TORONTO-DOMIN 2.55% 01/21 89114QBX5 2.5500 1/25/2021 100.3882 2,500,000.00 2,496,550.00 2,498,302.80 2,509,705.50TOTAL 4.45% 06/20 89152UAD4 4.4500 6/24/2020 101.8830 3,250,000.00 3,316,332.50 3,311,985.96 3,311,197.50TOYOTA MOTOR FLT 09/22 89236TED3 2.9330 9/8/2022 100.1790 2,000,000.00 2,002,780.00 2,002,780.00 2,003,580.00UBS 2.375% 08/19 90261XHE5 2.3750 8/14/2019 100.0010 2,850,000.00 2,875,833.50 2,850,301.54 2,850,028.50UNION 2.95% 03/22 907818EZ7 2.9500 3/1/2022 101.5860 1,030,000.00 1,029,792.45 1,029,829.88 1,046,335.80VISA INC 2.8% 12/22 92826CAC6 2.8000 12/14/2022 101.8830 2,500,000.00 2,462,725.00 2,471,463.86 2,547,075.00WELLS FARGO & FLT 02/22 949746SP7 3.4652 2/11/2022 100.5066 2,750,000.00 2,773,815.00 2,773,815.00 2,763,932.05WESTERN 3.5% 09/21 958587BJ5 3.5000 9/15/2021 102.0510 1,900,000.00 1,944,365.00 1,942,660.62 1,938,969.00
123,091,000.00 123,032,766.60 122,864,688.29 123,901,585.76 FHLMC
FHLMCGLD 4% 08/21 3128MDCN1 4.0000 8/1/2021 103.8870 222,397.28 236,905.24 225,626.40 231,041.86FHLMCGLD 3.5% 02/27 3128MDN74 3.5000 2/1/2027 103.3010 690,229.47 738,545.52 716,911.07 713,013.94FHLMCGLD 4% 05/27 3128MEB26 4.0000 5/1/2027 104.0750 726,805.47 759,965.99 754,157.28 756,422.79FHLMCGLD 4% 05/27 3128MECE9 4.0000 5/1/2027 104.1100 592,509.99 635,096.64 619,748.35 616,862.15FHLMCGLD 4.5% 09/26 3128MEMA6 4.5000 9/1/2026 103.6020 171,489.19 182,448.41 178,678.56 177,666.23FHLMCGLD 5% 06/25 3128MEMB4 5.0000 6/1/2025 103.6310 68,878.56 72,742.21 71,240.50 71,379.54FHLMCGLD 5.5% 12/24 3128MEMC2 5.5000 12/1/2024 102.2770 273,991.84 293,214.08 285,333.96 280,230.63FHLMCGLD 2.5% 08/27 3128MMP31 2.5000 8/1/2027 100.8210 2,578,993.05 2,599,544.40 2,599,481.31 2,600,166.58
5,325,294.85 5,518,462.49 5,451,177.43 5,446,783.72 FNMA
UMBS MORTPASS 3% 03/27 3138EBRC1 3.0000 3/1/2027 102.1010 436,917.64 449,956.90 446,659.14 446,097.28UMBS MORTPASS 3.5% 10/29 3138EPFL3 3.5000 10/1/2029 104.0940 1,448,940.52 1,540,631.28 1,513,566.87 1,508,260.14UMBS MORTPASS 4.5% 05/21 3138EQPU0 4.5000 5/1/2021 102.4880 43,058.86 45,284.12 43,791.86 44,130.16UMBS MORTPASS 5% 09/25 3138EQPV8 5.0000 9/1/2025 102.9490 186,598.42 199,966.46 194,990.38 192,101.21UMBS MORTPASS 5.5% 09/25 3138EQPW6 5.5000 9/1/2025 103.4100 403,171.99 435,992.70 423,776.07 416,920.15UMBS MORTPASS 4% 03/29 3138ETHZ2 4.0000 3/1/2029 104.0420 1,111,206.04 1,168,849.85 1,159,668.70 1,156,120.99UMBS MORTPASS 5.5% 09/25 3138ETJ23 5.5000 9/1/2025 103.9470 1,194,494.20 1,306,664.68 1,269,174.65 1,241,640.89UMBS MORTPASS 3.5% 12/29 3138WDNE7 3.5000 12/1/2029 104.2940 2,160,491.39 2,181,421.15 2,179,292.87 2,253,262.89UMBS MORTPASS 3.5% 05/27 3138Y5DW3 3.5000 5/1/2027 103.4690 1,363,128.89 1,380,168.03 1,378,057.14 1,410,415.83UMBS MORTPASS 4% 05/29 3140JADD7 4.0000 5/1/2029 103.8430 2,681,375.73 2,760,350.62 2,757,467.01 2,784,421.00UMBS MORTPASS 3% 06/31 3140J75E1 3.0000 6/1/2031 102.1560 2,350,200.00 2,345,976.98 2,346,144.74 2,400,870.31
13,379,583.68 13,815,262.77 13,712,589.43 13,854,240.85
Page 2 of 4

Account: 3015464900 VA. GENERAL/MERGANSER CAP Created: 7-Aug-2019 08:06:08 AM [CDT]
Audited Market Value - MonthlyAs of Jul 31, 2019
Description Security Coupon Rate Maturity Date Price (Base) Shares/Par Cost (Base) Amortized Cost Traded Market Value
Government BondINTERNATIONAL 2.24% 07/22 45905U6X7 2.2400 7/22/2022 100.0065 3,000,000.00 3,000,000.00 3,000,000.00 3,000,194.40
3,000,000.00 3,000,000.00 3,000,000.00 3,000,194.40 GNMA1 (20 Day Lag)
GNMA II FLT 11/41 36225FJ26 4.1250 11/20/2041 102.7290 209,224.78 217,593.77 217,593.77 214,934.52209,224.78 217,593.77 217,593.77 214,934.52
Money MarketINVESCO VAR 12/99 00499KPA5 2.1572 12/31/2099 100.0000 1,604,923.00 1,604,923.00 1,604,923.00 1,604,923.00
1,604,923.00 1,604,923.00 1,604,923.00 1,604,923.00 Mortgage Related
ALLY AUTO 3.02% 04/24 02004WAD3 3.0200 4/15/2024 102.1506 2,750,000.00 2,749,914.48 2,749,922.65 2,809,141.50ALLY MASTER 3.29% 05/23 02005AGU6 3.2900 5/15/2023 101.7069 2,550,000.00 2,549,976.29 2,549,980.65 2,593,524.93AMERICAN 2.04% 05/23 02582JHJ2 2.0400 5/15/2023 99.8141 2,500,000.00 2,499,623.25 2,499,744.14 2,495,352.75AMERICAN 2.67% 11/24 02587AAN4 2.6700 11/15/2024 101.4120 1,650,000.00 1,649,903.31 1,649,908.36 1,673,297.51ATLANTIC CITY 5.55% 10/23 048312AD4 5.5500 10/20/2023 103.9162 993,145.06 1,030,077.66 1,023,982.15 1,032,038.41BENCHMARK 3.848% 04/51 08161BAV5 3.8480 4/10/2051 104.6779 1,740,000.00 1,792,170.59 1,790,027.87 1,821,394.76COMM 3.031% 09/47 12592KAZ7 3.0310 9/10/2047 100.0303 1,016,013.83 1,039,509.15 1,037,601.91 1,016,322.09COMM 2.976% 07/48 12593FBA1 2.9760 7/10/2048 100.1217 850,849.92 850,650.50 850,659.35 851,885.57CNH EQUIPMENT 3.22% 01/26 12596JAD5 3.2200 1/15/2026 103.3361 1,500,000.00 1,499,550.60 1,499,583.54 1,550,041.35COMM 3.147% 08/45 12624KAD8 3.1470 8/15/2045 101.8011 1,400,000.00 1,390,375.00 1,390,733.90 1,425,215.82CAPITAL ONE 2.05% 08/23 14041NFB2 2.0500 8/15/2023 99.7199 1,000,000.00 999,613.90 999,800.88 997,199.20CAPITAL ONE 1.99% 07/23 14041NFN6 1.9900 7/17/2023 99.7550 2,000,000.00 1,999,845.40 1,999,892.02 1,995,099.40CAPITAL ONE 2.84% 12/24 14041NFT3 2.8400 12/15/2024 101.7162 5,100,000.00 5,099,111.58 5,099,179.62 5,187,524.16CAPITAL ONE 2.51% 11/23 14042WAC4 2.5100 11/15/2023 100.8450 1,500,000.00 1,499,696.10 1,499,709.78 1,512,674.40CHASE 1.84% 04/22 161571GX6 1.8400 4/15/2022 99.7631 1,200,000.00 1,211,062.50 1,205,022.97 1,197,156.60DISCOVER CARD 3.04% 07/24 254683CK9 3.0400 7/15/2024 102.1482 1,900,000.00 1,899,959.72 1,899,963.42 1,940,816.37FRESB 2017-SB27 VAR 01/22 302948AA2 2.4100 1/25/2022 100.2450 1,219,977.96 1,225,739.93 1,225,739.93 1,222,967.03FRESB 2018-SB55 VAR 07/23 30297PAE3 3.5300 7/25/2023 104.0694 1,289,040.81 1,295,179.22 1,295,179.22 1,341,497.17FANNIE MAE-ACES VAR 01/23 3136AEX69 2.3890 1/25/2023 100.4771 642,186.14 645,070.95 645,070.95 645,249.88FANNIE MAE-ACES VAR 10/21 3136ALHX2 2.6140 10/25/2021 100.4636 2,239,126.81 2,228,281.03 2,228,281.03 2,249,506.28FNMA REMICS 3% 04/42 3136ASJA5 3.0000 4/25/2042 101.9771 1,716,968.43 1,775,989.21 1,768,948.27 1,750,913.75FREDDIE MAC VAR 01/21 3137AA4W0 3.9740 1/25/2021 101.8880 1,000,000.00 1,064,921.88 1,064,921.88 1,018,879.50FHLMC REMICS 3.5% 07/41 3137ANTK1 3.5000 7/15/2041 103.0649 1,285,350.95 1,365,283.71 1,352,837.76 1,324,745.16FREDDIE MAC 3.13% 06/21 3137BDDC7 3.1300 6/25/2021 101.1390 800,000.00 811,968.75 811,031.13 809,111.60FREDDIE MAC 2.183% 05/22 3137BQBY2 2.1830 5/25/2022 99.9432 739,033.59 739,957.39 739,610.22 738,613.82FREDDIE MAC 2.197% 11/23 3137BYMP2 2.1970 11/25/2023 100.2116 1,112,311.43 1,109,498.40 1,110,403.81 1,114,665.41FREDDIE MAC 2.615% 01/23 3137B04Y7 2.6150 1/25/2023 101.0704 2,350,000.00 2,377,171.88 2,376,730.88 2,375,153.23FNMA REMICS 4.5% 09/23 31397MNG8 4.5000 9/25/2023 100.8385 3,229.60 3,250.41 3,240.40 3,256.68FIFTH THIRD 2.64% 12/23 31680YAD9 2.6400 12/15/2023 100.7543 1,150,000.00 1,149,747.23 1,149,761.18 1,158,674.22FORD CREDIT 2.16% 09/22 34528QFP4 2.1600 9/15/2022 99.8257 2,000,000.00 1,999,704.20 1,999,811.74 1,996,513.60FORD CREDIT 1.67% 06/21 34531EAD8 1.6700 6/15/2021 99.7302 1,412,605.34 1,412,600.12 1,412,603.08 1,408,794.13FORD CREDIT 2.16% 03/23 34532AAE3 2.1600 3/15/2023 99.8719 634,000.00 622,112.50 623,660.86 633,187.91FORD CREDIT 2.24% 10/24 34532DAE7 2.2400 10/15/2024 99.9175 2,800,000.00 2,799,696.76 2,799,703.80 2,797,690.28SEASONED LOANS 3.5% 06/28 35564CAA5 3.5000 6/25/2028 103.4784 997,705.06 997,266.63 997,252.60 1,032,409.53
Page 3 of 4
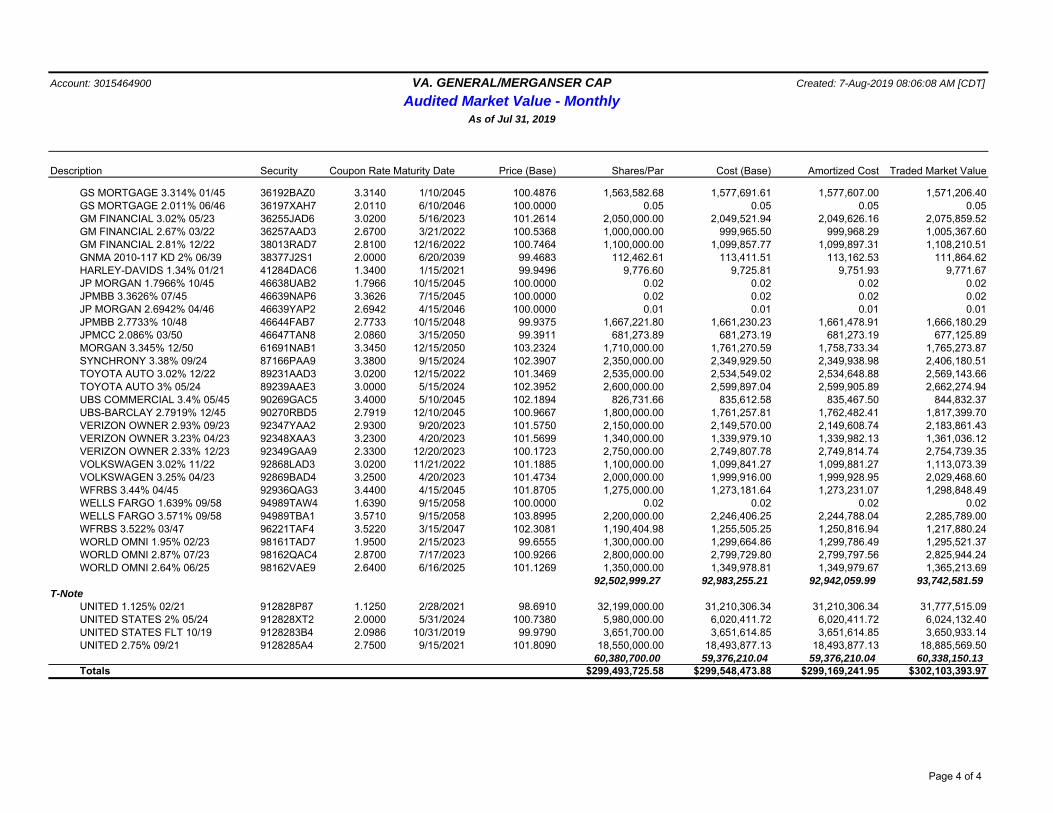
Account: 3015464900 VA. GENERAL/MERGANSER CAP Created: 7-Aug-2019 08:06:08 AM [CDT]
Audited Market Value - MonthlyAs of Jul 31, 2019
Description Security Coupon Rate Maturity Date Price (Base) Shares/Par Cost (Base) Amortized Cost Traded Market Value
GS MORTGAGE 3.314% 01/45 36192BAZ0 3.3140 1/10/2045 100.4876 1,563,582.68 1,577,691.61 1,577,607.00 1,571,206.40GS MORTGAGE 2.011% 06/46 36197XAH7 2.0110 6/10/2046 100.0000 0.05 0.05 0.05 0.05GM FINANCIAL 3.02% 05/23 36255JAD6 3.0200 5/16/2023 101.2614 2,050,000.00 2,049,521.94 2,049,626.16 2,075,859.52GM FINANCIAL 2.67% 03/22 36257AAD3 2.6700 3/21/2022 100.5368 1,000,000.00 999,965.50 999,968.29 1,005,367.60GM FINANCIAL 2.81% 12/22 38013RAD7 2.8100 12/16/2022 100.7464 1,100,000.00 1,099,857.77 1,099,897.31 1,108,210.51GNMA 2010-117 KD 2% 06/39 38377J2S1 2.0000 6/20/2039 99.4683 112,462.61 113,411.51 113,162.53 111,864.62HARLEY-DAVIDS 1.34% 01/21 41284DAC6 1.3400 1/15/2021 99.9496 9,776.60 9,725.81 9,751.93 9,771.67JP MORGAN 1.7966% 10/45 46638UAB2 1.7966 10/15/2045 100.0000 0.02 0.02 0.02 0.02JPMBB 3.3626% 07/45 46639NAP6 3.3626 7/15/2045 100.0000 0.02 0.02 0.02 0.02JP MORGAN 2.6942% 04/46 46639YAP2 2.6942 4/15/2046 100.0000 0.01 0.01 0.01 0.01JPMBB 2.7733% 10/48 46644FAB7 2.7733 10/15/2048 99.9375 1,667,221.80 1,661,230.23 1,661,478.91 1,666,180.29JPMCC 2.086% 03/50 46647TAN8 2.0860 3/15/2050 99.3911 681,273.89 681,273.19 681,273.19 677,125.89MORGAN 3.345% 12/50 61691NAB1 3.3450 12/15/2050 103.2324 1,710,000.00 1,761,270.59 1,758,733.34 1,765,273.87SYNCHRONY 3.38% 09/24 87166PAA9 3.3800 9/15/2024 102.3907 2,350,000.00 2,349,929.50 2,349,938.98 2,406,180.51TOYOTA AUTO 3.02% 12/22 89231AAD3 3.0200 12/15/2022 101.3469 2,535,000.00 2,534,549.02 2,534,648.88 2,569,143.66TOYOTA AUTO 3% 05/24 89239AAE3 3.0000 5/15/2024 102.3952 2,600,000.00 2,599,897.04 2,599,905.89 2,662,274.94UBS COMMERCIAL 3.4% 05/45 90269GAC5 3.4000 5/10/2045 102.1894 826,731.66 835,612.58 835,467.50 844,832.37UBS-BARCLAY 2.7919% 12/45 90270RBD5 2.7919 12/10/2045 100.9667 1,800,000.00 1,761,257.81 1,762,482.41 1,817,399.70VERIZON OWNER 2.93% 09/23 92347YAA2 2.9300 9/20/2023 101.5750 2,150,000.00 2,149,570.00 2,149,608.74 2,183,861.43VERIZON OWNER 3.23% 04/23 92348XAA3 3.2300 4/20/2023 101.5699 1,340,000.00 1,339,979.10 1,339,982.13 1,361,036.12VERIZON OWNER 2.33% 12/23 92349GAA9 2.3300 12/20/2023 100.1723 2,750,000.00 2,749,807.78 2,749,814.74 2,754,739.35VOLKSWAGEN 3.02% 11/22 92868LAD3 3.0200 11/21/2022 101.1885 1,100,000.00 1,099,841.27 1,099,881.27 1,113,073.39VOLKSWAGEN 3.25% 04/23 92869BAD4 3.2500 4/20/2023 101.4734 2,000,000.00 1,999,916.00 1,999,928.95 2,029,468.60WFRBS 3.44% 04/45 92936QAG3 3.4400 4/15/2045 101.8705 1,275,000.00 1,273,181.64 1,273,231.07 1,298,848.49WELLS FARGO 1.639% 09/58 94989TAW4 1.6390 9/15/2058 100.0000 0.02 0.02 0.02 0.02WELLS FARGO 3.571% 09/58 94989TBA1 3.5710 9/15/2058 103.8995 2,200,000.00 2,246,406.25 2,244,788.04 2,285,789.00WFRBS 3.522% 03/47 96221TAF4 3.5220 3/15/2047 102.3081 1,190,404.98 1,255,505.25 1,250,816.94 1,217,880.24WORLD OMNI 1.95% 02/23 98161TAD7 1.9500 2/15/2023 99.6555 1,300,000.00 1,299,664.86 1,299,786.49 1,295,521.37WORLD OMNI 2.87% 07/23 98162QAC4 2.8700 7/17/2023 100.9266 2,800,000.00 2,799,729.80 2,799,797.56 2,825,944.24WORLD OMNI 2.64% 06/25 98162VAE9 2.6400 6/16/2025 101.1269 1,350,000.00 1,349,978.81 1,349,979.67 1,365,213.69
92,502,999.27 92,983,255.21 92,942,059.99 93,742,581.59 T-Note
UNITED 1.125% 02/21 912828P87 1.1250 2/28/2021 98.6910 32,199,000.00 31,210,306.34 31,210,306.34 31,777,515.09UNITED STATES 2% 05/24 912828XT2 2.0000 5/31/2024 100.7380 5,980,000.00 6,020,411.72 6,020,411.72 6,024,132.40UNITED STATES FLT 10/19 9128283B4 2.0986 10/31/2019 99.9790 3,651,700.00 3,651,614.85 3,651,614.85 3,650,933.14UNITED 2.75% 09/21 9128285A4 2.7500 9/15/2021 101.8090 18,550,000.00 18,493,877.13 18,493,877.13 18,885,569.50
60,380,700.00 59,376,210.04 59,376,210.04 60,338,150.13 Totals $299,493,725.58 $299,548,473.88 $299,169,241.95 $302,103,393.97
Page 4 of 4

Account: 3015465000 VA GENERAL/WELLINGTON Created: 7-Aug-2019 08:06:12 AM [CDT]
Audited Market Value - MonthlyAs of Jul 31, 2019
Description Security Coupon Rate Maturity Date Price (Base) Shares/Par Cost (Base) Amortized Cost Traded Market Value
Corporate BondAT&T INC 4.125% 02/26 00206RCT7 4.1250 2/17/2026 107.0110 195,000.00 196,398.36 195,925.11 208,671.45AT&T INC 4.25% 03/27 00206RDQ2 4.2500 3/1/2027 107.5600 215,000.00 216,860.24 216,511.11 231,254.00AT&T INC 4.35% 03/29 00206RHJ4 4.3500 3/1/2029 107.9940 360,000.00 358,228.80 358,309.92 388,778.40AT&T INC 3.6% 07/25 00206RHS4 3.6000 7/15/2025 104.0160 410,000.00 401,194.15 401,415.35 426,465.60AT&T INC 3.875% 01/26 00206RHT2 3.8750 1/15/2026 105.2570 145,000.00 147,062.97 147,015.37 152,622.65AT&T INC 2.95% 07/26 00206RHV7 2.9500 7/15/2026 100.3180 145,000.00 139,094.10 139,221.50 145,461.10AETNA INC 2.8% 06/23 00817YAV0 2.8000 6/15/2023 100.0968 445,000.00 444,350.30 444,639.43 445,430.94ALABAMA 2.45% 03/22 010392FQ6 2.4500 3/30/2022 100.4330 645,000.00 638,973.30 640,757.22 647,792.85ALIBABA GROUP 3.4% 12/27 01609WAT9 3.4000 12/6/2027 101.7922 700,000.00 696,066.70 696,713.77 712,545.19ALTRIA GROUP 2.85% 08/22 02209SAN3 2.8500 8/9/2022 100.7650 80,000.00 81,240.79 80,608.68 80,612.00ALTRIA 2.625% 09/26 02209SAU7 2.6250 9/16/2026 96.9490 215,000.00 188,784.63 190,520.88 208,440.35ALTRIA GROUP 3.49% 02/22 02209SBA0 3.4900 2/14/2022 102.2081 675,000.00 674,959.50 674,966.30 689,904.74ALTRIA GROUP 3.8% 02/24 02209SBB8 3.8000 2/14/2024 103.9667 415,000.00 414,157.55 414,235.75 431,461.68ALTRIA GROUP 4.4% 02/26 02209SBC6 4.4000 2/14/2026 106.5910 145,000.00 144,696.95 144,717.35 154,556.95ALTRIA GROUP 4.8% 02/29 02209SBD4 4.8000 2/14/2029 107.9070 255,000.00 256,124.70 256,072.36 275,162.85AMAZON.COM 3.8% 12/24 023135AN6 3.8000 12/5/2024 107.2820 425,000.00 456,148.25 447,879.40 455,948.50AMEREN 3.25% 03/25 02361DAP5 3.2500 3/1/2025 103.5470 625,000.00 624,643.75 624,806.29 647,168.75AMERICAN 2.25% 08/19 0258M0DP1 2.2500 8/15/2019 99.9950 375,000.00 376,590.00 375,012.95 374,981.25AMERICAN 3.7% 11/21 025816BY4 3.7000 11/5/2021 102.9158 205,000.00 204,954.90 204,965.82 210,977.43AMERICAN 4.2% 11/25 025816CA5 4.2000 11/6/2025 108.7581 205,000.00 204,544.90 204,594.04 222,954.04ANHEUSER-BUSC 4.15% 01/25 03523TBX5 4.1500 1/23/2025 107.6360 565,000.00 564,435.00 564,486.90 608,143.40ANHEUSER-BUSCH 4% 04/28 035240AL4 4.0000 4/13/2028 108.5120 195,000.00 190,171.80 190,443.50 211,598.40ANHEUSER-BUSC 3.65% 02/26 035242AP1 3.6500 2/1/2026 105.3070 1,905,000.00 1,860,266.89 1,864,890.96 2,006,098.35ANTHEM INC 3.65% 12/27 036752AB9 3.6500 12/1/2027 103.3019 175,000.00 173,407.64 173,531.86 180,778.41APPALACHIAN 3.3% 06/27 037735CW5 3.3000 6/1/2027 103.0168 355,000.00 349,480.75 350,269.78 365,709.75APPLE INC 3.25% 02/26 037833BY5 3.2500 2/23/2026 104.5700 400,000.00 390,440.00 391,790.90 418,280.00BB&T CORP 2.5% 08/24 05531FBH5 2.5000 8/1/2024 99.8660 1,270,000.00 1,268,933.20 1,268,938.42 1,268,298.20BANK OF VAR 01/23 06050TMJ8 3.3350 1/25/2023 102.2450 1,100,000.00 1,100,000.00 1,100,000.00 1,124,694.89BANK OF AMERICA 4% 01/25 06051GFM6 4.0000 1/22/2025 104.9650 265,000.00 263,402.05 264,128.18 278,157.25BANK OF 3.95% 04/25 06051GFP9 3.9500 4/21/2025 104.7430 125,000.00 124,631.25 124,787.95 130,928.75BANK OF VAR 04/28 06051GGL7 3.7050 4/24/2028 104.9862 890,000.00 872,530.00 874,453.65 934,377.00BANK OF VAR 07/21 06051GGP8 2.3690 7/21/2021 99.9090 660,000.00 660,000.00 660,000.00 659,399.47BANK OF VAR 01/22 06051GGY9 2.7380 1/23/2022 100.3020 455,000.00 455,000.00 455,000.00 456,374.10BANK OF VAR 12/28 06051GHD4 3.4190 12/20/2028 102.8876 345,000.00 319,728.75 321,693.95 354,962.39BANK OF VAR 07/24 06051GHL6 3.8640 7/23/2024 104.8430 965,000.00 965,000.00 965,000.00 1,011,734.95BANK OF VAR 02/30 06051GHQ5 3.9740 2/7/2030 107.1530 450,000.00 450,000.00 450,000.00 482,188.50BANK OF VAR 07/30 06051GHV4 3.1940 7/23/2030 100.8200 1,595,000.00 1,595,000.00 1,595,000.00 1,608,079.00BANK OF 4.1% 07/23 06053FAA7 4.1000 7/24/2023 106.1240 595,000.00 628,005.35 610,293.07 631,437.80BANK OF 2.9% 03/22 06367WJM6 2.9000 3/26/2022 101.5110 1,000,000.00 997,460.00 997,767.23 1,015,110.00BANK OF NEW FLT 10/23 06406FAF0 3.3158 10/30/2023 101.7780 815,000.00 815,000.00 815,000.00 829,490.70BANK OF NEW 2.6% 08/20 06406HDD8 2.6000 8/17/2020 100.3490 490,000.00 489,769.70 489,952.25 491,710.10BARCLAYS PLC VAR 05/25 06738EBH7 3.9320 5/7/2025 101.0290 485,000.00 485,000.00 485,000.00 489,990.65BOEING CO/THE 2.7% 02/27 097023CM5 2.7000 2/1/2027 100.0700 270,000.00 269,271.00 269,271.81 270,189.00BOSTON 4% 03/28 101137AS6 4.0000 3/1/2028 108.0800 115,000.00 113,907.33 114,022.25 124,292.00BP CAPITAL 3.79% 02/24 10373QAD2 3.7900 2/6/2024 105.3002 165,000.00 165,000.00 165,000.00 173,745.35BP CAPITAL 3.224% 04/24 10373QAY6 3.2240 4/14/2024 103.2660 300,000.00 295,456.58 295,960.80 309,798.00BURLINGTON 3.4% 09/24 12189LAT8 3.4000 9/1/2024 104.8660 275,000.00 272,459.00 272,905.35 288,381.50BURLINGTON 3% 04/25 12189LAV3 3.0000 4/1/2025 103.1910 685,000.00 676,490.85 677,704.05 706,858.35BURLINGTON 4.7% 10/19 12189TBC7 4.7000 10/1/2019 100.3360 870,000.00 956,802.40 874,111.10 872,923.20
Page 1 of 10

Account: 3015465000 VA GENERAL/WELLINGTON Created: 7-Aug-2019 08:06:12 AM [CDT]
Audited Market Value - MonthlyAs of Jul 31, 2019
Description Security Coupon Rate Maturity Date Price (Base) Shares/Par Cost (Base) Amortized Cost Traded Market Value
CBS CORP 2.5% 02/23 124857AS2 2.5000 2/15/2023 99.5150 445,000.00 419,034.25 425,024.97 442,841.71CIGNA 3.05% 10/27 125509BV0 3.0500 10/15/2027 99.6040 2,225,000.00 2,048,993.78 2,065,194.97 2,216,189.00CSX CORP 3.25% 06/27 126408HH9 3.2500 6/1/2027 103.0939 340,000.00 339,585.20 339,677.68 350,519.29CVS HEALTH 3.875% 07/25 126650CL2 3.8750 7/20/2025 104.3620 1,001,000.00 969,898.93 974,670.53 1,044,663.62CVS HEALTH 2.875% 06/26 126650CU2 2.8750 6/1/2026 98.9950 640,000.00 602,595.72 608,488.41 633,568.00CVS HEALTH 4.1% 03/25 126650CW8 4.1000 3/25/2025 105.3040 240,000.00 237,650.40 238,116.93 252,729.60CANADIAN 3.85% 06/27 136385AX9 3.8500 6/1/2027 103.4480 440,000.00 433,884.00 434,171.64 455,171.20CATERPILLAR 1.85% 09/20 14913Q2A6 1.8500 9/4/2020 99.5692 425,000.00 424,643.00 424,870.00 423,169.27CATERPILLAR 2.65% 05/21 14913Q2W8 2.6500 5/17/2021 100.7970 700,000.00 699,664.00 699,700.34 705,579.00CENTERPOINT 2.5% 09/22 15189TAR8 2.5000 9/1/2022 99.9620 350,000.00 350,097.55 350,061.35 349,867.00CITIGROUP INC 5.5% 09/25 172967HB0 5.5000 9/13/2025 112.6140 250,000.00 272,986.56 263,989.16 281,535.00CITIGROUP INC 4.6% 03/26 172967KJ9 4.6000 3/9/2026 108.0350 170,000.00 169,663.40 169,775.63 183,659.50CITIGROUP INC FLT 05/24 172967LL3 3.6251 5/17/2024 101.0330 175,000.00 175,000.00 175,000.00 176,807.75CITIGROUP INC VAR 07/23 172967LM1 2.8760 7/24/2023 100.8515 360,000.00 348,422.40 350,457.89 363,065.36CITIGROUP INC VAR 03/30 172967ME8 3.9800 3/20/2030 106.8560 1,375,000.00 1,375,000.00 1,375,000.00 1,469,270.00CITIGROUP INC VAR 04/25 172967MF5 3.3520 4/24/2025 102.6820 1,595,000.00 1,595,000.00 1,595,000.00 1,637,777.90CITIBANK NA 3.4% 07/21 17325FAQ1 3.4000 7/23/2021 101.9360 585,000.00 584,356.50 584,577.63 596,325.60COCA-COLA 2.25% 09/26 191216BZ2 2.2500 9/1/2026 99.2615 375,000.00 357,530.15 362,030.88 372,230.44COMCAST 3.375% 08/25 20030NBN0 3.3750 8/15/2025 104.4090 355,000.00 341,328.57 343,399.36 370,651.95COMCAST CORP 3.45% 10/21 20030NCQ2 3.4500 10/1/2021 102.5368 280,000.00 279,717.20 279,795.98 287,102.98COMCAST CORP 3.95% 10/25 20030NCS8 3.9500 10/15/2025 107.6430 305,000.00 304,624.85 304,670.30 328,311.06COMCAST CORP 4.15% 10/28 20030NCT6 4.1500 10/15/2028 110.1535 415,000.00 414,792.50 414,810.68 457,137.23COMMONWEALTH 4% 08/20 202795HV5 4.0000 8/1/2020 101.2100 400,000.00 412,392.00 401,282.83 404,840.00COMMONWEALTH 2.55% 06/26 202795JH4 2.5500 6/15/2026 99.7020 290,000.00 290,000.00 290,000.00 289,135.80COMMONWEALTH 3.7% 08/28 202795JN1 3.7000 8/15/2028 108.5010 515,000.00 513,764.00 513,886.06 558,780.15CONSOLIDATED 4.45% 06/20 209111EZ2 4.4500 6/15/2020 101.7350 700,000.00 698,481.00 699,867.62 712,145.00CREDIT 3% 10/21 22546QAR8 3.0000 10/29/2021 101.3260 800,000.00 789,296.00 792,775.95 810,608.00DTE ENERGY CO 2.6% 06/22 233331BB2 2.6000 6/15/2022 100.2110 315,000.00 314,647.20 314,663.84 315,664.65JOHN DEERE 2.65% 01/22 24422ETL3 2.6500 1/6/2022 100.8162 575,000.00 574,839.00 574,923.60 579,693.21JOHN DEERE 2.15% 09/22 24422ETV1 2.1500 9/8/2022 99.5349 1,000,000.00 997,970.00 998,741.45 995,349.00DOMINION 3.9% 10/25 25746UCE7 3.9000 10/1/2025 106.2940 385,000.00 390,588.40 388,287.98 409,231.90DOMINION 4.25% 06/28 25746UCY3 4.2500 6/1/2028 108.9580 285,000.00 285,044.10 285,040.30 310,530.19DUKE ENERGY 3.35% 05/22 26442CAW4 3.3500 5/15/2022 103.0850 365,000.00 364,164.15 364,325.85 376,260.25DUKE ENERGY 3.25% 08/25 26442UAA2 3.2500 8/15/2025 104.0010 1,225,000.00 1,211,173.75 1,213,814.05 1,274,012.25ENTERPRISE 4.15% 10/28 29379VBT9 4.1500 10/16/2028 108.0182 180,000.00 177,804.00 177,976.80 194,432.67ENTERPRISE 3.125% 07/29 29379VBV4 3.1250 7/31/2029 100.5710 235,000.00 234,969.25 234,969.64 236,341.85EXXON MOBIL 3.043% 03/26 30231GAT9 3.0430 3/1/2026 103.7947 215,000.00 215,000.00 215,000.00 223,158.54EXXON MOBIL 2.222% 03/21 30231GAV4 2.2220 3/1/2021 100.1770 765,000.00 765,000.00 765,000.00 766,354.05FEDERAL HOME 2.75% 03/26 3130AAUF3 2.7500 3/13/2026 103.9340 700,000.00 683,788.00 686,067.15 727,538.00FEDERAL 0.875% 08/19 3130A8Y72 0.8750 8/5/2019 99.9839 1,360,000.00 1,337,124.80 1,359,770.66 1,359,781.58FEDERAL 1.875% 09/26 3135G0Q22 1.8750 9/24/2026 98.9240 1,100,000.00 1,004,421.00 1,016,982.00 1,088,164.00FEDERAL 6.625% 11/30 31359MGK3 6.6250 11/15/2030 142.4680 1,100,000.00 1,475,452.00 1,442,635.40 1,567,148.00FIDELITY 3.75% 05/29 31620MBJ4 3.7500 5/21/2029 105.9160 205,000.00 204,643.30 204,651.20 217,127.80FIFTH THIRD 2.875% 10/21 31677QBC2 2.8750 10/1/2021 100.9230 925,000.00 920,236.25 923,538.76 933,537.75FISERV INC 3.8% 10/23 337738AQ1 3.8000 10/1/2023 104.4952 695,000.00 694,680.30 694,733.85 726,241.50FISERV INC 2.75% 07/24 337738AS7 2.7500 7/1/2024 100.7500 1,275,000.00 1,272,858.00 1,272,918.32 1,284,562.50FLUOR CORP 4.25% 09/28 343412AF9 4.2500 9/15/2028 104.1711 290,000.00 289,382.30 289,441.12 302,096.31FORD MOTOR 4.134% 08/25 345397XL2 4.1340 8/4/2025 99.6780 300,000.00 274,035.00 275,820.24 299,034.00FORD MOTOR 3.815% 11/27 345397YT4 3.8150 11/2/2027 95.5800 200,000.00 183,260.00 184,946.62 191,160.00FORD MOTOR 5.113% 05/29 345397ZR7 5.1130 5/3/2029 101.4852 200,000.00 197,232.00 197,301.16 202,970.40
Page 2 of 10

Account: 3015465000 VA GENERAL/WELLINGTON Created: 7-Aug-2019 08:06:12 AM [CDT]
Audited Market Value - MonthlyAs of Jul 31, 2019
Description Security Coupon Rate Maturity Date Price (Base) Shares/Par Cost (Base) Amortized Cost Traded Market Value
GENERAL 2.625% 11/27 369550AZ1 2.6250 11/15/2027 101.0590 550,000.00 538,070.50 540,282.19 555,824.50GENERAL 2.875% 05/20 369550BA5 2.8750 5/11/2020 100.4916 810,000.00 807,132.60 808,890.98 813,982.12GENERAL FLT 05/20 369550BB3 2.8253 5/11/2020 100.1799 200,000.00 200,493.20 200,205.90 200,359.82GENERAL 3.375% 05/23 369550BD9 3.3750 5/15/2023 103.9430 100,000.00 100,156.51 100,120.96 103,943.00GENERAL MOTORS 5% 10/28 37045VAS9 5.0000 10/1/2028 105.0368 620,000.00 619,783.00 619,802.80 651,228.41GENERAL 4.35% 01/27 37045XBT2 4.3500 1/17/2027 101.5445 800,000.00 801,593.00 800,827.41 812,355.68GEORGIA 2.85% 05/22 373334JX0 2.8500 5/15/2022 101.2510 145,000.00 141,862.20 142,739.10 146,813.95GEORGIA POWER 2.4% 04/21 373334KF7 2.4000 4/1/2021 99.9790 550,000.00 548,872.50 549,631.56 549,884.50GEORGIA POWER 2% 09/20 373334KJ9 2.0000 9/8/2020 99.5285 737,000.00 720,664.59 729,624.98 733,525.05GLAXOSMITHKL 3.375% 05/23 377372AL1 3.3750 5/15/2023 103.5400 390,000.00 388,170.90 388,618.90 403,806.00GLAXOSMITHKLI 2.85% 05/22 377373AD7 2.8500 5/8/2022 101.4150 255,000.00 253,885.65 254,061.42 258,608.25GLAXOSMITHKL 3.125% 05/21 377373AE5 3.1250 5/14/2021 101.4197 390,000.00 388,950.90 389,377.34 395,536.91GOLDMAN SACHS FLT 11/23 38141EB81 4.1249 11/29/2023 102.9870 500,000.00 508,130.00 504,086.89 514,935.00GOLDMAN 5.75% 01/22 38141GGS7 5.7500 1/24/2022 107.6920 215,000.00 226,171.32 218,024.85 231,537.80GOLDMAN SACHS 4% 03/24 38141GVM3 4.0000 3/3/2024 105.6080 230,000.00 229,305.40 229,680.92 242,898.40GOLDMAN SACHS VAR 06/28 38141GWL4 3.6910 6/5/2028 103.4758 400,000.00 400,000.00 400,000.00 413,903.28GOLDMAN SACHS VAR 07/23 38141GWM2 2.9050 7/24/2023 100.8636 730,000.00 724,728.30 725,566.26 736,304.21GOLDMAN SACHS VAR 09/25 38141GWQ3 3.2720 9/29/2025 101.9620 260,000.00 248,625.00 249,510.40 265,101.23GOLDMAN SACHS VAR 05/29 38141GWZ3 4.2230 5/1/2029 107.7070 590,000.00 579,919.60 580,676.78 635,471.30GOLDMAN SACHS 3.5% 11/26 38145GAH3 3.5000 11/16/2026 102.7630 680,000.00 629,503.20 633,629.37 698,788.40GOLDMAN 3.75% 05/25 38148LAE6 3.7500 5/22/2025 104.4460 945,000.00 926,856.30 929,452.25 987,014.70GOLDMAN SACHS VAR 10/22 38148YAC2 2.8760 10/31/2022 100.6140 320,000.00 320,000.00 320,000.00 321,964.80HCP INC 3.25% 07/26 40414LAQ2 3.2500 7/15/2026 101.1720 145,000.00 144,863.70 144,865.80 146,699.40HSBC 4.25% 03/24 404280AP4 4.2500 3/14/2024 104.8010 600,000.00 626,676.50 613,359.86 628,806.00HSBC HOLDINGS 4.3% 03/26 404280AW9 4.3000 3/8/2026 106.9010 255,000.00 261,775.02 259,478.63 272,597.55HSBC 2.95% 05/21 404280AY5 2.9500 5/25/2021 100.7660 640,000.00 635,190.05 637,092.75 644,902.40HOME DEPOT 2.7% 04/23 437076AZ5 2.7000 4/1/2023 101.9360 320,000.00 319,500.80 319,819.24 326,195.20HOME DEPOT 2.8% 09/27 437076BT8 2.8000 9/14/2027 101.6322 1,000,000.00 997,400.00 997,893.45 1,016,321.70HOME DEPOT 3.25% 03/22 437076BV3 3.2500 3/1/2022 103.0230 170,000.00 169,534.20 169,630.53 175,139.10HUMANA INC 3.85% 10/24 444859BD3 3.8500 10/1/2024 104.4910 350,000.00 349,363.00 349,473.60 365,718.50INTEL CORP 1.7% 05/21 458140AW0 1.7000 5/19/2021 99.1373 625,000.00 623,900.00 624,605.00 619,608.00INTEL CORP 2.875% 05/24 458140BD1 2.8750 5/11/2024 102.4890 805,000.00 789,163.75 792,095.73 825,036.45INTERNATIONAL 2.85% 05/22 459200JX0 2.8500 5/13/2022 101.2760 745,000.00 744,597.70 744,629.15 754,506.20INTERNATIONAL 3% 05/24 459200JY8 3.0000 5/15/2024 102.3170 455,000.00 453,261.90 453,342.65 465,542.35INTERNATIONAL 3.3% 05/26 459200JZ5 3.3000 5/15/2026 103.8410 455,000.00 454,153.70 454,181.75 472,476.55INTERNATIONAL 3.5% 05/29 459200KA8 3.5000 5/15/2029 104.8040 425,000.00 423,933.25 423,957.90 445,417.00JPMORGAN 2.295% 08/21 46623EKG3 2.2950 8/15/2021 99.7740 480,000.00 474,704.00 476,539.48 478,915.20JPMORGAN 4.35% 08/21 46625HJC5 4.3500 8/15/2021 103.8090 980,000.00 997,426.23 984,414.12 1,017,328.20JPMORGAN 3.3% 04/26 46625HQW3 3.3000 4/1/2026 103.7640 210,000.00 209,750.10 209,836.06 217,904.40JPMORGAN CHASE VAR 03/25 46647PAH9 3.2200 3/1/2025 102.7074 475,000.00 475,000.00 475,000.00 487,860.29JPMORGAN CHASE VAR 01/29 46647PAM8 3.5090 1/23/2029 103.8937 760,000.00 750,243.50 751,242.85 789,592.35JPMORGAN CHASE VAR 07/24 46647PAU0 3.7970 7/23/2024 104.6820 1,320,000.00 1,321,575.00 1,321,426.80 1,381,802.40JPMORGAN CHASE VAR 01/27 46647PBA3 3.9600 1/29/2027 106.8633 1,260,000.00 1,260,000.00 1,260,000.00 1,346,477.45JOHNSON & 2.45% 03/26 478160BY9 2.4500 3/1/2026 100.4820 130,000.00 129,816.70 129,879.65 130,626.60MARSH & 4.05% 10/23 571748AU6 4.0500 10/15/2023 105.5870 800,000.00 796,848.00 798,684.96 844,696.00MARSH & 3.875% 03/24 571748BF8 3.8750 3/15/2024 105.5552 575,000.00 578,874.55 578,484.06 606,942.46MARSH & 4.375% 03/29 571748BG6 4.3750 3/15/2029 110.9031 200,000.00 200,335.05 200,316.85 221,806.16MERCK & CO 2.9% 03/24 58933YAU9 2.9000 3/7/2024 103.0910 500,000.00 498,590.00 498,704.73 515,455.00MERCK & CO 3.4% 03/29 58933YAX3 3.4000 3/7/2029 106.4540 400,000.00 397,752.00 397,843.81 425,816.00METLIFE INC 4.368% 09/23 59156RBB3 4.3680 9/15/2023 107.9210 450,000.00 466,285.50 462,900.35 485,644.50
Page 3 of 10
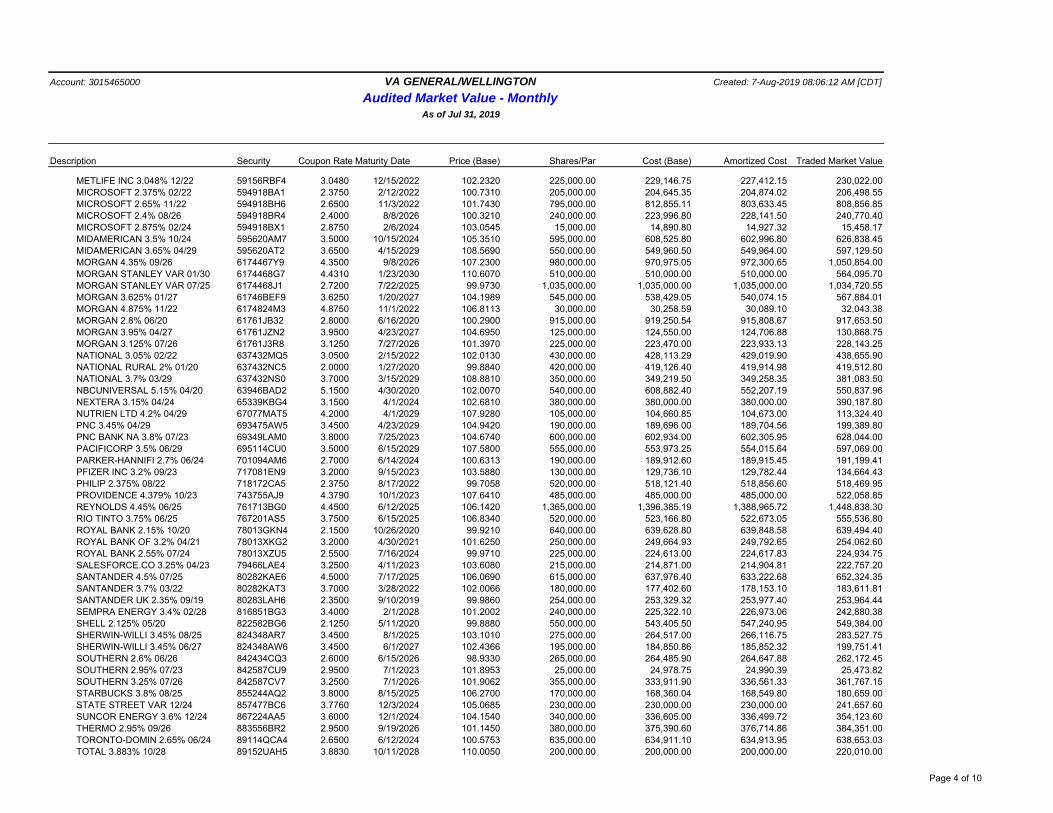
Account: 3015465000 VA GENERAL/WELLINGTON Created: 7-Aug-2019 08:06:12 AM [CDT]
Audited Market Value - MonthlyAs of Jul 31, 2019
Description Security Coupon Rate Maturity Date Price (Base) Shares/Par Cost (Base) Amortized Cost Traded Market Value
METLIFE INC 3.048% 12/22 59156RBF4 3.0480 12/15/2022 102.2320 225,000.00 229,146.75 227,412.15 230,022.00MICROSOFT 2.375% 02/22 594918BA1 2.3750 2/12/2022 100.7310 205,000.00 204,645.35 204,874.02 206,498.55MICROSOFT 2.65% 11/22 594918BH6 2.6500 11/3/2022 101.7430 795,000.00 812,855.11 803,633.45 808,856.85MICROSOFT 2.4% 08/26 594918BR4 2.4000 8/8/2026 100.3210 240,000.00 223,996.80 228,141.50 240,770.40MICROSOFT 2.875% 02/24 594918BX1 2.8750 2/6/2024 103.0545 15,000.00 14,890.80 14,927.32 15,458.17MIDAMERICAN 3.5% 10/24 595620AM7 3.5000 10/15/2024 105.3510 595,000.00 608,525.80 602,996.80 626,838.45MIDAMERICAN 3.65% 04/29 595620AT2 3.6500 4/15/2029 108.5690 550,000.00 549,960.50 549,964.00 597,129.50MORGAN 4.35% 09/26 6174467Y9 4.3500 9/8/2026 107.2300 980,000.00 970,975.05 972,300.65 1,050,854.00MORGAN STANLEY VAR 01/30 6174468G7 4.4310 1/23/2030 110.6070 510,000.00 510,000.00 510,000.00 564,095.70MORGAN STANLEY VAR 07/25 6174468J1 2.7200 7/22/2025 99.9730 1,035,000.00 1,035,000.00 1,035,000.00 1,034,720.55MORGAN 3.625% 01/27 61746BEF9 3.6250 1/20/2027 104.1989 545,000.00 538,429.05 540,074.15 567,884.01MORGAN 4.875% 11/22 6174824M3 4.8750 11/1/2022 106.8113 30,000.00 30,258.59 30,089.10 32,043.38MORGAN 2.8% 06/20 61761JB32 2.8000 6/16/2020 100.2900 915,000.00 919,250.54 915,808.67 917,653.50MORGAN 3.95% 04/27 61761JZN2 3.9500 4/23/2027 104.6950 125,000.00 124,550.00 124,706.88 130,868.75MORGAN 3.125% 07/26 61761J3R8 3.1250 7/27/2026 101.3970 225,000.00 223,470.00 223,933.13 228,143.25NATIONAL 3.05% 02/22 637432MQ5 3.0500 2/15/2022 102.0130 430,000.00 428,113.29 429,019.90 438,655.90NATIONAL RURAL 2% 01/20 637432NC5 2.0000 1/27/2020 99.8840 420,000.00 419,126.40 419,914.98 419,512.80NATIONAL 3.7% 03/29 637432NS0 3.7000 3/15/2029 108.8810 350,000.00 349,219.50 349,258.35 381,083.50NBCUNIVERSAL 5.15% 04/20 63946BAD2 5.1500 4/30/2020 102.0070 540,000.00 608,882.40 552,207.19 550,837.96NEXTERA 3.15% 04/24 65339KBG4 3.1500 4/1/2024 102.6810 380,000.00 380,000.00 380,000.00 390,187.80NUTRIEN LTD 4.2% 04/29 67077MAT5 4.2000 4/1/2029 107.9280 105,000.00 104,660.85 104,673.00 113,324.40PNC 3.45% 04/29 693475AW5 3.4500 4/23/2029 104.9420 190,000.00 189,696.00 189,704.56 199,389.80PNC BANK NA 3.8% 07/23 69349LAM0 3.8000 7/25/2023 104.6740 600,000.00 602,934.00 602,305.95 628,044.00PACIFICORP 3.5% 06/29 695114CU0 3.5000 6/15/2029 107.5800 555,000.00 553,973.25 554,015.64 597,069.00PARKER-HANNIFI 2.7% 06/24 701094AM6 2.7000 6/14/2024 100.6313 190,000.00 189,912.60 189,915.45 191,199.41PFIZER INC 3.2% 09/23 717081EN9 3.2000 9/15/2023 103.5880 130,000.00 129,736.10 129,782.44 134,664.43PHILIP 2.375% 08/22 718172CA5 2.3750 8/17/2022 99.7058 520,000.00 518,121.40 518,856.60 518,469.95PROVIDENCE 4.379% 10/23 743755AJ9 4.3790 10/1/2023 107.6410 485,000.00 485,000.00 485,000.00 522,058.85REYNOLDS 4.45% 06/25 761713BG0 4.4500 6/12/2025 106.1420 1,365,000.00 1,396,385.19 1,388,965.72 1,448,838.30RIO TINTO 3.75% 06/25 767201AS5 3.7500 6/15/2025 106.8340 520,000.00 523,166.80 522,673.05 555,536.80ROYAL BANK 2.15% 10/20 78013GKN4 2.1500 10/26/2020 99.9210 640,000.00 639,628.80 639,848.58 639,494.40ROYAL BANK OF 3.2% 04/21 78013XKG2 3.2000 4/30/2021 101.6250 250,000.00 249,664.93 249,792.65 254,062.60ROYAL BANK 2.55% 07/24 78013XZU5 2.5500 7/16/2024 99.9710 225,000.00 224,613.00 224,617.83 224,934.75SALESFORCE.CO 3.25% 04/23 79466LAE4 3.2500 4/11/2023 103.6080 215,000.00 214,871.00 214,904.81 222,757.20SANTANDER 4.5% 07/25 80282KAE6 4.5000 7/17/2025 106.0690 615,000.00 637,976.40 633,222.68 652,324.35SANTANDER 3.7% 03/22 80282KAT3 3.7000 3/28/2022 102.0066 180,000.00 177,402.60 178,153.10 183,611.81SANTANDER UK 2.35% 09/19 80283LAH6 2.3500 9/10/2019 99.9860 254,000.00 253,329.32 253,977.40 253,964.44SEMPRA ENERGY 3.4% 02/28 816851BG3 3.4000 2/1/2028 101.2002 240,000.00 225,322.10 226,973.06 242,880.38SHELL 2.125% 05/20 822582BG6 2.1250 5/11/2020 99.8880 550,000.00 543,405.50 547,240.95 549,384.00SHERWIN-WILLI 3.45% 08/25 824348AR7 3.4500 8/1/2025 103.1010 275,000.00 264,517.00 266,116.75 283,527.75SHERWIN-WILLI 3.45% 06/27 824348AW6 3.4500 6/1/2027 102.4366 195,000.00 184,850.86 185,852.32 199,751.41SOUTHERN 2.6% 06/26 842434CQ3 2.6000 6/15/2026 98.9330 265,000.00 264,485.90 264,647.88 262,172.45SOUTHERN 2.95% 07/23 842587CU9 2.9500 7/1/2023 101.8953 25,000.00 24,978.75 24,990.39 25,473.82SOUTHERN 3.25% 07/26 842587CV7 3.2500 7/1/2026 101.9062 355,000.00 333,911.90 336,561.33 361,767.15STARBUCKS 3.8% 08/25 855244AQ2 3.8000 8/15/2025 106.2700 170,000.00 168,360.04 168,549.80 180,659.00STATE STREET VAR 12/24 857477BC6 3.7760 12/3/2024 105.0685 230,000.00 230,000.00 230,000.00 241,657.60SUNCOR ENERGY 3.6% 12/24 867224AA5 3.6000 12/1/2024 104.1540 340,000.00 336,605.00 336,499.72 354,123.60THERMO 2.95% 09/26 883556BR2 2.9500 9/19/2026 101.1450 380,000.00 375,390.60 376,714.86 384,351.00TORONTO-DOMIN 2.65% 06/24 89114QCA4 2.6500 6/12/2024 100.5753 635,000.00 634,911.10 634,913.95 638,653.03TOTAL 3.883% 10/28 89152UAH5 3.8830 10/11/2028 110.0050 200,000.00 200,000.00 200,000.00 220,010.00
Page 4 of 10

Account: 3015465000 VA GENERAL/WELLINGTON Created: 7-Aug-2019 08:06:12 AM [CDT]
Audited Market Value - MonthlyAs of Jul 31, 2019
Description Security Coupon Rate Maturity Date Price (Base) Shares/Par Cost (Base) Amortized Cost Traded Market Value
TOTAL CAPITAL 3.7% 01/24 89153VAG4 3.7000 1/15/2024 105.7490 785,000.00 786,922.10 787,435.50 830,129.65TRANSCANADA 4.25% 05/28 89352HAW9 4.2500 5/15/2028 108.0840 950,000.00 955,447.75 955,102.72 1,026,798.00UNION 3.75% 07/25 907818ES3 3.7500 7/15/2025 106.2559 465,000.00 465,373.33 465,315.42 494,090.03UNION 3.15% 03/24 907818FA1 3.1500 3/1/2024 102.9520 455,000.00 454,617.80 454,653.71 468,431.60US BANCORP 3.375% 02/24 91159HHV5 3.3750 2/5/2024 104.2560 950,000.00 949,743.50 949,769.40 990,432.00UNITED 3.65% 08/23 913017DB2 3.6500 8/16/2023 104.7520 445,000.00 444,959.95 444,967.14 466,146.40UNITEDHEALTH 2.3% 12/19 91324PCG5 2.3000 12/15/2019 99.9699 770,000.00 787,710.00 771,357.96 769,768.38UNITEDHEALTH 2.875% 12/21 91324PCH3 2.8750 12/15/2021 101.2801 525,000.00 524,433.00 524,806.54 531,720.26UNITEDHEALTH 3.7% 12/25 91324PDN9 3.7000 12/15/2025 106.4431 170,000.00 169,658.30 169,688.33 180,953.34UNITEDHEALTH 2.375% 08/24 91324PDR0 2.3750 8/15/2024 99.9740 330,000.00 329,917.50 329,917.86 329,914.20UNITEDHEALTH 2.875% 08/29 91324PDS8 2.8750 8/15/2029 100.2910 105,000.00 104,971.65 104,971.74 105,305.55VALERO ENERGY 3.4% 09/26 91913YAU4 3.4000 9/15/2026 102.3050 80,000.00 78,847.29 79,127.75 81,844.00VALERO ENERGY 4% 04/29 91913YAW0 4.0000 4/1/2029 104.3150 235,000.00 233,197.55 233,262.72 245,140.25VERIZON 4.125% 03/27 92343VDY7 4.1250 3/16/2027 108.6940 255,000.00 261,974.25 260,818.48 277,169.70VERIZON 3.875% 02/29 92343VES9 3.8750 2/8/2029 107.7000 700,000.00 746,914.00 746,619.20 753,900.00VIRGINIA 2.75% 03/23 927804FN9 2.7500 3/15/2023 101.2960 790,000.00 789,794.60 789,808.31 800,238.40VISA INC 2.8% 12/22 92826CAC6 2.8000 12/14/2022 101.8830 45,000.00 44,937.45 44,969.23 45,847.35VISA INC 3.15% 12/25 92826CAD4 3.1500 12/14/2025 104.3570 230,000.00 229,747.00 229,818.76 240,021.10VODAFONE 3.75% 01/24 92857WBH2 3.7500 1/16/2024 104.1090 220,000.00 218,173.69 218,523.15 229,039.80VODAFONE 4.125% 05/25 92857WBJ8 4.1250 5/30/2025 106.2500 115,000.00 115,093.15 115,086.31 122,187.50WALMART INC 3.4% 06/23 931142EK5 3.4000 6/26/2023 104.5450 680,000.00 682,275.44 681,783.17 710,906.00WALMART INC 3.05% 07/26 931142EM1 3.0500 7/8/2026 104.3978 1,135,000.00 1,133,501.80 1,133,562.79 1,184,914.69WASTE 2.95% 06/24 94106LBF5 2.9500 6/15/2024 102.3770 510,000.00 509,969.40 509,970.98 522,122.70ANTHEM INC 3.5% 08/24 94973VBJ5 3.5000 8/15/2024 103.4910 250,000.00 257,862.50 254,242.30 258,727.50WELLS FARGO & 4.3% 07/27 94974BGL8 4.3000 7/22/2027 107.8740 515,000.00 527,590.12 523,553.82 555,551.10WELLS FARGO & 2.5% 03/21 949746RS2 2.5000 3/4/2021 100.3420 610,000.00 612,529.79 610,816.30 612,086.20WELLS FARGO & 3% 04/26 949746RW3 3.0000 4/22/2026 101.1990 815,000.00 775,012.13 780,779.31 824,771.85WELLS FARGO 2.6% 01/21 94988J5N3 2.6000 1/15/2021 100.4899 275,000.00 274,851.50 274,928.05 276,347.20WELLS FARGO 3.625% 10/21 94988J5T0 3.6250 10/22/2021 102.6248 725,000.00 724,920.25 724,940.48 744,029.51WELLS FARGO & VAR 05/28 95000U2A0 3.5840 5/22/2028 104.1619 725,000.00 725,000.00 725,000.00 755,173.99WELLS FARGO 2.625% 07/22 95000U2B8 2.6250 7/22/2022 100.5104 630,000.00 630,623.20 630,383.51 633,215.21WELLS FARGO 3.75% 01/24 95000U2C6 3.7500 1/24/2024 104.7780 575,000.00 575,250.35 575,225.22 602,473.50WELLS FARGO & VAR 06/27 95000U2F9 3.1960 6/17/2027 101.9960 330,000.00 330,000.00 330,000.00 336,586.80WILLIS NORTH 3.6% 05/24 970648AF8 3.6000 5/15/2024 103.3315 175,000.00 175,256.70 175,175.50 180,830.13
116,832,000.00 116,688,411.97 116,542,764.73 120,855,697.30 FHLMC
FHLMCGLD 5% 01/36 3128K86S0 5.0000 1/1/2036 109.7800 154,986.42 149,210.78 151,762.34 170,144.09FHLMCGLD 5.5% 12/37 3128LCJD9 5.5000 12/1/2037 111.8670 137,367.08 148,714.97 148,103.20 153,668.43FHLMCGLD 3.5% 06/46 3128MJYH7 3.5000 6/1/2046 100.0000 0.01 0.01 0.01 0.01FHLMCGLD 3% 12/47 3128MJ2Z2 3.0000 12/1/2047 101.2974 169,517.02 162,656.88 162,919.23 171,716.40FHLMCGLD 3% 02/48 3128MJ3H1 3.0000 2/1/2048 101.3930 537,034.26 515,301.16 516,129.92 544,515.15FHLMCGLD 3.5% 03/48 3128MJ3N8 3.5000 3/1/2048 102.9859 342,768.02 339,434.08 339,560.82 353,002.80FHLMCGLD 3.5% 06/48 3128MJ4A5 3.5000 6/1/2048 102.7810 3,112,151.52 3,076,831.30 3,077,879.58 3,198,700.45FHLMCGLD 3% 07/48 3128MJ4G2 3.0000 7/1/2048 101.2740 1,549,809.02 1,487,090.18 1,489,448.57 1,569,553.59FHLMCGLD 3.5% 07/48 3128MJ4H0 3.5000 7/1/2048 102.5140 271,823.55 269,179.65 269,278.76 278,657.19FHLMCGLD 5.5% 09/19 3128MMAL7 5.5000 9/1/2019 99.9488 78.12 80.88 78.26 78.08FHLMCGLD 5% 01/21 3128MMC92 5.0000 1/1/2021 102.9020 6,318.84 6,233.92 6,310.12 6,502.21FHLMCGLD 5% 05/21 3128M1PU7 5.0000 5/1/2021 103.0480 19,324.72 19,039.38 19,287.81 19,913.74FHLMCGLD 5.5% 07/38 3128M6F29 5.5000 7/1/2038 110.7400 35,634.96 35,879.96 35,793.25 39,462.15FHLMCGLD 7% 02/39 3128M9U67 7.0000 2/1/2039 118.2770 61,952.11 69,657.10 69,265.62 73,275.10
Page 5 of 10

Account: 3015465000 VA GENERAL/WELLINGTON Created: 7-Aug-2019 08:06:12 AM [CDT]
Audited Market Value - MonthlyAs of Jul 31, 2019
Description Security Coupon Rate Maturity Date Price (Base) Shares/Par Cost (Base) Amortized Cost Traded Market Value
FHLMCGLD 5% 01/21 3128PCCE0 5.0000 1/1/2021 102.7191 6,444.51 6,357.91 6,435.67 6,619.74FHLMC MORTPASS 7.5% 11/19 31290KPL7 7.5000 11/1/2019 100.0000 0.81 0.81 0.81 0.81FHLMCGLD 5.5% 04/34 31292JAM2 5.5000 4/1/2034 111.9880 259,316.40 281,241.61 279,783.70 290,403.25FHLMCGLD 5% 08/38 312927CU8 5.0000 8/1/2038 108.9140 59,964.21 59,214.66 59,480.42 65,309.42FHLMCGLD 5.5% 08/19 312968WR7 5.5000 8/1/2019 99.8043 76.65 79.36 76.65 76.50FHLMCGLD 5% 01/20 312971UA0 5.0000 1/1/2020 102.7197 578.37 570.60 577.61 594.10FHLMCGLD 3% 01/48 3132L9J48 3.0000 1/1/2048 101.3310 376,785.42 361,537.39 362,120.78 381,800.43FHLMCGLD 3.5% 01/48 3132XWCU3 3.5000 1/1/2048 103.0590 286,834.27 283,528.94 283,626.13 295,608.53
7,388,766.29 7,271,841.53 7,277,919.26 7,619,602.17 FNMA
FNMA MORTPASS 8% 07/20 31365PQX9 8.0000 7/1/2020 100.0000 0.04 0.04 0.04 0.04UMBS MORTPASS 7% 08/19 31374TW88 7.0000 8/1/2019 100.0000 0.03 0.03 0.03 0.03UMBS MORTPASS 4.5% 04/26 3138AFAG5 4.5000 4/1/2026 104.8400 152,002.23 157,109.51 156,418.12 159,359.14UMBS MORTPASS 4.5% 03/41 3138A87K6 4.5000 3/1/2041 107.9310 1,346,534.16 1,456,360.77 1,436,041.24 1,453,327.78UMBS MORTPASS 7% 03/39 3138ELYN7 7.0000 3/1/2039 117.4630 35,746.85 39,671.51 39,472.38 41,989.32FNMA MORTPASS 2.88% 11/27 3138LLFS9 2.8800 11/1/2027 103.5330 940,111.00 943,930.20 943,260.63 973,325.12FNMA MORTPASS 3.75% 06/30 3138LNPR6 3.7500 6/1/2030 109.4890 100,000.00 101,292.97 101,181.07 109,489.00FNMA MORTPASS 2.78% 03/27 3138L9BK7 2.7800 3/1/2027 102.5690 273,579.98 279,137.07 277,110.24 280,608.25UMBS MORTPASS 3% 04/43 3138MKQH2 3.0000 4/1/2043 101.9000 18,658.58 18,268.08 18,284.57 19,013.09UMBS MORTPASS 3% 01/43 3138MN5G1 3.0000 1/1/2043 101.9000 16,889.85 16,512.21 16,528.29 17,210.76UMBS MORTPASS 3% 12/42 3138MQTN3 3.0000 12/1/2042 101.9000 13,393.24 13,089.61 13,102.99 13,647.71UMBS MORTPASS 2.5% 01/43 3138MRK67 2.5000 1/1/2043 99.1990 521,250.22 485,251.38 492,414.06 517,075.01UMBS MORTPASS 3% 01/43 3138MRK75 3.0000 1/1/2043 101.9000 34,783.33 33,996.18 34,030.06 35,444.21UMBS MORTPASS 4% 03/44 3138WBG58 4.0000 3/1/2044 105.5170 1,521,525.57 1,600,611.63 1,587,142.40 1,605,468.14UMBS MORTPASS 2.5% 10/31 3138WJD88 2.5000 10/1/2031 100.6740 143,923.40 145,767.44 145,445.84 144,893.44UMBS MORTPASS 3% 04/43 3138WMWQ0 3.0000 4/1/2043 101.9010 38,017.13 37,168.97 37,205.08 38,739.84UMBS MORTPASS 3% 04/43 3138WN5M7 3.0000 4/1/2043 101.9010 33,670.21 32,904.21 32,936.60 34,310.28UMBS MORTPASS 2.5% 01/31 3140EVGE1 2.5000 1/1/2031 100.6710 43,854.93 44,416.82 44,313.98 44,149.20UMBS MORTPASS 2.5% 12/31 3140FDGH3 2.5000 12/1/2031 100.5730 344,243.57 348,654.20 347,893.82 346,216.09UMBS MORTPASS 3.5% 12/46 3140FLNT1 3.5000 12/1/2046 103.4740 126,328.72 125,257.89 125,299.76 130,717.38UMBS MORTPASS 4.5% 07/47 3140FPFS3 4.5000 7/1/2047 105.5949 833,092.82 868,694.54 867,409.50 879,703.45UMBS MORTPASS 3.5% 01/47 3140FQJ65 3.5000 1/1/2047 103.4870 659,342.54 653,753.57 653,975.07 682,333.81UMBS MORTPASS 3.5% 03/48 3140HAP95 3.5000 3/1/2048 103.0580 189,556.96 187,950.18 188,011.33 195,353.61UMBS MORTPASS 3.5% 05/48 3140HAS27 3.5000 5/1/2048 102.7910 567,139.25 562,331.86 562,513.11 582,968.11UMBS MORTPASS 3.5% 05/48 3140HJQC8 3.5000 5/1/2048 102.8240 156,136.79 154,813.28 154,863.80 160,546.09UMBS MORTPASS 3.5% 01/48 3140H1FV7 3.5000 1/1/2048 103.0740 146,777.22 145,533.05 145,581.29 151,289.15UMBS MORTPASS 3.5% 12/47 3140H5LJ8 3.5000 12/1/2047 102.9960 131,793.39 130,676.24 130,719.31 135,741.92UMBS MORTPASS 3.5% 04/48 3140H8QX6 3.5000 4/1/2048 102.8760 598,715.43 593,640.37 593,832.73 615,934.49UMBS MORTPASS 3.5% 11/47 3140Q8KD6 3.5000 11/1/2047 103.0960 547,379.74 542,761.22 542,938.99 564,326.62UMBS MORTPASS 5% 02/36 31403C6L0 5.0000 2/1/2036 109.7990 197,124.02 190,193.86 192,988.79 216,440.20UMBS MORTPASS 6% 02/21 31406JS95 6.0000 2/1/2021 100.3560 4,722.22 4,781.25 4,729.12 4,739.03UMBS MORTPASS 6% 03/21 31409AYA1 6.0000 3/1/2021 101.1660 7,246.87 7,337.46 7,257.67 7,331.37UMBS MORTPASS 6% 05/21 31409HC28 6.0000 5/1/2021 100.2701 3,221.31 3,261.58 3,227.04 3,230.01UMBS MORTPASS 6% 01/38 31410GWV1 6.0000 1/1/2038 113.8310 154,630.90 170,209.96 169,373.36 176,017.90UMBS MORTPASS 6% 01/38 31410GWW9 6.0000 1/1/2038 115.2880 93,416.95 104,655.02 104,051.58 107,698.53UMBS MORTPASS 6% 03/38 31410G4C4 6.0000 3/1/2038 115.2730 182,131.05 204,573.24 203,378.17 209,947.93UMBS MORTPASS 6% 10/36 31410QCW9 6.0000 10/1/2036 110.6840 51,958.45 52,250.72 52,129.94 57,509.69UMBS MORTPASS 6% 09/36 31410RVR7 6.0000 9/1/2036 109.9660 17,399.96 17,427.17 17,417.59 19,134.04UMBS MORTPASS 5.5% 05/37 31410WKW7 5.5000 5/1/2037 111.5609 5,234.27 5,014.27 5,100.15 5,839.40UMBS MORTPASS 6% 09/36 31410XBB1 6.0000 9/1/2036 109.9260 9,918.42 9,933.91 9,930.12 10,902.92
Page 6 of 10

Account: 3015465000 VA GENERAL/WELLINGTON Created: 7-Aug-2019 08:06:12 AM [CDT]
Audited Market Value - MonthlyAs of Jul 31, 2019
Description Security Coupon Rate Maturity Date Price (Base) Shares/Par Cost (Base) Amortized Cost Traded Market Value
UMBS MORTPASS 5.5% 04/37 31411RMG0 5.5000 4/1/2037 107.0880 29,915.01 28,657.69 29,153.36 32,035.39UMBS MORTPASS 5.5% 07/37 31412LQV5 5.5000 7/1/2037 107.7750 28,879.37 27,665.55 28,139.10 31,124.74UMBS MORTPASS 5.5% 05/37 31412YEC2 5.5000 5/1/2037 111.6930 16,086.82 15,410.68 15,675.96 17,967.85UMBS MORTPASS 6% 04/33 31415P4K1 6.0000 4/1/2033 113.7060 6,130.87 6,755.34 6,710.75 6,971.17UMBS MORTPASS 5.5% 09/39 31417MT45 5.5000 9/1/2039 113.3890 995,094.51 1,102,694.09 1,097,372.18 1,128,327.71UMBS MORTPASS 4% 03/46 31418BZY5 4.0000 3/1/2046 105.1560 286,650.96 306,850.90 304,678.81 301,430.68UMBS MORTPASS 4% 04/46 31418B3D6 4.0000 4/1/2046 105.1670 624,463.23 668,761.10 664,011.71 656,729.25UMBS MORTPASS 2.5% 11/31 31418CDH4 2.5000 11/1/2031 100.0000 0.01 0.01 0.01 0.01UMBS MORTPASS 3.5% 07/47 31418CMF8 3.5000 7/1/2047 103.1040 136,805.21 135,645.57 135,690.84 141,051.64UMBS MORTPASS 5% 07/40 31418U4R2 5.0000 7/1/2040 111.3280 253,946.58 274,567.05 273,586.12 282,713.65
12,639,424.17 13,056,201.45 13,012,528.70 13,350,324.19 Government Bond
EQUINOR ASA 2.65% 01/24 85771PAK8 2.6500 1/15/2024 101.7580 880,000.00 841,731.30 855,320.78 895,470.40EQUINOR ASA 2.25% 11/19 85771PAW2 2.2500 11/8/2019 99.8910 225,000.00 224,905.50 224,994.56 224,754.75
1,105,000.00 1,066,636.80 1,080,315.34 1,120,225.15 GNMA1 (15 Day Lag)
GNMA I MORTPASS 3% 12/42 36178DRS2 3.0000 12/15/2042 100.0000 0.01 0.01 0.01 0.01GNMA I MORTPASS 3% 05/43 36178EDL0 3.0000 5/15/2043 117.6471 0.02 0.02 0.02 0.02GNMA I MORTPASS 4% 08/41 3620AY7J9 4.0000 8/15/2041 106.1780 910,678.49 983,497.19 965,750.25 966,940.21GNMA I MORTPASS 6% 08/34 36241KBZ0 6.0000 8/15/2034 114.3440 115,437.91 119,433.13 117,511.32 131,996.32GNMA I MORTPASS 7% 11/32 36241KJL3 7.0000 11/15/2032 117.7400 53,343.79 55,658.84 54,524.69 62,806.98GNMA I MORTPASS 7% 06/32 36241KJP4 7.0000 6/15/2032 111.0651 5,300.47 5,530.31 5,415.86 5,886.97GNMA I MORTPASS 7% 05/33 36241KJQ2 7.0000 5/15/2033 114.7340 4,405.32 4,596.69 4,505.21 5,054.40GNMA I MORTPASS 7% 01/33 36241KJT6 7.0000 1/15/2033 115.2790 10,854.70 11,329.18 11,107.78 12,513.19GNMA I MORTPASS 7% 11/33 36241KJ66 7.0000 11/15/2033 114.8450 15,159.25 15,693.94 15,442.66 17,409.64
1,115,179.96 1,195,739.31 1,174,257.80 1,202,607.74 GNMA1 (20 Day Lag)
TBA GNMA2 SINGLE 3.5% 21H032688 3.5000 8/15/2049 103.4020 2,500,000.00 2,576,234.38 2,576,234.38 2,585,050.00TBA GNMA2 SINGLE 4% 21H040681 4.0000 8/15/2049 103.8630 400,000.00 414,762.50 414,762.50 415,452.00TBA GNMA2 SINGLE 4% 21H040699 4.0000 9/15/2049 103.8320 400,000.00 415,218.76 415,218.76 415,328.00TBA GNMA2 SINGLE 4.5% 21H042687 4.5000 8/15/2049 104.1410 2,400,000.00 2,500,471.10 2,500,471.10 2,499,384.00GNMA II MORTPASS 4% 07/45 36179RJF7 4.0000 7/20/2045 105.3520 531,909.82 549,361.77 548,685.93 560,377.63GNMA II MORTPASS 4% 10/45 36179RQ36 4.0000 10/20/2045 105.2130 720,010.76 743,641.52 742,736.13 757,544.92GNMA II 3.5% 04/46 36179R7J2 3.5000 4/20/2046 100.0000 0.01 0.01 0.01 0.01GNMA II MORTPASS 3% 06/46 36179SEG8 3.0000 6/20/2046 100.0000 0.01 0.01 0.01 0.01GNMA II MORTPASS 4% 07/47 36179TCY9 4.0000 7/20/2047 104.3540 769,769.85 792,439.57 791,622.90 803,285.63GNMA II MORTPASS 3% 01/48 36179TQN8 3.0000 1/20/2048 102.2860 89,999.75 86,909.52 87,027.78 92,057.14GNMA II MORTPASS 3% 02/48 36179TSF3 3.0000 2/20/2048 102.2860 2,717,133.18 2,623,837.87 2,627,389.27 2,779,246.84
10,528,823.38 10,702,877.01 10,704,148.77 10,907,726.18 Municipal Bond
CHICAGO ILL 4.864% 12/22 167486RW1 4.8640 12/1/2022 105.6280 210,000.00 219,901.50 216,023.01 221,818.80210,000.00 219,901.50 216,023.01 221,818.80
Money MarketINVESCO VAR 12/99 00499KPA5 2.1572 12/31/2099 100.0000 18,848,186.51 18,848,186.51 18,848,186.51 18,848,186.51
18,848,186.51 18,848,186.51 18,848,186.51 18,848,186.51 Mortgage Related
TBA UMBS SINGLE 2.5% 01F022485 2.5000 8/25/2034 100.5710 6,200,000.00 6,238,750.00 6,238,750.00 6,235,402.00TBA UMBS SINGLE FAMILY 3% 01F030488 3.0000 8/25/2034 101.9740 4,300,000.00 4,384,992.19 4,384,992.19 4,384,882.00TBA UMBS SINGLE FAMILY 3% 01F030686 3.0000 8/25/2049 100.8540 16,600,000.00 16,714,762.06 16,714,762.06 16,741,764.00TBA UMBS SINGLE FAMILY 4% 01F040685 4.0000 8/25/2049 103.5130 6,100,000.00 6,308,398.44 6,308,398.44 6,314,293.00
Page 7 of 10
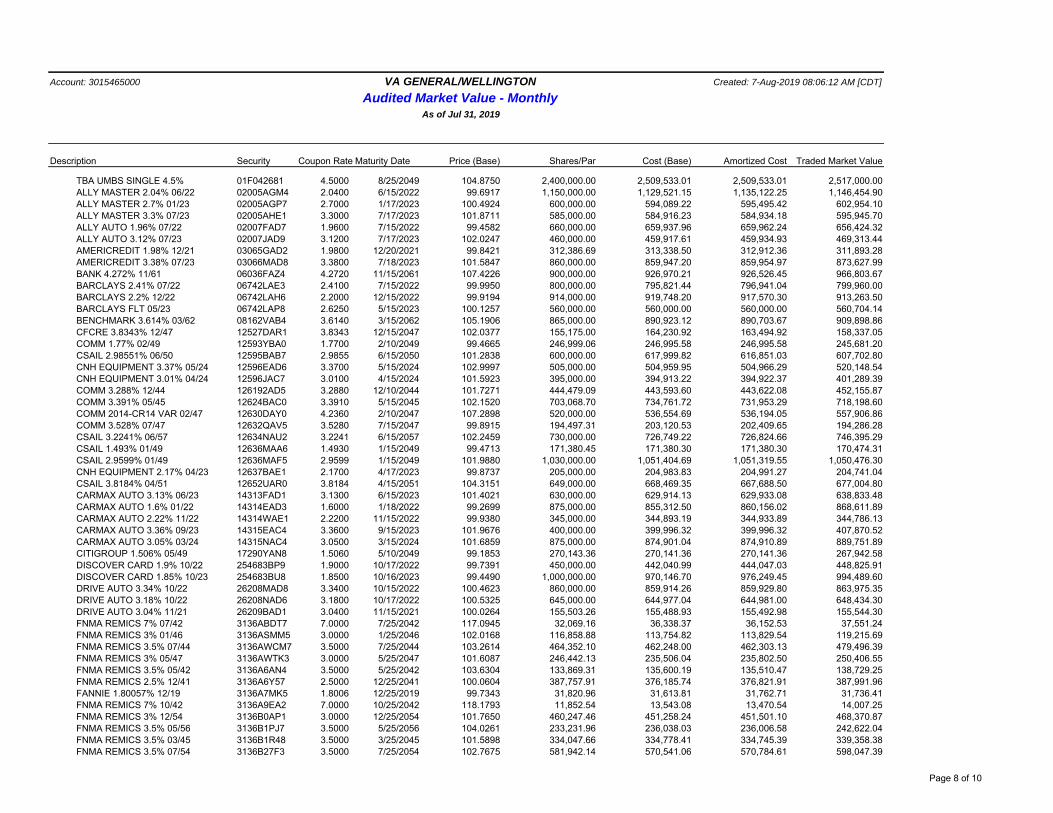
Account: 3015465000 VA GENERAL/WELLINGTON Created: 7-Aug-2019 08:06:12 AM [CDT]
Audited Market Value - MonthlyAs of Jul 31, 2019
Description Security Coupon Rate Maturity Date Price (Base) Shares/Par Cost (Base) Amortized Cost Traded Market Value
TBA UMBS SINGLE 4.5% 01F042681 4.5000 8/25/2049 104.8750 2,400,000.00 2,509,533.01 2,509,533.01 2,517,000.00ALLY MASTER 2.04% 06/22 02005AGM4 2.0400 6/15/2022 99.6917 1,150,000.00 1,129,521.15 1,135,122.25 1,146,454.90ALLY MASTER 2.7% 01/23 02005AGP7 2.7000 1/17/2023 100.4924 600,000.00 594,089.22 595,495.42 602,954.10ALLY MASTER 3.3% 07/23 02005AHE1 3.3000 7/17/2023 101.8711 585,000.00 584,916.23 584,934.18 595,945.70ALLY AUTO 1.96% 07/22 02007FAD7 1.9600 7/15/2022 99.4582 660,000.00 659,937.96 659,962.24 656,424.32ALLY AUTO 3.12% 07/23 02007JAD9 3.1200 7/17/2023 102.0247 460,000.00 459,917.61 459,934.93 469,313.44AMERICREDIT 1.98% 12/21 03065GAD2 1.9800 12/20/2021 99.8421 312,386.69 313,338.50 312,912.36 311,893.28AMERICREDIT 3.38% 07/23 03066MAD8 3.3800 7/18/2023 101.5847 860,000.00 859,947.20 859,954.97 873,627.99BANK 4.272% 11/61 06036FAZ4 4.2720 11/15/2061 107.4226 900,000.00 926,970.21 926,526.45 966,803.67BARCLAYS 2.41% 07/22 06742LAE3 2.4100 7/15/2022 99.9950 800,000.00 795,821.44 796,941.04 799,960.00BARCLAYS 2.2% 12/22 06742LAH6 2.2000 12/15/2022 99.9194 914,000.00 919,748.20 917,570.30 913,263.50BARCLAYS FLT 05/23 06742LAP8 2.6250 5/15/2023 100.1257 560,000.00 560,000.00 560,000.00 560,704.14BENCHMARK 3.614% 03/62 08162VAB4 3.6140 3/15/2062 105.1906 865,000.00 890,923.12 890,703.67 909,898.86CFCRE 3.8343% 12/47 12527DAR1 3.8343 12/15/2047 102.0377 155,175.00 164,230.92 163,494.92 158,337.05COMM 1.77% 02/49 12593YBA0 1.7700 2/10/2049 99.4665 246,999.06 246,995.58 246,995.58 245,681.20CSAIL 2.98551% 06/50 12595BAB7 2.9855 6/15/2050 101.2838 600,000.00 617,999.82 616,851.03 607,702.80CNH EQUIPMENT 3.37% 05/24 12596EAD6 3.3700 5/15/2024 102.9997 505,000.00 504,959.95 504,966.29 520,148.54CNH EQUIPMENT 3.01% 04/24 12596JAC7 3.0100 4/15/2024 101.5923 395,000.00 394,913.22 394,922.37 401,289.39COMM 3.288% 12/44 126192AD5 3.2880 12/10/2044 101.7271 444,479.09 443,593.60 443,622.08 452,155.87COMM 3.391% 05/45 12624BAC0 3.3910 5/15/2045 102.1520 703,068.70 734,761.72 731,953.29 718,198.60COMM 2014-CR14 VAR 02/47 12630DAY0 4.2360 2/10/2047 107.2898 520,000.00 536,554.69 536,194.05 557,906.86COMM 3.528% 07/47 12632QAV5 3.5280 7/15/2047 99.8915 194,497.31 203,120.53 202,409.65 194,286.28CSAIL 3.2241% 06/57 12634NAU2 3.2241 6/15/2057 102.2459 730,000.00 726,749.22 726,824.66 746,395.29CSAIL 1.493% 01/49 12636MAA6 1.4930 1/15/2049 99.4713 171,380.45 171,380.30 171,380.30 170,474.31CSAIL 2.9599% 01/49 12636MAF5 2.9599 1/15/2049 101.9880 1,030,000.00 1,051,404.69 1,051,319.55 1,050,476.30CNH EQUIPMENT 2.17% 04/23 12637BAE1 2.1700 4/17/2023 99.8737 205,000.00 204,983.83 204,991.27 204,741.04CSAIL 3.8184% 04/51 12652UAR0 3.8184 4/15/2051 104.3151 649,000.00 668,469.35 667,688.50 677,004.80CARMAX AUTO 3.13% 06/23 14313FAD1 3.1300 6/15/2023 101.4021 630,000.00 629,914.13 629,933.08 638,833.48CARMAX AUTO 1.6% 01/22 14314EAD3 1.6000 1/18/2022 99.2699 875,000.00 855,312.50 860,156.02 868,611.89CARMAX AUTO 2.22% 11/22 14314WAE1 2.2200 11/15/2022 99.9380 345,000.00 344,893.19 344,933.89 344,786.13CARMAX AUTO 3.36% 09/23 14315EAC4 3.3600 9/15/2023 101.9676 400,000.00 399,996.32 399,996.32 407,870.52CARMAX AUTO 3.05% 03/24 14315NAC4 3.0500 3/15/2024 101.6859 875,000.00 874,901.04 874,910.89 889,751.89CITIGROUP 1.506% 05/49 17290YAN8 1.5060 5/10/2049 99.1853 270,143.36 270,141.36 270,141.36 267,942.58DISCOVER CARD 1.9% 10/22 254683BP9 1.9000 10/17/2022 99.7391 450,000.00 442,040.99 444,047.03 448,825.91DISCOVER CARD 1.85% 10/23 254683BU8 1.8500 10/16/2023 99.4490 1,000,000.00 970,146.70 976,249.45 994,489.60DRIVE AUTO 3.34% 10/22 26208MAD8 3.3400 10/15/2022 100.4623 860,000.00 859,914.26 859,929.80 863,975.35DRIVE AUTO 3.18% 10/22 26208NAD6 3.1800 10/17/2022 100.5325 645,000.00 644,977.04 644,981.00 648,434.30DRIVE AUTO 3.04% 11/21 26209BAD1 3.0400 11/15/2021 100.0264 155,503.26 155,488.93 155,492.98 155,544.30FNMA REMICS 7% 07/42 3136ABDT7 7.0000 7/25/2042 117.0945 32,069.16 36,338.37 36,152.53 37,551.24FNMA REMICS 3% 01/46 3136ASMM5 3.0000 1/25/2046 102.0168 116,858.88 113,754.82 113,829.54 119,215.69FNMA REMICS 3.5% 07/44 3136AWCM7 3.5000 7/25/2044 103.2614 464,352.10 462,248.00 462,303.13 479,496.39FNMA REMICS 3% 05/47 3136AWTK3 3.0000 5/25/2047 101.6087 246,442.13 235,506.04 235,802.50 250,406.55FNMA REMICS 3.5% 05/42 3136A6AN4 3.5000 5/25/2042 103.6304 133,869.31 135,600.19 135,510.47 138,729.25FNMA REMICS 2.5% 12/41 3136A6Y57 2.5000 12/25/2041 100.0604 387,757.91 376,185.74 376,821.91 387,991.96FANNIE 1.80057% 12/19 3136A7MK5 1.8006 12/25/2019 99.7343 31,820.96 31,613.81 31,762.71 31,736.41FNMA REMICS 7% 10/42 3136A9EA2 7.0000 10/25/2042 118.1793 11,852.54 13,543.08 13,470.54 14,007.25FNMA REMICS 3% 12/54 3136B0AP1 3.0000 12/25/2054 101.7650 460,247.46 451,258.24 451,501.10 468,370.87FNMA REMICS 3.5% 05/56 3136B1PJ7 3.5000 5/25/2056 104.0261 233,231.96 236,038.03 236,006.58 242,622.04FNMA REMICS 3.5% 03/45 3136B1R48 3.5000 3/25/2045 101.5898 334,047.66 334,778.41 334,745.39 339,358.38FNMA REMICS 3.5% 07/54 3136B27F3 3.5000 7/25/2054 102.7675 581,942.14 570,541.06 570,784.61 598,047.39
Page 8 of 10
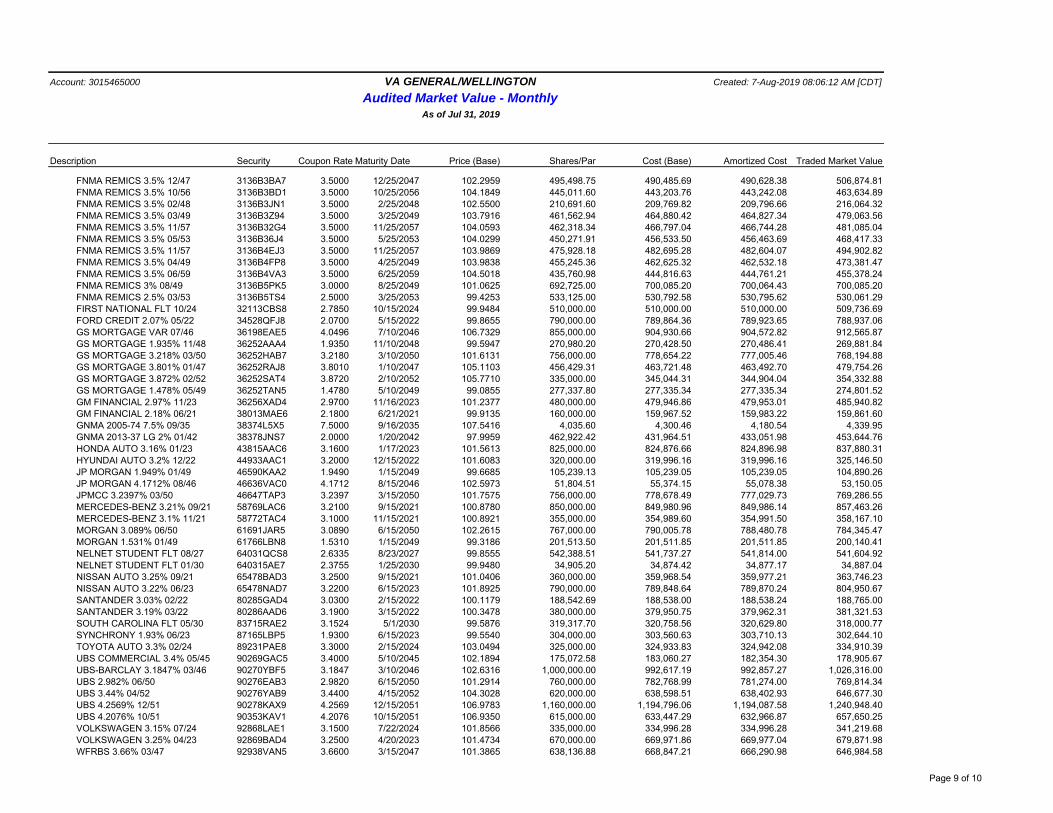
Account: 3015465000 VA GENERAL/WELLINGTON Created: 7-Aug-2019 08:06:12 AM [CDT]
Audited Market Value - MonthlyAs of Jul 31, 2019
Description Security Coupon Rate Maturity Date Price (Base) Shares/Par Cost (Base) Amortized Cost Traded Market Value
FNMA REMICS 3.5% 12/47 3136B3BA7 3.5000 12/25/2047 102.2959 495,498.75 490,485.69 490,628.38 506,874.81FNMA REMICS 3.5% 10/56 3136B3BD1 3.5000 10/25/2056 104.1849 445,011.60 443,203.76 443,242.08 463,634.89FNMA REMICS 3.5% 02/48 3136B3JN1 3.5000 2/25/2048 102.5500 210,691.60 209,769.82 209,796.66 216,064.32FNMA REMICS 3.5% 03/49 3136B3Z94 3.5000 3/25/2049 103.7916 461,562.94 464,880.42 464,827.34 479,063.56FNMA REMICS 3.5% 11/57 3136B32G4 3.5000 11/25/2057 104.0593 462,318.34 466,797.04 466,744.28 481,085.04FNMA REMICS 3.5% 05/53 3136B36J4 3.5000 5/25/2053 104.0299 450,271.91 456,533.50 456,463.69 468,417.33FNMA REMICS 3.5% 11/57 3136B4EJ3 3.5000 11/25/2057 103.9869 475,928.18 482,695.28 482,604.07 494,902.82FNMA REMICS 3.5% 04/49 3136B4FP8 3.5000 4/25/2049 103.9838 455,245.36 462,625.32 462,532.18 473,381.47FNMA REMICS 3.5% 06/59 3136B4VA3 3.5000 6/25/2059 104.5018 435,760.98 444,816.63 444,761.21 455,378.24FNMA REMICS 3% 08/49 3136B5PK5 3.0000 8/25/2049 101.0625 692,725.00 700,085.20 700,064.43 700,085.20FNMA REMICS 2.5% 03/53 3136B5TS4 2.5000 3/25/2053 99.4253 533,125.00 530,792.58 530,795.62 530,061.29FIRST NATIONAL FLT 10/24 32113CBS8 2.7850 10/15/2024 99.9484 510,000.00 510,000.00 510,000.00 509,736.69FORD CREDIT 2.07% 05/22 34528QFJ8 2.0700 5/15/2022 99.8655 790,000.00 789,864.36 789,923.65 788,937.06GS MORTGAGE VAR 07/46 36198EAE5 4.0496 7/10/2046 106.7329 855,000.00 904,930.66 904,572.82 912,565.87GS MORTGAGE 1.935% 11/48 36252AAA4 1.9350 11/10/2048 99.5947 270,980.20 270,428.50 270,486.41 269,881.84GS MORTGAGE 3.218% 03/50 36252HAB7 3.2180 3/10/2050 101.6131 756,000.00 778,654.22 777,005.46 768,194.88GS MORTGAGE 3.801% 01/47 36252RAJ8 3.8010 1/10/2047 105.1103 456,429.31 463,721.48 463,492.70 479,754.26GS MORTGAGE 3.872% 02/52 36252SAT4 3.8720 2/10/2052 105.7710 335,000.00 345,044.31 344,904.04 354,332.88GS MORTGAGE 1.478% 05/49 36252TAN5 1.4780 5/10/2049 99.0855 277,337.80 277,335.34 277,335.34 274,801.52GM FINANCIAL 2.97% 11/23 36256XAD4 2.9700 11/16/2023 101.2377 480,000.00 479,946.86 479,953.01 485,940.82GM FINANCIAL 2.18% 06/21 38013MAE6 2.1800 6/21/2021 99.9135 160,000.00 159,967.52 159,983.22 159,861.60GNMA 2005-74 7.5% 09/35 38374L5X5 7.5000 9/16/2035 107.5416 4,035.60 4,300.46 4,180.54 4,339.95GNMA 2013-37 LG 2% 01/42 38378JNS7 2.0000 1/20/2042 97.9959 462,922.42 431,964.51 433,051.98 453,644.76HONDA AUTO 3.16% 01/23 43815AAC6 3.1600 1/17/2023 101.5613 825,000.00 824,876.66 824,896.98 837,880.31HYUNDAI AUTO 3.2% 12/22 44933AAC1 3.2000 12/15/2022 101.6083 320,000.00 319,996.16 319,996.16 325,146.50JP MORGAN 1.949% 01/49 46590KAA2 1.9490 1/15/2049 99.6685 105,239.13 105,239.05 105,239.05 104,890.26JP MORGAN 4.1712% 08/46 46636VAC0 4.1712 8/15/2046 102.5973 51,804.51 55,374.15 55,078.38 53,150.05JPMCC 3.2397% 03/50 46647TAP3 3.2397 3/15/2050 101.7575 756,000.00 778,678.49 777,029.73 769,286.55MERCEDES-BENZ 3.21% 09/21 58769LAC6 3.2100 9/15/2021 100.8780 850,000.00 849,980.96 849,986.14 857,463.26MERCEDES-BENZ 3.1% 11/21 58772TAC4 3.1000 11/15/2021 100.8921 355,000.00 354,989.60 354,991.50 358,167.10MORGAN 3.089% 06/50 61691JAR5 3.0890 6/15/2050 102.2615 767,000.00 790,005.78 788,480.78 784,345.47MORGAN 1.531% 01/49 61766LBN8 1.5310 1/15/2049 99.3186 201,513.50 201,511.85 201,511.85 200,140.41NELNET STUDENT FLT 08/27 64031QCS8 2.6335 8/23/2027 99.8555 542,388.51 541,737.27 541,814.00 541,604.92NELNET STUDENT FLT 01/30 640315AE7 2.3755 1/25/2030 99.9480 34,905.20 34,874.42 34,877.17 34,887.04NISSAN AUTO 3.25% 09/21 65478BAD3 3.2500 9/15/2021 101.0406 360,000.00 359,968.54 359,977.21 363,746.23NISSAN AUTO 3.22% 06/23 65478NAD7 3.2200 6/15/2023 101.8925 790,000.00 789,848.64 789,870.24 804,950.67SANTANDER 3.03% 02/22 80285GAD4 3.0300 2/15/2022 100.1179 188,542.69 188,538.00 188,538.24 188,765.00SANTANDER 3.19% 03/22 80286AAD6 3.1900 3/15/2022 100.3478 380,000.00 379,950.75 379,962.31 381,321.53SOUTH CAROLINA FLT 05/30 83715RAE2 3.1524 5/1/2030 99.5876 319,317.70 320,758.56 320,629.80 318,000.77SYNCHRONY 1.93% 06/23 87165LBP5 1.9300 6/15/2023 99.5540 304,000.00 303,560.63 303,710.13 302,644.10TOYOTA AUTO 3.3% 02/24 89231PAE8 3.3000 2/15/2024 103.0494 325,000.00 324,933.83 324,942.08 334,910.39UBS COMMERCIAL 3.4% 05/45 90269GAC5 3.4000 5/10/2045 102.1894 175,072.58 183,060.27 182,354.30 178,905.67UBS-BARCLAY 3.1847% 03/46 90270YBF5 3.1847 3/10/2046 102.6316 1,000,000.00 992,617.19 992,857.27 1,026,316.00UBS 2.982% 06/50 90276EAB3 2.9820 6/15/2050 101.2914 760,000.00 782,768.99 781,274.00 769,814.34UBS 3.44% 04/52 90276YAB9 3.4400 4/15/2052 104.3028 620,000.00 638,598.51 638,402.93 646,677.30UBS 4.2569% 12/51 90278KAX9 4.2569 12/15/2051 106.9783 1,160,000.00 1,194,796.06 1,194,087.58 1,240,948.40UBS 4.2076% 10/51 90353KAV1 4.2076 10/15/2051 106.9350 615,000.00 633,447.29 632,966.87 657,650.25VOLKSWAGEN 3.15% 07/24 92868LAE1 3.1500 7/22/2024 101.8566 335,000.00 334,996.28 334,996.28 341,219.68VOLKSWAGEN 3.25% 04/23 92869BAD4 3.2500 4/20/2023 101.4734 670,000.00 669,971.86 669,977.04 679,871.98WFRBS 3.66% 03/47 92938VAN5 3.6600 3/15/2047 101.3865 638,136.88 668,847.21 666,290.98 646,984.58
Page 9 of 10
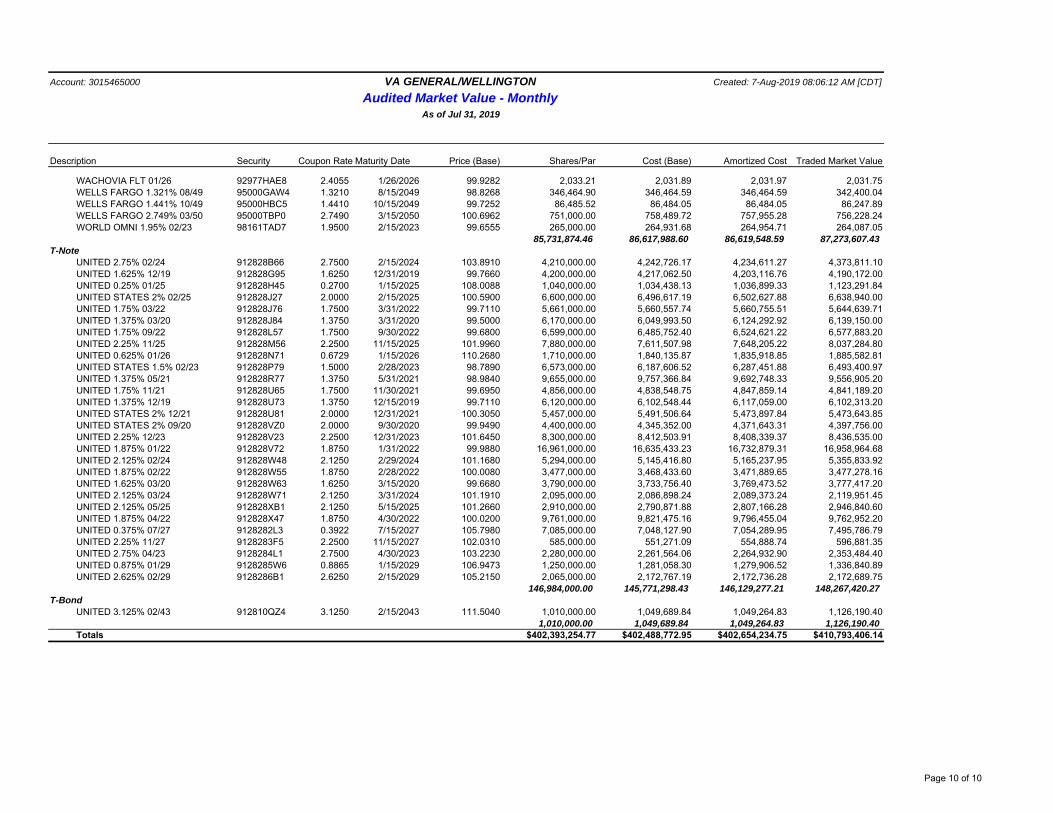
Account: 3015465000 VA GENERAL/WELLINGTON Created: 7-Aug-2019 08:06:12 AM [CDT]
Audited Market Value - MonthlyAs of Jul 31, 2019
Description Security Coupon Rate Maturity Date Price (Base) Shares/Par Cost (Base) Amortized Cost Traded Market Value
WACHOVIA FLT 01/26 92977HAE8 2.4055 1/26/2026 99.9282 2,033.21 2,031.89 2,031.97 2,031.75WELLS FARGO 1.321% 08/49 95000GAW4 1.3210 8/15/2049 98.8268 346,464.90 346,464.59 346,464.59 342,400.04WELLS FARGO 1.441% 10/49 95000HBC5 1.4410 10/15/2049 99.7252 86,485.52 86,484.05 86,484.05 86,247.89WELLS FARGO 2.749% 03/50 95000TBP0 2.7490 3/15/2050 100.6962 751,000.00 758,489.72 757,955.28 756,228.24WORLD OMNI 1.95% 02/23 98161TAD7 1.9500 2/15/2023 99.6555 265,000.00 264,931.68 264,954.71 264,087.05
85,731,874.46 86,617,988.60 86,619,548.59 87,273,607.43 T-Note
UNITED 2.75% 02/24 912828B66 2.7500 2/15/2024 103.8910 4,210,000.00 4,242,726.17 4,234,611.27 4,373,811.10UNITED 1.625% 12/19 912828G95 1.6250 12/31/2019 99.7660 4,200,000.00 4,217,062.50 4,203,116.76 4,190,172.00UNITED 0.25% 01/25 912828H45 0.2700 1/15/2025 108.0088 1,040,000.00 1,034,438.13 1,036,899.33 1,123,291.84UNITED STATES 2% 02/25 912828J27 2.0000 2/15/2025 100.5900 6,600,000.00 6,496,617.19 6,502,627.88 6,638,940.00UNITED 1.75% 03/22 912828J76 1.7500 3/31/2022 99.7110 5,661,000.00 5,660,557.74 5,660,755.51 5,644,639.71UNITED 1.375% 03/20 912828J84 1.3750 3/31/2020 99.5000 6,170,000.00 6,049,993.50 6,124,292.92 6,139,150.00UNITED 1.75% 09/22 912828L57 1.7500 9/30/2022 99.6800 6,599,000.00 6,485,752.40 6,524,621.22 6,577,883.20UNITED 2.25% 11/25 912828M56 2.2500 11/15/2025 101.9960 7,880,000.00 7,611,507.98 7,648,205.22 8,037,284.80UNITED 0.625% 01/26 912828N71 0.6729 1/15/2026 110.2680 1,710,000.00 1,840,135.87 1,835,918.85 1,885,582.81UNITED STATES 1.5% 02/23 912828P79 1.5000 2/28/2023 98.7890 6,573,000.00 6,187,606.52 6,287,451.88 6,493,400.97UNITED 1.375% 05/21 912828R77 1.3750 5/31/2021 98.9840 9,655,000.00 9,757,366.84 9,692,748.33 9,556,905.20UNITED 1.75% 11/21 912828U65 1.7500 11/30/2021 99.6950 4,856,000.00 4,838,548.75 4,847,859.14 4,841,189.20UNITED 1.375% 12/19 912828U73 1.3750 12/15/2019 99.7110 6,120,000.00 6,102,548.44 6,117,059.00 6,102,313.20UNITED STATES 2% 12/21 912828U81 2.0000 12/31/2021 100.3050 5,457,000.00 5,491,506.64 5,473,897.84 5,473,643.85UNITED STATES 2% 09/20 912828VZ0 2.0000 9/30/2020 99.9490 4,400,000.00 4,345,352.00 4,371,643.31 4,397,756.00UNITED 2.25% 12/23 912828V23 2.2500 12/31/2023 101.6450 8,300,000.00 8,412,503.91 8,408,339.37 8,436,535.00UNITED 1.875% 01/22 912828V72 1.8750 1/31/2022 99.9880 16,961,000.00 16,635,433.23 16,732,879.31 16,958,964.68UNITED 2.125% 02/24 912828W48 2.1250 2/29/2024 101.1680 5,294,000.00 5,145,416.80 5,165,237.95 5,355,833.92UNITED 1.875% 02/22 912828W55 1.8750 2/28/2022 100.0080 3,477,000.00 3,468,433.60 3,471,889.65 3,477,278.16UNITED 1.625% 03/20 912828W63 1.6250 3/15/2020 99.6680 3,790,000.00 3,733,756.40 3,769,473.52 3,777,417.20UNITED 2.125% 03/24 912828W71 2.1250 3/31/2024 101.1910 2,095,000.00 2,086,898.24 2,089,373.24 2,119,951.45UNITED 2.125% 05/25 912828XB1 2.1250 5/15/2025 101.2660 2,910,000.00 2,790,871.88 2,807,166.28 2,946,840.60UNITED 1.875% 04/22 912828X47 1.8750 4/30/2022 100.0200 9,761,000.00 9,821,475.16 9,796,455.04 9,762,952.20UNITED 0.375% 07/27 9128282L3 0.3922 7/15/2027 105.7980 7,085,000.00 7,048,127.90 7,054,289.95 7,495,786.79UNITED 2.25% 11/27 9128283F5 2.2500 11/15/2027 102.0310 585,000.00 551,271.09 554,888.74 596,881.35UNITED 2.75% 04/23 9128284L1 2.7500 4/30/2023 103.2230 2,280,000.00 2,261,564.06 2,264,932.90 2,353,484.40UNITED 0.875% 01/29 9128285W6 0.8865 1/15/2029 106.9473 1,250,000.00 1,281,058.30 1,279,906.52 1,336,840.89UNITED 2.625% 02/29 9128286B1 2.6250 2/15/2029 105.2150 2,065,000.00 2,172,767.19 2,172,736.28 2,172,689.75
146,984,000.00 145,771,298.43 146,129,277.21 148,267,420.27 T-Bond
UNITED 3.125% 02/43 912810QZ4 3.1250 2/15/2043 111.5040 1,010,000.00 1,049,689.84 1,049,264.83 1,126,190.401,010,000.00 1,049,689.84 1,049,264.83 1,126,190.40
Totals $402,393,254.77 $402,488,772.95 $402,654,234.75 $410,793,406.14
Page 10 of 10
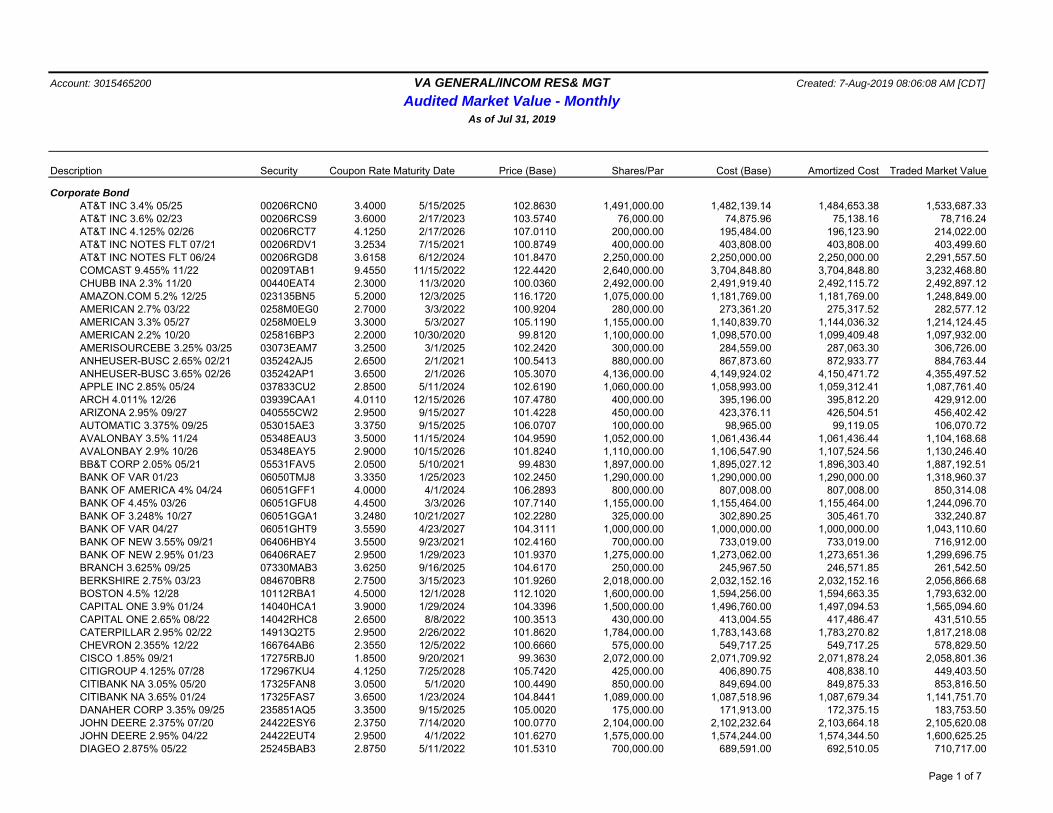
Account: 3015465200 VA GENERAL/INCOM RES& MGT Created: 7-Aug-2019 08:06:08 AM [CDT]
Audited Market Value - MonthlyAs of Jul 31, 2019
Description Security Coupon Rate Maturity Date Price (Base) Shares/Par Cost (Base) Amortized Cost Traded Market Value
Corporate BondAT&T INC 3.4% 05/25 00206RCN0 3.4000 5/15/2025 102.8630 1,491,000.00 1,482,139.14 1,484,653.38 1,533,687.33AT&T INC 3.6% 02/23 00206RCS9 3.6000 2/17/2023 103.5740 76,000.00 74,875.96 75,138.16 78,716.24AT&T INC 4.125% 02/26 00206RCT7 4.1250 2/17/2026 107.0110 200,000.00 195,484.00 196,123.90 214,022.00AT&T INC NOTES FLT 07/21 00206RDV1 3.2534 7/15/2021 100.8749 400,000.00 403,808.00 403,808.00 403,499.60AT&T INC NOTES FLT 06/24 00206RGD8 3.6158 6/12/2024 101.8470 2,250,000.00 2,250,000.00 2,250,000.00 2,291,557.50COMCAST 9.455% 11/22 00209TAB1 9.4550 11/15/2022 122.4420 2,640,000.00 3,704,848.80 3,704,848.80 3,232,468.80CHUBB INA 2.3% 11/20 00440EAT4 2.3000 11/3/2020 100.0360 2,492,000.00 2,491,919.40 2,492,115.72 2,492,897.12AMAZON.COM 5.2% 12/25 023135BN5 5.2000 12/3/2025 116.1720 1,075,000.00 1,181,769.00 1,181,769.00 1,248,849.00AMERICAN 2.7% 03/22 0258M0EG0 2.7000 3/3/2022 100.9204 280,000.00 273,361.20 275,317.52 282,577.12AMERICAN 3.3% 05/27 0258M0EL9 3.3000 5/3/2027 105.1190 1,155,000.00 1,140,839.70 1,144,036.32 1,214,124.45AMERICAN 2.2% 10/20 025816BP3 2.2000 10/30/2020 99.8120 1,100,000.00 1,098,570.00 1,099,409.48 1,097,932.00AMERISOURCEBE 3.25% 03/25 03073EAM7 3.2500 3/1/2025 102.2420 300,000.00 284,559.00 287,063.30 306,726.00ANHEUSER-BUSC 2.65% 02/21 035242AJ5 2.6500 2/1/2021 100.5413 880,000.00 867,873.60 872,933.77 884,763.44ANHEUSER-BUSC 3.65% 02/26 035242AP1 3.6500 2/1/2026 105.3070 4,136,000.00 4,149,924.02 4,150,471.72 4,355,497.52APPLE INC 2.85% 05/24 037833CU2 2.8500 5/11/2024 102.6190 1,060,000.00 1,058,993.00 1,059,312.41 1,087,761.40ARCH 4.011% 12/26 03939CAA1 4.0110 12/15/2026 107.4780 400,000.00 395,196.00 395,812.20 429,912.00ARIZONA 2.95% 09/27 040555CW2 2.9500 9/15/2027 101.4228 450,000.00 423,376.11 426,504.51 456,402.42AUTOMATIC 3.375% 09/25 053015AE3 3.3750 9/15/2025 106.0707 100,000.00 98,965.00 99,119.05 106,070.72AVALONBAY 3.5% 11/24 05348EAU3 3.5000 11/15/2024 104.9590 1,052,000.00 1,061,436.44 1,061,436.44 1,104,168.68AVALONBAY 2.9% 10/26 05348EAY5 2.9000 10/15/2026 101.8240 1,110,000.00 1,106,547.90 1,107,524.56 1,130,246.40BB&T CORP 2.05% 05/21 05531FAV5 2.0500 5/10/2021 99.4830 1,897,000.00 1,895,027.12 1,896,303.40 1,887,192.51BANK OF VAR 01/23 06050TMJ8 3.3350 1/25/2023 102.2450 1,290,000.00 1,290,000.00 1,290,000.00 1,318,960.37BANK OF AMERICA 4% 04/24 06051GFF1 4.0000 4/1/2024 106.2893 800,000.00 807,008.00 807,008.00 850,314.08BANK OF 4.45% 03/26 06051GFU8 4.4500 3/3/2026 107.7140 1,155,000.00 1,155,464.00 1,155,464.00 1,244,096.70BANK OF 3.248% 10/27 06051GGA1 3.2480 10/21/2027 102.2280 325,000.00 302,890.25 305,461.70 332,240.87BANK OF VAR 04/27 06051GHT9 3.5590 4/23/2027 104.3111 1,000,000.00 1,000,000.00 1,000,000.00 1,043,110.60BANK OF NEW 3.55% 09/21 06406HBY4 3.5500 9/23/2021 102.4160 700,000.00 733,019.00 733,019.00 716,912.00BANK OF NEW 2.95% 01/23 06406RAE7 2.9500 1/29/2023 101.9370 1,275,000.00 1,273,062.00 1,273,651.36 1,299,696.75BRANCH 3.625% 09/25 07330MAB3 3.6250 9/16/2025 104.6170 250,000.00 245,967.50 246,571.85 261,542.50BERKSHIRE 2.75% 03/23 084670BR8 2.7500 3/15/2023 101.9260 2,018,000.00 2,032,152.16 2,032,152.16 2,056,866.68BOSTON 4.5% 12/28 10112RBA1 4.5000 12/1/2028 112.1020 1,600,000.00 1,594,256.00 1,594,663.35 1,793,632.00CAPITAL ONE 3.9% 01/24 14040HCA1 3.9000 1/29/2024 104.3396 1,500,000.00 1,496,760.00 1,497,094.53 1,565,094.60CAPITAL ONE 2.65% 08/22 14042RHC8 2.6500 8/8/2022 100.3513 430,000.00 413,004.55 417,486.47 431,510.55CATERPILLAR 2.95% 02/22 14913Q2T5 2.9500 2/26/2022 101.8620 1,784,000.00 1,783,143.68 1,783,270.82 1,817,218.08CHEVRON 2.355% 12/22 166764AB6 2.3550 12/5/2022 100.6660 575,000.00 549,717.25 549,717.25 578,829.50CISCO 1.85% 09/21 17275RBJ0 1.8500 9/20/2021 99.3630 2,072,000.00 2,071,709.92 2,071,878.24 2,058,801.36CITIGROUP 4.125% 07/28 172967KU4 4.1250 7/25/2028 105.7420 425,000.00 406,890.75 408,838.10 449,403.50CITIBANK NA 3.05% 05/20 17325FAN8 3.0500 5/1/2020 100.4490 850,000.00 849,694.00 849,875.33 853,816.50CITIBANK NA 3.65% 01/24 17325FAS7 3.6500 1/23/2024 104.8441 1,089,000.00 1,087,518.96 1,087,679.34 1,141,751.70DANAHER CORP 3.35% 09/25 235851AQ5 3.3500 9/15/2025 105.0020 175,000.00 171,913.00 172,375.15 183,753.50JOHN DEERE 2.375% 07/20 24422ESY6 2.3750 7/14/2020 100.0770 2,104,000.00 2,102,232.64 2,103,664.18 2,105,620.08JOHN DEERE 2.95% 04/22 24422EUT4 2.9500 4/1/2022 101.6270 1,575,000.00 1,574,244.00 1,574,344.50 1,600,625.25DIAGEO 2.875% 05/22 25245BAB3 2.8750 5/11/2022 101.5310 700,000.00 689,591.00 692,510.05 710,717.00
Page 1 of 7

Account: 3015465200 VA GENERAL/INCOM RES& MGT Created: 7-Aug-2019 08:06:08 AM [CDT]
Audited Market Value - MonthlyAs of Jul 31, 2019
Description Security Coupon Rate Maturity Date Price (Base) Shares/Par Cost (Base) Amortized Cost Traded Market Value
DOMINION STEP 08/21 25746UDA4 2.7150 8/15/2021 100.1580 1,450,000.00 1,450,348.00 1,450,348.00 1,452,291.00DUKE ENERGY 3.9% 06/21 26442CAK0 3.9000 6/15/2021 102.6690 2,500,000.00 2,676,050.00 2,676,050.00 2,566,725.00ERP 4.625% 12/21 26884AAZ6 4.6250 12/15/2021 104.6830 224,000.00 232,187.20 232,187.20 234,489.92ECOLAB INC 2.7% 11/26 278865AV2 2.7000 11/1/2026 100.3322 175,000.00 161,731.50 163,453.70 175,581.35ENTERPRISE 2.85% 04/21 29379VBK8 2.8500 4/15/2021 100.6320 175,000.00 172,824.75 173,669.89 176,106.00FEDERAL 2.55% 01/21 313747AW7 2.5500 1/15/2021 100.1880 150,000.00 147,355.50 148,481.25 150,282.00FIFTH THIRD 2.2% 10/20 31677QBK4 2.2000 10/30/2020 99.7079 1,390,000.00 1,389,471.80 1,389,781.40 1,385,939.53WACHOVIA CORP STEP 08/26 337358BH7 7.5740 8/1/2026 125.7780 190,000.00 212,105.70 212,105.70 238,978.20GILEAD 2.35% 02/20 375558AY9 2.3500 2/1/2020 99.9820 1,108,000.00 1,105,473.76 1,107,756.20 1,107,800.56GILEAD 3.65% 03/26 375558BF9 3.6500 3/1/2026 105.6032 400,000.00 394,916.00 395,634.90 422,412.92GOLDMAN 5.75% 01/22 38141GGS7 5.7500 1/24/2022 107.6920 1,217,000.00 1,418,816.75 1,418,816.75 1,310,611.64GOLDMAN SACHS 3% 04/22 38141GWC4 3.0000 4/26/2022 100.7934 1,552,000.00 1,547,514.72 1,549,637.37 1,564,313.57GOLDMAN SACHS VAR 05/29 38141GWZ3 4.2230 5/1/2029 107.7070 1,700,000.00 1,700,153.00 1,700,153.00 1,831,019.00HCP INC 4.25% 11/23 40414LAJ8 4.2500 11/15/2023 106.1320 497,000.00 508,828.60 508,828.60 527,476.04HEALTHCARE 3.375% 07/21 42225UAC8 3.3750 7/15/2021 101.3020 125,000.00 124,585.00 124,732.25 126,627.50HUNTINGTON 3.25% 05/21 44644AAD9 3.2500 5/14/2021 101.4425 1,985,000.00 1,980,513.90 1,982,345.40 2,013,634.22HUNTINGTON 3.55% 10/23 44644AAE7 3.5500 10/6/2023 104.1424 1,495,000.00 1,491,711.00 1,492,323.50 1,556,929.03INTERCONTINEN 2.35% 09/22 45866FAE4 2.3500 9/15/2022 99.9808 1,476,000.00 1,472,619.96 1,473,929.09 1,475,716.46JPMORGAN 4.4% 07/20 46625HHS2 4.4000 7/22/2020 101.9730 224,000.00 229,452.16 229,452.16 228,419.52JPMORGAN 4.5% 01/22 46625HJD3 4.5000 1/24/2022 104.9560 4,080,000.00 4,347,956.50 4,347,956.50 4,282,204.80JPMORGAN 3.625% 05/24 46625HJX9 3.6250 5/13/2024 105.1230 225,000.00 223,497.00 223,773.50 236,526.75JPMORGAN 3.625% 12/27 46625HRX0 3.6250 12/1/2027 103.7353 175,000.00 164,533.25 165,734.05 181,536.71JPMORGAN CHASE VAR 04/24 46647PAP1 3.5590 4/23/2024 103.5479 925,000.00 915,951.47 917,634.34 957,817.61JPMORGAN 2.972% 01/23 48128BAB7 2.9720 1/15/2023 101.2780 300,000.00 292,188.00 294,048.45 303,834.00KILROY 4.375% 10/25 49427RAL6 4.3750 10/1/2025 106.7090 250,000.00 250,347.50 250,347.50 266,772.50KIMCO REALTY 3.2% 05/21 49446RAL3 3.2000 5/1/2021 101.0860 400,000.00 397,584.00 398,507.94 404,344.00MANUFACTURER 2.625% 01/21 55279HAR1 2.6250 1/25/2021 100.3420 935,000.00 933,737.75 934,377.15 938,197.70MAGELLAN 5% 03/26 559080AK2 5.0000 3/1/2026 111.2030 375,000.00 394,935.00 394,935.00 417,011.25MCKESSON 2.85% 03/23 58155QAG8 2.8500 3/15/2023 100.5210 200,000.00 191,284.00 193,290.60 201,042.00METLIFE INC 3% 03/25 59156RBM9 3.0000 3/1/2025 102.0950 1,200,000.00 1,151,604.00 1,172,071.80 1,225,140.00MICROSOFT 3.3% 02/27 594918BY9 3.3000 2/6/2027 105.6917 2,074,000.00 2,058,104.05 2,060,695.63 2,192,046.07MORGAN STANLEY VAR 04/24 61744YAQ1 3.7370 4/24/2024 103.8920 225,000.00 223,650.00 223,902.72 233,757.00MORGAN STANLEY 4% 07/25 6174468C6 4.0000 7/23/2025 106.5075 25,000.00 24,924.00 24,935.85 26,626.88MORGAN 3.75% 02/23 61746BDJ2 3.7500 2/25/2023 104.0700 2,519,000.00 2,582,398.50 2,582,398.50 2,621,523.30MORGAN 3.875% 01/26 61746BDZ6 3.8750 1/27/2026 105.8590 975,000.00 1,007,210.07 1,007,210.07 1,032,125.25MORGAN STANLEY FLT 10/23 61746BEC6 3.6827 10/24/2023 101.9730 200,000.00 204,576.00 204,576.00 203,946.00MORGAN 3.625% 01/27 61746BEF9 3.6250 1/20/2027 104.1989 200,000.00 191,817.50 192,852.40 208,397.80MORGAN 5.5% 07/21 61747WAL3 5.5000 7/28/2021 105.7510 1,125,000.00 1,190,452.50 1,190,452.50 1,189,698.75MORGAN 2.65% 01/20 61747YDW2 2.6500 1/27/2020 100.0860 575,000.00 570,825.50 573,697.78 575,494.50MORGAN 3.7% 10/24 61761JVL0 3.7000 10/23/2024 104.8610 250,000.00 246,812.50 247,357.60 262,152.50NATIONAL 3.6% 12/26 637417AJ5 3.6000 12/15/2026 103.5520 175,000.00 165,662.00 166,854.90 181,216.00NATIONAL 2.85% 01/25 637432ND3 2.8500 1/27/2025 102.1740 2,620,000.00 2,564,744.20 2,568,540.40 2,676,958.80NISOURCE INC 3.49% 05/27 65473QBE2 3.4900 5/15/2027 103.4177 600,000.00 573,726.00 576,929.45 620,506.02NORTHROP 3.25% 01/28 666807BN1 3.2500 1/15/2028 102.8652 725,000.00 681,442.80 686,380.30 745,772.92
Page 2 of 7

Account: 3015465200 VA GENERAL/INCOM RES& MGT Created: 7-Aug-2019 08:06:08 AM [CDT]
Audited Market Value - MonthlyAs of Jul 31, 2019
Description Security Coupon Rate Maturity Date Price (Base) Shares/Par Cost (Base) Amortized Cost Traded Market Value
ORACLE CORP 2.5% 05/22 68389XBB0 2.5000 5/15/2022 100.5990 275,000.00 267,773.00 269,792.93 276,647.25ORACLE CORP 3.25% 11/27 68389XBN4 3.2500 11/15/2027 104.6180 450,000.00 430,281.00 432,556.20 470,781.00ORACLE CORP 2.95% 11/24 68389XBS3 2.9500 11/15/2024 102.7728 1,500,000.00 1,482,570.00 1,483,909.52 1,541,592.30PNC FINANCIAL 3.5% 01/24 693475AV7 3.5000 1/23/2024 104.6480 1,422,000.00 1,418,772.06 1,419,117.02 1,488,094.56PRUDENTIAL 3.5% 05/24 74432QBZ7 3.5000 5/15/2024 105.5680 400,000.00 396,580.00 397,210.35 422,272.00PRUDENTIAL 3.878% 03/28 74432QCC7 3.8780 3/27/2028 108.6957 600,000.00 591,171.48 592,151.08 652,174.02PUBLIC 3.75% 03/24 74456QBD7 3.7500 3/15/2024 105.1710 1,041,000.00 1,116,144.72 1,116,144.72 1,094,830.11PUBLIC 3.7% 05/28 74456QBU9 3.7000 5/1/2028 107.7014 125,000.00 125,366.25 125,366.25 134,626.78REALTY 3.65% 01/28 756109AU8 3.6500 1/15/2028 105.4320 1,412,000.00 1,421,008.56 1,421,008.56 1,488,699.84S&P GLOBAL 4.4% 02/26 78409VAK0 4.4000 2/15/2026 110.5980 1,211,000.00 1,269,152.22 1,269,152.22 1,339,341.78CHARLES 3.2% 03/27 808513AQ8 3.2000 3/2/2027 102.9277 300,000.00 286,392.00 288,090.50 308,783.01SEMPRA ENERGY FLT 01/21 816851BD0 2.8034 1/15/2021 99.7217 300,000.00 300,918.78 300,918.78 299,164.98SIMON 4.125% 12/21 828807CG0 4.1250 12/1/2021 103.6040 580,000.00 592,951.40 592,951.40 600,903.20SIMON 2.75% 02/23 828807CN5 2.7500 2/1/2023 101.0910 3,132,000.00 3,085,427.16 3,105,206.01 3,166,170.12SOUTHERN 3.25% 07/26 842587CV7 3.2500 7/1/2026 101.9062 350,000.00 328,534.50 331,437.75 356,671.84STATE STREET VAR 05/23 857477AZ6 2.6530 5/15/2023 100.7104 1,678,000.00 1,678,000.00 1,678,000.00 1,689,919.84SUNTRUST 2.75% 05/23 86787EAN7 2.7500 5/1/2023 100.7130 400,000.00 386,344.00 389,401.30 402,852.00SUNTRUST VAR 10/21 86787EBA4 3.5250 10/26/2021 101.2905 1,211,000.00 1,211,000.00 1,211,000.00 1,226,627.83TD 3.625% 04/25 87236YAD0 3.6250 4/1/2025 105.2920 300,000.00 296,841.00 297,346.60 315,876.00TD AMERITRADE 3.3% 04/27 87236YAF5 3.3000 4/1/2027 102.9260 1,067,000.00 1,064,780.64 1,065,286.33 1,098,220.74TANGER 3.125% 09/26 875484AJ6 3.1250 9/1/2026 96.0030 50,000.00 45,117.50 45,765.30 48,001.50US BANCORP 2.95% 07/22 91159JAA4 2.9500 7/15/2022 101.6730 150,000.00 146,566.50 147,486.85 152,509.50UNITEDHEALTH 3.5% 06/23 91324PDJ8 3.5000 6/15/2023 104.2520 895,000.00 894,552.50 894,653.57 933,055.40UNITEDHEALTH 3.5% 02/24 91324PDM1 3.5000 2/15/2024 104.7857 2,200,000.00 2,194,522.00 2,195,191.90 2,305,285.18VENTAS 3.25% 10/26 92277GAJ6 3.2500 10/15/2026 101.1100 1,571,000.00 1,557,646.81 1,560,320.86 1,588,438.10VERIZON 3.5% 11/24 92343VCR3 3.5000 11/1/2024 104.7250 275,000.00 265,988.25 267,525.49 287,993.75VERIZON 2.625% 08/26 92343VDD3 2.6250 8/15/2026 99.9040 1,573,000.00 1,423,785.22 1,442,998.02 1,571,489.92WALMART INC 2.85% 07/24 931142EL3 2.8500 7/8/2024 102.8260 3,140,000.00 3,136,169.20 3,136,384.27 3,228,736.40WELLS FARGO & 4.6% 04/21 94974BEV8 4.6000 4/1/2021 103.6140 625,000.00 645,343.75 645,343.75 647,587.50WELLS FARGO & 3.5% 03/22 94974BFC9 3.5000 3/8/2022 102.7160 425,000.00 423,614.50 424,021.35 436,543.00WELLS FARGO & 3% 04/26 949746RW3 3.0000 4/22/2026 101.1990 1,291,000.00 1,286,571.87 1,288,027.50 1,306,479.09WELLS FARGO & 3% 10/26 949746SH5 3.0000 10/23/2026 100.8529 250,000.00 230,835.00 233,328.40 252,132.25XCEL ENERGY 2.6% 03/22 98389BAT7 2.6000 3/15/2022 100.5070 1,740,000.00 1,739,530.20 1,739,765.54 1,748,821.80
119,561,000.00 120,976,627.51 121,146,434.63 123,864,911.58 FHLMC
FHLMCGLD 5% 11/35 3128DFAR9 5.0000 11/1/2035 109.7940 2,233,270.53 2,363,428.33 2,363,428.33 2,451,997.05FHLMC MORTPASS FLT 04/35 3128JR6Z4 4.8670 4/1/2035 105.4170 782,933.37 825,016.02 825,016.02 825,344.87FHLMCGLD 4.5% 11/39 3128MJMW7 4.5000 11/1/2039 107.9480 291,614.54 311,708.61 311,708.61 314,792.06FHLMCGLD 4% 07/37 3128M9Z96 4.0000 7/1/2037 104.0370 1,122,647.94 1,186,323.13 1,186,323.13 1,167,969.24FHLMCGLD 4.5% 06/38 3128M93E0 4.5000 6/1/2038 107.9360 975,517.47 1,052,491.88 1,052,491.88 1,052,934.54FHLMCGLD 6% 03/35 3132FCD69 6.0000 3/1/2035 114.3090 1,343,761.03 1,500,813.09 1,500,813.09 1,536,039.80FHLMCGLD 4% 01/42 3132GL7D0 4.0000 1/1/2042 100.0000 0.01 0.01 0.01 0.01UMBS MORTPASS 5% 06/49 31329Q5X5 5.0000 6/1/2049 108.1890 2,043,501.24 2,196,763.83 2,196,763.83 2,210,843.56FHLMCGLD 4.5% 05/42 31335A3M8 4.5000 5/1/2042 107.8380 2,949,841.42 3,172,231.83 3,172,231.83 3,181,049.99
Page 3 of 7
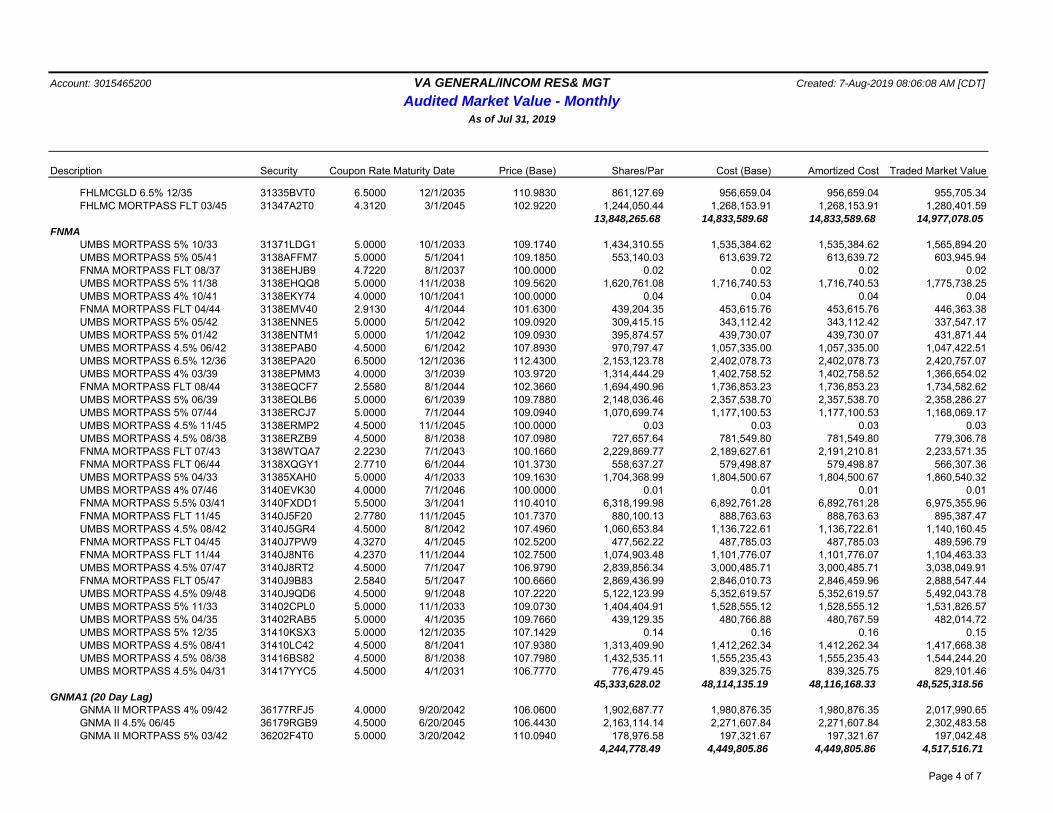
Account: 3015465200 VA GENERAL/INCOM RES& MGT Created: 7-Aug-2019 08:06:08 AM [CDT]
Audited Market Value - MonthlyAs of Jul 31, 2019
Description Security Coupon Rate Maturity Date Price (Base) Shares/Par Cost (Base) Amortized Cost Traded Market Value
FHLMCGLD 6.5% 12/35 31335BVT0 6.5000 12/1/2035 110.9830 861,127.69 956,659.04 956,659.04 955,705.34FHLMC MORTPASS FLT 03/45 31347A2T0 4.3120 3/1/2045 102.9220 1,244,050.44 1,268,153.91 1,268,153.91 1,280,401.59
13,848,265.68 14,833,589.68 14,833,589.68 14,977,078.05 FNMA
UMBS MORTPASS 5% 10/33 31371LDG1 5.0000 10/1/2033 109.1740 1,434,310.55 1,535,384.62 1,535,384.62 1,565,894.20UMBS MORTPASS 5% 05/41 3138AFFM7 5.0000 5/1/2041 109.1850 553,140.03 613,639.72 613,639.72 603,945.94FNMA MORTPASS FLT 08/37 3138EHJB9 4.7220 8/1/2037 100.0000 0.02 0.02 0.02 0.02UMBS MORTPASS 5% 11/38 3138EHQQ8 5.0000 11/1/2038 109.5620 1,620,761.08 1,716,740.53 1,716,740.53 1,775,738.25UMBS MORTPASS 4% 10/41 3138EKY74 4.0000 10/1/2041 100.0000 0.04 0.04 0.04 0.04FNMA MORTPASS FLT 04/44 3138EMV40 2.9130 4/1/2044 101.6300 439,204.35 453,615.76 453,615.76 446,363.38UMBS MORTPASS 5% 05/42 3138ENNE5 5.0000 5/1/2042 109.0920 309,415.15 343,112.42 343,112.42 337,547.17UMBS MORTPASS 5% 01/42 3138ENTM1 5.0000 1/1/2042 109.0930 395,874.57 439,730.07 439,730.07 431,871.44UMBS MORTPASS 4.5% 06/42 3138EPAB0 4.5000 6/1/2042 107.8930 970,797.47 1,057,335.00 1,057,335.00 1,047,422.51UMBS MORTPASS 6.5% 12/36 3138EPA20 6.5000 12/1/2036 112.4300 2,153,123.78 2,402,078.73 2,402,078.73 2,420,757.07UMBS MORTPASS 4% 03/39 3138EPMM3 4.0000 3/1/2039 103.9720 1,314,444.29 1,402,758.52 1,402,758.52 1,366,654.02FNMA MORTPASS FLT 08/44 3138EQCF7 2.5580 8/1/2044 102.3660 1,694,490.96 1,736,853.23 1,736,853.23 1,734,582.62UMBS MORTPASS 5% 06/39 3138EQLB6 5.0000 6/1/2039 109.7880 2,148,036.46 2,357,538.70 2,357,538.70 2,358,286.27UMBS MORTPASS 5% 07/44 3138ERCJ7 5.0000 7/1/2044 109.0940 1,070,699.74 1,177,100.53 1,177,100.53 1,168,069.17UMBS MORTPASS 4.5% 11/45 3138ERMP2 4.5000 11/1/2045 100.0000 0.03 0.03 0.03 0.03UMBS MORTPASS 4.5% 08/38 3138ERZB9 4.5000 8/1/2038 107.0980 727,657.64 781,549.80 781,549.80 779,306.78FNMA MORTPASS FLT 07/43 3138WTQA7 2.2230 7/1/2043 100.1660 2,229,869.77 2,189,627.61 2,191,210.81 2,233,571.35FNMA MORTPASS FLT 06/44 3138XQGY1 2.7710 6/1/2044 101.3730 558,637.27 579,498.87 579,498.87 566,307.36UMBS MORTPASS 5% 04/33 31385XAH0 5.0000 4/1/2033 109.1630 1,704,368.99 1,804,500.67 1,804,500.67 1,860,540.32UMBS MORTPASS 4% 07/46 3140EVK30 4.0000 7/1/2046 100.0000 0.01 0.01 0.01 0.01FNMA MORTPASS 5.5% 03/41 3140FXDD1 5.5000 3/1/2041 110.4010 6,318,199.98 6,892,761.28 6,892,761.28 6,975,355.96FNMA MORTPASS FLT 11/45 3140J5F20 2.7780 11/1/2045 101.7370 880,100.13 888,763.63 888,763.63 895,387.47UMBS MORTPASS 4.5% 08/42 3140J5GR4 4.5000 8/1/2042 107.4960 1,060,653.84 1,136,722.61 1,136,722.61 1,140,160.45FNMA MORTPASS FLT 04/45 3140J7PW9 4.3270 4/1/2045 102.5200 477,562.22 487,785.03 487,785.03 489,596.79FNMA MORTPASS FLT 11/44 3140J8NT6 4.2370 11/1/2044 102.7500 1,074,903.48 1,101,776.07 1,101,776.07 1,104,463.33UMBS MORTPASS 4.5% 07/47 3140J8RT2 4.5000 7/1/2047 106.9790 2,839,856.34 3,000,485.71 3,000,485.71 3,038,049.91FNMA MORTPASS FLT 05/47 3140J9B83 2.5840 5/1/2047 100.6660 2,869,436.99 2,846,010.73 2,846,459.96 2,888,547.44UMBS MORTPASS 4.5% 09/48 3140J9QD6 4.5000 9/1/2048 107.2220 5,122,123.99 5,352,619.57 5,352,619.57 5,492,043.78UMBS MORTPASS 5% 11/33 31402CPL0 5.0000 11/1/2033 109.0730 1,404,404.91 1,528,555.12 1,528,555.12 1,531,826.57UMBS MORTPASS 5% 04/35 31402RAB5 5.0000 4/1/2035 109.7660 439,129.35 480,766.88 480,767.59 482,014.72UMBS MORTPASS 5% 12/35 31410KSX3 5.0000 12/1/2035 107.1429 0.14 0.16 0.16 0.15UMBS MORTPASS 4.5% 08/41 31410LC42 4.5000 8/1/2041 107.9380 1,313,409.90 1,412,262.34 1,412,262.34 1,417,668.38UMBS MORTPASS 4.5% 08/38 31416BS82 4.5000 8/1/2038 107.7980 1,432,535.11 1,555,235.43 1,555,235.43 1,544,244.20UMBS MORTPASS 4.5% 04/31 31417YYC5 4.5000 4/1/2031 106.7770 776,479.45 839,325.75 839,325.75 829,101.46
45,333,628.02 48,114,135.19 48,116,168.33 48,525,318.56 GNMA1 (20 Day Lag)
GNMA II MORTPASS 4% 09/42 36177RFJ5 4.0000 9/20/2042 106.0600 1,902,687.77 1,980,876.35 1,980,876.35 2,017,990.65GNMA II 4.5% 06/45 36179RGB9 4.5000 6/20/2045 106.4430 2,163,114.14 2,271,607.84 2,271,607.84 2,302,483.58GNMA II MORTPASS 5% 03/42 36202F4T0 5.0000 3/20/2042 110.0940 178,976.58 197,321.67 197,321.67 197,042.48
4,244,778.49 4,449,805.86 4,449,805.86 4,517,516.71
Page 4 of 7
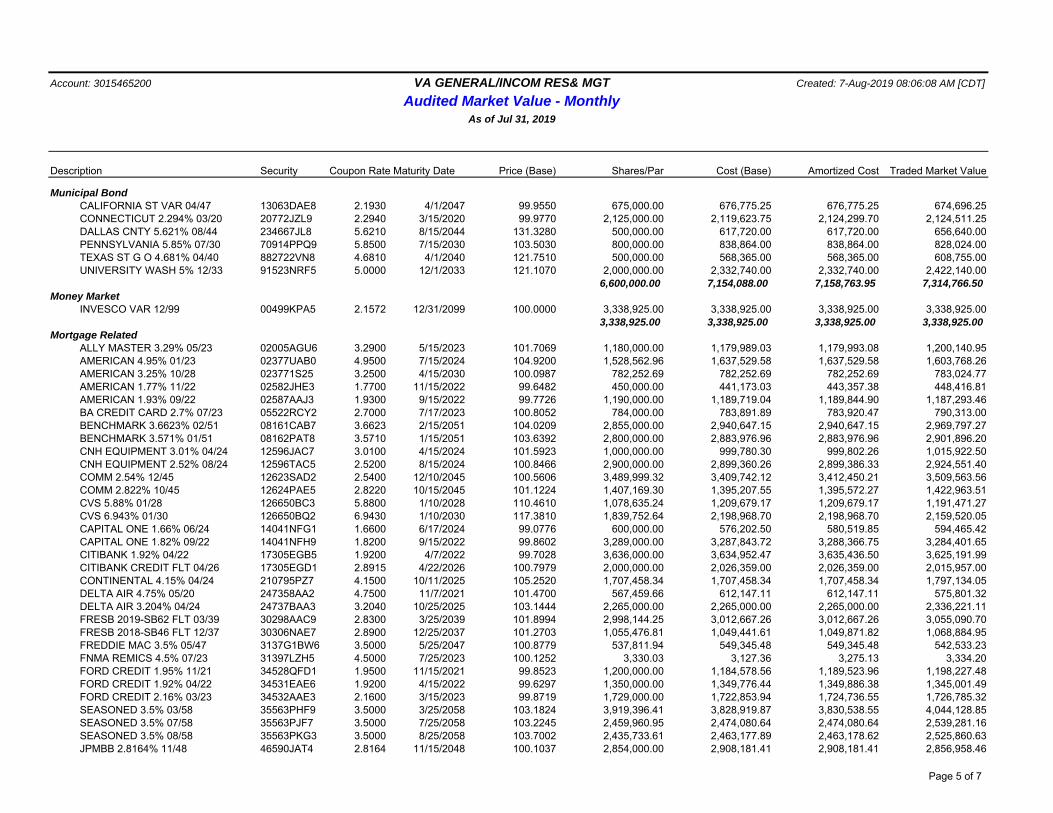
Account: 3015465200 VA GENERAL/INCOM RES& MGT Created: 7-Aug-2019 08:06:08 AM [CDT]
Audited Market Value - MonthlyAs of Jul 31, 2019
Description Security Coupon Rate Maturity Date Price (Base) Shares/Par Cost (Base) Amortized Cost Traded Market Value
Municipal BondCALIFORNIA ST VAR 04/47 13063DAE8 2.1930 4/1/2047 99.9550 675,000.00 676,775.25 676,775.25 674,696.25CONNECTICUT 2.294% 03/20 20772JZL9 2.2940 3/15/2020 99.9770 2,125,000.00 2,119,623.75 2,124,299.70 2,124,511.25DALLAS CNTY 5.621% 08/44 234667JL8 5.6210 8/15/2044 131.3280 500,000.00 617,720.00 617,720.00 656,640.00PENNSYLVANIA 5.85% 07/30 70914PPQ9 5.8500 7/15/2030 103.5030 800,000.00 838,864.00 838,864.00 828,024.00TEXAS ST G O 4.681% 04/40 882722VN8 4.6810 4/1/2040 121.7510 500,000.00 568,365.00 568,365.00 608,755.00UNIVERSITY WASH 5% 12/33 91523NRF5 5.0000 12/1/2033 121.1070 2,000,000.00 2,332,740.00 2,332,740.00 2,422,140.00
6,600,000.00 7,154,088.00 7,158,763.95 7,314,766.50 Money Market
INVESCO VAR 12/99 00499KPA5 2.1572 12/31/2099 100.0000 3,338,925.00 3,338,925.00 3,338,925.00 3,338,925.003,338,925.00 3,338,925.00 3,338,925.00 3,338,925.00
Mortgage RelatedALLY MASTER 3.29% 05/23 02005AGU6 3.2900 5/15/2023 101.7069 1,180,000.00 1,179,989.03 1,179,993.08 1,200,140.95AMERICAN 4.95% 01/23 02377UAB0 4.9500 7/15/2024 104.9200 1,528,562.96 1,637,529.58 1,637,529.58 1,603,768.26AMERICAN 3.25% 10/28 023771S25 3.2500 4/15/2030 100.0987 782,252.69 782,252.69 782,252.69 783,024.77AMERICAN 1.77% 11/22 02582JHE3 1.7700 11/15/2022 99.6482 450,000.00 441,173.03 443,357.38 448,416.81AMERICAN 1.93% 09/22 02587AAJ3 1.9300 9/15/2022 99.7726 1,190,000.00 1,189,719.04 1,189,844.90 1,187,293.46BA CREDIT CARD 2.7% 07/23 05522RCY2 2.7000 7/17/2023 100.8052 784,000.00 783,891.89 783,920.47 790,313.00BENCHMARK 3.6623% 02/51 08161CAB7 3.6623 2/15/2051 104.0209 2,855,000.00 2,940,647.15 2,940,647.15 2,969,797.27BENCHMARK 3.571% 01/51 08162PAT8 3.5710 1/15/2051 103.6392 2,800,000.00 2,883,976.96 2,883,976.96 2,901,896.20CNH EQUIPMENT 3.01% 04/24 12596JAC7 3.0100 4/15/2024 101.5923 1,000,000.00 999,780.30 999,802.26 1,015,922.50CNH EQUIPMENT 2.52% 08/24 12596TAC5 2.5200 8/15/2024 100.8466 2,900,000.00 2,899,360.26 2,899,386.33 2,924,551.40COMM 2.54% 12/45 12623SAD2 2.5400 12/10/2045 100.5606 3,489,999.32 3,409,742.12 3,412,450.21 3,509,563.56COMM 2.822% 10/45 12624PAE5 2.8220 10/15/2045 101.1224 1,407,169.30 1,395,207.55 1,395,572.27 1,422,963.51CVS 5.88% 01/28 126650BC3 5.8800 1/10/2028 110.4610 1,078,635.24 1,209,679.17 1,209,679.17 1,191,471.27CVS 6.943% 01/30 126650BQ2 6.9430 1/10/2030 117.3810 1,839,752.64 2,198,968.70 2,198,968.70 2,159,520.05CAPITAL ONE 1.66% 06/24 14041NFG1 1.6600 6/17/2024 99.0776 600,000.00 576,202.50 580,519.85 594,465.42CAPITAL ONE 1.82% 09/22 14041NFH9 1.8200 9/15/2022 99.8602 3,289,000.00 3,287,843.72 3,288,366.75 3,284,401.65CITIBANK 1.92% 04/22 17305EGB5 1.9200 4/7/2022 99.7028 3,636,000.00 3,634,952.47 3,635,436.50 3,625,191.99CITIBANK CREDIT FLT 04/26 17305EGD1 2.8915 4/22/2026 100.7979 2,000,000.00 2,026,359.00 2,026,359.00 2,015,957.00CONTINENTAL 4.15% 04/24 210795PZ7 4.1500 10/11/2025 105.2520 1,707,458.34 1,707,458.34 1,707,458.34 1,797,134.05DELTA AIR 4.75% 05/20 247358AA2 4.7500 11/7/2021 101.4700 567,459.66 612,147.11 612,147.11 575,801.32DELTA AIR 3.204% 04/24 24737BAA3 3.2040 10/25/2025 103.1444 2,265,000.00 2,265,000.00 2,265,000.00 2,336,221.11FRESB 2019-SB62 FLT 03/39 30298AAC9 2.8300 3/25/2039 101.8994 2,998,144.25 3,012,667.26 3,012,667.26 3,055,090.70FRESB 2018-SB46 FLT 12/37 30306NAE7 2.8900 12/25/2037 101.2703 1,055,476.81 1,049,441.61 1,049,871.82 1,068,884.95FREDDIE MAC 3.5% 05/47 3137G1BW6 3.5000 5/25/2047 100.8779 537,811.94 549,345.48 549,345.48 542,533.23FNMA REMICS 4.5% 07/23 31397LZH5 4.5000 7/25/2023 100.1252 3,330.03 3,127.36 3,275.13 3,334.20FORD CREDIT 1.95% 11/21 34528QFD1 1.9500 11/15/2021 99.8523 1,200,000.00 1,184,578.56 1,189,523.96 1,198,227.48FORD CREDIT 1.92% 04/22 34531EAE6 1.9200 4/15/2022 99.6297 1,350,000.00 1,349,776.44 1,349,886.38 1,345,001.49FORD CREDIT 2.16% 03/23 34532AAE3 2.1600 3/15/2023 99.8719 1,729,000.00 1,722,853.94 1,724,736.55 1,726,785.32SEASONED 3.5% 03/58 35563PHF9 3.5000 3/25/2058 103.1824 3,919,396.41 3,828,919.87 3,830,538.55 4,044,128.85SEASONED 3.5% 07/58 35563PJF7 3.5000 7/25/2058 103.2245 2,459,960.95 2,474,080.64 2,474,080.64 2,539,281.16SEASONED 3.5% 08/58 35563PKG3 3.5000 8/25/2058 103.7002 2,435,733.61 2,463,177.89 2,463,178.62 2,525,860.63JPMBB 2.8164% 11/48 46590JAT4 2.8164 11/15/2048 100.1037 2,854,000.00 2,908,181.41 2,908,181.41 2,856,958.46
Page 5 of 7
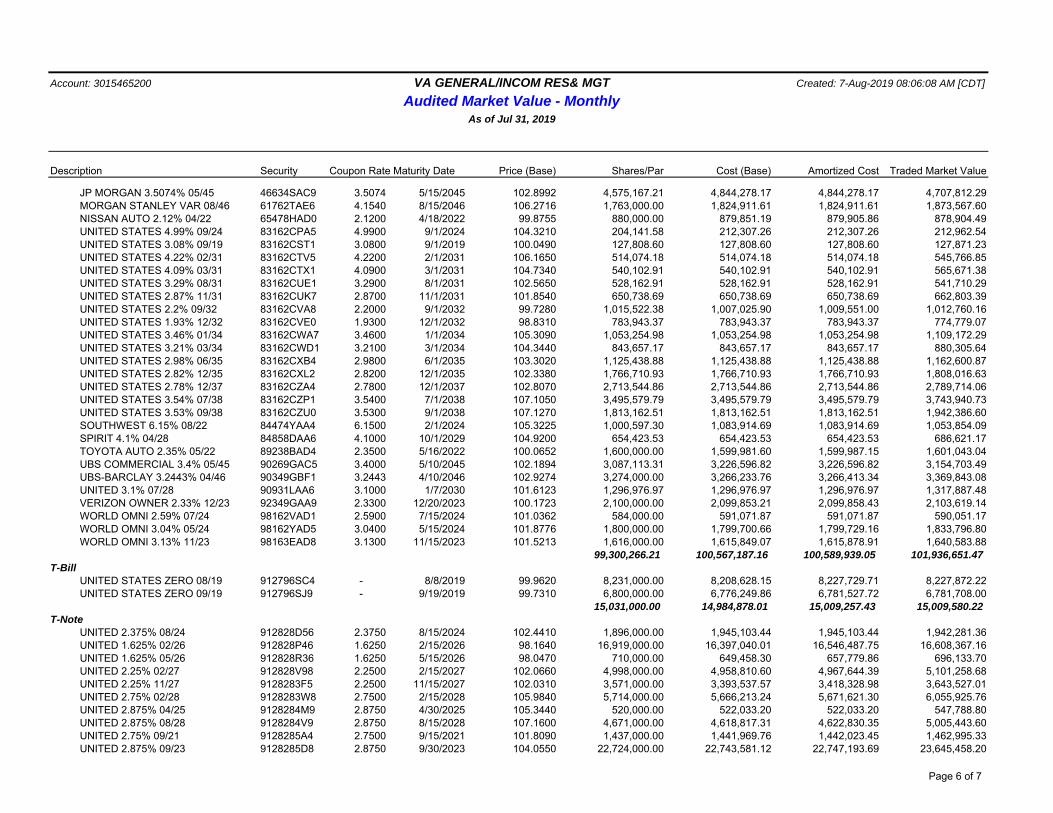
Account: 3015465200 VA GENERAL/INCOM RES& MGT Created: 7-Aug-2019 08:06:08 AM [CDT]
Audited Market Value - MonthlyAs of Jul 31, 2019
Description Security Coupon Rate Maturity Date Price (Base) Shares/Par Cost (Base) Amortized Cost Traded Market Value
JP MORGAN 3.5074% 05/45 46634SAC9 3.5074 5/15/2045 102.8992 4,575,167.21 4,844,278.17 4,844,278.17 4,707,812.29MORGAN STANLEY VAR 08/46 61762TAE6 4.1540 8/15/2046 106.2716 1,763,000.00 1,824,911.61 1,824,911.61 1,873,567.60NISSAN AUTO 2.12% 04/22 65478HAD0 2.1200 4/18/2022 99.8755 880,000.00 879,851.19 879,905.86 878,904.49UNITED STATES 4.99% 09/24 83162CPA5 4.9900 9/1/2024 104.3210 204,141.58 212,307.26 212,307.26 212,962.54UNITED STATES 3.08% 09/19 83162CST1 3.0800 9/1/2019 100.0490 127,808.60 127,808.60 127,808.60 127,871.23UNITED STATES 4.22% 02/31 83162CTV5 4.2200 2/1/2031 106.1650 514,074.18 514,074.18 514,074.18 545,766.85UNITED STATES 4.09% 03/31 83162CTX1 4.0900 3/1/2031 104.7340 540,102.91 540,102.91 540,102.91 565,671.38UNITED STATES 3.29% 08/31 83162CUE1 3.2900 8/1/2031 102.5650 528,162.91 528,162.91 528,162.91 541,710.29UNITED STATES 2.87% 11/31 83162CUK7 2.8700 11/1/2031 101.8540 650,738.69 650,738.69 650,738.69 662,803.39UNITED STATES 2.2% 09/32 83162CVA8 2.2000 9/1/2032 99.7280 1,015,522.38 1,007,025.90 1,009,551.00 1,012,760.16UNITED STATES 1.93% 12/32 83162CVE0 1.9300 12/1/2032 98.8310 783,943.37 783,943.37 783,943.37 774,779.07UNITED STATES 3.46% 01/34 83162CWA7 3.4600 1/1/2034 105.3090 1,053,254.98 1,053,254.98 1,053,254.98 1,109,172.29UNITED STATES 3.21% 03/34 83162CWD1 3.2100 3/1/2034 104.3440 843,657.17 843,657.17 843,657.17 880,305.64UNITED STATES 2.98% 06/35 83162CXB4 2.9800 6/1/2035 103.3020 1,125,438.88 1,125,438.88 1,125,438.88 1,162,600.87UNITED STATES 2.82% 12/35 83162CXL2 2.8200 12/1/2035 102.3380 1,766,710.93 1,766,710.93 1,766,710.93 1,808,016.63UNITED STATES 2.78% 12/37 83162CZA4 2.7800 12/1/2037 102.8070 2,713,544.86 2,713,544.86 2,713,544.86 2,789,714.06UNITED STATES 3.54% 07/38 83162CZP1 3.5400 7/1/2038 107.1050 3,495,579.79 3,495,579.79 3,495,579.79 3,743,940.73UNITED STATES 3.53% 09/38 83162CZU0 3.5300 9/1/2038 107.1270 1,813,162.51 1,813,162.51 1,813,162.51 1,942,386.60SOUTHWEST 6.15% 08/22 84474YAA4 6.1500 2/1/2024 105.3225 1,000,597.30 1,083,914.69 1,083,914.69 1,053,854.09SPIRIT 4.1% 04/28 84858DAA6 4.1000 10/1/2029 104.9200 654,423.53 654,423.53 654,423.53 686,621.17TOYOTA AUTO 2.35% 05/22 89238BAD4 2.3500 5/16/2022 100.0652 1,600,000.00 1,599,981.60 1,599,987.15 1,601,043.04UBS COMMERCIAL 3.4% 05/45 90269GAC5 3.4000 5/10/2045 102.1894 3,087,113.31 3,226,596.82 3,226,596.82 3,154,703.49UBS-BARCLAY 3.2443% 04/46 90349GBF1 3.2443 4/10/2046 102.9274 3,274,000.00 3,266,233.76 3,266,413.34 3,369,843.08UNITED 3.1% 07/28 90931LAA6 3.1000 1/7/2030 101.6123 1,296,976.97 1,296,976.97 1,296,976.97 1,317,887.48VERIZON OWNER 2.33% 12/23 92349GAA9 2.3300 12/20/2023 100.1723 2,100,000.00 2,099,853.21 2,099,858.43 2,103,619.14WORLD OMNI 2.59% 07/24 98162VAD1 2.5900 7/15/2024 101.0362 584,000.00 591,071.87 591,071.87 590,051.17WORLD OMNI 3.04% 05/24 98162YAD5 3.0400 5/15/2024 101.8776 1,800,000.00 1,799,700.66 1,799,729.16 1,833,796.80WORLD OMNI 3.13% 11/23 98163EAD8 3.1300 11/15/2023 101.5213 1,616,000.00 1,615,849.07 1,615,878.91 1,640,583.88
99,300,266.21 100,567,187.16 100,589,939.05 101,936,651.47 T-Bill
UNITED STATES ZERO 08/19 912796SC4 - 8/8/2019 99.9620 8,231,000.00 8,208,628.15 8,227,729.71 8,227,872.22UNITED STATES ZERO 09/19 912796SJ9 - 9/19/2019 99.7310 6,800,000.00 6,776,249.86 6,781,527.72 6,781,708.00
15,031,000.00 14,984,878.01 15,009,257.43 15,009,580.22 T-Note
UNITED 2.375% 08/24 912828D56 2.3750 8/15/2024 102.4410 1,896,000.00 1,945,103.44 1,945,103.44 1,942,281.36UNITED 1.625% 02/26 912828P46 1.6250 2/15/2026 98.1640 16,919,000.00 16,397,040.01 16,546,487.75 16,608,367.16UNITED 1.625% 05/26 912828R36 1.6250 5/15/2026 98.0470 710,000.00 649,458.30 657,779.86 696,133.70UNITED 2.25% 02/27 912828V98 2.2500 2/15/2027 102.0660 4,998,000.00 4,958,810.60 4,967,644.39 5,101,258.68UNITED 2.25% 11/27 9128283F5 2.2500 11/15/2027 102.0310 3,571,000.00 3,393,537.57 3,418,328.98 3,643,527.01UNITED 2.75% 02/28 9128283W8 2.7500 2/15/2028 105.9840 5,714,000.00 5,666,213.24 5,671,621.30 6,055,925.76UNITED 2.875% 04/25 9128284M9 2.8750 4/30/2025 105.3440 520,000.00 522,033.20 522,033.20 547,788.80UNITED 2.875% 08/28 9128284V9 2.8750 8/15/2028 107.1600 4,671,000.00 4,618,817.31 4,622,830.35 5,005,443.60UNITED 2.75% 09/21 9128285A4 2.7500 9/15/2021 101.8090 1,437,000.00 1,441,969.76 1,442,023.45 1,462,995.33UNITED 2.875% 09/23 9128285D8 2.8750 9/30/2023 104.0550 22,724,000.00 22,743,581.12 22,747,193.69 23,645,458.20
Page 6 of 7
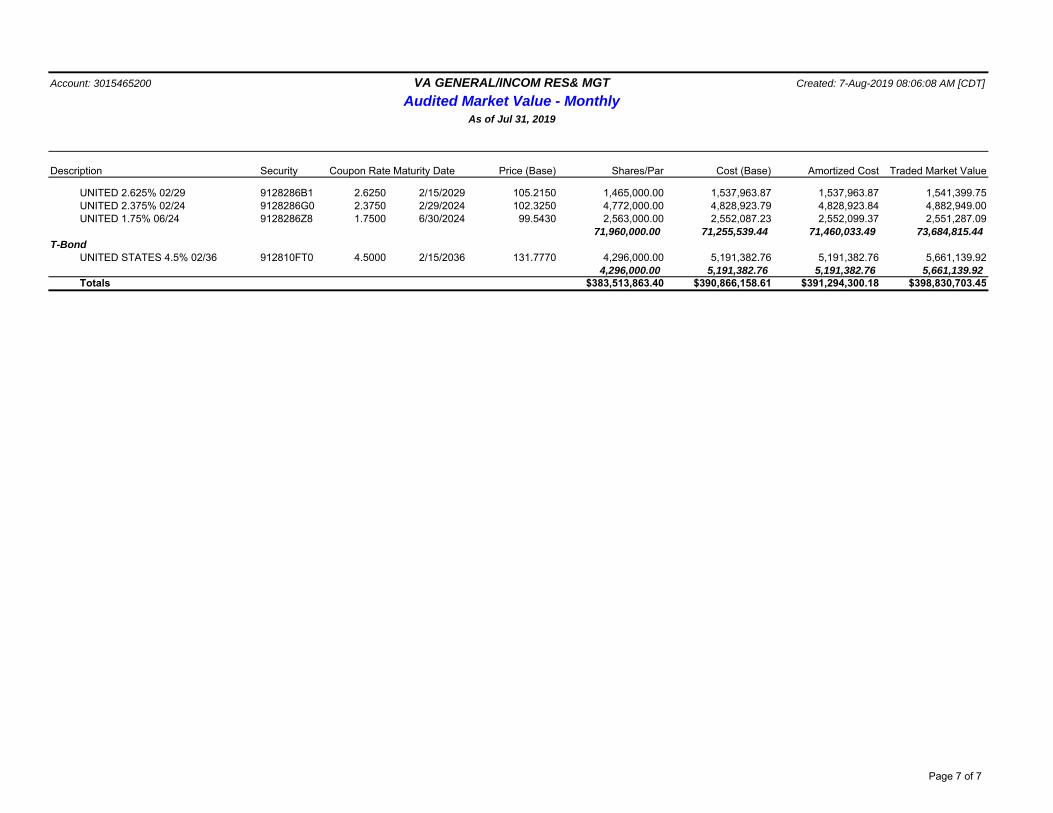
Account: 3015465200 VA GENERAL/INCOM RES& MGT Created: 7-Aug-2019 08:06:08 AM [CDT]
Audited Market Value - MonthlyAs of Jul 31, 2019
Description Security Coupon Rate Maturity Date Price (Base) Shares/Par Cost (Base) Amortized Cost Traded Market Value
UNITED 2.625% 02/29 9128286B1 2.6250 2/15/2029 105.2150 1,465,000.00 1,537,963.87 1,537,963.87 1,541,399.75UNITED 2.375% 02/24 9128286G0 2.3750 2/29/2024 102.3250 4,772,000.00 4,828,923.79 4,828,923.84 4,882,949.00UNITED 1.75% 06/24 9128286Z8 1.7500 6/30/2024 99.5430 2,563,000.00 2,552,087.23 2,552,099.37 2,551,287.09
71,960,000.00 71,255,539.44 71,460,033.49 73,684,815.44 T-Bond
UNITED STATES 4.5% 02/36 912810FT0 4.5000 2/15/2036 131.7770 4,296,000.00 5,191,382.76 5,191,382.76 5,661,139.924,296,000.00 5,191,382.76 5,191,382.76 5,661,139.92
Totals $383,513,863.40 $390,866,158.61 $391,294,300.18 $398,830,703.45
Page 7 of 7
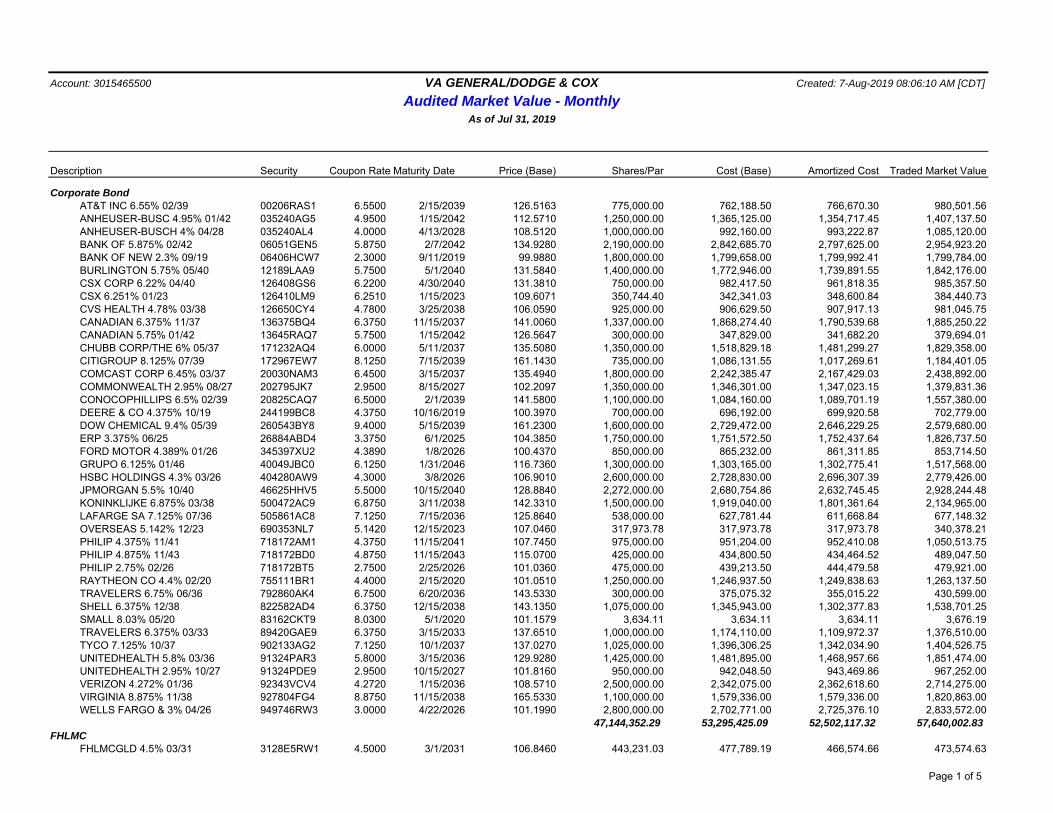
Account: 3015465500 VA GENERAL/DODGE & COX Created: 7-Aug-2019 08:06:10 AM [CDT]
Audited Market Value - MonthlyAs of Jul 31, 2019
Description Security Coupon Rate Maturity Date Price (Base) Shares/Par Cost (Base) Amortized Cost Traded Market Value
Corporate BondAT&T INC 6.55% 02/39 00206RAS1 6.5500 2/15/2039 126.5163 775,000.00 762,188.50 766,670.30 980,501.56ANHEUSER-BUSC 4.95% 01/42 035240AG5 4.9500 1/15/2042 112.5710 1,250,000.00 1,365,125.00 1,354,717.45 1,407,137.50ANHEUSER-BUSCH 4% 04/28 035240AL4 4.0000 4/13/2028 108.5120 1,000,000.00 992,160.00 993,222.87 1,085,120.00BANK OF 5.875% 02/42 06051GEN5 5.8750 2/7/2042 134.9280 2,190,000.00 2,842,685.70 2,797,625.00 2,954,923.20BANK OF NEW 2.3% 09/19 06406HCW7 2.3000 9/11/2019 99.9880 1,800,000.00 1,799,658.00 1,799,992.41 1,799,784.00BURLINGTON 5.75% 05/40 12189LAA9 5.7500 5/1/2040 131.5840 1,400,000.00 1,772,946.00 1,739,891.55 1,842,176.00CSX CORP 6.22% 04/40 126408GS6 6.2200 4/30/2040 131.3810 750,000.00 982,417.50 961,818.35 985,357.50CSX 6.251% 01/23 126410LM9 6.2510 1/15/2023 109.6071 350,744.40 342,341.03 348,600.84 384,440.73CVS HEALTH 4.78% 03/38 126650CY4 4.7800 3/25/2038 106.0590 925,000.00 906,629.50 907,917.13 981,045.75CANADIAN 6.375% 11/37 136375BQ4 6.3750 11/15/2037 141.0060 1,337,000.00 1,868,274.40 1,790,539.68 1,885,250.22CANADIAN 5.75% 01/42 13645RAQ7 5.7500 1/15/2042 126.5647 300,000.00 347,829.00 341,682.20 379,694.01CHUBB CORP/THE 6% 05/37 171232AQ4 6.0000 5/11/2037 135.5080 1,350,000.00 1,518,829.18 1,481,299.27 1,829,358.00CITIGROUP 8.125% 07/39 172967EW7 8.1250 7/15/2039 161.1430 735,000.00 1,086,131.55 1,017,269.61 1,184,401.05COMCAST CORP 6.45% 03/37 20030NAM3 6.4500 3/15/2037 135.4940 1,800,000.00 2,242,385.47 2,167,429.03 2,438,892.00COMMONWEALTH 2.95% 08/27 202795JK7 2.9500 8/15/2027 102.2097 1,350,000.00 1,346,301.00 1,347,023.15 1,379,831.36CONOCOPHILLIPS 6.5% 02/39 20825CAQ7 6.5000 2/1/2039 141.5800 1,100,000.00 1,084,160.00 1,089,701.19 1,557,380.00DEERE & CO 4.375% 10/19 244199BC8 4.3750 10/16/2019 100.3970 700,000.00 696,192.00 699,920.58 702,779.00DOW CHEMICAL 9.4% 05/39 260543BY8 9.4000 5/15/2039 161.2300 1,600,000.00 2,729,472.00 2,646,229.25 2,579,680.00ERP 3.375% 06/25 26884ABD4 3.3750 6/1/2025 104.3850 1,750,000.00 1,751,572.50 1,752,437.64 1,826,737.50FORD MOTOR 4.389% 01/26 345397XU2 4.3890 1/8/2026 100.4370 850,000.00 865,232.00 861,311.85 853,714.50GRUPO 6.125% 01/46 40049JBC0 6.1250 1/31/2046 116.7360 1,300,000.00 1,303,165.00 1,302,775.41 1,517,568.00HSBC HOLDINGS 4.3% 03/26 404280AW9 4.3000 3/8/2026 106.9010 2,600,000.00 2,728,830.00 2,696,307.39 2,779,426.00JPMORGAN 5.5% 10/40 46625HHV5 5.5000 10/15/2040 128.8840 2,272,000.00 2,680,754.86 2,632,745.45 2,928,244.48KONINKLIJKE 6.875% 03/38 500472AC9 6.8750 3/11/2038 142.3310 1,500,000.00 1,919,040.00 1,801,361.64 2,134,965.00LAFARGE SA 7.125% 07/36 505861AC8 7.1250 7/15/2036 125.8640 538,000.00 627,781.44 611,668.84 677,148.32OVERSEAS 5.142% 12/23 690353NL7 5.1420 12/15/2023 107.0460 317,973.78 317,973.78 317,973.78 340,378.21PHILIP 4.375% 11/41 718172AM1 4.3750 11/15/2041 107.7450 975,000.00 951,204.00 952,410.08 1,050,513.75PHILIP 4.875% 11/43 718172BD0 4.8750 11/15/2043 115.0700 425,000.00 434,800.50 434,464.52 489,047.50PHILIP 2.75% 02/26 718172BT5 2.7500 2/25/2026 101.0360 475,000.00 439,213.50 444,479.58 479,921.00RAYTHEON CO 4.4% 02/20 755111BR1 4.4000 2/15/2020 101.0510 1,250,000.00 1,246,937.50 1,249,838.63 1,263,137.50TRAVELERS 6.75% 06/36 792860AK4 6.7500 6/20/2036 143.5330 300,000.00 375,075.32 355,015.22 430,599.00SHELL 6.375% 12/38 822582AD4 6.3750 12/15/2038 143.1350 1,075,000.00 1,345,943.00 1,302,377.83 1,538,701.25SMALL 8.03% 05/20 83162CKT9 8.0300 5/1/2020 101.1579 3,634.11 3,634.11 3,634.11 3,676.19TRAVELERS 6.375% 03/33 89420GAE9 6.3750 3/15/2033 137.6510 1,000,000.00 1,174,110.00 1,109,972.37 1,376,510.00TYCO 7.125% 10/37 902133AG2 7.1250 10/1/2037 137.0270 1,025,000.00 1,396,306.25 1,342,034.90 1,404,526.75UNITEDHEALTH 5.8% 03/36 91324PAR3 5.8000 3/15/2036 129.9280 1,425,000.00 1,481,895.00 1,468,957.66 1,851,474.00UNITEDHEALTH 2.95% 10/27 91324PDE9 2.9500 10/15/2027 101.8160 950,000.00 942,048.50 943,469.86 967,252.00VERIZON 4.272% 01/36 92343VCV4 4.2720 1/15/2036 108.5710 2,500,000.00 2,342,075.00 2,362,618.60 2,714,275.00VIRGINIA 8.875% 11/38 927804FG4 8.8750 11/15/2038 165.5330 1,100,000.00 1,579,336.00 1,579,336.00 1,820,863.00WELLS FARGO & 3% 04/26 949746RW3 3.0000 4/22/2026 101.1990 2,800,000.00 2,702,771.00 2,725,376.10 2,833,572.00
47,144,352.29 53,295,425.09 52,502,117.32 57,640,002.83 FHLMC
FHLMCGLD 4.5% 03/31 3128E5RW1 4.5000 3/1/2031 106.8460 443,231.03 477,789.19 466,574.66 473,574.63
Page 1 of 5

Account: 3015465500 VA GENERAL/DODGE & COX Created: 7-Aug-2019 08:06:10 AM [CDT]
Audited Market Value - MonthlyAs of Jul 31, 2019
Description Security Coupon Rate Maturity Date Price (Base) Shares/Par Cost (Base) Amortized Cost Traded Market Value
FHLMCGLD 6% 02/22 3128MBJB4 6.0000 2/1/2022 102.5720 30,491.60 30,690.50 30,528.25 31,275.84FHLMCGLD 6% 03/23 3128MB5D5 6.0000 3/1/2023 102.6140 57,852.11 58,918.73 58,131.97 59,364.36FHLMCGLD 4% 05/27 3128MDKE2 4.0000 5/1/2027 104.0650 321,698.44 342,081.07 332,817.89 334,775.48FHLMCGLD 4.5% 01/44 3128MJT26 4.5000 1/1/2044 107.3320 275,980.12 294,910.63 291,536.85 296,214.98FHLMCGLD 4.5% 06/47 3128MJ2A7 4.5000 6/1/2047 105.6630 1,116,465.94 1,194,967.47 1,190,513.68 1,179,691.41FHLMCGLD 4.5% 08/48 3128MJ4S6 4.5000 8/1/2048 105.1570 2,727,907.95 2,831,370.13 2,829,849.79 2,868,586.16FHLMCGLD 4.5% 03/49 3128MJ6D7 4.5000 3/1/2049 104.8810 935,105.35 978,061.76 977,863.85 980,747.84FHLMCGLD 5.5% 10/20 3128M1PY9 5.5000 10/1/2020 100.6810 30,161.21 30,043.39 30,150.59 30,366.61FHLMCGLD 6.5% 01/38 3128M5QY9 6.5000 1/1/2038 115.9170 57,959.16 63,927.14 62,054.72 67,184.52FHLMCGLD 4.5% 05/41 3128M8P81 4.5000 5/1/2041 108.7180 373,733.89 402,114.32 396,673.42 406,316.01FHLMCGLD 4.5% 12/43 3128M9YH9 4.5000 12/1/2043 107.3990 155,611.05 167,962.67 165,919.62 167,124.71FHLMC MORTPASS FLT 08/36 3128S4EP8 4.2730 8/1/2036 103.5210 79,932.90 80,666.67 80,666.67 82,747.34FHLMCGLD 6.5% 10/37 3128UNDB5 6.5000 10/1/2037 111.1590 23,904.88 24,248.50 24,116.86 26,572.43FHLMCGLD 5.5% 03/34 31283HZ65 5.5000 3/1/2034 112.0570 106,024.78 112,245.46 109,854.11 118,808.19FHLMCGLD 5.5% 01/35 31283H5J0 5.5000 1/1/2035 112.0030 61,483.84 66,825.22 65,036.19 68,863.75FHLMCGLD 4.5% 09/40 312942NM3 4.5000 9/1/2040 107.9790 397,820.25 425,419.03 419,673.97 429,562.33FHLMC MORTPASS FLT 05/44 31300MNQ2 3.0920 5/1/2044 101.8370 647,417.15 670,279.07 670,279.07 659,310.20FHLMC MORTPASS FLT 11/44 31300MR39 2.9110 11/1/2044 101.6870 660,500.23 659,841.48 659,841.48 671,642.87FHLMC MORTPASS FLT 01/45 31300MVS9 3.0690 1/1/2045 101.9160 600,178.35 623,529.04 623,529.04 611,677.77FHLMCGLD 4.5% 10/48 3132LAJA1 4.5000 10/1/2048 105.2750 3,070,551.19 3,231,275.36 3,230,944.26 3,232,522.77FHLMCGLD 4.5% 05/47 3132L8RZ2 4.5000 5/1/2047 105.6720 2,998,026.14 3,223,580.74 3,209,004.26 3,168,074.18FHLMCGLD 4.5% 03/47 3132WLT71 4.5000 3/1/2047 100.0000 0.01 0.01 0.01 0.01FHLMCGLD 4.5% 05/47 3132WNEK4 4.5000 5/1/2047 105.6700 1,221,326.12 1,269,988.34 1,268,114.84 1,290,575.31FHLMC MORTPASS FLT 09/45 31326KCR6 2.9310 9/1/2045 101.2350 189,516.25 194,579.89 194,579.89 191,856.78FHLMCGLD 4.5% 07/42 31335BAP1 4.5000 7/1/2042 107.9100 4,380,145.79 4,726,451.07 4,695,998.87 4,726,615.32FHLMC MORTPASS FLT 10/34 31349UCV8 4.7380 10/1/2034 105.3820 183,723.85 178,987.21 178,987.21 193,611.87FHLMC MORTPASS FLT 03/35 31349UM54 4.7850 3/1/2035 105.0150 44,448.85 43,381.04 43,381.04 46,677.96
21,191,198.43 22,404,135.13 22,306,623.06 22,414,341.63 FNMA
UMBS MORTPASS 6.5% 11/32 31371KVH1 6.5000 11/1/2032 113.7700 29,884.64 31,084.69 30,475.83 33,999.75UMBS MORTPASS 7% 08/37 31371NH40 7.0000 8/1/2037 115.2810 25,748.04 26,981.13 26,525.92 29,682.60UMBS MORTPASS 7% 11/37 31371NNA9 7.0000 11/1/2037 116.1770 31,381.46 32,989.78 32,404.72 36,458.04UMBS MORTPASS 6.5% 02/38 31374CL53 6.5000 2/1/2038 114.6070 21,913.06 24,073.53 23,383.51 25,113.90UMBS MORTPASS 5% 09/25 3138EJWC8 5.0000 9/1/2025 103.3410 199,265.27 216,856.65 207,717.85 205,922.72UMBS MORTPASS 6% 07/39 3138EK7L3 6.0000 7/1/2039 113.7400 546,456.23 605,200.26 592,133.61 621,539.32UMBS MORTPASS 4.5% 01/32 3138EMBT7 4.5000 1/1/2032 106.7590 178,150.81 191,651.31 187,578.38 190,192.02FNMA MORTPASS FLT 02/44 3138EMRA1 2.9570 2/1/2044 101.7460 180,633.11 187,237.50 187,237.50 183,786.97UMBS MORTPASS 5% 09/39 3138EM5Y3 5.0000 9/1/2039 109.5880 921,628.18 1,015,519.06 996,863.69 1,009,993.89UMBS MORTPASS 4.5% 09/41 3138ENBK4 4.5000 9/1/2041 107.9170 265,528.06 288,803.25 284,519.99 286,549.92UMBS MORTPASS 3.5% 12/29 3138EQAF9 3.5000 12/1/2029 103.6380 277,997.39 292,939.74 288,919.49 288,110.94FNMA MORTPASS FLT 10/45 3138EQTS1 2.8300 10/1/2045 101.1100 1,025,873.60 1,047,793.63 1,047,793.63 1,037,260.80UMBS MORTPASS 4.5% 02/46 3138EREA4 4.5000 2/1/2046 107.8910 2,448,241.41 2,687,709.99 2,665,681.46 2,641,432.14FNMA MORTPASS FLT 07/46 3138ET4D5 2.5740 7/1/2046 100.6070 595,691.40 611,281.77 611,281.77 599,307.25FNMA MORTPASS 3.14% 12/31 3138LGAK2 3.1400 12/1/2031 103.9930 1,715,000.00 1,688,739.06 1,688,739.06 1,783,479.95
Page 2 of 5
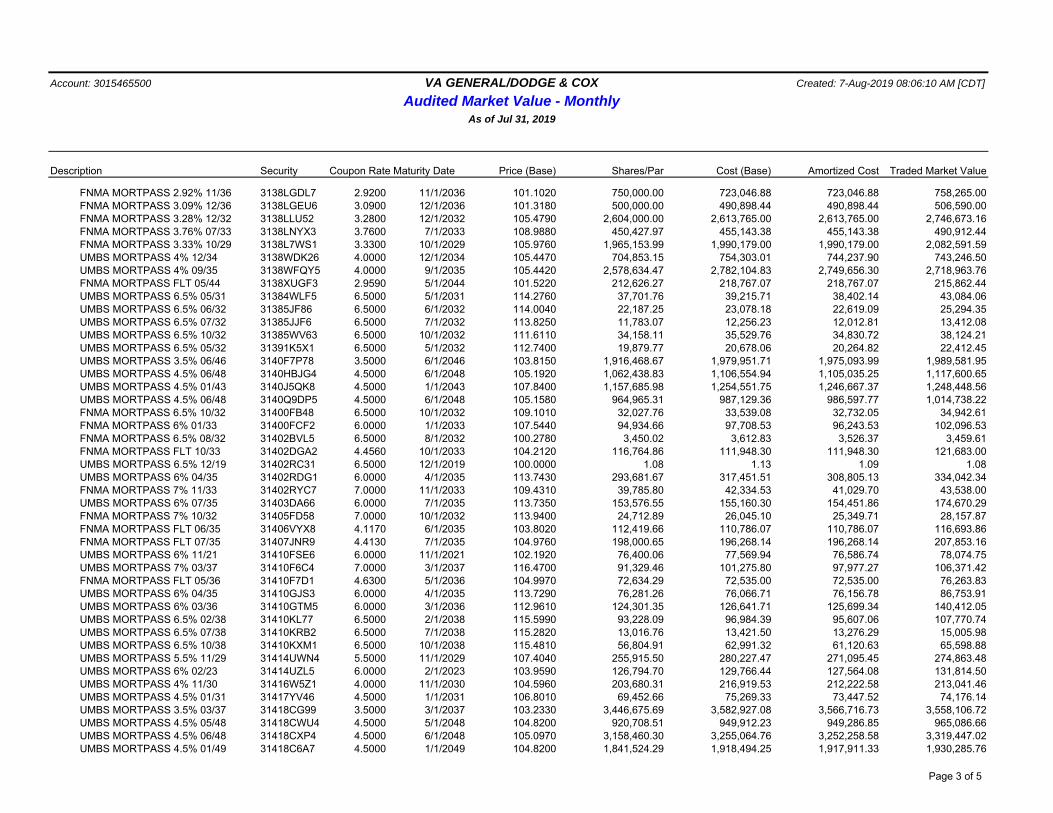
Account: 3015465500 VA GENERAL/DODGE & COX Created: 7-Aug-2019 08:06:10 AM [CDT]
Audited Market Value - MonthlyAs of Jul 31, 2019
Description Security Coupon Rate Maturity Date Price (Base) Shares/Par Cost (Base) Amortized Cost Traded Market Value
FNMA MORTPASS 2.92% 11/36 3138LGDL7 2.9200 11/1/2036 101.1020 750,000.00 723,046.88 723,046.88 758,265.00FNMA MORTPASS 3.09% 12/36 3138LGEU6 3.0900 12/1/2036 101.3180 500,000.00 490,898.44 490,898.44 506,590.00FNMA MORTPASS 3.28% 12/32 3138LLU52 3.2800 12/1/2032 105.4790 2,604,000.00 2,613,765.00 2,613,765.00 2,746,673.16FNMA MORTPASS 3.76% 07/33 3138LNYX3 3.7600 7/1/2033 108.9880 450,427.97 455,143.38 455,143.38 490,912.44FNMA MORTPASS 3.33% 10/29 3138L7WS1 3.3300 10/1/2029 105.9760 1,965,153.99 1,990,179.00 1,990,179.00 2,082,591.59UMBS MORTPASS 4% 12/34 3138WDK26 4.0000 12/1/2034 105.4470 704,853.15 754,303.01 744,237.90 743,246.50UMBS MORTPASS 4% 09/35 3138WFQY5 4.0000 9/1/2035 105.4420 2,578,634.47 2,782,104.83 2,749,656.30 2,718,963.76FNMA MORTPASS FLT 05/44 3138XUGF3 2.9590 5/1/2044 101.5220 212,626.27 218,767.07 218,767.07 215,862.44UMBS MORTPASS 6.5% 05/31 31384WLF5 6.5000 5/1/2031 114.2760 37,701.76 39,215.71 38,402.14 43,084.06UMBS MORTPASS 6.5% 06/32 31385JF86 6.5000 6/1/2032 114.0040 22,187.25 23,078.18 22,619.09 25,294.35UMBS MORTPASS 6.5% 07/32 31385JJF6 6.5000 7/1/2032 113.8250 11,783.07 12,256.23 12,012.81 13,412.08UMBS MORTPASS 6.5% 10/32 31385WV63 6.5000 10/1/2032 111.6110 34,158.11 35,529.76 34,830.72 38,124.21UMBS MORTPASS 6.5% 05/32 31391K5X1 6.5000 5/1/2032 112.7400 19,879.77 20,678.06 20,264.82 22,412.45UMBS MORTPASS 3.5% 06/46 3140F7P78 3.5000 6/1/2046 103.8150 1,916,468.67 1,979,951.71 1,975,093.99 1,989,581.95UMBS MORTPASS 4.5% 06/48 3140HBJG4 4.5000 6/1/2048 105.1920 1,062,438.83 1,106,554.94 1,105,035.25 1,117,600.65UMBS MORTPASS 4.5% 01/43 3140J5QK8 4.5000 1/1/2043 107.8400 1,157,685.98 1,254,551.75 1,246,667.37 1,248,448.56UMBS MORTPASS 4.5% 06/48 3140Q9DP5 4.5000 6/1/2048 105.1580 964,965.31 987,129.36 986,597.77 1,014,738.22FNMA MORTPASS 6.5% 10/32 31400FB48 6.5000 10/1/2032 109.1010 32,027.76 33,539.08 32,732.05 34,942.61FNMA MORTPASS 6% 01/33 31400FCF2 6.0000 1/1/2033 107.5440 94,934.66 97,708.53 96,243.53 102,096.53FNMA MORTPASS 6.5% 08/32 31402BVL5 6.5000 8/1/2032 100.2780 3,450.02 3,612.83 3,526.37 3,459.61FNMA MORTPASS FLT 10/33 31402DGA2 4.4560 10/1/2033 104.2120 116,764.86 111,948.30 111,948.30 121,683.00UMBS MORTPASS 6.5% 12/19 31402RC31 6.5000 12/1/2019 100.0000 1.08 1.13 1.09 1.08UMBS MORTPASS 6% 04/35 31402RDG1 6.0000 4/1/2035 113.7430 293,681.67 317,451.51 308,805.13 334,042.34FNMA MORTPASS 7% 11/33 31402RYC7 7.0000 11/1/2033 109.4310 39,785.80 42,334.53 41,029.70 43,538.00UMBS MORTPASS 6% 07/35 31403DA66 6.0000 7/1/2035 113.7350 153,576.55 155,160.30 154,451.86 174,670.29FNMA MORTPASS 7% 10/32 31405FD58 7.0000 10/1/2032 113.9400 24,712.89 26,045.10 25,349.71 28,157.87FNMA MORTPASS FLT 06/35 31406VYX8 4.1170 6/1/2035 103.8020 112,419.66 110,786.07 110,786.07 116,693.86FNMA MORTPASS FLT 07/35 31407JNR9 4.4130 7/1/2035 104.9760 198,000.65 196,268.14 196,268.14 207,853.16UMBS MORTPASS 6% 11/21 31410FSE6 6.0000 11/1/2021 102.1920 76,400.06 77,569.94 76,586.74 78,074.75UMBS MORTPASS 7% 03/37 31410F6C4 7.0000 3/1/2037 116.4700 91,329.46 101,275.80 97,977.27 106,371.42FNMA MORTPASS FLT 05/36 31410F7D1 4.6300 5/1/2036 104.9970 72,634.29 72,535.00 72,535.00 76,263.83UMBS MORTPASS 6% 04/35 31410GJS3 6.0000 4/1/2035 113.7290 76,281.26 76,066.71 76,156.78 86,753.91UMBS MORTPASS 6% 03/36 31410GTM5 6.0000 3/1/2036 112.9610 124,301.35 126,641.71 125,699.34 140,412.05UMBS MORTPASS 6.5% 02/38 31410KL77 6.5000 2/1/2038 115.5990 93,228.09 96,984.39 95,607.06 107,770.74UMBS MORTPASS 6.5% 07/38 31410KRB2 6.5000 7/1/2038 115.2820 13,016.76 13,421.50 13,276.29 15,005.98UMBS MORTPASS 6.5% 10/38 31410KXM1 6.5000 10/1/2038 115.4810 56,804.91 62,991.32 61,120.63 65,598.88UMBS MORTPASS 5.5% 11/29 31414UWN4 5.5000 11/1/2029 107.4040 255,915.50 280,227.47 271,095.45 274,863.48UMBS MORTPASS 6% 02/23 31414UZL5 6.0000 2/1/2023 103.9590 126,794.70 129,766.44 127,564.08 131,814.50UMBS MORTPASS 4% 11/30 31416W5Z1 4.0000 11/1/2030 104.5960 203,680.31 216,919.53 212,222.58 213,041.46UMBS MORTPASS 4.5% 01/31 31417YV46 4.5000 1/1/2031 106.8010 69,452.66 75,269.33 73,447.52 74,176.14UMBS MORTPASS 3.5% 03/37 31418CG99 3.5000 3/1/2037 103.2330 3,446,675.69 3,582,927.08 3,566,716.73 3,558,106.72UMBS MORTPASS 4.5% 05/48 31418CWU4 4.5000 5/1/2048 104.8200 920,708.51 949,912.23 949,286.85 965,086.66UMBS MORTPASS 4.5% 06/48 31418CXP4 4.5000 6/1/2048 105.0970 3,158,460.30 3,255,064.76 3,252,258.58 3,319,447.02UMBS MORTPASS 4.5% 01/49 31418C6A7 4.5000 1/1/2049 104.8200 1,841,524.29 1,918,494.25 1,917,911.33 1,930,285.76
Page 3 of 5

Account: 3015465500 VA GENERAL/DODGE & COX Created: 7-Aug-2019 08:06:10 AM [CDT]
Audited Market Value - MonthlyAs of Jul 31, 2019
Description Security Coupon Rate Maturity Date Price (Base) Shares/Par Cost (Base) Amortized Cost Traded Market Value
UMBS MORTPASS 6.5% 08/39 31418MEC2 6.5000 8/1/2039 115.7730 63,544.69 69,188.16 67,501.86 73,567.59UMBS MORTPASS 5.5% 09/38 31418MGG1 5.5000 9/1/2038 111.9540 175,916.19 193,755.19 188,981.27 196,945.21UMBS MORTPASS 6% 08/37 31418MG30 6.0000 8/1/2037 113.7360 304,022.44 321,313.73 315,336.35 345,782.96UMBS MORTPASS 5.5% 04/37 31418MH39 5.5000 4/1/2037 110.7460 113,583.02 121,853.26 119,102.28 125,788.65UMBS MORTPASS 7% 12/38 31418MKY7 7.0000 12/1/2038 117.1780 87,017.20 94,604.01 92,114.85 101,965.01FNMA MORTPASS 5.5% 02/38 31419AJ99 5.5000 2/1/2038 108.7230 95,587.38 102,233.69 100,118.67 103,925.47UMBS MORTPASS 6.5% 01/39 31419AP43 6.5000 1/1/2039 115.0670 114,072.58 127,101.82 123,258.74 131,259.90UMBS MORTPASS 5.5% 09/24 31419AQZ3 5.5000 9/1/2024 102.2530 43,864.19 47,332.21 45,173.83 44,852.45UMBS MORTPASS 5.5% 01/25 31419A6M4 5.5000 1/1/2025 103.7080 90,629.89 97,894.45 93,547.92 93,990.45
36,241,158.59 37,742,214.16 37,514,214.29 38,276,920.97 Government Bond
PETROLEOS 6.625% 06/35 706451BG5 6.6250 6/15/2035 93.3250 1,505,000.00 1,746,275.00 1,689,958.90 1,404,541.25PETROLEOS 6.75% 09/47 71654QCC4 6.7500 9/21/2047 90.6400 425,000.00 396,716.25 397,673.85 385,220.00PETROLEOS 6.5% 03/27 71654QCG5 6.5000 3/13/2027 99.1700 900,000.00 912,150.00 910,756.80 892,530.00
2,830,000.00 3,055,141.25 2,998,389.55 2,682,291.25 GNMA1 (15 Day Lag)
GNMA I 7.9% 10/21 36225BJR0 7.9000 10/15/2021 100.8040 8,986.06 9,008.53 8,989.12 9,058.318,986.06 9,008.53 8,989.12 9,058.31
Municipal BondCALIFORNIA ST 7.5% 04/34 13063A5E0 7.5000 4/1/2034 149.9400 1,775,000.00 1,841,944.60 1,816,051.68 2,661,435.00CALIFORNIA 7.625% 03/40 13063BFR8 7.6250 3/1/2040 159.5820 200,000.00 293,384.00 284,259.06 319,164.00LOS ANGELES 5.75% 07/34 544646XZ0 5.7500 7/1/2034 128.0130 2,250,000.00 2,202,877.69 2,231,750.64 2,880,292.50
4,225,000.00 4,338,206.29 4,332,061.38 5,860,891.50 Money Market
INVESCO VAR 12/99 00499KPA5 2.1572 12/31/2099 100.0000 2,910,387.24 2,910,387.24 2,910,387.24 2,910,387.242,910,387.24 2,910,387.24 2,910,387.24 2,910,387.24
Mortgage RelatedBNSF 5.996% 04/24 05568YAA6 5.9960 4/1/2024 109.0806 338,997.54 338,997.54 338,997.54 369,780.48BURLINGTON 7.57% 01/21 12189PAF9 7.5700 1/2/2021 102.5143 60,932.44 69,739.31 62,089.56 62,464.45BURLINGTON 8.251% 01/21 12189PAG7 8.2510 1/15/2021 103.1560 79,709.74 88,466.56 80,796.30 82,225.38FNMA REMICS FLT 12/43 3136AHPA2 2.8660 12/25/2043 100.3595 2,115,724.74 2,120,022.28 2,120,022.28 2,123,331.19FANNIE MAE-ACES VAR 04/29 3136AWWF0 3.1770 4/25/2029 104.9652 700,000.00 705,299.98 705,299.98 734,756.26FHLMC REMICS VAR 03/44 3137B8LR6 4.5000 3/15/2044 109.0887 674,859.96 757,741.19 757,741.19 736,196.29FREDDIE MAC VAR 09/43 31392W7B0 6.5000 9/25/2043 116.7413 268,222.36 272,383.08 272,383.08 313,126.19FNMA TRUST 6.5% 09/42 31393BU94 6.5000 9/25/2042 113.3079 174,687.71 179,321.03 177,644.69 197,935.03FNMA TRUST 7% 08/44 31394BZ80 7.0000 8/25/2044 116.1214 110,617.23 117,280.18 114,934.91 128,450.28SEASONED 4.5% 06/57 35563PCS6 4.5000 6/25/2057 107.4917 1,132,372.14 1,240,079.18 1,235,922.69 1,217,205.84GNMA 2017-H20 FLT 10/67 38375UQ29 3.0700 10/20/2067 98.9504 958,417.60 958,417.60 958,417.60 948,358.43GNMA 2018-H05 FLT 02/68 38380LAC7 3.0606 2/20/2068 98.3461 1,100,122.60 1,098,250.30 1,098,250.30 1,081,927.45GNMA 2018-H08 FLT 06/68 38380LDF7 2.8669 6/20/2068 98.2599 1,575,473.32 1,569,305.49 1,569,305.49 1,548,058.98GNMA 2018-H09 FLT 04/68 38380LFE8 3.2369 4/20/2068 100.5019 2,444,697.12 2,464,942.27 2,464,942.27 2,456,966.57NEW VALLEY 4.929% 01/21 64908QAA9 4.9290 1/15/2021 102.8981 167,254.70 167,254.70 167,254.70 172,101.98UNITED STATES 4.72% 02/24 83162CNN9 4.7200 2/1/2024 103.3990 65,748.70 63,848.16 65,236.46 67,983.50UNITED STATES 4.88% 11/24 83162CPD9 4.8800 11/1/2024 104.4670 82,974.68 82,974.68 82,974.68 86,681.16
Page 4 of 5

Account: 3015465500 VA GENERAL/DODGE & COX Created: 7-Aug-2019 08:06:10 AM [CDT]
Audited Market Value - MonthlyAs of Jul 31, 2019
Description Security Coupon Rate Maturity Date Price (Base) Shares/Par Cost (Base) Amortized Cost Traded Market Value
UNION 4.698% 01/24 90783SAA0 4.6980 1/2/2024 104.9453 239,472.57 223,214.77 235,783.68 251,315.16UNION 5.082% 01/29 90783VAA3 5.0820 1/2/2029 107.9776 443,919.14 427,986.31 436,210.38 479,333.10UNION 6.176% 01/31 90783XAA9 6.1760 1/2/2031 115.4166 299,264.34 299,264.34 299,264.34 345,400.64
13,033,468.63 13,244,788.95 13,243,472.12 13,403,598.36 T-Note
UNITED 1.625% 02/26 912828P46 1.6250 2/15/2026 98.1640 3,000,000.00 2,879,605.83 2,879,605.83 2,944,920.00UNITED STATES 2% 11/26 912828U24 2.0000 11/15/2026 100.3750 8,100,000.00 7,790,813.84 7,790,813.84 8,130,375.00UNITED 2.125% 05/25 912828XB1 2.1250 5/15/2025 101.2660 10,580,000.00 10,423,582.70 10,423,582.70 10,713,942.80UNITED STATES 1.5% 08/26 9128282A7 1.5000 8/15/2026 97.1170 8,935,000.00 8,735,472.56 8,735,472.56 8,677,403.95UNITED STATES 3% 10/25 9128285J5 3.0000 10/31/2025 106.3750 6,900,000.00 6,922,656.25 6,922,656.25 7,339,875.00UNITED 3.125% 11/28 9128285M8 3.1250 11/15/2028 109.4109 3,450,000.00 3,566,212.89 3,566,212.89 3,774,677.43UNITED 2.625% 02/29 9128286B1 2.6250 2/15/2029 105.2150 4,500,000.00 4,548,867.19 4,548,867.19 4,734,675.00
45,465,000.00 44,867,211.26 44,867,211.26 46,315,869.18 T-Bond
UNITED 2.75% 08/42 912810QX9 2.7500 8/15/2042 104.9391 3,560,000.00 3,362,277.48 3,362,277.48 3,735,830.54UNITED 3.625% 08/43 912810RC4 3.6250 8/15/2043 120.6910 2,600,000.00 2,561,467.34 2,561,467.34 3,137,966.00UNITED 2.75% 11/47 912810RZ3 2.7500 11/15/2047 104.3090 3,870,000.00 3,650,999.23 3,650,999.23 4,036,758.30UNITED 2.875% 05/49 912810SH2 2.8750 5/15/2049 107.2700 870,000.00 909,000.35 909,000.35 933,249.00
10,900,000.00 10,483,744.40 10,483,744.40 11,843,803.84 Totals $183,949,551.24 $192,350,262.30 $191,167,209.74 $201,357,165.11
Page 5 of 5
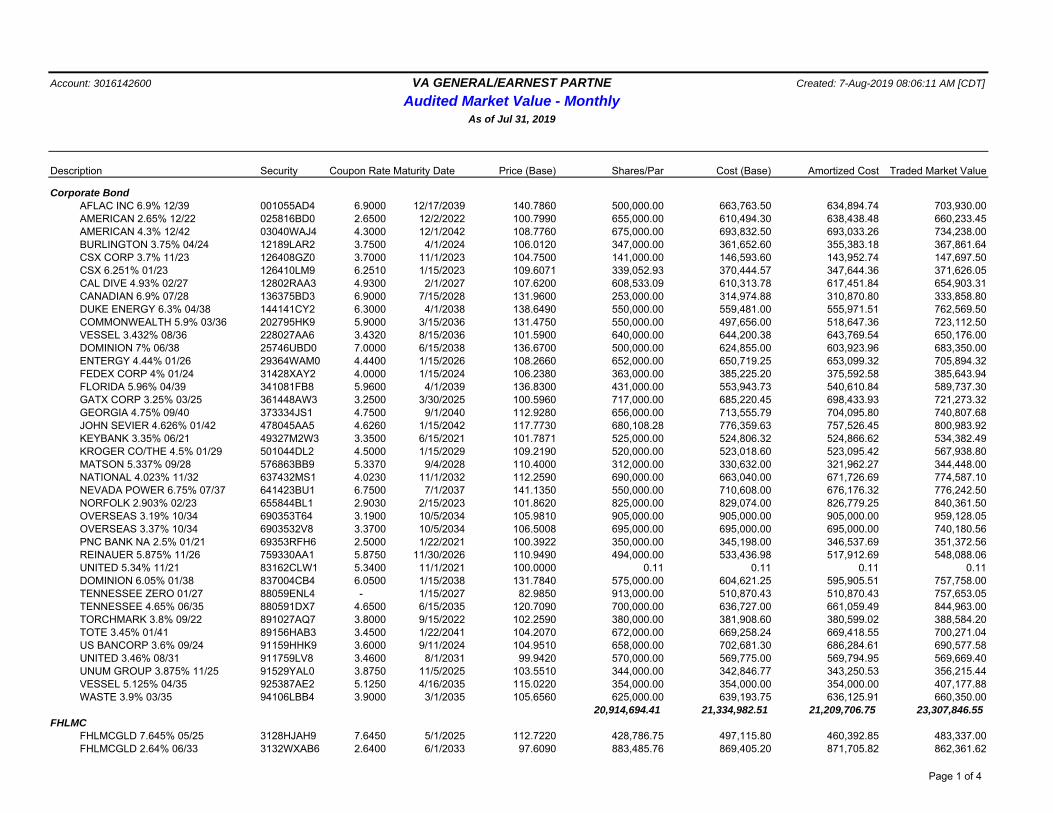
Account: 3016142600 VA GENERAL/EARNEST PARTNE Created: 7-Aug-2019 08:06:11 AM [CDT]
Audited Market Value - MonthlyAs of Jul 31, 2019
Description Security Coupon Rate Maturity Date Price (Base) Shares/Par Cost (Base) Amortized Cost Traded Market Value
Corporate BondAFLAC INC 6.9% 12/39 001055AD4 6.9000 12/17/2039 140.7860 500,000.00 663,763.50 634,894.74 703,930.00AMERICAN 2.65% 12/22 025816BD0 2.6500 12/2/2022 100.7990 655,000.00 610,494.30 638,438.48 660,233.45AMERICAN 4.3% 12/42 03040WAJ4 4.3000 12/1/2042 108.7760 675,000.00 693,832.50 693,033.26 734,238.00BURLINGTON 3.75% 04/24 12189LAR2 3.7500 4/1/2024 106.0120 347,000.00 361,652.60 355,383.18 367,861.64CSX CORP 3.7% 11/23 126408GZ0 3.7000 11/1/2023 104.7500 141,000.00 146,593.60 143,952.74 147,697.50CSX 6.251% 01/23 126410LM9 6.2510 1/15/2023 109.6071 339,052.93 370,444.57 347,644.36 371,626.05CAL DIVE 4.93% 02/27 12802RAA3 4.9300 2/1/2027 107.6200 608,533.09 610,313.78 617,451.84 654,903.31CANADIAN 6.9% 07/28 136375BD3 6.9000 7/15/2028 131.9600 253,000.00 314,974.88 310,870.80 333,858.80DUKE ENERGY 6.3% 04/38 144141CY2 6.3000 4/1/2038 138.6490 550,000.00 559,481.00 555,971.51 762,569.50COMMONWEALTH 5.9% 03/36 202795HK9 5.9000 3/15/2036 131.4750 550,000.00 497,656.00 518,647.36 723,112.50VESSEL 3.432% 08/36 228027AA6 3.4320 8/15/2036 101.5900 640,000.00 644,200.38 643,769.54 650,176.00DOMINION 7% 06/38 25746UBD0 7.0000 6/15/2038 136.6700 500,000.00 624,855.00 603,923.96 683,350.00ENTERGY 4.44% 01/26 29364WAM0 4.4400 1/15/2026 108.2660 652,000.00 650,719.25 653,099.32 705,894.32FEDEX CORP 4% 01/24 31428XAY2 4.0000 1/15/2024 106.2380 363,000.00 385,225.20 375,592.58 385,643.94FLORIDA 5.96% 04/39 341081FB8 5.9600 4/1/2039 136.8300 431,000.00 553,943.73 540,610.84 589,737.30GATX CORP 3.25% 03/25 361448AW3 3.2500 3/30/2025 100.5960 717,000.00 685,220.45 698,433.93 721,273.32GEORGIA 4.75% 09/40 373334JS1 4.7500 9/1/2040 112.9280 656,000.00 713,555.79 704,095.80 740,807.68JOHN SEVIER 4.626% 01/42 478045AA5 4.6260 1/15/2042 117.7730 680,108.28 776,359.63 757,526.45 800,983.92KEYBANK 3.35% 06/21 49327M2W3 3.3500 6/15/2021 101.7871 525,000.00 524,806.32 524,866.62 534,382.49KROGER CO/THE 4.5% 01/29 501044DL2 4.5000 1/15/2029 109.2190 520,000.00 523,018.60 523,095.42 567,938.80MATSON 5.337% 09/28 576863BB9 5.3370 9/4/2028 110.4000 312,000.00 330,632.00 321,962.27 344,448.00NATIONAL 4.023% 11/32 637432MS1 4.0230 11/1/2032 112.2590 690,000.00 663,040.00 671,726.69 774,587.10NEVADA POWER 6.75% 07/37 641423BU1 6.7500 7/1/2037 141.1350 550,000.00 710,608.00 676,176.32 776,242.50NORFOLK 2.903% 02/23 655844BL1 2.9030 2/15/2023 101.8620 825,000.00 829,074.00 826,779.25 840,361.50OVERSEAS 3.19% 10/34 690353T64 3.1900 10/5/2034 105.9810 905,000.00 905,000.00 905,000.00 959,128.05OVERSEAS 3.37% 10/34 6903532V8 3.3700 10/5/2034 106.5008 695,000.00 695,000.00 695,000.00 740,180.56PNC BANK NA 2.5% 01/21 69353RFH6 2.5000 1/22/2021 100.3922 350,000.00 345,198.00 346,537.69 351,372.56REINAUER 5.875% 11/26 759330AA1 5.8750 11/30/2026 110.9490 494,000.00 533,436.98 517,912.69 548,088.06UNITED 5.34% 11/21 83162CLW1 5.3400 11/1/2021 100.0000 0.11 0.11 0.11 0.11DOMINION 6.05% 01/38 837004CB4 6.0500 1/15/2038 131.7840 575,000.00 604,621.25 595,905.51 757,758.00TENNESSEE ZERO 01/27 88059ENL4 - 1/15/2027 82.9850 913,000.00 510,870.43 510,870.43 757,653.05TENNESSEE 4.65% 06/35 880591DX7 4.6500 6/15/2035 120.7090 700,000.00 636,727.00 661,059.49 844,963.00TORCHMARK 3.8% 09/22 891027AQ7 3.8000 9/15/2022 102.2590 380,000.00 381,908.60 380,599.02 388,584.20TOTE 3.45% 01/41 89156HAB3 3.4500 1/22/2041 104.2070 672,000.00 669,258.24 669,418.55 700,271.04US BANCORP 3.6% 09/24 91159HHK9 3.6000 9/11/2024 104.9510 658,000.00 702,681.30 686,284.61 690,577.58UNITED 3.46% 08/31 911759LV8 3.4600 8/1/2031 99.9420 570,000.00 569,775.00 569,794.95 569,669.40UNUM GROUP 3.875% 11/25 91529YAL0 3.8750 11/5/2025 103.5510 344,000.00 342,846.77 343,250.53 356,215.44VESSEL 5.125% 04/35 925387AE2 5.1250 4/16/2035 115.0220 354,000.00 354,000.00 354,000.00 407,177.88WASTE 3.9% 03/35 94106LBB4 3.9000 3/1/2035 105.6560 625,000.00 639,193.75 636,125.91 660,350.00
20,914,694.41 21,334,982.51 21,209,706.75 23,307,846.55 FHLMC
FHLMCGLD 7.645% 05/25 3128HJAH9 7.6450 5/1/2025 112.7220 428,786.75 497,115.80 460,392.85 483,337.00FHLMCGLD 2.64% 06/33 3132WXAB6 2.6400 6/1/2033 97.6090 883,485.76 869,405.20 871,705.82 862,361.62
Page 1 of 4

Account: 3016142600 VA GENERAL/EARNEST PARTNE Created: 7-Aug-2019 08:06:11 AM [CDT]
Audited Market Value - MonthlyAs of Jul 31, 2019
Description Security Coupon Rate Maturity Date Price (Base) Shares/Par Cost (Base) Amortized Cost Traded Market Value
1,312,272.51 1,366,521.00 1,332,098.67 1,345,698.62 FNMA
UMBS MORTPASS 3% 03/42 3138EBPJ8 3.0000 3/1/2042 101.8960 457,853.67 444,690.38 447,145.06 466,534.58FNMA MORTPASS 3.54% 06/45 3138LACD9 3.5400 6/1/2045 103.5860 650,750.95 643,429.99 643,568.38 674,086.88FNMA MORTPASS 3.75% 12/37 3138LGJT4 3.7500 12/1/2037 108.0020 744,979.24 734,735.77 735,384.22 804,592.48FNMA MORTPASS 3.22% 07/32 3138LJWG1 3.2200 7/1/2032 104.5810 783,930.75 821,504.31 821,424.81 819,842.62UMBS MORTPASS 3.5% 06/42 3138LUSZ9 3.5000 6/1/2042 104.1900 160,873.86 167,785.66 166,635.97 167,614.47UMBS MORTPASS 3.5% 02/45 3138WD2R1 3.5000 2/1/2045 103.9150 500,996.85 532,465.71 529,225.86 520,610.88UMBS MORTPASS 3.5% 08/45 3138WFKJ4 3.5000 8/1/2045 103.3350 718,620.68 750,424.73 747,063.29 742,586.68UMBS MORTPASS 3.5% 04/43 3138WMW49 3.5000 4/1/2043 104.2050 389,428.69 393,140.47 392,458.97 405,804.17UMBS MORTPASS 3% 07/43 3138X0Y28 3.0000 7/1/2043 101.8980 1,099,848.09 1,120,761.09 1,117,943.69 1,120,723.21UMBS MORTPASS 4% 10/43 3138X6P66 4.0000 10/1/2043 105.8030 319,187.45 334,598.20 331,706.50 337,709.90UMBS MORTPASS 3.5% 02/45 3138Y9RV2 3.5000 2/1/2045 103.5310 1,377,052.50 1,404,424.92 1,401,870.28 1,425,676.22FNMA MORTPASS 5.06% 01/30 31381LQS9 5.0600 1/1/2030 118.3480 1,029,199.81 1,057,824.45 1,044,369.36 1,218,037.39FNMA MORTPASS 4.96% 06/30 31381MR56 4.9600 6/1/2030 115.1460 571,945.13 667,745.93 648,771.37 658,571.94FNMA MORTPASS 4.68% 08/28 31381NKY8 4.6800 8/1/2028 112.9290 516,325.75 524,554.69 520,632.60 583,081.51FNMA MORTPASS 5.62% 06/41 31381RFK5 5.6200 6/1/2041 122.0940 662,348.50 680,770.10 675,894.29 808,687.78FNMA MORTPASS 3.49% 07/30 31381VD36 3.4900 7/1/2030 107.0610 605,147.93 631,150.41 621,135.23 647,877.43FNMA MORTPASS 3.3% 07/32 31381VHP3 3.3000 7/1/2032 105.6090 1,159,300.39 1,197,702.23 1,184,456.68 1,224,325.55UMBS MORTPASS 4% 01/46 3140EUE39 4.0000 1/1/2046 105.1810 743,499.71 796,938.76 791,262.50 782,020.43UMBS MORTPASS 4% 03/47 3140FE2P8 4.0000 3/1/2047 104.8400 1,316,094.65 1,362,363.60 1,361,800.90 1,379,793.63UMBS MORTPASS 3.5% 11/47 3140GUMA2 3.5000 11/1/2047 103.0960 1,215,508.52 1,251,071.63 1,249,106.43 1,253,140.66FNMA MORTPASS 5.26% 01/25 31409LGT6 5.2600 1/1/2025 104.6640 558,593.83 582,202.24 567,930.32 584,646.65FNMA MORTPASS 6% 10/37 31410GNB5 6.0000 10/1/2037 100.0000 0.02 0.02 0.02 0.02FNMA MORTPASS 5.03% 05/24 31413XU27 5.0300 5/1/2024 111.2000 925,026.81 979,109.91 961,459.24 1,028,629.81FNMA MORTPASS 4% 01/41 31416XHV5 4.0000 1/1/2041 105.5010 160,919.16 158,580.83 159,226.70 169,771.32UMBS MORTPASS 3.5% 05/43 31417GGC4 3.5000 5/1/2043 104.2070 388,916.56 387,397.38 387,676.86 405,278.28FNMA 4.785% 08/19 31418MFG2 4.7850 8/1/2019 99.8110 19,225.05 20,209.58 19,225.05 19,188.71FNMA 4.501% 01/20 31418M2U5 4.5010 1/1/2020 99.8920 190,966.60 196,621.02 191,232.29 190,760.36UMBS MORTPASS 4% 12/39 31419AGZ4 4.0000 12/1/2039 105.9540 379,930.46 391,120.59 388,680.59 402,551.52UMBS MORTPASS 4.5% 10/40 31419FU79 4.5000 10/1/2040 107.9090 146,567.95 155,583.57 153,443.81 158,160.01
17,793,039.56 18,388,908.17 18,260,731.27 19,000,305.09 Government Bond
STATE OF ZERO 02/24 465139RG0 - 2/15/2024 90.4670 1,500,000.00 793,230.00 793,230.00 1,357,005.001,500,000.00 793,230.00 793,230.00 1,357,005.00
GNMA1 (15 Day Lag)GNMA I MORTPASS 4% 01/29 3620ANRW2 4.0000 1/15/2029 101.4220 435,434.13 438,228.01 437,079.77 441,626.00GNMA I 3.85% 07/36 36230MFL6 3.8500 7/15/2036 107.6820 774,798.31 821,881.56 814,113.26 834,318.32
1,210,232.44 1,260,109.57 1,251,193.03 1,275,944.32 GNMA1 (20 Day Lag)
GNMA II 4.5% 04/35 36202EDD8 4.5000 4/20/2035 100.0000 0.03 0.03 0.03 0.03GNMA II 5.5% 05/35 36202EDQ9 5.5000 5/20/2035 110.9010 62,613.90 62,026.34 62,279.43 69,439.44GNMA II MORTPASS 5% 09/35 36202EE88 5.0000 9/20/2035 107.6970 38,050.02 37,246.57 37,601.11 40,978.73
100,663.95 99,272.94 99,880.57 110,418.20
Page 2 of 4
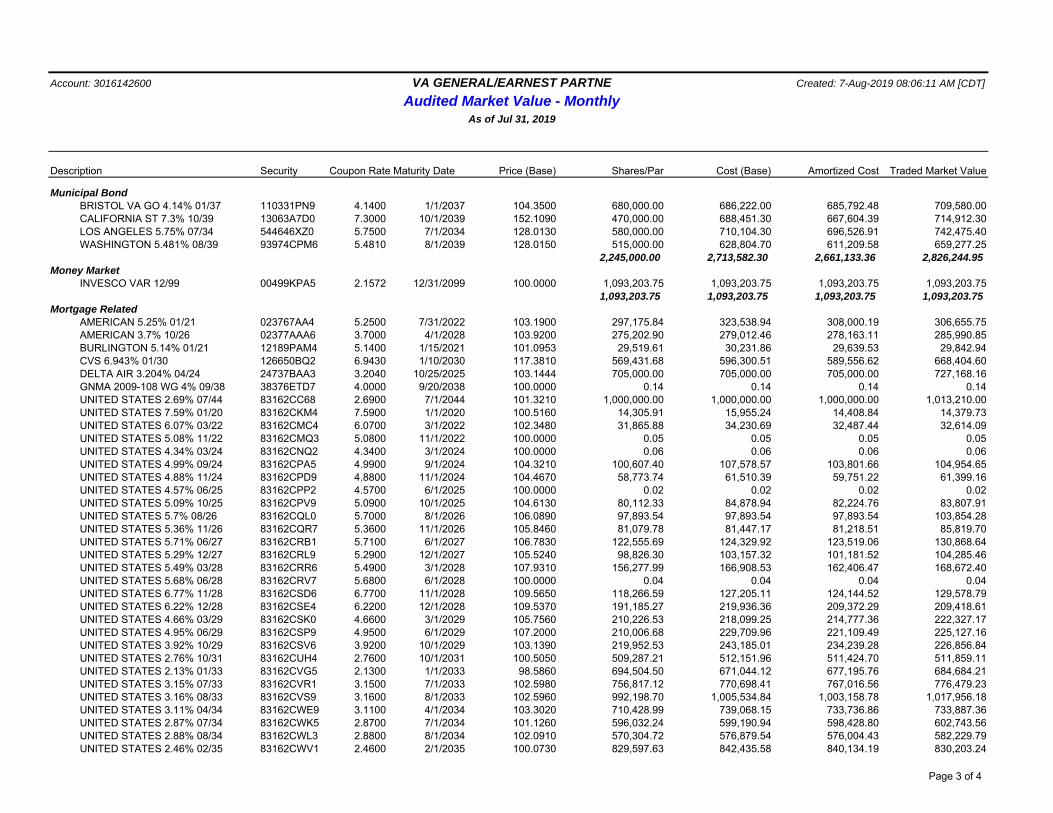
Account: 3016142600 VA GENERAL/EARNEST PARTNE Created: 7-Aug-2019 08:06:11 AM [CDT]
Audited Market Value - MonthlyAs of Jul 31, 2019
Description Security Coupon Rate Maturity Date Price (Base) Shares/Par Cost (Base) Amortized Cost Traded Market Value
Municipal BondBRISTOL VA GO 4.14% 01/37 110331PN9 4.1400 1/1/2037 104.3500 680,000.00 686,222.00 685,792.48 709,580.00CALIFORNIA ST 7.3% 10/39 13063A7D0 7.3000 10/1/2039 152.1090 470,000.00 688,451.30 667,604.39 714,912.30LOS ANGELES 5.75% 07/34 544646XZ0 5.7500 7/1/2034 128.0130 580,000.00 710,104.30 696,526.91 742,475.40WASHINGTON 5.481% 08/39 93974CPM6 5.4810 8/1/2039 128.0150 515,000.00 628,804.70 611,209.58 659,277.25
2,245,000.00 2,713,582.30 2,661,133.36 2,826,244.95 Money Market
INVESCO VAR 12/99 00499KPA5 2.1572 12/31/2099 100.0000 1,093,203.75 1,093,203.75 1,093,203.75 1,093,203.751,093,203.75 1,093,203.75 1,093,203.75 1,093,203.75
Mortgage RelatedAMERICAN 5.25% 01/21 023767AA4 5.2500 7/31/2022 103.1900 297,175.84 323,538.94 308,000.19 306,655.75AMERICAN 3.7% 10/26 02377AAA6 3.7000 4/1/2028 103.9200 275,202.90 279,012.46 278,163.11 285,990.85BURLINGTON 5.14% 01/21 12189PAM4 5.1400 1/15/2021 101.0953 29,519.61 30,231.86 29,639.53 29,842.94CVS 6.943% 01/30 126650BQ2 6.9430 1/10/2030 117.3810 569,431.68 596,300.51 589,556.62 668,404.60DELTA AIR 3.204% 04/24 24737BAA3 3.2040 10/25/2025 103.1444 705,000.00 705,000.00 705,000.00 727,168.16GNMA 2009-108 WG 4% 09/38 38376ETD7 4.0000 9/20/2038 100.0000 0.14 0.14 0.14 0.14UNITED STATES 2.69% 07/44 83162CC68 2.6900 7/1/2044 101.3210 1,000,000.00 1,000,000.00 1,000,000.00 1,013,210.00UNITED STATES 7.59% 01/20 83162CKM4 7.5900 1/1/2020 100.5160 14,305.91 15,955.24 14,408.84 14,379.73UNITED STATES 6.07% 03/22 83162CMC4 6.0700 3/1/2022 102.3480 31,865.88 34,230.69 32,487.44 32,614.09UNITED STATES 5.08% 11/22 83162CMQ3 5.0800 11/1/2022 100.0000 0.05 0.05 0.05 0.05UNITED STATES 4.34% 03/24 83162CNQ2 4.3400 3/1/2024 100.0000 0.06 0.06 0.06 0.06UNITED STATES 4.99% 09/24 83162CPA5 4.9900 9/1/2024 104.3210 100,607.40 107,578.57 103,801.66 104,954.65UNITED STATES 4.88% 11/24 83162CPD9 4.8800 11/1/2024 104.4670 58,773.74 61,510.39 59,751.22 61,399.16UNITED STATES 4.57% 06/25 83162CPP2 4.5700 6/1/2025 100.0000 0.02 0.02 0.02 0.02UNITED STATES 5.09% 10/25 83162CPV9 5.0900 10/1/2025 104.6130 80,112.33 84,878.94 82,224.76 83,807.91UNITED STATES 5.7% 08/26 83162CQL0 5.7000 8/1/2026 106.0890 97,893.54 97,893.54 97,893.54 103,854.28UNITED STATES 5.36% 11/26 83162CQR7 5.3600 11/1/2026 105.8460 81,079.78 81,447.17 81,218.51 85,819.70UNITED STATES 5.71% 06/27 83162CRB1 5.7100 6/1/2027 106.7830 122,555.69 124,329.92 123,519.06 130,868.64UNITED STATES 5.29% 12/27 83162CRL9 5.2900 12/1/2027 105.5240 98,826.30 103,157.32 101,181.52 104,285.46UNITED STATES 5.49% 03/28 83162CRR6 5.4900 3/1/2028 107.9310 156,277.99 166,908.53 162,406.47 168,672.40UNITED STATES 5.68% 06/28 83162CRV7 5.6800 6/1/2028 100.0000 0.04 0.04 0.04 0.04UNITED STATES 6.77% 11/28 83162CSD6 6.7700 11/1/2028 109.5650 118,266.59 127,205.11 124,144.52 129,578.79UNITED STATES 6.22% 12/28 83162CSE4 6.2200 12/1/2028 109.5370 191,185.27 219,936.36 209,372.29 209,418.61UNITED STATES 4.66% 03/29 83162CSK0 4.6600 3/1/2029 105.7560 210,226.53 218,099.25 214,777.36 222,327.17UNITED STATES 4.95% 06/29 83162CSP9 4.9500 6/1/2029 107.2000 210,006.68 229,709.96 221,109.49 225,127.16UNITED STATES 3.92% 10/29 83162CSV6 3.9200 10/1/2029 103.1390 219,952.53 243,185.01 234,239.28 226,856.84UNITED STATES 2.76% 10/31 83162CUH4 2.7600 10/1/2031 100.5050 509,287.21 512,151.96 511,424.70 511,859.11UNITED STATES 2.13% 01/33 83162CVG5 2.1300 1/1/2033 98.5860 694,504.50 671,044.12 677,195.76 684,684.21UNITED STATES 3.15% 07/33 83162CVR1 3.1500 7/1/2033 102.5980 756,817.12 770,698.41 767,016.56 776,479.23UNITED STATES 3.16% 08/33 83162CVS9 3.1600 8/1/2033 102.5960 992,198.70 1,005,534.84 1,003,158.78 1,017,956.18UNITED STATES 3.11% 04/34 83162CWE9 3.1100 4/1/2034 103.3020 710,428.99 739,068.15 733,736.86 733,887.36UNITED STATES 2.87% 07/34 83162CWK5 2.8700 7/1/2034 101.1260 596,032.24 599,190.94 598,428.80 602,743.56UNITED STATES 2.88% 08/34 83162CWL3 2.8800 8/1/2034 102.0910 570,304.72 576,879.54 576,004.43 582,229.79UNITED STATES 2.46% 02/35 83162CWV1 2.4600 2/1/2035 100.0730 829,597.63 842,435.58 840,134.19 830,203.24
Page 3 of 4
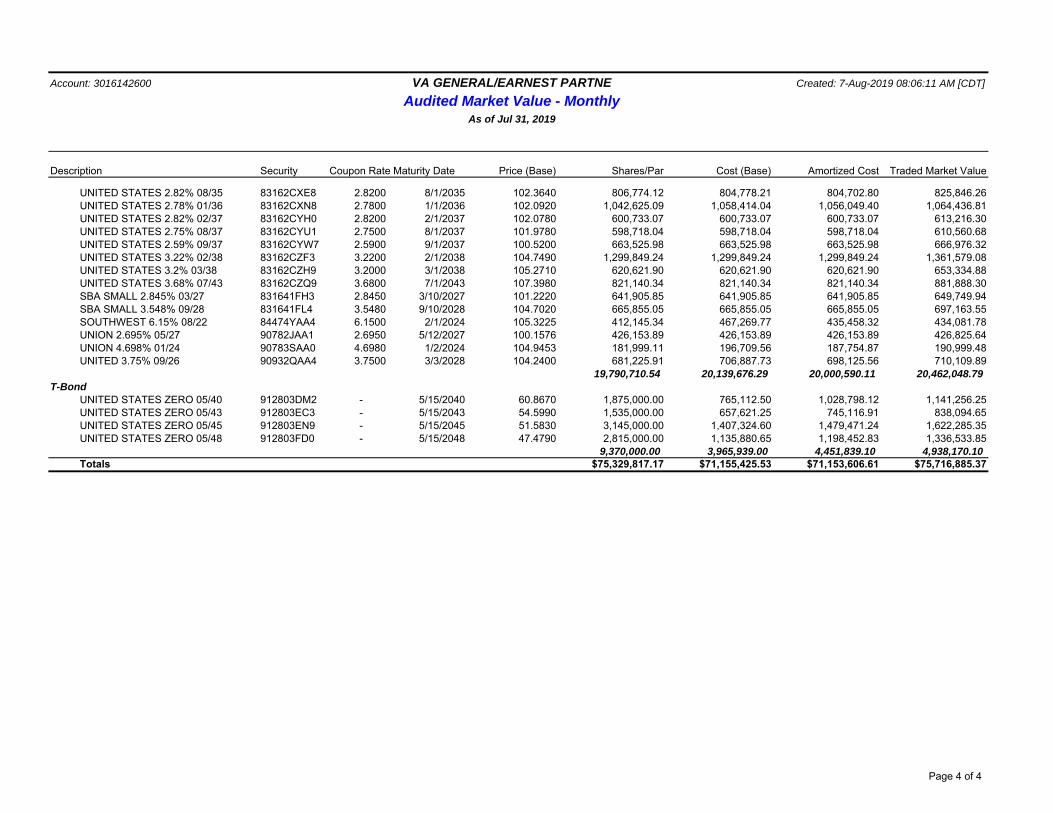
Account: 3016142600 VA GENERAL/EARNEST PARTNE Created: 7-Aug-2019 08:06:11 AM [CDT]
Audited Market Value - MonthlyAs of Jul 31, 2019
Description Security Coupon Rate Maturity Date Price (Base) Shares/Par Cost (Base) Amortized Cost Traded Market Value
UNITED STATES 2.82% 08/35 83162CXE8 2.8200 8/1/2035 102.3640 806,774.12 804,778.21 804,702.80 825,846.26UNITED STATES 2.78% 01/36 83162CXN8 2.7800 1/1/2036 102.0920 1,042,625.09 1,058,414.04 1,056,049.40 1,064,436.81UNITED STATES 2.82% 02/37 83162CYH0 2.8200 2/1/2037 102.0780 600,733.07 600,733.07 600,733.07 613,216.30UNITED STATES 2.75% 08/37 83162CYU1 2.7500 8/1/2037 101.9780 598,718.04 598,718.04 598,718.04 610,560.68UNITED STATES 2.59% 09/37 83162CYW7 2.5900 9/1/2037 100.5200 663,525.98 663,525.98 663,525.98 666,976.32UNITED STATES 3.22% 02/38 83162CZF3 3.2200 2/1/2038 104.7490 1,299,849.24 1,299,849.24 1,299,849.24 1,361,579.08UNITED STATES 3.2% 03/38 83162CZH9 3.2000 3/1/2038 105.2710 620,621.90 620,621.90 620,621.90 653,334.88UNITED STATES 3.68% 07/43 83162CZQ9 3.6800 7/1/2043 107.3980 821,140.34 821,140.34 821,140.34 881,888.30SBA SMALL 2.845% 03/27 831641FH3 2.8450 3/10/2027 101.2220 641,905.85 641,905.85 641,905.85 649,749.94SBA SMALL 3.548% 09/28 831641FL4 3.5480 9/10/2028 104.7020 665,855.05 665,855.05 665,855.05 697,163.55SOUTHWEST 6.15% 08/22 84474YAA4 6.1500 2/1/2024 105.3225 412,145.34 467,269.77 435,458.32 434,081.78UNION 2.695% 05/27 90782JAA1 2.6950 5/12/2027 100.1576 426,153.89 426,153.89 426,153.89 426,825.64UNION 4.698% 01/24 90783SAA0 4.6980 1/2/2024 104.9453 181,999.11 196,709.56 187,754.87 190,999.48UNITED 3.75% 09/26 90932QAA4 3.7500 3/3/2028 104.2400 681,225.91 706,887.73 698,125.56 710,109.89
19,790,710.54 20,139,676.29 20,000,590.11 20,462,048.79 T-Bond
UNITED STATES ZERO 05/40 912803DM2 - 5/15/2040 60.8670 1,875,000.00 765,112.50 1,028,798.12 1,141,256.25UNITED STATES ZERO 05/43 912803EC3 - 5/15/2043 54.5990 1,535,000.00 657,621.25 745,116.91 838,094.65UNITED STATES ZERO 05/45 912803EN9 - 5/15/2045 51.5830 3,145,000.00 1,407,324.60 1,479,471.24 1,622,285.35UNITED STATES ZERO 05/48 912803FD0 - 5/15/2048 47.4790 2,815,000.00 1,135,880.65 1,198,452.83 1,336,533.85
9,370,000.00 3,965,939.00 4,451,839.10 4,938,170.10 Totals $75,329,817.17 $71,155,425.53 $71,153,606.61 $75,716,885.37
Page 4 of 4

SECURITIES LENDING
Investment Holdings Report
Run time 01-Aug-2019 08:06 EDT
Date Asof 31-JUL-2019
Investment Account Not Specified
Master Client COV
Security ID Trade Date/Settle Date
PurchasePrice
Par BookValue
AmountInvested
MarketValue
MoneyMarketYield
Security Description Maturity Date/ExpectedMaturity
S&P MDY Variance%
Commonwealth of Virginia Dept of the TreasuryOutstanding Positions
USD
Triparty Set 1
CANTO0022D31-Jul-201931-Jul-2019 100.00 21,169,331 21,169,33121,169,331 21,169,3312.570000CANTOR FITZGERALD & CO.
FIXEDNR NR 0.0001-Aug-2019
CITGM004D631-Jul-201931-Jul-2019 100.00 75,000,000 75,000,00075,000,000 75,000,0002.530000Citigroup Global Markets Inc.
FIXEDA-1 P-2 0.0001-Aug-2019
HSBCS0018B31-Jul-201931-Jul-2019 100.00 50,000,000 50,000,00050,000,000 50,000,0002.520000HSBC SECURITIES USA INC
FIXEDA-1+ NR 0.0001-Aug-2019
JEFFC003B631-Jul-201931-Jul-2019 100.00 25,000,000 25,000,00025,000,000 25,000,0002.550000Jefferies & Company Inc
FIXEDNR NR 0.0001-Aug-2019
JEFFC003B731-Jul-201931-Jul-2019 100.00 100,000,000 100,000,000100,000,000 100,000,0002.590000Jefferies & Company Inc
FIXEDNR NR 0.0001-Aug-2019
SUBTOTAL 271,169,331 2.555249 271,169,331 271,169,331 0.00
Page 1 of 2
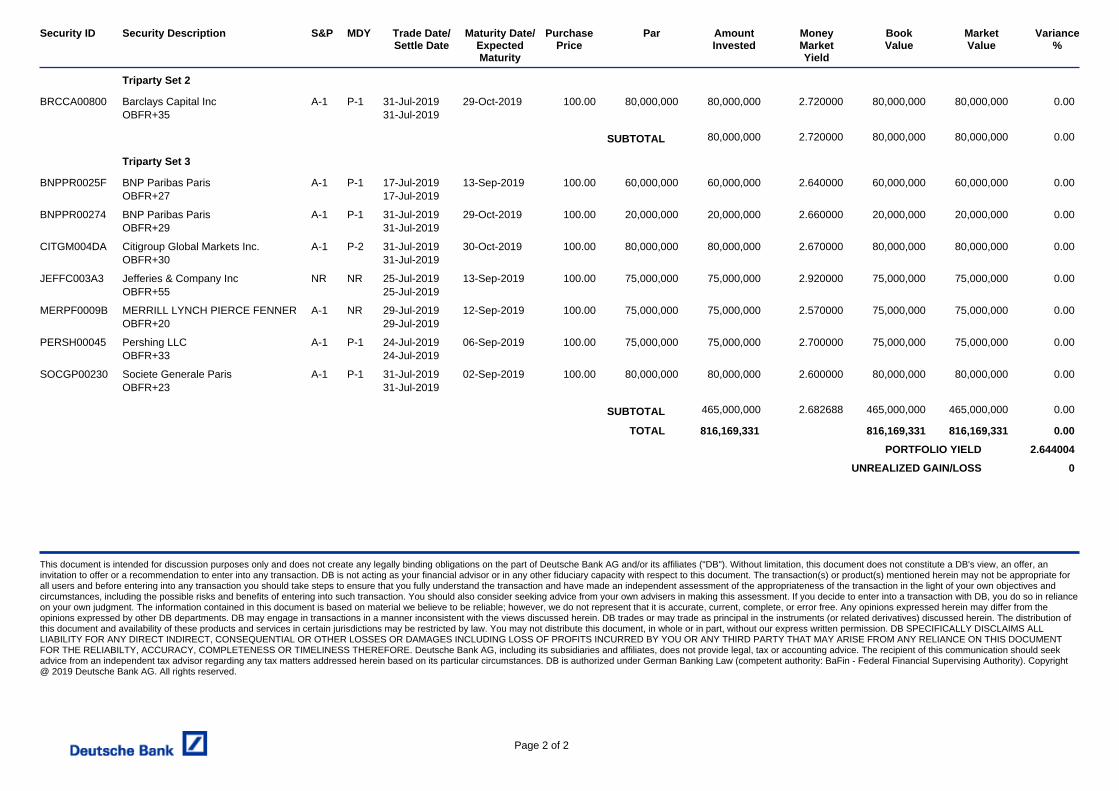
Security ID Trade Date/Settle Date
PurchasePrice
Par BookValue
AmountInvested
MarketValue
MoneyMarketYield
Security Description Maturity Date/ExpectedMaturity
S&P MDY Variance%
Triparty Set 2
BRCCA0080031-Jul-201931-Jul-2019 100.00 80,000,000 80,000,00080,000,000 80,000,0002.720000Barclays Capital Inc
OBFR+35A-1 P-1 0.0029-Oct-2019
SUBTOTAL 80,000,000 2.720000 80,000,000 80,000,000 0.00
Triparty Set 3
BNPPR0025F17-Jul-201917-Jul-2019 100.00 60,000,000 60,000,00060,000,000 60,000,0002.640000BNP Paribas Paris
OBFR+27A-1 P-1 0.0013-Sep-2019
BNPPR0027431-Jul-201931-Jul-2019 100.00 20,000,000 20,000,00020,000,000 20,000,0002.660000BNP Paribas Paris
OBFR+29A-1 P-1 0.0029-Oct-2019
CITGM004DA31-Jul-201931-Jul-2019 100.00 80,000,000 80,000,00080,000,000 80,000,0002.670000Citigroup Global Markets Inc.
OBFR+30A-1 P-2 0.0030-Oct-2019
JEFFC003A325-Jul-201925-Jul-2019 100.00 75,000,000 75,000,00075,000,000 75,000,0002.920000Jefferies & Company Inc
OBFR+55NR NR 0.0013-Sep-2019
MERPF0009B29-Jul-201929-Jul-2019 100.00 75,000,000 75,000,00075,000,000 75,000,0002.570000MERRILL LYNCH PIERCE FENNER
OBFR+20A-1 NR 0.0012-Sep-2019
PERSH0004524-Jul-201924-Jul-2019 100.00 75,000,000 75,000,00075,000,000 75,000,0002.700000Pershing LLC
OBFR+33A-1 P-1 0.0006-Sep-2019
SOCGP0023031-Jul-201931-Jul-2019 100.00 80,000,000 80,000,00080,000,000 80,000,0002.600000Societe Generale Paris
OBFR+23A-1 P-1 0.0002-Sep-2019
SUBTOTAL 465,000,000 2.682688 465,000,000 465,000,000 0.00
TOTAL 816,169,331 816,169,331 816,169,331 0.00
PORTFOLIO YIELD
UNREALIZED GAIN/LOSS
2.644004
0
This document is intended for discussion purposes only and does not create any legally binding obligations on the part of Deutsche Bank AG and/or its affiliates ("DB"). Without limitation, this document does not constitute a DB's view, an offer, aninvitation to offer or a recommendation to enter into any transaction. DB is not acting as your financial advisor or in any other fiduciary capacity with respect to this document. The transaction(s) or product(s) mentioned herein may not be appropriate forall users and before entering into any transaction you should take steps to ensure that you fully understand the transaction and have made an independent assessment of the appropriateness of the transaction in the light of your own objectives andcircumstances, including the possible risks and benefits of entering into such transaction. You should also consider seeking advice from your own advisers in making this assessment. If you decide to enter into a transaction with DB, you do so in relianceon your own judgment. The information contained in this document is based on material we believe to be reliable; however, we do not represent that it is accurate, current, complete, or error free. Any opinions expressed herein may differ from theopinions expressed by other DB departments. DB may engage in transactions in a manner inconsistent with the views discussed herein. DB trades or may trade as principal in the instruments (or related derivatives) discussed herein. The distribution ofthis document and availability of these products and services in certain jurisdictions may be restricted by law. You may not distribute this document, in whole or in part, without our express written permission. DB SPECIFICALLY DISCLAIMS ALLLIABILITY FOR ANY DIRECT INDIRECT, CONSEQUENTIAL OR OTHER LOSSES OR DAMAGES INCLUDING LOSS OF PROFITS INCURRED BY YOU OR ANY THIRD PARTY THAT MAY ARISE FROM ANY RELIANCE ON THIS DOCUMENTFOR THE RELIABILTY, ACCURACY, COMPLETENESS OR TIMELINESS THEREFORE. Deutsche Bank AG, including its subsidiaries and affiliates, does not provide legal, tax or accounting advice. The recipient of this communication should seekadvice from an independent tax advisor regarding any tax matters addressed herein based on its particular circumstances. DB is authorized under German Banking Law (competent authority: BaFin - Federal Financial Supervising Authority). Copyright@ 2019 Deutsche Bank AG. All rights reserved.
Page 2 of 2

LGIP Compliance Investment staff affirms the portfolio complies with the following standards at
time of purchase for the month of July 2019. Maturity Requirements
o LGIP portfolio weighted average maturity ≤ 60-days (WAM). o LGIP portfolio weighted average final maturity ≤120-days (WAL).
Liquidity Requirements
o Daily Liquid Assets ≥10% of Total Assets. o Weekly Liquid Assets (WLA) ≥ 30% of Total Assets. o ≤ 5% of Total Assets in Illiquid Securities.
Portfolio Quality o All security purchases were Eligible Securities. o All holdings were Eligible Securities.
Stress Test (Weekly) subject to:
o Interest rate movements. o Credit spread widening. o Current market NAV of portfolio. o Shareholder redemptions.
Comments: The Stress Test indicates that the LGIP can maintain a stable net asset value per share based upon the hypothetical event assumptions developed by management using worst case scenarios.
Shadow Price NAV
o Determined weekly using JPMorgan’s third party pricing services.
Comments: Board will be advised if Shadow Price NAV deviation from the amortized cost price per share exceeds ½ of 1 percent.
Definitions:
o Daily Liquid Assets: Securities that will mature or are subject to a Demand Feature that is exercisable and payable within one Business Day and direct obligations of the U.S. Government.
o Weekly Liquid Assets: Securities that will mature or are subject to a Demand Feature that is exercisable and payable within five Business Days, Direct obligations of the U.S. Government, and Government Securities issued at a discount having a remaining maturity date of 60 days or less (e.g. government agency discount notes).
o Liquid Securities: Securities which can be sold or disposed of within 7 calendar days at approximately the values ascribed to it by the Fund.
o Eligible Securities: Securities that meet the LGIP’s credit quality, issuer limits, and maturity requirements.
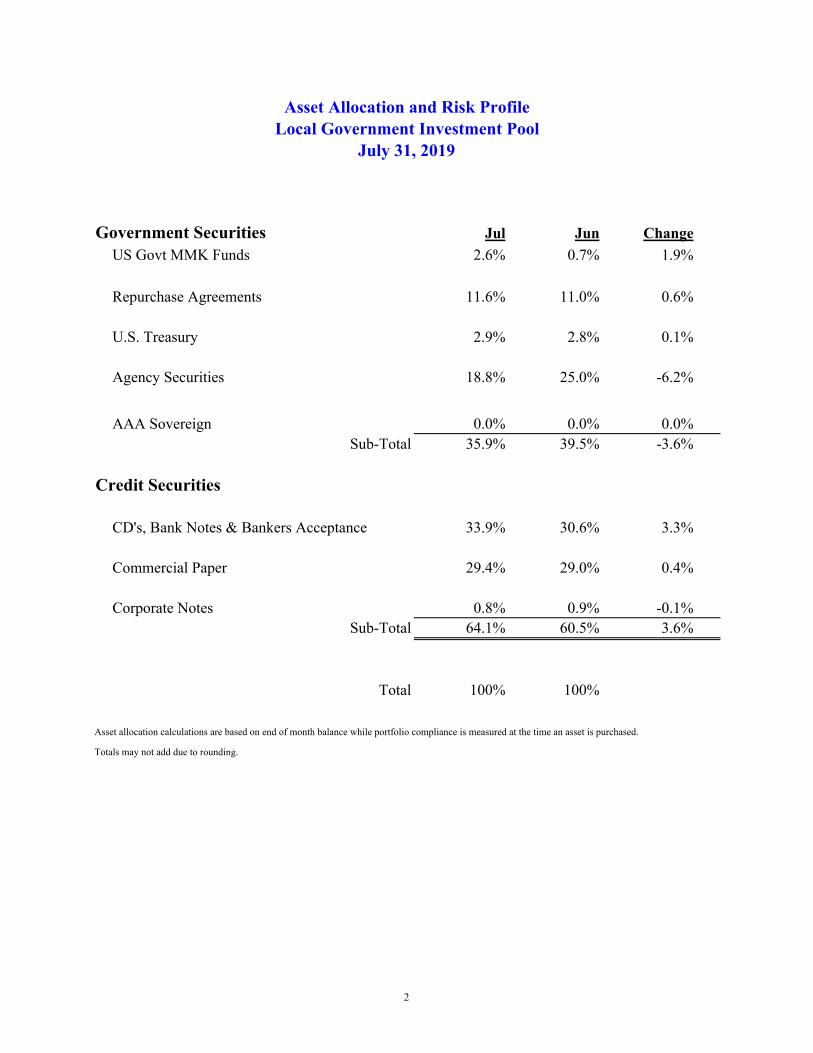
Government Securities Jul Jun Change
US Govt MMK Funds 2.6% 0.7% 1.9%
Repurchase Agreements 11.6% 11.0% 0.6%
U.S. Treasury 2.9% 2.8% 0.1%
Agency Securities 18.8% 25.0% -6.2%
AAA Sovereign 0.0% 0.0% 0.0%Sub-Total 35.9% 39.5% -3.6%
Credit Securities
CD's, Bank Notes & Bankers Acceptance 33.9% 30.6% 3.3%
Commercial Paper 29.4% 29.0% 0.4%
Corporate Notes 0.8% 0.9% -0.1%Sub-Total 64.1% 60.5% 3.6%
Total 100% 100%
Asset allocation calculations are based on end of month balance while portfolio compliance is measured at the time an asset is purchased.
Totals may not add due to rounding.
Asset Allocation and Risk ProfileLocal Government Investment Pool
July 31, 2019
2

FISCAL YEAR Average Average Treasury 3-Month iMoneyNet2020 Average Bal. Maturity Maturity Gross Constant Money Fund Monitor TM
$ (millions) (WAM)r (WAM)f Yield % Maturity1 Institutional Index
July 2019 $6,823.6 32 60 2.44% 2.15% 2.07%
August 2019
September 2019
October 2019
November 2019
December 2019
January 2020
February 2020
March 2020
April 2020
May 2020
June 2020
Year-to-Date Average2$6,823.6 32 60 2.44% 2.15% 2.07%
1 Federal Reserve Bank H.15 Release.
2 YTD average is weighted for the LGIP.
LGIP YIELD COMPARISONS
LGIP
3 8/13/2019 3:54 PM
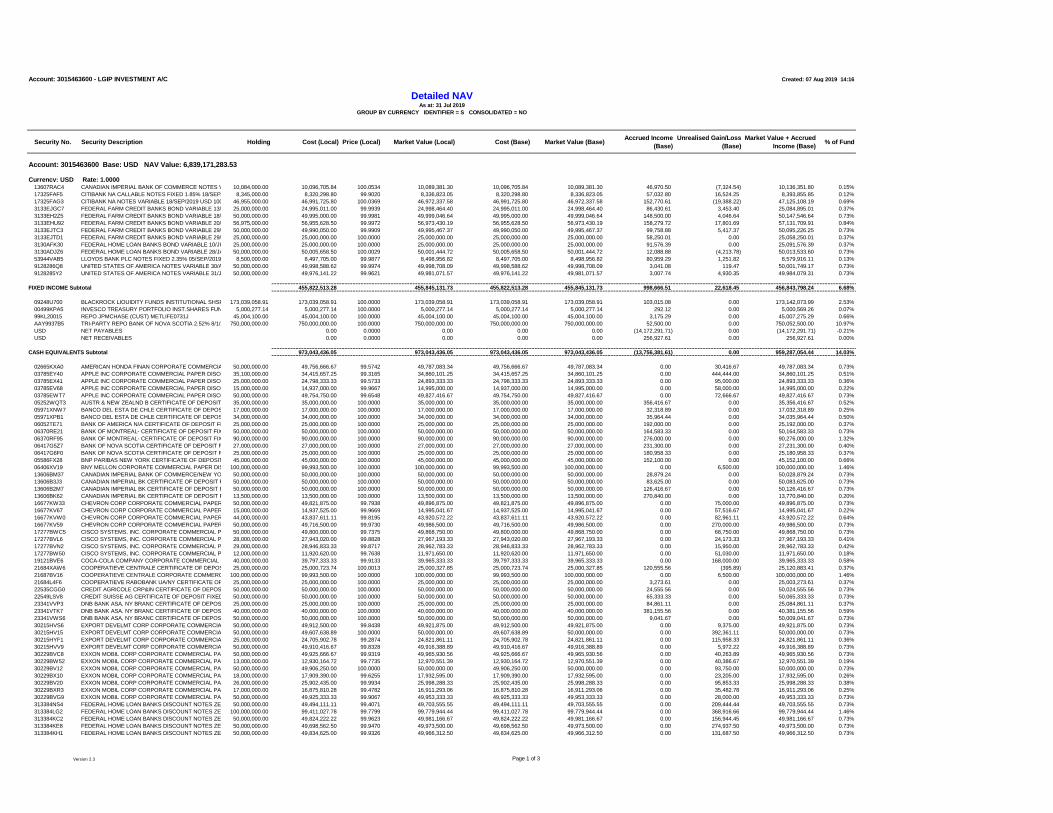
Account: 3015463600 - LGIP INVESTMENT A/C Created: 07 Aug 2019 14:16
Security No. Security Description Holding Cost (Local) Price (Local) Market Value (Local) Cost (Base) Market Value (Base)Accrued Income
(Base)
Unrealised Gain/Loss
(Base)
Market Value + Accrued
Income (Base)% of Fund
Account: 3015463600 Base: USD NAV Value: 6,839,171,283.53
Currency: USD Rate: 1.000013607RAC4 CANADIAN IMPERIAL BANK OF COMMERCE NOTES VARIABLE 06/SEP/2019 USD 100010,084,000.00 10,096,705.84 100.0534 10,089,381.30 10,096,705.84 10,089,381.30 46,970.50 (7,324.54) 10,136,351.80 0.15%
17325FAF5 CITIBANK NA CALLABLE NOTES FIXED 1.85% 18/SEP/2019 USD 10008,345,000.00 8,320,298.80 99.9020 8,336,823.05 8,320,298.80 8,336,823.05 57,032.80 16,524.25 8,393,855.85 0.12%
17325FAG3 CITIBANK NA NOTES VARIABLE 18/SEP/2019 USD 1000 46,955,000.00 46,991,725.80 100.0369 46,972,337.58 46,991,725.80 46,972,337.58 152,770.61 (19,388.22) 47,125,108.19 0.69%
3133EJGC7 FEDERAL FARM CREDIT BANKS BOND VARIABLE 13/MAR/2020 USD 100025,000,000.00 24,995,011.00 99.9939 24,998,464.40 24,995,011.00 24,998,464.40 86,430.61 3,453.40 25,084,895.01 0.37%
3133EH2Z5 FEDERAL FARM CREDIT BANKS BOND VARIABLE 18/DEC/2019 USD 100050,000,000.00 49,995,000.00 99.9981 49,999,046.64 49,995,000.00 49,999,046.64 148,500.00 4,046.64 50,147,546.64 0.73%
3133EHU92 FEDERAL FARM CREDIT BANKS BOND VARIABLE 20/SEP/2019 USD 100056,975,000.00 56,955,628.50 99.9972 56,973,430.19 56,955,628.50 56,973,430.19 158,279.72 17,801.69 57,131,709.91 0.84%
3133EJTC3 FEDERAL FARM CREDIT BANKS BOND VARIABLE 29/JUN/2020 USD 100050,000,000.00 49,990,050.00 99.9909 49,995,467.37 49,990,050.00 49,995,467.37 99,758.88 5,417.37 50,095,226.25 0.73%
3133EJTD1 FEDERAL FARM CREDIT BANKS BOND VARIABLE 29/JUN/2020 USD 100025,000,000.00 25,000,000.00 100.0000 25,000,000.00 25,000,000.00 25,000,000.00 58,250.01 0.00 25,058,250.01 0.37%
3130AFK30 FEDERAL HOME LOAN BANKS BOND VARIABLE 10/JUN/2020 USD 500025,000,000.00 25,000,000.00 100.0000 25,000,000.00 25,000,000.00 25,000,000.00 91,576.39 0.00 25,091,576.39 0.37%
3130ADJZ6 FEDERAL HOME LOAN BANKS BOND VARIABLE 28/JAN/2020 USD 500050,000,000.00 50,005,658.50 100.0029 50,001,444.72 50,005,658.50 50,001,444.72 12,088.88 (4,213.78) 50,013,533.60 0.73%
53944VAB5 LLOYDS BANK PLC NOTES FIXED 2.35% 05/SEP/2019 USD 10008,500,000.00 8,497,705.00 99.9877 8,498,956.82 8,497,705.00 8,498,956.82 80,959.29 1,251.82 8,579,916.11 0.13%
9128286Q8 UNITED STATES OF AMERICA NOTES VARIABLE 30/APR/2021 USD 10050,000,000.00 49,998,588.62 99.9974 49,998,708.09 49,998,588.62 49,998,708.09 3,041.08 119.47 50,001,749.17 0.73%
9128285Y2 UNITED STATES OF AMERICA NOTES VARIABLE 31/JAN/2021 USD 10050,000,000.00 49,976,141.22 99.9621 49,981,071.57 49,976,141.22 49,981,071.57 3,007.74 4,930.35 49,984,079.31 0.73%
FIXED INCOME Subtotal 455,822,513.28 455,845,131.73 455,822,513.28 455,845,131.73 998,666.51 22,618.45 456,843,798.24 6.68%
09248U700 BLACKROCK LIQUIDITY FUNDS INSTITUTIONAL SHSFEDFUND PORTFOLIO173,039,058.91 173,039,058.91 100.0000 173,039,058.91 173,039,058.91 173,039,058.91 103,015.08 0.00 173,142,073.99 2.53%
00499KPA5 INVESCO TREASURY PORTFOLIO INST.SHARES FUND 19315,000,277.14 5,000,277.14 100.0000 5,000,277.14 5,000,277.14 5,000,277.14 292.12 0.00 5,000,569.26 0.07%
99KL20015 REPO JPMCHASE (CUST) METLIFE0731J 45,004,100.00 45,004,100.00 100.0000 45,004,100.00 45,004,100.00 45,004,100.00 3,175.29 0.00 45,007,275.29 0.66%
AAY9937B5 TRI-PARTY REPO BANK OF NOVA SCOTIA 2.52% 8/1/2019750,000,000.00 750,000,000.00 100.0000 750,000,000.00 750,000,000.00 750,000,000.00 52,500.00 0.00 750,052,500.00 10.97%
USD NET PAYABLES 0.00 0.0000 0.00 0.00 0.00 (14,172,291.71) 0.00 (14,172,291.71) -0.21%
USD NET RECEIVABLES 0.00 0.0000 0.00 0.00 0.00 256,927.61 0.00 256,927.61 0.00%
CASH EQUIVALENTS Subtotal 973,043,436.05 973,043,436.05 973,043,436.05 973,043,436.05 (13,756,381.61) 0.00 959,287,054.44 14.03%
02665KXA0 AMERICAN HONDA FINAN CORPORATE COMMERCIAL PAPER DISCOUNT DTD 22/JUL/2019 DUE 10/OCT/2019 2.25%50,000,000.00 49,756,666.67 99.5742 49,787,083.34 49,756,666.67 49,787,083.34 0.00 30,416.67 49,787,083.34 0.73%
03785EY40 APPLE INC CORPORATE COMMERCIAL PAPER DISCOUNT DTD 06/FEB/2019 DUE 04/NOV/2019 2.61%35,100,000.00 34,415,657.25 99.3165 34,860,101.25 34,415,657.25 34,860,101.25 0.00 444,444.00 34,860,101.25 0.51%
03785EX41 APPLE INC CORPORATE COMMERCIAL PAPER DISCOUNT DTD 29/JAN/2019 DUE 04/OCT/2019 2.69%25,000,000.00 24,798,333.33 99.5733 24,893,333.33 24,798,333.33 24,893,333.33 0.00 95,000.00 24,893,333.33 0.36%
03785EV68 APPLE INC CORPORATE COMMERCIAL PAPER DISCOUNT DTD 29/JAN/2019 DUE 06/AUG/2019 2.66%15,000,000.00 14,937,000.00 99.9667 14,995,000.00 14,937,000.00 14,995,000.00 0.00 58,000.00 14,995,000.00 0.22%
03785EWT7 APPLE INC CORPORATE COMMERCIAL PAPER DISCOUNT DTD 30/APR/2019 DUE 27/SEP/2019 2.47%50,000,000.00 49,754,750.00 99.6548 49,827,416.67 49,754,750.00 49,827,416.67 0.00 72,666.67 49,827,416.67 0.73%
05252WQT3 AUSTR & NEW ZEALND B CERTIFICATE OF DEPOSIT FIXED DTD 13/MAR/2019 DUE 19/SEP/2019 2.6%35,000,000.00 35,000,000.00 100.0000 35,000,000.00 35,000,000.00 35,000,000.00 356,416.67 0.00 35,356,416.67 0.52%
05971XNW7 BANCO DEL ESTA DE CHLE CERTIFICATE OF DEPOSIT FIXED DTD 03/JUL/2019 DUE 05/AUG/2019 2.36%17,000,000.00 17,000,000.00 100.0000 17,000,000.00 17,000,000.00 17,000,000.00 32,318.89 0.00 17,032,318.89 0.25%
05971XPB1 BANCO DEL ESTA DE CHLE CERTIFICATE OF DEPOSIT FIXED DTD 15/JUL/2019 DUE 15/OCT/2019 2.24%34,000,000.00 34,000,000.00 100.0000 34,000,000.00 34,000,000.00 34,000,000.00 35,964.44 0.00 34,035,964.44 0.50%
06052TE71 BANK OF AMERICA N/A CERTIFICATE OF DEPOSIT FIXED DTD 15/APR/2019 DUE 15/OCT/2019 2.56%25,000,000.00 25,000,000.00 100.0000 25,000,000.00 25,000,000.00 25,000,000.00 192,000.00 0.00 25,192,000.00 0.37%
06370RE21 BANK OF MONTREAL- CERTIFICATE OF DEPOSIT FIXED DTD 12/JUN/2019 DUE 12/SEP/2019 2.37%50,000,000.00 50,000,000.00 100.0000 50,000,000.00 50,000,000.00 50,000,000.00 164,583.33 0.00 50,164,583.33 0.73%
06370RF95 BANK OF MONTREAL- CERTIFICATE OF DEPOSIT FIXED DTD 14/JUN/2019 DUE 21/AUG/2019 2.3%90,000,000.00 90,000,000.00 100.0000 90,000,000.00 90,000,000.00 90,000,000.00 276,000.00 0.00 90,276,000.00 1.32%
06417G5Z7 BANK OF NOVA SCOTIA CERTIFICATE OF DEPOSIT FIXED DTD 03/APR/2019 DUE 03/OCT/2019 2.57%27,000,000.00 27,000,000.00 100.0000 27,000,000.00 27,000,000.00 27,000,000.00 231,300.00 0.00 27,231,300.00 0.40%
06417G6F0 BANK OF NOVA SCOTIA CERTIFICATE OF DEPOSIT FIXED DTD 22/APR/2019 DUE 22/OCT/2019 2.58%25,000,000.00 25,000,000.00 100.0000 25,000,000.00 25,000,000.00 25,000,000.00 180,958.33 0.00 25,180,958.33 0.37%
05586FX28 BNP PARIBAS NEW YORK CERTIFICATE OF DEPOSIT FIXED DTD 10/JUN/2019 DUE 12/AUG/2019 2.34%45,000,000.00 45,000,000.00 100.0000 45,000,000.00 45,000,000.00 45,000,000.00 152,100.00 0.00 45,152,100.00 0.66%
06406XV19 BNY MELLON CORPORATE COMMERCIAL PAPER DISCOUNT DTD 01/JUL/2019 DUE 01/AUG/2019 2.31%100,000,000.00 99,993,500.00 100.0000 100,000,000.00 99,993,500.00 100,000,000.00 0.00 6,500.00 100,000,000.00 1.46%
13606BM37 CANADIAN IMPERIAL BANK OF COMMERCE/NEW YORK NY CERTIFICATE OF DEPOSIT VARIABLE 24/SEP/2019 USD50,000,000.00 50,000,000.00 100.0000 50,000,000.00 50,000,000.00 50,000,000.00 28,879.24 0.00 50,028,879.24 0.73%
13606B3J3 CANADIAN IMPERIAL BK CERTIFICATE OF DEPOSIT FIXED DTD 05/JUL/2019 DUE 08/OCT/2019 2.23%50,000,000.00 50,000,000.00 100.0000 50,000,000.00 50,000,000.00 50,000,000.00 83,625.00 0.00 50,083,625.00 0.73%
13606B2M7 CANADIAN IMPERIAL BK CERTIFICATE OF DEPOSIT FIXED DTD 21/JUN/2019 DUE 24/SEP/2019 2.22%50,000,000.00 50,000,000.00 100.0000 50,000,000.00 50,000,000.00 50,000,000.00 126,416.67 0.00 50,126,416.67 0.73%
13606BK62 CANADIAN IMPERIAL BK CERTIFICATE OF DEPOSIT FIXED DTD 30/NOV/2018 DUE 29/AUG/2019 2.96%13,500,000.00 13,500,000.00 100.0000 13,500,000.00 13,500,000.00 13,500,000.00 270,840.00 0.00 13,770,840.00 0.20%
16677KW33 CHEVRON CORP CORPORATE COMMERCIAL PAPER DISCOUNT DTD 01/APR/2019 DUE 03/SEP/2019 2.45%50,000,000.00 49,821,875.00 99.7938 49,896,875.00 49,821,875.00 49,896,875.00 0.00 75,000.00 49,896,875.00 0.73%
16677KV67 CHEVRON CORP CORPORATE COMMERCIAL PAPER DISCOUNT DTD 03/JUN/2019 DUE 06/AUG/2019 2.39%15,000,000.00 14,937,525.00 99.9669 14,995,041.67 14,937,525.00 14,995,041.67 0.00 57,516.67 14,995,041.67 0.22%
16677KVW0 CHEVRON CORP CORPORATE COMMERCIAL PAPER DISCOUNT DTD 03/JUN/2019 DUE 30/AUG/2019 2.39%44,000,000.00 43,837,611.11 99.8195 43,920,572.22 43,837,611.11 43,920,572.22 0.00 82,961.11 43,920,572.22 0.64%
16677KV59 CHEVRON CORP CORPORATE COMMERCIAL PAPER DISCOUNT DTD 13/MAY/2019 DUE 05/AUG/2019 2.44%50,000,000.00 49,716,500.00 99.9730 49,986,500.00 49,716,500.00 49,986,500.00 0.00 270,000.00 49,986,500.00 0.73%
17277BWC5 CISCO SYSTEMS, INC. CORPORATE COMMERCIAL PAPER DISCOUNT DTD 10/JUL/2019 DUE 12/SEP/2019 2.3%50,000,000.00 49,800,000.00 99.7375 49,868,750.00 49,800,000.00 49,868,750.00 0.00 68,750.00 49,868,750.00 0.73%
17277BVL6 CISCO SYSTEMS, INC. CORPORATE COMMERCIAL PAPER DISCOUNT DTD 25/JUN/2019 DUE 20/AUG/2019 2.32%28,000,000.00 27,943,020.00 99.8828 27,967,193.33 27,943,020.00 27,967,193.33 0.00 24,173.33 27,967,193.33 0.41%
17277BVN2 CISCO SYSTEMS, INC. CORPORATE COMMERCIAL PAPER DISCOUNT DTD 27/JUN/2019 DUE 22/AUG/2019 2.32%29,000,000.00 28,946,833.33 99.8717 28,962,783.33 28,946,833.33 28,962,783.33 0.00 15,950.00 28,962,783.33 0.42%
17277BW50 CISCO SYSTEMS, INC. CORPORATE COMMERCIAL PAPER DISCOUNT DTD 28/MAY/2019 DUE 05/SEP/2019 2.48%12,000,000.00 11,920,620.00 99.7638 11,971,650.00 11,920,620.00 11,971,650.00 0.00 51,030.00 11,971,650.00 0.18%
19121BVE6 COCA-COLA COMPANY CORPORATE COMMERCIAL PAPER DISCOUNT DTD 28/MAY/2019 DUE 14/AUG/2019 2.45%40,000,000.00 39,797,333.33 99.9133 39,965,333.33 39,797,333.33 39,965,333.33 0.00 168,000.00 39,965,333.33 0.58%
21684XAW6 COOPERATIEVE CENTRALE CERTIFICATE OF DEPOSIT FIXED DTD 23/MAY/2019 DUE 23/SEP/2019 2.48%25,000,000.00 25,000,723.74 100.0013 25,000,327.85 25,000,723.74 25,000,327.85 120,555.56 (395.89) 25,120,883.41 0.37%
21687BV16 COOPERATIEVE CENTRALE CORPORATE COMMERCIAL PAPER DISCOUNT DTD 31/JUL/2019 DUE 01/AUG/2019 2.34%100,000,000.00 99,993,500.00 100.0000 100,000,000.00 99,993,500.00 100,000,000.00 0.00 6,500.00 100,000,000.00 1.46%
21684L4F6 COOPERATIEVE RABOBANK UA/NY CERTIFICATE OF DEPOSIT VARIABLE 30/DEC/2019 USD 100025,000,000.00 25,000,000.00 100.0000 25,000,000.00 25,000,000.00 25,000,000.00 3,273.61 0.00 25,003,273.61 0.37%
22535CGG0 CREDIT AGRICOLE CRP&IN CERTIFICATE OF DEPOSIT FIXED DTD 24/JUL/2019 DUE 01/OCT/2019 2.21%50,000,000.00 50,000,000.00 100.0000 50,000,000.00 50,000,000.00 50,000,000.00 24,555.56 0.00 50,024,555.56 0.73%
22549LSV8 CREDIT SUISSE AG CERTIFICATE OF DEPOSIT FIXED DTD 11/JUL/2019 DUE 07/OCT/2019 2.24%50,000,000.00 50,000,000.00 100.0000 50,000,000.00 50,000,000.00 50,000,000.00 65,333.33 0.00 50,065,333.33 0.73%
23341VVP3 DNB BANK ASA, NY BRANC CERTIFICATE OF DEPOSIT FIXED DTD 10/JUN/2019 DUE 10/SEP/2019 2.35%25,000,000.00 25,000,000.00 100.0000 25,000,000.00 25,000,000.00 25,000,000.00 84,861.11 0.00 25,084,861.11 0.37%
23341VTK7 DNB BANK ASA, NY BRANC CERTIFICATE OF DEPOSIT FIXED DTD 20/MAR/2019 DUE 30/AUG/2019 2.56%40,000,000.00 40,000,000.00 100.0000 40,000,000.00 40,000,000.00 40,000,000.00 381,155.56 0.00 40,381,155.56 0.59%
23341VWS6 DNB BANK ASA, NY BRANC CERTIFICATE OF DEPOSIT FIXED DTD 29/JUL/2019 DUE 29/JAN/2020 2.17%50,000,000.00 50,000,000.00 100.0000 50,000,000.00 50,000,000.00 50,000,000.00 9,041.67 0.00 50,009,041.67 0.73%
30215HVS6 EXPORT DEVELMT CORP CORPORATE COMMERCIAL PAPER DISCOUNT DTD 01/MAY/2019 DUE 26/AUG/2019 2.47%50,000,000.00 49,912,500.00 99.8438 49,921,875.00 49,912,500.00 49,921,875.00 0.00 9,375.00 49,921,875.00 0.73%
30215HV15 EXPORT DEVELMT CORP CORPORATE COMMERCIAL PAPER DISCOUNT DTD 10/APR/2019 DUE 01/AUG/2019 2.5%50,000,000.00 49,607,638.89 100.0000 50,000,000.00 49,607,638.89 50,000,000.00 0.00 392,361.11 50,000,000.00 0.73%
30215HYF1 EXPORT DEVELMT CORP CORPORATE COMMERCIAL PAPER DISCOUNT DTD 24/MAY/2019 DUE 15/NOV/2019 2.42%25,000,000.00 24,705,902.78 99.2874 24,821,861.11 24,705,902.78 24,821,861.11 0.00 115,958.33 24,821,861.11 0.36%
30215HVV9 EXPORT DEVELMT CORP CORPORATE COMMERCIAL PAPER DISCOUNT DTD 29/JUL/2019 DUE 29/AUG/2019 2.25%50,000,000.00 49,910,416.67 99.8328 49,916,388.89 49,910,416.67 49,916,388.89 0.00 5,972.22 49,916,388.89 0.73%
30229BVC8 EXXON MOBIL CORP CORPORATE COMMERCIAL PAPER DISCOUNT DTD 06/JUN/2019 DUE 12/AUG/2019 2.38%50,000,000.00 49,925,666.67 99.9319 49,965,930.56 49,925,666.67 49,965,930.56 0.00 40,263.89 49,965,930.56 0.73%
30229BW52 EXXON MOBIL CORP CORPORATE COMMERCIAL PAPER DISCOUNT DTD 10/JUN/2019 DUE 05/SEP/2019 2.36%13,000,000.00 12,930,164.72 99.7735 12,970,551.39 12,930,164.72 12,970,551.39 0.00 40,386.67 12,970,551.39 0.19%
30229BV12 EXXON MOBIL CORP CORPORATE COMMERCIAL PAPER DISCOUNT DTD 15/MAR/2019 DUE 01/AUG/2019 2.51%50,000,000.00 49,906,250.00 100.0000 50,000,000.00 49,906,250.00 50,000,000.00 0.00 93,750.00 50,000,000.00 0.73%
30229BX10 EXXON MOBIL CORP CORPORATE COMMERCIAL PAPER DISCOUNT DTD 17/JUN/2019 DUE 01/OCT/2019 2.3%18,000,000.00 17,909,390.00 99.6255 17,932,595.00 17,909,390.00 17,932,595.00 0.00 23,205.00 17,932,595.00 0.26%
30229BV20 EXXON MOBIL CORP CORPORATE COMMERCIAL PAPER DISCOUNT DTD 20/MAR/2019 DUE 02/AUG/2019 2.5%26,000,000.00 25,902,435.00 99.9934 25,998,288.33 25,902,435.00 25,998,288.33 0.00 95,853.33 25,998,288.33 0.38%
30229BXR3 EXXON MOBIL CORP CORPORATE COMMERCIAL PAPER DISCOUNT DTD 27/JUN/2019 DUE 25/OCT/2019 2.23%17,000,000.00 16,875,810.28 99.4782 16,911,293.06 16,875,810.28 16,911,293.06 0.00 35,482.78 16,911,293.06 0.25%
30229BVG9 EXXON MOBIL CORP CORPORATE COMMERCIAL PAPER DISCOUNT DTD 30/MAY/2019 DUE 16/AUG/2019 2.42%50,000,000.00 49,925,333.33 99.9067 49,953,333.33 49,925,333.33 49,953,333.33 0.00 28,000.00 49,953,333.33 0.73%
313384NS4 FEDERAL HOME LOAN BANKS DISCOUNT NOTES ZERO CPN 01/NOV/2019 USD 100050,000,000.00 49,494,111.11 99.4071 49,703,555.55 49,494,111.11 49,703,555.55 0.00 209,444.44 49,703,555.55 0.73%
313384LG2 FEDERAL HOME LOAN BANKS DISCOUNT NOTES ZERO CPN 04/SEP/2019 USD 1000100,000,000.00 99,411,027.78 99.7799 99,779,944.44 99,411,027.78 99,779,944.44 0.00 368,916.66 99,779,944.44 1.46%
313384KC2 FEDERAL HOME LOAN BANKS DISCOUNT NOTES ZERO CPN 07/AUG/2019 USD 100050,000,000.00 49,824,222.22 99.9623 49,981,166.67 49,824,222.22 49,981,166.67 0.00 156,944.45 49,981,166.67 0.73%
313384KE8 FEDERAL HOME LOAN BANKS DISCOUNT NOTES ZERO CPN 09/AUG/2019 USD 100050,000,000.00 49,698,562.50 99.9470 49,973,500.00 49,698,562.50 49,973,500.00 0.00 274,937.50 49,973,500.00 0.73%
313384KH1 FEDERAL HOME LOAN BANKS DISCOUNT NOTES ZERO CPN 12/AUG/2019 USD 100050,000,000.00 49,834,625.00 99.9326 49,966,312.50 49,834,625.00 49,966,312.50 0.00 131,687.50 49,966,312.50 0.73%
Detailed NAVAs at: 31 Jul 2019
GROUP BY CURRENCY IDENTIFIER = S CONSOLIDATED = NO
Version 2.3 Page 1 of 3

Account: 3015463600 - LGIP INVESTMENT A/C Created: 07 Aug 2019 14:16
Security No. Security Description Holding Cost (Local) Price (Local) Market Value (Local) Cost (Base) Market Value (Base)Accrued Income
(Base)
Unrealised Gain/Loss
(Base)
Market Value + Accrued
Income (Base)% of Fund
Detailed NAVAs at: 31 Jul 2019
GROUP BY CURRENCY IDENTIFIER = S CONSOLIDATED = NO
313384KJ7 FEDERAL HOME LOAN BANKS DISCOUNT NOTES ZERO CPN 13/AUG/2019 USD 100050,000,000.00 49,856,388.89 99.9267 49,963,333.33 49,856,388.89 49,963,333.33 0.00 106,944.44 49,963,333.33 0.73%
313384KK4 FEDERAL HOME LOAN BANKS DISCOUNT NOTES ZERO CPN 14/AUG/2019 USD 1000110,000,000.00 109,623,215.00 99.9198 109,911,816.27 109,623,215.00 109,911,816.27 0.00 288,601.27 109,911,816.27 1.61%
313384KL2 FEDERAL HOME LOAN BANKS DISCOUNT NOTES ZERO CPN 15/AUG/2019 USD 100050,000,000.00 49,743,798.61 99.9092 49,954,597.22 49,743,798.61 49,954,597.22 0.00 210,798.61 49,954,597.22 0.73%
313384KM0 FEDERAL HOME LOAN BANKS DISCOUNT NOTES ZERO CPN 16/AUG/2019 USD 100050,000,000.00 49,740,555.56 99.9027 49,951,354.17 49,740,555.56 49,951,354.17 0.00 210,798.61 49,951,354.17 0.73%
313384LV9 FEDERAL HOME LOAN BANKS DISCOUNT NOTES ZERO CPN 17/SEP/2019 USD 100050,000,000.00 49,661,666.67 99.6971 49,848,555.56 49,661,666.67 49,848,555.56 0.00 186,888.89 49,848,555.56 0.73%
313384LX5 FEDERAL HOME LOAN BANKS DISCOUNT NOTES ZERO CPN 19/SEP/2019 USD 100050,000,000.00 49,654,479.17 99.6835 49,841,770.83 49,654,479.17 49,841,770.83 0.00 187,291.66 49,841,770.83 0.73%
313384KU2 FEDERAL HOME LOAN BANKS DISCOUNT NOTES ZERO CPN 23/AUG/2019 USD 1000100,000,000.00 99,447,500.00 99.8570 99,857,000.00 99,447,500.00 99,857,000.00 0.00 409,500.00 99,857,000.00 1.46%
313384ME6 FEDERAL HOME LOAN BANKS DISCOUNT NOTES ZERO CPN 26/SEP/2019 USD 100050,000,000.00 49,631,875.00 99.6383 49,819,166.67 49,631,875.00 49,819,166.67 0.00 187,291.67 49,819,166.67 0.73%
313384KZ1 FEDERAL HOME LOAN BANKS DISCOUNT NOTES ZERO CPN 28/AUG/2019 USD 1000100,000,000.00 99,407,236.11 99.8241 99,824,125.00 99,407,236.11 99,824,125.00 0.00 416,888.89 99,824,125.00 1.46%
313384LB3 FEDERAL HOME LOAN BANKS DISCOUNT NOTES ZERO CPN 30/AUG/2019 USD 100092,500,000.00 92,261,902.43 99.8264 92,339,422.57 92,261,902.43 92,339,422.57 0.00 77,520.14 92,339,422.57 1.35%
40435RDS7 HSBC BANK USA NA CERTIFICATE OF DEPOSIT FIXED 2.38% 05/AUG/2019 USD 100050,000,000.00 50,000,000.00 100.0000 50,000,000.00 50,000,000.00 50,000,000.00 46,277.78 0.00 50,046,277.78 0.73%
40435RDR9 HSBC BANK USA NA CERTIFICATE OF DEPOSIT FIXED 2.38% DTD 17/JUL/2019 DUE 05/AUG/201950,000,000.00 50,000,000.00 100.0000 50,000,000.00 50,000,000.00 50,000,000.00 49,583.33 0.00 50,049,583.33 0.73%
4497W1Y83 ING (US) FUNDING LLC CORPORATE COMMERCIAL PAPER DISCOUNT DTD 08/MAY/2019 DUE 08/NOV/2019 2.51%26,000,000.00 25,667,777.72 99.3125 25,821,249.97 25,667,777.72 25,821,249.97 0.00 153,472.25 25,821,249.97 0.38%
46640QYJ4 J.P. MORGAN SECURITIES CORPORATE COMMERCIAL PAPER DISCOUNT DTD 16/MAY/2019 DUE 18/NOV/2019 2.56%25,000,000.00 24,690,347.22 99.2582 24,814,548.61 24,690,347.22 24,814,548.61 0.00 124,201.39 24,814,548.61 0.36%
53947CBL1 LLOYDS BANK CORPORATE CERTIFICATE OF DEPOSIT FIXED DTD 03/JUN/2019 DUE 03/SEP/2019 2.45%39,000,000.00 39,000,000.00 100.0000 39,000,000.00 39,000,000.00 39,000,000.00 156,595.83 0.00 39,156,595.83 0.57%
59157UV15 METLIFE SHORT TERM FDG CORPORATE COMMERCIAL PAPER DISCOUNT DTD 02/APR/2019 DUE 01/AUG/2019 2.59%33,000,000.00 32,907,389.72 100.0000 33,000,000.00 32,907,389.72 33,000,000.00 0.00 92,610.28 33,000,000.00 0.48%
59157UX21 METLIFE SHORT TERM FDG CORPORATE COMMERCIAL PAPER DISCOUNT DTD 08/APR/2019 DUE 02/OCT/2019 2.62%15,750,000.00 15,559,980.63 99.5574 15,680,288.75 15,559,980.63 15,680,288.75 0.00 120,308.12 15,680,288.75 0.23%
59157UXB1 METLIFE SHORT TERM FDG CORPORATE COMMERCIAL PAPER DISCOUNT DTD 08/JUL/2019 DUE 11/OCT/2019 2.28%43,000,000.00 42,749,226.39 99.5641 42,812,579.72 42,749,226.39 42,812,579.72 0.00 63,353.33 42,812,579.72 0.63%
59157UVC1 METLIFE SHORT TERM FDG CORPORATE COMMERCIAL PAPER DISCOUNT DTD 11/FEB/2019 DUE 12/AUG/2019 2.71%22,000,000.00 21,705,261.11 99.9190 21,982,186.11 21,705,261.11 21,982,186.11 0.00 276,925.00 21,982,186.11 0.32%
59157UX47 METLIFE SHORT TERM FDG CORPORATE COMMERCIAL PAPER DISCOUNT DTD 17/JUN/2019 DUE 04/OCT/2019 2.38%22,000,000.00 21,900,963.33 99.6053 21,913,173.33 21,900,963.33 21,913,173.33 0.00 12,210.00 21,913,173.33 0.32%
60710A2N1 MIZUHO BANK LTD CERTIFICATE OF DEPOSIT FIXED DTD 13/FEB/2019 DUE 09/AUG/2019 2.68%41,350,000.00 41,358,408.28 100.0065 41,352,690.65 41,358,408.28 41,352,690.65 520,228.94 (5,717.63) 41,872,919.59 0.61%
55379WT89 MUFG BANK LTD NY BRAN CERTIFICATE OF DEPOSIT FIXED DTD 11/JUL/2019 DUE 11/OCT/2019 2.27%50,000,000.00 50,000,000.00 100.0000 50,000,000.00 50,000,000.00 50,000,000.00 66,208.33 0.00 50,066,208.33 0.73%
63763QV53 NATIONAL SECS CLEARING CORPORATE COMMERCIAL PAPER DISCOUNT DTD 02/MAY/2019 DUE 05/AUG/2019 2.52%20,000,000.00 19,871,533.33 99.9727 19,994,533.33 19,871,533.33 19,994,533.33 0.00 123,000.00 19,994,533.33 0.29%
63763QV87 NATIONAL SECS CLEARING CORPORATE COMMERCIAL PAPER DISCOUNT DTD 10/MAY/2019 DUE 08/AUG/2019 2.52%40,000,000.00 39,777,451.39 99.9524 39,980,973.61 39,777,451.39 39,980,973.61 0.00 203,522.22 39,980,973.61 0.58%
63763QW60 NATIONAL SECS CLEARING CORPORATE COMMERCIAL PAPER DISCOUNT DTD 11/DEC/2018 DUE 06/SEP/2019 3%18,000,000.00 17,603,225.00 99.7050 17,946,900.00 17,603,225.00 17,946,900.00 0.00 343,675.00 17,946,900.00 0.26%
63763QVW4 NATIONAL SECS CLEARING CORPORATE COMMERCIAL PAPER DISCOUNT DTD 23/MAY/2019 DUE 30/AUG/2019 2.48%50,000,000.00 49,893,055.56 99.8228 49,911,388.89 49,893,055.56 49,911,388.89 0.00 18,333.33 49,911,388.89 0.73%
63763QVS3 NATIONAL SECS CLEARING CORPORATE COMMERCIAL PAPER DISCOUNT DTD 28/MAY/2019 DUE 26/AUG/2019 2.48%11,000,000.00 10,933,917.50 99.8313 10,981,437.50 10,933,917.50 10,981,437.50 0.00 47,520.00 10,981,437.50 0.16%
63253KVG9 NAT'L AUSTRALIA FNDG CORPORATE COMMERCIAL PAPER DISCOUNT DTD 14/MAY/2019 DUE 16/AUG/2019 2.42%15,000,000.00 14,905,216.67 99.8992 14,984,875.00 14,905,216.67 14,984,875.00 0.00 79,658.33 14,984,875.00 0.22%
63253KY19 NAT'L AUSTRALIA FNDG CORPORATE COMMERCIAL PAPER DISCOUNT DTD 30/JUL/2019 DUE 01/NOV/2019 2.18%50,000,000.00 49,715,388.89 99.4429 49,721,444.45 49,715,388.89 49,721,444.45 0.00 6,055.56 49,721,444.45 0.73%
64105HYC0 NESTLE CAP CORP CORPORATE COMMERCIAL PAPER DISCOUNT DTD 15/FEB/2019 DUE 12/NOV/2019 2.65%25,000,000.00 24,692,048.61 99.2990 24,824,756.94 24,692,048.61 24,824,756.94 0.00 132,708.33 24,824,756.94 0.36%
65558TJC0 NORDEA BK ABP NY CERTIFICATE OF DEPOSIT FIXED DTD 05/JUN/2019 DUE 05/SEP/2019 2.41%27,000,000.00 27,000,000.00 100.0000 27,000,000.00 27,000,000.00 27,000,000.00 103,027.50 0.00 27,103,027.50 0.40%
65558THH1 NORDEA BK ABP NY CERTIFICATE OF DEPOSIT FIXED DTD 06/MAY/2019 DUE 07/OCT/2019 2.53%36,000,000.00 36,000,000.00 100.0000 36,000,000.00 36,000,000.00 36,000,000.00 220,110.00 0.00 36,220,110.00 0.53%
65558TGJ8 NORDEA BK ABP NY CERTIFICATE OF DEPOSIT FIXED DTD 10/APR/2019 DUE 10/SEP/2019 2.55%42,000,000.00 42,000,000.00 100.0000 42,000,000.00 42,000,000.00 42,000,000.00 336,175.00 0.00 42,336,175.00 0.62%
65558TKV6 NORDEA BK ABP NY CERTIFICATE OF DEPOSIT FIXED DTD 30/JUL/2019 DUE 31/OCT/2019 2.18%16,000,000.00 16,000,000.00 100.0000 16,000,000.00 16,000,000.00 16,000,000.00 1,937.78 0.00 16,001,937.78 0.23%
67984WLW6 OLD LINE FUNDING LLC CORPORATE COMMERCIAL PAPER DISCOUNT DTD 05/JUN/2019 DUE 09/OCT/2019 2.46%35,000,000.00 34,698,650.00 99.5285 34,834,975.00 34,698,650.00 34,834,975.00 0.00 136,325.00 34,834,975.00 0.51%
67984XFL5 OLD LINE FUNDING LLC CORPORATE COMMERCIAL PAPER DISCOUNT DTD 14/JUN/2019 DUE 16/SEP/2019 2.37%20,000,000.00 19,876,233.33 99.6972 19,939,433.33 19,876,233.33 19,939,433.33 0.00 63,200.00 19,939,433.33 0.29%
67983UXP3 OLD LINE FUNDING LLC CORPORATE COMMERCIAL PAPER DISCOUNT DTD 22/JUL/2019 DUE 23/OCT/2019 2.28%21,000,000.00 20,879,022.50 99.4859 20,892,030.83 20,879,022.50 20,892,030.83 0.00 13,008.33 20,892,030.83 0.31%
67983UV18 OLD LINE FUNDING LLC CORPORATE COMMERCIAL PAPER DISCOUNT DTD 28/MAR/2019 DUE 01/AUG/2019 2.59%15,000,000.00 14,878,770.83 100.0000 15,000,000.00 14,878,770.83 15,000,000.00 0.00 121,229.17 15,000,000.00 0.22%
67983UYR8 OLD LINE FUNDING LLC CORPORATE COMMERCIAL PAPER DISCOUNT DTD 28/MAY/2019 DUE 25/NOV/2019 2.53%14,000,000.00 13,828,500.00 99.2106 13,889,477.78 13,828,500.00 13,889,477.78 0.00 60,977.78 13,889,477.78 0.20%
69372BV64 PACCAR FINANCIAL COR CORPORATE COMMERCIAL PAPER DISCOUNT DTD 03/JUL/2019 DUE 06/AUG/2019 2.35%10,000,000.00 9,978,183.33 99.9679 9,996,791.67 9,978,183.33 9,996,791.67 0.00 18,608.34 9,996,791.67 0.15%
69372BVG2 PACCAR FINANCIAL COR CORPORATE COMMERCIAL PAPER DISCOUNT DTD 17/JUL/2019 DUE 16/AUG/2019 2.3%17,000,000.00 16,967,983.33 99.9058 16,983,991.67 16,967,983.33 16,983,991.67 0.00 16,008.34 16,983,991.67 0.25%
69372BVM9 PACCAR FINANCIAL COR CORPORATE COMMERCIAL PAPER DISCOUNT DTD 22/JUL/2019 DUE 21/AUG/2019 2.28%20,000,000.00 19,964,072.22 99.8761 19,975,222.22 19,964,072.22 19,975,222.22 0.00 11,150.00 19,975,222.22 0.29%
71708FY63 PFIZER INC. CORPORATE COMMERCIAL PAPER DISCOUNT DTD 08/JUL/2019 DUE 06/NOV/2019 2.28%26,000,000.00 25,809,492.22 99.4126 25,847,278.89 25,809,492.22 25,847,278.89 0.00 37,786.67 25,847,278.89 0.38%
71708FVD1 PFIZER INC. CORPORATE COMMERCIAL PAPER DISCOUNT DTD 14/MAY/2019 DUE 13/AUG/2019 2.49%50,000,000.00 49,690,347.22 99.9183 49,959,166.67 49,690,347.22 49,959,166.67 0.00 268,819.45 49,959,166.67 0.73%
71708FZH8 PFIZER INC. CORPORATE COMMERCIAL PAPER DISCOUNT DTD 18/JUN/2019 DUE 17/DEC/2019 2.3%25,000,000.00 24,717,187.50 99.1375 24,784,375.00 24,717,187.50 24,784,375.00 0.00 67,187.50 24,784,375.00 0.36%
71708FVU3 PFIZER INC. CORPORATE COMMERCIAL PAPER DISCOUNT DTD 28/MAY/2019 DUE 28/AUG/2019 2.49%20,000,000.00 19,876,311.11 99.8185 19,963,700.00 19,876,311.11 19,963,700.00 0.00 87,388.89 19,963,700.00 0.29%
71838MV23 PHILIP MORRIS INTL INC CORPORATE COMMERCIAL PAPER DISCOUNT DTD 23/JUL/2019 DUE 02/AUG/2019 2.33%75,000,000.00 74,980,833.33 99.9936 74,995,208.34 74,980,833.33 74,995,208.34 0.00 14,375.01 74,995,208.34 1.10%
83050PBG3 SKANDIN ENS BANKEN CERTIFICATE OF DEPOSIT FIXED DTD 06/JUN/2019 DUE 07/AUG/2019 2.4%25,000,000.00 25,000,000.00 100.0000 25,000,000.00 25,000,000.00 25,000,000.00 93,333.33 0.00 25,093,333.33 0.37%
83050PAE9 SKANDIN ENS BANKEN CERTIFICATE OF DEPOSIT FIXED DTD 16/APR/2019 DUE 16/OCT/2019 2.58%18,000,000.00 18,000,000.00 100.0000 18,000,000.00 18,000,000.00 18,000,000.00 138,030.00 0.00 18,138,030.00 0.27%
83050PBQ1 SKANDIN ENS BANKEN CERTIFICATE OF DEPOSIT FIXED DTD 17/JUN/2019 DUE 19/AUG/2019 2.33%50,000,000.00 50,000,000.00 100.0000 50,000,000.00 50,000,000.00 50,000,000.00 145,625.00 0.00 50,145,625.00 0.73%
83050PBR9 SKANDIN ENS BANKEN CERTIFICATE OF DEPOSIT FIXED DTD 18/JUN/2019 DUE 19/AUG/2019 2.33%23,000,000.00 23,000,000.00 100.0000 23,000,000.00 23,000,000.00 23,000,000.00 65,498.89 0.00 23,065,498.89 0.34%
86565BH20 SUMITOMO MITSUI BANKING CORP/NEW YORK CERTIFICATE OF DEPOSIT VARIABLE 24/JAN/2020 USD 100048,000,000.00 48,000,000.00 100.0000 48,000,000.00 48,000,000.00 48,000,000.00 25,804.07 0.00 48,025,804.07 0.70%
86565BC25 SUMITOMO MTSU BKG CORP CERTIFICATE OF DEPOSIT FIXED DTD 06/JUN/2019 DUE 09/SEP/2019 2.4%70,000,000.00 70,000,000.00 100.0000 70,000,000.00 70,000,000.00 70,000,000.00 261,333.33 0.00 70,261,333.33 1.03%
86959RAS9 SVENSKA HANDELSBANKEN/NEW YORK NY CERTIFICATE OF DEPOSIT VARIABLE 08/APR/2020 USD 100050,000,000.00 50,000,000.00 100.0000 50,000,000.00 50,000,000.00 50,000,000.00 82,804.32 0.00 50,082,804.32 0.73%
86958J2Q1 SVENSKA HANDELSBANKEN/NEW YORK NY CERTIFICATE OF DEPOSIT VARIABLE 12/SEP/2019 USD 100025,000,000.00 25,000,000.00 100.0000 25,000,000.00 25,000,000.00 25,000,000.00 37,487.90 0.00 25,037,487.90 0.37%
86958J3Z0 SVENSKA HANDELSBANKEN/NEW YORK NY CERTIFICATE OF DEPOSIT VARIABLE 22/OCT/2019 USD 100025,000,000.00 25,000,000.00 100.0000 25,000,000.00 25,000,000.00 25,000,000.00 17,440.98 0.00 25,017,440.98 0.37%
86959RAJ9 SVENSKA HANDELSBANKEN/NEW YORK NY CERTIFICATE OF DEPOSIT VARIABLE 27/MAR/2020 USD 100050,000,000.00 50,000,000.00 100.0000 50,000,000.00 50,000,000.00 50,000,000.00 9,838.04 0.00 50,009,838.04 0.73%
87019VXD4 SWEDBANK (SPARBANK) CERTIFICATE OF DEPOSIT FIXED DTD 05/JUN/2019 DUE 07/OCT/2019 2.43%30,000,000.00 30,000,000.00 100.0000 30,000,000.00 30,000,000.00 30,000,000.00 115,425.00 0.00 30,115,425.00 0.44%
87019VXK8 SWEDBANK (SPARBANK) CERTIFICATE OF DEPOSIT FIXED DTD 15/JUL/2019 DUE 15/NOV/2019 2.29%100,000,000.00 100,000,000.00 100.0000 100,000,000.00 100,000,000.00 100,000,000.00 108,138.89 0.00 100,108,138.89 1.46%
87019VXQ5 SWEDBANK (SPARBANK) CERTIFICATE OF DEPOSIT FIXED DTD 29/JUL/2019 DUE 29/NOV/2019 2.23%40,000,000.00 40,000,000.00 100.0000 40,000,000.00 40,000,000.00 40,000,000.00 7,433.33 0.00 40,007,433.33 0.58%
88603GLD0 THUNDER BAY FNDNG LL CORPORATE COMMERCIAL PAPER DISCOUNT DTD 05/JUN/2019 DUE 09/OCT/2019 2.46%40,000,000.00 39,655,600.00 99.5285 39,811,400.00 39,655,600.00 39,811,400.00 0.00 155,800.00 39,811,400.00 0.58%
88603YFL0 THUNDER BAY FNDNG LL CORPORATE COMMERCIAL PAPER VARIABLE DTD 10/JUN/2019 DUE 10/DEC/201927,000,000.00 27,000,000.00 100.0000 27,000,000.00 27,000,000.00 27,000,000.00 40,909.79 0.00 27,040,909.79 0.40%
88602UV80 THUNDER BAY FNDNG LLC. CORPORATE COMMERCIAL PAPER DISCOUNT DTD 06/JUN/2019 DUE 08/AUG/2019 2.46%18,000,000.00 17,924,085.00 99.9531 17,991,565.00 17,924,085.00 17,991,565.00 0.00 67,480.00 17,991,565.00 0.26%
88602UVL1 THUNDER BAY FNDNG LLC. CORPORATE COMMERCIAL PAPER DISCOUNT DTD 20/FEB/2019 DUE 20/AUG/2019 2.65%16,000,000.00 15,824,782.22 99.8649 15,978,382.22 15,824,782.22 15,978,382.22 0.00 153,600.00 15,978,382.22 0.23%
89114MPH4 TORONTO-DOMINION BANK/NY CALLABLE CERTIFICATE OF DEPOSIT VARIABLE 06/DEC/2019 USD 100045,000,000.00 45,000,000.00 100.0000 45,000,000.00 45,000,000.00 45,000,000.00 82,623.89 0.00 45,082,623.89 0.66%
89114MW52 TORONTO-DOMINION CERTIFICATE OF DEPOSIT FIXED DTD 01/JUL/2019 DUE 01/AUG/2019 2.41%23,000,000.00 23,000,000.00 100.0000 23,000,000.00 23,000,000.00 23,000,000.00 47,731.39 0.00 23,047,731.39 0.34%
89114MN94 TORONTO-DOMINION CERTIFICATE OF DEPOSIT FIXED DTD 06/JUN/2019 DUE 06/NOV/2019 2.39%25,000,000.00 25,000,000.00 100.0000 25,000,000.00 25,000,000.00 25,000,000.00 92,944.44 0.00 25,092,944.44 0.37%
89114MH75 TORONTO-DOMINION CERTIFICATE OF DEPOSIT FIXED DTD 09/MAY/2019 DUE 19/AUG/2019 2.528%12,000,000.00 12,002,400.00 100.0055 12,000,654.55 12,002,400.00 12,000,654.55 70,784.00 (1,745.45) 12,071,438.55 0.18%
89114MPS0 TORONTO-DOMINION CERTIFICATE OF DEPOSIT FIXED DTD 10/DEC/2018 DUE 01/AUG/2019 2.92%33,000,000.00 33,000,000.00 100.0000 33,000,000.00 33,000,000.00 33,000,000.00 626,340.00 0.00 33,626,340.00 0.49%
89114MNA1 TORONTO-DOMINION CERTIFICATE OF DEPOSIT FIXED DTD 23/NOV/2018 DUE 25/NOV/2019 3.1%27,000,000.00 27,000,000.00 100.0000 27,000,000.00 27,000,000.00 27,000,000.00 583,575.00 0.00 27,583,575.00 0.40%
89114MFU6 TORONTO-DOMINION CERTIFICATE OF DEPOSIT FIXED DTD 25/SEP/2018 DUE 25/SEP/2019 2.8%23,000,000.00 23,000,000.00 100.0000 23,000,000.00 23,000,000.00 23,000,000.00 554,555.56 0.00 23,554,555.56 0.34%
89114MM20 TORONTO-DOMINION CERTIFICATE OF DEPOSIT FIXED DTD 29/MAY/2019 DUE 30/SEP/2019 2.47%15,000,000.00 15,000,499.65 100.0016 15,000,243.73 15,000,499.65 15,000,243.73 65,866.67 (255.92) 15,066,110.40 0.22%
89233HWB6 TOYOTA MOTOR CREDIT CORPORATE COMMERCIAL PAPER DISCOUNT DTD 13/MAR/2019 DUE 11/SEP/2019 2.57%45,000,000.00 44,722,895.83 99.7324 44,879,562.50 44,722,895.83 44,879,562.50 0.00 156,666.67 44,879,562.50 0.66%
90275DJJ0 UBS AG STAMFORD BRAN CERTIFICATE OF DEPOSIT FIXED DTD 27/FEB/2019 DUE 27/AUG/2019 2.62%30,000,000.00 30,000,000.00 100.0000 30,000,000.00 30,000,000.00 30,000,000.00 338,416.67 0.00 30,338,416.67 0.44%
912796SE0 UNITED STATES OF AMERICA BILL ZERO CPN 22/AUG/2019 USD 100100,000,000.00 98,788,611.11 99.8571 99,857,083.34 98,788,611.11 99,857,083.34 0.00 1,068,472.23 99,857,083.34 1.46%
90333VS35 US BANK N.A. CERTIFICATE OF DEPOSIT FIXED DTD 29/MAY/2019 DUE 02/JAN/2020 2.4%50,000,000.00 50,000,000.00 100.0000 50,000,000.00 50,000,000.00 50,000,000.00 213,333.33 0.00 50,213,333.33 0.73%
90333VS92 US BANK N.A. CERTIFICATE OF DEPOSIT VARIABLE DTD 28/JUN/2019 DUE 30/MAR/202050,000,000.00 50,000,000.00 100.0000 50,000,000.00 50,000,000.00 50,000,000.00 6,519.44 0.00 50,006,519.44 0.73%
93114FVK7 WAL-MART INC CORPORATE COMMERCIAL PAPER DISCOUNT DTD 21/MAY/2019 DUE 19/AUG/2019 2.46%14,000,000.00 13,924,400.00 99.8800 13,983,200.00 13,924,400.00 13,983,200.00 0.00 58,800.00 13,983,200.00 0.20%
94989R6C7 WELLS FARGO BANK NA CERTIFICATE OF DEPOSIT FIXED DTD 11/MAR/2019 DUE 11/DEC/2019 2.6%25,000,000.00 25,000,000.00 100.0000 25,000,000.00 25,000,000.00 25,000,000.00 258,194.44 0.00 25,258,194.44 0.37%
95001KAB0 WELLS FARGO BANK NA CERTIFICATE OF DEPOSIT VARIABLE 23/JAN/2020 USD 100050,000,000.00 50,000,000.00 100.0000 50,000,000.00 50,000,000.00 50,000,000.00 29,889.14 0.00 50,029,889.14 0.73%
Version 2.3 Page 2 of 3
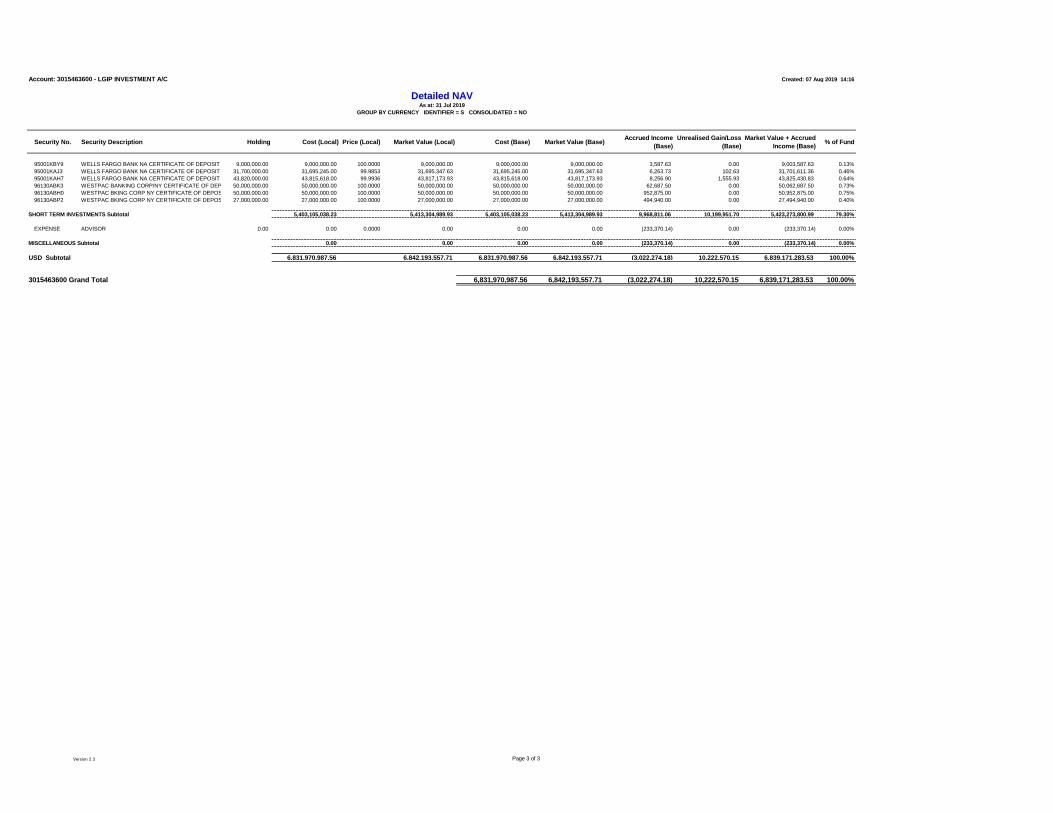
Account: 3015463600 - LGIP INVESTMENT A/C Created: 07 Aug 2019 14:16
Security No. Security Description Holding Cost (Local) Price (Local) Market Value (Local) Cost (Base) Market Value (Base)Accrued Income
(Base)
Unrealised Gain/Loss
(Base)
Market Value + Accrued
Income (Base)% of Fund
Detailed NAVAs at: 31 Jul 2019
GROUP BY CURRENCY IDENTIFIER = S CONSOLIDATED = NO
95001KBY9 WELLS FARGO BANK NA CERTIFICATE OF DEPOSIT VARIABLE 26/MAR/2020 USD 10009,000,000.00 9,000,000.00 100.0000 9,000,000.00 9,000,000.00 9,000,000.00 3,587.63 0.00 9,003,587.63 0.13%
95001KAJ3 WELLS FARGO BANK NA CERTIFICATE OF DEPOSIT VARIABLE 29/APR/2020 USD 100031,700,000.00 31,695,245.00 99.9853 31,695,347.63 31,695,245.00 31,695,347.63 6,263.73 102.63 31,701,611.36 0.46%
95001KAH7 WELLS FARGO BANK NA CERTIFICATE OF DEPOSIT VARIABLE 29/OCT/2019 USD 100043,820,000.00 43,815,618.00 99.9936 43,817,173.93 43,815,618.00 43,817,173.93 8,256.90 1,555.93 43,825,430.83 0.64%
96130ABK3 WESTPAC BANKING CORP/NY CERTIFICATE OF DEPOSIT VARIABLE 16/SEP/2019 USD 100050,000,000.00 50,000,000.00 100.0000 50,000,000.00 50,000,000.00 50,000,000.00 62,687.50 0.00 50,062,687.50 0.73%
96130ABH0 WESTPAC BKING CORP NY CERTIFICATE OF DEPOSIT FIXED DTD 13/DEC/2018 DUE 13/SEP/2019 2.97%50,000,000.00 50,000,000.00 100.0000 50,000,000.00 50,000,000.00 50,000,000.00 952,875.00 0.00 50,952,875.00 0.75%
96130ABP2 WESTPAC BKING CORP NY CERTIFICATE OF DEPOSIT FIXED DTD 18/DEC/2018 DUE 18/SEP/2019 2.92%27,000,000.00 27,000,000.00 100.0000 27,000,000.00 27,000,000.00 27,000,000.00 494,940.00 0.00 27,494,940.00 0.40%
SHORT TERM INVESTMENTS Subtotal 5,403,105,038.23 5,413,304,989.93 5,403,105,038.23 5,413,304,989.93 9,968,811.06 10,199,951.70 5,423,273,800.99 79.30%
EXPENSE 00015ADVISOR 0.00 0.00 0.0000 0.00 0.00 0.00 (233,370.14) 0.00 (233,370.14) 0.00%
MISCELLANEOUS Subtotal 0.00 0.00 0.00 0.00 (233,370.14) 0.00 (233,370.14) 0.00%
USD Subtotal 6,831,970,987.56 6,842,193,557.71 6,831,970,987.56 6,842,193,557.71 (3,022,274.18) 10,222,570.15 6,839,171,283.53 100.00%
3015463600 Grand Total 6,831,970,987.56 6,842,193,557.71 (3,022,274.18) 10,222,570.15 6,839,171,283.53 100.00%
Version 2.3 Page 3 of 3
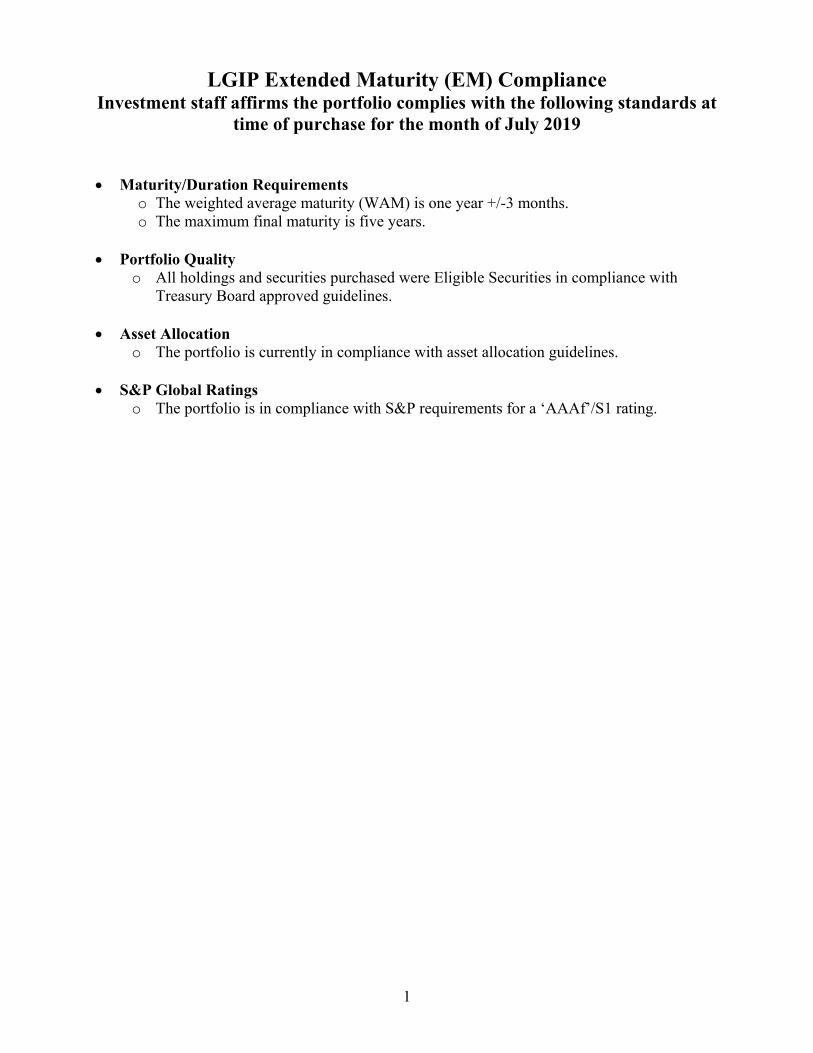
1
LGIP Extended Maturity (EM) Compliance Investment staff affirms the portfolio complies with the following standards at
time of purchase for the month of July 2019 Maturity/Duration Requirements
o The weighted average maturity (WAM) is one year +/-3 months. o The maximum final maturity is five years.
Portfolio Quality
o All holdings and securities purchased were Eligible Securities in compliance with Treasury Board approved guidelines.
Asset Allocation
o The portfolio is currently in compliance with asset allocation guidelines. S&P Global Ratings
o The portfolio is in compliance with S&P requirements for a ‘AAAf’/S1 rating.

Jul Jun Change
US MMK FundsLGIP 10.8% 9.0% 1.8%
Sub-Total 10.8% 9.0% 1.8%
Government SecuritiesUS Gov MMK Funds 0.0% 0.0% 0.0%
Repurchase Agreements 0.0% 0.0% 0.0%
U.S. Treasury 0.0% 0.0% 0.0%
Agency Securities 49.8% 49.8% 0.0%
AAA Sovereign 0.0% 0.0% 0.0%Sub-Total 49.8% 49.8% 0.0%
Credit Securities
CD's, Bank Notes & Bankers Acceptance 12.8% 13.5% -0.7%
Commercial Paper 3.4% 5.2% -1.8%
Corporate Notes 23.2% 22.5% 0.7%Sub-Total 39.4% 41.2% -1.8%
Total 100% 100%Asset allocation calculations are based on end of month balance while portfolio compliance is measured at the time an asset is purchased.
Totals may not add due to rounding.
Asset Allocation and Risk ProfileLocal Government Investment Pool EM
July 31, 2019
2
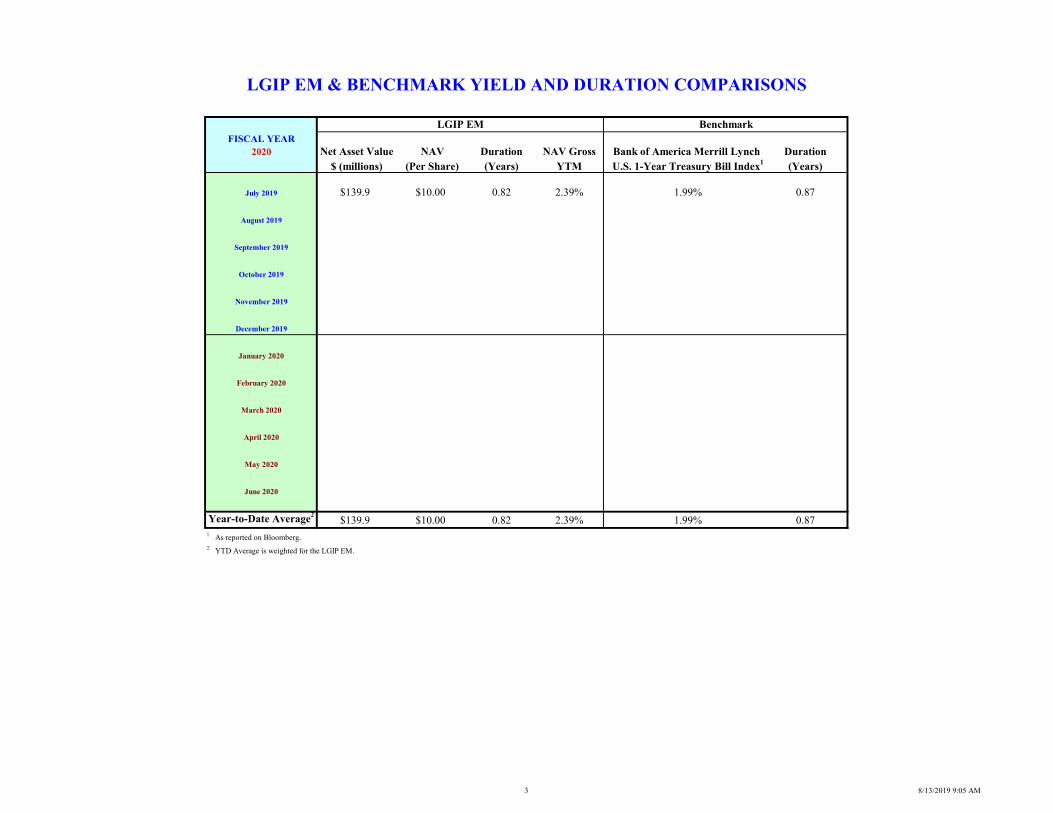
FISCAL YEAR2020 Net Asset Value NAV Duration NAV Gross Bank of America Merrill Lynch Duration
$ (millions) (Per Share) (Years) YTM U.S. 1-Year Treasury Bill Index1 (Years)
July 2019 $139.9 $10.00 0.82 2.39% 1.99% 0.87
August 2019
September 2019
October 2019
November 2019
December 2019
January 2020
February 2020
March 2020
April 2020
May 2020
June 2020
Year-to-Date Average2$139.9 $10.00 0.82 2.39% 1.99% 0.87
1 As reported on Bloomberg.2 YTD Average is weighted for the LGIP EM.
LGIP EM & BENCHMARK YIELD AND DURATION COMPARISONS
LGIP EM Benchmark
3 8/13/2019 9:05 AM
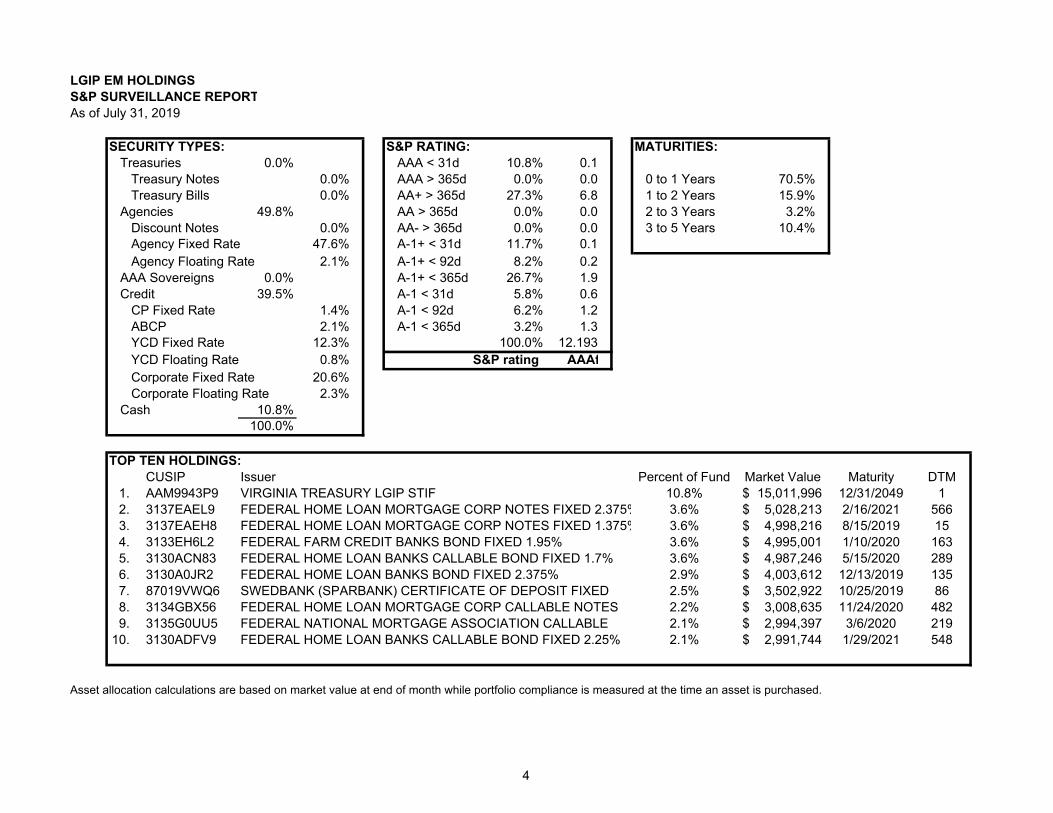
LGIP EM HOLDINGSS&P SURVEILLANCE REPORTAs of July 31, 2019
SECURITY TYPES: S&P RATING: MATURITIES:Treasuries 0.0% AAA < 31d 10.8% 0.1
Treasury Notes 0.0% AAA > 365d 0.0% 0.0 0 to 1 Years 70.5%Treasury Bills 0.0% AA+ > 365d 27.3% 6.8 1 to 2 Years 15.9%
Agencies 49.8% AA > 365d 0.0% 0.0 2 to 3 Years 3.2%Discount Notes 0.0% AA- > 365d 0.0% 0.0 3 to 5 Years 10.4%Agency Fixed Rate 47.6% A-1+ < 31d 11.7% 0.1Agency Floating Rate 2.1% A-1+ < 92d 8.2% 0.2
AAA Sovereigns 0.0% A-1+ < 365d 26.7% 1.9Credit 39.5% A-1 < 31d 5.8% 0.6
CP Fixed Rate 1.4% A-1 < 92d 6.2% 1.2ABCP 2.1% A-1 < 365d 3.2% 1.3YCD Fixed Rate 12.3% 100.0% 12.193YCD Floating Rate 0.8% S&P rating AAAfCorporate Fixed Rate 20.6%Corporate Floating Rate 2.3%
Cash 10.8%100.0%
TOP TEN HOLDINGS:CUSIP Issuer Percent of Fund Market Value Maturity DTM
1. AAM9943P9 VIRGINIA TREASURY LGIP STIF 10.8% 15,011,996$ 12/31/2049 12. 3137EAEL9 FEDERAL HOME LOAN MORTGAGE CORP NOTES FIXED 2.375% 3.6% 5,028,213$ 2/16/2021 5663. 3137EAEH8 FEDERAL HOME LOAN MORTGAGE CORP NOTES FIXED 1.375% 3.6% 4,998,216$ 8/15/2019 154. 3133EH6L2 FEDERAL FARM CREDIT BANKS BOND FIXED 1.95% 3.6% 4,995,001$ 1/10/2020 1635. 3130ACN83 FEDERAL HOME LOAN BANKS CALLABLE BOND FIXED 1.7% 3.6% 4,987,246$ 5/15/2020 2896. 3130A0JR2 FEDERAL HOME LOAN BANKS BOND FIXED 2.375% 2.9% 4,003,612$ 12/13/2019 1357. 87019VWQ6 SWEDBANK (SPARBANK) CERTIFICATE OF DEPOSIT FIXED 2.5% 3,502,922$ 10/25/2019 868. 3134GBX56 FEDERAL HOME LOAN MORTGAGE CORP CALLABLE NOTES 2.2% 3,008,635$ 11/24/2020 4829. 3135G0UU5 FEDERAL NATIONAL MORTGAGE ASSOCIATION CALLABLE 2.1% 2,994,397$ 3/6/2020 219
10. 3130ADFV9 FEDERAL HOME LOAN BANKS CALLABLE BOND FIXED 2.25% 2.1% 2,991,744$ 1/29/2021 548
Asset allocation calculations are based on market value at end of month while portfolio compliance is measured at the time an asset is purchased.
4
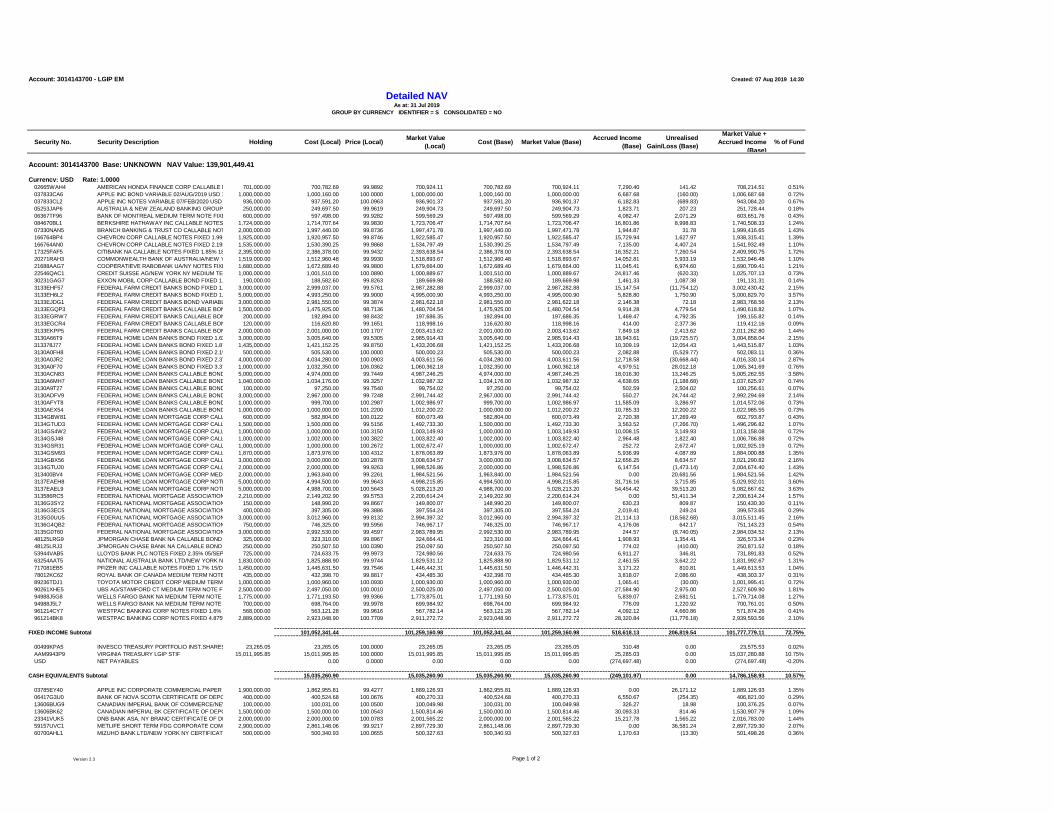
Account: 3014143700 - LGIP EM Created: 07 Aug 2019 14:30
Security No. Security Description Holding Cost (Local) Price (Local)Market Value
(Local)Cost (Base) Market Value (Base)
Accrued Income
(Base)
Unrealised
Gain/Loss (Base)
Market Value +
Accrued Income
(Base)
% of Fund
Account: 3014143700 Base: UNKNOWN NAV Value: 139,901,449.41
Currency: USD Rate: 1.000002665WAH4 AMERICAN HONDA FINANCE CORP CALLABLE MEDIUM TERM NOTE FIXED 2.25% 15/AUG/2019 USD 1000701,000.00 700,782.69 99.9892 700,924.11 700,782.69 700,924.11 7,290.40 141.42 708,214.51 0.51%
037833CA6 APPLE INC BOND VARIABLE 02/AUG/2019 USD 1000 1,000,000.00 1,000,160.00 100.0000 1,000,000.00 1,000,160.00 1,000,000.00 6,687.68 (160.00) 1,006,687.68 0.72%
037833CL2 APPLE INC NOTES VARIABLE 07/FEB/2020 USD 1000 936,000.00 937,591.20 100.0963 936,901.37 937,591.20 936,901.37 6,182.83 (689.83) 943,084.20 0.67%
05253JAP6 AUSTRALIA & NEW ZEALAND BANKING GROUP LTD/NEW YORK NY NOTES FIXED 2.05% 23/SEP/2019 USD 1000250,000.00 249,697.50 99.9619 249,904.73 249,697.50 249,904.73 1,823.71 207.23 251,728.44 0.18%
06367TF96 BANK OF MONTREAL MEDIUM TERM NOTE FIXED 1.75% 11/SEP/2019 USD 1000600,000.00 597,498.00 99.9282 599,569.29 597,498.00 599,569.29 4,082.47 2,071.29 603,651.76 0.43%
084670BL1 BERKSHIRE HATHAWAY INC CALLABLE NOTES FIXED 2.1% 14/AUG/2019 USD 10001,724,000.00 1,714,707.64 99.9830 1,723,706.47 1,714,707.64 1,723,706.47 16,801.86 8,998.83 1,740,508.33 1.24%
07330NAN5 BRANCH BANKING & TRUST CO CALLABLE NOTES FIXED 2.1% 15/JAN/2020 USD 10002,000,000.00 1,997,440.00 99.8736 1,997,471.78 1,997,440.00 1,997,471.78 1,944.87 31.78 1,999,416.65 1.43%
166764BP4 CHEVRON CORP CALLABLE NOTES FIXED 1.991% 03/MAR/2020 USD 10001,925,000.00 1,920,957.50 99.8746 1,922,585.47 1,920,957.50 1,922,585.47 15,729.94 1,627.97 1,938,315.41 1.39%
166764AN0 CHEVRON CORP CALLABLE NOTES FIXED 2.193% 15/NOV/2019 USD 10001,535,000.00 1,530,390.25 99.9868 1,534,797.49 1,530,390.25 1,534,797.49 7,135.00 4,407.24 1,541,932.49 1.10%
17325FAF5 CITIBANK NA CALLABLE NOTES FIXED 1.85% 18/SEP/2019 USD 10002,395,000.00 2,386,378.00 99.9432 2,393,638.54 2,386,378.00 2,393,638.54 16,352.21 7,260.54 2,409,990.75 1.72%
20271RAH3 COMMONWEALTH BANK OF AUSTRALIA/NEW YORK NY BOND FIXED 2.3% 06/SEP/2019 USD 10001,519,000.00 1,512,960.48 99.9930 1,518,893.67 1,512,960.48 1,518,893.67 14,052.81 5,933.19 1,532,946.48 1.10%
21688AAG7 COOPERATIEVE RABOBANK UA/NY NOTES FIXED 1.375% 09/AUG/2019 USD 10001,680,000.00 1,672,689.40 99.9800 1,679,664.00 1,672,689.40 1,679,664.00 11,045.41 6,974.60 1,690,709.41 1.21%
22546QAC1 CREDIT SUISSE AG/NEW YORK NY MEDIUM TERM NOTE FIXED 5.3% 13/AUG/2019 USD 10001,000,000.00 1,001,510.00 100.0890 1,000,889.67 1,001,510.00 1,000,889.67 24,817.46 (620.33) 1,025,707.13 0.73%
30231GAG7 EXXON MOBIL CORP CALLABLE BOND FIXED 1.912% 06/MAR/2020 USD 1000190,000.00 188,582.60 99.8263 189,669.98 188,582.60 189,669.98 1,461.33 1,087.38 191,131.31 0.14%
3133EHF57 FEDERAL FARM CREDIT BANKS BOND FIXED 1.68% 13/OCT/2020 USD 10003,000,000.00 2,999,037.00 99.5761 2,987,282.88 2,999,037.00 2,987,282.88 15,147.54 (11,754.12) 3,002,430.42 2.15%
3133EH6L2 FEDERAL FARM CREDIT BANKS BOND FIXED 1.95% 10/JAN/2020 USD 10005,000,000.00 4,993,250.00 99.9000 4,995,000.90 4,993,250.00 4,995,000.90 5,828.80 1,750.90 5,000,829.70 3.57%
3133EJDG1 FEDERAL FARM CREDIT BANKS BOND VARIABLE 21/FEB/2023 USD 10003,000,000.00 2,981,550.00 99.3874 2,981,622.18 2,981,550.00 2,981,622.18 2,146.38 72.18 2,983,768.56 2.13%
3133EGQP3 FEDERAL FARM CREDIT BANKS CALLABLE BOND FIXED 1.44% 16/AUG/2021 USD 10001,500,000.00 1,475,925.00 98.7136 1,480,704.54 1,475,925.00 1,480,704.54 9,914.28 4,779.54 1,490,618.82 1.07%
3133EGRW7 FEDERAL FARM CREDIT BANKS CALLABLE BOND FIXED 1.67% 23/AUG/2022 USD 1000200,000.00 192,894.00 98.8432 197,686.35 192,894.00 197,686.35 1,469.47 4,792.35 199,155.82 0.14%
3133EGCR4 FEDERAL FARM CREDIT BANKS CALLABLE BOND FIXED 2.07% 01/JUN/2023 USD 1000120,000.00 116,620.80 99.1651 118,998.16 116,620.80 118,998.16 414.00 2,377.36 119,412.16 0.09%
3133EKPP5 FEDERAL FARM CREDIT BANKS CALLABLE BOND FIXED 2.52% 05/JUN/2024 USD 10002,000,000.00 2,001,000.00 100.1707 2,003,413.62 2,001,000.00 2,003,413.62 7,849.18 2,413.62 2,011,262.80 1.44%
3130A66T9 FEDERAL HOME LOAN BANKS BOND FIXED 1.625% 11/SEP/2020 USD 50003,000,000.00 3,005,640.00 99.5305 2,985,914.43 3,005,640.00 2,985,914.43 18,943.61 (19,725.57) 3,004,858.04 2.15%
313378J77 FEDERAL HOME LOAN BANKS BOND FIXED 1.875% 13/MAR/2020 USD 50001,435,000.00 1,421,152.25 99.8750 1,433,206.68 1,421,152.25 1,433,206.68 10,309.19 12,054.43 1,443,515.87 1.03%
3130A0FH8 FEDERAL HOME LOAN BANKS BOND FIXED 2.1% 20/NOV/2019 USD 5000500,000.00 505,530.00 100.0000 500,000.23 505,530.00 500,000.23 2,082.88 (5,529.77) 502,083.11 0.36%
3130A0JR2 FEDERAL HOME LOAN BANKS BOND FIXED 2.375% 13/DEC/2019 USD 50004,000,000.00 4,034,280.00 100.0903 4,003,611.56 4,034,280.00 4,003,611.56 12,718.58 (30,668.44) 4,016,330.14 2.87%
3130A0F70 FEDERAL HOME LOAN BANKS BOND FIXED 3.375% 08/DEC/2023 USD 50001,000,000.00 1,032,350.00 106.0362 1,060,362.18 1,032,350.00 1,060,362.18 4,979.51 28,012.18 1,065,341.69 0.76%
3130ACN83 FEDERAL HOME LOAN BANKS CALLABLE BOND FIXED 1.7% 15/MAY/2020 USD 50005,000,000.00 4,974,000.00 99.7449 4,987,246.25 4,974,000.00 4,987,246.25 18,016.30 13,246.25 5,005,262.55 3.58%
3130A6MH7 FEDERAL HOME LOAN BANKS CALLABLE BOND FIXED 1.72% 28/OCT/2020 USD 50001,040,000.00 1,034,176.00 99.3257 1,032,987.32 1,034,176.00 1,032,987.32 4,638.65 (1,188.68) 1,037,625.97 0.74%
3130A9T27 FEDERAL HOME LOAN BANKS CALLABLE BOND FIXED 1.89% 26/OCT/2023 USD 5000100,000.00 97,250.00 99.7540 99,754.02 97,250.00 99,754.02 502.59 2,504.02 100,256.61 0.07%
3130ADFV9 FEDERAL HOME LOAN BANKS CALLABLE BOND FIXED 2.25% 29/JAN/2021 USD 50003,000,000.00 2,967,000.00 99.7248 2,991,744.42 2,967,000.00 2,991,744.42 550.27 24,744.42 2,992,294.69 2.14%
3130AFYT8 FEDERAL HOME LOAN BANKS CALLABLE BOND FIXED 2.88% 06/MAR/2024 USD 50001,000,000.00 999,700.00 100.2987 1,002,986.97 999,700.00 1,002,986.97 11,585.09 3,286.97 1,014,572.06 0.73%
3130AEX54 FEDERAL HOME LOAN BANKS CALLABLE BOND FIXED 3.15% 28/SEP/2023 USD 50001,000,000.00 1,000,000.00 101.2200 1,012,200.22 1,000,000.00 1,012,200.22 10,785.33 12,200.22 1,022,985.55 0.73%
3134GBW81 FEDERAL HOME LOAN MORTGAGE CORP CALLABLE MEDIUM TERM NOTE FIXED 2.35% 22/NOV/2022 USD 1000600,000.00 582,804.00 100.0122 600,073.49 582,804.00 600,073.49 2,720.38 17,269.49 602,793.87 0.43%
3134GTUD3 FEDERAL HOME LOAN MORTGAGE CORP CALLABLE MEDIUM TERM NOTE FIXED 2.35% 25/JUN/2024 USD 10001,500,000.00 1,500,000.00 99.5156 1,492,733.30 1,500,000.00 1,492,733.30 3,563.52 (7,266.70) 1,496,296.82 1.07%
3134GS4W2 FEDERAL HOME LOAN MORTGAGE CORP CALLABLE MEDIUM TERM NOTE FIXED 2.9% 27/MAR/2024 USD 10001,000,000.00 1,000,000.00 100.3150 1,003,149.93 1,000,000.00 1,003,149.93 10,008.15 3,149.93 1,013,158.08 0.72%
3134GSJ48 FEDERAL HOME LOAN MORTGAGE CORP CALLABLE MEDIUM TERM NOTE FIXED 3.1% 27/JUN/2022 USD 10001,000,000.00 1,002,000.00 100.3822 1,003,822.40 1,002,000.00 1,003,822.40 2,964.48 1,822.40 1,006,786.88 0.72%
3134GSR31 FEDERAL HOME LOAN MORTGAGE CORP CALLABLE MEDIUM TERM NOTE FIXED 3.1% 29/JAN/2024 USD 10001,000,000.00 1,000,000.00 100.2672 1,002,672.47 1,000,000.00 1,002,672.47 252.72 2,672.47 1,002,925.19 0.72%
3134GSM93 FEDERAL HOME LOAN MORTGAGE CORP CALLABLE MEDIUM TERM NOTE FIXED 3.32% 27/DEC/2023 USD 10001,870,000.00 1,873,976.00 100.4312 1,878,063.89 1,873,976.00 1,878,063.89 5,936.99 4,087.89 1,884,000.88 1.35%
3134GBX56 FEDERAL HOME LOAN MORTGAGE CORP CALLABLE NOTES FIXED 2.25% 24/NOV/2020 USD 10003,000,000.00 3,000,000.00 100.2878 3,008,634.57 3,000,000.00 3,008,634.57 12,656.25 8,634.57 3,021,290.82 2.16%
3134GTUJ0 FEDERAL HOME LOAN MORTGAGE CORP CALLABLE NOTES FIXED 2.5% 17/JUN/2022 USD 10002,000,000.00 2,000,000.00 99.9263 1,998,526.86 2,000,000.00 1,998,526.86 6,147.54 (1,473.14) 2,004,674.40 1.43%
313400BV4 FEDERAL HOME LOAN MORTGAGE CORP MEDIUM TERM NOTE ZERO CPN 29/NOV/2019 USD 10002,000,000.00 1,963,840.00 99.2261 1,984,521.56 1,963,840.00 1,984,521.56 0.00 20,681.56 1,984,521.56 1.42%
3137EAEH8 FEDERAL HOME LOAN MORTGAGE CORP NOTES FIXED 1.375% 15/AUG/2019 USD 10005,000,000.00 4,994,500.00 99.9643 4,998,215.85 4,994,500.00 4,998,215.85 31,716.16 3,715.85 5,029,932.01 3.60%
3137EAEL9 FEDERAL HOME LOAN MORTGAGE CORP NOTES FIXED 2.375% 16/FEB/2021 USD 10005,000,000.00 4,988,700.00 100.5643 5,028,213.20 4,988,700.00 5,028,213.20 54,454.42 39,513.20 5,082,667.62 3.63%
313586RC5 FEDERAL NATIONAL MORTGAGE ASSOCIATION BOND ZERO CPN 09/OCT/2019 USD 50002,210,000.00 2,149,202.90 99.5753 2,200,614.24 2,149,202.90 2,200,614.24 0.00 51,411.34 2,200,614.24 1.57%
3136G3SY2 FEDERAL NATIONAL MORTGAGE ASSOCIATION CALLABLE NOTES FIXED 1.25% 30/SEP/2019 USD 1000150,000.00 148,990.20 99.8667 149,800.07 148,990.20 149,800.07 630.23 809.87 150,430.30 0.11%
3136G3EC5 FEDERAL NATIONAL MORTGAGE ASSOCIATION CALLABLE NOTES FIXED 1.5% 30/SEP/2020 USD 1000400,000.00 397,305.00 99.3886 397,554.24 397,305.00 397,554.24 2,019.41 249.24 399,573.65 0.29%
3135G0UU5 FEDERAL NATIONAL MORTGAGE ASSOCIATION CALLABLE NOTES FIXED 1.75% 06/MAR/2020 USD 10003,000,000.00 3,012,960.00 99.8132 2,994,397.32 3,012,960.00 2,994,397.32 21,114.13 (18,562.68) 3,015,511.45 2.16%
3136G4QB2 FEDERAL NATIONAL MORTGAGE ASSOCIATION CALLABLE NOTES FIXED 1.85% 13/OCT/2020 USD 1000750,000.00 746,325.00 99.5956 746,967.17 746,325.00 746,967.17 4,176.06 642.17 751,143.23 0.54%
3135G0T60 FEDERAL NATIONAL MORTGAGE ASSOCIATION NOTES FIXED 1.5% 30/JUL/2020 USD 10003,000,000.00 2,992,530.00 99.4597 2,983,789.95 2,992,530.00 2,983,789.95 244.57 (8,740.05) 2,984,034.52 2.13%
48125LRG9 JPMORGAN CHASE BANK NA CALLABLE BOND FIXED 1.65% 23/SEP/2019 USD 1000325,000.00 323,310.00 99.8967 324,664.41 323,310.00 324,664.41 1,908.93 1,354.41 326,573.34 0.23%
48125LRJ3 JPMORGAN CHASE BANK NA CALLABLE BOND VARIABLE 23/SEP/2019 USD 1000250,000.00 250,507.50 100.0390 250,097.50 250,507.50 250,097.50 774.02 (410.00) 250,871.52 0.18%
53944VAB5 LLOYDS BANK PLC NOTES FIXED 2.35% 05/SEP/2019 USD 1000725,000.00 724,633.75 99.9973 724,980.56 724,633.75 724,980.56 6,911.27 346.81 731,891.83 0.52%
63254AAT5 NATIONAL AUSTRALIA BANK LTD/NEW YORK NOTES FIXED 2.25% 10/JAN/2020 USD 10001,830,000.00 1,825,888.90 99.9744 1,829,531.12 1,825,888.90 1,829,531.12 2,461.55 3,642.22 1,831,992.67 1.31%
717081EB5 PFIZER INC CALLABLE NOTES FIXED 1.7% 15/DEC/2019 USD 10001,450,000.00 1,445,631.50 99.7546 1,446,442.31 1,445,631.50 1,446,442.31 3,171.22 810.81 1,449,613.53 1.04%
78012KC62 ROYAL BANK OF CANADA MEDIUM TERM NOTE FIXED 2.125% 02/MAR/2020 USD 1000435,000.00 432,398.70 99.8817 434,485.30 432,398.70 434,485.30 3,818.07 2,086.60 438,303.37 0.31%
89236TDJ1 TOYOTA MOTOR CREDIT CORP MEDIUM TERM NOTE VARIABLE 18/OCT/2019 USD 10001,000,000.00 1,000,960.00 100.0930 1,000,930.00 1,000,960.00 1,000,930.00 1,065.41 (30.00) 1,001,995.41 0.72%
90261XHE5 UBS AG/STAMFORD CT MEDIUM TERM NOTE FIXED 2.375% 14/AUG/2019 USD 10002,500,000.00 2,497,050.00 100.0010 2,500,025.00 2,497,050.00 2,500,025.00 27,584.90 2,975.00 2,527,609.90 1.81%
94988J5G8 WELLS FARGO BANK NA MEDIUM TERM NOTE FIXED 2.15% 06/DEC/2019 USD 10001,775,000.00 1,771,193.50 99.9366 1,773,875.01 1,771,193.50 1,773,875.01 5,839.07 2,681.51 1,779,714.08 1.27%
94988J5L7 WELLS FARGO BANK NA MEDIUM TERM NOTE FIXED 2.4% 15/JAN/2020 USD 1000700,000.00 698,764.00 99.9978 699,984.92 698,764.00 699,984.92 776.09 1,220.92 700,761.01 0.50%
961214CY7 WESTPAC BANKING CORP NOTES FIXED 1.6% 19/AUG/2019 USD 1000568,000.00 563,121.28 99.9616 567,782.14 563,121.28 567,782.14 4,092.12 4,660.86 571,874.26 0.41%
961214BK8 WESTPAC BANKING CORP NOTES FIXED 4.875% 19/NOV/2019 USD 10002,889,000.00 2,923,048.90 100.7709 2,911,272.72 2,923,048.90 2,911,272.72 28,320.84 (11,776.18) 2,939,593.56 2.10%
FIXED INCOME Subtotal 101,052,341.44 101,259,160.98 101,052,341.44 101,259,160.98 518,618.13 206,819.54 101,777,779.11 72.75%
00499KPA5 INVESCO TREASURY PORTFOLIO INST.SHARES FUND 193123,265.05 23,265.05 100.0000 23,265.05 23,265.05 23,265.05 310.48 0.00 23,575.53 0.02%
AAM9943P9 VIRGINIA TREASURY LGIP STIF 15,011,995.85 15,011,995.85 100.0000 15,011,995.85 15,011,995.85 15,011,995.85 25,285.03 0.00 15,037,280.88 10.75%
USD NET PAYABLES 0.00 0.0000 0.00 0.00 0.00 (274,697.48) 0.00 (274,697.48) -0.20%
CASH EQUIVALENTS Subtotal 15,035,260.90 15,035,260.90 15,035,260.90 15,035,260.90 (249,101.97) 0.00 14,786,158.93 10.57%
03785EY40 APPLE INC CORPORATE COMMERCIAL PAPER DISCOUNT DTD 06/FEB/2019 DUE 04/NOV/2019 2.61%1,900,000.00 1,862,955.81 99.4277 1,889,126.93 1,862,955.81 1,889,126.93 0.00 26,171.12 1,889,126.93 1.35%
06417G3U0 BANK OF NOVA SCOTIA CERTIFICATE OF DEPOSIT FIXED DTD 09/JAN/2019 DUE 09/OCT/2019 2.89%400,000.00 400,524.68 100.0676 400,270.33 400,524.68 400,270.33 6,550.67 (254.35) 406,821.00 0.29%
13606BUG9 CANADIAN IMPERIAL BANK OF COMMERCE/NEW YORK NY CERTIFICATE OF DEPOSIT VARIABLE 20/SEP/2019 USD100,000.00 100,031.00 100.0500 100,049.98 100,031.00 100,049.98 326.27 18.98 100,376.25 0.07%
13606BK62 CANADIAN IMPERIAL BK CERTIFICATE OF DEPOSIT FIXED DTD 30/NOV/2018 DUE 29/AUG/2019 2.96%1,500,000.00 1,500,000.00 100.0543 1,500,814.46 1,500,000.00 1,500,814.46 30,093.33 814.46 1,530,907.79 1.09%
23341VUK5 DNB BANK ASA, NY BRANC CERTIFICATE OF DEPOSIT FIXED DTD 16/APR/2019 DUE 16/OCT/2019 2.56%2,000,000.00 2,000,000.00 100.0783 2,001,565.22 2,000,000.00 2,001,565.22 15,217.78 1,565.22 2,016,783.00 1.44%
59157UVC1 METLIFE SHORT TERM FDG CORPORATE COMMERCIAL PAPER DISCOUNT DTD 11/FEB/2019 DUE 12/AUG/2019 2.71%2,900,000.00 2,861,148.06 99.9217 2,897,729.30 2,861,148.06 2,897,729.30 0.00 36,581.24 2,897,729.30 2.07%
60700AHL1 MIZUHO BANK LTD/NEW YORK NY CERTIFICATE OF DEPOSIT VARIABLE 01/OCT/2019 USD 1000500,000.00 500,340.93 100.0655 500,327.63 500,340.93 500,327.63 1,170.63 (13.30) 501,498.26 0.36%
Detailed NAVAs at: 31 Jul 2019
GROUP BY CURRENCY IDENTIFIER = S CONSOLIDATED = NO
Version 2.3 Page 1 of 2
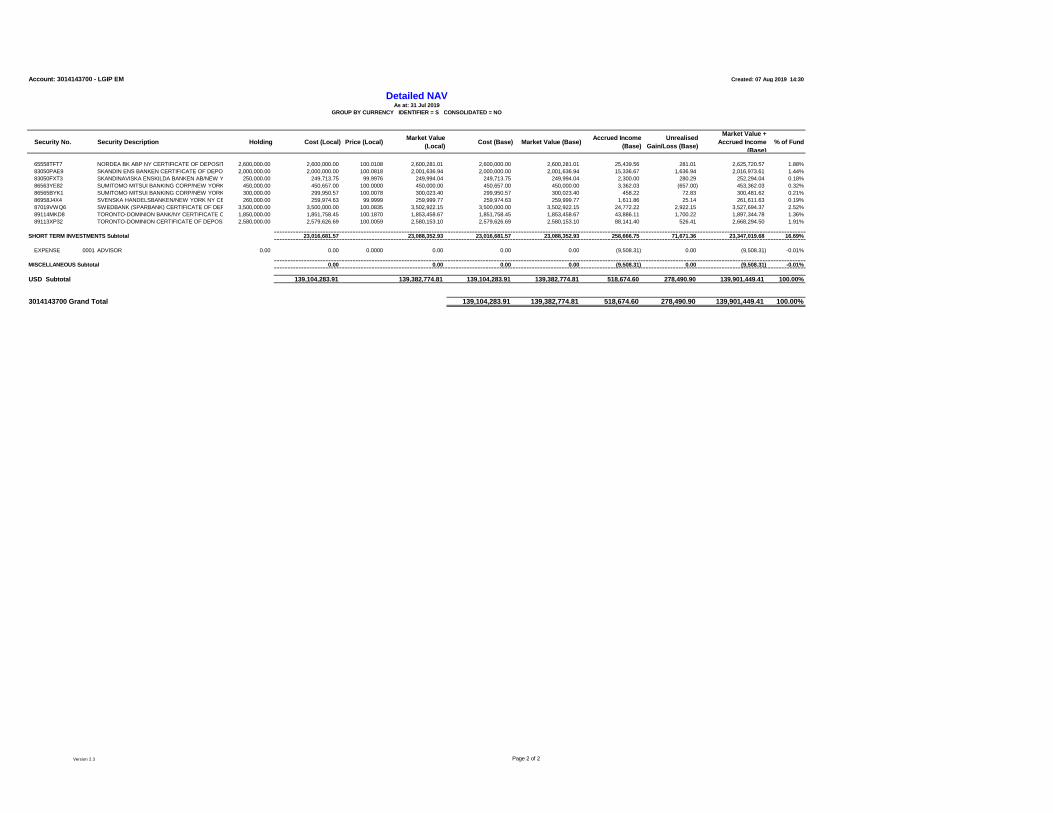
Account: 3014143700 - LGIP EM Created: 07 Aug 2019 14:30
Security No. Security Description Holding Cost (Local) Price (Local)Market Value
(Local)Cost (Base) Market Value (Base)
Accrued Income
(Base)
Unrealised
Gain/Loss (Base)
Market Value +
Accrued Income
(Base)
% of Fund
Detailed NAVAs at: 31 Jul 2019
GROUP BY CURRENCY IDENTIFIER = S CONSOLIDATED = NO
65558TFT7 NORDEA BK ABP NY CERTIFICATE OF DEPOSIT FIXED DTD 18/MAR/2019 DUE 16/AUG/2019 2.59%2,600,000.00 2,600,000.00 100.0108 2,600,281.01 2,600,000.00 2,600,281.01 25,439.56 281.01 2,625,720.57 1.88%
83050PAE9 SKANDIN ENS BANKEN CERTIFICATE OF DEPOSIT FIXED DTD 16/APR/2019 DUE 16/OCT/2019 2.58%2,000,000.00 2,000,000.00 100.0818 2,001,636.94 2,000,000.00 2,001,636.94 15,336.67 1,636.94 2,016,973.61 1.44%
83050FXT3 SKANDINAVISKA ENSKILDA BANKEN AB/NEW YORK NY CERTIFICATE OF DEPOSIT FIXED 1.84% 02/AUG/2019 USD250,000.00 249,713.75 99.9976 249,994.04 249,713.75 249,994.04 2,300.00 280.29 252,294.04 0.18%
86563YE82 SUMITOMO MITSUI BANKING CORP/NEW YORK CERTIFICATE OF DEPOSIT VARIABLE 02/AUG/2019 USD 1000450,000.00 450,657.00 100.0000 450,000.00 450,657.00 450,000.00 3,362.03 (657.00) 453,362.03 0.32%
86565BYK1 SUMITOMO MITSUI BANKING CORP/NEW YORK CERTIFICATE OF DEPOSIT VARIABLE 10/OCT/2019 USD 1000300,000.00 299,950.57 100.0078 300,023.40 299,950.57 300,023.40 458.22 72.83 300,481.62 0.21%
86958J4X4 SVENSKA HANDELSBANKEN/NEW YORK NY CERTIFICATE OF DEPOSIT VARIABLE 07/FEB/2020 USD 1000260,000.00 259,974.63 99.9999 259,999.77 259,974.63 259,999.77 1,611.86 25.14 261,611.63 0.19%
87019VWQ6 SWEDBANK (SPARBANK) CERTIFICATE OF DEPOSIT FIXED DTD 25/APR/2019 DUE 25/OCT/2019 2.6%3,500,000.00 3,500,000.00 100.0835 3,502,922.15 3,500,000.00 3,502,922.15 24,772.22 2,922.15 3,527,694.37 2.52%
89114MKD8 TORONTO-DOMINION BANK/NY CERTIFICATE OF DEPOSIT FIXED 3.05% DTD 25/OCT/2018 DUE 25/OCT/20191,850,000.00 1,851,758.45 100.1870 1,853,458.67 1,851,758.45 1,853,458.67 43,886.11 1,700.22 1,897,344.78 1.36%
89113XP32 TORONTO-DOMINION CERTIFICATE OF DEPOSIT FIXED DTD 14/MAY/2018 DUE 09/AUG/2019 2.77%2,580,000.00 2,579,626.69 100.0059 2,580,153.10 2,579,626.69 2,580,153.10 88,141.40 526.41 2,668,294.50 1.91%
SHORT TERM INVESTMENTS Subtotal 23,016,681.57 23,088,352.93 23,016,681.57 23,088,352.93 258,666.75 71,671.36 23,347,019.68 16.69%
EXPENSE 00015ADVISOR 0.00 0.00 0.0000 0.00 0.00 0.00 (9,508.31) 0.00 (9,508.31) -0.01%
MISCELLANEOUS Subtotal 0.00 0.00 0.00 0.00 (9,508.31) 0.00 (9,508.31) -0.01%
USD Subtotal 139,104,283.91 139,382,774.81 139,104,283.91 139,382,774.81 518,674.60 278,490.90 139,901,449.41 100.00%
3014143700 Grand Total 139,104,283.91 139,382,774.81 518,674.60 278,490.90 139,901,449.41 100.00%
Version 2.3 Page 2 of 2