TRB Planning Applications Conference May 18, 2009 Houston, TX
21
Transportation leadership you can trus TRB Planning Applications Conference May 18, 2009 Houston, TX A Recommended Approach to Delineating A Recommended Approach to Delineating Traffic Analysis Zones in Florida Traffic Analysis Zones in Florida
-
Upload
maisie-mcconnell -
Category
Documents
-
view
26 -
download
1
description
TRB Planning Applications Conference May 18, 2009 Houston, TX. Transportation leadership you can trust. A Recommended Approach to Delineating Traffic Analysis Zones in Florida. Presentation Overview. Purpose and Need Reviewers Recommendation Checklist Delineating TAZs Base-Year Models - PowerPoint PPT Presentation
Transcript of TRB Planning Applications Conference May 18, 2009 Houston, TX

Transportation leadership you can trust.
TRB Planning Applications ConferenceMay 18, 2009Houston, TX
A Recommended Approach to DelineatingA Recommended Approach to DelineatingTraffic Analysis Zones in FloridaTraffic Analysis Zones in Florida

Presentation OverviewPurpose and Need
Reviewers
Recommendation Checklist
Delineating TAZs
• Base-Year Models
• Future-Year TAZ Considerations
• Splitting TAZs
• Topics Requiring Further Research
Where to Find the Full Paper
Acknowledgements and Discussion
Purpose and Need
Purpose
• Provide modelers within Florida guidance on delineating TAZs
• Applicable both to new travel demand models and refining existing models
Need
• Better represent transit access inCube Voyager’s Public Transport (PT) program
• Improved model accuracy for both highwayand transit models
• Consistent approach for Florida’s modeling and planning community

Reviewers
FDOT
Federal Highway Administration (FHWA)
Florida Model Task Force (MTF)
• MTF Model Advancement Committee
• MTF Data Committee
Other interested parties outside Florida

Recommendation Checklist
Persons per TAZ should be greater than 1,200, but less than 3,000 for all years (base and future)
Each TAZ should yield less than 15,000 person trips in all years
The size of each TAZ should be between 0.25 and one square mile in area
Achieve reasonable number of intrazonal trips in each zone based on mix and density of land use
Minimize irregular-shaped TAZs
Centroid connectors should load less than 10,000 to 15,000 vehicles per day in all years

Recommendation Checklist (Cont’d)
Study areas should be large enough so that nearly all (>90%) of trips begin and end within study area
The TAZ structure should be compatible with highway and transit networks for all years
The centroid connectors should represent true access points to highway network
Transit access should be realistically represented
TAZ structure should be compatible with Census, physical, political, and planning district boundaries
Special generators and freight generators should be isolated within their own TAZ

Delineating TAZs in the Base-Year Model
Zone size and quantity
Boundary compatibility
Socioeconomic data
Access
Centroid connectors
Existing transportationfacilities
TAZ numbering
Figure 3.3 Blocks versus Block Groups versus Census Tracts
Census Tracts
Block Groups (Colored Areas)
Blocks

Delineating TAZs in the Base-Year Model Zone Size and Quantity
Size of zones depends on intended use of model• Larger-sized zones for statewide and systems planning
− Statewide models
− TAZs can be larger than the arterial grid
− Up to approximately 20,000 persons per zone
• Medium-sized zones for major investment planning− Regional or MPO models
− Two or more arterials should not traverse the TAZ in any direction
− Up to approximately 4,000 persons per zone
• Small-sized zones for corridor analysis− Corridor level or subarea models
− TAZs in a corridor or subarea should be more refined
− Should be greater than 1,200, but less than 3,000persons per zone

Delineating TAZs in the Base-Year Model Boundary Compatibility
Physical geography
Census geography
Political geography
Planning district/sector boundaries
Irregular zone geography
Figure 3.1 Delineating TAZs Consistent with the Physical Geography
Figure 3.2 Delineating TAZs Based on Permanent Barriers

Delineating TAZs in the Base-Year Model Socioeconomic Data
Special generators
Trips per zone
Developments ofregional impact
Figure 3.10 Delineating TAZs Based on Clusters of Similar Land Uses

Delineating TAZs in the Base-Year Model Access
Transit access
Freight/intermodal facilities
Figure 3.11 Over-Estimating Walk Access to Transit
Development Development
1 mile 0.5 mile
Over-Estimation More Accurate Estimation

Delineating TAZs in the Base-Year Model Centroid Connectors
Represent realistic roadway and transit access
Should not cross man-made or natural barriers
Include sufficient number of centroid connectors to avoid over-loading to one roadway network link
Do not connect centroid connectors at intersectionsor directly to interstate ramps
When two centroid connectors are connected to the same roadway segment, access points should be separated by a certain distance
Figure 3.20 Placement of Centroid Connectors Relative to Intersectionsand Interstate Ramps
The Wrong Way The Right Way
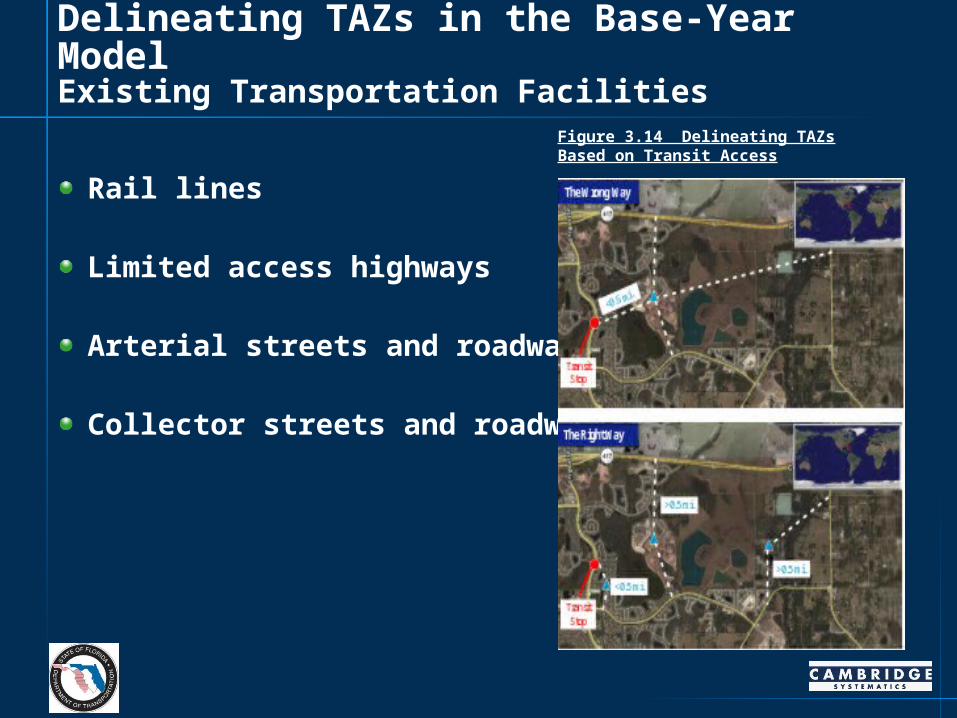
Delineating TAZs in the Base-Year Model Existing Transportation Facilities
Rail lines
Limited access highways
Arterial streets and roadways
Collector streets and roadways
Figure 3.14 Delineating TAZs Based on Transit Access

Delineating TAZs in the Base-Year Model TAZ Numbering
Recommended that TAZ numbers begin with oneand be consecutive
Regional models may set aside a specific range of TAZ numbers for both TAZs and dummy zones for each county
Create TAZ equivalency tables to provide list of new zone numbers split from original zone numbers

Future Year TAZ Considerations
Plannedtransportationcorridors
Developments ofregional impact
Populationand tripsper zone
Figure 4.1 Defining the TAZ Structure Based on Future Corridors
Figure 4.2 Defining the TAZ Structure Based on Future DRI

Future Year TAZ ConsiderationsPopulation and Trips per Zone
Greater than 15,000 trips per day or 1,200 to 3,000 people per TAZ exceeds recommended zone size
• The Census Bureau is currently considering increasing the minimum number of persons per block group (and potentially TAZs) to 1,200 persons (previously 600) or 480 households. The existing maximum thresholds of 3,000 persons and 1,200 households per block group remain unchanged
Often times, a TAZ may not have as many people or generate that many daily trips in the base-year
However, with future-year land use, it may push population or daily trips over the thresholds noted above

Splitting TAZs
Network data impacts
Socioeconomicdata impacts
Boundary shiftsand zone aggregations
Zones beyondmodel boundary
Revalidation
Figure 5.1 Splitting Household Data into New TAZs
Topics Requiring Further Research
Mixed land uses• Delineating TAZs based on homogenous land uses is not
always feasible
• CBDs and neo-traditional developments make it difficult to isolate employees from households
Dynamic subzoning• Potential solution to mixed land use issue
• Includes multiple centroids within one zone; one to represent employment and another to represent households
• Allows different access points onto the network by having one set of centroid connectors for employment and another for households
• Would require further research, including the numberingof subzones

Where to Find the Paper
Full White Paper is on-line at www.fsutmsonline.net

AcknowledgementsFlorida Department of Transportation (FDOT)
• Vidya Mysore, Systems Planning Office (SPO)
• Terry Corkery, SPO
Cambridge Systematics (CS)
• Keli Paul, AICP
• Rob Schiffer, AICP
AECOM Consult
• Dave Schmitt

Discussion
Questions or Comments?
Keli Paul, AICPCambridge Systematics
Senior AssociateTallahassee, FL 32301
Terry CorkeryFDOT, Systems Planning OfficeSenior Transportation Modeler
Tallahassee, FL 32399850.414.4900