Travel apps for Disabled People: Evaluating their ...eprints.whiterose.ac.uk/101880/1/matthews and...
22
This is a repository copy of Travel apps for Disabled People: Evaluating their contribution towards inclusive transport. White Rose Research Online URL for this paper: http://eprints.whiterose.ac.uk/101880/ Version: Accepted Version Conference or Workshop Item: Matthews, B and Wardman, MR (2015) Travel apps for Disabled People: Evaluating their contribution towards inclusive transport. In: The 14th International Conference on Mobility and Transport for Elderly and Disabled Persons (TRANSED), 28-31 Jul 2015, Lisbon, Portugal. (Unpublished) [email protected] https://eprints.whiterose.ac.uk/ Reuse Unless indicated otherwise, fulltext items are protected by copyright with all rights reserved. The copyright exception in section 29 of the Copyright, Designs and Patents Act 1988 allows the making of a single copy solely for the purpose of non-commercial research or private study within the limits of fair dealing. The publisher or other rights-holder may allow further reproduction and re-use of this version - refer to the White Rose Research Online record for this item. Where records identify the publisher as the copyright holder, users can verify any specific terms of use on the publisher’s website. Takedown If you consider content in White Rose Research Online to be in breach of UK law, please notify us by emailing [email protected] including the URL of the record and the reason for the withdrawal request.
Transcript of Travel apps for Disabled People: Evaluating their ...eprints.whiterose.ac.uk/101880/1/matthews and...

This is a repository copy of Travel apps for Disabled People: Evaluating their contribution towards inclusive transport.
White Rose Research Online URL for this paper:http://eprints.whiterose.ac.uk/101880/
Version: Accepted Version
Conference or Workshop Item:Matthews, B and Wardman, MR (2015) Travel apps for Disabled People: Evaluating their contribution towards inclusive transport. In: The 14th International Conference on Mobility and Transport for Elderly and Disabled Persons (TRANSED), 28-31 Jul 2015, Lisbon, Portugal. (Unpublished)
[email protected]://eprints.whiterose.ac.uk/
Reuse Unless indicated otherwise, fulltext items are protected by copyright with all rights reserved. The copyright exception in section 29 of the Copyright, Designs and Patents Act 1988 allows the making of a single copy solely for the purpose of non-commercial research or private study within the limits of fair dealing. The publisher or other rights-holder may allow further reproduction and re-use of this version - refer to the White Rose Research Online record for this item. Where records identify the publisher as the copyright holder, users can verify any specific terms of use on the publisher’s website.
Takedown If you consider content in White Rose Research Online to be in breach of UK law, please notify us by emailing [email protected] including the URL of the record and the reason for the withdrawal request.

TRAVEL APPS FOR DISABLED PEOPLE: EVALUATING THEIR CONTRIBUTION
TOWARD INCLUSIVE TRANSPORT
Matthews Bryan; Wardman Mark
University of Leeds, Leeds, UK
Paper for presentation at The 14th International Conference on Mobility and Transport for
Elderly and Disabled Persons (TRANSED), Lisbon July 2015
1. Introduction
Transport and mobility have, historically, been at the centre of debates about disabled
people’s place in society and, in the wake of almost 4 decades of argument and debate,
there is now an increasingly widespread acceptance that efforts should be made to tackle the
barriers to disabled people’s participation and engagement in society. The content of these
debates has generally been couched in terms of disability rights and the moral and legal
duties societies have to promote and facilitate the equality and diversity that exists within
them. Over time, and spurred on by similar such debates that were taking place concurrently
in relation to race and gender rights, many countries have now passed legislation to obligate
and embed disability rights and, at the international level, the United Nations has adopted the
Convention on the Rights of Persons with Disabilities (2006).
Whilst these developments represent a major shift from the prevailing situation of two
decades ago, the pace of change in relation to accessible transport and mobility as
experienced by large sections of disabled people appears to be somewhat pedestrian.
Undoubtedly, one of the reasons for the slow pace of change is that realising disability rights
comes with cost implications, and nowhere is this more evident than in relation to making
transport systems accessible. The costs of disability access in relation to transport and
mobility, such as those related to making physical modifications to transport systems and to
the built environment or to providing customer service support, are relatively straight forward
to estimate (given an understanding of the engineering requirements and of the appropriate
capital and staffing cost rates). In several cases, such calculations have been made, with
the resulting cost estimates coming out as being substantial. Then with these cost

implications clearly highlighted, disagreement emerges on whether, how, and how fast, to
implement the particular disability access-improving intervention.
However, common practice in investment appraisal, particularly in transport but also in other
sectors, would involve some form of cost-benefit analysis. This, as its name suggests,
involves an understanding both of the costs and of the benefits of the investment being
considered, but this balanced assessment is very rare in relation to disability transport and
mobility access investments. Perhaps this is because, conceptually and methodologically,
the benefits of disability access are difficult to quantify, and perhaps more difficult still to
estimate in monetary terms. Perhaps also there is some degree of philosophical or political
unease about analysts and decision-makers being seen to reduce disability rights to a
monetary value, capable of being placed in a cost-benefit equation alongside time savings,
reliability and other more conventional transport investment benefits.
In this paper, we argue for more economic evaluation in relation to disability access and
present work looking at the potential of emerging technological solutions as a case study of
estimating the benefits of disability access. In the next section, we review the emergence of
these new technological solutions, in particular smartphone travel apps, and how their
different attributes contribute to improving accessibility to the transport system for disabled
people. We then report on novel research to quantify and place monetary values on such
attributes, in an effort to add to the embryonic evidence base in this area. We acknowledge
here the support of EU FP7 funding, via the COMPASS project, which enabled this work to
be conducted.
2. New Mobility Technologies Emerging ITS solutions are offering new potential means of tackling disability access issues
related to transport and mobility. Technological applications may usefully be categorised into
three types, as to whether they are applied to a vehicle, a person or to the physical
infrastructure (OECD, 2003). Firstly, ‘in-vehicle systems’ for private cars have generally
been developed by motor manufacturers based on commercial incentives to increase driver
safety, confidence and comfort, with an awareness of the growing size of the older driver and
disabled driver markets. Secondly, personal technologies are being used to develop

solutions for different disability groups. A great deal of effort has focused on technologies to
assist visually impaired people. To a lesser extent, solutions have also targeted wheelchair
users and others with reduced mobility, and for people with hearing or other communications
impairments. Thirdly, new technologies have also been embedded into the physical
infrastructure of the built environment. Triggered Information, via the use of Beacons, has
been the subject of research and development, and the RNIB has recently launched its
Update to their REACT system of talking beacons for visually impaired people. A further idea
is that of ‘Electronic leadlines’, whereby RFID tags are fitted to the visually impaired person
or to their long white cane, which then interact with tags in the environment. The aim is to
enable the visually impaired person to be prompted and guided in unknown environments,
but it could also serve to improve cognitive awareness of ones surroundings. The Austrian
‘ways4all’ project has undertaken ground-breaking work in this area, establishing several
demonstration sites in Vienna. However, it is not possible to embed RFID tags everywhere,
so the question returns to the issue of how to use what is already there to best effect.
One exciting set of developments in the area of personal technologies and disability access
over the past five years is the range of smartphone travel applications (apps) being used by
and targeted toward disabled people. This seems to be representing a start of a move from
specialist mobility devices and technologies, targeted specifically at disabled people,
toward apps designed for internet-enabled mobile phones, smartphones and tablet
computers. Since the required technologies are often already integral to the mobile device,
this switch has benefits for disabled people, both in terms of cost and functionality. What the
apps make possible are new forms of conveying personalized travel information, new ways
of tailoring travel and accessibility information and new mechanisms for communicating with
the transport system and its staff.
From our review of apps currently on the market, it seems there are two broad categories of
app available:
I. Passenger guidance apps for visually impaired people, which seek to make
use of GPS and mapping technologies, often referred to as Personal
Positioning Systems (PPS), in conjunction with screen magnification and
speech synthesis technologies, in order to provide personalised route
navigation and wayfinding information to people with a visual impairment. A
number of such apps exist, but three examples are:
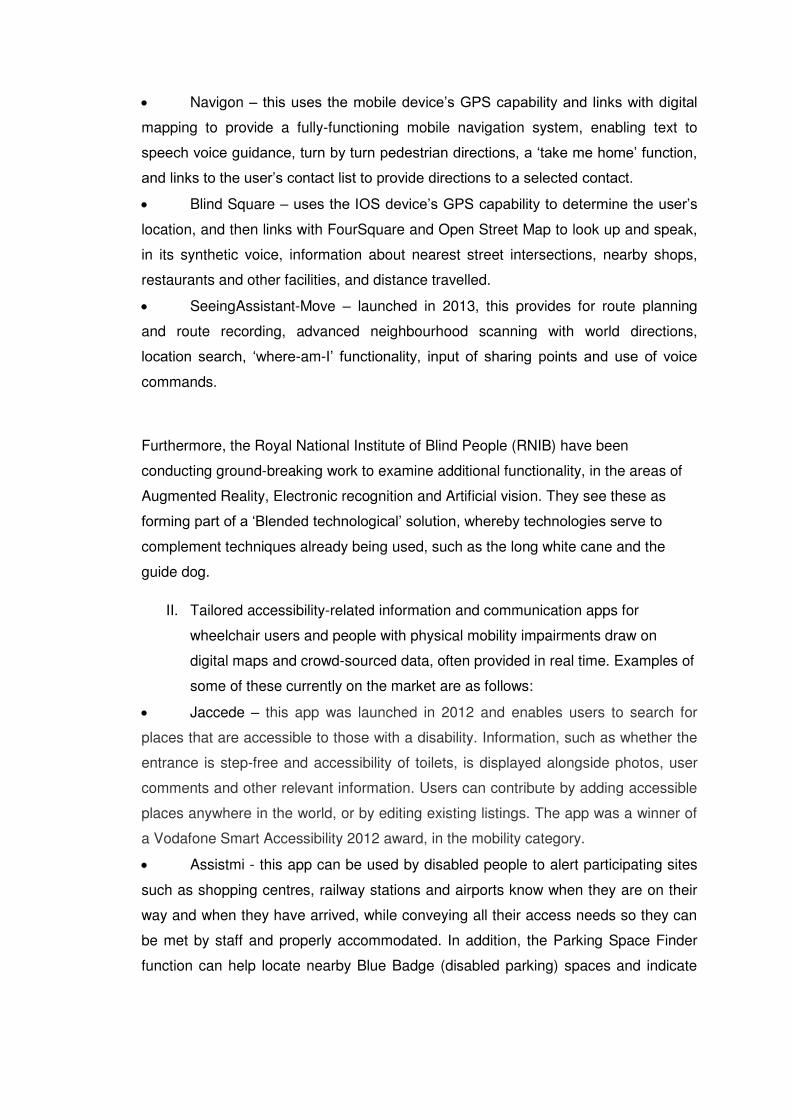
Navigon – this uses the mobile device’s GPS capability and links with digital
mapping to provide a fully-functioning mobile navigation system, enabling text to
speech voice guidance, turn by turn pedestrian directions, a ‘take me home’ function,
and links to the user’s contact list to provide directions to a selected contact.
Blind Square – uses the IOS device’s GPS capability to determine the user’s
location, and then links with FourSquare and Open Street Map to look up and speak,
in its synthetic voice, information about nearest street intersections, nearby shops,
restaurants and other facilities, and distance travelled.
SeeingAssistant-Move – launched in 2013, this provides for route planning
and route recording, advanced neighbourhood scanning with world directions,
location search, ‘where-am-I’ functionality, input of sharing points and use of voice
commands.
Furthermore, the Royal National Institute of Blind People (RNIB) have been
conducting ground-breaking work to examine additional functionality, in the areas of
Augmented Reality, Electronic recognition and Artificial vision. They see these as
forming part of a ‘Blended technological’ solution, whereby technologies serve to
complement techniques already being used, such as the long white cane and the
guide dog.
II. Tailored accessibility-related information and communication apps for
wheelchair users and people with physical mobility impairments draw on
digital maps and crowd-sourced data, often provided in real time. Examples of
some of these currently on the market are as follows:
Jaccede – this app was launched in 2012 and enables users to search for
places that are accessible to those with a disability. Information, such as whether the
entrance is step-free and accessibility of toilets, is displayed alongside photos, user
comments and other relevant information. Users can contribute by adding accessible
places anywhere in the world, or by editing existing listings. The app was a winner of
a Vodafone Smart Accessibility 2012 award, in the mobility category.
Assistmi - this app can be used by disabled people to alert participating sites
such as shopping centres, railway stations and airports know when they are on their
way and when they have arrived, while conveying all their access needs so they can
be met by staff and properly accommodated. In addition, the Parking Space Finder
function can help locate nearby Blue Badge (disabled parking) spaces and indicate

how far away the space is, any special parking restrictions the space may have and
what kind of parking it offers.
GoGenie - this app aims to help disabled and deaf people find access
information online for any location such as a shop, cinema, cultural event or town
centre, based on the recommendations and comments of others. Specific features
include access information, contact, maps, facilities to add reviews, photos and
videos, and a ‘report-it’ feature enabling people to complain directly to inaccessible
venues and organisations.
Ldn Access – this app is designed to be used as a source of access-related
information for places to eat, hotels, entertainment, attractions etc. throughout
London. It is targeted slightly more broadly at disabled people (either physical or none
physical or both), older people, families with young children, and visitors to London,
and provides information on wheelchair access, disabled toilets, induction loops, baby
changing facilities, customer parking etc.
Hence, at present, different apps do different things – some relate only to one place (e.g.
London), some focus on a particular mode of travel (e.g. separate apps for disabled drivers
and for public transport use), and some rely on information from organisations, whilst others
‘crowd-source’ their input information. By tackling barriers associated with information and
awareness in these different ways, the resulting enhancements to disabled people’s
information and communications provide the potential to instil greater confidence on the part
of the traveller, a greater sense of security, an improved quality of the travel experience and,
in some circumstances, reduced journey times.
However, whilst these developments are scientifically exciting, it is important to note a
number of outstanding difficulties associated with them. Technology take-up, particularly
amongst older age-groups and lower income groups – groups which have a strong
correlation with disability - seems to continue to be a problem. Likewise, technology
abandonment has been shown to be commonplace, particularly where that technology has
been designed especially for the elderly and disabled market. These take-up and
abandonment problems would seem to be a result of several factors including awareness of
the technologies amongst the relevant user groups, a lack of availability of training specific to
the technologies, the length of battery life for the associated devices, accessibility/user-
friendliness of the technology itself, and, of course, cost to the individual. The costs of
smartphone ownership, for example, are still significant, and their pattern of take-up

somewhat mixed, as illustrated in the most recent review of digital technologies take-up in
the UK, which showed that amongst people aged over 65, 28% did not possess a mobile
phone and some 80% did not possess a smartphone (OFFCOM, 014). Furthermore, with the
additional functionality of mainstream mobile devices comes added complexities and, in
some cases, new accessibility problems. In recognition of this, the European Standards
Organisations (CEN, CENELEC and ETSI) have, in 2014, for the first time, published a
European Standard on accessibility requirements for information and communication
technologies (ICT) products and services. It is intended that this Standard will be used by
public sector bodies during procurement, to ensure that websites, software and digital
devices (such as computers, smartphones and ticket machines) can be used by people with
a wide range of abilities and impairments. So whilst take-up amongst older and disabled
people may be relatively low at present, the increasing accessibility of the technologies
themselves and the greater familiarity with smartphones amongst the next cohort of older
and disabled people, are likely to make this a growth area.
3. Our Survey With a view to identifying and quantifying the benefits of these smartphone apps for disabled
people, and to – more generally – gauge ‘user reaction’, we conducted a survey of 259
disabled people by use of an online panel. The survey included a stated choice experiment,
the state of the art means of eliciting data reflecting how people would choose between
different alternatives, given a described set of attributes of those alternatives. By asking
respondents to choose, in a series of repeated scenarios (or choice tasks) in which the levels
of the attributes are systematically varied, it is possible to uncover what the choices imply
about how respondents value the different attributes.
Following an initial review of the available apps and the information requirements of different
groups of disabled people, it was decided to focus on disabled people experiencing physical
mobility impairments because desk research had shown there to be some common features
of the information needs and general travel patterns for this subgroup and because they
represent quite a significant proportion of disabled people. An alternative would have been to
focus on sensory impaired people (vision and hearing impairments), but this subgroup is
known to have very different information needs to otherwise disabled people and to rely on
public transport to a much greater extent.
The survey itself was divided into sections, inquiring about respondents’ mobility impairments
and how they affect individual travel behaviour, respondents’ use of technologies to assist
their travel, and the details of more and less-frequently made journey-types. Then, the choice

experiment was a decision between two conceptualized mobility apps providing different
levels of information services, and an opt-out option in case a respondent wished to select
not to use the app. Thus, there were three ‘alternatives to choose from – to buy one or other
of the apps, or neither. Each respondent was presented with 10 choice tasks each, and the
apps they were presented with were focused to provide information for a specific mode of
transport (Bus, Car or Train), based on the respondents’ description of a recent trip they had
made. Accordingly, the experiment can best be described as a ‘within mode’ choice
experiment. The result was that there were 159 car-users and 48 public transport-users,
therefore yielding 1590 and 480 observations respectively (10 choice observations per
respondent).
Each smartphone app in the survey had the basic feature of providing information on optimal
route and the expected travel time to get from A to B. The additional information provided is
split up into a planning phase and an interactive phase during the trip. The attributes used
were as follows:
Attribute 1: Accessibility info - This offered options to provide information such as maps and
directions regarding the accessibility of important places along the route, for example train
stations, petrol stations, but also the availability of staff assistance or disabled parking
spaces at those facilities.
Attribute 2: Pre-booking options - The App allowed travellers to pre-book a disabled parking
space, accessible taxis or assistance at stations before starting the trip.
Attribute 3: Interactive phase - It was decided not to include this option in every App offered
in the experiment, so there was a ‘Yes’ or ‘No’ option in the design. All the following attribute
levels were set to 0 or ‘No’ if the App did not provide real time information
Attribute 4: Route info - For cars, this attribute operated like a ‘satnav’ system with updated
route and disruption info, including rerouting. For trains and buses this mainly focused on up-
to-date arrival and departure times for connecting services, information on the next stop and
ETA and accessibility of the approaching vehicle.
Attribute 5: Time efficiency gain - The real-time option of the App will optimize the route for
cars, but may also improve the efficiency for public transport users by sending them to the
right platform and making sure station staff are notified in time for the arrival of the disabled
person. This may result in decreases in travel time.
Attribute 6: Assist me request - The App proposed to include an attribute which makes sure
that the traveller is tapped into the system such that assistance can be provided and will be

warned in time. For cars, this relates to assistance at service stations and connection to
break down services. In the latter case, leaving the car is sometimes not an option where the
driver is experiencing physical mobility impairments. For public transport, the app enabled
assistance personnel to be alerted that a traveller with specific needs is approaching the
station and bus drivers to be alerted when these passengers need to access or leave the
vehicle.
Attribute 7: Cost - Cost for the use of the App.
The attributes used and the levels they took for each mode are set out in Table 1.
Table 1: Attributes and Levels in the SP Exercise
Attribute Mode Level 1 Level 2 Level 3 Level 4
Accessibility
information
Car
Map of
arrival area
Location and
number of
disabled parking
spots
Distance from
(disabled)
parking to
destination
Assistance
availability at
service stations
along the route
and point of
arrival
Train
Station Map
Distance
between and
accessibility of
platforms
Distance
between and
accessibility of
connecting
services
Staff availability
on station and in
train
Bus Localized
maps
Accessible
walking route to
bus stop and
destination
Distance
between and
accessibility of
connecting
services
Staff availability
on main bus
station
Pre-booking
options
Car No options
Pre-book
disabled parking
spot
Pre-book
assistance at
car park
Train No options
Pre-book staff
assistance at
station
Pre-book
accessible taxi
Bus No options Pre-book staff
assistance at Pre-book

main bus station accessible taxi
Real-time
App
Car No Yes
Train No Yes
Bus No Yes
Route
information
Car No
Directions
during trip
Disruption info
and rerouting Both
Train No
Info on next
station and
estimated arrival
time
Up to date
connection info
at interchange
Accessibility info
of arriving train
Bus No
Info on next stop
and estimated
arrival time
Up to date
connection info
at interchange
Accessibility info
and seat
availability of
arriving bus
Efficiency
Gain in
Time
Car 0.00% 5.00% 10.00% 15.00%
Train 0.00% 5.00% 10.00% 15.00%
Bus 0.00% 5.00% 10.00% 15.00%
Assist me
request
Car No
At service
station
Road break
down services At car park
Train No
On-board
assistance
Platform
assistance
Bus No
Assistance at
main bus station
Warn bus
driver on
access and
egress stops
Purchase
model
Car Permanent
license
Annual
subscription
Pay as you go
(per trip
payment)
Train Permanent
license
Annual
subscription
Pay as you go
(per trip
payment)
Bus Permanent
license
Annual
subscription
Pay as you go
(per trip
payment)
Cost (£) Permanent 50 75 100

license
Annual
subscription 15 25 35
Pay as you go
(per trip
payment) 1 2 3
4. Results As mentioned above, our dataset included 259 responses, but the total sample of those who
completed the SP exercise is 207. A key feature of the SP exercise is whether the
respondent’s recent occasional or rare medium or long distance trip related to car (driver,
passenger and taxi) or public transport (rail and bus); we might expect the attitudes to
different aspects of the apps to differ between the two. Hence we have distinguished
between the two in the tables below, as well as providing figures for the sample as a whole.
In total we have 159 car users and 48 public transport users.
Table 2 reports the types of physical impairment in our sample. Walking difficulties are the
largest form of impairment, with sizeable proportions for both those who require the use of a
walking aid and those who do not. The other category is also significant. Those who need to
use a wheelchair, or with some kind of respiratory disease, form low proportions of the total.
Table 2: Types of Impairment
All Car PT
Walking difficulties which require the use of a stick
or some other walking aid (e.g. as a result of
arthritis)
68 (33%) 58 (37%) 10 (21%)
Walking difficulties, though not to the extent of
needing to use a walking aid
60 (29%) 42 (26%) 18 (38%)
Wheelchair user 14 (7%) 11 (7%) 3 (6%)
Chronic (heart or) respiratory disease 17 (8%) 15 (9%) 2 (4%)
Other 48 (23%) 33 (21%) 15 (31%)
Total 207 159 48

(100%) (100%) (100%)
We asked our respondents about the travel impacts of their physical mobility impairments.
Almost two thirds of our sample (65%) reported that their mobility fluctuated from day to day,
and more than four fifths (82%) reported that, even on a good day, they would be capable of
comfortably walking no more than 100m without needing to take a rest. Whilst less than a
fifth of our sample (15%) reported that they always need assistance when going out, close to
half of our sample (44%) stated that they do not go out as often as they would like to, and a
similarly high proportion (41%) stated that they always had to plan their journeys really
carefully.
We then asked respondents about their use of technologies in connection with their travel.
Nearly three quarters of our sample (71%) uses the internet in connection with their travel,
and nearly all possess a mobile phone, with almost half 49%) being smartphone users. Yet,
only just over a half of our sample (52%) report that they use their mobile phone to assist
with travel at present, and very few (7%) reported having specific travel apps which they use.
The SP exercise was completed by 159 car users and 48 PT users, therefore yielding 1590
and 480 observations respectively (10 choice observations per respondent). We discuss the
car user models first. Option 1 is chosen 362 (23%) times, option 2 is chosen 303 (19%)
times whilst the APP is not purchased on 925 (58%) occasions.
We have estimated logit models to the discrete choice SP responses. These models relate
the probability of choosing an alternative to the utility of each alternative. In turn, the utility of
each alternative is a function of the attributes used to characterise it in the SP exercise.
The models we have estimated specify dummy variables to represent the categorical
variables relating to accessibility information, pre-booking options, real time APP, route
information, assist me request and subscription type. If there are n categories, then n-1
dummy variables are entered and their coefficients represent their effects on utility relative to
the arbitrarily omitted category. Given that we have three alternatives, we can specify two
alternative specific constants (ASCs). Continuous variables, such as cost and efficiency gain
in time, are entered in linear-additive form. Thus monetary valuations are obtained as the
ratio of the relevant coefficient and the time coefficient.

We have specified different cost terms for the permanent licence, the annual subscription
and pay as you go, on the grounds that the behavioural response to each will vary, in part
depending on frequency of trip making. We did estimate a model with dummy variables
specifically for the purchase model but they were both far from significant. We therefore
removed them on the grounds that attitudes towards the specific purchase model are being
discerned by the separate cost terms specified for each.
The first model reported (NL) is a nested logit model, combining the two APP options in a
single nest. It achieves, what is in our experience for SP choice models, a good fit to the
data, although the t ratios associated with the coefficient estimates are generally
disappointing. The scale parameter implies a logsum parameter of 0.25, which lies between
0 and 1 as required. This will have the effect of considerably reducing the cross elasticity
between the purchase and not purchase options compared to the cross elasticity between
the two APP options.
Nonetheless, the second model is a multinomial logit model (MNL) and despite the worse fit
overall it does lead to some distinct improvements in t ratios. Given this, and that the t ratio of
the scale in the NL model was only just significantly different from a value of one at which the
NL model collapses to MNL, we have persisted with the MNL model.
The second MNL model removed the ASC relating to the not purchase option (ASC3) since
not only was it not significant but it was highly correlated with other variables. We also
removed ASC1 as insignificant and because there is no reason to expect a preference for
APP option 1 over APP option 2 all else equal. This leads to some further increases in t
ratios. However, MNL2 still contains some insignificant coefficients and indeed some wrong
sign yet significant ones.
The three terms relating to accessibility information are all negative and indeed the
coefficient for assistance availability at service stations along the route and point of arrival is
significant. We would expect these coefficients to be positive, if anything, given that they can
be expected to be preferred to the base category of just a map of the arrival area. MNL
removes these three coefficients and also the others that were not significant at the 5% level
of significance. The latter are a further seven terms. As for the assist me request terms,

there was no preference for such a facility for car parks or at service stations. A contributory
factor here could be that the respondent might not use service stations and might not park in
a car park, or that there were insufficient numbers of respondents who required assistance
with these stages of their trip. However, there was a positive value in the context of road
break down services, and it seems plausible that this is the strongest effect.
There was a significant value associated with being able to pre-book a disabled parking spot
but the ability to pre-book assistance at the car park was not significant. Perhaps the
presence of other travellers reduces the need for the latter, or again there may have been
insufficient numbers of respondents who specifically required this type of assistance. Nor
was there a significant benefit from the presence of a real time APP. As for route information,
car users did place a significant value on directions during the trip, and this is the largest
effect in the model, but they did not value disruption information and rerouting, perhaps
because they perceive this to be such a rare occurrence.
Surprisingly, the efficiency gain in time was not significant. It may be that respondents did not
believe that the APP could credibly achieve such time efficiencies, or it may be related to the
trip under consideration being viewed as non-time critical.
The three cost coefficients are all highly significant. Those for licence and subscription are so
much smaller since the fees are much higher to cover the longer periods. The licence
coefficient would be equivalent to the pay as you go coefficient for eight trips whilst the
subscription coefficient would be equivalent to the pay as you go coefficient for just over four
trips. These numbers seem sensible.
The easiest way to obtain willingness to pay values is to use the pay as you go coefficient
since it will yield a value per trip. For the three significant coefficients we obtain the following
values:
£0.69 per trip for the road break down assistance
£1.50 per trip for the pre-book disabled parking slot

£1.60 per trip for directions during the trip.
These valuations seem plausible. To place them in context, the official value of travel time
savings in the UK is around £0.08 per minute, so the largest value above is equivalent to 20
minutes on a round trip.
Table 3: Overall SP Models for Car Users
NL MNL1 MNL2 MNL3
Alternative Specific Constant
(Option 1)
0.025
(0.7)
0.103 (1.0) - -
Alternative Specific Constant
(Option 2)
- - - -
Alternative Specific Constant
(Option 3)
0.163
(0.7)
0.048 (0.1) - -
Map of arrival area (Base) - - - -
Location and number of disabled
parking spots
-0.054
(0.5)
-0.185 (1.0) -0.199 (1.2) -
Distance from (disabled) parking to
destination
-0.078
(0.7)
-0.241 (1.5) -0.215 (1.7) -
Assistance availability at service
stations along the route and point of
arrival
-0.232
(2.1)
-0.626 (3.0) -0.624 (4.3) -
No Assist Me Request (Base) - - -
At Service Station 0.124
(1.5)
-0.010 (0.1) -0.007 (0.0) -
Road Break Down Services 0.237
(2.2)
0.274 (1.4) 0.289 (1.6) 0.168 (2.5)
At Car Park 0.088
(0.8)
0.054 (0.3) 0.060 (0.3) -
No Pre-booking options - - - -
Pre-book disabled parking spot 0.242
(2.7)
0.484 (3.5) 0.515 (3.9) 0.365 (3.2)
Pre-book assistance at car park 0.033
(0.4)
0.113 (0.8) 0.160 (1.3) -

No Real Time APP (Base) - - - -
Real Time APP -0.059
(0.5)
-0.061 (0.2) -0.107 (0.6) -
No Route Information (Base) - - - -
Directions during trip 0.139
(1.6)
0.353 (1.9) 0.418 (2.5) 0.390 (3.5)
Disruption information and
Rerouting
0.020
(0.3)
-0.051 (0.3) -0.038 (0.2) -
Both 0.125
(1.4)
-0.011 (0.1) 0.039 (0.2) -
Efficiency Gain in Time (%) -0.0001
(0.0)
0.006 (0.5) 0.0053 (0.6) -
Cost Licence -0.0091
(2.6)
-0.0298
(11.4)
-0.0298
(11.7)
-0.0318
(15.8)
Cost Pay as You Go -0.0981
(1.4)
-0.2210
(2.2)
-0.2310
(4.1)
-0.2431
(6.5)
Cost Subscription -0.0249
(3.0)
-0.0513
(7.2)
-0.0514
(9.6)
-0.0568
(14.8)
Scale 4.01 (2.1)a - - -
Log-Likelihood -1332.9 -1342.9 -1343.5 -1356.1
Adjusted と2 0.226 0.221 0.222 0.220
Note: a t ratio with respect to one.
Turning to the public transport users, option 1 is chosen 153 (32%) times; option 2 is chosen
130 (27%) times whilst the APP is not purchased on 197 (41%) occasions. Thus public
transport users have a somewhat greater interest in purchasing the APP. The same set of
models was estimated as for car users and these are reported in Table 4.
Although the levels can be different for train and bus users, such as the level 2 accessibilities
of distance between platforms for train and accessible walking route to stop and destination
for bus, we have so few observations for public transport that it would be futile to try and
distinguish between them. This indeed turned out to be the case when we tried it!

The scale parameter in the NL model is not significantly different from one and hence the
MNL is justified on empirical grounds. MNL1 contains the full set of attributes. It can be
seen that a lot of the coefficients are not significant at the 5% level, although the limited
sample size will not have helped here. Following the same procedure as for car users, we
removed the ASCs, both of which were far from significant. This had little effect on the t
ratios of the other coefficient estimates.
We then removed coefficients step by step, starting with those with the lowest t ratios until
we arrived at MNL3. We have retained coefficients with t ratios greater than one, being more
generous than we might otherwise be given the relatively small data set, although only two
coefficient estimates in MNL3 are not significant at the 95% level.
As with car users, none of the coefficients for the accessibility information are retained,
although this is because they all had t ratios less than one. It may be that respondents have
a reasonably good idea about the distances in the first two levels or and they might have
presumed that there would be staff available on trains anyway.
Surprisingly, neither of the assist me request terms were significant, perhaps due to the
concept of being able to request assistance on-route being unfamiliar to respondents.
The pre-booking options were both significant, with the taxi being more important than staff
assistance at the station. As with car users, there was no value for a real time APP and again
the efficiency gain in time was far from significant.
The three information terms were all significant with fairly similar coefficients. We again find
that cost coefficients for licence and subscription are somewhat smaller than for the pay as
you go option.
Our preference is to use the pay as you go cost coefficient as the numeraire in calculating
money values. A slight concern here is that the coefficient is not quite significant. In this
case, the licence coefficient would be equivalent to the pay as you go coefficient for 4.7 trips
(as opposed to 8 for car users) whilst the subscription coefficient would be equivalent to the
pay as you go coefficient for 2.3 trips (as opposed to 4.3 for car users). Thus these ratios in
the range of 50-60% of the previous ratios, and this might be due to the relatively low
precision of the pay as you go cost coefficient. Given this, and the much greater precision
with which the licence and subscription coefficients are estimated, there is a case for basing
values on a corrected pay as you go coefficient which is 55% larger. We present values
below for the original pay as you go cost coefficient and the revised one (in brackets based
on a cost coefficient 80% larger). These are:
Pre-booking staff assistance at station £1.81 (£1.01) per trip
Pre-booking accessible taxi £2.92 (£1.62) per trip
Information on next station/stop and arrival time £5.32 (£2.96) per trip
Up to date connection information £4.60 (£2.56) per trip
Accessibility information of arriving train or bus is £6.01 (£3.34) per trip
On balance we prefer the amended values as being more credible.

At the official value of time, the amended values range from 12.6 minutes per round trip for
pre-booking staff assistance at stations to 41.8 minutes for accessibility information per
round trip.
It seems that the values of the features of an APP and the propensity to buy one are
somewhat larger for public transport than car users. This seems quite plausible, given that
the consequences of poor accessibility information and support are likely to be more
problematic when travelling via public transport than via car.
Table 4: Overall SP Models for Public Transport Users
NL MNL1 MNL2 MNL3
Alternative Specific Constant (Option 1) -0.024
(0.1)
-0.062
(0.4)
- -
Alternative Specific Constant (Option 2) - - - -
Alternative Specific Constant (Option 3) -0.080
(0.2)
-0.018
(0.1)
- -
Station/local map (Base) - - -
Distance between/accessibility platforms
Accessible walking route to stop and
destination
0.198
(0.5)
0.223
(0.8)
0.214
(0.9)
-
Distance between and accessibility of
connecting services
0.191
(0.3)
0.285
(1.0)
0.276
(1.2)
-
Staff availability on station and in train 0.052
(0.2)
0.056
(0.2)
0.040
(0.2)
-
No Assist Me Request (Base) - - - -
On board assistance
Assistance at main bus station
-0.320
(0.4)
-0.428
(2.2)
-0.398
(1.5)
-
Platform assistance
Warn bus driver on access and egress
stops
0.123
(0.1)
0.273
(1.1)
0.256
(0.9)
-
No Pre-booking options - - - -

Pre-book staff assistance at station 0.212
(0.5)
0.252
(1.0)
0.252
(1.1)
0.236
(1.1)
Pre-book accessible taxi 0.237
(0.2)
0.415
(1.9)
0.393
(2.1)
0.380
(2.2)
No Real Time APP (Base) - - - -
Real Time APP 0.294
(0.9)
0.260
(0.8)
0.246
(0.8)
-
No Route Information (Base) - - - -
Info on next station/stop and estimated
arrival time
0.387
(0.3)
0.548
(1.6)
0.552
(1.9)
0.692
(3.3)
Up to date connection info at interchange 0.307
(0.3)
0.443
(1.5)
0.434
(1.6)
0.598
(3.1)
Accessibility info of arriving train
Accessibility info and seat availability of
arriving bus
0.368
(0.4)
0.497
(1.6)
0.449
(1.7)
0.781
(3.7)
Efficiency Gain in Time (%) -0.003
(0.1)
0.000
(0.0)
0.000
(0.0)
-
Cost Licence -0.0195
(0.3)
-0.0306
(7.2)
-0.0304
(7.1)
-0.0276
(7.7)
Cost PAYG -0.0772
(0.1)
-0.1471
(1.0)
-0.149
(1.4)
-0.1300
(1.7)
Cost Subscription -0.0521
(0.4)
-0.0709
(5.5)
-0.070
(6.0)
-0.0561
(6.1)
Scale 1.59
(0.32)a
- - -
Log-Likelihood -448.5 -448.7 -448.7 -452.6
Adjusted と2 0.113 0.115 0.119 0.125
Note: a t ratio with respect to one.
To see if particular types of people in our survey have specific attributes they are interested
in, we have made some segmentation of our survey responses. This work is ongoing, but it
appears that wheelchair users place particular value on assist (road break-down services)

and Assist (carpark), as well as Route (both direction and disruption information). Also,
people with chronic breathing difficulties place particular value on Route (both direction and
disruption information), whilst people who stated that they ‘don’t get out as much as I’d like
to’ place particular value on ASSIST (car parking).
5. Conclusions
By opening up information sources and support services, smartphone travel apps offer huge
potential to help and liberate disabled people who face challenges with other methods of
communication and information-gathering and/or who require specific and personalised
information relating to the accessibility of the transport system. In doing so, they contribute to
the social inclusion agenda, with benefits not only for the individual but also for society and
governments. Our review of the market shows there to be a range of apps being developed
providing several common functions but a number of interesting variations. However, as
they are focused on disabled people, many of whom are older, and as they are provided via
smartphones, the costs of owning a smartphone and their usability for older and disabled
people are important limiting factors. We highlight these as causes for concern, and the
need for market research to assess user reaction. Nevertheless, if it is established that there
are valuable accessibility benefits to be gained, then some public investment to assist users
with these costs may be justifiable in cost-benefit terms.
Our survey indicates that people do place value on particular aspects of these apps. Car-
users chose to purchase an app 42% of the time, and the most significant attributes of the
apps presented to them were found to be:
that which provided them with en-route directions – with an estimated value of
£1.60 per trip;
that which enabled them to request assistance via road break-down services
– with an estimated value of 69pence per trip; and
that which enabled them to pre-book a disabled parking space – with an
estimated value of £1.50 per trip.
The values obtained for these attributes can be thought of as being approximately equivalent
to the value of saving 10-20 minutes travel time on a round trip.
Public transport users chose to purchase an app 59% of the time, and the most significant
attributes of the apps presented to them were found to be:

that which enabled them to pre-book staff assistance – with an estimated
value of £1.01 per trip;
that which enabled them to pre-book an accessible taxi – with an estimated
value of £1.62 per trip;
that which provided them with Information on next station/stop and arrival time
– with an estimated value of £2.96 per trip;
that which provided them with up to date connection information – with an
estimated value of £2.56 per trip; and
that which provided them with Accessibility information about the arriving train
or bus – with an estimated value of £3.34 per trip.
The values obtained for these attributes can be thought of as being in a range approximately
equivalent to the value of saving 10-40 minutes travel time on a round trip. Interestingly, the
attributes of most importance, the values placed upon them, and the propensity to purchase
the app are grater for public transport users than for car-users, probably reflecting the
likelihood that the consequences of poor accessibility information and support on public
transport are more problematic than when using one’s own vehicle or that of a friend or
carer.
The exercise here to estimate monetary valuations of accessibility benefits, as they relate to
smartphone travel apps, serves to illustrate the feasibility of the quantification of such
benefits more broadly. Added to the work of others such as Maynard (2009) and Fearnley et
al (2011), it may be possible to move in the direction of embedding the evaluation of disability
access investments into the mainstream evaluation of transport projects, using a more
objective set of measures, rather than it remaining outside of conventional appraisal and
using more subjective measures. Nevertheless, the fact that often the bulk of the costs of
disability access investments in transport fall upon the transport authority and/or industry,
whilst a significant proportion of the benefits accrue to non-transport-related stakeholders, is
likely to continue to pose problems when it comes to making a business case.
References
Fearnley, N., Flügel, S., Ramjerdi , F. (2011). Passengers' valuations of universal design
measures in public transport, Research in Transportation Business &Management, 2
(November 2011) 83-91.

Maynard, A., (2009) Can measuring the benefits of accessible transport enable a seamless
journey? Journal of Transport and Land Use, 2 (2), 21–30.
OECD (2003) New Transport Technology for Older People, an OECD/MIT International
Symposium, OECD.
OfCom Research (2014). The Communications Market Report (7 August 2014)