Travel Activities and Motivations of U.S. Residents · This report, entitled “Travel Activities...
63
Travel Activities and Motivations of U.S. Residents An Overview January 2007 Ministry of Tourism Tourism Research Unit
Transcript of Travel Activities and Motivations of U.S. Residents · This report, entitled “Travel Activities...

Travel Activities and Motivations
of U.S. Residents
An Overview
January 2007
Ministry of Tourism
Tourism Research Unit

TABLE OF CONTENTS Executive Summary ........................................................................................................3 Introduction .....................................................................................................................8 Overnight Travel by Americans ...................................................................................10
Incidence of Overnight Travel ..................................................................................... 10 Reasons for not Taking Overnight Trips...................................................................... 11 Destinations Visited..................................................................................................... 12 Visitation to Ontario ..................................................................................................... 13 Activity Participation while on Overnight Trips and Importance of Specific Activities as Trip Motivators ....................................................................... 14 Shelter Used on Camping Trips .................................................................................. 25 Tours ........................................................................................................................... 26 Cruises ........................................................................................................................ 26
Business Travel.............................................................................................................28 Incidence of Business or Job-related Travel ............................................................... 28 Incentive Travel ........................................................................................................... 28
Pleasure or Vacation Travel .........................................................................................30 Incidence of Overnight Pleasure or Vacation Travel ................................................... 30 Number of Pleasure or Vacation Trips ........................................................................ 31 Places Visited during Pleasure or Vacation Trips........................................................ 32 Number of Overnight Trips to Specific Destinations.................................................... 33 Number of Overnight Trips to Ontario ......................................................................... 33
Trip Planning .................................................................................................................35 Involvement with Planning........................................................................................... 35 Information Sources .................................................................................................... 36 Types of Websites Used ............................................................................................. 37 Booking on the Internet ............................................................................................... 38 Purchases of Travel Packages.................................................................................... 39
Decision Making Process .............................................................................................40 Destination or Experience? ......................................................................................... 40 Benefits Sought from Pleasure or Vacation Trips........................................................ 41 The Importance of the Choice of Destination .............................................................. 42 Important Considerations in Choosing a Destination .................................................. 43
Impressions and Ratings of Destinations...................................................................44 Appeal of a Destination ............................................................................................... 44 Reasons to Travel to Destination ................................................................................ 45

2
Activity Participation at Home .....................................................................................46 Outdoor Activities ........................................................................................................ 46 Entertainment Activities............................................................................................... 47
Cottage or Vacation Home Ownership and Location ................................................48 Recreation Vehicle Ownership.....................................................................................49 Media Habits ..................................................................................................................50
Newspapers ................................................................................................................ 50 Magazines ................................................................................................................... 51 Television .................................................................................................................... 52 Radio ........................................................................................................................... 53 Internet Use................................................................................................................. 54 Membership in Organizations and Programs .............................................................. 55
General Attitudes ..........................................................................................................56 Vacations Days..............................................................................................................57 Demographics ...............................................................................................................58
Age and Household income ........................................................................................ 58 Occupation and Household Composition .................................................................... 59 Respondent’s Place of Birth ........................................................................................ 59 Parent’s Place of Birth................................................................................................. 61 Education .................................................................................................................... 62

3
EXECUTIVE SUMMARY This report, entitled “Travel Activities and Motivations of U.S. Residents: An Overview”, is based on a survey of Canadian and American travellers conducted between January and June 2006. However, this report deals only with the travel patterns and attitudes of Americans. The Ontario Ministry of Tourism will release a separate report about the travel patterns of Canadians, entitled “Travel Activities and Motivations of Canadian Residents: An Overview”. Unless otherwise specified, data in this report pertaining to American travel patterns refer to the two-year time period including 2004 and 2005. Overnight Travel by Americans • In the last two years, 79% of adult Americans, or 176 million, took at least one
overnight trip, while 46 million did not take any such trips. • Although most Americans who did not travel cited time or financial constraints, 8.7%
mentioned reasons related to health and terrorism issues and 5.4% gave reasons related to hassles at border crossings. These are new issues that did not arise in surveys prior to the terror attacks of September 11, 2001.
• In the last ten years, as well as in the last two years, Canada was the top foreign
destination visited by Americans for overnight trips. In the last two years, 30% of American travellers have visited Canada, Mexico or the Caribbean and only 16% have taken an overnight trip outside North America.
• In the last two years, Canada’s share of US visitors declined more than that of
Mexico’s or the Caribbean’s, but less than the shares of Europe, Australia, Asia or Africa.
• Destinations that aspire to attract the mass travel market need to evaluate the
shopping and dining opportunities that they offer to their visitors as these appear to be the most popular activities among travellers.
• On overnight trips, Americans most enjoy: dining at restaurants that offer local
ingredients and recipes, shopping for clothing, shoes or jewelry, visiting casinos or amusement parks, and strolling around a city to observe its buildings and architecture.
• Although American travellers enjoy shopping and dining, that is not what brings them
to the destination. Dining was the main reason for taking overnight trips in only 12% of all the trips that had dining as an activity. Similarly, only in 13% of the trips in which Americans engaged in shopping, was shopping the main reason for taking these trips.
4
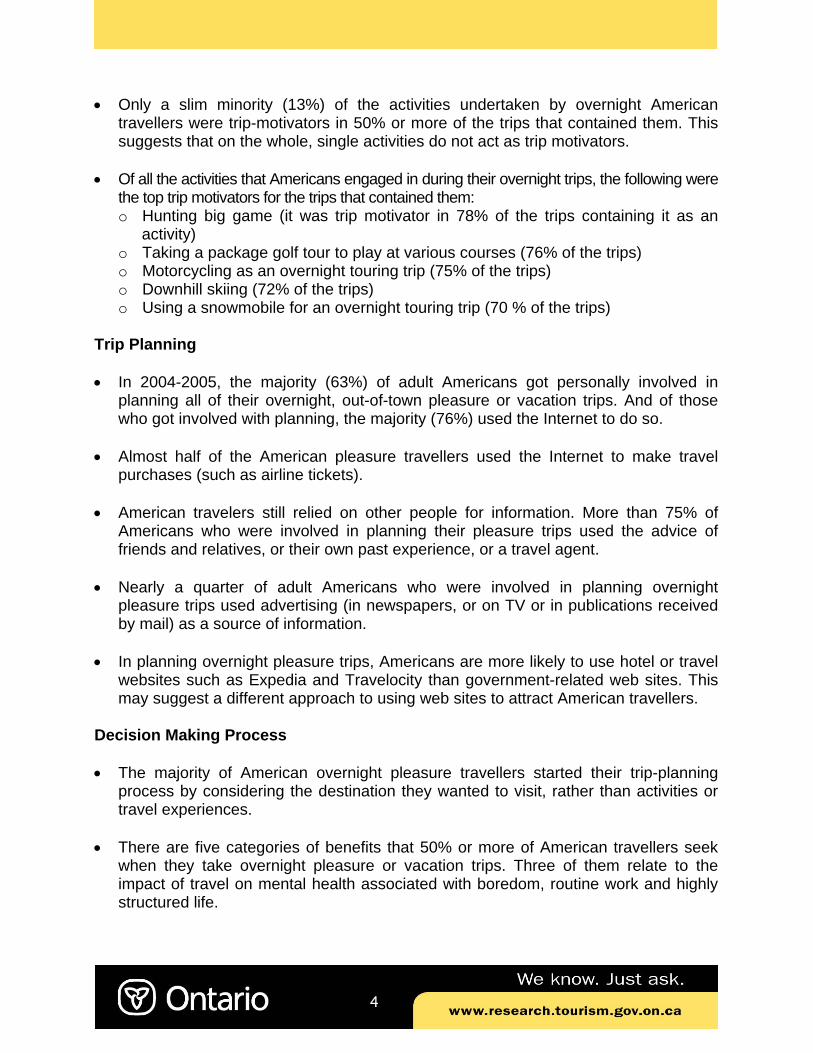
• Only a slim minority (13%) of the activities undertaken by overnight American travellers were trip-motivators in 50% or more of the trips that contained them. This suggests that on the whole, single activities do not act as trip motivators.
• Of all the activities that Americans engaged in during their overnight trips, the following were
the top trip motivators for the trips that contained them: o Hunting big game (it was trip motivator in 78% of the trips containing it as an
activity) o Taking a package golf tour to play at various courses (76% of the trips) o Motorcycling as an overnight touring trip (75% of the trips) o Downhill skiing (72% of the trips) o Using a snowmobile for an overnight touring trip (70 % of the trips)
Trip Planning • In 2004-2005, the majority (63%) of adult Americans got personally involved in
planning all of their overnight, out-of-town pleasure or vacation trips. And of those who got involved with planning, the majority (76%) used the Internet to do so.
• Almost half of the American pleasure travellers used the Internet to make travel
purchases (such as airline tickets). • American travelers still relied on other people for information. More than 75% of
Americans who were involved in planning their pleasure trips used the advice of friends and relatives, or their own past experience, or a travel agent.
• Nearly a quarter of adult Americans who were involved in planning overnight
pleasure trips used advertising (in newspapers, or on TV or in publications received by mail) as a source of information.
• In planning overnight pleasure trips, Americans are more likely to use hotel or travel
websites such as Expedia and Travelocity than government-related web sites. This may suggest a different approach to using web sites to attract American travellers.
Decision Making Process • The majority of American overnight pleasure travellers started their trip-planning
process by considering the destination they wanted to visit, rather than activities or travel experiences.
• There are five categories of benefits that 50% or more of American travellers seek
when they take overnight pleasure or vacation trips. Three of them relate to the impact of travel on mental health associated with boredom, routine work and highly structured life.

5
• 85% of all American travellers used travel to relieve stress in one form or another. Some 54% of travellers reported that they sought knowledge and mental stimulation, while 69% wanted to maintain or improve relationships.
• Two-thirds (67%) of the American travellers indicated that the choice of the
destination for a pleasure or vacation trip is very or extremely important to them (at least as important as buying a house or car).
• In choosing a destination, two conditions were vital to a majority of American
travellers: Feeling safe at the destination (72%) and having convenient access to the destination by car (51%).
• Among American travellers, 79% rate comfort and safety as highly important, and
67% rate the cost of travel as highly important. Impressions and Ratings of Destinations • About one-third of American travellers had no impressions of Canadian provinces or
territories and were unable to rate them. However, Americans were able to rate Ontario and Quebec more often than other Canadian jurisdictions.
• For eight out of 12 Canadian jurisdictions the proportion of American travellers who
rated them as very unappealing is greater than the proportion who rated them as very appealing travel destinations. The four jurisdictions that received higher ratings as very appealing were: PEI, Quebec, Ontario and British Columbia. However, even for these destinations only 17%-26% of American travellers gave them “very appealing” ratings.
• Hawaii is by far the most appealing destination for the majority of American
travellers. Activity Participation at Home • American adults (travellers and non-travellers) say that their preferred outdoor
activities at home are outings to parks, swimming, exercising and gardening. • Even when they are home, travellers are more active than non-travellers. Cottage and Recreational Vehicle Ownership • Almost 20% of American travellers (or 34.5 million) have access to a cottage, cabin
or vacation home. Almost all of these cottages and vacation homes are in the United States (93%) and most are in the travellers’ home states.
• Almost 1 million American travellers (949,185) have cottages or vacation homes in
Canada, 60% of which are located in Ontario.
6
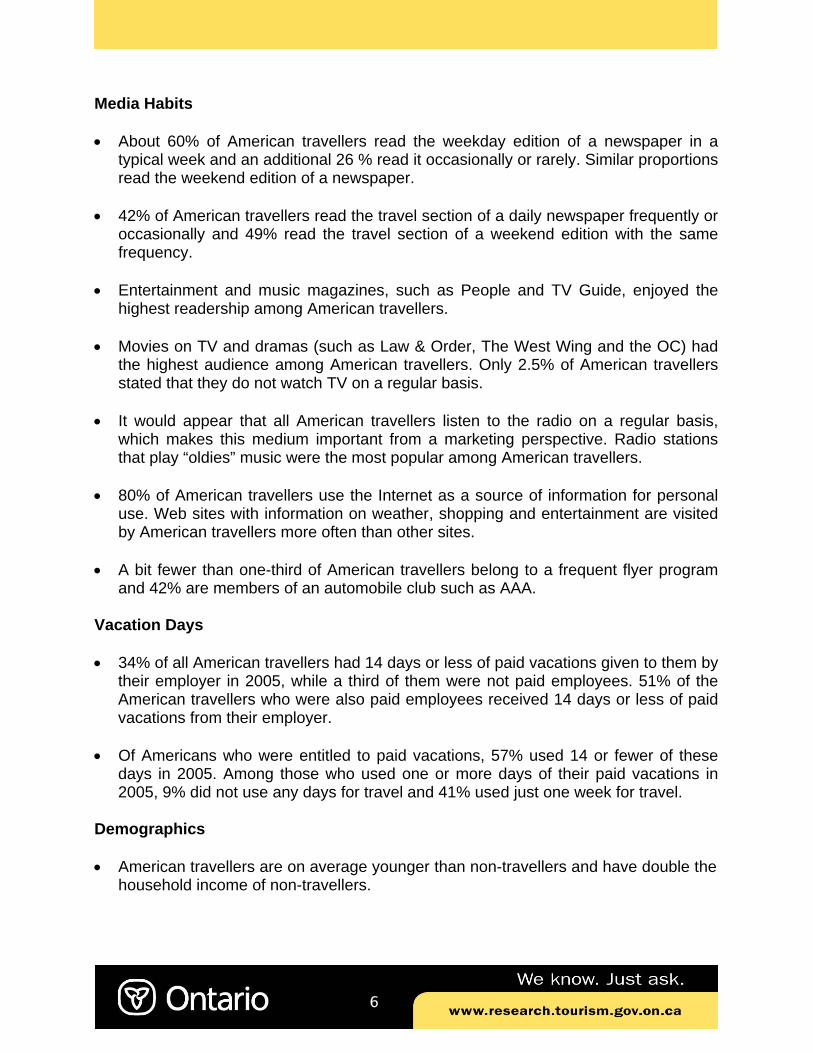
Media Habits • About 60% of American travellers read the weekday edition of a newspaper in a
typical week and an additional 26 % read it occasionally or rarely. Similar proportions read the weekend edition of a newspaper.
• 42% of American travellers read the travel section of a daily newspaper frequently or
occasionally and 49% read the travel section of a weekend edition with the same frequency.
• Entertainment and music magazines, such as People and TV Guide, enjoyed the
highest readership among American travellers. • Movies on TV and dramas (such as Law & Order, The West Wing and the OC) had
the highest audience among American travellers. Only 2.5% of American travellers stated that they do not watch TV on a regular basis.
• It would appear that all American travellers listen to the radio on a regular basis,
which makes this medium important from a marketing perspective. Radio stations that play “oldies” music were the most popular among American travellers.
• 80% of American travellers use the Internet as a source of information for personal
use. Web sites with information on weather, shopping and entertainment are visited by American travellers more often than other sites.
• A bit fewer than one-third of American travellers belong to a frequent flyer program
and 42% are members of an automobile club such as AAA. Vacation Days • 34% of all American travellers had 14 days or less of paid vacations given to them by
their employer in 2005, while a third of them were not paid employees. 51% of the American travellers who were also paid employees received 14 days or less of paid vacations from their employer.
• Of Americans who were entitled to paid vacations, 57% used 14 or fewer of these
days in 2005. Among those who used one or more days of their paid vacations in 2005, 9% did not use any days for travel and 41% used just one week for travel.
Demographics • American travellers are on average younger than non-travellers and have double the
household income of non-travellers.

7
• Compared to travellers, a higher proportion of American non-travellers is retired, suffers from a long-term illness, or is unemployed and a lower proportion is employed as full time paid employees.
• The vast majority of American travellers live with a spouse or partner and about one-
third of them have children under the age of 18. On the other hand, proportionally, more American non-travellers live alone.
• 93% of American travellers were born in the US as compared to 90% of American
non-travellers. • Germany and Canada are the top two countries of origin for those American
travellers who were not born in the US. • 88% of American travellers’ parents were born in the US, with Germany, Canada,
Italy and Mexico being the top countries of origin for those who were born outside the US.
• American travellers are significantly more educated than American non-travellers.
Over 38% of American travellers had a university degree.
8
Introduction
This report is based on the 2006 Travel Activities and Motivations Survey (TAMS), which examined the recreational activities and travel habits of Canadians and Americans looking at their travel behaviour over the past two-year period. The survey provides detailed information on travellers’ activities, travel motivators, places visited, type of accommodation used, impressions of Canada, its provinces and territories, demographics and media consumption patterns.
This report deals only with the travel patterns and attitudes of Americans. In 2007, the Ontario Ministry of Tourism will release a separate report about the travel patterns of Canadians, called Travel Activities and Motivations of Canadian Residents: An Overview.
Unless otherwise specified, data in this report refers to the two-year period including 2004 and 2005.
It should also be noted that American respondents were at least 18 years of age and that ‘trips’ refer to overnight out-of-town travel.
TAMS represents a comprehensive assessment of travel behaviour and motivators and provides a rich and authoritative database by which to develop marketing strategies and travel products to attract visitors to Canada. In particular, TAMS was designed to:
o Identify existing and potential tourism markets; o Measure the likelihood of these tourism markets being attracted to vacation
experiences in Ontario; o Create packaging opportunities for each of these markets; o Determine how to reach these markets (i.e. in terms of communication
strategies); and o Provide information on how to better fine-tune and target existing marketing
campaigns. TAMS was sponsored by the following organizations:
The Ontario Ministry of Tourism The Quebec Ministry of Tourism The Ontario Tourism Marketing Partnership Tourism Manitoba The Canadian Tourism Commission Tourism Saskatchewan The Atlantic Canada Opportunities Agency Alberta Economic Development The Department of Canadian Heritage Tourism BC Parks Canada The Government of Yukon Statistics Canada The Government of Northwest Territories
The survey was conducted in Canada and the United States between January 2006 and June 2006 and it covered only adults (18 years and over). The reference period for the data is 2004 and 2005.

9
The U.S. survey consisted of a mailback survey only as it used an existing mail panel. The panel’s response rate for this survey was 71.3%. The U.S. database consists of 60,649 completed responses
In this second TAMS survey (the first was completed in 2000), the questionnaire was adjusted to better meet the needs of our tourism stakeholders. Some of the differences include:
• More detailed questions regarding activities, as well as identifying the activities that were the primary motivators for trips;
• Identification of the travel decision-maker in the family and the process of selecting trip types;
• Identification of planning sequence regarding destinations, experiences or activities;
• Ratings of various factors as to their importance in deciding where to travel; • More detailed questions regarding media habits; • Additional questions on ethnic/cultural background to identify the country of birth
of the parents of the respondents as well as the time of immigration; and • Ratings of Canadian and foreign jurisdictions as destinations for pleasure travel.
10
OVERNIGHT TRAVEL BY AMERICANS
INCIDENCE OF OVERNIGHT TRAVEL
Highlights:
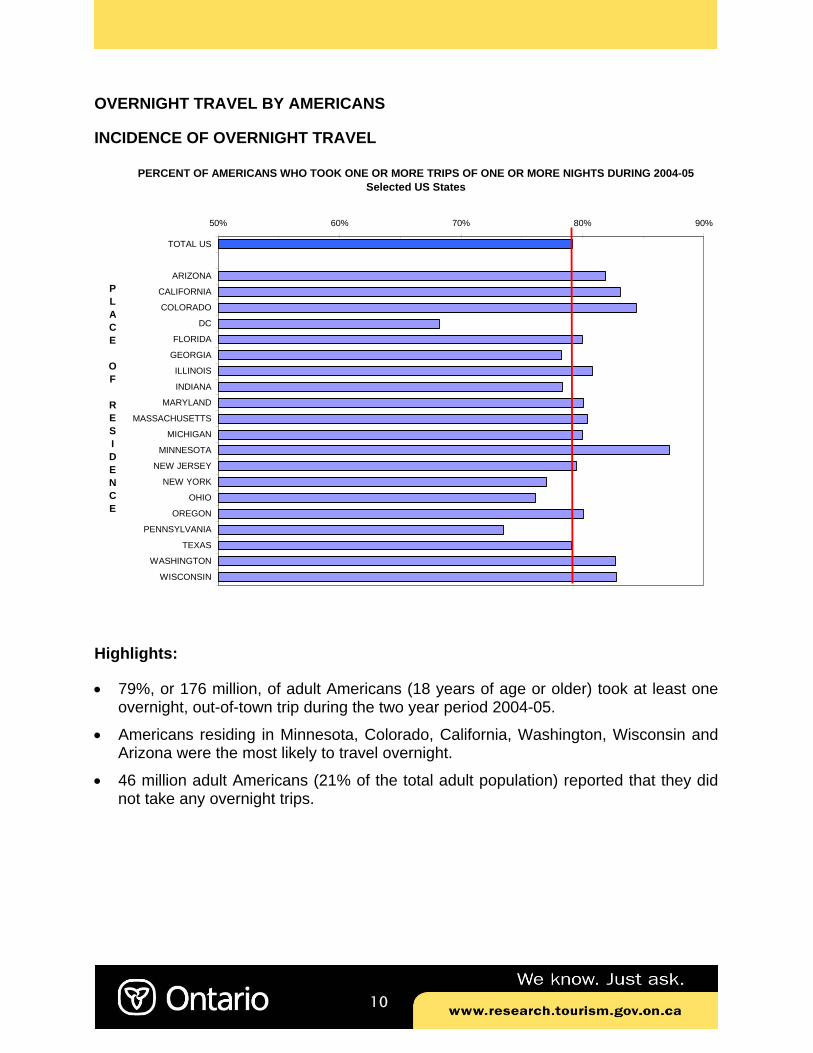
• 79%, or 176 million, of adult Americans (18 years of age or older) took at least one overnight, out-of-town trip during the two year period 2004-05.
• Americans residing in Minnesota, Colorado, California, Washington, Wisconsin and Arizona were the most likely to travel overnight.
• 46 million adult Americans (21% of the total adult population) reported that they did not take any overnight trips.
50% 60% 70% 80% 90%
TOTAL US
ARIZONA
CALIFORNIA
COLORADO
DC
FLORIDA
GEORGIA
ILLINOIS
INDIANA
MARYLAND
MASSACHUSETTS
MICHIGAN
MINNESOTA
NEW JERSEY
NEW YORK
OHIO
OREGON
PENNSYLVANIA
TEXAS
WASHINGTON
WISCONSIN
PERCENT OF AMERICANS WHO TOOK ONE OR MORE TRIPS OF ONE OR MORE NIGHTS DURING 2004-05Selected US States
PLACE OF RESIDENCE
11
REASONS FOR NOT TAKING OVERNIGHT TRIPS
REASON % of
Americans who did not
travel
Number of Americans who
did not travel (46.45 million)
Financial reasons (not enough money, unemployed, etc.) 42% 19,697
Too expensive / I would rather spend the money on something else 28% 12,841
Not enough time to travel 17% 7,748
Sick / Infirm / Disabled 14% 6,725
Nobody to travel with 10% 4,576
No particular reason 9% 4,037
No interest / Nothing to see or do that appeals to me 8% 3,508
No out-of-town family or friends to visit 8% 3,485
I have young children 7% 3,149
Recently made a major purchase (house, car, etc.) 6% 2,626
Worried about health issues at the destination 5% 2,540 Too much hassle to travel (passports, border crossings, etc.) 5% 2,522 I am done travelling 5% 2,489
Too old to travel 5% 2,459
Worried about terrorism 5% 2,200 Language difficulties / Don't speak the language 1% 639
Some other reason 9% 4,409
Don’t Know 1% 365
Not Stated 17% 7,787
Highlights:
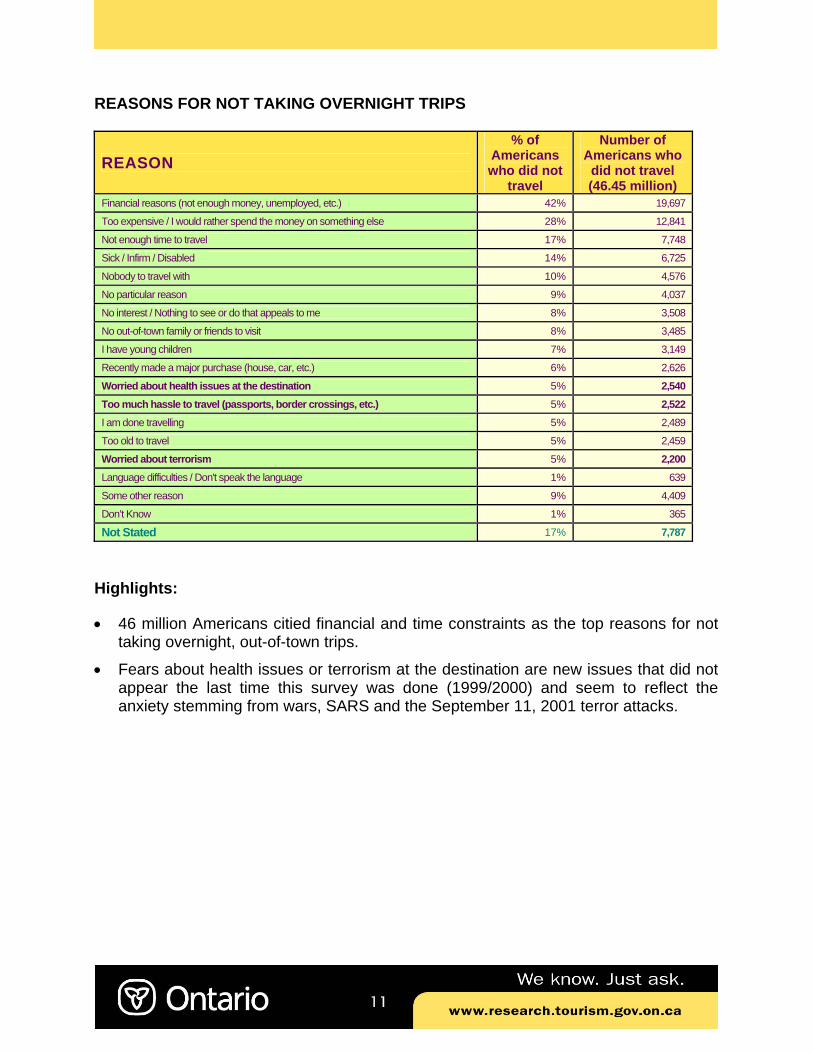
• 46 million Americans citied financial and time constraints as the top reasons for not taking overnight, out-of-town trips.
• Fears about health issues or terrorism at the destination are new issues that did not appear the last time this survey was done (1999/2000) and seem to reflect the anxiety stemming from wars, SARS and the September 11, 2001 terror attacks.

12
DESTINATIONS VISITED
DESTINATION
# of American travellers
who visited this
destination in 2004-05
(000s)
% of total traveller
(176.4 mil)
# of American travellers who
visited this destination in
the last 10 years (000s)
% of total travellers (176.4 mil)
U.S. (NET) 173,790 98.5% 174819 99.1%
YOUR OWN STATE 138,937 78.8% 149,522 84.8%
SOME OTHER U.S. STATE 156,955 89.0% 166,784 94.6%
C AN AD A (NE T) 24,982 14.2% 46,611 26.4% NEWFOUNDLAND & LABRADOR 708 0.4% 1,869 1.1%
PRINCE EDWARD ISLAND 1,041 0.6% 2,822 1.6%
NEW BRUNSWICK 1,399 0.8% 3,377 1.9%
NOVA SCOTIA 2,297 1.3% 5,572 3.2%
QUEBEC 5,323 3.0% 12,335 7.0%
ONTARIO 14,181 8.0% 27,046 15.3%
MANITOBA 896 0.5% 2,430 1.4%
SASKATCHEWAN 831 0.5% 2,237 1.3%
ALBERTA 2,056 1.2% 5,594 3.2%
BRITISH COLUMBIA 7,049 4.0% 15,813 9.0%
YUKON 968 0.5% 2,412 1.4%
NORTHWEST TERRITORIES 673 0.4% 1,632 0.9%
NUNAVUT 82 0.0% 274 0.2%
MEXICO 23,250 13.2% 42,159 23.9%
SOUTH/CENTRAL AMERICA 5,758 3.3% 10,849 6.2%
THE CARIBBEAN 21,740 12.3% 38,312 21.7%
EUROPE ( i nc l . UK&RUSSIA) 15,581 8.8% 31,945 18.1%
AUSTRALIA /NEW ZEALAND 1,622 0.9% 4,917 2.8%
ASIA 5,166 2.9% 9,821 5.6%
AFRICA 1,268 0.7% 3,380 1.9%
SOME OTHER DESTINATION 5,990 3.4% 10,994 6.2%
NOT STATED 1,350 0.8% 883 0.5%
Note: Numbers and percentages do not add up to 100% because travellers visit more than one place. Highlights:
• Over the last ten years and in the most recent two-year period, Canada has been the top foreign destination visited by Americans for overnight trips.
• Compared to the last 10 years, Canada’s share of US visitors in the past 2 years declined more than that of Mexico’s or the Caribbean’s, but less than the shares of Europe, Australia, Asia or Africa.
13
VISITATION TO ONTARIO
Highlights:
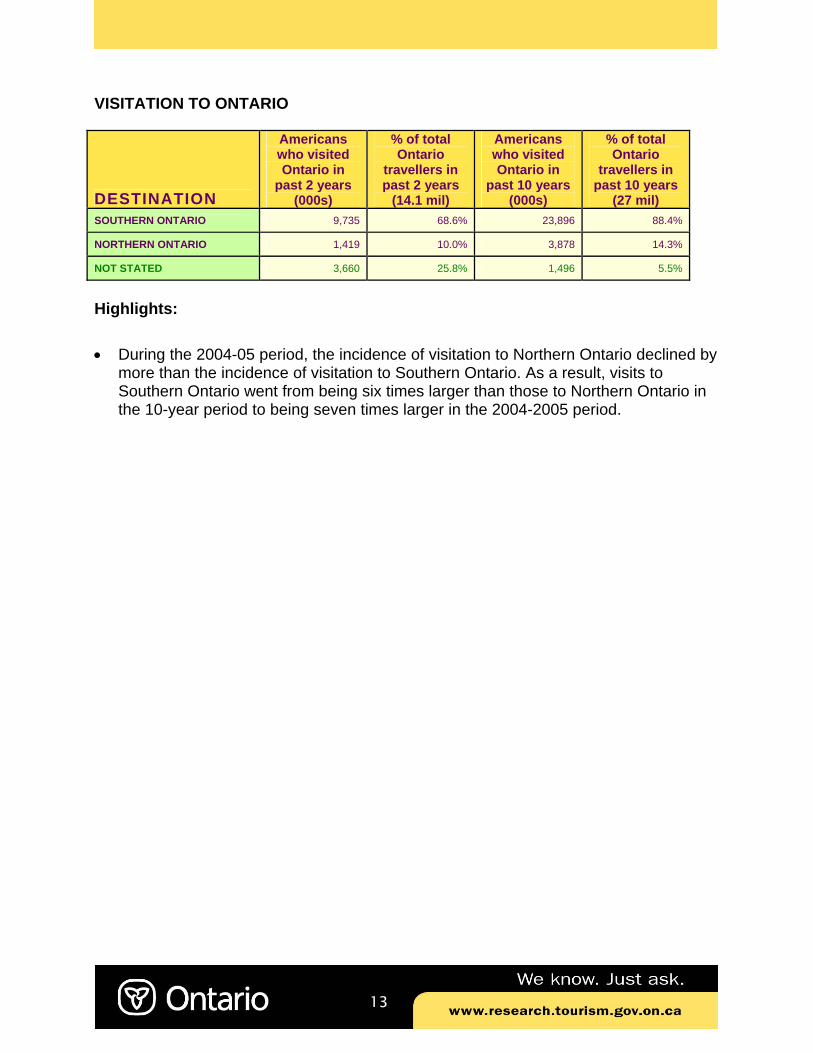
• During the 2004-05 period, the incidence of visitation to Northern Ontario declined by more than the incidence of visitation to Southern Ontario. As a result, visits to Southern Ontario went from being six times larger than those to Northern Ontario in the 10-year period to being seven times larger in the 2004-2005 period.
DESTINATION
Americans who visited Ontario in
past 2 years (000s)
% of total Ontario
travellers in past 2 years
(14.1 mil)
Americans who visited Ontario in
past 10 years (000s)
% of total Ontario
travellers in past 10 years
(27 mil) SOUTHERN ONTARIO 9,735 68.6% 23,896 88.4%
NORTHERN ONTARIO 1,419 10.0% 3,878 14.3%
NOT STATED 3,660 25.8% 1,496 5.5%
14
ACTIVITY PARTICIPATION WHILE ON OVERNIGHT TRIPS AND IMPORTANCE OF ACTIVITIES AS TRIP MOTIVATORS Highlights for All Activity Tables: • Shopping and dining are travellers’ most popular activities. Destinations that aspire
to attract the mass travel market need to evaluate the shopping and dining opportunities that they offer to their visitors.
• Dining at restaurants that offer local ingredients and recipes, shopping for clothing,
shoes or jewellery, going to a casino or an amusement park and strolling around a city to observe buildings and architecture are the most popular single activities for overnight travelers.
• Although American travelers enjoy shopping and dining when they travel, they tend to list
other activities as the primary reason for their travel. Dining was the main reason for taking trips of one or more nights in only 12% of all the trips that had dining as an activity. Similarly, only in 13% of the trips that had shopping as an activity, was shopping the main reason for the trip.
• The top trip motivators were (for the trips that contained these activities):
o Big-game hunting (it motivated 78% of the trips containing it as an activity) o Package golf tour (76% of trips) o Motorcycle overnight touring (75% of trips) o Downhill skiing (72% of trips) o Snowmobile overnight touring (70% of trips)
• Winter outdoor activities as a group had the highest ratio of trips motivated by these
activities to total trips containing these activities (64%). • Only 26 activities, accounting for 13% of the 194 activities contained in the TAMS
questionnaire and 34% of the American travelers, were main trip motivators in 50% or more of the trips that contained them. This suggests that single activities do not tend to motivate trips.
• Overall, 4.5% of American travellers did not answer the activity question, either because
they did not do any of the activities listed in the questionnaire or because they did not want to bother with a long question.
• As well, 31.2% of American travellers did not mention any activity as the main reason for
taking any of their trips, either because single activities do not act as trip-motivators for many travellers or because they did not want to bother answering a long question. Given the low non-response rates in all of the other TAMS questions, this high percentage most likely signifies again that for a large portion of American travellers, single activities do not act as trip-motivators.
15
ACTIVITIES DURING OVERNIGHT TRIPS IN2004-2005
American travellers
(000s)
% of total travellers (176.4 mil)
% of travellers for whom this activity motivated some of
their trips
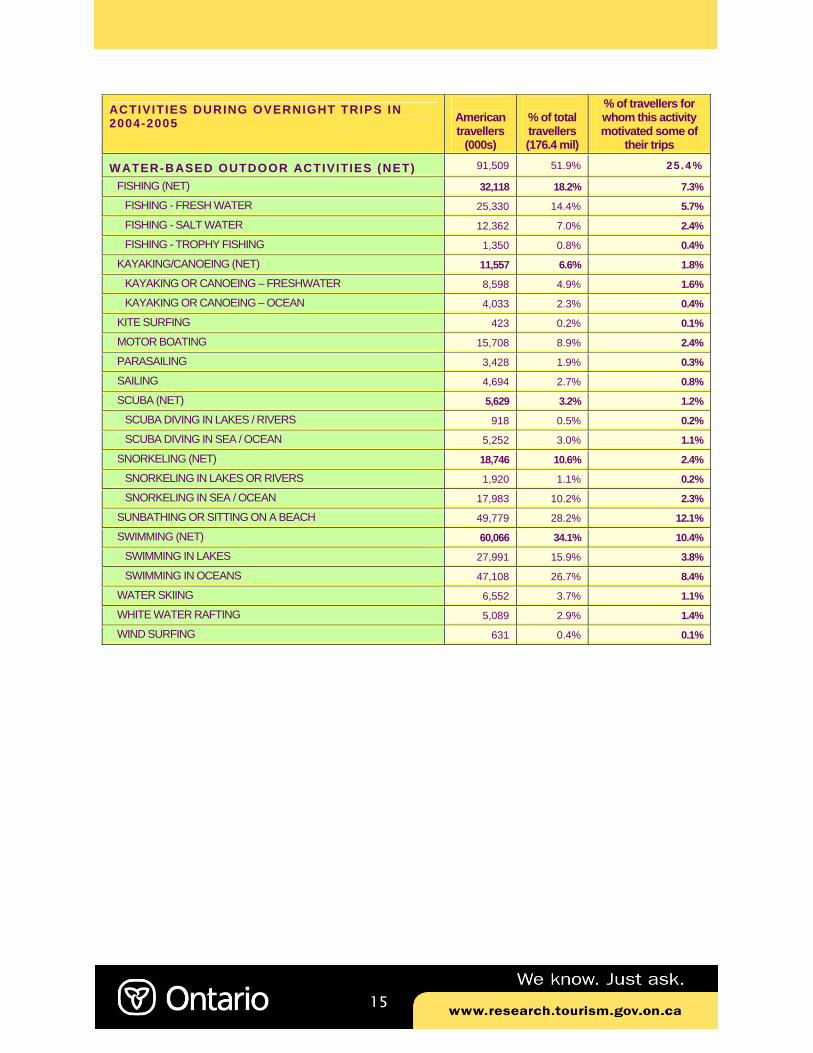
WATER-BASED OUTDOOR ACTIVITIES (NET) 91,509 51.9% 25 .4%
FISHING (NET) 32,118 18.2% 7.3%
FISHING - FRESH WATER 25,330 14.4% 5.7%
FISHING - SALT WATER 12,362 7.0% 2.4%
FISHING - TROPHY FISHING 1,350 0.8% 0.4%
KAYAKING/CANOEING (NET) 11,557 6.6% 1.8%
KAYAKING OR CANOEING – FRESHWATER 8,598 4.9% 1.6%
KAYAKING OR CANOEING – OCEAN 4,033 2.3% 0.4%
KITE SURFING 423 0.2% 0.1%
MOTOR BOATING 15,708 8.9% 2.4%
PARASAILING 3,428 1.9% 0.3%
SAILING 4,694 2.7% 0.8%
SCUBA (NET) 5,629 3.2% 1.2%
SCUBA DIVING IN LAKES / RIVERS 918 0.5% 0.2%
SCUBA DIVING IN SEA / OCEAN 5,252 3.0% 1.1%
SNORKELING (NET) 18,746 10.6% 2.4%
SNORKELING IN LAKES OR RIVERS 1,920 1.1% 0.2%
SNORKELING IN SEA / OCEAN 17,983 10.2% 2.3%
SUNBATHING OR SITTING ON A BEACH 49,779 28.2% 12.1%
SWIMMING (NET) 60,066 34.1% 10.4%
SWIMMING IN LAKES 27,991 15.9% 3.8%
SWIMMING IN OCEANS 47,108 26.7% 8.4%
WATER SKIING 6,552 3.7% 1.1%
WHITE WATER RAFTING 5,089 2.9% 1.4%
WIND SURFING 631 0.4% 0.1%

16
ACTIVITIES DURING OVERNIGHT TRIPS IN 2004-2005
American travellers
(000s) % of total travellers
% of travellers for whom this activity motivated some of
their trips
WINTER OUTDOOR ACTIVITIES (NET) 20 ,936 11 .9% 7 .6%
DOG SLEDDING 593 0.3% 0.1%
ICE FISHING 2,337 1.3% 0.8%
ICE-SKATING 3,761 2.1% 0.4%
SKIING (NET) 12,545 7.1% 5.0
CROSS COUNTRY 2,431 1.4% 0.6%
CROSS/BACK COUNTRY AS AN OVERNIGHT TOURING TRIP 380 0.2% 0.1%
DOWNHILL 10,960 6.2% 4.5%
HELI-SKIING 216 0.1% 0.1%
SKI JOURING 173 0.1% 0.0%
SNOWBOARDING 4,452 2.5% 1.5%
SNOWMOBILING 3,414 1.9% 1.0
DAY USE ON ORGANIZED TRAIL 3,220 1.8% 0.9%
AS AN OVERNIGHT TOURING TRIP 650 0.4% 0.3%
SNOWSHOEING 1,369 0.8% 0.2%

17
ACTIVITIES DURING OVERNIGHT TRIPS IN 2004-2005
American travellers
(000s) % of total travellers
% of travellers for whom this activity motivated some of
their trips
LAND-BASED ACTIVITIES (NET) 100,773 57.1% 24.6%
ALL TERRAIN VEHICLE (NET) 9,862 5.6% 1.6% USED ONE FOR A SAME DAY EXCURSION 9,373 5.3% 1.5% USED ONE AS PART OF AN OVERNIGHT TOURING TRIP 1,759 1.0% 0.5%
BUNGEE JUMPING 729 0.4% 0.1% CLIMBING (NET) 7,077 4.0% 1.4% ICE CLIMBING 253 0.1% 0.1% ROCK CLIMBING 3,284 1.9% 0.6% MOUNTAIN CLIMBING / TREKKING 4,777 2.7% 1.0% CYCLING (NET) 10,883 6.2% 1.7% SAME DAY EXCURSION 8,451 4.8% 1.1% MOUNTAINING BIKING 3,437 1.9% 0.6% USED ONE FOR AN OVERNIGHT TOURING TRIP 962 0.5% 0.3% FITNESS (NET) 24,263 13.8% 1.9% WORKING OUT IN A FITNESS CENTRE 17,212 9.8% 1.2% JOGGING OR EXERCISING OUTDOORS 15,851 9.0% 1.3% GOLFING (NET) 18,377 10.4% 3.5% PLAYED AN OCCASIONAL GAME 16,343 9.3% 2.1% PLAYED DURING A STAY AT A GOLF RESORT 5,080 2.9% 1.8% TOOK PACKAGE GOLF TOUR TO PLAY ON VARIOUS COURSES 2,236 1.3% 1.0%

18
ACTIVITIES DURING OVERNIGHT TRIPS IN 2004-2005
American travellers
(000s) % of total travellers
% of travellers for whom this activity
motivated some of their trips
LAND-BASED ACTIVITIES - Cont inued HIKING (NET) 32,129 18.2% 5.6% SAME DAY EXCURSION WHILE ON OVERNIGHT TRIP 29,661 16.8% 4.0%
HIKING IN WILDERNESS WITH OVERNIGHT CAMPING 7,446 4.2% 2.6%
HORSEBACK RIDING (NET) 10,553 6.0% 1.5% SAME DAY HORSEBACK RIDING EXCURSION 10,211 5.8 1.3
TRAVELED BY HORSE WITH OVERNIGHT STOPS 948 0.5 0.3
HUNTING (NET) 9,288 5.3% 3.8% BIG GAME 6,417 3.6% 2.8% SMALL GAME 4,153 2.4% 1.4% BIRDS 3,434 1.9% 1.2% IN-LINE / ROLLER BLADING 2,105 1.2% 0.2% MINI-GOLF 23,121 13.1% 1.2% MOTORCYCLING (NET) 5,283 3.0% 1.7% DAY EXCURSION WHILE ON AN OVERNIGHT TRIP 4,667 2.6% 1.3%
AS AN OVERNIGHT TOURING TRIP 2,500 1.4% 1.1% VISITED NATIONAL, PROVINCIAL, STATE NATURE PARK 45,375 25.7% 10.0%
SKATEBOARDING 1,178 0.7% 0.2% VIEWING NORTHERN LIGHTS 3,762 2.1% 0.6% WILDFLOWERS / FLORA VIEWING 15,319 8.7% 1.7% WILDLIFE VIEWING (NET) 30,841 17.5% 4.4% BIRD WATCHING 12,128 6.9% 1.3% WHALE WATCHING AND OTHER MARINE LIFE 14,097 8.0% 2.1% LAND BASED ANIMALS 22,268 12.6% 3.0%

19
ACTIVITIES DURING OVERNIGHT TRIPS IN 2004-2005
American travellers
(000s) % of total travellers
% of travellers for whom this activity motivated some of
their trips TEAM SPORTS (NET) 31,935 18.1% 6.1% BADMINTON 1,541 0.9% 0.1% BASEBALL OR SOFTBALL 6,262 3.6% 1.7% BASKETBALL 4,909 2.8% 0.9% BEACH VOLLEYBALL 4,296 2.4% 0.4% BOARD GAMES 12,365 7.0% 0.5% BOWLING 8,600 4.9% 1.2% CURLING 249 0.1% 0.0% FOOTBALL 4,237 2.4% 1.2% ICE HOCKEY 1,400 0.8% 0.5% PAINTBALL 1,471 0.8% 0.2% SOCCER 2,807 1.6% 0.8% SQUASH 184 0.1% 0.0% TENNIS 4,491 2.5% 0.5% VOLLEYBALL 4,120 2.3% 0.5%
ABORIGINAL ACTIVITIES (NET) 14,752 8.4% 2.6%
ABORIGINAL CULTURAL EXPERIENCES IN A REMOTE OR RURAL SETTING WHERE YOU STAYED FOR ONE OR MORE NIGHTS
3,889 2.2% 0.8%
ABORIGINAL HERITAGE ATTRACTIONS (e.g., MUSEUMS, INTERPRETIVE CENTRES) 10,253 5.8% 1.4%
ABORIGINAL FESTIVALS AND EVENTS (e.g., POW WOWS) 4,400 2.5% 0.9%
ABORIGINAL CUISINE (TASTED OR SAMPLED) 4,460 2.5% 0.6% ABORIGINAL ARTS AND CRAFTS SHOWS 5,810 3.3% 0.9% ABORIGINAL OUTDOOR ADVENTURE OR SPORTS 1,734 1.0% 0.3%
20
ACTIVITIES DURING OVERNIGHT TRIPS IN 2004-2005
American travellers
(000s) % of total travellers
% of travellers for whom this activity motivated some of
their trips
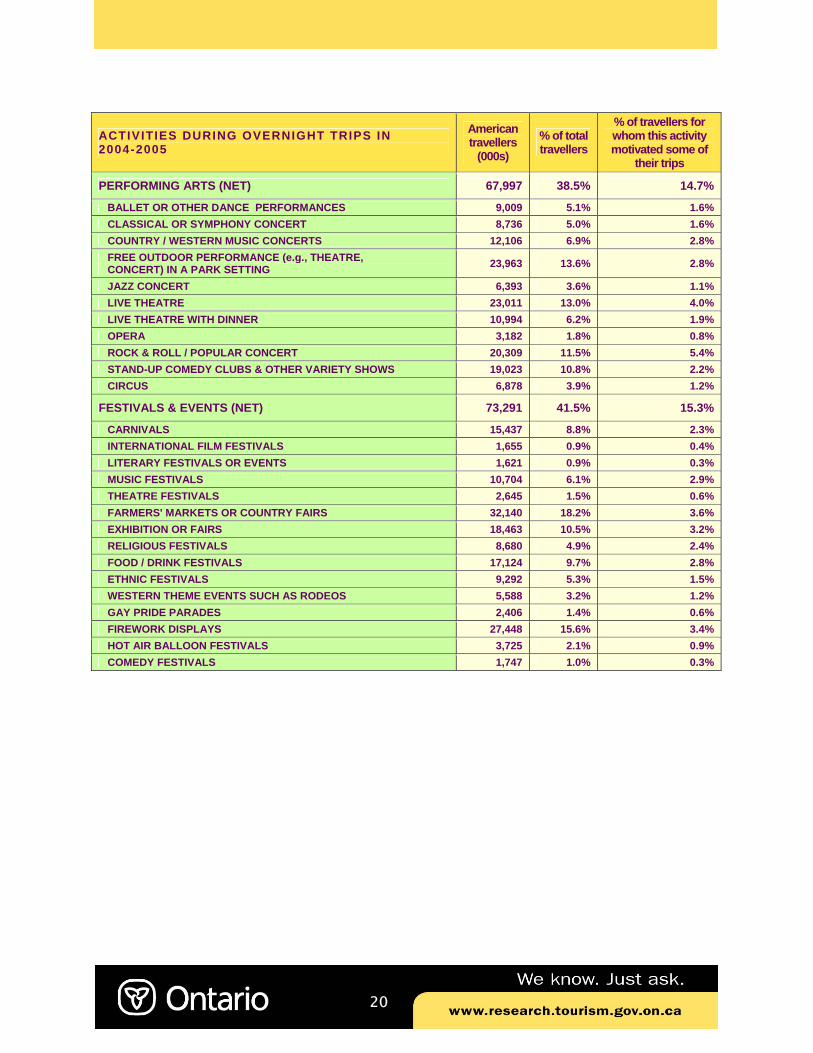
PERFORMING ARTS (NET) 67,997 38.5% 14.7%
BALLET OR OTHER DANCE PERFORMANCES 9,009 5.1% 1.6% CLASSICAL OR SYMPHONY CONCERT 8,736 5.0% 1.6% COUNTRY / WESTERN MUSIC CONCERTS 12,106 6.9% 2.8% FREE OUTDOOR PERFORMANCE (e.g., THEATRE, CONCERT) IN A PARK SETTING 23,963 13.6% 2.8%
JAZZ CONCERT 6,393 3.6% 1.1% LIVE THEATRE 23,011 13.0% 4.0% LIVE THEATRE WITH DINNER 10,994 6.2% 1.9% OPERA 3,182 1.8% 0.8% ROCK & ROLL / POPULAR CONCERT 20,309 11.5% 5.4% STAND-UP COMEDY CLUBS & OTHER VARIETY SHOWS 19,023 10.8% 2.2% CIRCUS 6,878 3.9% 1.2%
FESTIVALS & EVENTS (NET) 73,291 41.5% 15.3%
CARNIVALS 15,437 8.8% 2.3% INTERNATIONAL FILM FESTIVALS 1,655 0.9% 0.4% LITERARY FESTIVALS OR EVENTS 1,621 0.9% 0.3% MUSIC FESTIVALS 10,704 6.1% 2.9% THEATRE FESTIVALS 2,645 1.5% 0.6% FARMERS' MARKETS OR COUNTRY FAIRS 32,140 18.2% 3.6% EXHIBITION OR FAIRS 18,463 10.5% 3.2% RELIGIOUS FESTIVALS 8,680 4.9% 2.4% FOOD / DRINK FESTIVALS 17,124 9.7% 2.8% ETHNIC FESTIVALS 9,292 5.3% 1.5% WESTERN THEME EVENTS SUCH AS RODEOS 5,588 3.2% 1.2% GAY PRIDE PARADES 2,406 1.4% 0.6% FIREWORK DISPLAYS 27,448 15.6% 3.4% HOT AIR BALLOON FESTIVALS 3,725 2.1% 0.9% COMEDY FESTIVALS 1,747 1.0% 0.3%

21
ACTIVITIES DURING OVERNIGHT TRIPS IN 2004-2005
American travellers
(000s) % of total travellers
% of travellers for whom this activity motivated some of
their trips
THEME PARKS (NET) 92,519 52.4% 23.9%
AMUSEMENT PARK 57,903 32.8% 17.7%
AQUARIUMS 35,088 19.9% 5.1%
BOTANICAL GARDENS 20,228 11.5% 2.1%
GARDEN THEME PARK 7,218 4.1% 1.1%
MUSICAL ATTRACTIONS 8,261 4.7% 1.4%
MOVIE THEME PARK 12,048 6.8% 2.7%
PLANETARIUM 7,867 4.5% 1.0%
SCIENCE & TECHNOLOGY THEME PARK 8,270 4.7% 1.2%
WATER THEME PARK 21,496 12.2% 4.7%
WAX MUSEUMS 7,125 4.0% 0.8%
ZOOS 35,049 19.9% 5.4%
ENTERTAINMENT FARMS (CORN MAZE, PETTING ZOO) 10,912 6.2% 1.5%
EXHIBITS, ARCHTECTURE, HISTORIC SITES (NET) 95,814 54.3% 18.1%
ART GALLERIES 24,755 14.0% 2.8% HISTORICAL REPLICAS OF CITIES/TOWNS WITH HISTORIC RE-ENACTMENTS 16,132 9.1% 2.9%
MUSEUMS (NET) 50,468 28.6% 6.3% CHILDREN'S MUSEUMS 10,691 6.1% 1.3% GENERAL HISTORY OR HERITAGE MUSEUMS 33,461 19.0% 3.8% SCIENCE OR TECHNOLOGY MUSEUMS 20,645 11.7% 2.6% MILITARY / WAR MUSEUMS 17,660 10.0% 2.4% PALEONTOLOGICAL / ARCHAEOLOGICAL SITES 8,748 5.0% 1.3% STROLLING AROUND A CITY TO OBSERVE ITS BUILDINGS & ARCHITECTURE 56,945 32.3% 6.8%
WELL KNOWN HISTORIC SITES OR BUILDINGS 51,478 29.2% 7.4% OTHER HISTORIC SITES MONUMENTS AND BUILDINGS 42,809 24.3% 5.6% WELL KNOWN NATURAL "WONDERS" 36,223 20.5% 6.9%
HANDS-ON LEARNING ACTIVITIES (NET) 16,427 9.3% 3.0%
ARCHAEOLOGICAL DIGS 1,666 0.9% 0.3% COOKING / WINE TASTING COURSES 7,109 4.0% 1.1% COURSES TO LEARN ANOTHER LANGUAGE 1,369 0.8% 0.3% CURATORIAL TOURS 1,814 1.0% 0.3% HARVESTING AND / OR OTHER FARM OPERATIONS 2,659 1.5% 0.5% HISTORICAL RE-ENACTMENTS (AS AN ACTOR) 1,355 0.8% 0.4% INTERPRETIVE PROGRAM AT A HISTORIC SITE OR PARK 4,684 2.7% 0.6% WILDERNESS SKILLS COURSES 1,508 0.9% 0.3%
22
ACTIVITIES DURING OVERNIGHT TRIPS IN 2004-2005
American travellers
(000s) % of total travellers
% of travellers for whom this
activity motivated some of their
trips
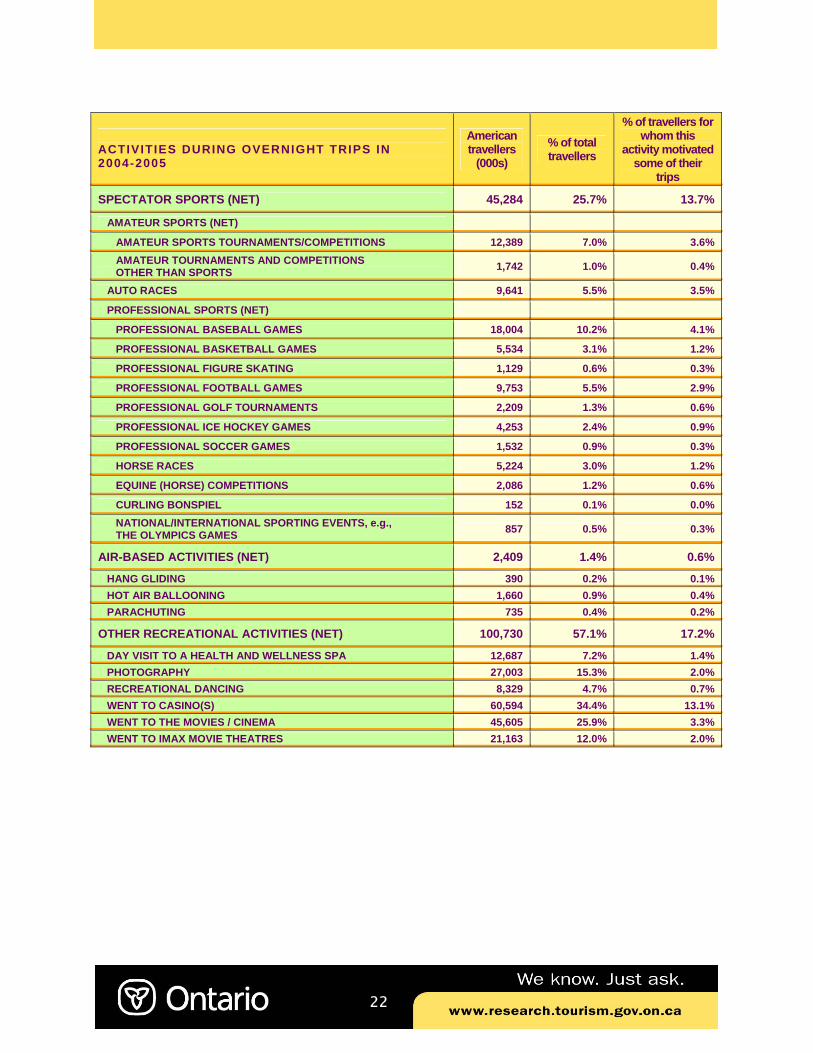
SPECTATOR SPORTS (NET) 45,284 25.7% 13.7%
AMATEUR SPORTS (NET)
AMATEUR SPORTS TOURNAMENTS/COMPETITIONS 12,389 7.0% 3.6% AMATEUR TOURNAMENTS AND COMPETITIONS OTHER THAN SPORTS 1,742 1.0% 0.4%
AUTO RACES 9,641 5.5% 3.5%
PROFESSIONAL SPORTS (NET)
PROFESSIONAL BASEBALL GAMES 18,004 10.2% 4.1%
PROFESSIONAL BASKETBALL GAMES 5,534 3.1% 1.2%
PROFESSIONAL FIGURE SKATING 1,129 0.6% 0.3%
PROFESSIONAL FOOTBALL GAMES 9,753 5.5% 2.9%
PROFESSIONAL GOLF TOURNAMENTS 2,209 1.3% 0.6%
PROFESSIONAL ICE HOCKEY GAMES 4,253 2.4% 0.9%
PROFESSIONAL SOCCER GAMES 1,532 0.9% 0.3%
HORSE RACES 5,224 3.0% 1.2%
EQUINE (HORSE) COMPETITIONS 2,086 1.2% 0.6%
CURLING BONSPIEL 152 0.1% 0.0% NATIONAL/INTERNATIONAL SPORTING EVENTS, e.g., THE OLYMPICS GAMES 857 0.5% 0.3%
AIR-BASED ACTIVITIES (NET) 2,409 1.4% 0.6%
HANG GLIDING 390 0.2% 0.1% HOT AIR BALLOONING 1,660 0.9% 0.4% PARACHUTING 735 0.4% 0.2%
OTHER RECREATIONAL ACTIVITIES (NET) 100,730 57.1% 17.2%
DAY VISIT TO A HEALTH AND WELLNESS SPA 12,687 7.2% 1.4% PHOTOGRAPHY 27,003 15.3% 2.0% RECREATIONAL DANCING 8,329 4.7% 0.7% WENT TO CASINO(S) 60,594 34.4% 13.1% WENT TO THE MOVIES / CINEMA 45,605 25.9% 3.3% WENT TO IMAX MOVIE THEATRES 21,163 12.0% 2.0%
23
ACTIVITIES DURING OVERNIGHT TRIPS IN 2004-2005
American travellers
(000s) % of total travellers
% of travellers for whom this activity motivated some
of their trips
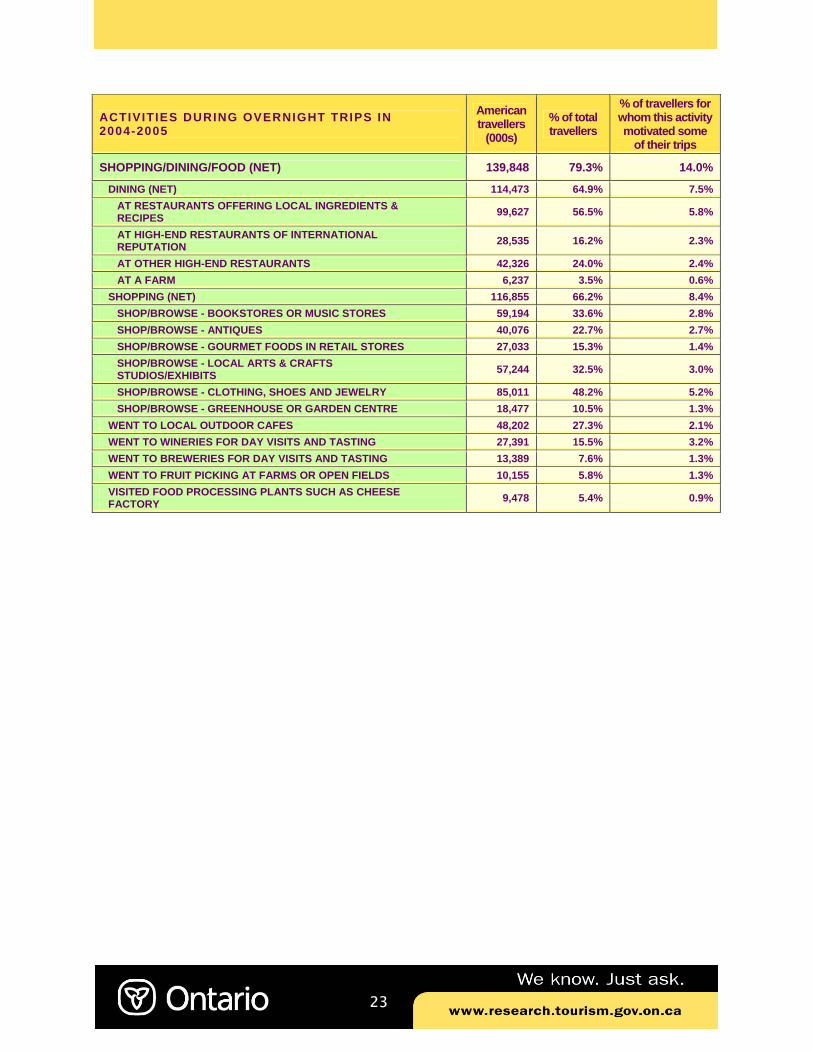
SHOPPING/DINING/FOOD (NET) 139,848 79.3% 14.0%
DINING (NET) 114,473 64.9% 7.5% AT RESTAURANTS OFFERING LOCAL INGREDIENTS & RECIPES 99,627 56.5% 5.8%
AT HIGH-END RESTAURANTS OF INTERNATIONAL REPUTATION 28,535 16.2% 2.3%
AT OTHER HIGH-END RESTAURANTS 42,326 24.0% 2.4% AT A FARM 6,237 3.5% 0.6% SHOPPING (NET) 116,855 66.2% 8.4% SHOP/BROWSE - BOOKSTORES OR MUSIC STORES 59,194 33.6% 2.8% SHOP/BROWSE - ANTIQUES 40,076 22.7% 2.7% SHOP/BROWSE - GOURMET FOODS IN RETAIL STORES 27,033 15.3% 1.4% SHOP/BROWSE - LOCAL ARTS & CRAFTS STUDIOS/EXHIBITS 57,244 32.5% 3.0%
SHOP/BROWSE - CLOTHING, SHOES AND JEWELRY 85,011 48.2% 5.2% SHOP/BROWSE - GREENHOUSE OR GARDEN CENTRE 18,477 10.5% 1.3% WENT TO LOCAL OUTDOOR CAFES 48,202 27.3% 2.1% WENT TO WINERIES FOR DAY VISITS AND TASTING 27,391 15.5% 3.2% WENT TO BREWERIES FOR DAY VISITS AND TASTING 13,389 7.6% 1.3% WENT TO FRUIT PICKING AT FARMS OR OPEN FIELDS 10,155 5.8% 1.3% VISITED FOOD PROCESSING PLANTS SUCH AS CHEESE FACTORY 9,478 5.4% 0.9%

24
ACTIVITIES DURING OVERNIGHT TRIPS IN 2004-2005
American travellers
(000s)
% of total travellers
% of travellers for whom this activity motivated some of
their trips ACCOMODATION-RELATED ACTIVITIES (NET) STAYED AT: 83,631 47.4% 20.7%
LAKESIDE / RIVERSIDE RESORT 21,363 12.1% 4.4% SKI RESORT OR MOUNTAIN RESORT 15,374 8.7% 3.6% SEASIDE RESORT 31,380 17.8% 6.8% WILDERNESS (NET) 7,218 4.1% 1.7% REMOTE OR FLY-IN WILDERNESS LODGE 1,415 0.8% 0.4% REMOTE OR FLY-IN WILDERNESS OUTPOST 762 0.4% 0.2% WILDERNESS LODGE YOU CAN DRIVE TO BY CAR 5,977 3.4% 1.3% COOKING SCHOOL 1,006 0.6% 0.2% WINE TASTING SCHOOL 755 0.4% 0.2% COUNTRY INN OR RESORT BECAUSE IT HAD A GOURMET RESTAURANT ON THE PREMISES 3,432 1.9% 0.6%
HEALTH SPA 5,411 3.1% 0.8% FARM OR GUEST RANCH 3,452 2.0% 0.6% ON A HOUSEBOAT 2,477 1.4% 0.7% CAMPGROUND (NET) 39,314 22.3% 9.6% A PUBLIC CAMPGROUND IN A NATURE PARK 29,085 16.5% 7.1% A PRIVATE CAMPGROUND 17,484 9.9% 3.7% A CAMP SITE IN A WILDERNESS SETTING (NOT A CAMPGROUND) 8,073 4.6% 1.8%
A MOTOR HOME OR RV WHILE TRAVELING OR TOURING (NOT A CAMPING TRIP) 7,338 4.2% 1.4%

25
SHELTER USED ON CAMPING TRIPS
TENT28,820,675
TENT TRAILER2,810,424
TRUCK CAMPER OR VAN2,443,641
MOTOR HOME OR RV7,082,605
TRAVEL TRAILER/FIFTH WHEEL
7,618,646
60.6%
5.9%
5.1%
16.0%
14.9%
TYPE OF SHELTER MOST OFTEN USED ON CAMPING TRIPS2004-05
Highlights:
• Of the 48 million adult Americans who went camping, 61% used a tent. Travel trailer/fifth wheeler was the second most popular choice accounting for 16% of American campers.
26
TOURS
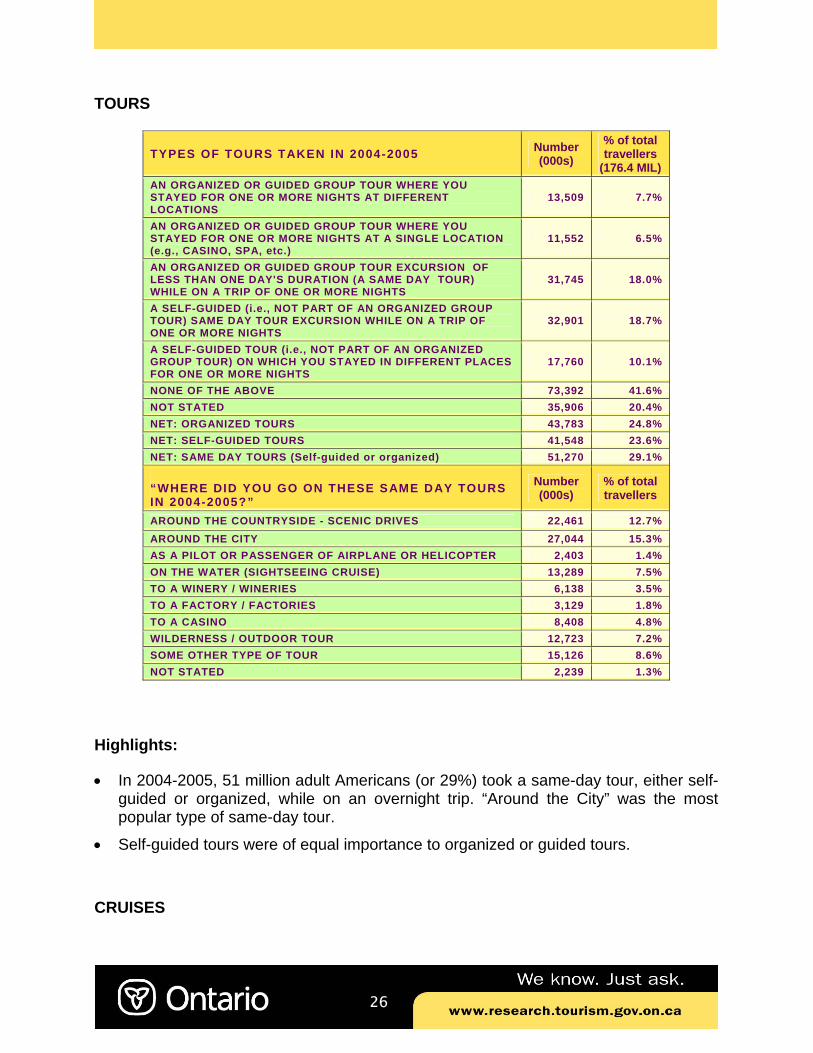
TYPES OF TOURS TAKEN IN 2004-2005 Number (000s)
% of total travellers
(176.4 MIL) AN ORGANIZED OR GUIDED GROUP TOUR WHERE YOU STAYED FOR ONE OR MORE NIGHTS AT DIFFERENT LOCATIONS
13,509 7.7%
AN ORGANIZED OR GUIDED GROUP TOUR WHERE YOU STAYED FOR ONE OR MORE NIGHTS AT A SINGLE LOCATION (e.g., CASINO, SPA, etc.)
11,552 6.5%
AN ORGANIZED OR GUIDED GROUP TOUR EXCURSION OF LESS THAN ONE DAY'S DURATION (A SAME DAY TOUR) WHILE ON A TRIP OF ONE OR MORE NIGHTS
31,745 18.0%
A SELF-GUIDED (i.e., NOT PART OF AN ORGANIZED GROUP TOUR) SAME DAY TOUR EXCURSION WHILE ON A TRIP OF ONE OR MORE NIGHTS
32,901 18.7%
A SELF-GUIDED TOUR (i.e., NOT PART OF AN ORGANIZED GROUP TOUR) ON WHICH YOU STAYED IN DIFFERENT PLACES FOR ONE OR MORE NIGHTS
17,760 10.1%
NONE OF THE ABOVE 73,392 41.6% NOT STATED 35,906 20.4% NET: ORGANIZED TOURS 43,783 24.8% NET: SELF-GUIDED TOURS 41,548 23.6% NET: SAME DAY TOURS (Self-guided or organized) 51,270 29.1%
“WHERE DID YOU GO ON THESE SAME DAY TOURS IN 2004-2005?”
Number (000s)
% of total travellers
AROUND THE COUNTRYSIDE - SCENIC DRIVES 22,461 12.7% AROUND THE CITY 27,044 15.3% AS A PILOT OR PASSENGER OF AIRPLANE OR HELICOPTER 2,403 1.4% ON THE WATER (SIGHTSEEING CRUISE) 13,289 7.5% TO A WINERY / WINERIES 6,138 3.5% TO A FACTORY / FACTORIES 3,129 1.8% TO A CASINO 8,408 4.8% WILDERNESS / OUTDOOR TOUR 12,723 7.2% SOME OTHER TYPE OF TOUR 15,126 8.6% NOT STATED 2,239 1.3%
Highlights:
• In 2004-2005, 51 million adult Americans (or 29%) took a same-day tour, either self-guided or organized, while on an overnight trip. “Around the City” was the most popular type of same-day tour.
• Self-guided tours were of equal importance to organized or guided tours. CRUISES
27
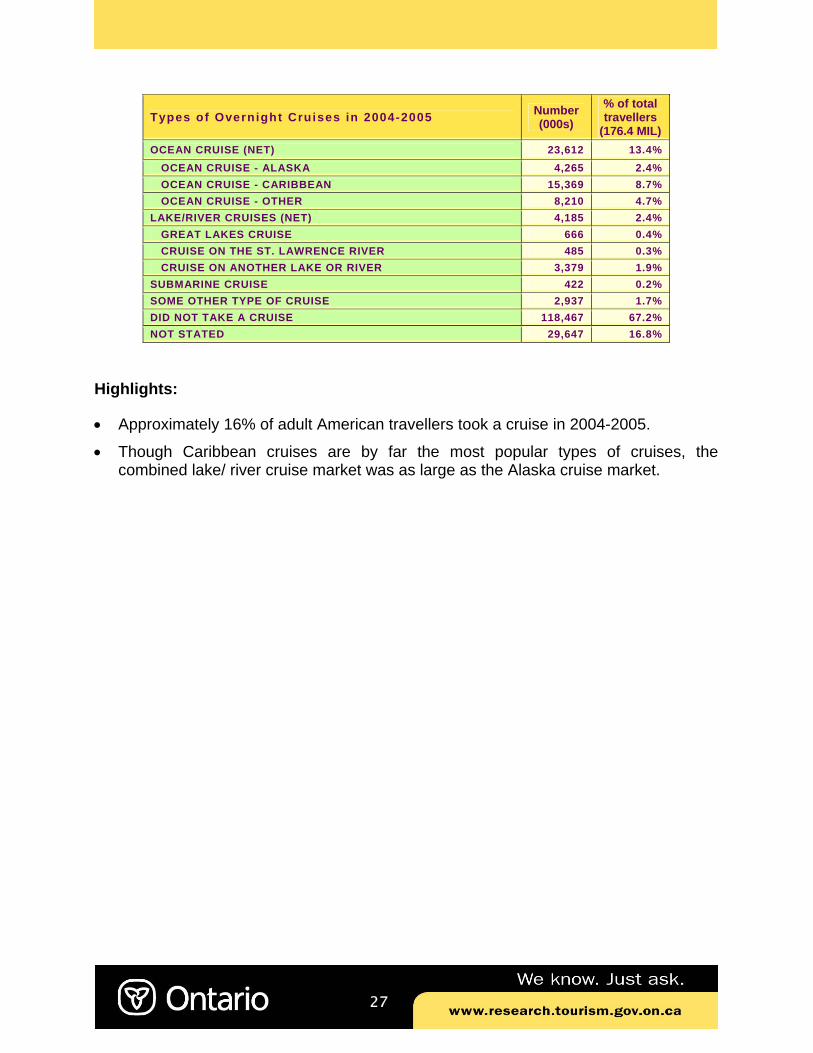
Types of Overnight Cruises in 2004-2005 Number (000s)
% of total travellers
(176.4 MIL) OCEAN CRUISE (NET) 23,612 13.4% OCEAN CRUISE - ALASKA 4,265 2.4% OCEAN CRUISE - CARIBBEAN 15,369 8.7% OCEAN CRUISE - OTHER 8,210 4.7% LAKE/RIVER CRUISES (NET) 4,185 2.4% GREAT LAKES CRUISE 666 0.4% CRUISE ON THE ST. LAWRENCE RIVER 485 0.3% CRUISE ON ANOTHER LAKE OR RIVER 3,379 1.9% SUBMARINE CRUISE 422 0.2% SOME OTHER TYPE OF CRUISE 2,937 1.7% DID NOT TAKE A CRUISE 118,467 67.2% NOT STATED 29,647 16.8%
Highlights:
• Approximately 16% of adult American travellers took a cruise in 2004-2005.
• Though Caribbean cruises are by far the most popular types of cruises, the combined lake/ river cruise market was as large as the Alaska cruise market.
28
BUSINESS TRAVEL
Incidence of Business or Job-related Travel
TYPES OF BUSINESS OR JOB-RELATED TRAVEL IN 2004-2005
Number (000s)
% of total travellers (176.4 mil)
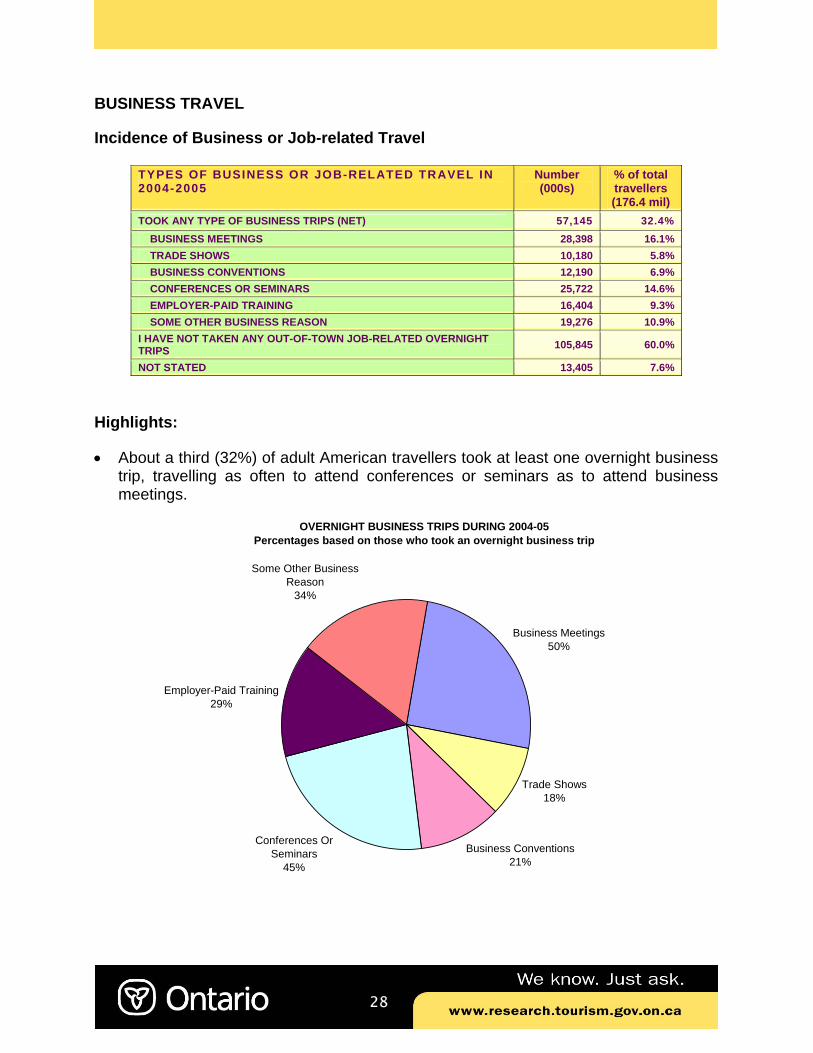
TOOK ANY TYPE OF BUSINESS TRIPS (NET) 57,145 32.4% BUSINESS MEETINGS 28,398 16.1% TRADE SHOWS 10,180 5.8% BUSINESS CONVENTIONS 12,190 6.9% CONFERENCES OR SEMINARS 25,722 14.6% EMPLOYER-PAID TRAINING 16,404 9.3% SOME OTHER BUSINESS REASON 19,276 10.9% I HAVE NOT TAKEN ANY OUT-OF-TOWN JOB-RELATED OVERNIGHT TRIPS 105,845 60.0%
NOT STATED 13,405 7.6%
Highlights:
• About a third (32%) of adult American travellers took at least one overnight business trip, travelling as often to attend conferences or seminars as to attend business meetings.
Business Meetings50%
Trade Shows18%
Business Conventions21%
Conferences Or Seminars
45%
Employer-Paid Training29%
Some Other Business Reason
34%
OVERNIGHT BUSINESS TRIPS DURING 2004-05Percentages based on those who took an overnight business trip

29
INCENTIVE TRAVEL
Highlights:
• Only 4% of American travellers received as a reward an overnight vacation planned and paid by their employers.
• In the bullet point above, if one excludes those who did not answer the question as well as the Americans who did not have an employer, then this percentage climbs to 5.6%. In other words, 5.6% of the American travellers who answered this question and had an employer, received as a reward an overnight vacation planned and paid by their employer.
“Has your employer provided you with a ful ly paid, overnight vacat ion as a reward?”
Number (000s)
% of total travellers (176.4 mil)
YES 6,808 3.9% NO 115,126 65.3% DON'T HAVE AN EMPLOYER 41,388 23.5% NOT STATED 7,189 4.1%

30
PLEASURE OR VACATION TRAVEL
Incidence of Overnight Pleasure or Vacation Travel
93% 94% 95% 96% 97% 98% 99%
TOTAL US
ARIZONA
CALIFORNIA
COLORADO
DC
FLORIDA
GEORGIA
ILLINOIS
INDIANA
MARYLAND
MASSACHUSETTS
MICHIGAN
MINNESOTA
NEW JERSEY
NEW YORK
OHIO
OREGON
PENNSYLVANIA
TEXAS
WASHINGTON
WISCONSIN
AMERICAN TRAVELLERS WHO TOOK ONE OR MORE OVERNIGHT PLEASURE/VACATION TRIPS IN 2004-05As a % of total travellers
PLACE OF RESIDENCE
Highlights:
• Of the 176 million Americans who took overnight trips, 97%, or 171 million travelled for pleasure or vacations.
• The incidence of pleasure travel among American travellers varied considerably by state with Massachusetts reporting one of the highest incidences and Texas one of the lowest.
31
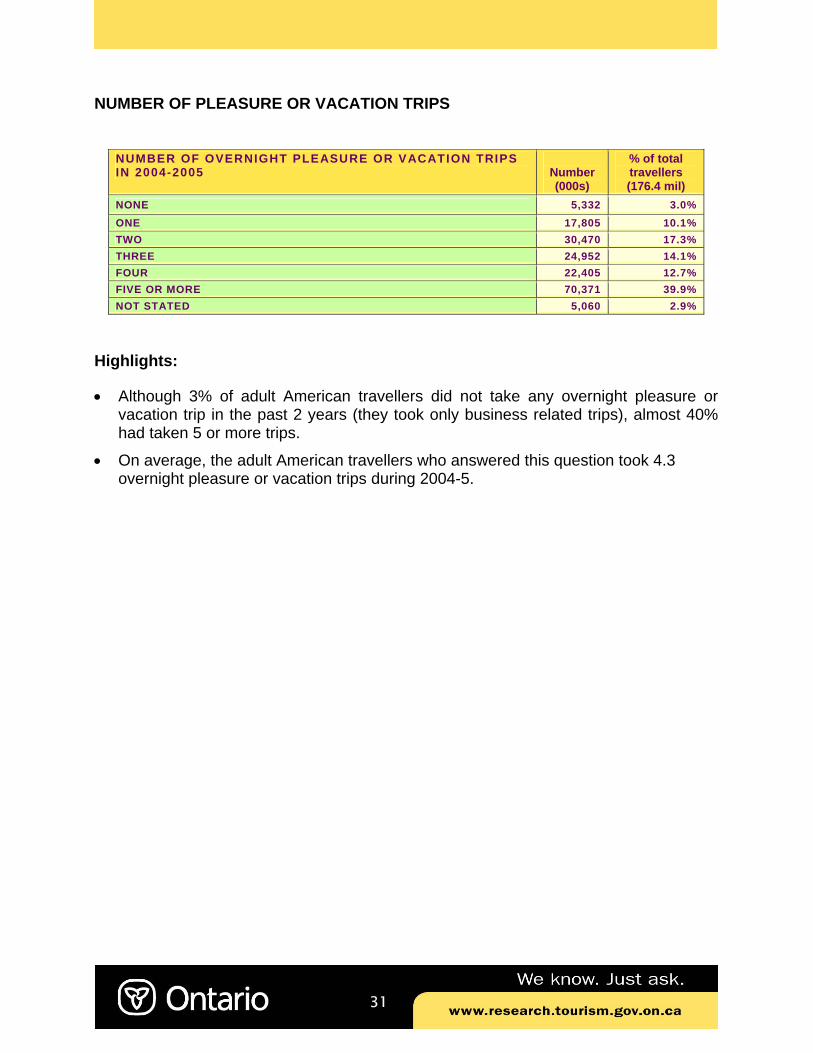
NUMBER OF PLEASURE OR VACATION TRIPS
NUMBER OF OVERNIGHT PLEASURE OR VACATION TRIPS IN 2004-2005
Number (000s)
% of total travellers (176.4 mil)
NONE 5,332 3.0% ONE 17,805 10.1% TWO 30,470 17.3% THREE 24,952 14.1% FOUR 22,405 12.7% FIVE OR MORE 70,371 39.9% NOT STATED 5,060 2.9%
Highlights:
• Although 3% of adult American travellers did not take any overnight pleasure or vacation trip in the past 2 years (they took only business related trips), almost 40% had taken 5 or more trips.
• On average, the adult American travellers who answered this question took 4.3 overnight pleasure or vacation trips during 2004-5.
32
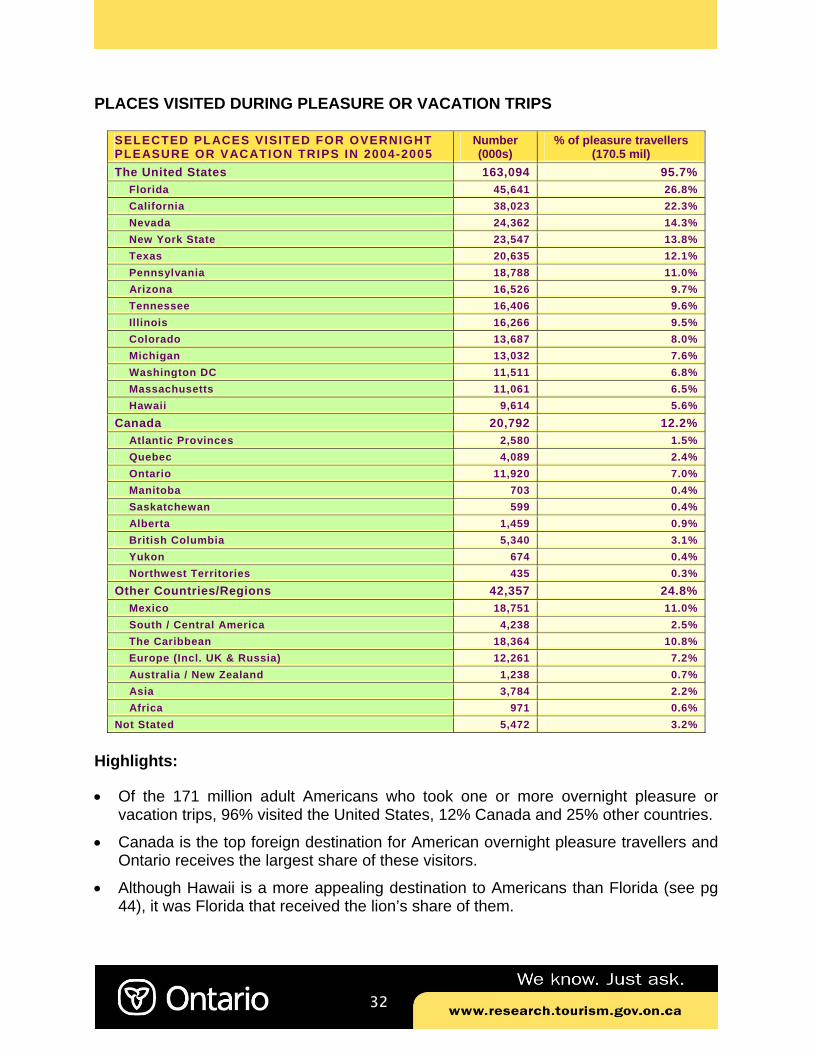
PLACES VISITED DURING PLEASURE OR VACATION TRIPS
SELECTED PLACES VISITED FOR OVERNIGHT PLEASURE OR VACATION TRIPS IN 2004-2005
Number (000s)
% of pleasure travellers (170.5 mil)
The United States 163,094 95.7% Florida 45,641 26.8% California 38,023 22.3% Nevada 24,362 14.3% New York State 23,547 13.8% Texas 20,635 12.1% Pennsylvania 18,788 11.0% Arizona 16,526 9.7% Tennessee 16,406 9.6% Illinois 16,266 9.5% Colorado 13,687 8.0% Michigan 13,032 7.6% Washington DC 11,511 6.8% Massachusetts 11,061 6.5% Hawaii 9,614 5.6% Canada 20,792 12.2% Atlantic Provinces 2,580 1.5% Quebec 4,089 2.4% Ontario 11,920 7.0% Manitoba 703 0.4% Saskatchewan 599 0.4% Alberta 1,459 0.9% British Columbia 5,340 3.1% Yukon 674 0.4% Northwest Territories 435 0.3% Other Countries/Regions 42,357 24.8% Mexico 18,751 11.0% South / Central America 4,238 2.5% The Caribbean 18,364 10.8% Europe (Incl. UK & Russia) 12,261 7.2% Australia / New Zealand 1,238 0.7% Asia 3,784 2.2% Africa 971 0.6% Not Stated 5,472 3.2%
Highlights:
• Of the 171 million adult Americans who took one or more overnight pleasure or vacation trips, 96% visited the United States, 12% Canada and 25% other countries.
• Canada is the top foreign destination for American overnight pleasure travellers and Ontario receives the largest share of these visitors.
• Although Hawaii is a more appealing destination to Americans than Florida (see pg 44), it was Florida that received the lion’s share of them.

33
NUMBER OF OVERNIGHT TRIPS TO SPECIFIC DESTINATIONS
NUMBER OF OVERNIGHT PLEASURE TRIPS TAKEN IN 2004-2005 TO SPECIFIC DESTINATIONS SELECTED STATES, PROVINCES AND COUNTRIES
Number of Overnight Pleasure Trips DESTINATION OF OVERNIGHT PLEASURE TRIP 1 2 3 4 5+ Not
Stated CALIFORNIA (000s) 16,346 8,310 4,335 2,331 6,173 528 As % of pleasure travellers to destination 43.0% 21.9% 11.4% 6.1% 16.2% 1.4%
FLORIDA (000s) 22,473 11,937 4,238 2,187 4,267 538 As % of pleasure travellers to destination 49.2% 26.2% 9.3% 4.8% 9.3% 1.2%
NEVADA (000s) 12,485 5,605 2,271 1,467 2,161 371 As % of pleasure travellers to destination 51.3% 23.0% 9.3% 6.0% 8.9% 1.5%
NEW YORK STATE (000s) 11,932 4,977 2,229 1,230 2,822 357 As % of pleasure travellers to destination 50.7% 21.1% 9.5% 5.2% 12.0% 1.5%
QUEBEC (000s) 3,060 576 166 68 99 119 As % of pleasure travellers to destination 74.8% 14.1% 4.1% 1.7% 2.4% 2.9%
ONTARIO (000s) 6,693 2,044 424 299 404 2,056 As % of pleasure travellers to destination 56.2% 17.2% 3.6% 2.5% 3.4% 17.2%
MANITOBA (000s) 458 139 51 11 16 29 As % of pleasure travellers to destination 65.1% 19.7% 7.2% 1.6% 2.2% 4.2%
SASKATCHEWAN (000s) 467 85 16 6 6 19 As % of pleasure travellers to destination 77.9% 14.3% 2.7% 1.1% 1.0% 3.1%
ALBERTA (000s) 1,164 161 43 29 19 44 As % of pleasure travellers to destination 79.7% 11.1% 2.9% 2.0% 1.3% 3.0%
BRITISH COLUMBIA (000s) 4,164 671 198 97 123 88 As % of pleasure travellers to destination 78.0% 12.6% 3.7% 1.8% 2.3% 1.6%
YUKON (000s) 541 82 13 8 7 22 As % of pleasure travellers to destination 80.3% 12.2% 1.9% 1.2% 1.0% 3.3%
NORTHWEST TER. (000s) 348 61 7 10 2 8 As % of pleasure travellers to destination 79.9% 14.1% 1.5% 2.3% 0.5% 1.7%
MEXICO (000s) 12,811 3,757 897 368 677 241 As % of pleasure travellers to destination 68.3% 20.0% 4.8% 2.0% 3.6% 1.3%
THE CARIBBEAN (000s) 12,789 3,497 931 386 499 262 As % of pleasure travellers to destination 69.6% 19.0% 5.1% 2.1% 2.7% 1.4%
EUROPE (000s) 8,416 2,302 632 294 471 146 As % of pleasure travellers to destination 68.6% 18.8% 5.2% 2.4% 3.8% 1.2%
Highlights:
• As expected, the number of trips to US destinations that Americans take for pleasure or vacation is higher than the number of trips they take to foreign destinations.
NUMBER OF OVERNIGHT TRIPS TO ONTARIO
34
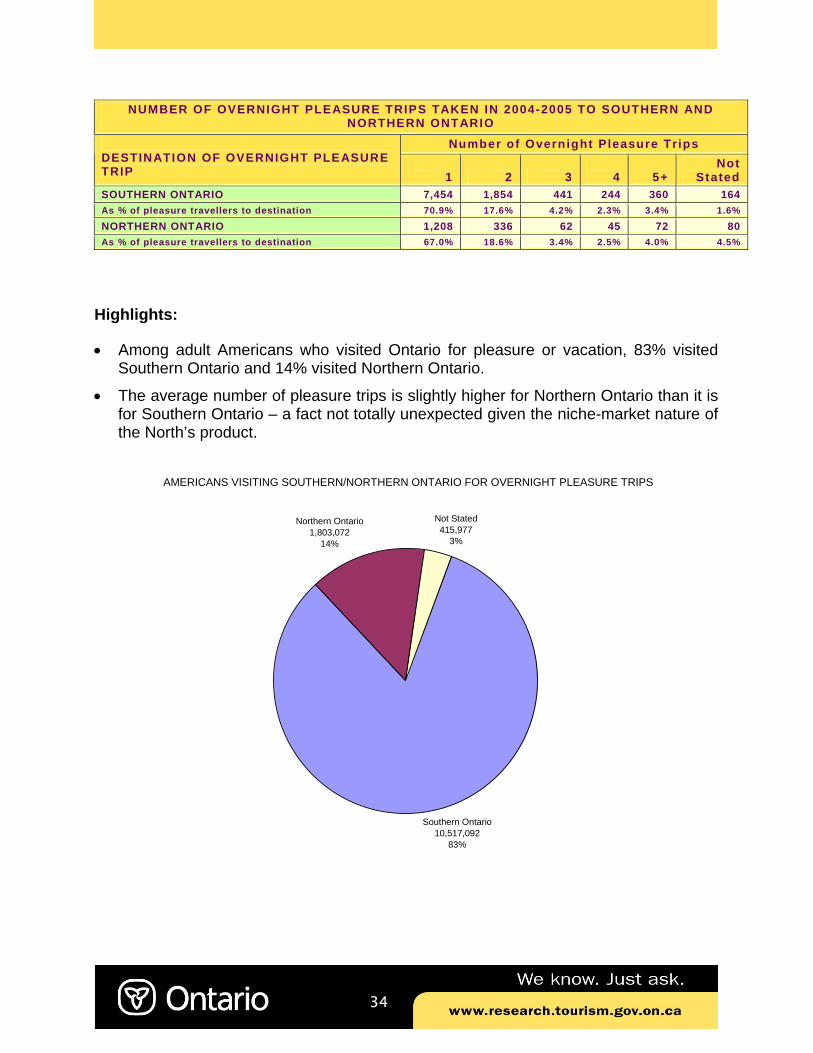
Highlights:
• Among adult Americans who visited Ontario for pleasure or vacation, 83% visited Southern Ontario and 14% visited Northern Ontario.
• The average number of pleasure trips is slightly higher for Northern Ontario than it is for Southern Ontario – a fact not totally unexpected given the niche-market nature of the North’s product.
Southern Ontario10,517,092
83%
Northern Ontario1,803,072
14%
Not Stated415,977
3%
AMERICANS VISITING SOUTHERN/NORTHERN ONTARIO FOR OVERNIGHT PLEASURE TRIPS
NUMBER OF OVERNIGHT PLEASURE TRIPS TAKEN IN 2004-2005 TO SOUTHERN AND NORTHERN ONTARIO
Number of Overnight Pleasure Trips DESTINATION OF OVERNIGHT PLEASURE TRIP 1 2 3 4 5+
Not Stated
SOUTHERN ONTARIO 7,454 1,854 441 244 360 164 As % of pleasure travellers to destination 70.9% 17.6% 4.2% 2.3% 3.4% 1.6%
NORTHERN ONTARIO 1,208 336 62 45 72 80 As % of pleasure travellers to destination 67.0% 18.6% 3.4% 2.5% 4.0% 4.5%

35
TRIP PLANNING
Involvement with Planning
INVOLVEMENT WITH THE PLANNING OF OVERNIGHT PLEASURE TRIPS IN 2004-2005
Number (000s)
% of pleasure travellers (170.5 mil)
Frequency of Involvement ALL OF THE TRIPS 107,595 63.1% MOST OF THE TRIPS 24,984 14.7% SOME OF THE TRIPS 16,151 9.5% NONE OF THE TRIPS 14,287 8.4% NOT STATED 7,494 4.4% TRAVELLERS WHO ARE INVOLVED (Some trips or more) 148,730 87.2%
Main Person Responsible for the Planning Number (000s)
% of travellers who are involved in
planning (148.7 mil)
YOURSELF 63,871 42.9% YOUR SPOUSE OR PARTNER 27,815 18.7% SOMEONE ELSE IN HOUSEHOLD 4,042 2.7% SHARED RESPONSIBILITY INVOLVING YOURSELF AND ANOTHER HOUSEHOLD MEMBER 42,228 28.4%
SHARED RESPONSIBILITY INVOLVING OTHER MEMBERS OF YOUR HOUSEHOLD, BUT NOT YOURSELF 877 0.6%
SOMEONE ELSE IN HOUSEHOLD 7,084 4.8% NOT STATED 2,813 1.9%
Highlights:
• The majority (63%) of adult Americans got personally involved in planning all overnight, out-of-town pleasure or vacation trips. About one-quarter got involved with some of these trips and only 9% did not get involved at all.
• Of the Americans who were involved with planning at least some of their overnight pleasure trips, 43% were the main person responsible for planning the trips, while their spouse/partner was the main planner in 19% of the cases.
36
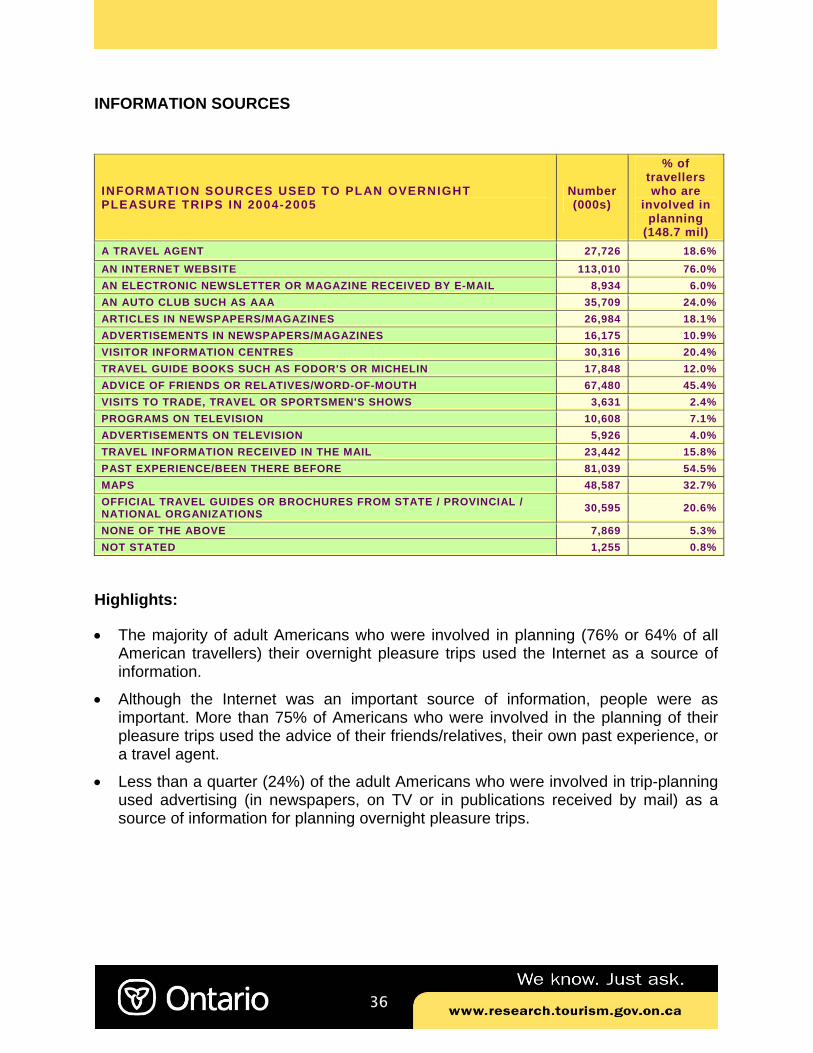
INFORMATION SOURCES
Highlights:
• The majority of adult Americans who were involved in planning (76% or 64% of all American travellers) their overnight pleasure trips used the Internet as a source of information.
• Although the Internet was an important source of information, people were as important. More than 75% of Americans who were involved in the planning of their pleasure trips used the advice of their friends/relatives, their own past experience, or a travel agent.
• Less than a quarter (24%) of the adult Americans who were involved in trip-planning used advertising (in newspapers, on TV or in publications received by mail) as a source of information for planning overnight pleasure trips.
INFORMATION SOURCES USED TO PLAN OVERNIGHT PLEASURE TRIPS IN 2004-2005
Number (000s)
% of travellers who are
involved in planning
(148.7 mil) A TRAVEL AGENT 27,726 18.6% AN INTERNET WEBSITE 113,010 76.0% AN ELECTRONIC NEWSLETTER OR MAGAZINE RECEIVED BY E-MAIL 8,934 6.0% AN AUTO CLUB SUCH AS AAA 35,709 24.0% ARTICLES IN NEWSPAPERS/MAGAZINES 26,984 18.1% ADVERTISEMENTS IN NEWSPAPERS/MAGAZINES 16,175 10.9% VISITOR INFORMATION CENTRES 30,316 20.4% TRAVEL GUIDE BOOKS SUCH AS FODOR'S OR MICHELIN 17,848 12.0% ADVICE OF FRIENDS OR RELATIVES/WORD-OF-MOUTH 67,480 45.4% VISITS TO TRADE, TRAVEL OR SPORTSMEN'S SHOWS 3,631 2.4% PROGRAMS ON TELEVISION 10,608 7.1% ADVERTISEMENTS ON TELEVISION 5,926 4.0% TRAVEL INFORMATION RECEIVED IN THE MAIL 23,442 15.8% PAST EXPERIENCE/BEEN THERE BEFORE 81,039 54.5% MAPS 48,587 32.7% OFFICIAL TRAVEL GUIDES OR BROCHURES FROM STATE / PROVINCIAL / NATIONAL ORGANIZATIONS 30,595 20.6%
NONE OF THE ABOVE 7,869 5.3% NOT STATED 1,255 0.8%

37
TYPES OF WEBSITES USED
55.6%
53.3%
45.6%
35.1%
33.4%
12.4%
25.1%
4.1%
1.3%
0% 8% 16% 24% 32% 40% 48% 56%
A TRAVEL BOOKING WEBSITE (e.g.,EXPEDIA, TRAVELOCITY)
THE WEBSITE OF A HOTEL ORRESORT
AN AIRLINE'S WEBSITE
THE WEBSITE OF ACOUNTRY/STATE/PROVINCE/CITY
TOURISM AUTHORITY
THE WEBSITE OF AN ATTRACTION(e.g., MUSEUM, THEATRE)
A CRUISE LINE WEBSITE
A MOTORCOACH WEBSITE
SOME OTHER WEBSITE
NOT STATED
TYPES OF WEB SITES USED IN 2004-05 TO PLAN OVERNIGHT PLEASURE TRIPSAmericans Who Used the Internet as a Source of Planning Information =113.0 million
Highlights:
• In planning overnight pleasure trips, Americans are more likely to use hotel or travel websites such as Expedia and Travelocity than government-related web sites.
• This may suggest a different approach to using web sites to attract American travellers. Instead of using a generic destination web site that acts as gateway to all locally provided travel services, the web sites of specific travel services could act as gateways to other travel services in the destination.
38
BOOKING ON THE INTERNET
AIR TICKETS - 70.6%
NOT STATED 1.1%
OTHER 2.9%
A PACKAGE CONTAINING AT
LEAST TWO OF THE ABOVE ITEMS - 17.8%CAR RENTAL - 38.0%
ACCOMMODATION 71.9%
TICKETS FOR RAIL/BUS/BOAT FARES
11.9%
TICKETS FOR SPECIFIC ACTIVITIES
OR ATTRACTIONS (e.g., THEATERS,
AMUSEMENT PARKS) 26.4%
TYPES OF TRAVEL SERVICES PURCHASED ON THE INTERNETPercentages based on those who had purchased travel services on the Internet =83.4 million
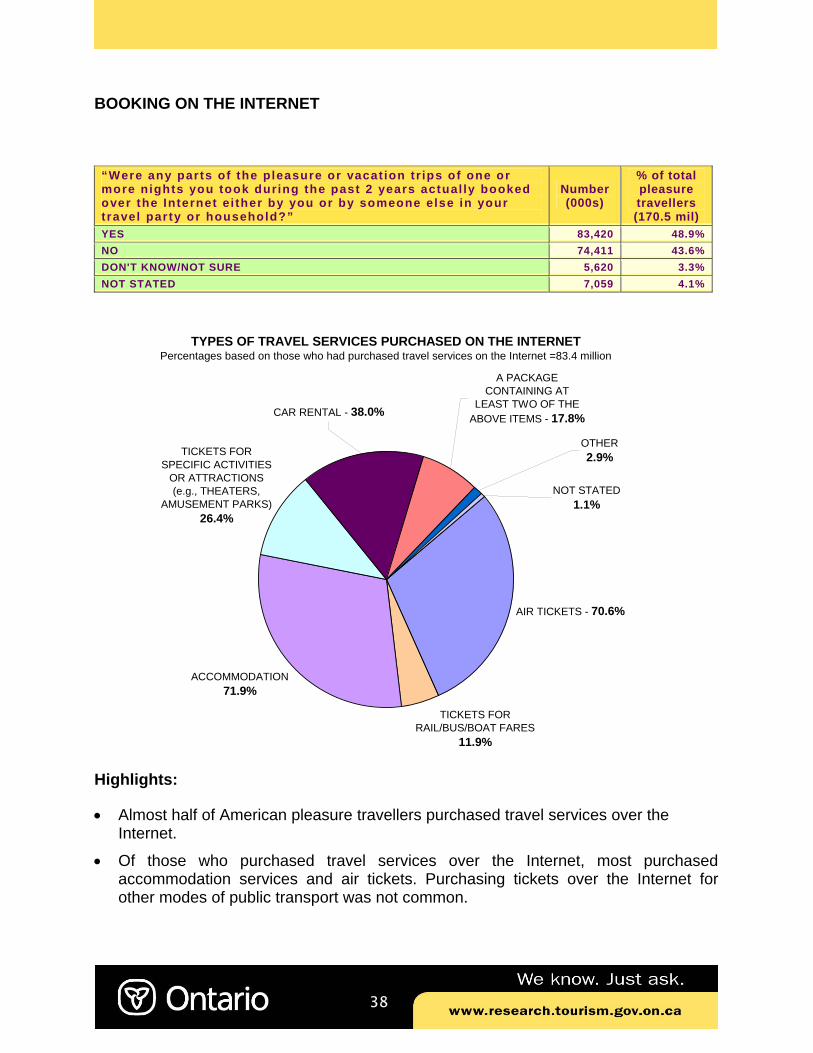
Highlights:
• Almost half of American pleasure travellers purchased travel services over the Internet.
• Of those who purchased travel services over the Internet, most purchased accommodation services and air tickets. Purchasing tickets over the Internet for other modes of public transport was not common.
“Were any parts of the pleasure or vacat ion tr ips of one or more nights you took during the past 2 years actual ly booked over the Internet e i ther by you or by someone else in your t ravel party or household?”
Number (000s)
% of total pleasure travellers (170.5 mil)
YES 83,420 48.9% NO 74,411 43.6% DON'T KNOW/NOT SURE 5,620 3.3% NOT STATED 7,059 4.1%
39
PURCHASES OF TRAVEL PACKAGES
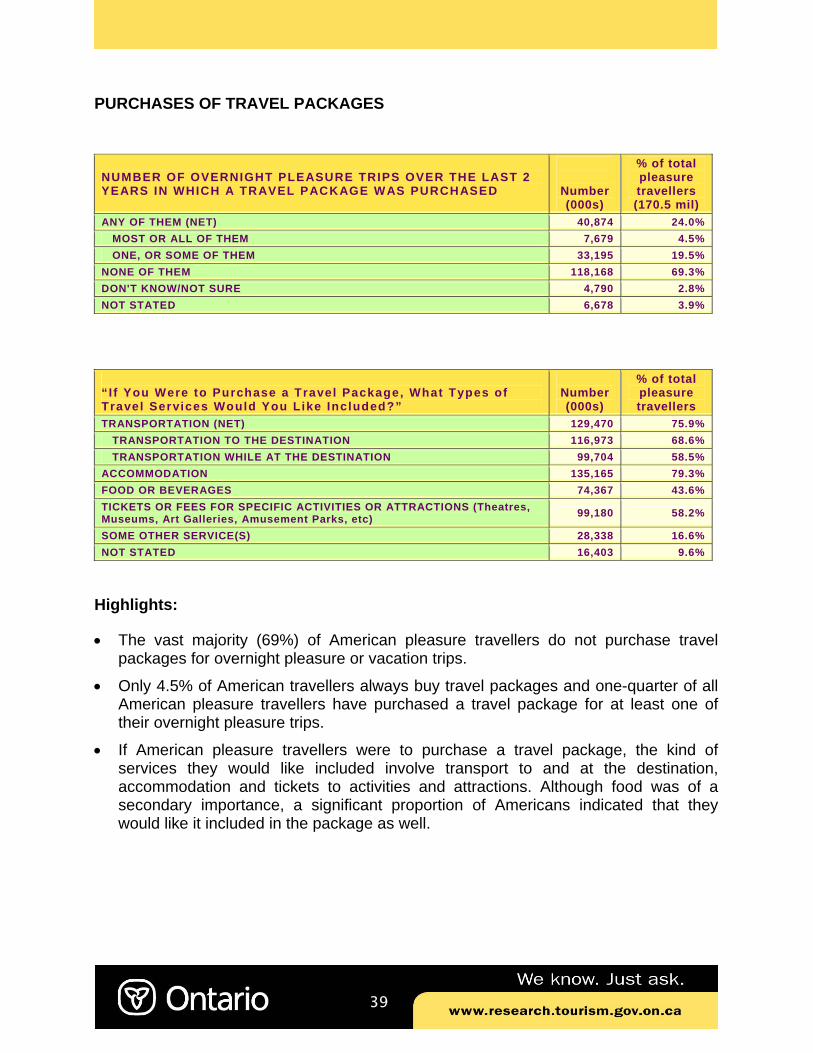
Highlights:
• The vast majority (69%) of American pleasure travellers do not purchase travel packages for overnight pleasure or vacation trips.
• Only 4.5% of American travellers always buy travel packages and one-quarter of all American pleasure travellers have purchased a travel package for at least one of their overnight pleasure trips.
• If American pleasure travellers were to purchase a travel package, the kind of services they would like included involve transport to and at the destination, accommodation and tickets to activities and attractions. Although food was of a secondary importance, a significant proportion of Americans indicated that they would like it included in the package as well.
NUMBER OF OVERNIGHT PLEASURE TRIPS OVER THE LAST 2 YEARS IN WHICH A TRAVEL PACKAGE WAS PURCHASED
Number (000s)
% of total pleasure travellers (170.5 mil)
ANY OF THEM (NET) 40,874 24.0% MOST OR ALL OF THEM 7,679 4.5% ONE, OR SOME OF THEM 33,195 19.5% NONE OF THEM 118,168 69.3% DON'T KNOW/NOT SURE 4,790 2.8% NOT STATED 6,678 3.9%
“ I f You Were to Purchase a Travel Package, What Types of Travel Services Would You Like Included?”
Number (000s)
% of total pleasure travellers
TRANSPORTATION (NET) 129,470 75.9% TRANSPORTATION TO THE DESTINATION 116,973 68.6% TRANSPORTATION WHILE AT THE DESTINATION 99,704 58.5% ACCOMMODATION 135,165 79.3% FOOD OR BEVERAGES 74,367 43.6% TICKETS OR FEES FOR SPECIFIC ACTIVITIES OR ATTRACTIONS (Theatres, Museums, Art Galleries, Amusement Parks, etc) 99,180 58.2%
SOME OTHER SERVICE(S) 28,338 16.6% NOT STATED 16,403 9.6%
40
DECISION-MAKING PROCESS: DESTINATION OR EXPERIENCE?
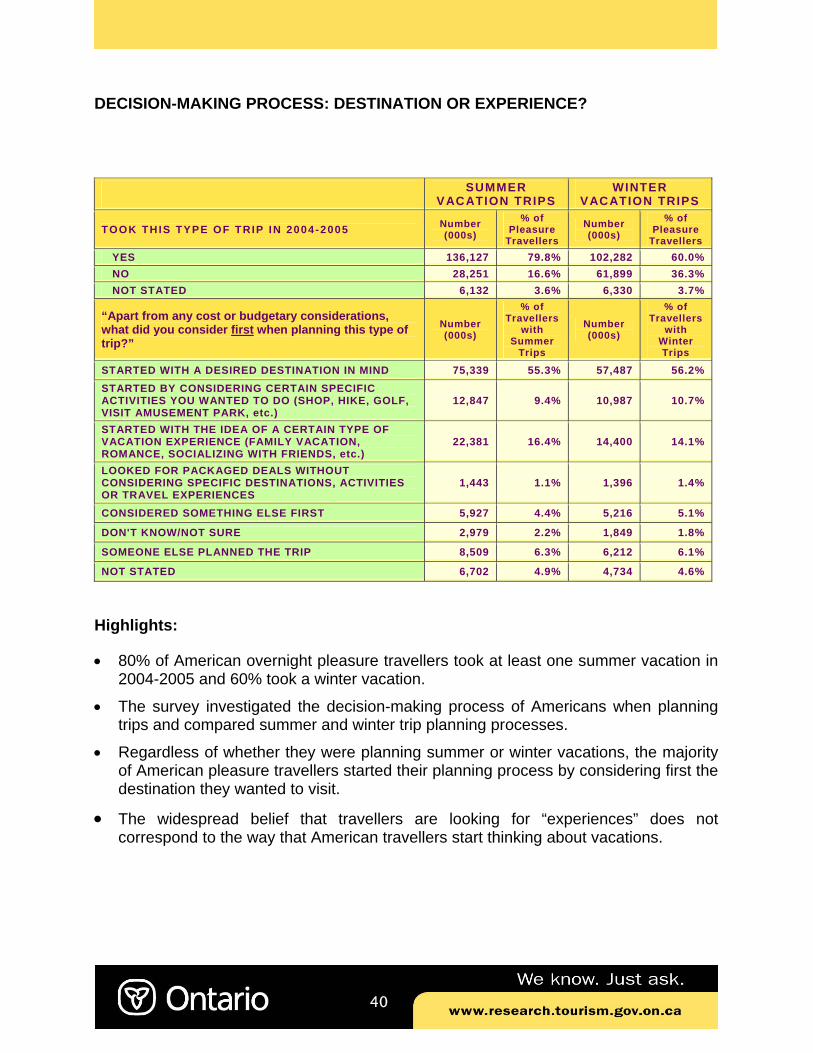
Highlights:
• 80% of American overnight pleasure travellers took at least one summer vacation in 2004-2005 and 60% took a winter vacation.
• The survey investigated the decision-making process of Americans when planning trips and compared summer and winter trip planning processes.
• Regardless of whether they were planning summer or winter vacations, the majority of American pleasure travellers started their planning process by considering first the destination they wanted to visit.
• The widespread belief that travellers are looking for “experiences” does not correspond to the way that American travellers start thinking about vacations.
SUMMER VACATION TRIPS
WINTER VACATION TRIPS
TOOK THIS TYPE OF TRIP IN 2004-2005 Number (000s)
% of Pleasure
Travellers Number (000s)
% of Pleasure
Travellers YES 136,127 79.8% 102,282 60.0% NO 28,251 16.6% 61,899 36.3% NOT STATED 6,132 3.6% 6,330 3.7%
“Apart from any cost or budgetary considerations, what did you consider first when planning this type of trip?”
Number (000s)
% of Travellers
with Summer
Trips
Number (000s)
% of Travellers
with Winter Trips
STARTED WITH A DESIRED DESTINATION IN MIND 75,339 55.3% 57,487 56.2% STARTED BY CONSIDERING CERTAIN SPECIFIC ACTIVITIES YOU WANTED TO DO (SHOP, HIKE, GOLF, VISIT AMUSEMENT PARK, etc.)
12,847 9.4% 10,987 10.7%
STARTED WITH THE IDEA OF A CERTAIN TYPE OF VACATION EXPERIENCE (FAMILY VACATION, ROMANCE, SOCIALIZING WITH FRIENDS, etc.)
22,381 16.4% 14,400 14.1%
LOOKED FOR PACKAGED DEALS WITHOUT CONSIDERING SPECIFIC DESTINATIONS, ACTIVITIES OR TRAVEL EXPERIENCES
1,443 1.1% 1,396 1.4%
CONSIDERED SOMETHING ELSE FIRST 5,927 4.4% 5,216 5.1%
DON'T KNOW/NOT SURE 2,979 2.2% 1,849 1.8%
SOMEONE ELSE PLANNED THE TRIP 8,509 6.3% 6,212 6.1%
NOT STATED 6,702 4.9% 4,734 4.6%
41
BENEFITS SOUGHT FROM PLEASURE OR VACATION TRIPS
Percentages based on total travellers = 176.4 million
0% 10% 20% 30% 40% 50% 60% 70% 80%
TO RELAX AND RELIEVE STRESS
TO GET A BREAK FROM YOUR DAY-TO-DAY ENVIRONMENT
TO CREATE LASTING MEMORIES
TO ENRICH YOUR RELATIONSHIP WITH YOUR SPOUSE/CHILDREN
TO HAVE A LIFE WITH NO FIXED SCHEDULE (TO DO WHAT YOUWANT, WHEN YOU WANT)
TO KEEP FAMILY TIES ALIVE
TO SEE OR DO SOMETHING NEW AND DIFFERENT
TO ENRICH YOUR PERSPECTIVE ON LIFE
TO GAIN KNOWLEDGE OF HISTORY, OTHER CULTURES OR OTHERPLACES
TO STIMULATE YOUR MIND/BE INTELLECTUALLY CHALLENGED
TO RENEW PERSONAL CONNECTIONS WITH PEOPLE (OTHER THANFAMILY)
TO BE PAMPERED
TO HAVE STORIES TO SHARE BACK AT HOME OR SOMETHINGINTERESTING TO TALK ABOUT
TO SEEK SOLITUDE AND ISOLATION
TO BE CHALLENGED PHYSICALLY/TO FEEL PHYSICALLY ENERGIZED
NOT STATED OF NO IMPORTANCE
SOMEWHAT IMPORTANT
HIGHLY IMPORTANT
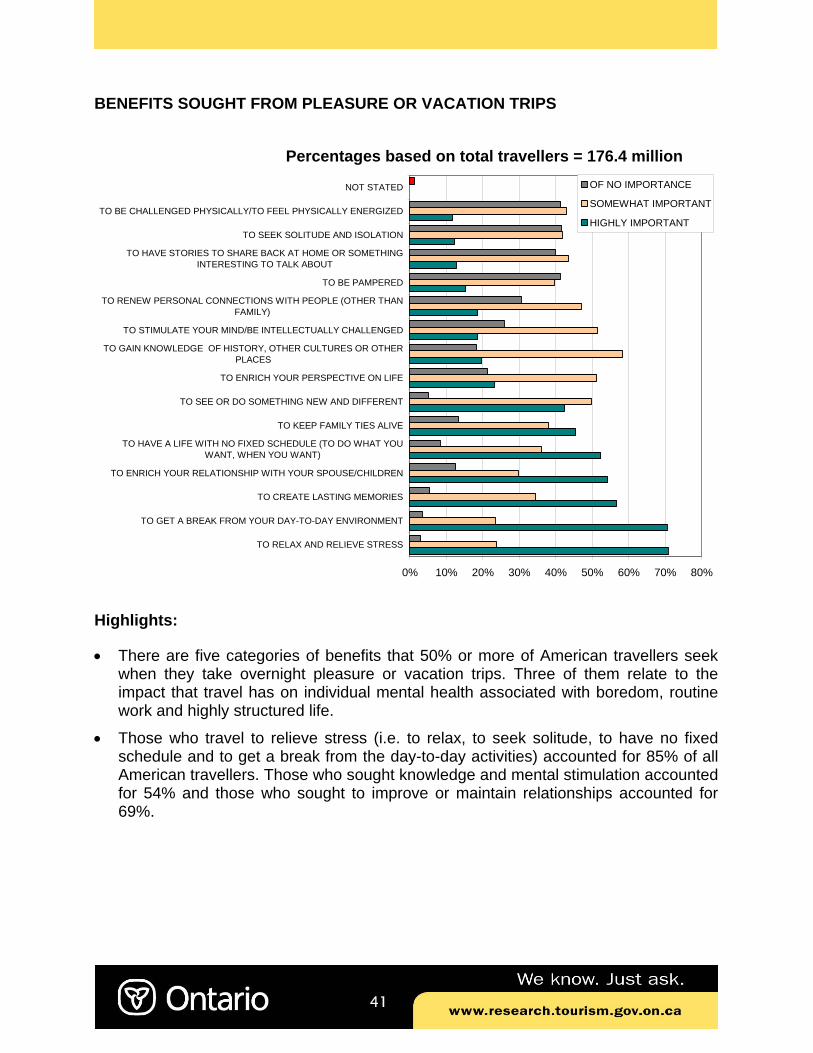
Highlights:
• There are five categories of benefits that 50% or more of American travellers seek when they take overnight pleasure or vacation trips. Three of them relate to the impact that travel has on individual mental health associated with boredom, routine work and highly structured life.
• Those who travel to relieve stress (i.e. to relax, to seek solitude, to have no fixed schedule and to get a break from the day-to-day activities) accounted for 85% of all American travellers. Those who sought knowledge and mental stimulation accounted for 54% and those who sought to improve or maintain relationships accounted for 69%.

42
THE IMPORTANCE OF THE CHOICE OF DESTINATION
EXTREMELY IMPORTANT 50,330,772
29%
VERY IMPORTANT 66,992,171
38%
MODERATELY IMPORTANT 45,130,242
26%
SLIGHTLY IMPORTANT
7,770,4134%
NOT AT ALL IMPORTANT
3,852,3102%
NOT STATED 2,319,382
1%
"For some people, the decision about which destination to choose for a pleasure trip is extremely important - as important as deciding how much to spend on a house or car. For others, the decision is not important at all. How
important is the choise of destination to you?"Percentages based on total travellers
Highlights:
• Two-thirds (67%) of American travellers indicated that the choice of the destination for a pleasure or vacation trip is very or extremely important to them (at least as important as buying a house or car).
43
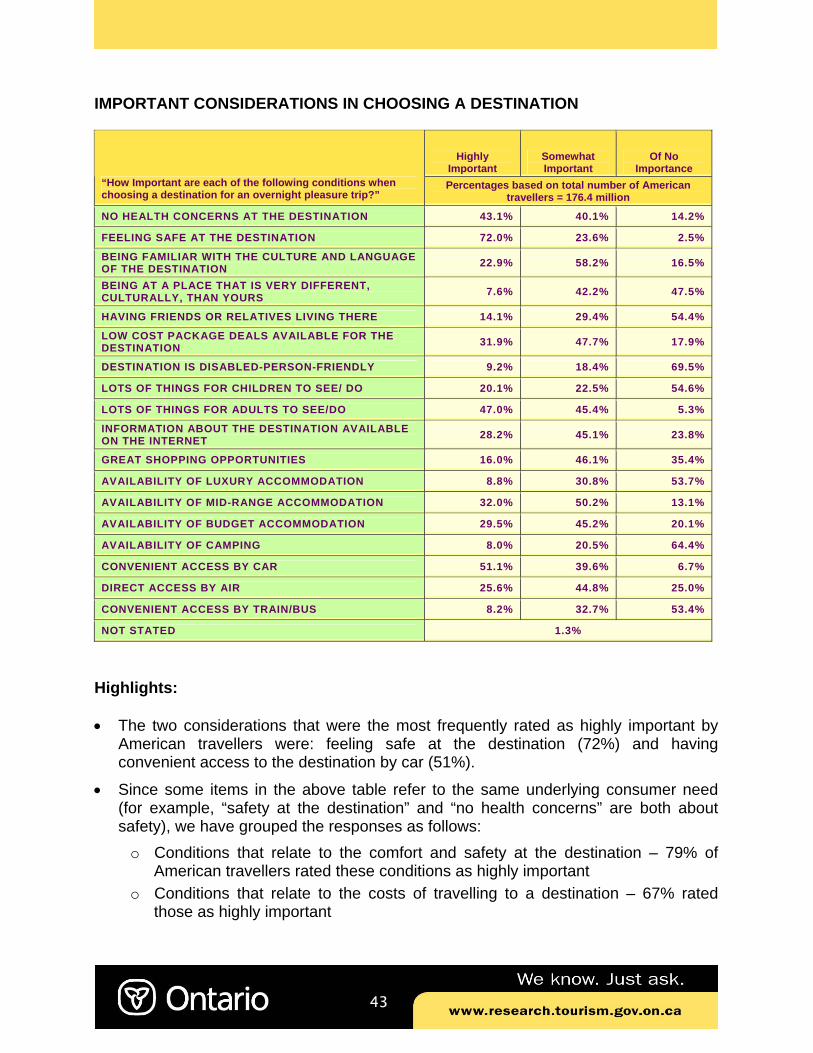
IMPORTANT CONSIDERATIONS IN CHOOSING A DESTINATION
Highlights: • The two considerations that were the most frequently rated as highly important by
American travellers were: feeling safe at the destination (72%) and having convenient access to the destination by car (51%).
• Since some items in the above table refer to the same underlying consumer need (for example, “safety at the destination” and “no health concerns” are both about safety), we have grouped the responses as follows: o Conditions that relate to the comfort and safety at the destination – 79% of
American travellers rated these conditions as highly important o Conditions that relate to the costs of travelling to a destination – 67% rated
those as highly important
Highly Important
Somewhat Important
Of No Importance
“How Important are each of the following conditions when choosing a destination for an overnight pleasure trip?”
Percentages based on total number of American travellers = 176.4 million
NO HEALTH CONCERNS AT THE DESTINATION 43.1% 40.1% 14.2%
FEELING SAFE AT THE DESTINATION 72.0% 23.6% 2.5%
BEING FAMILIAR WITH THE CULTURE AND LANGUAGE OF THE DESTINATION 22.9% 58.2% 16.5%
BEING AT A PLACE THAT IS VERY DIFFERENT, CULTURALLY, THAN YOURS 7.6% 42.2% 47.5%
HAVING FRIENDS OR RELATIVES LIVING THERE 14.1% 29.4% 54.4%
LOW COST PACKAGE DEALS AVAILABLE FOR THE DESTINATION 31.9% 47.7% 17.9%
DESTINATION IS DISABLED-PERSON-FRIENDLY 9.2% 18.4% 69.5%
LOTS OF THINGS FOR CHILDREN TO SEE/ DO 20.1% 22.5% 54.6%
LOTS OF THINGS FOR ADULTS TO SEE/DO 47.0% 45.4% 5.3%
INFORMATION ABOUT THE DESTINATION AVAILABLE ON THE INTERNET 28.2% 45.1% 23.8%
GREAT SHOPPING OPPORTUNITIES 16.0% 46.1% 35.4%
AVAILABILITY OF LUXURY ACCOMMODATION 8.8% 30.8% 53.7%
AVAILABILITY OF MID-RANGE ACCOMMODATION 32.0% 50.2% 13.1%
AVAILABILITY OF BUDGET ACCOMMODATION 29.5% 45.2% 20.1%
AVAILABILITY OF CAMPING 8.0% 20.5% 64.4%
CONVENIENT ACCESS BY CAR 51.1% 39.6% 6.7%
DIRECT ACCESS BY AIR 25.6% 44.8% 25.0%
CONVENIENT ACCESS BY TRAIN/BUS 8.2% 32.7% 53.4%
NOT STATED 1.3%

44
IMPRESSIONS AND RATINGS OF DESTINATIONS
Appeal of a Destination
Highlights:
• About one-third of American travellers had no impressions of any Canadian province or territory and were unable to rate them. Among Canadian jurisdictions, Ontario and Quebec had the lowest proportion of Americans who stated that could not rate them.
• For eight out of 12 Canadian jurisdictions the proportion of American travellers who rated them as very unappealing is greater than the proportion who rated them as very appealing travel destinations. The four jurisdictions that received higher ratings as very appealing were: PEI, Quebec, Ontario and British Columbia. However, even for these destinations only 17%-26% of American travellers gave them “very appealing” ratings.
• Hawaii is by far the most appealing of the destinations listed above for the majority of American travellers.
Very Appea l ing
(scores o f 8 , 9 or 10 )
Very Unappea l ing
(scores o f 1 , 2 or 3 )
No impress ion /Can’ t Rate
Not Sta ted
DESTINATION RATINGS ON A 10-POINT SCALE 1= Very Unappealing 10= Very Appealing Percentages based on total number of American travellers =
176.4 million NEWFOUNDLAND & LABRADOR 10.4% 20.3% 38.1% 3.4%
NOVA SCOTIA 17.1% 17.1% 31.6% 3.3%
NEW BRUNSWICK 10.3% 19.0% 38.6% 3.7%
PRINCE EDWARD ISLAND 17.4% 15.7% 33.5% 3.6%
QUEBEC 21.9% 16.0% 23.9% 3.5%
ONTARIO 24.2% 12.8% 21.5% 3.3%
MANITOBA 8.5% 18.9% 38.8% 3.7%
SASKATCHEWAN 9.4% 19.7% 37.6% 3.7%
ALBERTA 14.0% 17.5% 34.0% 3.6%
BRITISH COLUMBIA 26.4% 14.1% 27.0% 3.6%
YUKON 15.4% 21.9% 32.9% 3.6%
NORTHWEST TERRITORIES 15.4% 20.9% 31.6% 4.1%
NEW YORK STATE 37.2% 13.7% 6.9% 3.2%
COLORADO 42.7% 7.7% 7.7% 3.4%
FLORIDA 52.0% 10.8% 2.9% 2.8%
CALIFORNIA 51.8% 10.5% 4.1% 3.1%
HAWAII 68.2% 5.6% 4.9% 3.0%
ARIZONA 37.0% 11.4% 6.4% 3.2% DID NOT ANSWER ANY PARTS OF THE QUESTION 1.7%
45
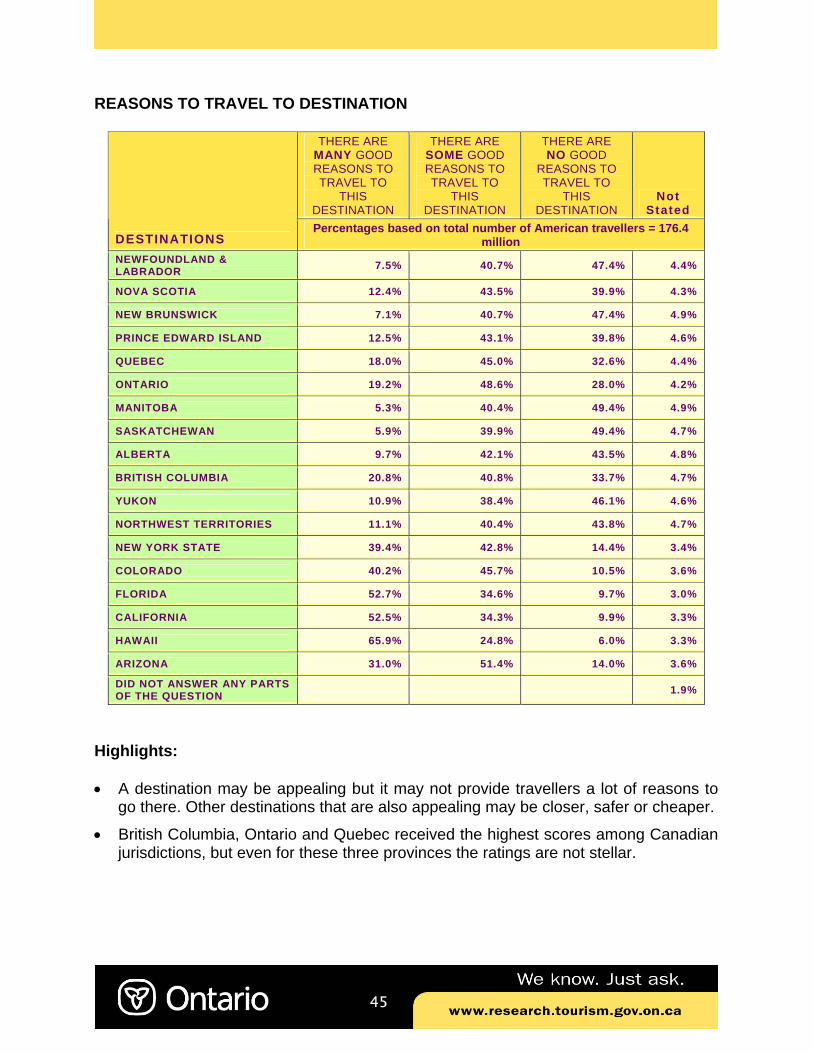
REASONS TO TRAVEL TO DESTINATION
Highlights: • A destination may be appealing but it may not provide travellers a lot of reasons to
go there. Other destinations that are also appealing may be closer, safer or cheaper.
• British Columbia, Ontario and Quebec received the highest scores among Canadian jurisdictions, but even for these three provinces the ratings are not stellar.
THERE ARE MANY GOOD REASONS TO TRAVEL TO
THIS DESTINATION
THERE ARE SOME GOOD REASONS TO TRAVEL TO
THIS DESTINATION
THERE ARE NO GOOD
REASONS TO TRAVEL TO
THIS DESTINATION
Not Stated
DESTINATIONS Percentages based on total number of American travellers = 176.4
million NEWFOUNDLAND & LABRADOR 7.5% 40.7% 47.4% 4.4%
NOVA SCOTIA 12.4% 43.5% 39.9% 4.3%
NEW BRUNSWICK 7.1% 40.7% 47.4% 4.9%
PRINCE EDWARD ISLAND 12.5% 43.1% 39.8% 4.6%
QUEBEC 18.0% 45.0% 32.6% 4.4%
ONTARIO 19.2% 48.6% 28.0% 4.2%
MANITOBA 5.3% 40.4% 49.4% 4.9%
SASKATCHEWAN 5.9% 39.9% 49.4% 4.7%
ALBERTA 9.7% 42.1% 43.5% 4.8%
BRITISH COLUMBIA 20.8% 40.8% 33.7% 4.7%
YUKON 10.9% 38.4% 46.1% 4.6%
NORTHWEST TERRITORIES 11.1% 40.4% 43.8% 4.7%
NEW YORK STATE 39.4% 42.8% 14.4% 3.4%
COLORADO 40.2% 45.7% 10.5% 3.6%
FLORIDA 52.7% 34.6% 9.7% 3.0%
CALIFORNIA 52.5% 34.3% 9.9% 3.3%
HAWAII 65.9% 24.8% 6.0% 3.3%
ARIZONA 31.0% 51.4% 14.0% 3.6%
DID NOT ANSWER ANY PARTS OF THE QUESTION 1.9%

46
ACTIVITY PARTICIPATION AT HOME
Outdoor Activities
OUTDOOR ACTIVITIES PARTICIPATED IN FREQUENTLY OR OCCASIONALLY DURING A TYPICAL YEAR
% of total adult populat ion
(222.8 mil l ion) % of travel lers (176.4 mil l ion)
Canoeing Or Kayaking 6.6% 7.7%
Camping 23.7% 26.3%
Cycling 20.2% 22.5%
Cross-Country Skiing 2.1% 2.5%
Downhill Skiing 4.6% 5.6%
Day Outing To A Park 58.3% 62.5%
Fishing 31.0% 32.5%
Golfing 15.4% 18.0%
Hiking 28.0% 32.0%
Horseback Riding 7.7% 8.5%
Hunting 11.1% 11.7%
Ice-Skating 4.7% 5.4%
Jogging 17.4% 19.3%
Picnicking 44.1% 47.3%
Rollerblading 6.5% 7.2%
Sailing Or Other Boating 17.1% 19.6%
Skateboarding 2.1% 2.2%
Snowboarding 2.3% 2.6%
Snowmobiling 2.9% 3.3%
Swimming 50.6% 55.8%
Playing Racquet Sports 11.6% 13.0%
Playing Team Sports 14.2% 15.7%
Exercise Home/Fitness Club 51.5% 55.5%
Gardening 50.3% 52.8%
Riding All-Terrain Vehicle 10.6% 11.4%
Highlights:
• When not travelling, American adults and travellers say that their preferred outdoor activities at home are outings to parks, swimming, exercising and gardening.
• In terms of all outdoor activities, travellers are more active than non-travellers.
47
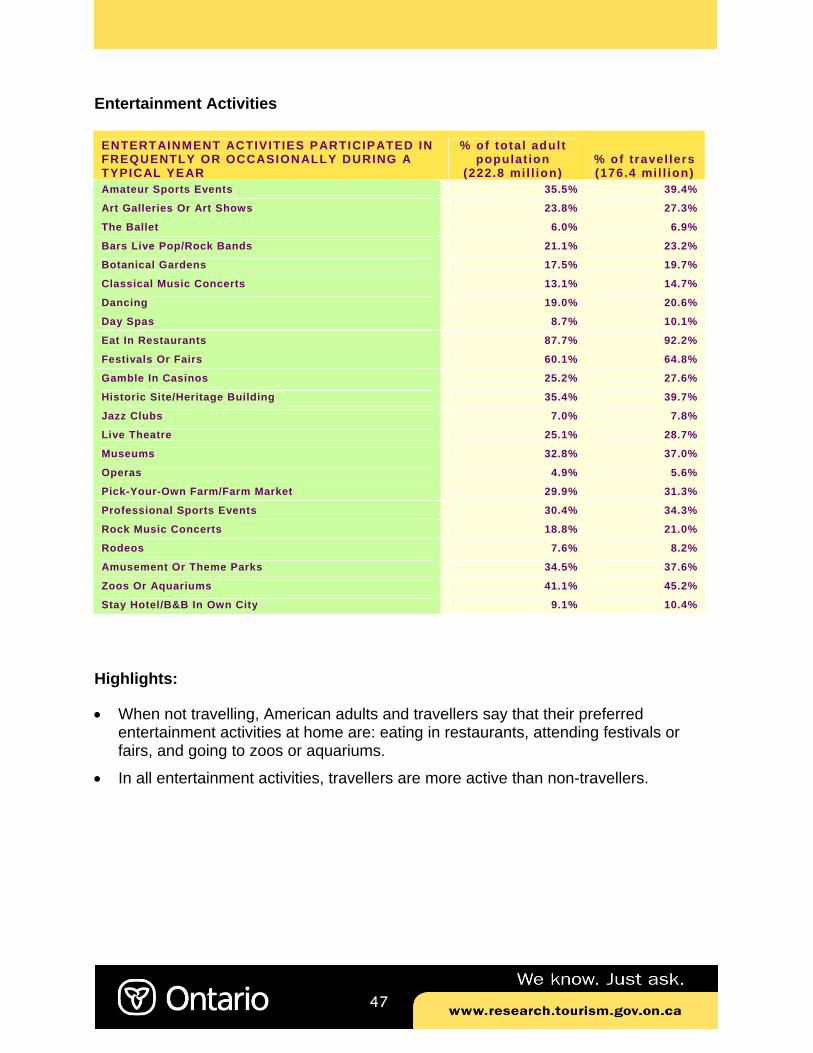
Entertainment Activities
ENTERTAINMENT ACTIVITIES PARTICIPATED IN FREQUENTLY OR OCCASIONALLY DURING A TYPICAL YEAR
% of total adult populat ion
(222.8 mil l ion) % of travel lers (176.4 mil l ion)
Amateur Sports Events 35.5% 39.4%
Art Galleries Or Art Shows 23.8% 27.3%
The Ballet 6.0% 6.9%
Bars Live Pop/Rock Bands 21.1% 23.2%
Botanical Gardens 17.5% 19.7%
Classical Music Concerts 13.1% 14.7%
Dancing 19.0% 20.6%
Day Spas 8.7% 10.1%
Eat In Restaurants 87.7% 92.2%
Festivals Or Fairs 60.1% 64.8%
Gamble In Casinos 25.2% 27.6%
Historic Site/Heritage Building 35.4% 39.7%
Jazz Clubs 7.0% 7.8%
Live Theatre 25.1% 28.7%
Museums 32.8% 37.0%
Operas 4.9% 5.6%
Pick-Your-Own Farm/Farm Market 29.9% 31.3%
Professional Sports Events 30.4% 34.3%
Rock Music Concerts 18.8% 21.0%
Rodeos 7.6% 8.2%
Amusement Or Theme Parks 34.5% 37.6%
Zoos Or Aquariums 41.1% 45.2%
Stay Hotel/B&B In Own City 9.1% 10.4%
Highlights:
• When not travelling, American adults and travellers say that their preferred entertainment activities at home are: eating in restaurants, attending festivals or fairs, and going to zoos or aquariums.
• In all entertainment activities, travellers are more active than non-travellers.

48
COTTAGE OR VACATION HOME OWNERSHIP AND LOCATION
Highlights:
• 18% of American travellers (or 34.5 million people) have access to a cottage, cabin or vacation home.
• The majority (93%) of these cottages and vacation homes are in the United States, with 55% of being located in the travellers’ own home states.
• Almost 1 million American travellers (949,185 people) have cottages or vacation homes in Canada, 60% of which are in Ontario.
“Do you have access to a pr ivate cottage, cabin or vacat ion home on a regular basis? (owned by you, a fr iend or family member that you can use on a regular basis)”
% of travel lers (176.4 mil l ion)
YES 19.6% NO 79.5% NOT STATED 1.0%
“Where is th is cottage, cabin or vacat ion home located?”
% of travel lers (176.4 mil l ion)
The United States 18.3% Your Own State 10.8% Anywhere Else In U.S. 9.1% Canada 0.5% Newfoundland & Labrador 0.0% Prince Edward Island 0.1% Nova Scotia 0.1% New Brunswick 0.1% Quebec 0.1% Ontario 0.3% Manitoba 0.1% Saskatchewan 0.0% Alberta 0.1% British Columbia 0.2% Yukon 0.0% Northwest Territories 0.0% Nunavut 0.0% Other Country 1.6% Mexico 0.6% The Caribbean 0.5% Some Other Place 0.9% Not Stated 0.9%
49
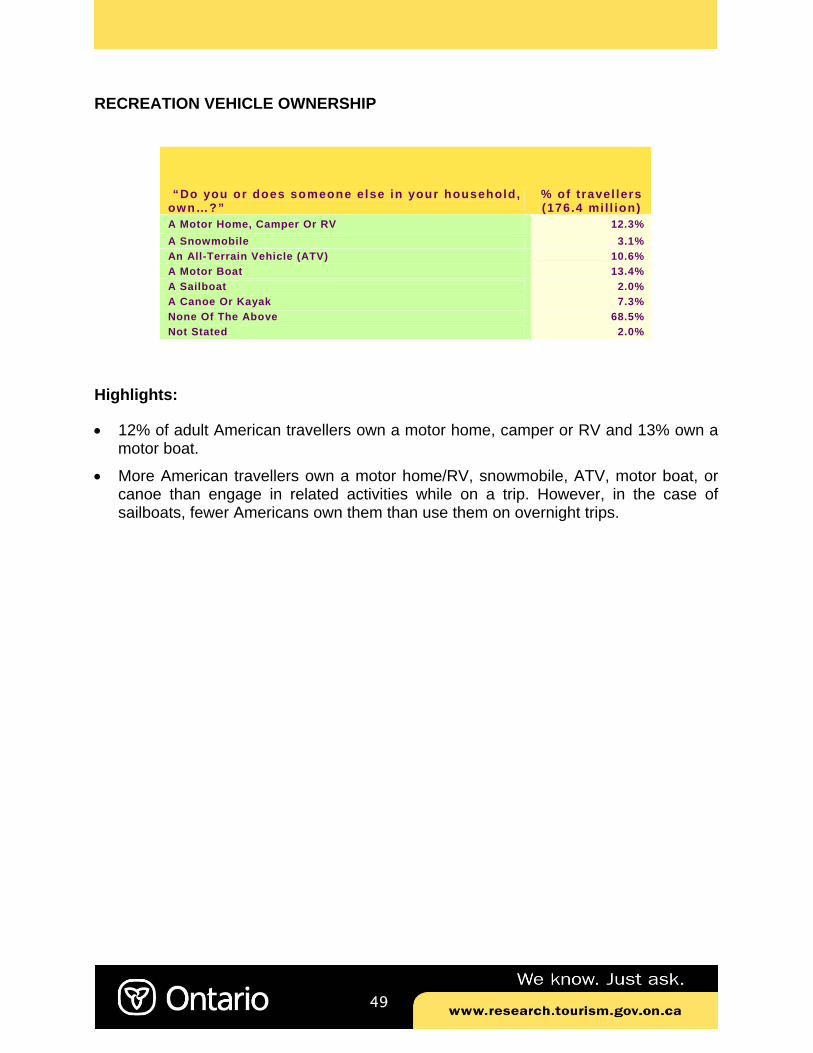
RECREATION VEHICLE OWNERSHIP
Highlights:
• 12% of adult American travellers own a motor home, camper or RV and 13% own a motor boat.
• More American travellers own a motor home/RV, snowmobile, ATV, motor boat, or canoe than engage in related activities while on a trip. However, in the case of sailboats, fewer Americans own them than use them on overnight trips.
“Do you or does someone else in your household, own…?”
% of travel lers (176.4 mil l ion)
A Motor Home, Camper Or RV 12.3% A Snowmobile 3.1% An All-Terrain Vehicle (ATV) 10.6% A Motor Boat 13.4% A Sailboat 2.0% A Canoe Or Kayak 7.3% None Of The Above 68.5% Not Stated 2.0%

50
MEDIA HABITS
Newspapers
Highlights:
• About 60% of American travellers read the weekday edition of a newspaper in a typical week and an additional 26% read it occasionally or rarely. Similar numbers of Americans read the weekend edition of a newspaper.
• 42% of American travellers read the travel section of a daily newspaper frequently or occasionally and 49% read the weekend travel section with the same frequency.
“Which of the fol lowing newspapers do you normally read in a typical week?”
% of t ravel lers
(176.4 mil ) Daily Newspaper Weekday Edition 59.7% Weekend Edition Of A Newspaper 57.0% Local Community Newspaper 49.3% Other Newspapers 13.9% Don't Read The Newspaper 12.9% Read Daily Newspapers Occasionally/Rarely 26.2% Read Weekend Newspapers Occasionally/Rarely 28.7% Not Stated 0.7%
“How often do you read the travel section of a daily newspaper?”
% of t ravel lers
(176.4 mil ) Frequently 17.1% Occasionally 25.3% Rarely 25.0% Never 18.1% Not Stated 0.9%
“How often do you read the travel section of a weekend edit ion of a newspaper?”
% of t ravel lers
(176.4 mil ) Frequently 23.7% Occasionally 24.9% Rarely 22.4% Never 14.4% Not Stated 1.0%
51
Magazines
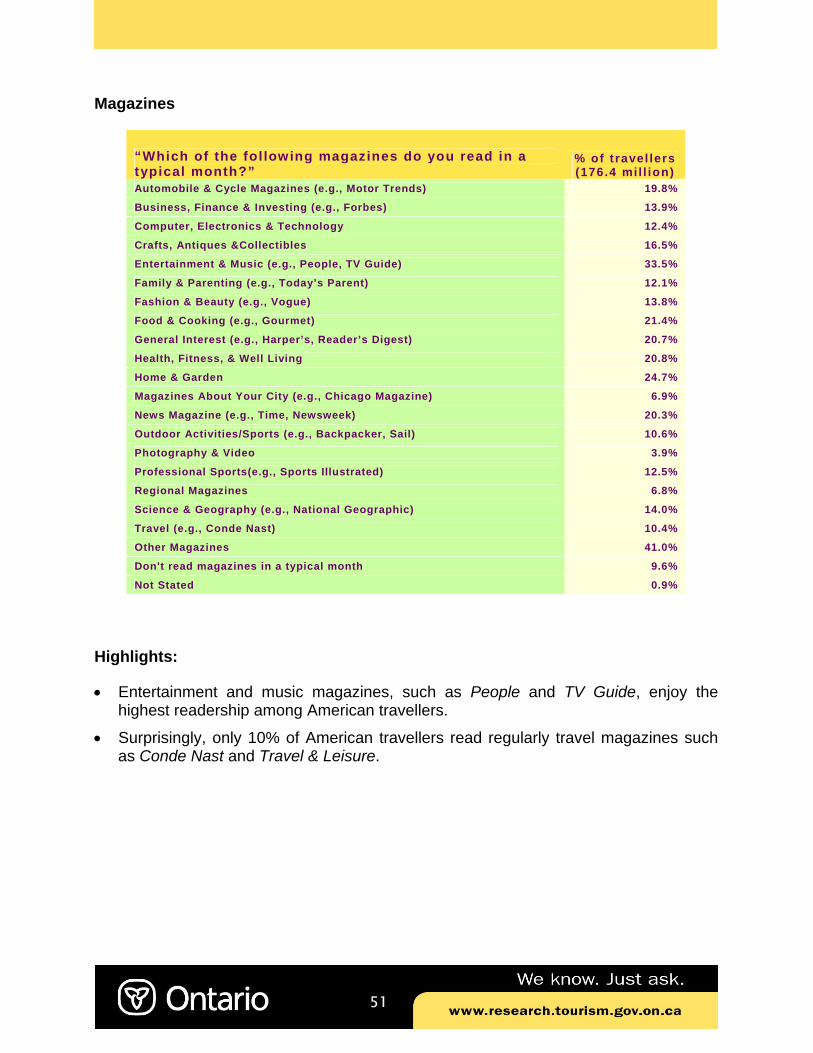
Highlights:
• Entertainment and music magazines, such as People and TV Guide, enjoy the highest readership among American travellers.
• Surprisingly, only 10% of American travellers read regularly travel magazines such as Conde Nast and Travel & Leisure.
“Which of the fol lowing magazines do you read in a typical month?”
% of travel lers (176.4 mil l ion)
Automobile & Cycle Magazines (e.g., Motor Trends) 19.8%
Business, Finance & Investing (e.g., Forbes) 13.9%
Computer, Electronics & Technology 12.4%
Crafts, Antiques &Collectibles 16.5%
Entertainment & Music (e.g., People, TV Guide) 33.5%
Family & Parenting (e.g., Today’s Parent) 12.1%
Fashion & Beauty (e.g., Vogue) 13.8%
Food & Cooking (e.g., Gourmet) 21.4%
General Interest (e.g., Harper’s, Reader’s Digest) 20.7%
Health, Fitness, & Well Living 20.8%
Home & Garden 24.7%
Magazines About Your City (e.g., Chicago Magazine) 6.9%
News Magazine (e.g., Time, Newsweek) 20.3%
Outdoor Activities/Sports (e.g., Backpacker, Sail) 10.6%
Photography & Video 3.9%
Professional Sports(e.g., Sports Illustrated) 12.5%
Regional Magazines 6.8%
Science & Geography (e.g., National Geographic) 14.0%
Travel (e.g., Conde Nast) 10.4%
Other Magazines 41.0%
Don't read magazines in a typical month 9.6%
Not Stated 0.9%
52
Television
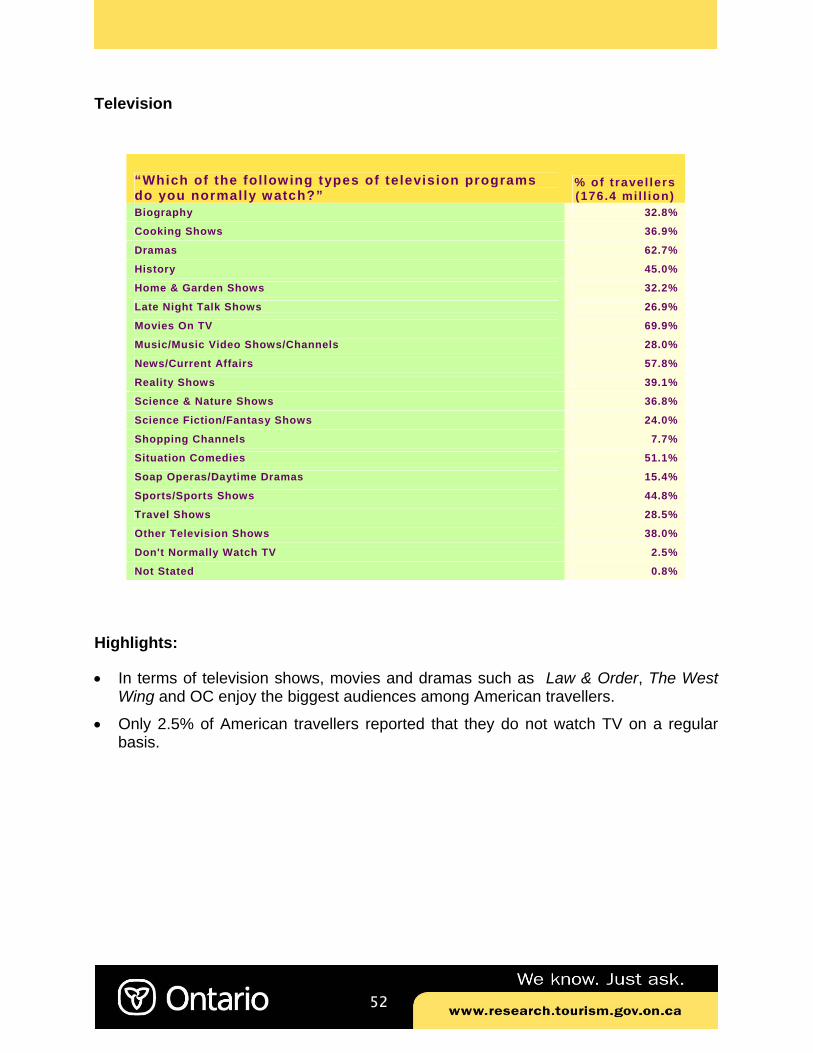
Highlights:
• In terms of television shows, movies and dramas such as Law & Order, The West Wing and OC enjoy the biggest audiences among American travellers.
• Only 2.5% of American travellers reported that they do not watch TV on a regular basis.
“Which of the following types of television programs do you normally watch?”
% of travel lers (176.4 mil l ion)
Biography 32.8%
Cooking Shows 36.9%
Dramas 62.7%
History 45.0%
Home & Garden Shows 32.2%
Late Night Talk Shows 26.9%
Movies On TV 69.9%
Music/Music Video Shows/Channels 28.0%
News/Current Affairs 57.8%
Reality Shows 39.1%
Science & Nature Shows 36.8%
Science Fiction/Fantasy Shows 24.0%
Shopping Channels 7.7%
Situation Comedies 51.1%
Soap Operas/Daytime Dramas 15.4%
Sports/Sports Shows 44.8%
Travel Shows 28.5%
Other Television Shows 38.0%
Don't Normally Watch TV 2.5%
Not Stated 0.8%
53
Radio
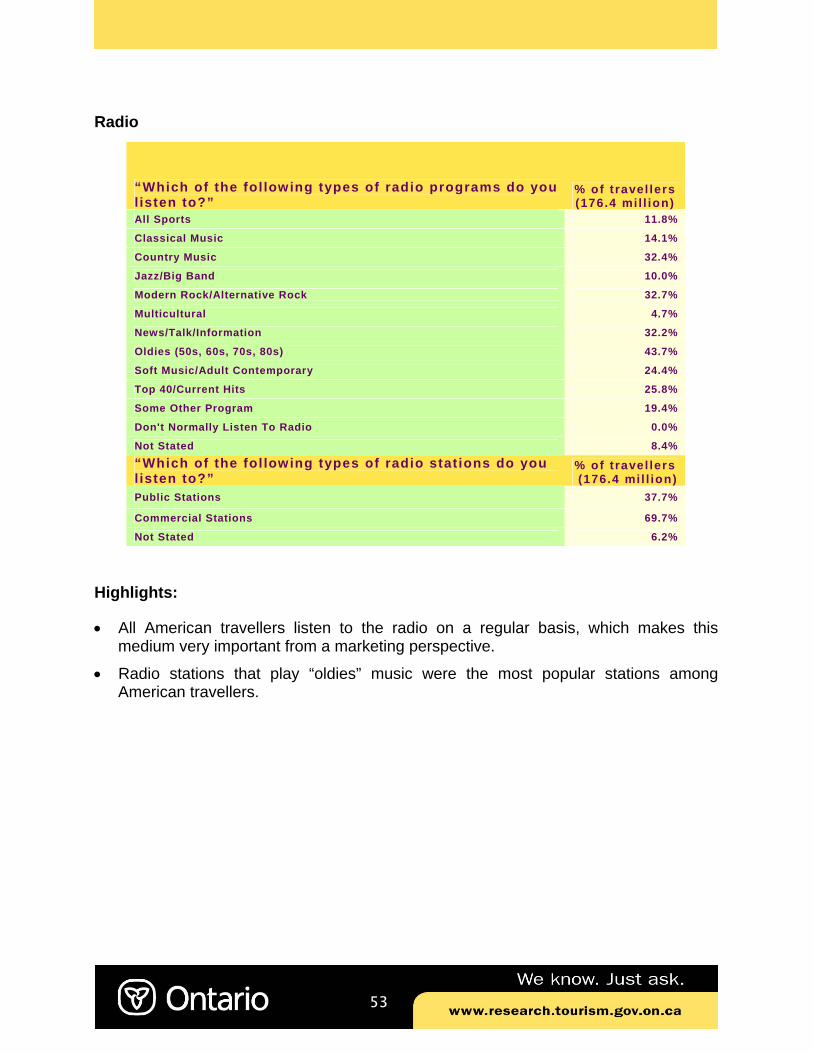
Highlights:
• All American travellers listen to the radio on a regular basis, which makes this medium very important from a marketing perspective.
• Radio stations that play “oldies” music were the most popular stations among American travellers.
“Which of the fol lowing types of radio programs do you l isten to?”
% of travel lers (176.4 mil l ion)
All Sports 11.8%
Classical Music 14.1%
Country Music 32.4%
Jazz/Big Band 10.0%
Modern Rock/Alternative Rock 32.7%
Multicultural 4.7%
News/Talk/Information 32.2%
Oldies (50s, 60s, 70s, 80s) 43.7%
Soft Music/Adult Contemporary 24.4%
Top 40/Current Hits 25.8%
Some Other Program 19.4%
Don't Normally Listen To Radio 0.0%
Not Stated 8.4% “Which of the fol lowing types of radio stat ions do you l isten to?”
% of travel lers (176.4 mil l ion)
Public Stations 37.7%
Commercial Stations 69.7%
Not Stated 6.2%
54
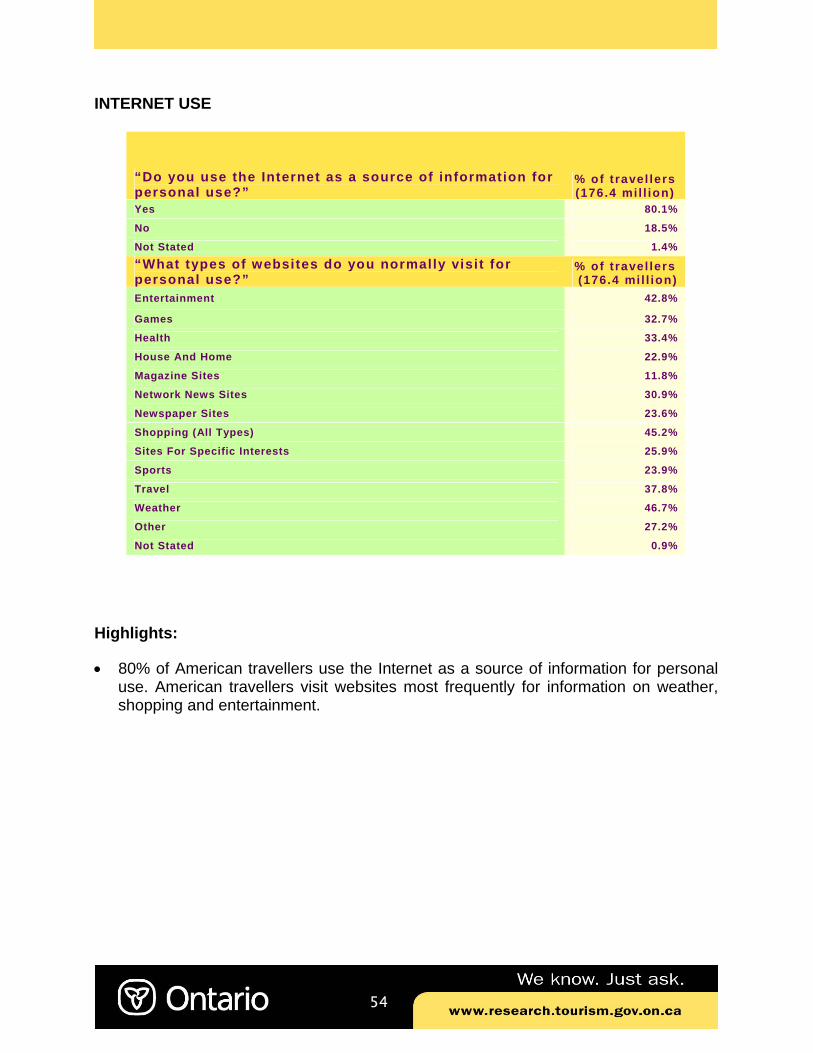
INTERNET USE
Highlights:
• 80% of American travellers use the Internet as a source of information for personal use. American travellers visit websites most frequently for information on weather, shopping and entertainment.
“Do you use the Internet as a source of information for personal use?”
% of travel lers (176.4 mil l ion)
Yes 80.1%
No 18.5%
Not Stated 1.4% “What types of websites do you normally visit for personal use?”
% of travel lers (176.4 mil l ion)
Entertainment 42.8%
Games 32.7%
Health 33.4%
House And Home 22.9%
Magazine Sites 11.8%
Network News Sites 30.9%
Newspaper Sites 23.6%
Shopping (All Types) 45.2%
Sites For Specific Interests 25.9%
Sports 23.9%
Travel 37.8%
Weather 46.7%
Other 27.2%
Not Stated 0.9%

55
MEMBERSHIP IN ORGANIZATIONS AND PROGRAMS
Highlights:
• Slightly less than one-third of American travellers belong to a frequent flyer program and 42% are members of an automobile club such as AAA.
“Are you a member of any of the fol lowing organizations or programs?”
% of travel lers (176.4 mil l ion)
Automobile Club like AAA 42.1%
Sports Club 15.5%
Book/Reading Club 10.6%
Community Service Club 10.3%
Nature/Environment Club/Group 5.2%
Travel Club 4.1%
Hobby Club 5.9%
Frequent Flyer Program 29.7%
Hotel/Car Rent Loyalty Program 19.7%
Other 17.7%
None Of The Above 25.6%
Not Stated 2.4%
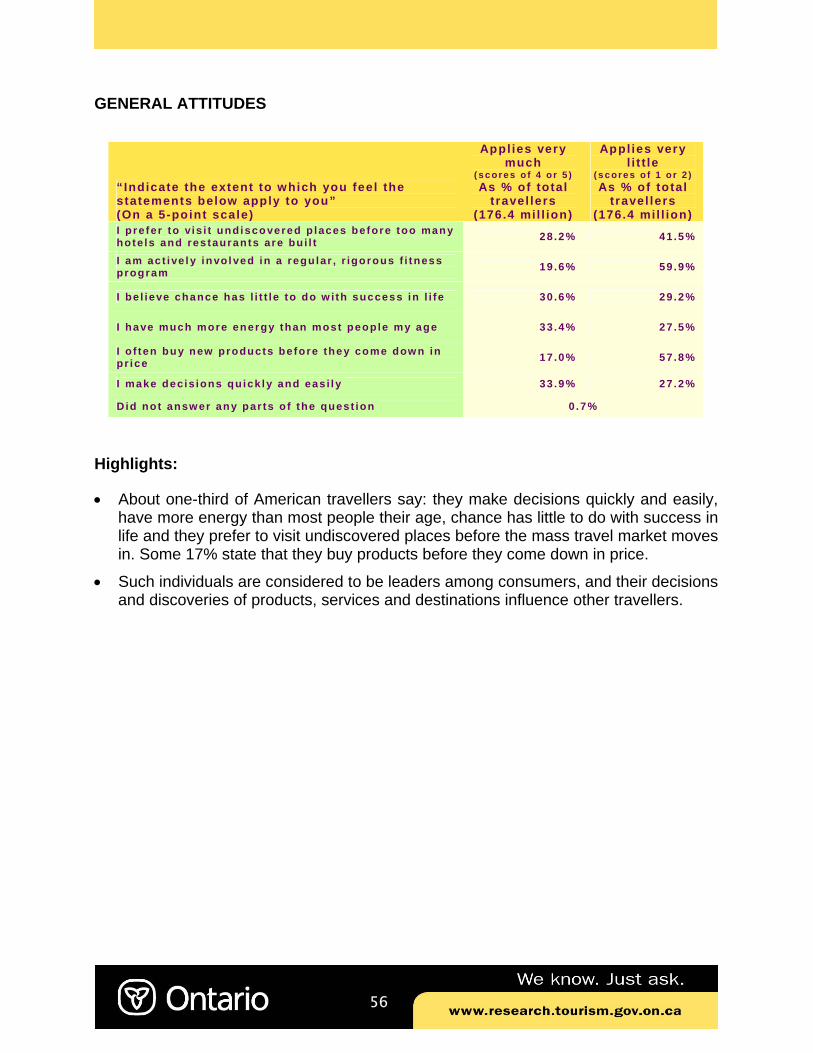
56
GENERAL ATTITUDES
Highlights:
• About one-third of American travellers say: they make decisions quickly and easily, have more energy than most people their age, chance has little to do with success in life and they prefer to visit undiscovered places before the mass travel market moves in. Some 17% state that they buy products before they come down in price.
• Such individuals are considered to be leaders among consumers, and their decisions and discoveries of products, services and destinations influence other travellers.
“Indicate the extent to which you feel the statements below apply to you” (On a 5-point scale)
Appl ies very much
( s c ore s o f 4 o r 5 ) As % of total
t ravel lers (176.4 mil l ion)
Appl ies very l i t t le
( s c ore s o f 1 o r 2 ) As % of total
t ravel lers (176.4 mil l ion)
I pre fer to vis i t undiscovered p laces before too many hote ls and restaurants are bu i l t 28 .2% 41 .5%
I am act ive l y invo l ved in a regular , r igorous f i tness program 19 .6% 59 .9%
I be l ieve chance has l i t t le to do w i th success in l i fe 30 .6% 29 .2%
I have much more energy than most people my age 33 .4% 27 .5%
I o f ten buy new products before they come dow n in pr ice 17 .0% 57 .8%
I make decis ions qu ick ly and eas i l y 33 .9% 27 .2%
Did not answ er any par ts o f the quest ion 0 .7%
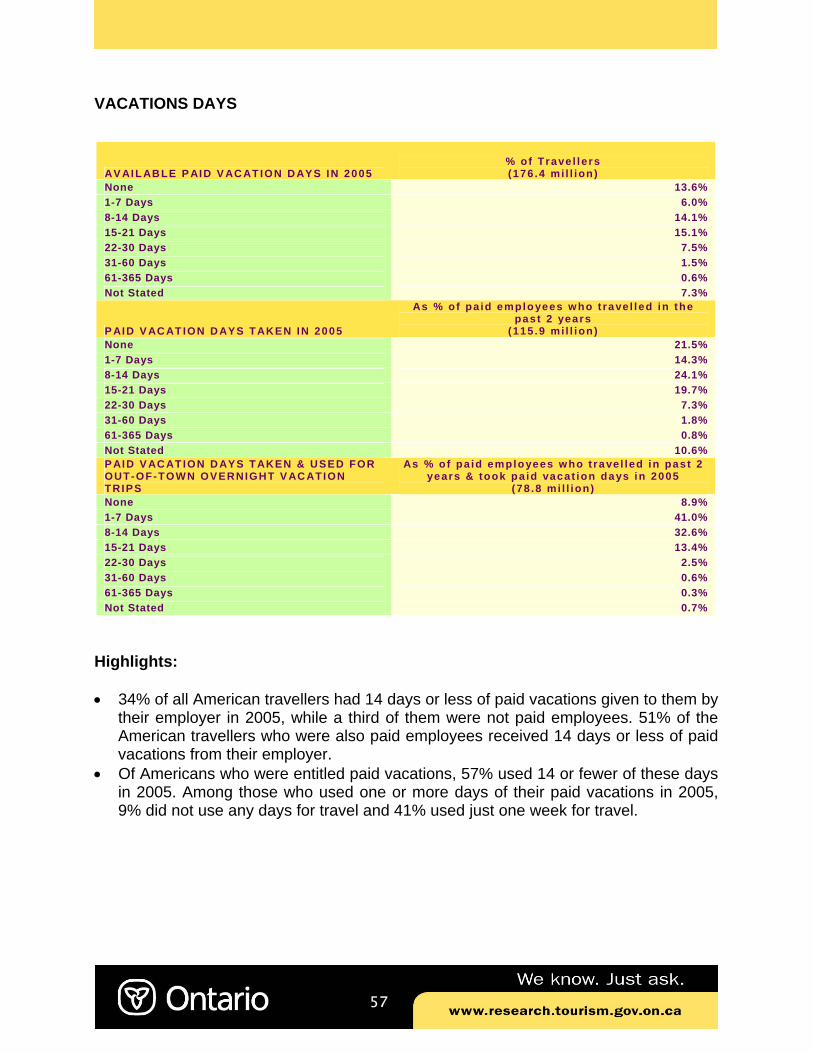
57
VACATIONS DAYS
Highlights: • 34% of all American travellers had 14 days or less of paid vacations given to them by
their employer in 2005, while a third of them were not paid employees. 51% of the American travellers who were also paid employees received 14 days or less of paid vacations from their employer.
• Of Americans who were entitled paid vacations, 57% used 14 or fewer of these days in 2005. Among those who used one or more days of their paid vacations in 2005, 9% did not use any days for travel and 41% used just one week for travel.
AV AIL ABLE P AID V AC AT ION D AYS IN 2005 % of Trave l le rs (176 .4 mi l l ion)
None 13.6% 1-7 Days 6.0% 8-14 Days 14.1% 15-21 Days 15.1% 22-30 Days 7.5% 31-60 Days 1.5% 61-365 Days 0.6% Not Stated 7.3%
P AID V AC AT ION D AYS TAKEN IN 2005
As % of pa id employees w ho t rave l led in the past 2 years
(115 .9 mi l l ion) None 21.5% 1-7 Days 14.3% 8-14 Days 24.1% 15-21 Days 19.7% 22-30 Days 7.3% 31-60 Days 1.8% 61-365 Days 0.8% Not Stated 10.6% P AID V AC AT ION D AYS TAKEN & USED FOR OUT-OF-TOWN OVERNIGHT V AC ATION TRIPS
As % of pa id employees w ho t rave l led in past 2 years & took pa id vacat ion days in 2005
(78 .8 mi l l ion) None 8.9% 1-7 Days 41.0% 8-14 Days 32.6% 15-21 Days 13.4% 22-30 Days 2.5% 31-60 Days 0.6% 61-365 Days 0.3% Not Stated 0.7%
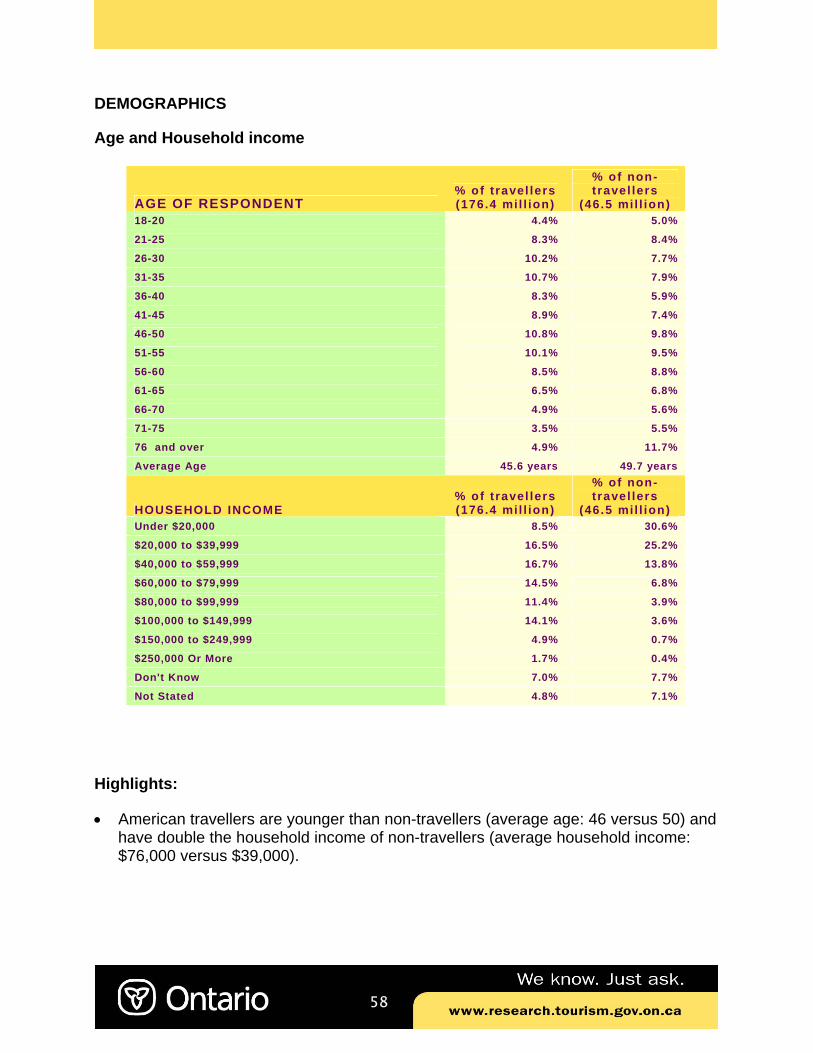
58
DEMOGRAPHICS
Age and Household income
Highlights:
• American travellers are younger than non-travellers (average age: 46 versus 50) and have double the household income of non-travellers (average household income: $76,000 versus $39,000).
AGE OF RESPONDENT % of travel lers (176.4 mil l ion)
% of non-travel lers
(46.5 mil l ion) 18-20 4.4% 5.0%
21-25 8.3% 8.4%
26-30 10.2% 7.7%
31-35 10.7% 7.9%
36-40 8.3% 5.9%
41-45 8.9% 7.4%
46-50 10.8% 9.8%
51-55 10.1% 9.5%
56-60 8.5% 8.8%
61-65 6.5% 6.8%
66-70 4.9% 5.6%
71-75 3.5% 5.5%
76 and over 4.9% 11.7%
Average Age 45.6 years 49.7 years
HOUSEHOLD INCOME % of travel lers (176.4 mil l ion)
% of non-travel lers
(46.5 mil l ion) Under $20,000 8.5% 30.6%
$20,000 to $39,999 16.5% 25.2%
$40,000 to $59,999 16.7% 13.8%
$60,000 to $79,999 14.5% 6.8%
$80,000 to $99,999 11.4% 3.9%
$100,000 to $149,999 14.1% 3.6%
$150,000 to $249,999 4.9% 0.7%
$250,000 Or More 1.7% 0.4%
Don't Know 7.0% 7.7%
Not Stated 4.8% 7.1%
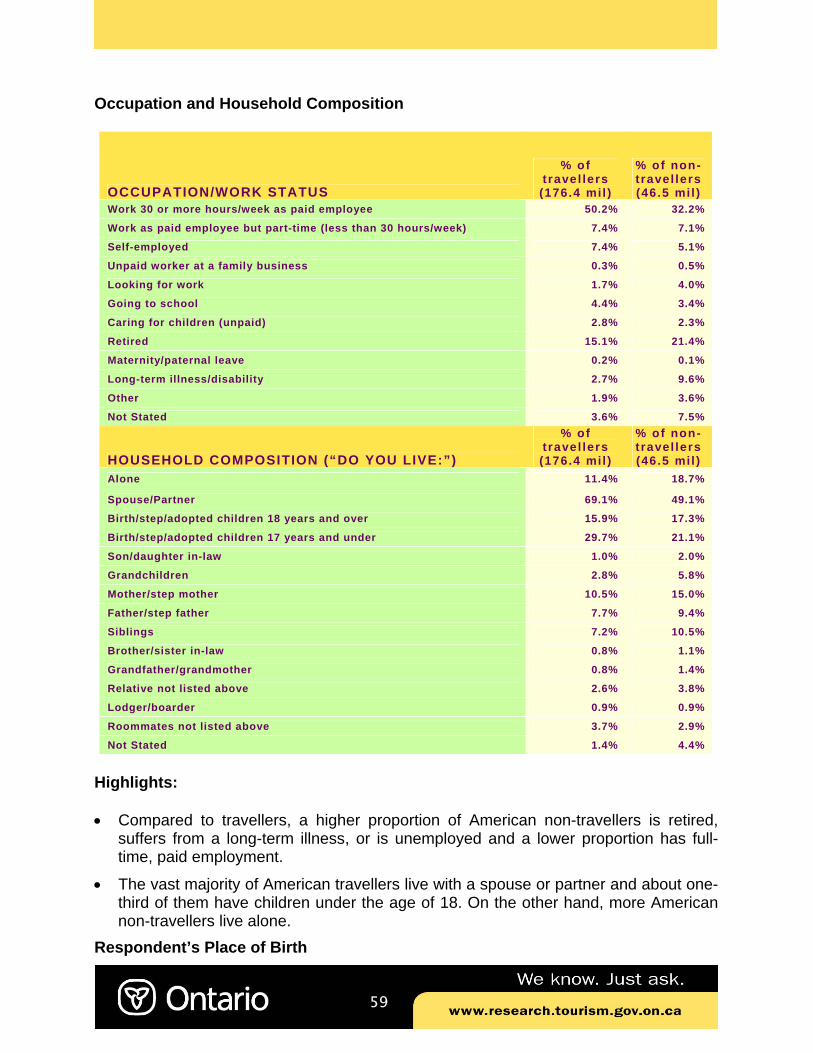
59
Occupation and Household Composition
Highlights: • Compared to travellers, a higher proportion of American non-travellers is retired,
suffers from a long-term illness, or is unemployed and a lower proportion has full-time, paid employment.
• The vast majority of American travellers live with a spouse or partner and about one-third of them have children under the age of 18. On the other hand, more American non-travellers live alone.
Respondent’s Place of Birth
OCCUPATION/WORK STATUS
% of t ravel lers
(176.4 mil )
% of non-travel lers (46.5 mil )
Work 30 or more hours/week as paid employee 50.2% 32.2%
Work as paid employee but part-time (less than 30 hours/week) 7.4% 7.1%
Self-employed 7.4% 5.1%
Unpaid worker at a family business 0.3% 0.5%
Looking for work 1.7% 4.0%
Going to school 4.4% 3.4%
Caring for children (unpaid) 2.8% 2.3%
Retired 15.1% 21.4%
Maternity/paternal leave 0.2% 0.1%
Long-term illness/disability 2.7% 9.6%
Other 1.9% 3.6%
Not Stated 3.6% 7.5%
HOUSEHOLD COMPOSITION (“DO YOU LIVE:”)
% of t ravel lers
(176.4 mil )
% of non-travel lers (46.5 mil )
Alone 11.4% 18.7%
Spouse/Partner 69.1% 49.1%
Birth/step/adopted children 18 years and over 15.9% 17.3%
Birth/step/adopted children 17 years and under 29.7% 21.1%
Son/daughter in-law 1.0% 2.0%
Grandchildren 2.8% 5.8%
Mother/step mother 10.5% 15.0%
Father/step father 7.7% 9.4%
Siblings 7.2% 10.5%
Brother/sister in-law 0.8% 1.1%
Grandfather/grandmother 0.8% 1.4%
Relative not listed above 2.6% 3.8%
Lodger/boarder 0.9% 0.9%
Roommates not listed above 3.7% 2.9%
Not Stated 1.4% 4.4%
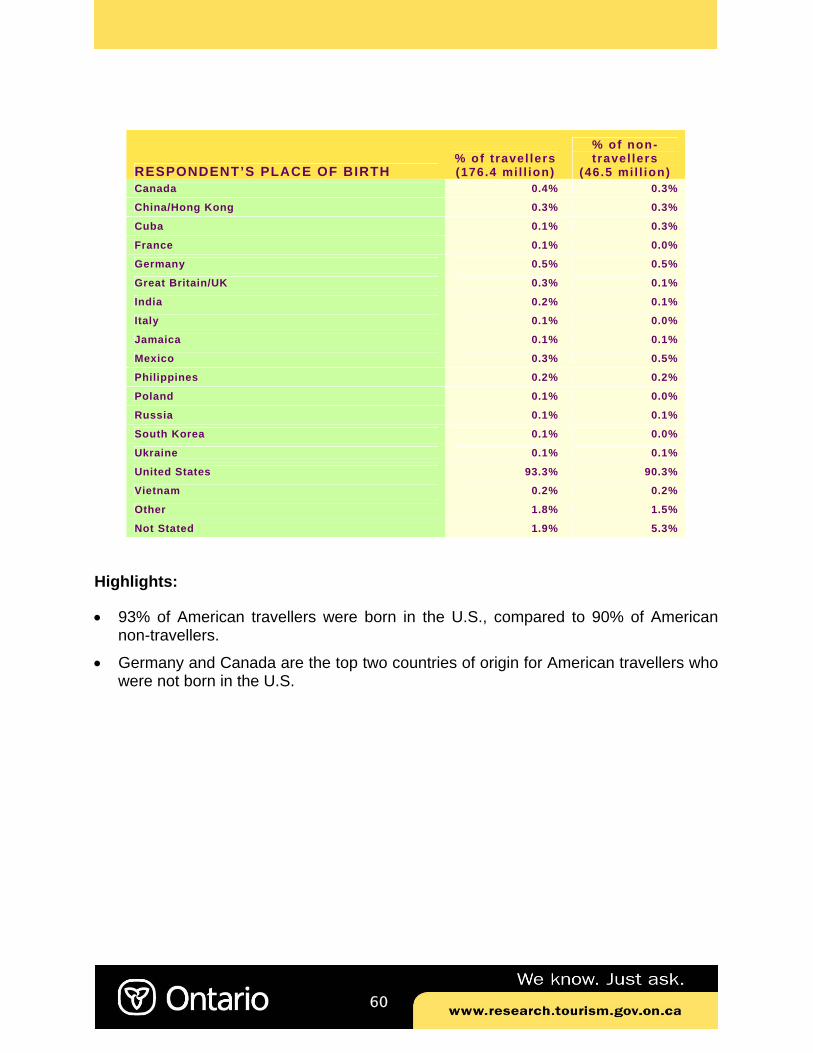
60
Highlights:
• 93% of American travellers were born in the U.S., compared to 90% of American non-travellers.
• Germany and Canada are the top two countries of origin for American travellers who were not born in the U.S.
RESPONDENT’S PLACE OF BIRTH % of travel lers (176.4 mil l ion)
% of non-travel lers
(46.5 mil l ion) Canada 0.4% 0.3%
China/Hong Kong 0.3% 0.3%
Cuba 0.1% 0.3%
France 0.1% 0.0%
Germany 0.5% 0.5%
Great Britain/UK 0.3% 0.1%
India 0.2% 0.1%
Italy 0.1% 0.0%
Jamaica 0.1% 0.1%
Mexico 0.3% 0.5%
Philippines 0.2% 0.2%
Poland 0.1% 0.0%
Russia 0.1% 0.1%
South Korea 0.1% 0.0%
Ukraine 0.1% 0.1%
United States 93.3% 90.3%
Vietnam 0.2% 0.2%
Other 1.8% 1.5%
Not Stated 1.9% 5.3%

61
Parent’s Place of Birth
Highlights: • 88% of American travellers’ parents were born in the U.S., with Germany, Canada,
Italy and Mexico being the top countries of origin for those who were born outside the U.S.
PLACE OF BIRTH OF PARENTS % of travel lers (176.4 mil l ion)
% of non-travel lers
(46.5 mil l ion) Australia 0.1% 0.0%
Barbados 0.0% 0.0%
Belgium 0.1% 0.1%
Canada 1.1% 0.9%
China/Hong Kong 0.6% 0.6%
Cuba 0.3% 0.4%
Dominican Republic 0.1% 0.0%
El Salvador 0.1% 0.1%
France 0.2% 0.1%
Germany 1.5% 1.6%
Great Britain/UK 1.0% 0.8%
Greece 0.1% 0.2%
Holland/The Netherlands 0.3% 0.1%
India 0.3% 0.2%
Italy 1.1% 1.2%
Ireland 0.4% 0.4%
Jamaica 0.1% 0.3%
Mexico 1.1% 1.5%
Philippines 0.4% 0.3%
Poland 0.7% 0.8%
Portugal 0.2% 0.2%
Russia 0.5% 0.6%
Serbia 0.1% 0.1%
South Korea 0.2% 0.1%
Switzerland 0.1% 0.1%
Ukraine 0.2% 0.3%
United States 88.3% 84.5%
Vietnam 0.3% 0.2%
Other 3.6% 3.6%
Not Stated 3.6% 6.8%
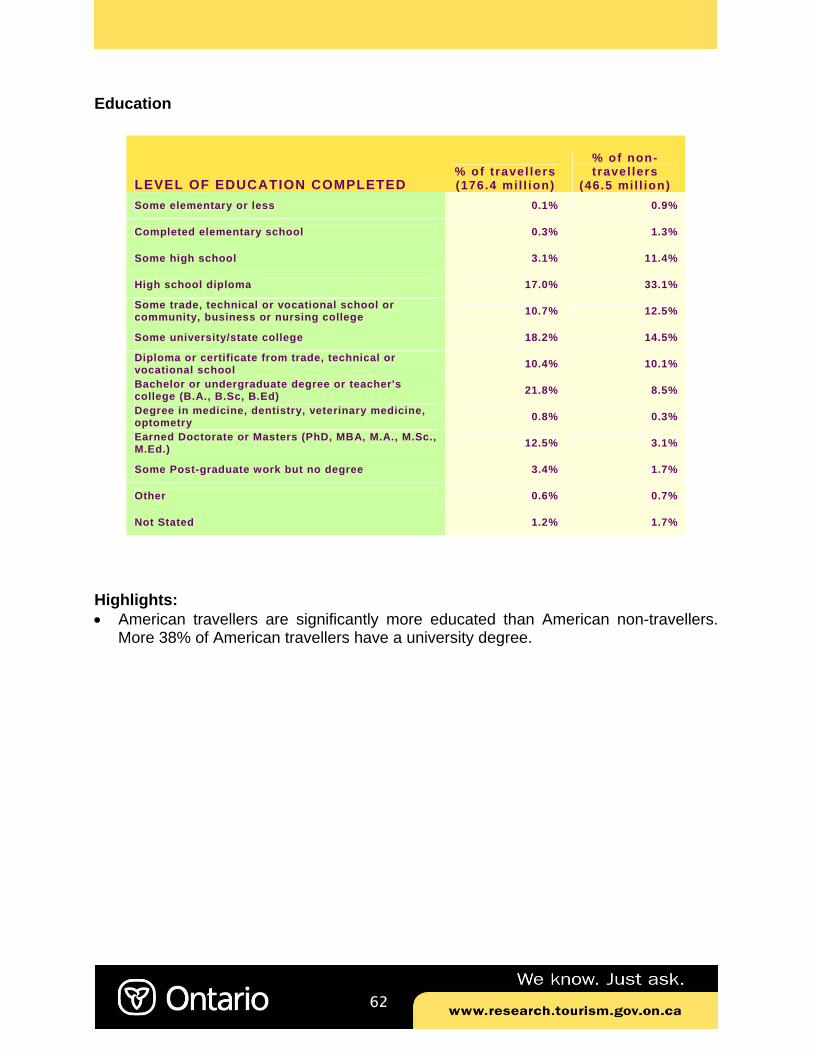
62
Education
Highlights: • American travellers are significantly more educated than American non-travellers.
More 38% of American travellers have a university degree.
LEVEL OF EDUCATION COMPLETED % of travel lers (176.4 mil l ion)
% of non-travel lers
(46.5 mil l ion) Some elementary or less 0.1% 0.9%
Completed elementary school 0.3% 1.3%
Some high school 3.1% 11.4%
High school diploma 17.0% 33.1%
Some trade, technical or vocational school or community, business or nursing college 10.7% 12.5%
Some university/state college 18.2% 14.5%
Diploma or certificate from trade, technical or vocational school 10.4% 10.1%
Bachelor or undergraduate degree or teacher's college (B.A., B.Sc, B.Ed) 21.8% 8.5%
Degree in medicine, dentistry, veterinary medicine, optometry 0.8% 0.3%
Earned Doctorate or Masters (PhD, MBA, M.A., M.Sc., M.Ed.) 12.5% 3.1%
Some Post-graduate work but no degree 3.4% 1.7%
Other 0.6% 0.7%
Not Stated 1.2% 1.7%