
Trauma: Who cares? - National Confidential Enquiry into ... · 1 Trauma: Who cares? A report of the...
151
Trauma: Who cares? A report of the National Confidential Enquiry into Patient Outcome and Death (2007)
Transcript of Trauma: Who cares? - National Confidential Enquiry into ... · 1 Trauma: Who cares? A report of the...

Trauma: Who cares?
A report of the National Confi dential Enquiry into Patient Outcome and Death (2007)

1
Trauma: Who cares?A report of the National Confi dential Enquiry into Patient Outcome and Death (2007)
Compiled by:
G Findlay MB ChB FRCA
I C Martin LLM FRCS FDSRCS
S Carter MBBS FRCS FRCS(G) RCPS
1
N Smith BSc PhD
D Weyman BSc
M Mason PhD

2
Contents
Acknowledgements 4
Foreword 8
Summary of fi ndings 10
Principal recommendations 12
Introduction 14
References 16
Method 17
Chapter 1 – Data overview 21
Chapter 2 – Organisational data 25
Key fi ndings 33
Recommendations 33
Chapter 3 – Overall assessment 34
Key fi ndings 36
Chapter 4 – Prehospital care 37
Introduction 37
Organisational aspects of care 37
Clinical aspects of care 42
Airway and ventilation 43
Key fi ndings 48
Recommendations 48
References 49
Chapter 5 – Hospital reception 50
Introduction 50
Results 50
Trauma team response 51
Trauma team response – individual cases 52
Primary survey and overall assessment 59
Key fi ndings 60
Recommendations 61
References 61

3
Chapter 6 – Airway and breathing 62
Introduction 62
Results 62
Case study 1 68
Key fi ndings 68
Recommendations 68
References 69
Chapter 7 – Management of circulation 70
Introduction 70
Results 71
Case study 2 72
Case study 3 76
Key fi ndings 81
Recommendations 82
References 82
Chapter 8 – Head injury management 85
Introduction 85
Results 85
Prehospital data 86
Hospital data 91
Case study 4 97
Case study 5 104
Key fi ndings 108
Recommendations 109
References 109
Chapter 9 – Paediatric care 112
Organisational data 112
Clinical data 114
Key fi ndings 116
Recommendations 116
References 117
Chapter 10 – Transfers 118
Introduction 118
Results 119
Case study 6 123
Case study 7 123
Key fi ndings 124
Recommendations 124
References 125
Chapter 11 – Incidence of trauma
and organisation of trauma services 126
Introduction 126
Results 126
Discussion 128
Key fi ndings 131
Recommendations 131
References 132
Appendix A – Glossary 133
Appendix B – Injury severity score 134
Appendix C – Adult and paediatric
Glasgow Coma Scale 135
Appendix D – An example of an excellent
Patient Report Form (PRF) 138
Appendix E – Level 1 trauma care 140
Appendix F – Participation 141
Appendix G – Corporate structure 148

4
Acknowledgements
The Expert Group who advised NCEPOD:
Dr B Winter
Consultant in Adult Critical Care
Dr C Carney
Chief Executive East Anglian Ambulance NHS Trust
Mr D Gilroy
Consultant General Surgeon
Mr K Porter
Consultant Orthopaedic Surgeon
Professor P Giannoudis
Professor of Trauma and Orthopaedics
Mr S Davies
Trauma Nurse Co-ordinator
Professor T Coats
Professor of Emergency Medicine
Mr T Pigott
Consultant Spinal Surgeon
Ms E Symonds
Lay Representative
Dr A Gray
Consultant Anaesthetist
Dr A Nicholson
Consultant Vascular Radiologist,
Clinical Director of Radiology
Dr I Doughty
Consultant Paediatrician
The Advisors who reviewed the cases:
Dr A Wilson
Consultant in Emergency Medicine
Miss A Hutchings
Trauma Nurse Specialist / Trauma Co-ordinator
Dr A Feazey
Consultant in Emergency Medicine
Dr A Black
Consultant Paediatrician
Miss A McGinley
Nurse Consultant Critical Care Outreach Team
Dr A Sutcliffe
Consultant in Intensive Care
Mr A Armstrong
Consultant Plastic Surgeon
Mr B White
Consultant Neurosurgeon
This is the twenty fi rst report published by NCEPOD and, as always, could not have been
achieved without the support of a wide range of individuals and organisations.
Our particular thanks go to:

5
Ackno
wled
gem
ents
Dr C Stevenson
Specialist Registrar in Anaesthesia
Dr C Gomez
Consultant in Intensive Care
Dr C Deakin
Consultant Anaesthetist
Dr D Gardiner
Consultant in Intensive Care
Dr D Bryden
Consultant in Intensive Care
Mr D Teanby
Consultant Orthopaedic Surgeon
Dr D Esberger
Consultant in Emergency Medicine
Dr E Abrahamson
Consultant in Emergency Medicine
Miss H Cattermole
Consultant Orthopaedic Surgeon
Dr J Berridge
Consultant Anaesthetist
Mr K Brohi
Consultant General Surgeon
Major M Butler
Specialist Registrar in Trauma and Orthopaedics
Mr M Perry
Consultant Oral and Maxillofacial Surgeon
Mr M McMonagle
Specialist Registrar in General Surgery
Mr N Tai
Consultant Vascular Surgeon
Dr O Bagshaw
Consultant Paediatrician
Dr R Landau
Consultant in Emergency Medicine
Dr R Banks
Specialist Registrar in Maxillofacial Surgery
Mr S Marks
Consultant Neurosurgeon
Dr S Smith
Consultant in Emergency Medicine
Dr S Luney
Consultant Anaesthetist

6
The organisations that provided funding to cover the
cost of this study:
National Patient Safety Agency
Department of Health, Social Services and Public Safety
(Northern Ireland)
Aspen Healthcare
Benenden Hospital
BMI Healthcare
BUPA
Capio Group
Covenant Healthcare
Cromwell Hospital
Isle of Man Health and Social Security Department
Fairfi eld Independent Hospital
HCA International
Horder Centre
Hospital Management Trust
Hospital of St John and St Elizabeth
King Edward VII Hospital
King Edward VIIs Hospital Sister Agnes
London Clinic
McIndoe Surgical Centre
Mount Alvernia Hospital
Netcare Healthcare
New Victoria Hospital
North Wales Medical Centre
Nuffi eld Hospitals
Orchard Hospital
St Anthony’s Hospital
St Joseph’s Hospital
Spencer Wing, Queen Elizabeth the
Queen Mother Hospital
States of Guernsey, Health and Social Services
States of Jersey, Health and Social Services
Ulster Independent Clinic
The professional organisations that support our work
and who constitute our Steering Group:
Association of Anaesthetists of Great Britain and Ireland
Association of Surgeons of Great Britain and Ireland
Coroners’ Society of England and Wales
Faculty of Dental Surgery of the Royal College
of Surgeons of England
Faculty of Public Health of the Royal College
of Physicians of the UK
Institute of Healthcare Management
Royal College of Anaesthetists
Royal College of Child Health and Paediatrics
Royal College of General Practitioners
Royal College of Nursing
Royal College of Obstetricians and Gynaecologists
Royal College of Ophthalmologists
Royal College of Pathologists
Royal College of Physicians of London
Royal College of Radiologists
Royal College of Surgeons of England
Acknowledgements

7
Ackno
wled
gem
ents
The authors and Trustees of NCEPOD would
particularly like to thank the NCEPOD staff for their
hard work in collecting and analysing the data for
this study:
Robert Alleway, Sabah Begg, Philip Brown, Heather
Cooper, Karen Protopapa, Sidhaarth Gobin, Clare Holtby,
Dolores Jarman, Viki Pepper, and Saba Raza.
In addition we thank our scientifi c advisors Dr Martin Utley
and Professor Steve Gallivan for all their assistance.
DISCLAIMERThis work was undertaken by NCEPOD, which received
funding for this report from the National Patient Safety
Agency. The views expressed in this publication are those
of the authors and not necessarily those of the Agency.

8
Severe injury - a car crash, a fall from
a height - accidents such as these are
the commonest causes of loss of life in
the young. The chance of survival and
the completeness of recovery are highly
dependent on the care that follows. Some
are killed outright but those who survive
the initial impact may still die in the hours,
days or weeks that follow. The speed
with which lethal processes are identifi ed
and halted makes the difference between
life and death. The injury sets in train
life threatening effects of injury on the
circulation, tissue oxygenation and the
brain. The sooner we can halt and reverse
these processes, the more likely and
complete will be the return to health.
Foreword

9
To be effective, all processes, including ATLS and other
components of care of severely injured patients, must be
embedded in practice at every stage: the scene of the
accident; alerts to the hospital; the journey from the scene
to the emergency department; preparations made there;
expertise accessible on arrival and at all subsequent stages,
including transfer to specialist services. This NCEPOD report
has studied how well we do - and where we sometimes
fail. It is by sympathetically, and analytically, studying where
things go wrong that we can learn most.
Fo
rewo
rd
As a junior in the emergency and neurosurgical departments
in Cambridge in the early 1970s we were trained in these
rather obvious principles. To use a current catch phrase - it’s
not rocket science or another, nearer the point - it doesn’t
take a brain surgeon to work that out! And yet somehow the
apparently obvious - or we might see it as “common sense”
- was not so commonplace. Then in 1976 an orthopaedic
surgeon James Styner crashed his plane in Nebraska. His
wife was dead and there he was in a fi eld with three of his
four children critically injured. He fl agged down a car to get
to the nearest hospital - which was closed. Once opened it
became clear to him that the care available was inadequate
and inappropriate.
The minutes and fi rst hours after an accident are not the
time to be working out care from fi rst principles. We miss
the obvious under pressure; we cannot hope to make
consistently inspired diagnoses. It is not the time to be
negotiating a hierarchy, debating priorities and searching
shelves and drawers for equipment. We need a well worked
out process based on getting most things right and very few
things wrong. Realising this, Styner started to work out a
system of care. From his initial efforts came Acute Trauma
Life Support (ATLS) and with it a new philosophy of care
of the severely injured patient based around well thought
through processes and teams trained in them - all adhering
to the same workshop manual.
Professor T. Treasure
Chairman

10
This study shows a rounded picture of
current trauma care provision in England,
Wales, Northern Ireland and the Offshore
Islands. It draws on data provided by the
clinicians involved in the care of these
patients (from questionnaires) and data
extracted from the casenotes. However,
these data are accompanied by peer
review, by practising clinicians involved in
the day-to-day care of trauma patients, to
give a much richer picture than a purely
quantitative assessment would allow.
Almost 60% of the patients in this study received a standard
of care that was less than good practice. Defi ciencies in
both organisational and clinical aspects of care occurred
frequently.
There were diffi culties in identifying those patients with an
injury severity score (ISS) >16. With large costs involved in
both the provision of care and resources for the management
of these patients it is surprising that that there is no current
method of identifying the demand for the management of
these patients.
Summary of fi ndings

11
The organisation of prehospital care, the trauma team
response, seniority of staff involvement and immediate in-
hospital care was found to be defi cient in many cases.
Lack of appreciation of severity of illness, of urgency of
clinical scenario and incorrect clinical decision making were
apparent. Many of these clinical issues were related to the
lack of seniority and experience of the staff involved in the
immediate management of these patients.
It was clear that the provision of suitably experienced staff
during evenings and nights was much lower than at other
times. In the management of trauma, which very often
presents at night, this is a major concern. NHS Trusts
should be open about the differences in care by day and
night and look to address this as a matter of urgency. Public
awareness of these differences may be useful in any debate
about the future confi guration of trauma services.
Severe trauma is not common and many hospitals see less
than one severely injured patient per week. This has a direct
bearing on experience and ability to manage these challenging
patients. Not only does this relate to clinical skills but also to
the feasibility of providing the entire infrastructure required to
manage the trauma patient defi nitively in all centres.
Sum
mary o
f fi nding
s

12
Principal recommendations
Organisational data
There is a need for designated Level 1 trauma centres
and a verifi cation process needs to be developed
to quality assure the delivery of trauma care (as has
been developed in the USA by the American College
of Surgeons). (Royal College of Surgeons of England,
College of Emergency Medicine)
Prehospital care
All agencies involved in trauma management, including
emergency medical services, should be integrated into
the clinical governance programmes of a regional trauma
service. (All healthcare providers)
Airway management in trauma patients is often
challenging. The prehospital response for these patients
should include someone with the skill to secure the
airway, (including the use of rapid sequence intubation),
and maintain adequate ventilation. (Ambulance and
hospital trusts)
Hospital reception
Trusts should ensure that a trauma team is available 24
hours a day, seven days a week. This is an essential part
of an organised trauma response system. (Hospital trusts)
A consultant must be the team leader for the management
of the severely injured patient. There should be no reason
for this not to happen during the normal working week.
Trusts and consultants should work together to provide
job plans that will lead to better consultant presence in the
emergency department at all times to provide more uniform
consultant leadership for all severely injured patients.
(Hospital trusts and clinical directors)

13
Princip
al recom
mend
ations
Airway and breathing
The current structure of prehospital management is
insuffi cient to meet the needs of the severely injured
patient. There is a high incidence of failed intubation
and a high incidence of patients arriving at hospital with
a partially or completely obstructed airway. Change
is urgently required to provide a system that reliably
provides a clear airway with good oxygenation and
control of ventilation. This may be through the provision
of personnel with the ability to provide anaesthesia
and intubation in the prehospital phase or the use of
alternative airway devices. (Ambulance trusts)
Management of circulation
Trauma laparotomy is potentially extremely challenging
and requires consultant presence within the operating
theatre. (Clinical directors)
If CT scanning is to be performed, all necessary images
should be obtained at the same time. Routine use of
‘top to toe’ scanning is recommended in the adult
trauma patient if no indication for immediate intervention
exists. (Royal College of Radiology and radiology
department heads)
Head injury management
Patients with severe head injury should have a CT head
scan of the head performed as soon as possible after
admission and within one hour of arrival at hospital.
(Trauma team leader and radiology heads)
All patients with severe head injury should be transferred
to a neurosurgical/critical care centre irrespective of the
requirement for surgical intervention. (Strategic health
authorities, hospital trusts, trauma team leaders)
Paediatric care
Each receiving unit should have up to date guidelines for
children which recognise the paediatric skills available on
site and their limitations and include agreed guidelines
for communication and transfer with specialised
paediatric services within the local clinical network.
(Strategic health authorities and hospital trusts)
Transfers
There should be standardised transfer documentation of
the patients’ details, injuries, results of investigations and
management with records kept at the dispatching and
receiving hospitals. (Trauma team leader, Department
of Health)
Published guidelines must be adhered to and audits per-
formed of the transfers and protocols. (Hospital trusts)
Incidence of trauma and organisation of trauma services
Given the relatively low incidence of severe trauma
in the UK, it is unlikely that each individual hospital
can deliver optimum care to this challenging group of
patients. Regional planning for the effective delivery of
trauma services is therefore essential. (Strategic health
authorities, hospital trusts)

14
Introduction
Trauma remains the fourth leading cause of death in western
countries and the leading cause of death in the fi rst four
decades of life. The incidence of trauma is particularly high
in the younger population; an average of 36 life years are
lost per trauma death1. Furthermore, trauma is also a major
cause of debilitating long-term injuries. For each trauma
fatality there are two survivors with serious or permanent
disability2. Trauma is, therefore, not only a leading cause
of death but also a large socio-economic burden. In 1998,
the estimated cost to the NHS, of treating all injuries, was
£1.2 billion per annum3. Reducing injuries is, therefore, a key
government objective. By 2010, the Department of Health
aims to have reduced the incidence of accidents by at least
20% from the baseline that was set in 19963.
Road trauma accounts for over a third of all deaths due to
injury4. In 2001-2003, there were (on average) 3,460 traffi c
related fatalities per annum in Great Britain5. The incidence
of severe trauma, defi ned as an Injury Severity Score (ISS) of
16 or greater, is estimated to be four per million per week6.
Given that the UK population in mid-2003 was in the region
of 59.5 million7, there are approximately 240 severely injured
patients in the UK each week.
In 1988, the working party report by the Royal College of
Surgeons of England highlighted ‘serious defi ciencies in the
management of severely injured patients’8. Following this
report, there was increased focus on the care of trauma
patients in the UK and consequently the fatality rate of
trauma patients reduced. However, most of the improvement
in the outcome of these patients occurred prior to 1995, with
no further signifi cant change occurring between 1994 and
20009.
In 2000, a joint report from the Royal College of Surgeons
of England and the British Orthopaedic Association
recommended that standards of care for the severely
injured patient should be nationally co-ordinated and

15
Introd
uction
systematically audited6. It was also recommended that
standards and outcome measures be developed, against
which institutions can audit the outcome of treatment. The
standards of care recommended in the report include the
use of advance warning systems by the ambulance service,
the establishment of trauma teams, the involvement of
a senior anaesthetist from the outset and criteria for the
activation of the trauma team. The overall purpose of these
recommendations was to improve the care of severely injured
patients in terms of reduced mortality and unnecessary
morbidity.
A number of UK-based single and multi-centre studies
have addressed specifi c issues relating to the care of
trauma patients10-15. The use of ambulance crews to alert
hospitals of severely injured patients, the effect of inter-
hospital transfers and the determinants affecting outcome
have all been studied. One of the largest UK-based studies
looked at the treatment of neurosurgical trauma patients in
non-neurosurgical units16. There has not, however, been a
national study to examine the overall care of trauma patients
in the UK to date.
Much of the research on trauma care in the UK has been
carried out using data from the Trauma Audit and Research
Network (TARN), which was established in response to
the Royal College of Surgeons of England’s working party
report. Approximately 50% of trauma receiving hospitals
submit data to TARN17. The Trauma Network Database is
now an important source of epidemiological data and, in
2000 it contained information on over 120,000 cases18. The
Healthcare Commission is working with TARN to increase
participation from 50% to 100% of hospitals and to expand
the number of quantitative trauma audits. At a local level, the
feedback provided by TARN to individual hospitals highlights,
amongst others, those cases in which patient outcome
was ‘unexpected’. This markedly aids internal audit and the
review of trauma cases by those multi-specialty clinicians
who were involved in the care of particular patients. Together
with national evaluations of trauma care, in particular head
injury, processes of trauma care are also analysed and
provide a factual basis for system review.
A lack of continued improvement in outcome is coupled
with concern that the quality of care in hospital is not of
a consistently high standard across the UK, despite the
availability of guidelines that indicate referral pathways for
optimum triage, management and access to specialist
care6,19,20. Furthermore, owing to the incidence of severe
trauma, hospitals are unlikely to treat more than one severely
injured patient per week. It has been suggested, therefore,
that as suffi cient trauma experience cannot be achieved at
all hospitals, optimal outcomes may be compromised. One
of the overall recommendations of the 2000 report was the
establishment of a National Trauma Service trauma hub and
spoke network between hospitals in each geographic area6.
The organisation of trauma services in the UK remains
highly topical. The recent report from The Royal College
of Surgeons of England (2006)6 confi rms that high quality
trauma care is not consistently available within the NHS.
Recent public debate and government statements refl ect
the continuing controversies regarding the optimum system
of delivering trauma services within the present resource
constraints21. This study is therefore timely as it explores
the organisation in trauma services from the perspective
of the patient journey. NCEPOD have identifi ed remediable
factors and made recommendations for improvement in the
management of the severely injured patient.
The Royal College of Surgeons of England Trauma
Committee proposed this study as part of NCEPOD’s topic
selection process in February 2004. The NCEPOD Steering
Group selected the topic, which falls under NCEPOD’s
extended remit.
16
1. Chaira 0, Cimbanissi S. Organized trauma care: does
volume matter and do trauma centers save lives?
Curr Opin Crit Care 2003; 9:510-4
2. http://www. tarn.ac.uk/content/images/53/overview%
2006.pdf
3. Our Healthier Nation – A contract for Health. Department
of Health, 1998
4. The Royal College of Surgeons of England and the British
Orthopaedic Society. Better Care for the Severely Injured.
2000
5. Department for Transport, Table 33, Casualties: by age,
road user type and severity: 2001, 2002 and 2003
6. Gorman DF, Teanby DN, Sinha MP, Wotherspoon J, Boot
DA, Molokhia A. The epidemiology of major injuries in
Mersey and North Wales. Injury 1995; 26(1):51-4
7. Offi ce for National Statistics http://www.statistics.gov.uk/
8. Report of the working party on the management of
patients with major injury. Royal College of Surgeons of
England, London. 1988
9. Lecky FE, Woodford M, Bouamra O, Yates DW, on behalf
of the Trauma Audit and Research Network. Lack of
change in trauma care in England and Wales since 1994.
Emerg Med J 2002; 19:520-3
10. Crystal R, Bleetman A, Steyn R. Ambulance crew
assessment of trauma severity and alerting
practice for trauma patients brought to a
general hospital. Resuscitation 2004; 60:279-82
11. Oakley PA, MacKenzie G, Templeton J, Cook AL, Kirby
RM. Longitudinal trends in trauma mortality and
survival in Stoke-on-Trent 1992-1998. Injury 2004;
35:379-85
12. McGinn GH, MacKenzie RE, Donnelly JA, Smith EA,
Runcie CJ. Interhospital transfer of the critically
ill trauma patient: the potential role of a specialist
transport system. J Accid Emerg Med 1996; 13:90-2
13. Cooke RS, McNicholl BP, Byrnes DP. Early
management of severe head injury in Northern Ireland.
Injury 1995; 26(6):395-7
14. Lloyd DA, Patterson M, Robson J, Phillips B.
A stratifi ed response system for the emergency
management of the severely injured. Ann R Coll Surg
Engl 2001; 83:15-20
15. Clayton TJ, Nelson RJ, Manara AR. Reduction in
mortality from severe head injury following introduction
of a protocol for intensive care management.
British Journal of Anaesthesia 2004; 93(6):761-7
16. McKeating EG, Andrews PJD, Tocher JI, Menon DK.
The intensive care of severe head injury: a survey of non-
neurosurgical centres in the United Kingdom.
British Journal of Neurosurgery 1998; 12(1):7-14
17. Lecky F, Woodford M, Yates DW. Trends in trauma
care in England and Wales 1989-1997. Lancet 2000;
355:1771-5
18. The First Decade 1990-2000. Trauma Audit and
Research Network, 2000
19. Report of the Working Party on the Management
of Patients with Head Injuries. Royal College of Surgeons
of England, London. 1999
20. Triage, assessment, investigation and early
management of head injury in infants, children
and adults: NICE guidelines, 2003
21. Darzi A. Framework for Action. 2007.
http://www.healthcareforlondon.nhs.uk/framework
_for_ action.asp
Introduction
References
17
Metho
d
Method
Study aim
The aim of this study was to examine the process of care for
severely injured patients and identify variations that affect the
achievement of agreed endpoints.
The expert group identifi ed six main thematic areas
that would address the overall aim of the study:
1. Timeliness of events making up the clinical
management process.
2. Issues associated with prehospital care at the site
of injury and transfer to hospital.
3. Issues associated with the care team that performs
the initial resuscitation.
4. Processes and procedures associated with
secondary transfers.
5. Issues associated with pathways, handovers
and communication.
6. Membership of the Trauma Audit Research Network
(TARN).
Expert group
A multidisciplinary group of experts comprising clinicians
from emergency medicine, general surgery, neurosurgery,
radiology, anaesthetics, and lay representatives contributed
to the design of the study and reviewed the combined
analysis of the data; both from the questionnaires and the
extra information from the advisory groups.
Case identifi cation
Patients were identifi ed prospectively. A nominated contact
in the emergency department identifi ed patients as severely
injured based primarily on their, and their colleagues’, clinical
judgement. A list of patients (which included a patient
identifi er and the date and time of admission) was then
forwarded to the NCEPOD local reporter who completed a
monthly spreadsheet which contained additional information
(for example, the name of the admitting clinician). Data
collection ran for three months from February 1st 2006
to April 30th 2006. Patients of all ages were eligible for
inclusion. After each month of sampling, a spreadsheet
was returned, password-protected, to NCEPOD along with
photocopies of all of the casenotes for the fi rst 72 hours
in hospital. The casenotes were used by NCEPOD staff
to calculate an injury severity score (ISS) for each patient
(see Appendix B). Patients with an ISS of 16 or more were
included in the study. The casenotes of included patients
were subsequently used for the peer review process.
Exclusions
The following patient groups were excluded:
• Death by hanging or drowning (the pathology is
asphyxia rather than trauma); and
• Patients brought in for confirmation of death.

18
It had been hoped at the outset of the study that, in addition
to these questionnaires, some information not otherwise
available regarding the prehospital management of patients
could be obtained from a questionnaire completed by
ambulance crews. However, it proved diffi cult to agree this
with ambulance services, partly due to employment contract
issues and partly due to reorganisation of ambulance trusts.
Therefore, assessment of prehospital care has been acquired
from:
a) The patient report form (PRF); completed by ambulance
crews at the scene and en route, a copy of which should
be available in the medical records.
b) Advisors’ assessments of the prehospital care following
review of both the PRF and clinical records and
questionnaires completed by the clinicians relating
to hospital management.
To complement the data available from the above
questionnaires, copies of all the casenotes for patients’
fi rst 72 hours in hospital were requested. If the patient was
transferred within 72 hours, the casenotes from the receiving
hospital were also requested.
Advisor group
A multidisciplinary group of advisors was recruited to review
the casenotes and associated questionnaires. The group of
advisors comprised clinicians from the following specialties:
emergency medicine, anaesthetics, general surgery, intensive
care medicine, maxillofacial surgery, neurosurgery, nursing,
paediatrics, plastics, orthopaedics and vascular surgery.
For each case reviewed, the advisor completed an
assessment form. This allowed both quantitative and
qualitative analysis of the advisor’s opinion.
Questionnaires and casenotes
There were three questionnaires used to collect data for
this study, two clinical questionnaires per patient and one
organisational questionnaire per site.
1. A&E clinician questionnaire
This questionnaire was sent to the A&E clinician in charge of
the patient’s initial resuscitation. Information was requested
concerning the mode and time of arrival, initial trauma
response, timeliness of investigations and hospital transfers.
2. Admitting consultant questionnaire
This questionnaire concerned information on the location
and consultant specialty to which the patient was admitted.
It also contained information on surgical procedures, patient
outcome and secondary transfers.
3. Organisational questionnaire
This questionnaire concerned data on the staff, departments,
facilities and protocols for each participating hospital.
Information was collected at the hospital level as it gave a
better indication of the facilities available for a patient at the
location where they were receiving care, rather than all the
facilities available within the trust as a whole.
The organisational questionnaire was sent to the medical
director for completion. If, after a reminder, it was not
returned to NCEPOD a copy was sent to the NCEPOD local
reporter of that hospital. Clinical questionnaires were either
sent to the NCEPOD local reporter for dissemination or
directly to the clinician involved, depending on the choice of
the hospital local reporter. However, whichever method was
used, it was requested that the completed questionnaires
were returned directly to NCEPOD.
Method

19
Specifi c sections of the assessment form were completed
by NCEPOD researchers using information extracted from
the casenotes such as the times of investigations, Airway,
Breathing, Circulation (ABC) measurements and the grades
of doctors involved in the patients’ care. The remainder of
the assessment form was completed by the advisors who
were asked to provide expert opinion on the prehospital
care, trauma response, timeliness of investigations and the
overall care of the patient.
Peer review process
All questionnaires and casenotes were anonymised by
the non-clinical staff at NCEPOD. All patient, clinician and
hospital identifi ers were removed. Neither clinical staff at
NCEPOD, nor the advisors had access to any identifi able
information.
After being anonymised each case was reviewed by one
advisor within a multidisciplinary group. At regular intervals
throughout the meeting, the chair allowed a period of
discussion for each advisor to summarise their cases and
ask for opinions from other specialties or raise aspects of a
case for discussion.
The grading system below was used by the advisors to
grade the overall care each patient received.
Metho
d
Good practice:
A standard that you would accept from yourself, your
trainees and your institution.
Room for improvement:
Aspects of clinical care that could have been better.
Room for improvement:
Aspects of organisational care that could have been
better.
Room for improvement:
Aspects of both clinical and organisational care that
could have been better.
Less than satisfactory:
Several aspects of clinical and/or organisational
care that were well below that you would accept from
yourself, your trainees and your institution.
Insuffi cient information submitted to assess the
quality of care.
20
Data analysis
Following cleaning of the quantitative data, descriptive
statistics were produced.
The qualitative data collected from the assessment form and
free text answers in the clinical questionnaires were coded
according to content and context. The data were reviewed
by NCEPOD clinical staff to identify the nature and frequency
of recurring themes.
Case studies have been used throughout this report to
illustrate particular themes.
All data were analysed using Microsoft Access and Excel by
the staff at NCEPOD.
The fi ndings of the report were reviewed by the expert
group, advisors and the NCEPOD steering group prior to
publication.
Quality and confi dentiality
A number of predetermined, mandatory key fi elds on each
questionnaire had been set to ensure that data analysis
could be performed effectively. If these key fi elds were not
completed on receipt of the questionnaire by NCEPOD, the
NCEPOD local reporter or clinician was contacted to see if
the data could be obtained.
Each case was given a unique NCEPOD number so that
cases could not easily be linked to a hospital.
The data from all questionnaires received were electronically
scanned into a preset database. Prior to any analysis taking
place, the data were cleaned to ensure that there were no
duplicate records and that erroneous data had not been
entered during scanning. Any fi elds that contained spurious
data that could not be validated were removed.
Method

21
Hospital participation
An organisational questionnaire was completed for 183/218
(83.9%) hospitals, that were expected to participate.
Patient identifi er spreadsheets
A patient identifi er spreadsheet was returned for 180/218
(82.6%) hospitals that were expected to participate. In total
this equated to 2203 patients, for which NCEPOD received
1735 (78.8%) sets of casenotes to calculate an injury severity
score (ISS). Of these 909 cases had an ISS less than 16 and
826 patients had an ISS ≥ 16, 31 of which were excluded
as they were either dead on arrival, had complications of a
previous injury or there was insuffi cient information for the
advisors to assess any aspect of the patient’s care. The
remaining 795 patients were included in the study sample.
Data o
verview1
Clinician questionnaires
The study was designed such that the overwhelming majority
of the quantitative and qualitative data could be obtained
directly from the casenotes and the focussed opinions
of the advisors’ (i.e. from the advisor assessment form).
To supplement this, the clinician responsible for the initial
resuscitation of the patient and the admitting consultant
(if applicable) were asked to complete a patient care
questionnaire. In total 513 A&E clinician questionnaires and
432 admitting consultant questionnaires were returned.
Age and gender
Seventy fi ve percent (594/795) of the patients were males,
and the mean age of the whole sample was 39.6 years. The
mode age of the study sample was 18; one in six (128/795)
patients being 16 – 20 years old (Figure 1).
CHAPTER 1 - Data overview
0
20
40
60
80
100
120
140
0 -5
6 -10
11 -15
16 -20
21 -25
26 -30
31 -35
36 -40
41 -45
46 -50
51 -55
56 -60
61 -65
66 -70
71 -75
76 -80
81 -85
86 -90
91 -95
Age (years)
Num
ber o
f pat
ient
s
Figure 1. Age range of patient sample

22
Day and time of arrival
The number of severely injured patients presenting to the
emergency department peaked on Friday and Saturday
(Figure 3).
The rise in number of patients on Friday and Saturday was
largely due to an increase in patients arriving at night (‘out
of hours’) at the weekend (see Table 2). Daytime admissions
were largely constant and were actually lower than the
weekly average on Friday and Saturday. The mean age of the
patients who presented out of hours on Friday, Saturday and
Sunday was considerably lower than the remainder of the
population: 33.5 years compared to 42.3 years.
Figure 2 shows the age range analysed by gender. The mean
age for males was 38 and mean age for females 44. There
was a peak in frequency for males aged 16-25.
Of the patients in the study 56.3% (442/785) were involved in
a road traffi c collision (RTC) (Table 1).
Table 1. Mechanism of injury
Number of patients %
RTC (driver/passenger) 319 40.6
RTC (pedestrian) 123 15.7
Fall from height 136 17.3
Assault 72 9.2
Industrial/agricultural 21 2.7
Sport/leisure 18 2.3
Self harm 15 1.9
Other 81 10.3
Subtotal 785
Not recorded 10
Total 795
CHAPTER 1 - Data overview
0
10
20
30
40
50
60
70
80
90
100
0 - 5
6 - 10
11 - 15
16 - 20
21 - 25
26 - 30
31 - 35
36 - 40
41 - 45
46 - 50
51 - 55
56 - 60
61 - 65
66 - 70
71 - 75
76 - 80
81 - 85
86 - 90
91 - 95
Age (years)
Num
ber
of p
atie
nts Male
Female
Figure 2. Age range of patient sample by gender

23
Table 2. Patient arrivals by time of day and day of week
Day 08.00-17.59 Night 18.00-07.59
SubtotalTime of day
not recorded Total% %
Mon 41 47.1 46 52.9 87 2 89
Tue 56 63.6 32 36.4 88 3 91
Wed 59 53.6 51 46.4 110 1 111
Thu 54 49.1 56 50.9 110 0 110
Fri 50 44.6 72 59.0 122 4 126
Sat 46 32.2 97 67.8 143 4 147
Sun 38 36.9 65 63.1 103 13 116
Subtotal 344 419 763 27 790
Day not recorded 0 0 0 5 5
Total 344 419 763 32 795
Data o
verview
0
20
40
60
80
100
120
140
160
MON TUE WED THU FRI SAT SUN Notrecorded
Day
Num
ber o
f pat
ient
s
Figure 3. Patient arrivals by day of week
1

24
Table 5. Patient outcome at 72 hours by ISS
ISS Alive Deceased Total % Mortality
16 – 24 411 38 449 8.5
25 – 35 220 59 269 21.9
36 – 75 47 20 67 29.9
Total 678 117 795 14.7
The 72 hour outcome for each ISS group is shown in Table 5.
There was an increased mortality with increased injury
severity.
Table 6. Injuries by body region (answers may be multiple)
Number of patients
Head 493
Face 191
Neck 14
Thorax 388
Abdomen and pelvic contents 143
Spine 162
Upper extremity 224
Lower extremity 289
External 82
Table 6 summarises the injuries by body region.
Mode of arrival
Table 3. Mode of arrival to hospital
Number of patients %
Ambulance 652 83.3
Helicopter 92 11.7
Other emergency service 5 <1
Hospital transfer 9 1.1
Member of public 13 1.7
Self referral 8 1.0
Other 4 <1
Subtotal 783
Not recorded 12
Total 795
The majority of patients 652/783 (83.3%) were transported
to hospital by road ambulance. A further 92/783 (11.7%)
patients arrived by helicopter. Only 25 patients arrived by
means other than an emergency service vehicle (Table 3).
Injury severity scores
Table 4. Injury severity score
Number of patients %
16 – 24 449 56.5
25 – 35 279 35.1
36 – 75 67 8.4
Total 795
Table 4 summarises the ISS of the study patient population.
CHAPTER 1 - Data overview

25
This chapter summarises the collated data from the
183 hospitals that returned a completed organisational
questionnaire. It provides the reader with an overview of the
departments, facilities, staff and protocols that were available
for the care of severely injured patients during the study
period.
Departments and procedures
Table 7 summarises the departments and/or procedures
that were available at the participating hospitals. It should
be noted that some hospitals without a specifi c department
e.g. vascular surgery, did have staff that were able to perform
surgical procedures related to that specialty.
The most striking, albeit well known fact, was the small
number of hospitals that had a neurosurgery department
(31) or performed neurosurgical procedures (a further
Org
anisational d
ata
seven hospitals). This is of particular concern given the
large number of severely injured patients who suffered
neurotrauma as part of their constellation of injuries (over
60% of patients in this study). The availability in patient
services is also refl ected in the Transfer chapter later in this
report. By far the most common reason for a secondary
transfer was the requirement for neurosurgery and/or
neurological monitoring. Time to defi nitive neurosurgical
intervention can be a major determinant of outcome for
patients with traumatic brain injury and the requirement
for a secondary transfer to access neurosurgical services
lengthens this time (see Time to surgery page 106).
More than half of the patients in the current study presented
to the emergency department out of hours. Furthermore,
many required immediate treatment. While in the large
majority of hospitals procedures were available for
orthopaedic trauma (168/173) and general surgery (166/173)
out of hours, immediate intervention for more specialised
injuries was often not available.
CHAPTER 2 - Organisational data
Table 7. Overview of departments and procedures
Department on site
Department not on site but specialty procedures available Subtotal
Not answered Total
Yes Yes No
Orthopaedic trauma 166 7 9 182 1 183
Neurosurgery 31 7 132 170 13 183
General surgery 173 2 7 182 1 183
Vascular surgery 131 15 33 179 4 183
Plastic surgery 44 30 98 172 11 183
Cardiac surgery 28 7 136 171 12 183
Thoracic surgery 31 24 115 170 13 183
Maxillofacial surgery 111 13 53 177 6 183
ENT 137 14 28 179 4 183
Urology 153 13 15 181 2 183
Vascular interventional radiology 108 19 47 174 9 183
2

26
Twenty four hour accessibility was defi ned as a facility which
can be fully staffed and functional when required anytime of
day or night. Thirty four hospitals reported that they did not
have x-ray with immediate reporting meeting this defi nition
(Table 9). Such a fundamental facility should be available at
all times at every hospital that has the potential to receive a
severely injured patient.
Whilst 161/169 (95.3%) hospitals had CT scanning that
met the 24 hour defi nition, only 97/169 (57.4%) had the
scanners located adjacent to the emergency department
The availability of multiple specialty treatment was further
analysed. It is clear from Table 8 that regional planning of
trauma services should consider the availability of services
at each hospital and consider whether it is appropriate to
take some severely injured patients to hospitals without a
full range of services, available at all times. Only 17 hospitals
that participated in this study could have been considered for
Level 1 verifi cation as a Trauma Centre (see Appendix E).
CHAPTER 2 - Organisational data
Table 8. Availability of multiple 24 hour treatment
Emergency department
Emergency department
Emergency department
Emergency department
Emergency department
Emergency department
Emergency department
General surgery
General surgery
General surgery
General surgery
General surgery
General surgery
Orthopaedic trauma
Orthopaedic trauma
Orthopaedic trauma
Orthopaedic trauma
Orthopaedic trauma
Vascular surgery
Vascular surgery
Vascular surgery
Vascular surgery
Neurosurgery Cardiac or Thoracic surgery
Neurosurgery
Cardiac or Thoracic surgery
183 166 159 90 23 33 17
Table 9. X-ray with immediate reporting by proximity to emergency department and 24 hour accessibility
24 hour accessibility
Proximity Yes No Subtotal Not answered Total
Adjacent 112 25 137 9 146
Onsite not adjacent 15 7 22 1 23
Offsite 0 2 2 0 2
Subtotal 127 34 161 10 171
Not answered 2 4 6 6 12
Total 129 38 167 16 183

27
(Table 10). Since the risk to a patient’s stability is increased
during movement, close proximity of the CT scanner to the
patient in the emergency department is of huge importance.
It should be noted that advisors and clinicians completing
questionnaires frequently indicated that a patient could not
be scanned because of their instability. It is likely that this
scenario could be improved by the relocation of CT scanners
into the resuscitation room.
In accordance with The Royal College of Radiologists’
technical standards for CT1 there appears to have been a
fairly good investment in CT scanner technology, as 117/145
(80.7%) hospitals that answered the question reported
having a scanner less than six years old (Table 11). The
remaining 28 hospitals should consider updating their CT
scanner in line with newer technology.
Table 12 demonstrates excellent access to a blood bank
from emergency departments.
Org
anisational d
ata
Table 11. Age of CT scanners (years)
Number of hospitals %
0 11 7.6
1 28 19.3
2 21 14.5
3 13 9.0
4 21 14.5
5 23 15.9
6 10 6.9
7 8 5.5
8 3 2.1
9 5 4.9
10 2 1.4
Subtotal 145
Not answered 38
Total 183
Table 10. CT scanner and access to immediate reporting; proximity to emergency department and 24 hour accessibility
24 hour accessibility
Proximity Yes No Subtotal Not answered Total
Adjacent 93 4 97 6 103
Onsite not adjacent 68 4 72 4 76
Subtotal 161 8 169 10 179
Not answered 2 0 2 2 4
Total 163 8 171 12 183
Table 12. Blood bank location and 24 hour accessibility
24 hour accessibility
Proximity Yes No Subtotal Not answered Total
Adjacent 19 0 19 3 22
Onsite not adjacent 145 0 145 10 155
Offsite 2 0 2 1 3
Subtotal 166 0 166 14 180
Not answered 0 0 0 3 3
Total 166 0 166 17 183
2

28
Table 15. Equipment available to each resuscitation bay
Number of hospitals
Anaesthetic machine/head 136
Diffi cult intubation trolley 149
Positive pressure ventilator 166
SpO2 monitoring 182
FeCO2 monitoring 158
Central venous pressure monitoring
171
Arterial pressure monitoring 170
Surgical set 146
Cricothyroidotomy set 178
Intercostal drain set 180
Tracheosotomy set 165
Diagnostic peritoneal lavage 144
Cut down set 177
External pelvic fi xation set 48
Foley catheter 182
Nasogastric tube 183
Obstetric wedge 87
Rapid infusion equipment 147
Fluid warming equipment 171
Rhesus negative blood 112
Defi brillator 181
Focused Assessment with Sonography for Trauma
61
Portable x-ray 165
Fixed gantry x-ray 56
Portable or fi xed gantry x-ray 183
Table 13. 24 hour access to haematology and biochemistry investigations
Haematology Biochemistry
Yes 165 165
No 1 0
Subtotal 166 165
Not answered
17 18
Total 183 183
Table 14. Number of resuscitation bays
Number of hospitals %
1 5 2.7
2 19 10.4
3 46 25.3
4 60 33.0
5 29 15.9
6 18 9.9
> 6 5 2.7
Subtotal 182
Not answered 1
Total 183
Only one hospital was reported not to have access to 24
hour haematology investigations, however a further 17 sites
failed to answer the question (Table 13). This fi nding was
similar for the 24 hour accessibility to biochemistry.
The resuscitation bay provides an area and an array of
equipment that are essential for the immediate treatment of
patients. Since there are often two or more victims from one
road traffi c collision (RTC), and other seriously ill patients also
need to be treated in this location, it is important to note that
70 hospitals had less than four resuscitation bays
(Table 14).
CHAPTER 2 - Organisational data
29
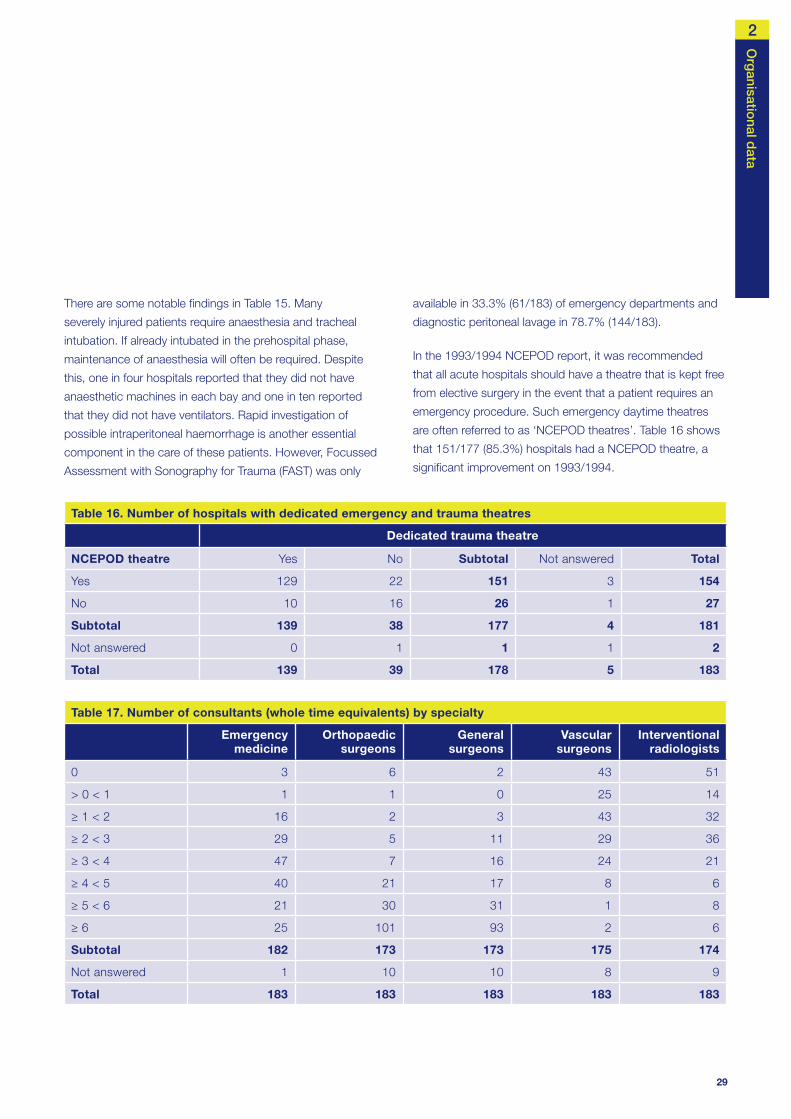
There are some notable fi ndings in Table 15. Many
severely injured patients require anaesthesia and tracheal
intubation. If already intubated in the prehospital phase,
maintenance of anaesthesia will often be required. Despite
this, one in four hospitals reported that they did not have
anaesthetic machines in each bay and one in ten reported
that they did not have ventilators. Rapid investigation of
possible intraperitoneal haemorrhage is another essential
component in the care of these patients. However, Focussed
Assessment with Sonography for Trauma (FAST) was only
Org
anisational d
ata
available in 33.3% (61/183) of emergency departments and
diagnostic peritoneal lavage in 78.7% (144/183).
In the 1993/1994 NCEPOD report, it was recommended
that all acute hospitals should have a theatre that is kept free
from elective surgery in the event that a patient requires an
emergency procedure. Such emergency daytime theatres
are often referred to as ‘NCEPOD theatres’. Table 16 shows
that 151/177 (85.3%) hospitals had a NCEPOD theatre, a
signifi cant improvement on 1993/1994.
Table 16. Number of hospitals with dedicated emergency and trauma theatres
Dedicated trauma theatre
NCEPOD theatre Yes No Subtotal Not answered Total
Yes 129 22 151 3 154
No 10 16 26 1 27
Subtotal 139 38 177 4 181
Not answered 0 1 1 1 2
Total 139 39 178 5 183
Table 17. Number of consultants (whole time equivalents) by specialty
Emergency medicine
Orthopaedic surgeons
General surgeons
Vascular surgeons
Interventional radiologists
0 3 6 2 43 51
> 0 < 1 1 1 0 25 14
≥ 1 < 2 16 2 3 43 32
≥ 2 < 3 29 5 11 29 36
≥ 3 < 4 47 7 16 24 21
≥ 4 < 5 40 21 17 8 6
≥ 5 < 6 21 30 31 1 8
≥ 6 25 101 93 2 6
Subtotal 182 173 173 175 174
Not answered 1 10 10 8 9
Total 183 183 183 183 183
2
30
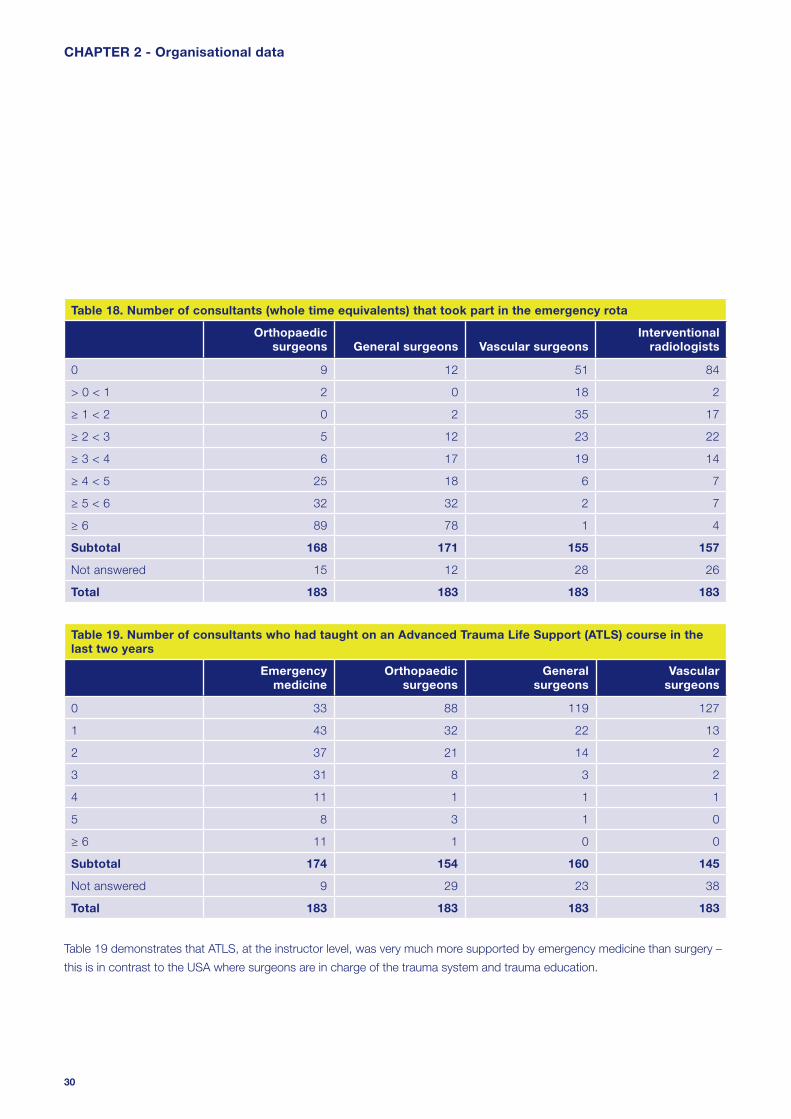
Table 19 demonstrates that ATLS, at the instructor level, was very much more supported by emergency medicine than surgery –
this is in contrast to the USA where surgeons are in charge of the trauma system and trauma education.
CHAPTER 2 - Organisational data
Table 18. Number of consultants (whole time equivalents) that took part in the emergency rota
Orthopaedic surgeons General surgeons Vascular surgeons
Interventional radiologists
0 9 12 51 84
> 0 < 1 2 0 18 2
≥ 1 < 2 0 2 35 17
≥ 2 < 3 5 12 23 22
≥ 3 < 4 6 17 19 14
≥ 4 < 5 25 18 6 7
≥ 5 < 6 32 32 2 7
≥ 6 89 78 1 4
Subtotal 168 171 155 157
Not answered 15 12 28 26
Total 183 183 183 183
Table 19. Number of consultants who had taught on an Advanced Trauma Life Support (ATLS) course in the last two years
Emergency medicine
Orthopaedic surgeons
General surgeons
Vascular surgeons
0 33 88 119 127
1 43 32 22 13
2 37 21 14 2
3 31 8 3 2
4 11 1 1 1
5 8 3 1 0
≥ 6 11 1 0 0
Subtotal 174 154 160 145
Not answered 9 29 23 38
Total 183 183 183 183

31
Org
anisational d
ata
The management of trauma patients requires a
multidisciplinary approach. However, at the time of this study
there was a lack of specialist interest in trauma across the
specialties (Table 20). This may well be a refl ection of the
low trauma workload which makes it diffi cult to develop
and maintain a special interest in this area, given the current
confi guration of trauma services.
To explore the apparent lack of specifi c consultant interest in
trauma further, we looked at the 33 hospitals that performed
neurosurgical procedures at all times. Table 21 demonstrates
that even in those hospitals with neurosurgery, other than
interest from orthopaedic surgeons there was little specialist
interest in trauma. This is important as it has been proposed
that hospitals with neurosurgery could form the basis of
regional trauma centres2.
Table 22 illustrates the number of hospitals which had a
formal trauma team and whether or not ATLS courses were
run onsite. One hundred and forty three hospitals (78.1%)
had a formal trauma team, and 82 (44.8%) indicated that
they ran ATLS courses onsite. It is diffi cult to comprehend
the fi nding that 16 hospitals that ran ATLS courses did not
have a formal trauma team; a key component of ATLS.
Table 20. Number of consultants who had a specialist interest in trauma
Orthopaedic surgeons
General surgeons
Vascular surgeons
Interventional vascular radiologists
0 66 137 128 123
1 25 10 13 12
2 9 5 6 10
3 9 5 2 4
4 9 1 3 2
5 7 3 0 0
≥ 6 39 6 0 0
Subtotal 164 167 152 151
Not answered 19 16 31 32
Total 183 183 183 183
Table 21. Hospitals that perform neurosurgical procedures at all times and consultants with a specialist interest in trauma
Number of hospitals
Orthopaedic surgeons 24
General surgeons 5
Vascular surgeons 6
Vascular interventional radiologists 5
Table 22. Formal trauma team/response associated with an ATLS course run onsite
Formal trauma team
ATLS courses Yes No Total
Yes 66 16 82
No 77 24 101
Total 143 40 183
2

32
Table 24. Communication and handovers
Written protocol for handing over care
Clinical teams Clinical specialties
% %
Yes 59 33.1 51 29.1
No 119 66.9 124 70.9
Subtotal 178 175
Not answered
5 8
Total 183 183
Over a third (65/183) of hospitals indicated that they did not
allocate a named person for communicating with the patient/
relatives. This insuffi ciency was refl ected by the individual
cases. Where the advisors felt they were able to assess the
level of communication with the patient/relatives, 31.4%
(141/449) of cases were found to be less than satisfactory
for quantity and quality of communication. This clearly
indicates that a named person of appropriate seniority
must be nominated to the patient/relatives as a point of
contact. Communication with the patient/relatives must be
documented to allow all involved with the care of the patient
to be aware of the occurrence and content of
this communication.
The majority (134/143) of hospitals with a formal trauma
team had a written protocol for activating a trauma response.
To determine who would respond to a severely injured patient
out of hours, we asked for a list of the grades, specialties,
ATLS and residency status, for each of the clinicians who
were on call on Sunday February 5th 2006 at 2am.
Despite the recommendation that the trauma team leader
should be a consultant3, the majority of hospitals (118/183) did
not have consultant presence for the management of major
trauma during the early hours of Sunday morning on February
5th 2006. Furthermore, in only six cases was the consultant
a resident and thus immediately available (Table 23).
Immediate airway control is vital. Only 111/183 hospitals
(60.7%) had an anaesthetic SpR or above immediately
available. Trauma airways are likely to be diffi cult and an
anaesthetic SpR or above should be present immediately in
the emergency department.
The management of the severely injured patient can be
extremely challenging and rapid, accurate communication of
all aspects of care is essential. This is particularly important
given that many different specialties may be involved. It can
be seen from Table 24 that only 51/175 hospitals had written
protocols covering this important area.
CHAPTER 2 - Organisational data
Table 23. Specialty of trauma team by residency
Consultant Emergency Medicine
SpR or above Anaesthetic SpR
or above Surgical SpR or
above
% % % %
Resident 6 3.3 109 59.6 111 60.7 86 47.0
Non resident 59 32.2 36 19.7 13 7.1 34 18.6
Not present 118 64.5 38 20.8 59 32.2 63 34.4
Total 183 183 183 183

33
Org
anisational d
ata
References
1. http://www.rcr.ac.uk/docs/radiology/worddocs/
RCRStandardsforCT11thNov2003webed.doc
2. A Darzi. Framework for Action. 2007.
http://www.healthcareforlondon.nhs.uk/framework
_for_ action.asp
3. The Royal College of Surgeons of England and the British
Orthopaedic Society. Better Care for the Severely Injured.
2000
Many severely injured patients are taken to hospitals that
do not have the staff or facilities to provide defi nitive care.
In this study only 17 hospitals had the range of
specialities available to be considered for a Level 1
Trauma Centre (under the verifi cation system of the
American College of Surgeons).
39.3% (72/183) of hospitals did not have a resident
anaesthetist at SpR level or above.
65% (118/183) of hospitals stated that a consultant was
not involved in the initial care of a severely injured patient
who presented at 0200 on Sunday 5th February 2006.
Key fi ndings
There is a need for designated Level 1 trauma centres
and a verifi cation process needs to be developed
to quality assure the delivery of trauma care (as has
been developed in USA by the American College of
Surgeons). (Royal College of Surgeons of England,
College of Emergency Medicine)
All hospitals receiving trauma cases should have at least
four resuscitation bays. (Hospital trusts)
All hospitals receiving trauma patients should have a
resident SpR or above with the skills to immediately
secure the airway in trauma patients. (Hospital trusts)
There should be a CT scanner within or adjacent to the
resuscitation room. (Hospital trusts)
Each trust involved in trauma care should develop a
core group of clinicians with a special interest in trauma
management. This trauma care delivery group should
include a member of the trust executive staff. (Hospital trusts)
Recommendations
2

34
0
100
200
300
400
Good practice Room forimprovement -
clinical
Room forimprovement -organisational
Room forimprovement -
clinical andorganisational
Less thansatisfactory
Insuff icientdata
Num
ber o
f pat
ient
s
Figure 4. Overall assessment of care (advisors’ view)
0
10
20
30
40
50
60
70
Good practice Room forimprovement -
clinical
Room forimprovement -organisational
Room forimprovement -
clinical andorganisational
Less thansatisfactory
Insufficient data
Perc
enta
ge o
f gro
up
1-5
6-10
11-20
>20
Figure 5. Number of patients per hospital vs. advisors’ overall assessment
Overall assessment by volume of cases
Figure 5 shows the overall assessment of care analysed by
the volume of cases each hospital reported to NCEPOD
during the study period. Hospitals that reported greater than
20 patients during the study period had a higher percentage
of cases classed as good practice than centres that reported
fewer cases (57% v 39%).
CHAPTER 3 - Overall assessment
All cases
Figure 4 shows the advisors’ assessment of overall
quality of care for the whole study population. More than
half the patients (415/795) were subjected to less than
good practice. There was greater room for improvement
in organisational (180/795) rather than clinical (129/795)
aspects of care.

35
Appropriateness of initial hospital response
The advisors were asked to assess the initial response to the
trauma patient. Table 25 shows that 94/699 (13.4%) cases,
where the advisors could make an assessment, were graded
as having an inappropriate initial response. In a further
96/795 cases there was insuffi cient data to comment.
Appropriateness of initial response by grade of staff
Table 26 shows the appropriateness of initial response in
cases where the grade of staff involved could be determined.
When these data were considered by grade of the fi rst
clinical reviewer at the hospital a clearer picture emerged and
the percentage of inappropriate responses rose from 3.1%
when consultants were the fi rst reviewer to 23.5% when
SHOs were the fi rst reviewer.
Appropriateness of initial hospital response and overall care
Table 27 shows only those patients who were classifi ed as
having an inappropriate initial response (94/699 from Table
25). Only a handful of the cases (8/94) were graded as
having good overall care. In addition 17/94 received less
than satisfactory care in the view of the advisors.
Table 27 refl ects the importance of the initial response in
the view of the advisors; both in terms of clinical decision
making, and overall care for the severely injured patient.
If the initial in-hospital phase of trauma care is not good
then the remainder of the patient journey is more likely to
be sub-standard.
Overall assessm
ent
Table 25. Appropriate initial response
Number of patients %
Yes 605 86.6
No 94 13.4
Subtotal 699
Insuffi cient data 96
Total 795
Table 26. Appropriateness of the response by grade of reviewer
Appropriate response
Grade of fi rst reviewer
Yes No Total
% %
Consultant 154 96.9 5 3.1 159
NCCG 16 84.2 3 15.8 19
SpR 204 88.3 27 11.7 231
SHO 52 76.5 16 23.5 68
Total 426 51 477
Table 27. Overall assessment in patients with inappropriate initial response
Number of patients %
Good practice 8 8.5
Room for improvement – clinical
28 29.8
Room for improvement – organisational
17 18.1
Room for improvement – clinical and organisational
21 22.3
Less than satisfactory 17 18.1
Insuffi cient data 3 3.2
Total 94
3

36
CHAPTER 3 - Overall assessment
Less than half (47.7%) of the patients in this study
received good care.
Patients were more likely to receive good care in centres
that reported a high volume of cases (>20) compared to
a low volume of cases (<20) – 57% v 39%.
13.4% of cases had an inappropriate initial hospital
response. It was much more likely to be an inappropriate
response if the team leader/fi rst reviewer was an SHO
(23.5%) than a consultant (3.1%).
If the initial hospital response was inappropriate, it was
more likely that the patient’s overall care would be
compromised.
Key fi ndings

37
Introduction
The administration of high quality prehospital care is vital in
any system of trauma care. Prioritisation and management
of life threatening injuries, coupled with rapid transfer to
defi nitive care in an appropriately equipped trauma unit
are the mainstay of this phase of the trauma system. The
emphasis on prehospital care versus rapid transfer varies
between countries, with little evidence of one system
having advantages over the other1. However, it must be
emphasised that there is no dichotomy between prehospital
care and rapid transfer as all care should be tailored to deal
with the patient’s injuries and any consequent physiological
derangements. Patients undergoing rapid transfer must still
receive appropriate prehospital care.
Trauma systems are primarily geared towards the
management of small and manageable numbers of
casualties, which do not overwhelm the local resources
available. Special measures are required when the number
of casualties exceeds the capacity of the local resources. In
this event, a major incident will be declared, and a multi-
agency predetermined major incident plan will be initiated.
Such a plan is necessary to ensure a high standard of care
is delivered to all patients presenting as part of a major
incident. In this study there were 12 cases reported where
it was indicated on the questionnaire that a “major incident”
had occurred2. However, on more detailed examination of
the casenotes, none of these cases arose in situations which
fulfi lled the requirements of the defi nition of a major incident
and in no case was a major incident formally declared. Since
none of the patients in this study were involved in a major
incident, it would be expected that resources should have
been suffi cient to provide the usual standard of care.
Preho
spital care
As mentioned in the methods section, it had been hoped
that some additional information regarding the prehospital
management of patients could be obtained from a
questionnaire completed by ambulance crews. However, it
proved diffi cult to agree this with ambulance services, partly
due to employment contract issues and partly due to the
re-organisation of ambulance trusts.
Organisational aspects of care
Prehospital documentation
In a third of cases (245/749), the ambulance patient report
form (PRF) was not available. Data in this chapter therefore
refers to the 504 cases where a PRF was returned. This is an
important healthcare record which provides treating clinicians
with vital prehospital information regarding the incident and
prehospital management. This form could also provide a
structure to ensure that protocols of prehospital management
are followed, and that data relevant to subsequent service
audit are accurately recorded. Unfortunately, there was no
uniformity between ambulance trusts; with wide variation in
the content of PRFs. Appendix D demonstrates an example
of an excellent PRF. It should be noted that the PRF is often
a non-standard size which does not fi t into the hospital
casenotes and, therefore, it may become misplaced.
CHAPTER 4 - Prehospital care
4

38
Response time and outcome
It is often said that rapid response times are essential and
associated with better outcomes although it is diffi cult to fi nd
data to support this statement. Table 28 shows mortality rate
at 72 hours post injury against response time.
In this study there was no clear evidence to support the
association of response time with better outcome. Indeed the
group with the fastest response time (0-5min) did not have a
lower mortality than the rest of the population (Table 28).
Response times
Response times from the time of the emergency call to arrival
at the scene of accident varied. This information, analysed by
time of day, is shown in Figure 6. The mean response time
for day, evening and night was 12.5, 11.6 and 10.1 minutes
respectively.
Overall there were better response times at night, although it
is doubtful if this is of clinical relevance.
CHAPTER 4 - Prehospital care
0
2
4
6
8
10
12
14
Day Evening Night
Tim
e (m
inut
es)
Figure 6. Time from emergency call to scene of accident (daytime is defi ned as 08.00–17.59, evening from 18.00-23.59 and night time from 00.00-07.59)
Table 28. Prehospital response times (minutes) and patient outcome at 72 hours
Alive Deceased Total % mortality
0-5 72 20 92 21.7
6-10 111 18 129 14.0
11-15 66 12 78 15.4
16-20 40 6 46 13.0
21-25 24 6 30 20.0
26-30 7 2 9 22.2
> 30 11 2 13 15.4

39
Mode of arrival
The mode of arrival is shown in Table 29.
Table 29. Mode of arrival
Number of patients %
Ambulance 652 83.3
Helicopter 92 11.7
Other emergency service 5 <1
Hospital transfer 9 1.1
Member of public 13 1.7
Self referral 8 1.0
Other 4 <1
Subtotal 783
Not recorded 12
Total 795
Preho
spital care
Effect of time on mode of arrival
Figure 7 shows that helicopters were much less likely to
be employed at night. Approximately 75% of helicopter
transfers occurred during daytime hours.
0
10
20
30
40
50
60
70
80
90
Day Night Day Night
Emergency call Arrival at hospital
Perc
enta
ge
Ambulance
Helicopter
Figure 7. The effect of time of day on the employment of helicopters (daytime was defi ned as 08.00–17.59 and night time from 18.00-07.59)
4
40
Transport system and prehospital timings
The role of helicopters in the management of trauma patients
remains controversial4. Some trauma victims may benefi t but
others may not. Previous studies in the USA have suggested
that total times from alert to arrival at hospital are signifi cantly
longer in all types of location by helicopter as opposed to
road ambulance5.
There was a greater time to reach hospital from the time
of the emergency call, and an increased time spent at the
scene of the incident, for those patients transported by
helicopter (Figure 9).
The longer time spent at the scene for patients transported
by helicopter could, in part, be attributed to the greater
likelihood of there being a doctor on the scene, and of the
patient being intubated before transfer. We were unable
to identify which cases were attended by doctors or
paramedics.
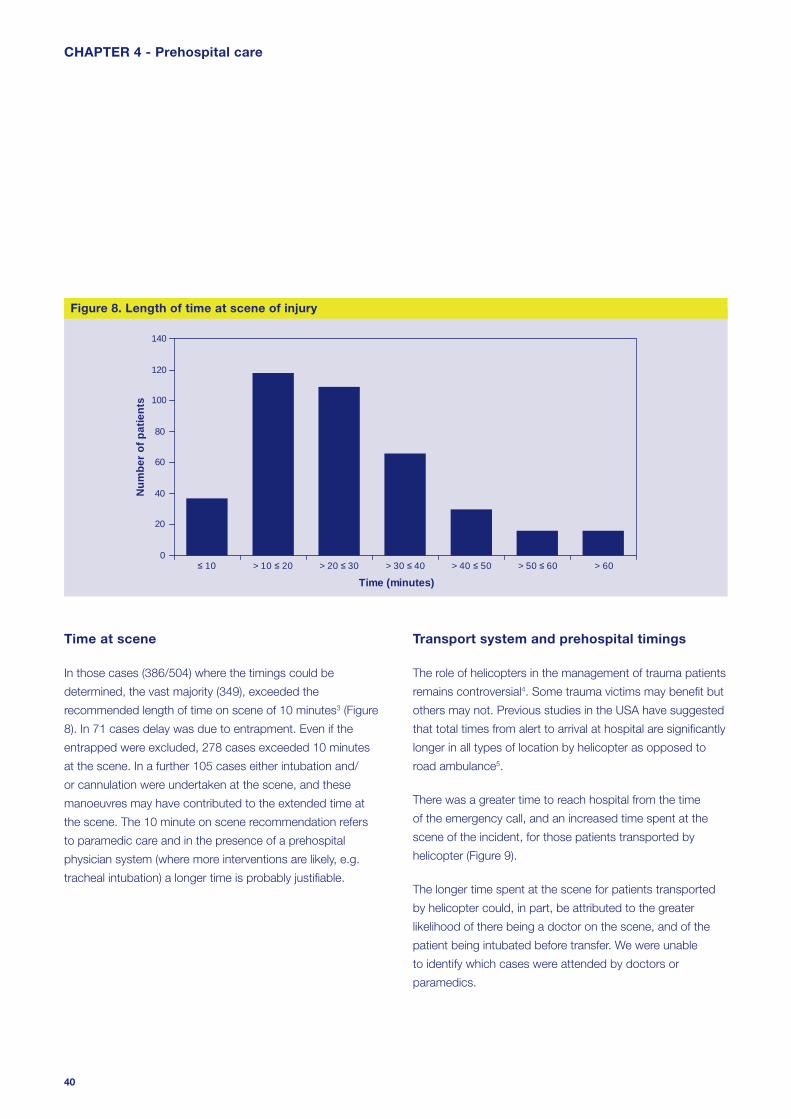
Time at scene
In those cases (386/504) where the timings could be
determined, the vast majority (349), exceeded the
recommended length of time on scene of 10 minutes3 (Figure
8). In 71 cases delay was due to entrapment. Even if the
entrapped were excluded, 278 cases exceeded 10 minutes
at the scene. In a further 105 cases either intubation and/
or cannulation were undertaken at the scene, and these
manoeuvres may have contributed to the extended time at
the scene. The 10 minute on scene recommendation refers
to paramedic care and in the presence of a prehospital
physician system (where more interventions are likely, e.g.
tracheal intubation) a longer time is probably justifi able.
CHAPTER 4 - Prehospital care
0
20
40
60
80
100
120
140
≤ 10 > 10 ≤ 20 > 20 ≤ 30 > 30 ≤ 40 > 40 ≤ 50 > 50 ≤ 60 > 60
Time (minutes)
Num
ber o
f pat
ient
s
Figure 8. Length of time at scene of injury

41
Transport system and prehospital airway management
From the cases where it could be determined, 23/56 (41.1%)
patients transported by helicopter were intubated at the
scene versus 32/440 (7.3%) of those patients transported
by ambulance. Additionally it was found that a greater
percentage of patients transported by ambulance arrived at
hospital with a noisy or blocked airway compared with those
transported by helicopter (52/380; 13.7% v 3/54; 5.6%).
Patients treated and transferred by a helicopter system had a
greater chance of defi nitive airway control than those treated
and transferred by a road ambulance system.
Preho
spital care
Transport system and severity of injuries
The severity of injuries in both groups was comparable
(Table 30).
Table 30. Transport system by injury severity score
Road ambulance Helicopter
ISS Number of patients
Number of patients
% %
16 - 24 240 54.5 31 52.5
25 - 35 156 35.5 20 33.9
36 - 75 44 10.0 8 13.6
Total 440 59
0
10
20
30
40
50
60
70
80
90
Time to hospital from emergency call Length of time at scene
Tim
e (m
inut
es)
ambulance
helicopter
Figure 9. Average response times and time at scene: ambulance vs. helicopter
4

42
55.2mins). However, the patient was more likely to be intubated
(41.1% v 7.3%), less likely to arrive at hospital with a completely
or partially blocked airway, more likely to be triaged to an
appropriate hospital (100% v 93%) and less likely to require a
secondary transfer (11.9% v 25.5%).
Clinical aspects of care
Primary and secondary survey
In the majority of patients, a primary survey was conducted
at the site of the incident, en route or at some unspecifi ed
stage prior to arrival at hospital.
Table 31. Primary and secondary survey performed
Primary Secondary
% %
Yes at scene 248 52.4 169 60.6
Yes en route 5 1.1 30 10.8
Yes unknown 220 46.5 80 28.7
Subtotal 473 279
Not recorded 31 225
Total 504 504
However, in 31/504 (6.2%) cases, there was no record of a
primary survey having been completed (Table 31).
In 199/504 cases a secondary survey was known to have
been performed in the prehospital phase. In nearly half of
cases the secondary survey was not recorded.
It is not clear why so many patients had a secondary survey
performed, as the priority in the prehospital phase should
be a good primary survey and attention to any immediate
Transport system and secondary transfer rate
The likelihood of requiring a secondary transfer was lower if the
patient’s mode of arrival was by helicopter than for those patients
who arrived by road ambulance. Only 7/59 (11.9%) patients
required a secondary transfer in the helicopter group compared
with 112/440 (25.5%) transported initially by road ambulance.
Transport system and appropriateness of initial hospital
It was judged that all of the patients transported by helicopter
were taken to an appropriate hospital. However, it was
deemed that 31/440 (7%) patients transported by road
ambulance were taken to an inappropriate fi rst hospital.
Transport systems – summary
Overall, the picture regarding mode of transport is complex.
There is a potential danger in making assumptions regarding the
appropriateness of the mode of transport in any individual case
if conclusions are drawn from aggregated data derived from
a heterogeneous population. Helicopters should not only be
considered as a mode of transport, but also as a system of care
with the potential to deliver rapidly to the scene of the incident
a doctor with suffi cient expertise to manage these challenging
patients. However, given the signifi cant expense involved in
operating helicopters, it is important that a careful and detailed
audit of the value of helicopter transport is undertaken.
In summary, helicopter transport was used for 11.7% of the
severely injured patients in this study, with most episodes taking
place in daylight hours. Treatment and transport by a helicopter-
based team compared to a ground ambulance-based team
was associated with a longer on scene time (36.9 minutes v
25.3 minutes) and a longer total prehospital time (77.4mins v
CHAPTER 4 - Prehospital care

43
problems with the airway, cervical spine, breathing and
circulation as the prime focus. Repeated evaluation of these
aspects of care is required en route to hospital and while a
secondary survey may provide valuable information regarding
the patient’s overall condition, it must not distract from this.
Airway and ventilation
Airway status at scene
In 85/504 cases it was recorded that the airway was either
partially (noisy) or completely obstructed (blocked) (Table 32).
Table 32. Airway status
Number of patients %
Clear 343 80.1
Noisy 46 10.7
Blocked 39 9.1
Subtotal 428
Not recorded 76
Total 504
Preho
spital care
Prehospital intubation
Twenty two of the patients with airway obstruction were
intubated at the scene. Attempted intubation failed in six
patients at the scene but all were successfully intubated in
the emergency department. A further 34 patients, for whom
the airway status was clear or not recorded, were intubated
at the scene (56 in total). However, three more failed
attempts were documented in this group.
Monitoring and oxygen therapy
The respiratory rate is an important indicator of respiratory
function and of shock. Respiratory rate was not recorded in
65/504 (13%) patients (Figure 10).
Oxygen therapy was administered to 372/504 (73.8%)
patients, but was not documented as being administered in
the remaining 132 cases. The use of assisted ventilation was
poorly documented.
0
100
200
300
400
500
Respiratory rate SpO2 O2 therapy
Num
ber o
f pat
ient
s
YesNot documented
Figure 10. Documentation of prehospital airway and ventilatory management
4

44
basic airway manoeuvres have failed. Paramedics in Britain
do not use anaesthetic drugs or muscle relaxants to achieve
intubation and, therefore, can only attempt this in the most
obtunded patients.
The literature points to a high mortality in the prehospital phase
when trauma patients are intubated without the need for
anaesthesia6, 7. This probably refl ects the severity of their injuries,
in that they can tolerate laryngoscopy and intubation without
anaesthesia, rather than the effect of the procedure itself.
The literature is confusing with regards to the effects of
prehospital intubation of trauma patients. Some studies have
shown increased mortality whilst others have shown benefi t8-
11. It is diffi cult to separate the effects of underlying injuries,
anaesthesia, skill and experience of the intubator from the
possible benefi ts or side effects of the procedure.
A recent expert panel concluded that suboptimal anaesthetic
technique as well as subsequent hyperventilation may account
for some of the mortality reported with prehospital airway
management in systems where anaesthesia is available12.
Invasive airway management at the scene is successfully
performed in systems that supply physician staffed ambulances,
and is considered a vital part of their advanced trauma life
support10, 13, 14.
As can be seen, there is little high quality evidence to support
either opinion. Most of the studies favouring prehospital
endotracheal intubation of severely traumatised patients were
conducted in out-of-hospital systems that rely on highly skilled
personnel such as anaesthetists, emergency physicians,
or specially trained nurses, mostly in continental Europe or
Australia. In contrast, studies that do not support this approach
rely on data from paramedic or emergency technician staffed
services, mostly in the USA or the UK. The conclusion must be
that if prehospital intubation is to be part of prehospital trauma
management then it needs to be in the context of a physician-
based prehospital care system.
Adequacy of prehospital airway and ventilation
Tables 33 and 34 show the advisors’ opinion on prehospital
airway and ventilation management.
Table 33. Adequate airway secured
Number of patients %
Yes 396 90.4
No 42 9.6
Subtotal 438
Insuffi cient data 66
Total 504
Table 34. Adequate ventilation secured
Number of patients %
Yes 401 92.0
No 35 8.0
Subtotal 436
Insuffi cient data 68
Total 504
The advisors were of the opinion that airway management in
the prehospital phase was inadequate in 42 out of the 438
cases that could be assessed. In a number of these cases
(12/42), it was felt that prehospital intubation should have
been attempted. In 35/436 (8%) cases, advisors felt that
ventilation was inadequate. NCEPOD did not request any
data on the use of capnography in the prehospital phase.
The management of the airway and breathing in the
prehospital setting is currently the responsibility of
paramedics because very few areas in the UK have a system
of care that ensures a doctor is part of the response team.
Whilst it is not current practice for paramedics to routinely
perform tracheal intubation on trauma patients, they may
undertake this task when the airway is compromised and
CHAPTER 4 - Prehospital care
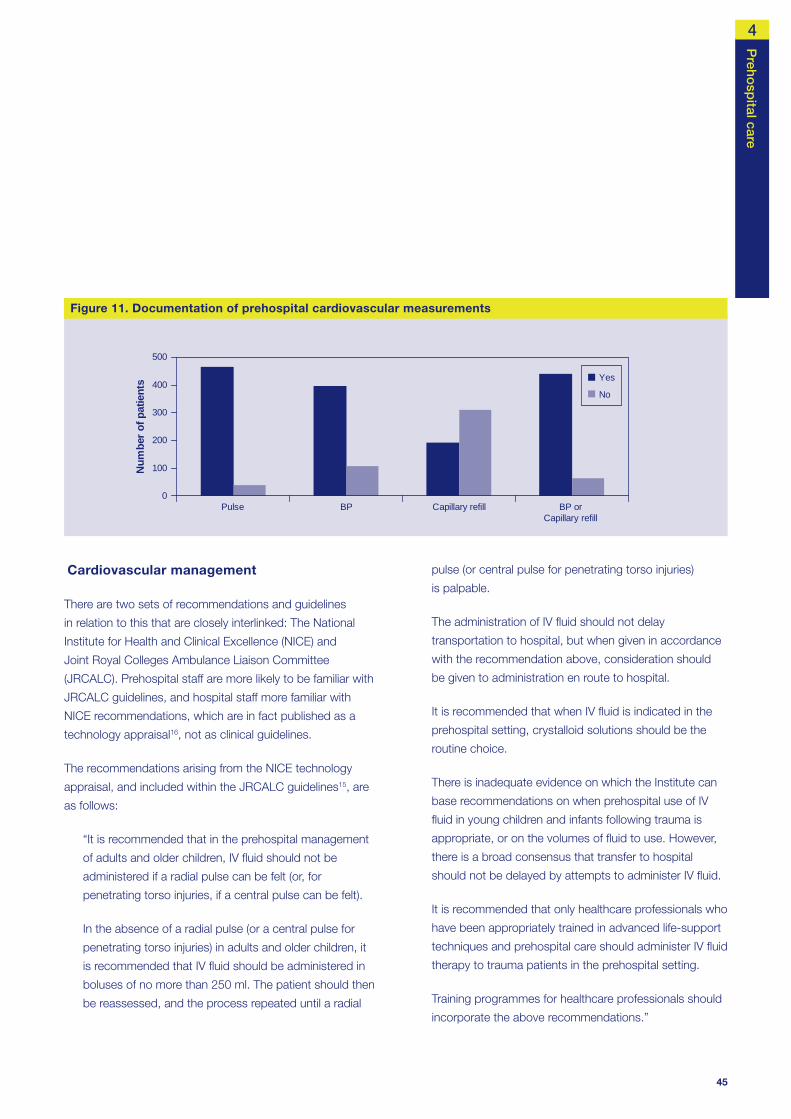
45
Cardiovascular management
There are two sets of recommendations and guidelines
in relation to this that are closely interlinked: The National
Institute for Health and Clinical Excellence (NICE) and
Joint Royal Colleges Ambulance Liaison Committee
(JRCALC). Prehospital staff are more likely to be familiar with
JRCALC guidelines, and hospital staff more familiar with
NICE recommendations, which are in fact published as a
technology appraisal16, not as clinical guidelines.
The recommendations arising from the NICE technology
appraisal, and included within the JRCALC guidelines15, are
as follows:
“It is recommended that in the prehospital management
of adults and older children, IV fl uid should not be
administered if a radial pulse can be felt (or, for
penetrating torso injuries, if a central pulse can be felt).
In the absence of a radial pulse (or a central pulse for
penetrating torso injuries) in adults and older children, it
is recommended that IV fl uid should be administered in
boluses of no more than 250 ml. The patient should then
be reassessed, and the process repeated until a radial
Preho
spital care
pulse (or central pulse for penetrating torso injuries)
is palpable.
The administration of IV fl uid should not delay
transportation to hospital, but when given in accordance
with the recommendation above, consideration should
be given to administration en route to hospital.
It is recommended that when IV fl uid is indicated in the
prehospital setting, crystalloid solutions should be the
routine choice.
There is inadequate evidence on which the Institute can
base recommendations on when prehospital use of IV
fl uid in young children and infants following trauma is
appropriate, or on the volumes of fl uid to use. However,
there is a broad consensus that transfer to hospital
should not be delayed by attempts to administer IV fl uid.
It is recommended that only healthcare professionals who
have been appropriately trained in advanced life-support
techniques and prehospital care should administer IV fl uid
therapy to trauma patients in the prehospital setting.
Training programmes for healthcare professionals should
incorporate the above recommendations.”
0
100
200
300
400
500
Pulse BP Capillary refill BP orCapillary refill
Num
ber o
f pat
ient
s Yes
No
Figure 11. Documentation of prehospital cardiovascular measurements
4

46
Table 36. Appropriate fl uid therapy (advisors’ opinion)
Number of patients %
Yes 279 87.2
No 41 12.8
Subtotal 320
Insuffi cient data 184
Total 504
The advisors assessed that in 12 cases, insuffi cient steps
had been taken to control haemorrhage (Table 35), and in
41 cases fl uids were not administered appropriately (Table
36). In most cases this was because inadequate volumes,
or in some cases no fl uid, was administered, despite clinical
features of shock. However, there were no cases in which
the advisors believed that children under the age of 16 years
had received inappropriate fl uid resuscitation prehospital.
Head injury
In 25 cases the Glasgow Coma Score (GCS) or AVPU (Alert,
Verbal, Pain, Unresponsive) score was not recorded
In 40/504 (7.9%) cases the pulse was not recorded. Blood
pressure was recorded in 398/504 (78.9%) cases. 21/504
(4.2%) patients did not have any measurements of their
cardiovascular status recorded prior to arrival at hospital.
Measurement of blood pressure at the site of incident or en
route, is not recommended particularly in children, as it may
lead to unnecessary delay.
Fluid therapy was recorded as being administered either at
the scene or en route in 188/504 cases.
Table 35. Appropriate haemorrhage control (advisors’ opinion)
Number of patients %
Yes 356 96.7
No 12 3.3
Subtotal 368
Insuffi cient data 136
Total 504
CHAPTER 4 - Prehospital care
0
20
40
60
80
100
120
140
15 14 13 12 11 10 09 08 07 06 05 04 03
Glasgow Coma Score
Num
ber o
f pat
ient
s
Figure 12. Prehospital Glasgow Coma Score (GCS)

47
(Table 37). This could be taken to mean that the score was
normal. However, it is important that the GCS or AVPU is
recorded, so that any deterioration later in the patient journey
can be clearly and unequivocally identifi ed.
Where the airway was at risk because of a GCS less
than 9, intubation was performed in only 46/170 patients.
Documentation of other forms of assisted ventilation was noted
to be poor. Advisors considered that the airway/ventilatory
management could have been better in a substantial number
of patients, a number of whom had a lowered GCS (Figure 13
and Table 38). Many patients who may have benefi ted from
intubation did not have this procedure performed because the
appropriate skills were not available.
Analgesia
The administration of analgesia prehospital was documented
in 110/504 cases. The advisors considered that the
analgesia was inappropriate for 7/110 of these cases.
In one such case it was felt that an overdose had been
administered. In another case the administration of analgesia
Preho
spital care
Not intubatedIntubatedFailed attempt
0
20
40
60
80
100
120
140
15 14 13 12 11 10 09 08 07 06 05 04 03
GCS
Num
ber
of p
atie
nts
Figure 13. Prehospital Glasgow Coma Score and intubation
Table 37. Prehospital AVPU score
Alert 68
Verbal 21
Pain 17
Unresponsive 21
Subtotal 127
GCS or AVPU not recorded 25
Total 152
Table 38. Prehospital AVPU score and intubation
Not
intubated IntubatedFailed
attempt
Alert 68 0 0
Verbal 21 0 0
Pain 11 5 1
Unresponsive 13 8 0
Total 113 13 1
4
48
caused respiratory depression which was not adequately
managed by suitable respiratory support. In three cases with
signifi cant thoracic injuries Entonox was the analgesic used
and this was considered by the advisors to be inappropriate
because of the risk of tension pneumothorax.
One must question why the provision of analgesia in a group
of severely injured patients was so low (110/504 – 21.8%)?
Patients with severe injuries are likely to experience pain and the
provision of analgesia to reduce this is a basic humanitarian aim.
It is rare that contraindications exist to the provision of pain relief.
CHAPTER 4 - Prehospital care
In a third of cases (245/749), the ambulance patient report
form was not available.
652/783 patients (83.3%) were transported to hospital by
road ambulance and 92/783 patients (11.7%) by helicopter.
23/56 (41.1%) patients treated by a helicopter-based
system were intubated on scene compared to 32/440
(7.3%) patients treated by a road ambulance system.
None of the patients treated by a helicopter based system
were taken to an inappropriate hospital compared to
31/440 (7%) patients treated by a road ambulance system
who were initially taken to an inappropriate hospital.
Blood pressure was recorded in 398/504 (80%) cases
despite recommendations that this should not be
measured in the prehospital phase.
Only 46/170 (27.1%) patients who suffered a severe head
injury (GCS less than 9) were intubated prehospital.
Only 110/504 (21.8%) patients were given analgesia in the
prehospital phase.
Key fi ndings
All agencies involved in trauma management, including
emergency medical services, should be integrated into
the clinical governance programmes of a regional trauma
service. (All healthcare providers)
Ambulance trusts should work together to standardise
the content and layout of the Patient Report Form
(PRF), and ensure that it is fi t for purpose and facilitates
comparative audit. Clinicians must ensure that a PRF
is received for every patient and secured in the medical
record. (Emergency medicine physicians and ambulance
crews)
It is important that where guidelines exist, they are widely
disseminated to appropriate groups, and there is a
robust system in place to monitor compliance with those
guidelines. (Ambulance and hospital trusts)
It is vital that all patients who have sustained serious
trauma should have a primary survey conducted at
the earliest opportunity, and that critical resuscitation
involving airway, breathing and circulation (with cervical
spine control) should be undertaken and reviewed
throughout the prehospital phase of care. This must be
documented. (Emergency medicine physicians)
Airway management in trauma patients is often
challenging. The prehospital response for these patients
should include someone with the skill to secure the
airway, (including the use of rapid sequence intubation),
and maintain adequate ventilation. (Ambulance and
hospital trusts)
Severely injured patients are likely to be in pain and the
provision of adequate analgesia is required. If analgesia
is not given there should be a clear record in the Patient
Report Form of the reasons for this. (Ambulance trusts)
Recommendations

49
References
1. Nathens AB, Brunet FP, Maier RV. Development of
trauma systems and effect on outcomes after injury.
Lancet 2004; 363(9423):1794-801
2. The form sent to lead A&E Clinicians contained the
following defi nition of a major incident protocol:
“Pre-planned and exercised procedures which are
activated once a major incident has been declared.
A major incident is any emergency that requires the
implementation of special arrangements by one or more
emergency services, the NHS or the local authority”.
3. The Royal College of Surgeons of England and the British
Orthopaedic Society. Better Care for the Severely Injured.
2000
4. Thomas SH, Biddinger PD, Helicopter trauma transport:
an overview of recent outcomes and triage literature.
Current Opinion in Anaesthesiology 2003; 16(2):153-8
5. Carr BG, Caplan JM, Pryor JP, Branas CC. A meta-
analysis of prehospital care times for trauma.
Prehospital Emergency Care 2006; 10(2):198-206
6. Lockey D, Davies G, Coats T. Survival of trauma patients
who have prehospital tracheal intubation without
anaesthesia or muscle relaxants: observational study.
BMJ 2001; 323:141
7. Christensen EF, Hoyer CC. Prehospital tracheal intubation
in severely injured patients: a Danish observational study.
BMJ 2003; 327:533-4
8. Winchell RJ, Hoyt DB: Endotracheal intubation in the
fi eld improves survival in patients with severe head injury.
Trauma Research and Education Foundation of San
Diego. Arch Surg 1997; 132:592-7
Preho
spital care
9. Garner A, Rashford S, Lee A, Bartolacci R. Addition of
physicians to paramedic helicopter services decreases
blunt trauma mortality. Aust N Z J Surg 1999; 69:697-
701
10. Adnet F, Jouriles NJ, Le Toumelin P, Hennequin B,
Taillandier C, Rayeh F, Couvreur J, Nougiere B, Nadiras P,
Ladka A, Fleury M: Survey of out-of-hospital emergency
intubations in the French prehospital medical system: a
multicenter study. Ann Emerg Med 1998; 32:454-60
11. Bochicchio GV, Ilahi O, Joshi M, Bochicchio K, Scalea
TM. Endotracheal intubation in the fi eld does not improve
outcome in trauma patients who present without an
acutely lethal traumatic brain injury. J Trauma 2003;
54:307-11
12. Davis DP, Fakhry SM, Wang HE, Bulger EM, Domeier
RM, Trask AL, Bochiocchio GV, Hauda WE, Robinsion
L. Paramedic rapid sequence intubation for severe
traumatic brain injury: perspectives from an expert panel.
Prehosp Emerg Care 2007; 11:1-8
13. Gerich TG, Schmidt U, Hubrich V, Lobenhoffer HP,
Tscherne H: Prehospital airway management in the
acutely injured patient: the role of surgical cricothyrotomy
revisited. J Trauma 1998; 45:312-4
14. Schmidt U, Frame SB, Nerlich ML, Rowe DW,
Enderson BL, Maull KI, Tscherne H: On-scene helicopter
transport of patients with multiple injuries: comparison
of a German and an American system. J Trauma 1992;
33:548-53
15. UK Ambulance Service Clinical Practice Guidelines 2006.
Joint Royal Colleges Ambulance Liaison Committee
(JRCALC)
16. NICE Technology Appraisal. Prehospital initiation of fl uid
replacement therapy in trauma. 2004
4

50
from the perspective of survivors, a good trauma process
may also reduce morbidity.
The recognition of these patterns led to the development
of the advanced trauma life support (ATLS) approach by
the American College of Surgeons. ATLS is the basis of
trauma care and it is built around a standardised protocol
for patient evaluation. This protocol ensures that the most
immediate life-threatening conditions are actively identifi ed
and addressed in the order of their risk potential.
The objectives of the initial evaluation of the trauma patient
are:
1. to identify life-threatening injuries and to initiate adequate
supportive therapy;
2. to effi ciently and rapidly organise either defi nitive therapy
or transfer to a facility that provides defi nitive therapy.
This chapter describes the initial reception of the severely
injured patient and organisation of the trauma response.
Results
Pre-alerts
From the introduction above it can be appreciated that
one of the key steps in maximising outcome for the
severely injured patient is to ensure a rapid and appropriate
emergency department response. One mechanism for
ensuring that this occurs is communication from the
prehospital clinicians to the receiving emergency department,
passing on details of the extent of the injuries and the
response required in hospital. This communication is referred
to as a pre-alert.
Introduction
Deaths after major trauma can be grouped into immediate,
early, and late deaths.
Immediate deaths are caused by a fatal disruption of the
great vessels, heart, lungs or a major disruption of body
cavities. Immediate death occurs at the scene of injury. This
group of deaths is least likely to be infl uenced by measures
taken post injury. Injury prevention strategies and public
health measures must remain the major strategy for reducing
this major source of mortality.
Early deaths occur in the hours just after the injury. These
patients frequently arrive at a hospital prior to death which
usually occurs because of cardiovascular and/or pulmonary
collapse. Early trauma deaths result from failed oxygenation
of the vital organs, massive central nervous system injury, or
both. The mechanisms of failed tissue oxygenation include
inadequate ventilation, impaired oxygenation, circulatory
collapse, and insuffi cient end-organ perfusion. Injuries that
cause early trauma mortality occur in predictable patterns
based on the mechanism of injury; the patient’s age, gender,
and body habitus; or environmental conditions. Rapid
resuscitation coupled with rapid defi nitive management of
injuries and complications has the potential to reduce these
deaths.
Late deaths peak from days to weeks after the injury and are
due primarily to sepsis and multiple organ failure.
Organised systems for trauma care are often thought
to be focused on the salvage of a patient from early
trauma mortality, while critical care is designed to manage
complications and avert late trauma mortality. However, it
must be noted that a good trauma process (early defi nitive
care and optimal resuscitation) will not only reduce early
mortality but also reduce the number of late deaths by
minimising the number of patients who go on to develop
multiple organ failure and require critical care. Importantly
CHAPTER 5 - Hospital reception
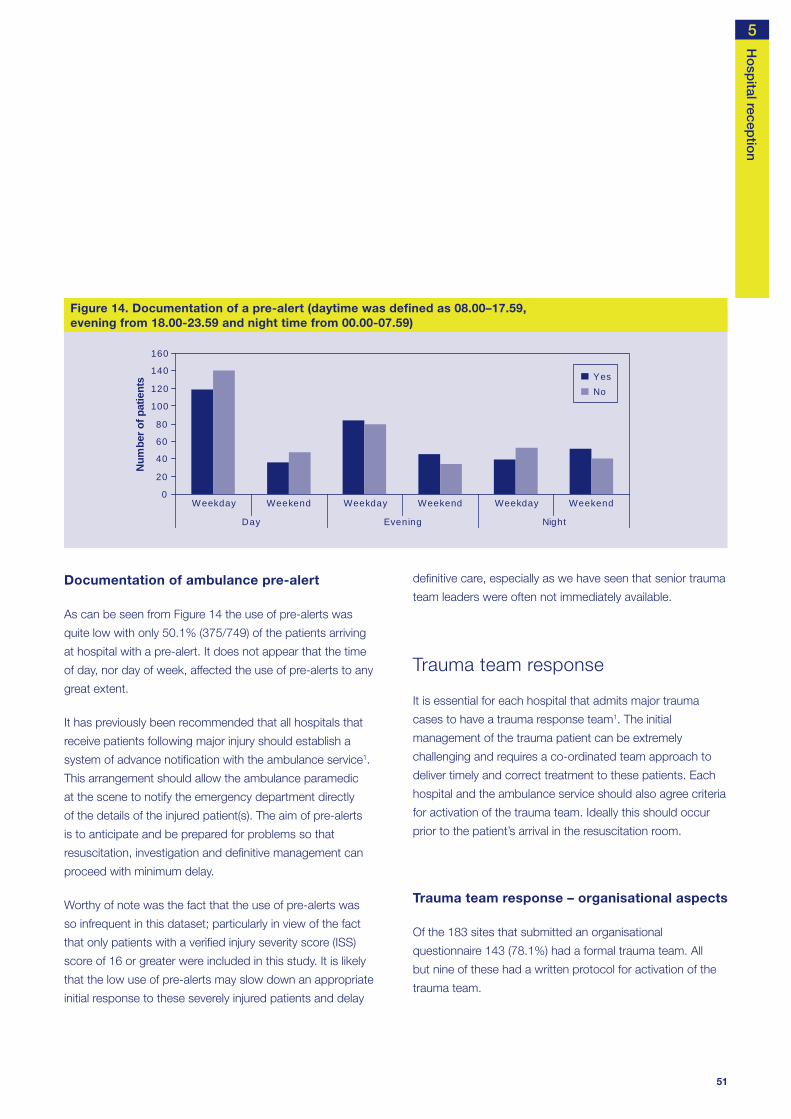
51
Documentation of ambulance pre-alert
As can be seen from Figure 14 the use of pre-alerts was
quite low with only 50.1% (375/749) of the patients arriving
at hospital with a pre-alert. It does not appear that the time
of day, nor day of week, affected the use of pre-alerts to any
great extent.
It has previously been recommended that all hospitals that
receive patients following major injury should establish a
system of advance notifi cation with the ambulance service1.
This arrangement should allow the ambulance paramedic
at the scene to notify the emergency department directly
of the details of the injured patient(s). The aim of pre-alerts
is to anticipate and be prepared for problems so that
resuscitation, investigation and defi nitive management can
proceed with minimum delay.
Worthy of note was the fact that the use of pre-alerts was
so infrequent in this dataset; particularly in view of the fact
that only patients with a verifi ed injury severity score (ISS)
score of 16 or greater were included in this study. It is likely
that the low use of pre-alerts may slow down an appropriate
initial response to these severely injured patients and delay
Ho
spital recep
tion
defi nitive care, especially as we have seen that senior trauma
team leaders were often not immediately available.
Trauma team response
It is essential for each hospital that admits major trauma
cases to have a trauma response team1. The initial
management of the trauma patient can be extremely
challenging and requires a co-ordinated team approach to
deliver timely and correct treatment to these patients. Each
hospital and the ambulance service should also agree criteria
for activation of the trauma team. Ideally this should occur
prior to the patient’s arrival in the resuscitation room.
Trauma team response – organisational aspects
Of the 183 sites that submitted an organisational
questionnaire 143 (78.1%) had a formal trauma team. All
but nine of these had a written protocol for activation of the
trauma team.
0
20
40
60
80
100
120
140
160
Weekday Weekend Weekday Weekend Weekday Weekend
Day Evening Night
Num
ber o
f pat
ient
s YesNo
Figure 14. Documentation of a pre-alert (daytime was defi ned as 08.00–17.59, evening from 18.00-23.59 and night time from 00.00-07.59)
5

52
There are clear recommendations regarding the composition
of a trauma team: consultant leadership plus the presence of
SpRs or above from the emergency department, anaesthesia
and surgery are probably the key elements1. Table 39 shows
that the current provision of staff falls well short of these
recommendations.
In the hospitals where SpRs or above were either not present
or non-resident, the initial care was presumably provided
by more junior members of staff. This is a concern, as initial
management may have a substantial impact on eventual
outcome.
Immediate airway control is vital. Only 111/183 (60.7%)
hospitals had an anaesthetic SpR or above immediately
available. Trauma airways are likely to be diffi cult and a SpR
or above should be present immediately.
Trauma team response- individual cases
Documentation of trauma team response
Figure 15 shows the trauma response analysed by
time of day and weekday/weekend. Overall there was
documentation of a trauma team response in 59.7%
(460/770) of cases. In 25 cases there was insuffi cient data
It has previously been shown that only half of the emergency
departments attending more than 30 000 patients per year
operated a trauma team system2. A more recent study has
shown some improvement in availability of trauma teams with
61% of departments surveyed operating such a system3. The
availability of trauma teams has continued to increase and
that the fi gure now approaches 80%. However, one in fi ve
departments in this study, despite accepting severely injured
patients, did not have a formal trauma team. This is presumably
an issue of organisation as these departments should have the
necessary personnel but for some reason had not arranged
their activity into a structured trauma response.
As part of the organisational questionnaire NCEPOD
requested information about who would respond to a
request for a trauma response in the early hours of a Sunday
morning (0200). Table 39 shows the response analysed by
grade and availability.
One hundred and eighteen of the 183 (65%) hospitals
from which an organisational questionnaire was received
responded that a consultant would not be present during the
trauma call. There were also a number of hospitals where it
was stated that they would not have the presence of a SpR
or above from the emergency department (38/183; 20.8%),
anaesthesia (59/183; 32.2%) or surgery (63/183; 34.4%).
CHAPTER 5 - Hospital reception
Table 39. Trauma respondents by grade of specialty
Consultant Emergency Medicine
SpR or above Anaesthetic SpR or above Surgical SpR or above
% % % %
Resident 6 3.3 109 59.6 111 60.7 86 47.0
Non-resident 59 32.2 36 19.7 13 7.1 34 18.6
Not present 118 64.5 38 20.8 59 32.2 63 34.4
Total 183 183 183 183

53
to determine if there was a trauma response. There was
some variation in the activation of the trauma team by time of
day and day of week. The trauma team was less likely to be
present on a weekday during the day (137/259; 52.9%) than
at nights (100/163; 61.3%) and weekends (168/256; 65.6%).
Possible explanations for the variation in trauma team
response are:
1. Less need for a trauma team during the normal working
day as there was an appropriate consultant response,
and supporting team, immediately available within the
receiving emergency department.
2. The trauma team had other responsibilities during the
working day and so was less likely to be available to attend
the emergency department for daytime trauma calls.
Ho
spital recep
tion
Infl uence of the severity of injury on the use of trauma teams
Table 40 describes the infl uence of the severity of injury and
the initiation of a trauma team response. There was a trend
towards greater involvement of trauma teams for patients
with more severe injuries.
Table 40. Trauma call documented by ISS
Trauma call documented
ISS Yes No Total
16 - 24 231 218 449
25 - 35 185 94 279
36 - 75 55 12 67
Total 471 324 795
While this may appear reassuring it must be remembered
that this score was calculated retrospectively and cannot
drive real time management decisions. Also many patients
with an ISS in the range 16-24 can pose great challenges
and do require the input of a well-organised trauma service.
0
20
40
60
80
100
120
140
160
180
Weekday Weekend Weekday Weekend Weekday Weekend
Day Evening Night
Num
ber o
f pat
ient
s Yes
No
Figure 15. Documentation of trauma response (daytime was defi ned as 08.00–17.59, evening from 18.00-23.59 and night time from 00.00-07.59)
5

54
in the presence of a pre-alert there was no trauma team
response in 99/383 (25.8%) cases.
The reasons for the lack of trauma team response to a
pre-alert were not clear but in a substantial number of cases
(99/383), where the prehospital clinicians had suffi cient
concerns to issue a pre-alert, no trauma team was activated.
Trauma team response to pre-alerts
The use of pre-alerts and activation of the trauma team are
key initial components of an organised trauma system. Figure
16 shows the relationship between these two elements (data
from A&E clinician questionnaire). It can be seen that even
CHAPTER 5 - Hospital reception
0
50
100
150
200
250
300
Yes No Not answered
Pre-alert
Num
ber o
f pat
ient
s YesNoNot answered
Figure 16. Trauma team activation in response to pre-alert
0
5
10
15
20
25
30
35
40
Consultant NCCG SpR 3+ SpR 1/2 SpR SHO Nurse Other Notanswered
Grade of clinician
Perc
enta
ge o
f pat
ient
s in
dat
aset
Trauma call
No trauma call
Figure 17. Grade of fi rst reviewer/team leader in response to trauma call

55
Trauma team leadership
The recommendations for an organised trauma response
states that the trauma team leader must be a consultant
from a relevant specialty1, recognising that the management
of the severely injured patient is potentially very challenging
and requires considerable skill and experience.
Figure 17 shows the grade of fi rst reviewer/team leader
analysed by whether or not a trauma call had been made.
A consultant was the team leader/fi rst reviewer in 136 out of
502 cases (27%). An SHO was the team leader/fi rst reviewer
in 54 out of 502 cases (10.8%). In 11 cases the grade of
reviewer was not answered.
Two other main fi ndings emerge from these data.
1. If a trauma call had been made it was much more likely
that a consultant was the fi rst reviewer/team leader.
Consultants were team leaders in 36.2% (111/307) of
cases where a trauma call was made compared to only
12.8% (25/195) of cases where no trauma call was
made.
2. If a trauma call had not been made it was much more
likely that an SHO was the fi rst reviewer/team leader.
SHOs were team leaders in 20.5% (40/195) of cases
where no trauma call was made compared to only 4.6%
(14/307) of cases where a trauma call was made.
It was also noted from the A&E clinician questionnaire that
176/513 (34.3%) patients were not seen by a consultant
from any specialty while in the emergency department. For
a further 53/513 (10%) patients, the clinician completing this
questionnaire was unable to determine what time the patient
was fi rst seen by a consultant in the emergency department.
The above data highlights the data shown earlier regarding
the variability of trauma team response by time and day
(Figure 15). If the trauma team was called less frequently
Ho
spital recep
tion
during the day because the emergency department was
appropriately staffed by consultants, then the proportion of
consultants seeing patients where a trauma team was not
called would be much higher and the involvement of SHOs
lower. This was not the case. The above data supports the
view that the response rate of the trauma team during normal
working hours was lower than out of hours as the team had
competing commitments during the normal working day and
was not always available to attend trauma calls.
Junior medical staff were still the fi rst reviewer/team leader
in a substantial number of cases. Indeed, an SHO was the
fi rst reviewer/team leader in 54/502 (10.8%) cases. However,
it appears that progress has been made in this aspect
since 1992 when an SHO was in charge of initial hospital
resuscitation in 826 out of 1445 patients with an ISS of 16
or greater (57.2%)4. While this progress is encouraging, it is
important to recognise the challenge that the severely injured
patient poses and that it is inappropriate for very junior
medical staff to lead their care.
Time to consultant review
Given the current staffi ng of emergency departments it
is clear that not all patients can be seen and assessed
immediately by a consultant. In the absence of immediate
consultant involvement timely review is required. Table
41 shows time to consultant involvement. Fifty percent of
patients (210/419) were either seen immediately or within
30 minutes. However, 42% (176/419) were not seen by a
consultant (of any specialty) in the emergency department
and in a further 94 cases the time interval was not known
or not answered.
5
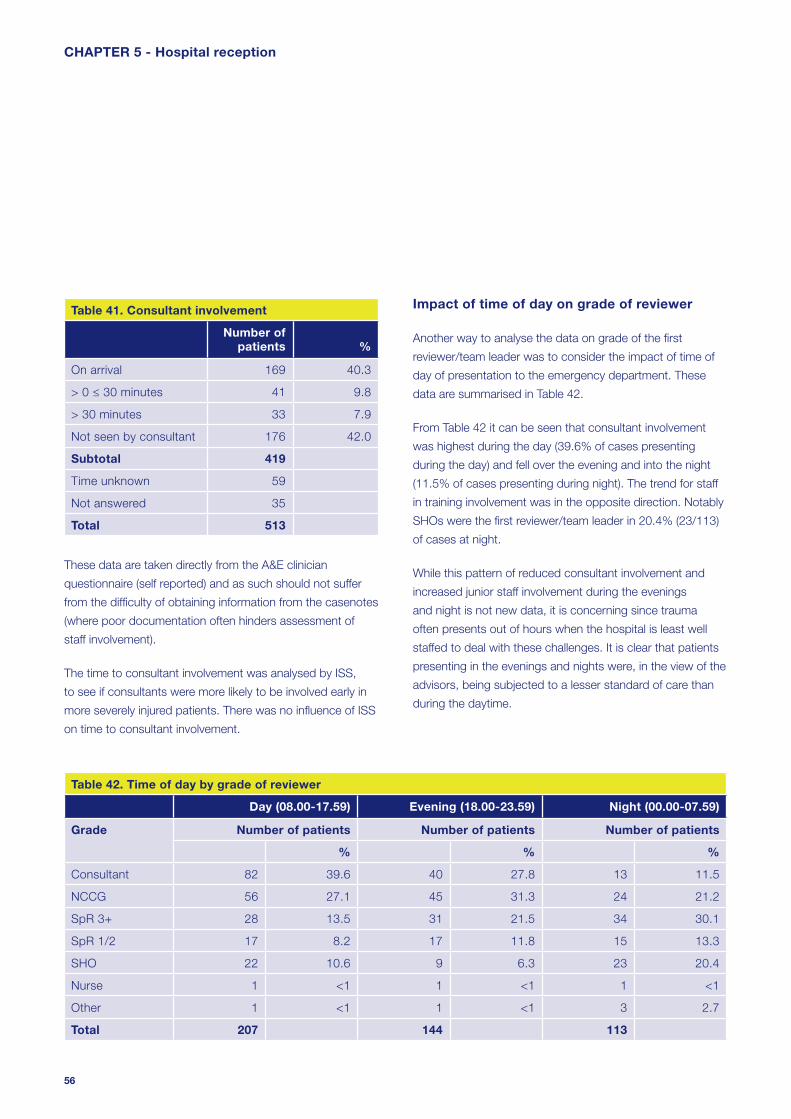
56
Impact of time of day on grade of reviewer
Another way to analyse the data on grade of the fi rst
reviewer/team leader was to consider the impact of time of
day of presentation to the emergency department. These
data are summarised in Table 42.
From Table 42 it can be seen that consultant involvement
was highest during the day (39.6% of cases presenting
during the day) and fell over the evening and into the night
(11.5% of cases presenting during night). The trend for staff
in training involvement was in the opposite direction. Notably
SHOs were the fi rst reviewer/team leader in 20.4% (23/113)
of cases at night.
While this pattern of reduced consultant involvement and
increased junior staff involvement during the evenings
and night is not new data, it is concerning since trauma
often presents out of hours when the hospital is least well
staffed to deal with these challenges. It is clear that patients
presenting in the evenings and nights were, in the view of the
advisors, being subjected to a lesser standard of care than
during the daytime.
Table 41. Consultant involvement
Number of patients %
On arrival 169 40.3
> 0 ≤ 30 minutes 41 9.8
> 30 minutes 33 7.9
Not seen by consultant 176 42.0
Subtotal 419
Time unknown 59
Not answered 35
Total 513
These data are taken directly from the A&E clinician
questionnaire (self reported) and as such should not suffer
from the diffi culty of obtaining information from the casenotes
(where poor documentation often hinders assessment of
staff involvement).
The time to consultant involvement was analysed by ISS,
to see if consultants were more likely to be involved early in
more severely injured patients. There was no infl uence of ISS
on time to consultant involvement.
CHAPTER 5 - Hospital reception
Table 42. Time of day by grade of reviewer
Day (08.00-17.59) Evening (18.00-23.59) Night (00.00-07.59)
Grade Number of patients Number of patients Number of patients
% % %
Consultant 82 39.6 40 27.8 13 11.5
NCCG 56 27.1 45 31.3 24 21.2
SpR 3+ 28 13.5 31 21.5 34 30.1
SpR 1/2 17 8.2 17 11.8 15 13.3
SHO 22 10.6 9 6.3 23 20.4
Nurse 1 <1 1 <1 1 <1
Other 1 <1 1 <1 3 2.7
Total 207 144 113

57
Relationship between grade of reviewer and quality of care
As stated previously, the experience of the staff making
the initial assessment and leading the trauma team is one
of the factors that may impact on patient outcome. One
question that was asked of the advisors during the peer
review process was ‘was the initial response in hospital
appropriate?’.
It was possible to look at the relationship between the
advisors’ opinion on appropriateness of initial response
and the grade of initial reviewer/team leader in 477/795
cases. In 318 cases, poor documentation of clinicians’
grades prevented this analysis. Overall 51 of the 477
(10.7%) cases that could be assessed were considered
to have an inappropriate response. When these data were
disaggregated by grade of fi rst reviewer a clearer picture
Ho
spital recep
tion
emerged and the percentage of inappropriate responses
rose from 3.1% (5/159) when consultants were the fi rst
reviewer to 23.5% (16/68) when SHOs were the fi rst reviewer
(Table 43).
Table 43. Appropriate response by grade of reviewer (advisors’ view)
Appropriate response
Grade of fi rst reviewer
Yes No Total
% %
Consultant 154 96.9 5 3.1 159
NCCG 16 84.2 3 15.8 19
SpR 204 88.3 27 11.7 231
SHO 52 76.5 16 23.5 68
Total 426 51 477
0 6 12 18 24 30 36 42 48 54 60 660
100
200
300
400
Time (hours)
Num
ber o
f pat
ient
s
Figure 18. Time to fi rst consultant review
5

58
These data provide a clear association between grade of fi rst
reviewer and the advisors’ assessments of appropriateness
of response.
Table 44. Time to fi rst consultant review
Number of patients %
On arrival 108 29.0
> 0 ≤ 30 minutes 34 9.1
> 30 minutes ≤ 1 hour 12 3.2
> 1 hour ≤ 6 hours 96 25.7
> 6 hours ≤ 12 hours 53 14.2
> 12 hours 70 18.8
Subtotal 373
Insuffi cient data 422
Total 795
As can be seen from Figure 18 and Table 44, a substantial
proportion (18.8%) of patients had not been reviewed by a
consultant within 12 hours of arrival to hospital. A number of
patients had still not been seen within 24 hours of arrival. In
addition, it is worth reiterating that 176/513 patients (34.3%;
data from the A&E clinician questionnaire) were not seen by
a consultant in the emergency department. The time to fi rst
consultant review could only be calculated for 373/795 (47%)
cases. Poor documentation of review times and grade of
reviewer are large contributory factors to this.
Prompt review by consultant staff would appear to be a
sensible aim. The infl uence of consultant staff is most likely to
be seen in the domain of the decision-making process. Put
more simply, consultants should have the training, ability and
seniority to ensure that the correct actions are undertaken in
a prompt and effi cient manner, thereby improving the patient
CHAPTER 5 - Hospital reception
care process. It was recently shown in a study of severely
injured patients5 that consultant presence in the emergency
department reduced the mean time to operating theatre in
these patients: (43.8 minutes (+/-20.1) when a consultant
was present and 109.4 minutes (+/-10.7) when a consultant
was not present, p<0.05). In addition there were no missed
injuries, delays to the operating theatre, or inappropriate
workups when a consultant was present. It is, therefore,
a concern that a number of severely injured patients
within this study experienced signifi cant delays before
consultant involvement. Furthermore, the high percentage
of inappropriate initial responses when consultants were not
immediately involved (Table 41) supports this view.
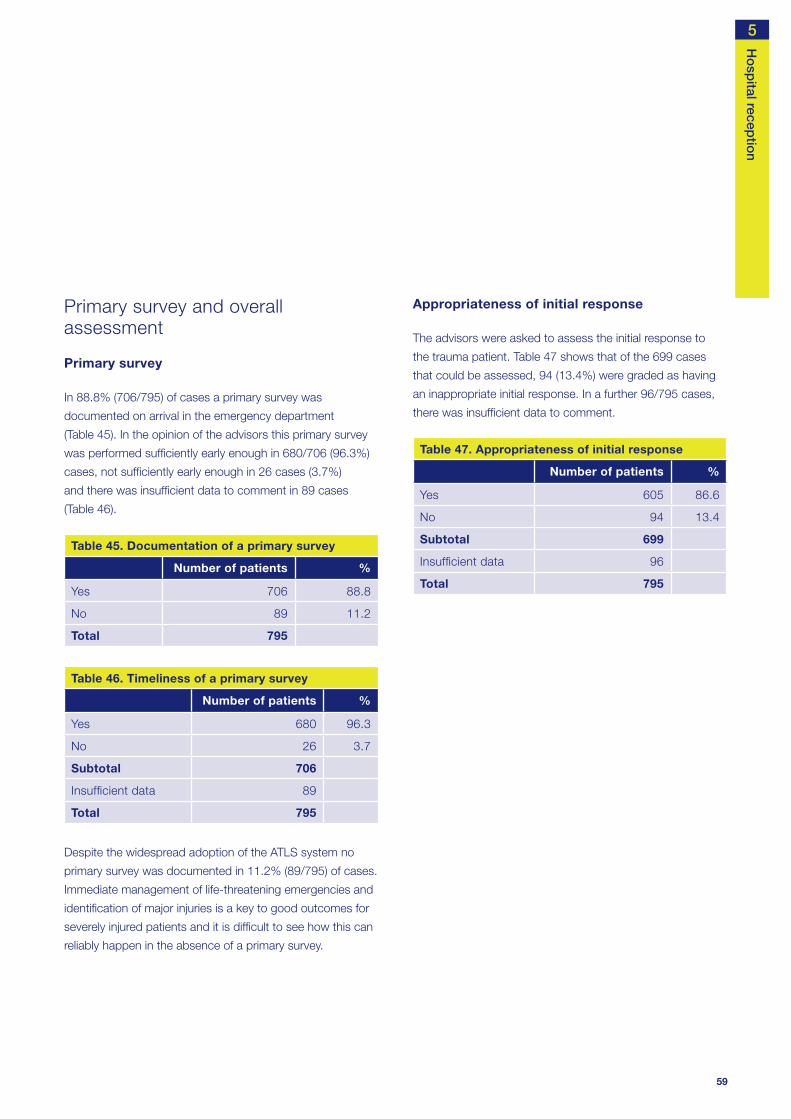
59
Primary survey and overall assessment
Primary survey
In 88.8% (706/795) of cases a primary survey was
documented on arrival in the emergency department
(Table 45). In the opinion of the advisors this primary survey
was performed suffi ciently early enough in 680/706 (96.3%)
cases, not suffi ciently early enough in 26 cases (3.7%)
and there was insuffi cient data to comment in 89 cases
(Table 46).
Table 45. Documentation of a primary survey
Number of patients %
Yes 706 88.8
No 89 11.2
Total 795
Table 46. Timeliness of a primary survey
Number of patients %
Yes 680 96.3
No 26 3.7
Subtotal 706
Insuffi cient data 89
Total 795
Despite the widespread adoption of the ATLS system no
primary survey was documented in 11.2% (89/795) of cases.
Immediate management of life-threatening emergencies and
identifi cation of major injuries is a key to good outcomes for
severely injured patients and it is diffi cult to see how this can
reliably happen in the absence of a primary survey.
Ho
spital recep
tion
Appropriateness of initial response
The advisors were asked to assess the initial response to
the trauma patient. Table 47 shows that of the 699 cases
that could be assessed, 94 (13.4%) were graded as having
an inappropriate initial response. In a further 96/795 cases,
there was insuffi cient data to comment.
Table 47. Appropriateness of initial response
Number of patients %
Yes 605 86.6
No 94 13.4
Subtotal 699
Insuffi cient data 96
Total 795
5

60
Overall assessment and appropriateness of initial response
Part of the advisors’ role was to come to an overall
assessment of each case using the grading system
described in the method section. Table 48 shows how the
patients classifi ed as having an inappropriate initial response
were graded (94/699 from Table 47).
Table 48. Overall assessment in patients with inappropriate initial response
Number of patients %
Good practice 8 8.5
Room for improvement clinical
28 29.8
Room for improvement organisational
17 18.1
Room for improvement clinical and organisational
21 22.3
Less than satisfactory 17 18.1
Insuffi cient data 3 3.2
Total 94
Only a small number of the cases (8/94) were graded as
good practice. Additionally, in the view of the advisors, 17
patients received less than satisfactory care. The above
refl ects the importance of the initial response, in terms of
clinical decision-making and overall care for the severely
injured patient.
CHAPTER 5 - Hospital reception
A pre-alert from the ambulance crew to the receiving
emergency department was documented for only 50.1%
of patients in this study.
One in fi ve hospitals admitting severely injured patients
did not have a formal trauma team.
When a pre-alert was made to the receiving emergency
department, there was no trauma response in one in
four cases.
A trauma team response was documented for only
59.7% of patients in this study.
A consultant was the team leader/ fi rst reviewer in only
169/419 (40.3%) of cases.
Advisors felt that the patient’s initial management was
inappropriate in 23.5% of cases where an SHO was the
team leader/ fi rst reviewer compared to 3.1% of cases
where a consultant was the team leader/ fi rst reviewer.
If no trauma response was activated, then it was more
likely that an SHO was the fi rst reviewer or team leader
for the severely injured patient.
176/419 (42%) patients were not seen by a consultant in
the emergency department.
89/795 (11.2%) patients did not have a primary survey
documented in their casenotes.
The initial management of the patient was thought to be
inappropriate in 94/699 cases (13.4%).
Key fi ndings

61
Ho
spital recep
tion
References
1. The Royal College of Surgeons of England and the
British Orthopaedic Society. Better Care for the Severely
Injured. 2000
2. Kazemi AR, Nayeem N. The existence and composition
of trauma teams in the UK. Injury 1997; 28:119-21
3. Brooks A, Williams J, Butcher W, Ryan J. General
Surgeons and Trauma. A questionnaire survey of General
Surgeons training in ATLS and involvement in the trauma
team. Injury 2003; 34(7):484-6
4. Yates DW, Woodford M, Hollis S. Preliminary analysis of
the care of injured patients in 33 British hospitals: fi rst
report of the United Kingdom major trauma outcome
study. BMJ 1992; 305(6856):737-40
5. Porter JM, Ursic C. Trauma attending in the resuscitation
room: does it affect outcome? Am Surg 2001;
67(7):611-4
Ambulance trusts and emergency departments should
have clear guidelines for the use of pre-alerts in the
severely injured patient population. The ambulance
crew should be able to speak directly to clinical staff
in the receiving emergency department to ensure an
appropriate clinical response is available immediately.
(Ambulance trusts and emergency departments)
Trusts should ensure that a trauma team is available 24
hours a day, seven days a week. This is an essential part
of an organised trauma response system. (Hospital trusts)
Hospital and ambulance trusts should ensure there are
agreed explicit criteria for issuing a pre-alert activation of
the trauma team. (Hospital and ambulance trusts)
A consultant must be the team leader for the management
of the severely injured patient. There should be no reason
for this not to happen during the normal working week.
Trusts and consultants should work together to provide
job plans that will lead to better consultant presence in the
emergency department at all times to provide more uniform
consultant leadership for all severely injured patients.
(Hospital trusts and clinical directors)
All patients should have a primary survey performed and
clearly documented on admission to the emergency
department. (Emergency medicine physicians)
Standardised documentation for the trauma patient
should be developed. This will improve patient care
and multidisciplinary communication. In addition,
comparative audit will be facilitated. (RCS and College of
Emergency Medicine)
Recommendations As previously recommended, a consultant must be the
team leader for the management of the severely injured
patient. However, it is appreciated that this will not be
achievable immediately. In the absence of this standard
all severely injured patients should be reviewed by a
consultant as soon as possible; ideally this should be
within four hours of arrival at hospital, but must be within
12 hours of arrival. (Hospital trusts)
5

62
Results
Airway and ventilation in hospital
Table 49 shows the airway status on arrival at the emergency
department and the 72 hour mortality for each group of
patients. As can be seen, 85/676 (12.6%) of patients arrive
at hospital with either a partially or completely obstructed
airway and these groups had a much higher mortality rate
although from this dataset, causality cannot be assumed.
Table 49. Airway status on arrival at hospital
Alive Deceased Total % Mortality
Clear 526 65 591 11.0
Noisy 27 13 40 32.5
Blocked 28 17 45 37.8
Subtotal 581 95 676
Not recorded
97 22 119 18.5
Total 678 117 795
The provision of an adequate airway by intubation of the
trachea is often required to facilitate the management of the
severely injured patient. Table 50 shows that 74 patients
were intubated before arrival at hospital, 11 patients had
attempted but failed intubation and 362 patients were
intubated after arrival at hospital. Table 50 also shows
mortality rates at 72 hours after injury. It can be seen that the
group that was intubated prehospital had a higher mortality
than the group intubated in hospital. This is in line with
previous literature7 although a causal relationship cannot be
determined from this dataset.
Introduction
Adequate oxygenation of the tissues is critical to survival
after trauma, and the maintenance of adequate levels of
oxygen in the blood stream is a paramount objective in the
management of severe trauma. Tissue hypoxia may occur
as a result of multiple injuries, haemorrhage or depressed
respiration and it may occur acutely or insidiously. A leading,
but rapidly reversible, life-threatening cause of insuffi cient
oxygenation is obstruction of the airway. Therefore, the
reversal of an obstructed airway is regarded as fundamental
in any approach to managing the severely injured patient.
Airway management is therefore one of the key components
of emergency care. The primary objective is to recognise
an obstructed or potentially obstructed airway, to clear
the obstruction and keep the airway patent. No medical
emergency, short of complete cardiopulmonary arrest,
is more immediately life-threatening than the loss of an
adequate airway. Failure to manage airway patency and
ventilation adequately has been identifi ed as a major cause
of preventable death in trauma1-4.
Many studies highlight the preventable mortality and
morbidity that occur following major trauma5, 6. Airway
problems and hypovolaemia are very often the causes.
The advanced trauma life support (ATLS) system of trauma
care stresses the importance of recognition of airway and
ventilation problems. The value of early senior experienced
anaesthetic involvement cannot be over-stated. The
anaesthetist should be a key member of the resuscitation
trauma team, and not simply called when serious problems
have already developed.
CHAPTER 6 - Airway and breathing

63
There are issues with prehospital and hospital airway
management. In the prehospital chapter concerns were
raised about the delays on scene whilst attempting to secure
an airway. Despite the prehospital care, 12.6% of patients
arrived at hospital with a partially or completely obstructed
Airw
ay and b
reathing
airway. This raises questions about what forms of airway
provision should be used in the prehospital phase, what skills
the prehospital staff need to possess and what background
these practitioners should come from (paramedical, medical).
Tables 51 and 52 show data relevant to the personnel
involved in, and the timing of, tracheal intubation. Data on
grade of medical staff involved was poorly documented
and not available in 223/362 cases. Anaesthetists were
responsible for the majority of this activity (203/230 cases
– 88.3%). There was evidence for use of rapid sequence
induction in 237/362 (65.5%) patients intubated in hospital.
In a substantial number of cases the grade and/or specialty
were not recorded. Where data were available it is clear that
many patients were intubated on arrival at hospital or very
shortly after. This, combined with the 12.6% of patients who
arrived at hospital with an obstructed or partially obstructed
airway, raises concerns over the adequacy of prehospital
airway management under the current system of prehospital
care, which is largely provided by paramedic staff who are
not trained to use drugs to facilitate tracheal intubation.
Table 53. Time of intubation (minutes)
Number of patients %
On arrival 54 22.2
0 ≥ 10 31 12.8
> 10 ≤ 20 21 8.6
> 20 ≤ 30 25 10.3
> 30 ≤ 40 10 4.1
> 40 ≤ 50 10 4.1
> 50 ≤ 60 7 2.9
> 60 85 35.0
Subtotal 243
Not recorded 119
Total 362
Table 50. Intubation status and mortality
Alive Deceased Total % Mortality
Prehospital 45 29 74 39.2
Failed attempt (prehospital)
3 8 11 72.7
Hospital 290 72 362 19.9
Subtotal 338 109 447
No evidence 340 8 348 2.3
Total 678 117 795
Table 51. Grade of clinician involved with intubation
Number of patients %
Consultant 22 15.8
SpR 95 68.3
SHO 22 15.8
Subtotal 139
Not recorded 223
Total 362
Table 52. Specialty of clinician involved with intubation
Number of patients %
Anaesthetics 203 88.3
Critical care medicine 20 8.7
Emergency medicine 7 3.0
Subtotal 230
Not recorded 132
Total 362
6

64
Figures 21, 22 and 23 show data from the fi rst arterial
blood gas (ABG) analysis after admission to the emergency
department. A large number 334/795 (42%) of patients did
not have arterial blood gas analysis, which is surprising in
the setting of severe trauma. Of those who did have arterial
blood gas analysis, it can be seen that there is extreme
physiological derangement in a substantial number.
Figure 19 shows the initial respiratory rate on admission to
the emergency department. Many patients had an abnormal
respiratory rate refl ecting their underlying injuries. Respiratory
rate is a very sensitive indicator of critical illness and
progression of disease. This parameter was not recorded
in 149 of 795 cases (18.7%). This lack of respiratory rate
monitoring has been found in other studies of severely ill
patients8 and despite recommendations for more use of this
measurement; the situation has changed little in this study.
The SpO2 was recorded in all but 81/795 (10.2%) cases on
admission (Figure 20).
CHAPTER 6 - Airway and breathing
0
50
100
150
200
250
300
350
≤ 5 > 5 ≤ 10 > 10 ≤ 15 > 15 ≤ 20 > 20 ≤ 25 > 25 ≤ 30 > 30 ≤ 35 > 35 ≤ 40 > 40 Not recorded
Breaths/min
Num
ber o
f pat
ient
s
Figure 19. First hospital respiration rate
0
50
100
150
200
250
300
350
< 80 ≥ 80 < 85 ≥ 85 <90 ≥ 90 < 95 ≥ 95 < 100 100 Unrecordable Not recorded
SpO2
Num
ber o
f pat
ient
s
Figure 20. First hospital SpO2

65
Airw
ay and b
reathing
0
50
100
150
200
250
300
350
≤ 7.15 > 7.15≤ 7.25
> 7.25≤ 7.35
> 7.35≤ 7.45
> 7.45≤ 7.55
> 7.55 Notrecorded
pH
Num
ber o
f pat
ient
s
Figure 21. First ABG pH measurements
0
50
100
150
200
250
300
350
≤5 >5≤10 >10≤15 >15 Not recorded
PaO2 (kPa)
Num
ber o
f pat
ient
s
Figure 22. First ABG PaO2 measurements
6

66
The group of patients who are diffi cult to intubate may have
different injuries, or a greater severity of injury, compared to
the group in whom there was no diffi culty with intubation.
The mortality rate at 72 hours in the group of patients with
airway diffi culty was 25% (14/56) compared with 13.6%
(95/697) in the non-diffi cult group. However, it is not clear if
there was any direct causal relationship between the diffi culty
with airway provision and mortality.
Advisors were asked to make an overall assessment of the
management of the airway and breathing. From Table 55
it can be seen that this was considered unsatisfactory in
52/741 cases (7%) where the data could be assessed.
Table 55. Satisfactory airway management
Number of patients %
Yes 689 93.0
No 52 7.0
Subtotal 741
Insuffi cient data 54
Total 795
One of the challenges in the trauma patient can be provision
of an adequate airway9 and tracheal intubation is frequently
a much more diffi cult procedure in the trauma patient10.
Table 54 shows that in 56/753 (7.4%) cases, the advisors
saw evidence of diffi culty in obtaining an adequate airway.
In 42 cases it was not possible to assess this. Of interest was
whether this was associated with the grade or experience
of personnel involved. Unfortunately, the information on the
personnel involved was so poorly documented, that
no comment can be made on this relationship.
Table 54. Evidence of diffi culty in obtaining an airway
Number of patients %
Yes 56 7.4
No 697 92.6
Subtotal 753
Insuffi cient data 42
Total 795
CHAPTER 6 - Airway and breathing
0
50
100
150
200
250
300
350
≤ 3 > 3 ≤ 4 > 4 ≤ 5 > 5 ≤ 6 > 6 ≤ 7 > 7 ≤ 8 > 8 ≤ 9 > 9 Notrecorded
PaCO2 (kPa)
Num
ber o
f pat
ient
s
Figure 23. First ABG PaCO2 measurements

67
Cervical spine management
The National Institute for Health and Clinical Excellence
(NICE) guidance on management of head injuries11
recognises the problems of cervical spine imaging in some
circumstances and states that:
“The current initial investigation of choice for the
detection of injuries to the cervical spine is the plain
radiograph. Three views should be obtained and be of
suffi cient quality for reliable interpretation. However, in
certain circumstances CT is preferred.
• GCS below 13 on initial assessment,
• has been intubated,
• plain film series is technically inadequate (for
example, desired view unavailable), suspicious
or definitely abnormal,
• continued clinical suspicion of injury despite
a normal x-ray,
• the patient is being scanned for
multi-region trauma”.
Airw
ay and b
reathing
All severely injured patients who undergo CT imaging of the
head, or other body parts, should have CT imaging of the
cervical spine performed at the same time.
Table 56. Prehospital spine immobilisation
Number of patients %
Cervical spine 32 9.6
Whole spine 45 13.6
Cervical spine & whole spine 255 76.8
Subtotal 332
Neither documented 172
Total 504
Table 56 shows data on what protection was given to the
cervical spine, and whole spine, in the prehospital phase
(data from PRF).
Of the 172 patients with no cervical spine immobilisation
documented in the prehospital phase 69 had cervical spine
immobilisation on admission to the emergency department
(40.1%).
Table 57 shows the advisors’ assessment of measures to
control the cervical spine. Overall there was concern that in
55/660 (8.3%) cases where it could be assessed the cervical
spine was not adequately managed. In 135 cases there was
insuffi cient data for the advisors to make an assessment.
Table 57. Appropriate control of cervical spine (advisors’ opinion)
Yes No Subtotal Insuffi cient data Total
Prehospital 332 6 338 35 373
In hospital 166 15 181 29 210
Subtotal 498 21 519 64 583
Not recorded 107 34 141 71 212
Total 605 55 660 135 795
6

68
Table 58 shows reasons for advisors’ concerns.
Table 58. Reasons for advisors’ concerns with regard to inappropriate control of cervical spine
No evidence of protection 22
Delay in protection 5
Not appropriately cleared 11
Needed imaging 3
Unable to fi t collar 4
Other 10
Total 55
Imaging and clearance of the cervical spine was often
commented on during the peer review process. There were
frequent problems with adequate imaging of the cervical spine
in unconscious patients. There were often multiple attempts
at plain x-rays of the cervical spine, even in those patients
who were undergoing CT scanning of another body part.
Reluctance to provide CT imaging of the cervical spine at the
same time as head CT scan was commonly encountered.
CHAPTER 6 - Airway and breathing
One in eight patients arrived at hospital with either
a partially or completely obstructed airway.
Prehospital intubation failed on 11/85 attempts (12.9%).
131 patients were intubated either on admission or
within the fi rst 30 minutes after admission to hospital.
Data on grade of medical staff performing tracheal
intubation was poorly documented and not available in
223/362 cases (61.6%).
Management of the airway was considered
unsatisfactory in 52/741 cases (7%).
The management of the potentially unstable spine was
considered unsatisfactory in 55/660 cases (8.3%).
Key fi ndings
The current structure of prehospital management is
insuffi cient to meet the needs of the severely injured
patient. There is a high incidence of failed intubation
and a high incidence of patients arriving at hospital with
a partially or completely obstructed airway. Change
is urgently required to provide a system that reliably
provides a clear airway with good oxygenation and
control of ventilation. This may be through the provision
of personnel with the ability to provide anaesthesia
and intubation in the prehospital phase or the use of
alternative airway devices. (Ambulance trusts)
CT scanning of the cervical spine should be performed
in adult patients who have any of the following features:
• GCS below 13 on initial assessment
• has been intubated
• is being scanned for multi-region trauma
(Radiology heads)
Recommendations
Case study 1
A young patient was admitted following a motor
vehicle crash. Initial Glasgow Coma Score was 5 and
the right pupil was fi xed and dilated. The patient was
transferred for a CT head scan which showed some
cerebral contusions and swelling but no lesion requiring
neurosurgical intervention. Given the mechanism of
injury there was concern that the cervical spine may also
have been damaged. No CT of the cervical spine was
performed; instead the patient was transferred back to
the emergency department to have plain x-rays of the
cervical spine. Despite several attempts, plain x-rays
provided inadequate views of the whole cervical spine
and the patient was then transferred back to the CT
scanner for CT imaging of the cervical spine.
The clinical scenario in Case study 1 was not uncommon.

69
Airw
ay and b
reathing
References
1. Gorman DF, Teanby DN, Sinha MP, Wotherspoon J, Boot
DA, Molokhia A. Preventable deaths among major trauma
patients in Mersey Region, North Wales and the Isle of
Man. Injury 1996; 27:189–92
2. Esposito TJ, Sanddal ND, Dean JM, Hansen JD,
Reynolds SA, Battan K. Analysis of preventable pediatric
trauma deaths and inappropriate trauma care in
Montana. The Journal of Trauma 1999; 47:243–51
3. Papadopoulos IN, Bukis D, Karalas E, Katsaragakis S,
Stergiopoulos S, Peros G, Androulakis G. Preventable
prehospital trauma deaths in a Hellenic urban health
region: an audit of prehospital trauma care. The Journal
of Trauma 1996; 41:864–9
4. Hussain LM, Redmond AD. Are prehospital deaths from
accidental injury preventable? BMJ 1994; 23:1077–80
5. Cales RH, Trunkey DD. Preventable trauma deaths.
JAMA 1985; 254: 1059-63
6. Anderson ID, Woodford M, Donbal FT, Irving M.
Retrospective Study of 1000 Deaths from Injury in
England and Wales. BMJ 1989; 296:1305-8
7. Lockey D, Davies G, Coats T. Survival of trauma patients
who have prehospital tracheal intubation without
anaesthesia or muscle relaxants: observational study.
BMJ 2001;323:141
8. An Acute Problem? National Confi dential Enquiry into
Patient Outcome and Death. 2005.
http://www.ncepod.org.uk
9. Boegtz MS, Katz JA. Airway management of the trauma
patient. Semin Anaes 1985; 4:114-23
10. Dunham CM, Barraco RD, Clark DE, Daley BJ, Davis FE
3rd, Gibbs MA, Knuth T, Letarte PB, Luchette FA, Omert
L, Weireter LJ, Wiles CE 3rd; EAST Practice Management
Guidelines Work Group. Guidelines for emergency
tracheal intubation immediately after traumatic injury.
J Trauma 2003; 55:162-197
11. National Institute for Health and Clinical Excellence. Draft
NICE head injury guidance 2007 – http://guidance.nice.
org.uk/page.aspx?o=267085&c=91522
6

70
care at an appropriate facility19,20 and better outcomes for
the severely injured patient16, 21-24. Nevertheless, the majority
of preventable deaths after injury occur from unrecognised
and hence untreated haemorrhage, particularly within the
abdominal cavity25-28 making it perhaps the single most
important reversible cause of death in the trauma population.
Defi ning the point at which a patient becomes ‘shocked’ is
diffi cult as bleeding patients are often in a state of dynamic
physiologic fl ux. However, recognition of ongoing bleeding
is the fi rst step in management. The Advanced Trauma
Life Support (ATLS) course has become a well-recognised
and accepted paradigm in the initial management of the
bleeding patient. Although the optimum end points for
effective resuscitation are less clear clinically29,30, current
practice in the acute assessment of the injured patient is
based on a dictum of readily available and measurable
parameters such as blood pressure, pulse rate, respiratory
rate, capillary refi ll, oxygen saturations and Glasgow
Coma Score. This has formed the basis for the format of
questions in the management of circulation after injury for
this NCEPOD study. These are simple bedside assessments
which may be repeated, and aim to recognise the bleeding
patient early. In the physiologically normal, stable patient
who has not decompensated, time allows for more detailed
diagnostic workup for occult bleeding and organ injury.
Simple, rapidly performed tests should also be performed
early in management that may refl ect both regional and
global hypoperfusion including; pH, lactate, base defi cit and
bicarbonate levels31-36.
The modern approach to the management of haemorrhage
after injury has evolved greatly in the two decades with the
advent of better evidence based practice. Older diagnostic
tests, such as diagnostic peritoneal lavage (DPL) have now
been largely superseded by other imaging techniques such
as bedside ultrasound (focussed abdominal sonography for
trauma (FAST))37-39 and more judicious use of CT scanning
for the physiological normal and stable patient. In many
Introduction
The importance of haemorrhage control after injury is crucial.
Best published evidence suggests that 30-40% of early
trauma deaths are directly attributable to haemorrhage1,2.
The American College of Surgeons Committee on Trauma
Multiple Outcome Study has estimated that 62% of all
in-hospital trauma deaths occur within the fi rst four hours,
of which haemorrhage is either the primary cause or a
major contributing factor3. Not only does haemorrhage
contribute directly to early mortality, but blood loss leading
to hypotension is a major factor in the development of
secondary brain injury4,5 as well as contributing signifi cantly
to late trauma deaths from multi-organ failure6,7.
Shock is a condition of inadequate end-organ perfusion.
In the severely injured patient, shock may be multifactorial,
but haemorrhage is the leading aetiology. In the shocked
polytrauma patient, the physiologic and metabolic reserve
can quickly become exhausted, leading to decompensation
and a deadly triad of hypothermia, coagulopathy and
acidosis, all of which are independent prognostic indicators
of outcome8-13. Treatment of these patients is aimed at
preventing or reversing this metabolic derangement by
recognising fi rstly that haemorrhage exists (preferentially
before decompensation), followed by timely intervention to
arrest the bleeding and restore circulating volume, and hence
oxygenation, to the tissues. Such timely management is
associated with improved patient outcomes14,15.
The management of haemorrhage should begin in the
prehospital fi eld and continue right through the hospital
system in a continuous process of assessment, treatment
and reassessment in a timely, co-ordinated fashion. Modern,
dedicated trauma systems and major trauma centres
have developed out of a need for rapid transportation,
assessment and treatment of the bleeding patient. Such
dedicated shock-trauma systems are associated with shorter
prehospital times16-18, shorter throughput times to defi nitive
CHAPTER 7 - Management of circulation

71
ways, CT scanning is the ideal non-invasive test as long as
the patient’s condition allows. As a result many injuries can
now be safely managed conservatively or non-operatively40,41.
Advances in radiology have allowed a greater proportion of
bleeding patients to undergo successful angioembolisation
of bleeding arterial vessels, especially for injuries that are
traditionally diffi cult to manage operatively or are associated
with a high mortality42,43.
Other important standards of care have now become
commonplace for the exsanguinating trauma patient
subgroup. These approaches, which are almost
counterintuitive to classical surgical dogma, include
hypotensive resuscitation and damage control surgery.
These concepts place a much greater emphasis on
permissive blood pressure control at a subnormal but
survivable level, followed by rapid, intraoperative control of
haemorrhage in a staged fashion and less on diagnostic
workup and defi nitive treatment of injuries during the early
stages of treatment. Both concepts have been associated
with higher survival rates for the exsanguinating subgroup of
injured patients44-46.
Manag
ement o
f circulation
Despite the modern approach to the bleeding patient, there
is still one concept that has remained unchanged. Blood
is a precious commodity and early haemorrhage control,
whether it occurs naturally or after iatrogenic intervention
such as angioembolisation or intraoperatively by a surgeon,
is still paramount in achieving good patient outcomes. Thus,
effective and timely haemorrhage recognition and control
may be the single most important step in the emergency
management of the severely injured patient.
Results
Initial haemodynamic assessment
The casenotes available identifi ed that assessment of
pulse, blood pressure, capillary refi ll and temperature were
measured on arrival at hospital in 95.4%, 95.7%, 31.6% and
53.2% of cases respectively (Figure 24).
0
100
200
300
400
500
600
700
800
Blood pressure Pulse Capillary refill Temperature Fluid
Num
ber o
f pat
ient
s
Yes
Not recorded
Figure 24. Measurements in hospital
7

72
Fluid therapy
Fluids were administered to 638/795 (80.3%) patients.
Appropriateness of fl uid therapy
It was assessed by the advisors that fl uid resuscitation was
appropriate in 93.2% (602/646) of patients and inappropriate
in 44/646 cases (6.8%).
In 16 cases it was considered that there was very aggressive
fl uid therapy and that too much crystalloid was given. In fi ve
cases it was considered that blood, rather than continued
crystalloid, should have been transfused, as there was very
signifi cant haemorrhage. In 21 cases it was considered that
insuffi cient fl uid was given.
CHAPTER 7 - Management of circulation
0
100
200
300
400
500
600
700
Yes No Insuff icient data
Num
ber o
f pat
ient
s
Figure 25. Appropriate fl uid resuscitation to the degree of shock
Case study 2
A young back seat passenger was involved in a high-
speed road traffi c collision. Glasgow Coma Score was
14 on admission. A CT head scan excluded signifi cant
head injury. Haemoglobin level fell from 12 to 6 over
three hours. The eventual injuries identifi ed were: pelvic
fracture; splenic and renal lacerations; and mediastinal
haematoma. There was only one measurement of blood
pressure in the fi rst hour of admission and no IV access.
When the blood loss was recognised, the patient was
over transfused with six litres of crystalloid and three
units of blood.

73
Investigation of haemorrhage
It is often the case that an experienced trauma surgeon will
identify patients who need an immediate trauma laparotomy
simply by the nature of the trauma and their failure to
respond to fl uid therapy. In these cases further investigation
may be unnecessary and delay the time to defi nitive care,
which is associated with poorer outcomes.
Some patients will require further investigation and options
include DPL, FAST or CT scanning. The availability of these
options is described in the organisational chapter. Whilst the
use of DPL is falling as a consequence of better access to
more sophisticated imaging, only one in three emergency
departments had access to FAST.
Manag
ement o
f circulation
Use of investigations
Clinicians completing the A&E questionnaire indicated that
254/495 (51.3%) patients had a CT scan of the chest and/
or abdomen and/or pelvis for the assessment of injuries and
potential haemorrhage. For 18 patients this question was not
answered (Figure 26).
For the large majority of patients (185/241; 76.8%) the
reason given for not scanning the chest, abdomen or pelvis
was because it was not clinically indicated. However, 22
patients did not have a CT scan as they were considered too
unstable to be transferred to the CT scanner. For a further
three patients it was indicated that they were taken straight
to theatre. There was one case where a scan could not be
performed as the CT scanner was broken.
The percentage of patients requiring CT for investigation
for haemorrhage was found to be higher on assessment
of the casenotes (483/795; 60.8%) compared to that
reported in the A&E questionnaire. This was simply because
of the difference in the returned documentation (513 A&E
questionnaires v 795 sets of casenotes), there were no cases
0
50
100
150
200
250
300
Yes No Not answered
Num
ber o
f pat
ient
s
Figure 26. CT scan of the chest, abdomen or pelvis performed
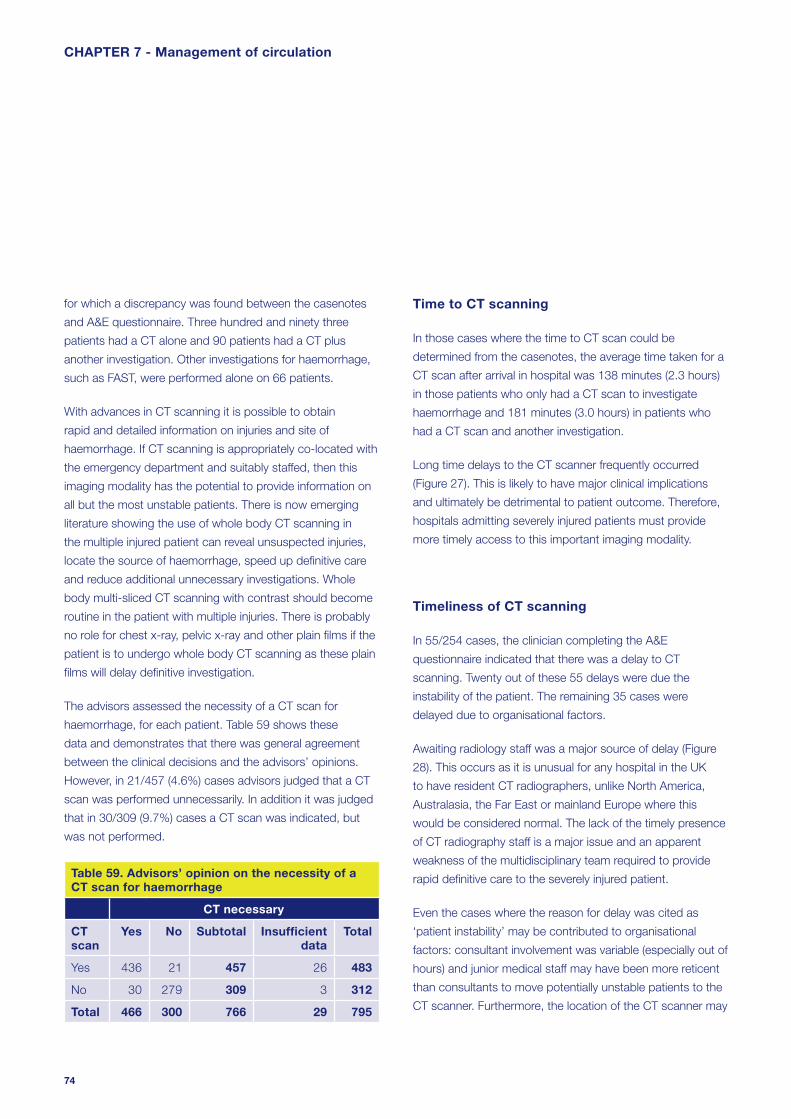
74
Time to CT scanning
In those cases where the time to CT scan could be
determined from the casenotes, the average time taken for a
CT scan after arrival in hospital was 138 minutes (2.3 hours)
in those patients who only had a CT scan to investigate
haemorrhage and 181 minutes (3.0 hours) in patients who
had a CT scan and another investigation.
Long time delays to the CT scanner frequently occurred
(Figure 27). This is likely to have major clinical implications
and ultimately be detrimental to patient outcome. Therefore,
hospitals admitting severely injured patients must provide
more timely access to this important imaging modality.
Timeliness of CT scanning
In 55/254 cases, the clinician completing the A&E
questionnaire indicated that there was a delay to CT
scanning. Twenty out of these 55 delays were due the
instability of the patient. The remaining 35 cases were
delayed due to organisational factors.
Awaiting radiology staff was a major source of delay (Figure
28). This occurs as it is unusual for any hospital in the UK
to have resident CT radiographers, unlike North America,
Australasia, the Far East or mainland Europe where this
would be considered normal. The lack of the timely presence
of CT radiography staff is a major issue and an apparent
weakness of the multidisciplinary team required to provide
rapid defi nitive care to the severely injured patient.
Even the cases where the reason for delay was cited as
‘patient instability’ may be contributed to organisational
factors: consultant involvement was variable (especially out of
hours) and junior medical staff may have been more reticent
than consultants to move potentially unstable patients to the
CT scanner. Furthermore, the location of the CT scanner may
for which a discrepancy was found between the casenotes
and A&E questionnaire. Three hundred and ninety three
patients had a CT alone and 90 patients had a CT plus
another investigation. Other investigations for haemorrhage,
such as FAST, were performed alone on 66 patients.
With advances in CT scanning it is possible to obtain
rapid and detailed information on injuries and site of
haemorrhage. If CT scanning is appropriately co-located with
the emergency department and suitably staffed, then this
imaging modality has the potential to provide information on
all but the most unstable patients. There is now emerging
literature showing the use of whole body CT scanning in
the multiple injured patient can reveal unsuspected injuries,
locate the source of haemorrhage, speed up defi nitive care
and reduce additional unnecessary investigations. Whole
body multi-sliced CT scanning with contrast should become
routine in the patient with multiple injuries. There is probably
no role for chest x-ray, pelvic x-ray and other plain fi lms if the
patient is to undergo whole body CT scanning as these plain
fi lms will delay defi nitive investigation.
The advisors assessed the necessity of a CT scan for
haemorrhage, for each patient. Table 59 shows these
data and demonstrates that there was general agreement
between the clinical decisions and the advisors’ opinions.
However, in 21/457 (4.6%) cases advisors judged that a CT
scan was performed unnecessarily. In addition it was judged
that in 30/309 (9.7%) cases a CT scan was indicated, but
was not performed.
Table 59. Advisors’ opinion on the necessity of a CT scan for haemorrhage
CT necessary
CT scan
Yes No Subtotal Insuffi cient data
Total
Yes 436 21 457 26 483
No 30 279 309 3 312
Total 466 300 766 29 795
CHAPTER 7 - Management of circulation

75
change the threshold for making the clinical decision that
the patient is stable enough to scan: it is clearly easier and
safer if the CT scanner is close to the emergency department
rather than in a remote area. In Europe, CT scanners are now
being installed into resuscitation rooms within the emergency
department to provide a comprehensive combined
resuscitation/investigation area.
Manag
ement o
f circulation
The philosophy of care that ‘unstable’ patients should not
be taken to the CT scanner is widely accepted but not
based on any evidence. It is common sense that an unstable
patient (i.e. a bleeding patient) will only be stabilised by
stopping the bleeding. Delaying surgery or scanning ‘to
wait for stabilisation’ does not make sense. If the patient is
considered too unstable for CT scan then transfer to theatre
is required instead.
0
20
40
60
80
100
120
≤ 1 > 1 ≤ 2 > 2 ≤ 3 > 3 ≤ 4 > 4
Time (hours)
Num
ber o
f pat
ient
s
Figure 27. Time to CT scan from arrival at hospital
0
5
10
15
20
25
Patient notstable enough
Awaitingradiology staff
Patient notstable enoughand awaiting
radiology staff
Awaitingaccess to CT
Awaitingsuitable
medical staff toaccompany
patient
Other Not answered
Reason
Num
ber o
f pat
ient
s
Figure 28. Reason for delay in CT scan (data from the A&E questionnaire)
7

76
Appropriateness of CT scanning
It was judged by the clinical advisors that a CT scan was
necessary in 466 of the cases. Seventeen patients did not
have a CT when the advisors thought that it was required. A
further 21 cases had a CT scan but it was assessed as being
unnecessary.
Reasons for assessment that the CT scan was unnecessary
(21cases) were:
• The patient was shocked with obvious
intraperitoneal haemorrhage and it was felt that
immediate surgery, rather than imaging, was
required (five cases)
• FAST had revealed free fluid and it was felt that no
further imaging should have been required prior to
surgery (five cases)
• No indication for imaging (six cases)
• No reason was supplied for this assessment
(five cases).
Appropriateness of assessment of haemorrhage
In general it was assessed that the possibility of
haemorrhage was investigated satisfactorily in 90.9%
(610/671) of cases. However, in 61/671 cases (9.1%) it
was considered that the possibility of haemorrhage was not
investigated satisfactorily. In 124 cases there was insuffi cient
information to assess this.
CHAPTER 7 - Management of circulation
Case study 3
An elderly patient was involved in a road traffi c collision.
The patient arrived at hospital speaking, pulse 120 but
blood pressure was unrecordable. The patient became
agitated and was intubated. A chest x-ray, pelvic
x-ray and abdominal ultrasound were performed. The
ultrasound of the abdomen revealed a splenic injury
and free fl uid in the peritoneal space. The patient was
then transferred to CT for chest, abdomen, head and
spine. During this time the patient was unstable and
received seven litres of fl uid and fi ve units of blood.
Following CT scanning, the patient was transferred to
critical care to be stabilised prior to laparotomy and
thoracotomy. At surgery splenic and liver injuries were
packed and a diaphragmatic tear repaired. The patient
returned from theatre unstable despite inotropic support
and subsequently arrested and died. The casenotes
did not document any consultant involvement in the
management of this patient and the advisors believed
that this was an avoidable death.

77
Interventions
One hundred and ten patients underwent surgery or further
procedures for the control of haemorrhage.
Procedures performed to manage haemorrhage
The procedures performed to manage haemorrhage are
shown in Figure 29. The majority of patients who were
operated on to manage abdominal trauma – 67/110 (60.9%)
required a laparotomy.
Interventional radiology has an increasing role to play in the
management of the multiple trauma patient44 and it was
noted that this was undertaken in only one case.
The infrequent use of interventional radiology is likely
to refl ect the lack of 24 hour availability of interrentional
radiology consultants who possess the necessary expertise
to perform these procedures. Such factors should be
considered and taken into account when planning regional
trauma services.
Manag
ement o
f circulation
Grade of surgeon
Fifty seven out of 73 (78%) operations, where the grade
could be determined, were performed by consultants
(Table 60).
Table 60. Grade of operating surgeon
Number of patients %
Consultant 57 78.1
SpR 16 21.9
Subtotal 73
Insuffi cient data 37
Total 110
0
10
20
30
40
50
60
70
80
Lapa
rotom
y
Thorac
otomy
Orthop
aedic
Craniot
omy/e
vacu
ation
Vascu
lar re
pair
Interv
entio
nal ra
diolog
yOthe
r
Not an
swere
d
Num
ber o
f cas
es
Figure 29. Procedure performed for haemorrhage control
7

78
The mean time to laparotomy in the group of patients
who had a CT scan was 499 minutes. The mean time to
laparotomy in the group of patients who did not have a CT
scan was 110 minutes.
Table 61 and Figure 30 show the relationship between CT
scanning and time to laparotomy.
Table 61. Time to laparotomy (hours) related to CT use
CT scan
Yes % No %
≤ 1 2 5.6 5 33.3
> 1 ≤ 2 4 11.1 6 40
> 2 ≤ 3 4 11.1 3 20
> 3 ≤ 4 8 22.2 0
> 4 18 50 1 6.7
Total 36 15
Appropriateness of surgeon
The advisors agreed that the experience of the surgeon
was appropriate in 63/73 of the cases for which the grade
could be determined. However, for 37/110 cases, poor
documentation, particularly of the grade of the surgeon
prevented judgement on the appropriateness of the
surgeon’s experience.
Time to surgery
It is important that defi nitive surgery is performed as soon as
possible after admission for the trauma patient with ongoing
haemorrhage.
It was possible to calculate the time to laparotomy in 51/67
cases.
The mean time to laparotomy in the whole group was 384
minutes (median 200 minutes).
CHAPTER 7 - Management of circulation
0
10
20
30
40
50
60
≤ 1 > 1 ≤ 2 > 2 ≤ 3 > 3 ≤ 4 > 4
Time to laparotomy (hours)
Perc
enta
ge o
f cas
es
CT scanNo CT scan
Figure 30. CT scan for haemorrhage and time to laparotomy

79
The time to trauma laparotomy in the whole group did
not compare favourably to published data from a trauma
centre47. In that study47 median time to laparotomy was 127
minutes compared to 200 minutes in this study. It can be
seen that the use of CT scanning was associated with much
longer times to trauma laparotomy but the reasons behind
this were not clear from the data collected.
Timeliness of surgery
The advisors were able to assess the timeliness of 87 of
the 110 procedures for haemorrhage. The interventions
performed were judged to be timely in 63/87 (72.4%) cases
and delayed in 24/87 (27.6%) (Figure 31).
Reasons given for delays in the initiation of the procedure
were multiple and often associated with the medical staff
not appreciating the urgency of the requirement to control
haemorrhage. Five patients were believed to have had
unnecessary imaging (CT scan) as it was clear that a trauma
Manag
ement o
f circulation
laparotomy was required. In 12 cases it was believed that the
severity of haemorrhage and urgency of the situation were
not appreciated. In two cases there was a delay in provision
of a staffed operating theatre.
Lack of senior involvement and lack of appreciation of clinical
urgency have been found in many areas of medicine involved
with acute care and the same problems have been found in
trauma management.
Imaging and delays to defi nitive care
Table 62 shows more data for the patients who required
surgery and the relationship between imaging and timeliness
of operation. As can be seen from the data, it was more
likely that delays were reported if imaging was performed as
opposed to a clinical decision that the patient required an
immediate operation. In the latter group, 19/20 patients were
considered to have received timely surgery.
0
10
20
30
40
50
60
70
Yes No Insufficient data
Num
ber o
f pat
ient
s
Figure 31. Procedure performed was timely (advisors’ view)
7

80
Outcome for patients requiring surgery
In this sample 72 hour mortality for patients who had surgery
was 22.7% (25/110) whereas for those who did not have
surgery for haemorrhage it was 13.7% (92/670).
It was observed that for those patients who had timely
intervention to control bleeding the 72 hour mortality was
23.8% (15/63) compared with 33.3% (8/24) where the
intervention was considered delayed.
Overall management
The overall management of the patients’ haemorrhage was
considered satisfactory by the advisors in 412/462 (89.2%).
More importantly, 50/462 (10.8%) cases were identifi ed as
not having satisfactory management of haemorrhage. No
assessment was made by the advisors on the remaining
333 cases, presumably as there was no clinical indication for
haemorrhage in these patients.
Imaging has a major role to play in the management of the
severely injured patient. However, as assessment must be
rapid and accurate, imaging should be appropriate and the
choice of modality should refl ect which is more likely to give
a rapid diagnosis. Inappropriate application of imaging or
delays in accessing imaging may delay defi nitive care.
Operative management – summary
It is clear from the above that there are concerns about
the operative management of the trauma patient. Whilst
78.1% of patients for whom the grade of surgeon could be
determined were operated on by a consultant, in 37 cases
requiring an intervention for haemorrhage there was no
documentation of the surgeon’s grade. In 27.6% of cases
it was felt that the operation was not performed in a timely
fashion.
CHAPTER 7 - Management of circulation
Table 62. Timely procedure and imaging for haemorrhage
Imaging for haemorrhage
Procedure timely CT CT & Other Other None Total
Yes 24 9 11 19 63
No 12 5 6 1 24
Subtotal 36 14 17 20 87
Insuffi cient data 15 3 2 3 23
Total 51 17 19 23 110

81
Overall management – operated cases
Table 63 shows that 19/98 patients who required an
operation were considered to have unsatisfactory
management.
Table 63. Overall management of haemorrhage was satisfactory
Number of patients %
Yes 79 80.6
No 19 19.4
Subtotal 98
Insuffi cient data 12
Total 110
In summary, there appeared to be problems with the
investigation and control of haemorrhage. The areas
of concern were principally the rapid recognition of
haemorrhage and the institution of defi nitive management.
There appeared to be delays to laparotomy and lack of initial
consultant input.
The inability to rapidly CT scan trauma patients may relate
to the proximity of the CT scanner to the emergency
department. Locating the scanner adjacent to, or as part of,
the resuscitation suite may rectify this problem. We also note
the limited use of interventional radiology in the management
of bleeding patients. There is evidence that increased use
of interventional radiology plays an important role in the
management of blood loss in the severely injured patient
and that integration of radiology staff and resources into the
trauma system may improve patient outcomes44.
Manag
ement o
f circulation
51.3% (254/495) of the patients had a CT scan of the
chest, abdomen and pelvis for assessment of blood loss.
In 55/254 (21.7%) cases there was a delay to
CT scanning.
In 61/671 cases (9.1%) it was felt that the possibility of
haemorrhage was not investigated satisfactorily.
110/795 patients (13.8%) underwent surgery or further
procedures for the control of haemorrhage.
57/73 (78.1%) operations were performed by
consultants.
In 37/110 (33.6%) poor documentation prevented the
grade of the surgeon being determined.
The interventions performed were considered untimely in
27.6% (24/87) of patients.
Where operative intervention for haemorrhage was
considered timely the 72 hour mortality was 23.8%
(15/63) compared to 33.3% (8/24) where the intervention
was considered delayed.
19/98 (19.4%) patients from whom data were
available and who required surgery for management of
haemorrhage had unsatisfactory overall management.
Key fi ndings
7
82
References
1. Shackford SR, Mackersie RC, Holbrook TL, et al. The
epidemiology of traumatic death: A population-based
analysis. Arch Surg 1993;128:571
2. Sauaia A, Moore FA, Moore EE, et al. Epidemiology of
trauma deaths: A reassessment. J Trauma 1995;38:185-
193
3. Champion HR, Copes WS, Sacco WJ, Lawnick MM,
Keast SL, Bain LW, Flanagan ME, Frey CF. The Major
Trauma Outcome Study: Establishing National Norms for
Trauma Care. J Trauma 1990; 30: 1356-1365
4. Marmarou A, Anderson RL, Ward JD, et al. Impact
on ICP instability and hypotension on outcome in
patients with severe head trauma. J Neurosurg
1991;75(suppl):S59-S66
5. Chestnut RM, Marshall LF, Klauber MR, et al. The role
of secondary brain injury in determining outcome from
severe head injury. J Trauma 1993;34:216-222
6. Goins WA, Reynolds HN, Nyanjom D, et al. Outcome
following prolonged intensive care unit stay in multiple
trauma patients. Crit Care Med 1991;19:339
7. Moore FA, Moore EE. Evolving concepts in the
pathogenesis of postinjury multiple organ failure. Surg
Clin North Am 1995;75:257
8. Jurkovich GJ, Greiser WB, Lyterman A, et al.
Hypothermia in trauma victims: an ominous predictor
of survival. J Trauma 1987;27:1019-1024
9. Luna GK, Maier RV, Pavlin EG, et al. Incidence and effect
of hypothermia in seriously injured patients. J Trauma
1987;27:1014-1017
CHAPTER 7 - Management of circulation
Rapid identifi cation of patients who require immediate
surgery for control of haemorrhage is essential. Ongoing
fl uid requirements and instability identify a group of
patients who require immediate intervention rather
than further investigation. Local protocols should
clearly identify the patient population for whom it is
inappropriate to delay the surgery/intervention for
reasons of ‘stabilisation’ or further investigation. (Hospital
trusts, clinical directors and emergency physicians)
Trauma laparotomy is potentially extremely challenging
and requires consultant presence within the operating
theatre. (Clinical directors)
CT scanning will have an increasing role in the
investigation and management of trauma patients. In
major centres, CT facilities should be co-located with
the emergency department to provide a combined
investigation/resuscitation area. (Hospital trusts)
If CT scanning is to be performed, all necessary images
should be obtained at the same time. Routine use of
‘top to toe’ scanning is recommended in the adult
trauma patient if no indication for immediate intervention
exists. (Royal College of Radiology and radiology
department heads)
Timely access to CT scanning is essential. CT
radiographers should be available within 30 minutes of
the patient arriving in hospital. In larger trauma centres,
with a higher workload, CT radiographers should be
immediately available at all times.
In the setting of remote radiology facilities and/or lack of
timely access to CT scanning, unstable patients should
not be taken to the CT scanner. These unstable patients
should have immediate surgery. (Trauma team leader)
Recommendations
83
10. Reed RL, Bracey AW, Hudson JD, et al. Hypothermia
and blood coagulation: dissociation between
enzyme activity and clotting factor levels. Circ Shock
1990;32:141-152
11. Schreiber MA. Damage control surgery. Crit Care Clin
2004;20:101-118
12. MacLeod JB, Lynn M, McKenny MG, et al. Early
coagulopathy predicts mortality in trauma. J Trauma
2003;55:39-44
13. Cosgriff N, Moore EE, Sauaia A, et al. Predicting life-
threatening coagulopathy in the massively transfused
patient: hypothermia and acidosis revisited. J Trauma
1997;42:857-62
14. Hill DA, West RH, Roncal S. Outcome of patients with
haemorrhagic shock: an indicator of performance in a
trauma centre. J R Coll Surg Edinb 1995;40:221-4
15. Spahn DR, Cerny V, Coats TJ, et al. Management of
bleeding patients following major trauma: A European
guideline. Criti Care 2007;11:R17
16. Demetriades D, Chan L, Cornwell E, et al. Paramedic
vs. private transportation of trauma patients. Effect on
outcome. Arch Surg. 1996;131:133-8
17. Gervin AS, Fischer RP. The importance of prompt
transport of salvage patients with penetrating heart
wounds. J Trauma 1982;22:443-8
18. Gold CR. Prehospital advanced life support vs. ‘scoop
and run’ in trauma management. Ann Emerg Med.
1987;16:797-801
19. Feero S, Hedges JR, Simmons E, Irwin L. Does out-of-
hospital EMS time affect survival? Am J Emerg Med.
1995;13:133-5
Manag
ement o
f circulation
20. Regel G, Stalp M, Lehmann U, Seekamp A. Prehospital
care, importance of early intervention on outcome. Acta
Anaesthesiol Scand. 1997;110(Suppl.):71-6
21. Ruteledge R, Fakhry SM, Meyer A, Sheldon GF, Baker
CC. An analysis of the association of trauma centres with
per capita hospitalisations and death rates from injury.
Ann Surg 1993;218:512-24
22. Eastman AB, Schwab CW, Annest JL, et al. Position
paper on trauma care systems. J Trauma 1992;32:127-9
23. Shackford SR, Mackersie RC, Hoyt DB, et al. Impact of
a trauma system on outcome of severely injured patients.
Arch Surg 1987; 122:523-7
24. MacKenzie EJ, Rivara FP, Jurkovich GJ, et al.
A national evaluation of the effect of trauma-center care
on mortality. N Engl J Med. 2006;354:366-78
25. West JG, Trunkey DD, Lim RC. Systems of trauma care:
A study of two counties. Arch Surg 1979;114:455
26. Lowe DK, Gately HL, Goss JR, et al. Patterns of death,
complication and error in the management of motor
accident victims: Implications for a regional system
of trauma care. J Trauma 1983;23:503
27. Van Wagoner FH. A three year study of deaths following
trauma. J Trauma 1961;1:401
28. Tien HC, Spencer F, Tremblay LN, Rizoli SB, Brenneman
FD. Preventable deaths from hemorrhage at a level 1
Canadian trauma center. J Trauma. 2007; 62: 142-6
29. Porter JM, Ivatury RR. In search of the optimal end
points of resuscitation in trauma: a review. J Trauma
1998;44:908-14
30. Revell M, Greaves I, Porter K. Endpoints for fl uid
resuscitation in hemorrhagic shock. J Trauma
2003;54:S63-S67
7

84
40. Velmahos GC, Toutouzas KG, Radin R, Chan L,
Demetriades D. Nonoperative treatment of blunt
injury to solid organs. A prospective study. Arch Surg
2003;138:844-851
41. Velmahos GC, Toutouzas KG, Radin R, Chan L, Rhee P,
Tillou A, Demetriades D. High success with nonoperative
management of blunt hepatic trauma. The liver is a sturdy
organ. Arch Surg 2003;138:475-481
42. Cook RE, Keating JF, Gillespie I: The role of angiography
in the management of haemorrhage from major fractures
of the pelvis. J Bone Joint Surg Br 2002;84:178-182
43. Hamill J, Holden A, Paice R, et al. Pelvic fracture pattern
predicts pelvic arterial haemorrhage. Aust N Z J Surg
2000;70:338-343
44. Pryor JP, Braslow B, Reilly PM, Gullamondegi O,
Hendrick JH, Schwab CW. The evolving role of
interventional radiology in trauma care. J Trauma
2005;59:102-4
45. Rotondo M, Schwab CW, McGonigal M, et al.
Damage control: an approach for improved survival in
exsanguinating penetrating abdominal injury. J Trauma
1993;35:375-383
46. Shapiro MB, Jenkins DH, Schwab CW, et al. Damage
Control: collective review. J Trauma 2000;49:969-978
47. Henderson KI, Coats TJ, Hassan TB, Brohi K. Audit of
time to trauma laparotomy. Br J Surg 2000; 87:472-476
31. Vincent JL, Dufaye P, Berre J, et al. Serial lactate
determinations during circulatory shock. Crit Care Med
1983;11:449-451
32. Abramson D, Scalea TM, Hitchcock R, et al. Lactate
clearance and survival following injury. J Trauma
1993;35:584-589
33. Davis JW, Kaups KL, Parks SN. Base defi cit is superior
to pH in evaluating clearance of acidosis after traumatic
shock. J Trauma 1998;44:114-118
34. Davis JW, Shackford SR, MacKersie RC, Hoyt DB. Base
defi cit as a guide to volume resuscitation. J Trauma
1988;28:1464-1467
35. Davis JW, Kaups KL. Base defi cit in the elderly: a marker
of severe injury and death. J Trauma 1998;45:873-877
36. Fitzsullivan E, Salim A, Demetriades D, et al. Serum
bicarbonate may replace the arterial base defi cit in the
trauma intensive care unit. Am J Surg 2005;190:961-967
37. Porter RS, Nester BA, Dalsey WC. Use of ultrasound to
determine need for laparotomy in trauma patients. Ann
Emerg Med 1997;29:323-330
38. Rozycki GS, Ochsner MG, Schmidt JA, et al. A
prospective study of surgeon-performed ultrasound
as the primary adjuvant modality for injured patient
assessment. J Trauma 1995;39:492-498
39. Stengel D, Bauwens K, Sehouli J, et al. Systematic
review and meta-analysis of emergency ultrasounography
for blunt abdominal trauma. Br J Surg 2001;88:901-912
CHAPTER 7 - Management of circulation

85
Introduction
In the UK, traumatic brain injury accounts for 15-20%
of deaths between the ages of 5 and 35 years, with an
incidence of 9 per 100 000 per year1. Outcome after head
injury depends upon the initial severity of injury and also the
extent of any subsequent complications and how these are
managed. Most of the patients who attend hospital after
a head injury do not develop life threatening or disabling
complications in the acute stage. However, in a small but
important group of patients, outcome is made worse by
a failure to detect promptly or to deal adequately with
complications2-7.
There is a growing body of evidence that secondary
insults occur frequently and exert a profound, adverse
effect on outcome from severe head injury. It is therefore
recommended that hypotension (Systolic BP <90mmHg)
and hypoxia (PaO2 <8kPa) must be scrupulously avoided or
treated immediately to avoid worsening outcome8.
The use of guidelines in the early management of head
injuries was endorsed by a Department of Health seminar in
1983 and has been supported many times over the last two
Head
injury manag
ement
decades9-15. More recently, comprehensive guidelines have
been produced by the Scottish Intercollegiate Guidelines
Network (SIGN Guideline 46)16 and the National Institute for
Health and Clinical Excellence (NICE)17. There is, therefore,
no shortage of guidelines for the management of patients
who have suffered a head injury and it should be expected
that current practice would be informed by this literature.
Results
Incidence of neurotrauma
Of the 795 patients within the study, 493 (62.0%) had
suffered neurotrauma as part of their constellation of injuries.
Impact of neurotrauma
Table 64 shows the patient location at 72 hours after
admission to hospital. In this sample more patients with
neurotrauma were deceased at 72 hours when compared to
the rest of the sample.
CHAPTER 8 - Head injury management
Table 64. Patient location at 72 hours
Head injury Non head injury Whole sample
% % %
Level 3 care 158 35.7 81 30.9 239 33.9
Specialist ward 83 18.8 59 22.5 142 20.2
Deceased 87 19.7 30 11.5 117 16.6
Level 2 care 29 6.6 35 13.4 64 9.1
General ward 25 5.7 35 13.4 60 8.5
Transferred, outcome unknown 39 8.8 17 6.5 56 8.0
Home 18 4.1 3 1.1 21 3.0
Other 3 <1 2 <1 5 <1
Subtotal 442 262 704
Not documented 51 40 91
Total 493 302 795
8

86
Table 65. AVPU score in head injury group
Number of patients %
Alert 27 34.6
Verbal 18 23.1
Pain 13 16.7
Unresponsive 20 25.6
Subtotal 78
GCS and/or AVPU not recorded
18
Total 96
It is important to document neurological status so that any
changes can be recognised and acted upon. Pupil size
and reactivity should also be recorded when assessment of
conscious level is being made. NICE guidance recommends
that the GCS should be used in all communications about
head injured patients and that ambulance crews should
be fully trained in the adult and paediatric versions of the
Glasgow Coma Scale17.
In addition to a higher 72 hour mortality, head injured patients
required more critical care resources than non-head injured
patients.
Prehospital data
Assessment of neurological function
Figure 32 and Table 65 show the prehospital assessment
of conscious level in the patients who had suffered a head
injury. It should be noted that a patient report form (PRF) was
available for 320 of the 493 head injury group.
Most patients had a Glasgow Coma Score (GCS) calculated,
although some prehospital assessment was performed using
the AVPU (Alert, Verbal, Pain, Unresponsive) scale. Eighteen
patients had no assessment of neurological dysfunction.
CHAPTER 8 - Head injury management
0
10
20
30
40
50
15 14 13 12 11 10 09 08 07 06 05 04 03
Glasgow Coma Score
Num
ber o
f pat
ient
s
Figure 32. Prehospital Glasgow Coma Score measurement in head injury group
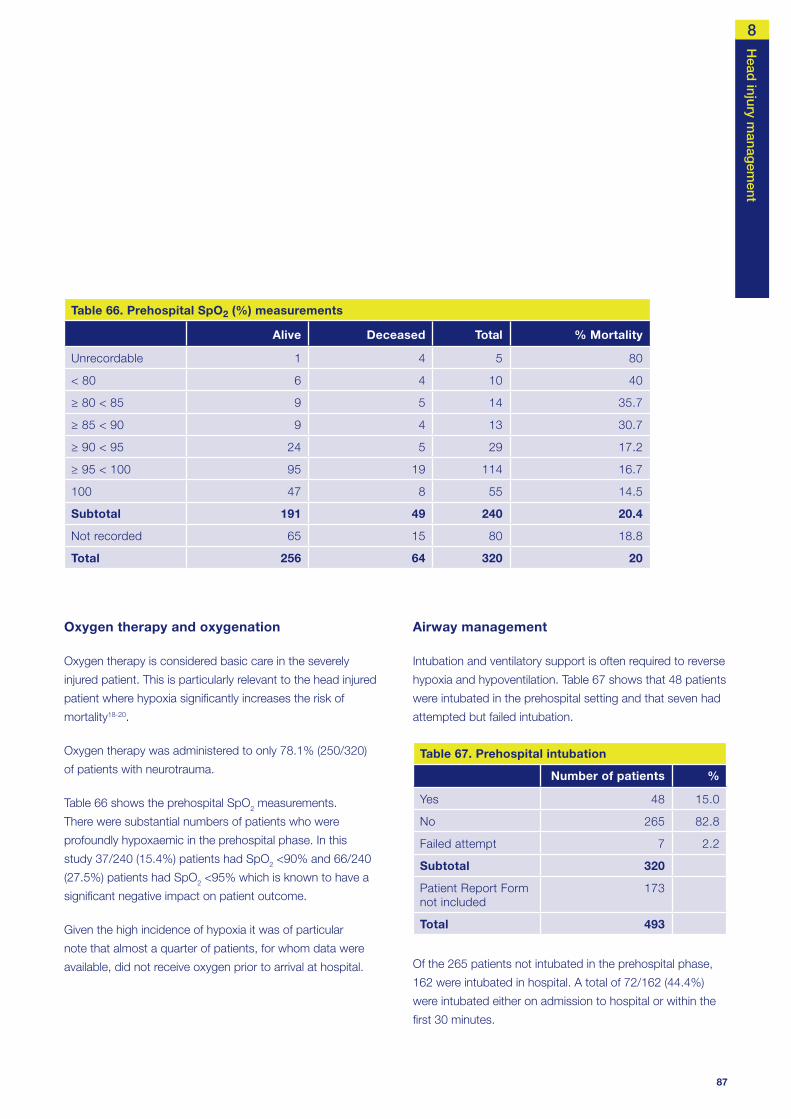
87
Oxygen therapy and oxygenation
Oxygen therapy is considered basic care in the severely
injured patient. This is particularly relevant to the head injured
patient where hypoxia signifi cantly increases the risk of
mortality18-20.
Oxygen therapy was administered to only 78.1% (250/320)
of patients with neurotrauma.
Table 66 shows the prehospital SpO2 measurements.
There were substantial numbers of patients who were
profoundly hypoxaemic in the prehospital phase. In this
study 37/240 (15.4%) patients had SpO2 <90% and 66/240
(27.5%) patients had SpO2 <95% which is known to have a
signifi cant negative impact on patient outcome.
Given the high incidence of hypoxia it was of particular
note that almost a quarter of patients, for whom data were
available, did not receive oxygen prior to arrival at hospital.
Head
injury manag
ement
Airway management
Intubation and ventilatory support is often required to reverse
hypoxia and hypoventilation. Table 67 shows that 48 patients
were intubated in the prehospital setting and that seven had
attempted but failed intubation.
Table 67. Prehospital intubation
Number of patients %
Yes 48 15.0
No 265 82.8
Failed attempt 7 2.2
Subtotal 320
Patient Report Form not included
173
Total 493
Of the 265 patients not intubated in the prehospital phase,
162 were intubated in hospital. A total of 72/162 (44.4%)
were intubated either on admission to hospital or within the
fi rst 30 minutes.
Table 66. Prehospital SpO2 (%) measurements
Alive Deceased Total % Mortality
Unrecordable 1 4 5 80
< 80 6 4 10 40
≥ 80 < 85 9 5 14 35.7
≥ 85 < 90 9 4 13 30.7
≥ 90 < 95 24 5 29 17.2
≥ 95 < 100 95 19 114 16.7
100 47 8 55 14.5
Subtotal 191 49 240 20.4
Not recorded 65 15 80 18.8
Total 256 64 320 20
8

88
Airway intervention and Glasgow Coma Score
Figure 33 and table 69 relate airway intervention to
prehospital assessment of conscious level. The greater the
degree of neurological injury, the greater the likelihood of the
need for intubation. All but two of the patients who had a
failed intubation attempt had a GCS of 3.
Table 69. AVPU score by intubation
Not intubated Intubated
Failed attempt
Alert 0 0 0
Verbal 0 0 0
Pain 8 4 1
Unresponsive 13 7 0
Total 21 11 1
Tables 70 and 71 show advisors’ assessment of prehospital
airway and ventilation management. In the opinion of the
advisors, all measures were taken to secure an adequate
airway in 234/273 cases and all measures to ensure
The patients who required prehospital intubation might
well have been more severely injured (hence the need for
advanced airway intervention). Table 68 shows outcome data
at 72 hours post injury in the head injured patients.
Table 68. Outcome at 72 hours by intubation in the prehospital phase
Not intubated Intubated
Failed attempt
% % %
Alive 225 84.9 30 62.5 1 14.3
Deceased 40 15.1 18 37.5 6 85.7
Total 265 48 7
The intubated group had a higher mortality than the non-
intubated group (37.5% v 15.1%). The failed intubation group
had a mortality rate of 85.7%. Although these are very small
numbers this group had a much worse outcome.
CHAPTER 8 - Head injury management
0
5
10
15
20
25
30
35
40
45
50
15 14 13 12 11 10 09 08 07 06 05 04 03
GCS/AVPU
Num
ber o
f pat
ient
s
Not intubatedIntubatedfailed attempt
Figure 33. Prehospital Glasgow Coma Score and intubation for the head injury group

89
adequate ventilation in 245/274 cases where suffi cient data
were available to make these assessments. This means that
there were concerns with airway management in 39 (14.3%)
cases and ventilatory management in 29 (10.6%) cases.
Table 70. Adequate airway
Number of patients %
Yes 234 85.7
No 39 14.3
Subtotal 273
Insuffi cient data 47
Total 320
Table 71. Adequate ventilation
Number of patients %
Yes 245 89.4
No 29 10.6
Subtotal 274
Insuffi cient data 46
Total 320
Head
injury manag
ement
This incidence of inadequate airway management does
not fi t with the current guidelines for the management of
severe head injury which state that patients who have
suffered severe head injury should be intubated and
receive ventilatory support. From Figure 33, 103 patients
with GCS less than 9 were not intubated prior to arrival at
hospital. It may be that the advisors did not include all the
unintubated patients in the inadequate airway management
group as they were aware of the constraints of the current
prehospital paramedic based system (with respect to ability
to anaesthetise and intubate patients).
Despite the above comments on the advisors’ opinion of
the incidence of airway problems, and the possible under
reporting of this issue, Table 72 shows that the 72 hour
mortality rate more than doubled for the group of patients
that advisors judged had received inadequate airway or
ventilatory management prehospital.
These data serve to underline the importance of adequate
airway control and avoidance of hypoxia and hypercapnia.
Table 72. Adequate airway/ventilation by outcome at 72 hours
Adequate airway Adequate ventilation
Yes % No % Yes % No %
Alive 192 82.1 23 59.0 199 81.2 16 55.2
Deceased 42 17.9 16 41.0 46 18.8 13 44.8
Total 234 39 245 29
8
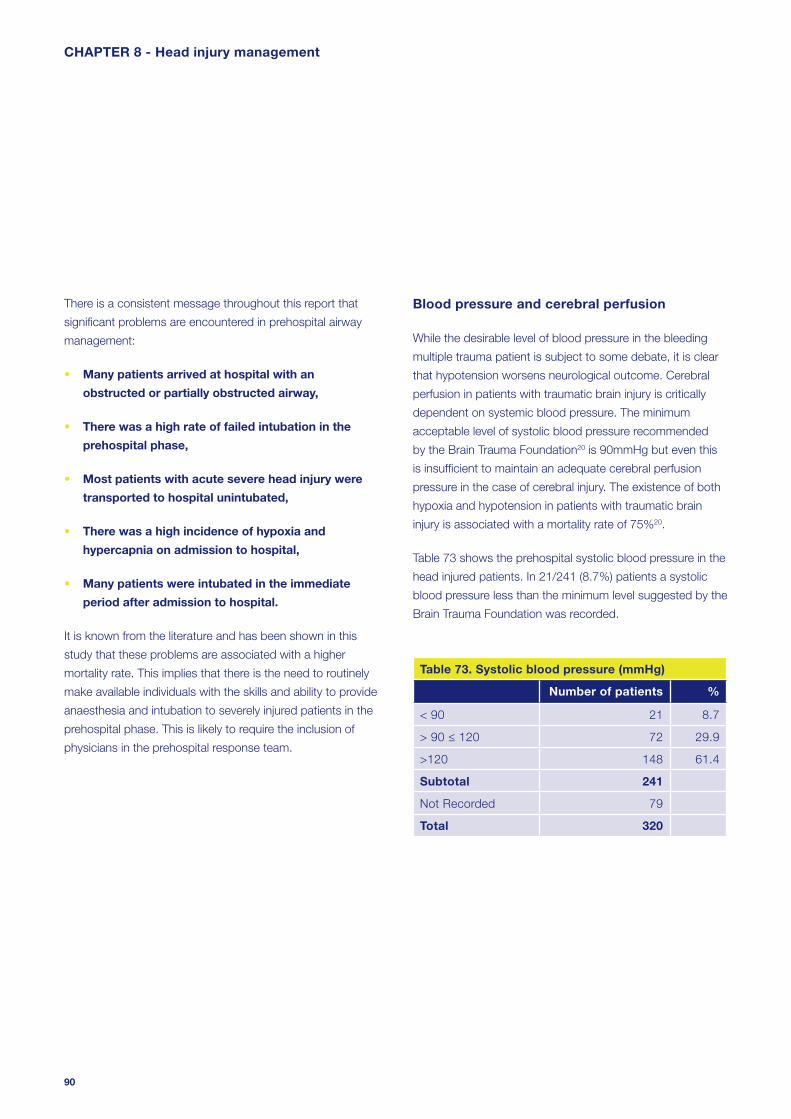
90
Blood pressure and cerebral perfusion
While the desirable level of blood pressure in the bleeding
multiple trauma patient is subject to some debate, it is clear
that hypotension worsens neurological outcome. Cerebral
perfusion in patients with traumatic brain injury is critically
dependent on systemic blood pressure. The minimum
acceptable level of systolic blood pressure recommended
by the Brain Trauma Foundation20 is 90mmHg but even this
is insuffi cient to maintain an adequate cerebral perfusion
pressure in the case of cerebral injury. The existence of both
hypoxia and hypotension in patients with traumatic brain
injury is associated with a mortality rate of 75%20.
Table 73 shows the prehospital systolic blood pressure in the
head injured patients. In 21/241 (8.7%) patients a systolic
blood pressure less than the minimum level suggested by the
Brain Trauma Foundation was recorded.
Table 73. Systolic blood pressure (mmHg)
Number of patients %
< 90 21 8.7
> 90 ≤ 120 72 29.9
>120 148 61.4
Subtotal 241
Not Recorded 79
Total 320
There is a consistent message throughout this report that
signifi cant problems are encountered in prehospital airway
management:
• Many patients arrived at hospital with an
obstructed or partially obstructed airway,
• There was a high rate of failed intubation in the
prehospital phase,
• Most patients with acute severe head injury were
transported to hospital unintubated,
• There was a high incidence of hypoxia and
hypercapnia on admission to hospital,
• Many patients were intubated in the immediate
period after admission to hospital.
It is known from the literature and has been shown in this
study that these problems are associated with a higher
mortality rate. This implies that there is the need to routinely
make available individuals with the skills and ability to provide
anaesthesia and intubation to severely injured patients in the
prehospital phase. This is likely to require the inclusion of
physicians in the prehospital response team.
CHAPTER 8 - Head injury management

91
Hospital data
Pre-alerts
Pre-alerts allow the emergency department to provide a
rapid and appropriate response. In the head injured patient,
where there is very strong linkage between avoidance
of secondary injury and good outcome, this rapid and
appropriate response is particularly important. Figure 34
shows the use of pre-alerts analysed by prehospital GCS.
The use of pre-alerts was variable. Even in the patient group
with a GCS of 8 or less (severe head injury) there were a
substantial number of patients arriving at hospital without
a pre-alert. Indeed, in the group with a GCS of 3, 22.4%
(17/76) of patients arrived at hospital without a pre-alert.
Head
injury manag
ement
NICE guidance on this aspect of care states17:
“Standby calls to the destination A&E Department should be
made for all patients with a GCS less than or equal to 8, to
ensure appropriately experienced professionals are available
for their treatment and to prepare for imaging”.
Data from this study showed that practice was falling well
short of this guideline. Fifty nine out of 160 (36.9%) patients,
in which it was recorded, with severe head injury did not
have a pre-alert. Delays to the amelioration of secondary
insults, imaging and defi nitive surgery (if required) could
adversely affect outcome.
0
20
40
60
80
100
120
15 13-14 9-12 4-8 3 Notrecorded
Glasgow Coma Score
Num
ber o
f pat
ient
s
Yes
No
Figure 34. Prehospital Glasgow Coma Score and documentation of an ambulance pre-alert
8

92
Table 74. Mortality rate by Glasgow Coma Score
Glasgow Coma Score Alive Deceased Total
% Mortality
03 51 49 100 49.0
04-08 98 17 115 14.8
09-12 56 7 63 11.1
13-14 97 2 99 2.0
15 87 4 91 4.4
Subtotal 389 79 468 16.9
Not recorded 17 8 25 32.0
Total 406 87 493 17.6
Assessment of neurological function on admission
Figure 35 shows the fi rst documented hospital GCS in the
group of patients who had suffered a head injury.
From Figure 35 it can be seen that 91 patients had minor
head injury (GCS 15), 99 had mild head injury (GCS 13-
14), 63 had moderate head injury (GCS 9-12) and 215
had severe head injury (GCS 3-8). Of these, 100 were fi rst
assessed to be completely unresponsive (GCS 3). For the
remaining 25 patients a GCS was not documented.
The 72 hour mortality rate for each group is shown in Table
74. The group of patients with GCS 3 had a much worse
outcome. It is well known that initial GCS is an independent
predictor of outcome.
CHAPTER 8 - Head injury management
0
20
40
60
80
100
120
15 14 13 12 11 10 09 08 07 06 05 04 03
Not rec
orded
Glasgow Coma Score
Num
ber o
f pat
ient
s
Figure 35. First hospital Glasgow Coma Score measurement in the head injury group

93
Frequency of neurological assessment
NICE guidance on this aspect of head injury management
states17:
“For patients admitted for head injury observation
the minimum acceptable documented neurological
observations are: GCS; pupil size and reactivity; limb
movements; respiratory rate; heart rate; blood pressure;
temperature; blood oxygen saturation. Observations
should be performed and recorded on a half-hourly
basis until GCS equal to 15 has been achieved.”
Frequent assessment of neurological function is a key part of
the management of the head injured patient. Rapid detection
of deterioration is important to allow timely investigation and
intervention, if required. Table 75 shows how often a GCS was
documented in the fi rst four hours after admission to hospital.
Table 75. Frequency of Glasgow Coma Score measurements during the fi rst four hours after admission
Number of patients %
0 41 8.3
1 92 18.7
2 98 19.9
3 73 14.8
4 44 8.9
5 29 5.9
6 27 5.5
7 18 3.7
8 13 2.6
> 8 58 11.8
Total 493
Head
injury manag
ement
While data was not collected about time to normalisation
of GCS in this study, it appears from Table 75 that the
frequency of observations may have been falling far short
of this NICE recommendation, as there is the opportunity to
perform eight sets of observations in the fi rst four hours.
Airway status on admission
Table 76 shows airway status on admission to hospital for
the head injured group. Sixty six patients arrived at hospital
with either a partially or completely obstructed airway. This
represented 18.3% of the non-intubated patients (66/361).
Table 76. Airway status on arrival for the head injury group
Number of patients %
Clear 295 69.7
Noisy 31 7.3
Blocked 35 8.3
Intubated 62 14.7
Subtotal 423
Not recorded 70
Total 493
Airway management in hospital
Many of these problems were addressed after arrival to
hospital but there were 37 patients for whom the advisors
felt that management of the airway and/or ventilation was
unsatisfactory in hospital (Table 77). These were primarily
concerns over lack of timely intubation and control
of ventilation.
8

94
Table 77. Overall airway management satisfactory
Number of patients %
Yes 417 91.9
No 37 8.1
Subtotal 454
Insuffi cient data 39
Total 493
After admission, mortality at 72 hours in the groups with
satisfactory and unsatisfactory airway management was
73/417 (17.5%) and 10/37 (27.0%) respectively.
There were a substantial number of patients who had less
than satisfactory management of airway and ventilation in
both the prehospital and hospital phase. These fi ndings
indicate the potential for secondary insults to occur. The
mortality rate in the unsatisfactory group supported this.
Admission pulse oximetry and blood gas analysis
Table 78 shows data on fi rst SpO2 measurements in hospital.
Slightly more than one in ten patients were hypoxaemic
(SpO2 <95%) despite prehospital treatment.
CHAPTER 8 - Head injury management
Table 78. SpO2 (%) measurements in hospital
Number of patients %
< 80 8 1.8
≥ 80 < 85 10 2.3
≥ 85 < 90 7 1.6
≥ 90 < 95 32 7.4
≥ 95 < 100 184 42.4
100 193 44.5
Subtotal 434
Not recorded 59
Total 493
Figures 36, 37 and 38 show the results of the fi rst arterial
blood gas (ABG) analysis after hospital admission. As can be
seen there were small, but appreciable, numbers of patients
who have signifi cant hypoxia (PaO2 <10kPa), hypercapnia
(PaCO2 >6kPa), hypocapnia (PaCO2 <4kPa) and acidosis (pH
<7.35). There were also a large number of cases where no
ABG analysis was performed (202/493).
0
50
100
150
200
250
≤5 >5 ≤10 >10 ≤15 >15 Not recorded
PaO2 (kPa)
Num
ber o
f pat
ient
s
Figure 36. First documented ABG PaO2 measurement

95
Head
injury manag
ement
0
50
100
150
200
250
≤ 3 > 3 ≤ 4 > 4 ≤ 5 > 5 ≤ 6 > 6 ≤ 7 > 7 ≤ 8 > 8 ≤ 9 > 9 Notrecorded
PaCO2 (KPa)
Num
ber o
f pat
ient
s
Figure 37. First documented ABG PaCO2 measurement
0
50
100
150
200
250
≤ 7.15 > 7.15≤ 7.25
> 7.25≤ 7.35
> 7.35≤ 7.45
> 7.45≤ 7.55
> 7.55 Notrecorded
pH
Num
ber o
f pat
ient
s
Figure 38. First documented ABG pH measurement
8

96
emergency department response should be to minimise and
rapidly correct these changes.
Given the importance of normoventilation and avoidance of
both hyper and hypocapnia in the setting of traumatic brain
injury the high number of patients without blood gas analysis
is unacceptable.
Hypoxia, hypercapnia, hypocapnia and acidosis are known
to be secondary insults that can worsen outcome in the head
injured patient. Hypocapnia is also detrimental to the head
injured patient as it causes cerebral vasospasm and can
exacerbate cerebral ischaemia. Clearly these physiological
derangements are likely to occur in severely injured patients,
therefore the aim of prehospital care and a well-organised
CHAPTER 8 - Head injury management
0
20
40
60
80
100
120
15 13-14 09-12 04-08 03 Notrecorded
Glasgow Coma Score
Num
ber o
f pat
ient
s
Prehospital
Hospital
No evidence
Figure 39. Glasgow Coma Score and intubation

97
Head
injury manag
ement
Case study 4
A middle-aged patient was admitted to the emergency
department at 22:15 hours following a fall onto the back
of the head. Admission GCS was documented as 6. It
appeared that the patient was admitted to the minor
injuries section of the emergency department. Despite
the low GCS and the history of head trauma there was
no ambulance pre-alert and no trauma team response.
The patient was placed in a cubical, commenced on
neuro observations, given 15l/min oxygen and placed
in the recovery position. No medical review happened
until 23:40 when the patient was seen by an SHO. This
medical review was prompted by the occurrence of a
tonic-clonic seizure. The patient’s GCS was recorded
as 3 after this seizure. No investigation or intervention
occurred at this time. The patient had a subsequent
seizure at 00:05 and was given Lorazepam at that
time. Finally at 01:00 the patient was taken for a CT
scan. The GCS was still recorded as 3. The patient was
not intubated and was escorted to radiology by the
surgical SHO. The CT scan revealed a large intracerebral
haemorrhage with signifi cant midline shift. The patient
was transferred back to the emergency department
and at 01:30 the patient was referred to the anaesthetic
SHO. The anaesthetic SHO contacted the SpR on
call for anaesthesia and following their attendance
the patient was intubated at 03:00. The patient
subsequently died from severe brain injury.
Carbon dioxide and outcome
Table 79 shows data on admission PaCO2 and 72 hour
mortality and illustrates the relationship between hypercapnia
and poor outcome.
Table 79. PaCO2 and 72 hour mortality
PaCO2 Alive Deceased TotalMortality
(%)
≤ 3 3 0 3 0
> 3 ≤ 4 21 3 24 12.5
> 4 ≤ 5 76 15 91 16.5
> 5 ≤ 6 72 10 82 12.2
> 6 ≤ 7 37 9 46 19.6
> 7 ≤ 8 14 5 19 26.3
> 8 ≤ 9 6 3 9 33.3
> 9 8 9 17 52.9
Subtotal 237 54 291 18.6
Not recorded 169 33 202 16.3
Total 406 87 493 17.7
Glasgow Coma Score and intubation
Hypoxia and hypercapnia may be precipitated by problems
with airway patency and/or ventilatory inadequacy. This is
more likely in the group of severe head injuries (GCS <9) but
can occur when there is any depression of consciousness.
Intubation of the trachea and ventilatory support may be
the best option to reverse these problems and prevent
secondary insults. This could be performed in the prehospital
setting or in the emergency department.
Figure 39 shows data about the setting of the intubation
analysed by severity of head injury. In the severe head injury
group, fi fty one patients were intubated prehospital and
another 150 patients were intubated in hospital. It should be
noted that for this group (head injury), no patient with a GCS
greater than 8 was intubated in the prehospital setting.
It is reasonable to assume that this group of 150 patients
may have benefi ted from earlier intubation and hence
avoidance of secondary insults. The need for prehospital
intubation raises many diffi cult questions (who should be able
to perform this task, the use of anaesthetic drugs/muscle
relaxants, risk and benefi ts of the procedure) and these may
become more relevant if the provision of services for the
severely injured patient undergoes service reconfi guration.
In addition it must be remembered that intubation without
anaesthesia is potentially harmful to head injured patients21.
8

98
Investigation of head injury
The NICE guidance on management of head injuries17 gives
a list of indicators for head CT scan. The list below is taken
from that guidance. Any patient who has suffered a head
injury with any of these factors should have a CT scan of the
head requested immediately.
Indicators for CT scanning in head injury:
• GCS less than 13 on initial assessment in the emergency department,
• GCS less than 15 at two hours after the injury on assessment in the emergency department,
• Suspected open or depressed skull fracture,
• Any sign of basal skull fracture (haemotympanum, ‘panda’ eyes, cerebrospinal fluid leakage from the ear or nose, Battle’s sign),
• Post traumatic seizure,
• Focal neurological deficit,
• More than one episode of vomiting,
• Amnesia for events more than 30 minutes
before impact.
Cerebral swelling and corticosteroids
Cerebral swelling and intracranial hypertension are other
important factors in secondary brain injury. There has
been a long-standing interest in the use of steroids to
minimise cerebral oedema and reduce intracranial pressure.
However, there are concerns over detrimental side effects
caused by steroid therapy and whether, in fact, steroids
confer any outcome benefi t. A recent study has addressed
this question22 showing that the use of corticosteroids in
traumatic brain injury caused harm. A signifi cant increase in
death and disability was found in the corticosteroid group.
There was no evidence that the effect of corticosteroids
differed by injury severity or time since injury. The conclusion
was that corticosteroids should not be used routinely in the
treatment of head injury.
There were a small number of cases (six) within this current
NCEPOD study where steroids were prescribed and given to
patients with head injuries as part of a management strategy
to prevent brain swelling and secondary injury. Clearly this
is not in line with current best evidence and cannot be
supported or recommended by NCEPOD.
CHAPTER 8 - Head injury management
0
50
100
150
200
15 13-14 09-12 04-08 03
Glasgow Coma Score
Num
ber o
f pat
ient
s
YesNot documented
Figure 40. Head CT scan and Glasgow Coma Score

99
It would appear that despite this guidance some patients
were not investigated appropriately. Forty-four patients with
a GCS less than 13 had no evidence of head CT scanning.
Without this essential investigation the scope of the injury
cannot be delineated and any subsequent management plan
may be sub-optimal.
Most patients who had suffered a signifi cant head injury
had a CT scan of the head (Figure 40). A small number
of patients with a depressed level of consciousness did
not have a CT head scan although the reasons for this
decision were not clear. It may be that within the group of
patients with a GCS of 3 there was no requirement for a CT
head scan as the severity of the injuries led to the clinical
conclusion that death was inevitable or that death occurred
before CT scanning could be undertaken.
Table 80 shows the reasons, stated in the A&E clinician
questionnaire, for not carrying out a CT head scan. In the
majority it was felt that scanning was not clinically indicated.
Head
injury manag
ement
Table 80. Reasons why a CT was not performed
Number of patients %
Not clinically indicated 128 88.9
Patient not stable enough 14 9.7
Unable to access CT 2 1.4
Subtotal 144
Not answered 11
Total 155
Timing of investigation of head injury
In the event that a CT scan of the head is required, it should
be performed as rapidly as possible. This does not only
mean that a scan is performed in a timely fashion, but also
that the images should be assessed and a report available.
Figure 41 shows the time from admission to CT scan
analysed by GCS. Few scans were performed within the
0
5
10
15
20
25
30
35
40
≤ 1 > 1 ≤ 2 > 2 ≤ 3 > 3 ≤ 4 > 4
Time to CT scan (hours)
Num
ber o
f pat
ient
s
1513-1409-1204-0803
Figure 41. Time to head CT scan by Glasgow Coma Score
8

100
The majority of cases were delayed because of
organisational factors (awaiting access to CT or awaiting
suitable medical staff). In only 22/75 cases was the delay
considered to be due to patient instability. Again, the
availability of CT radiography and radiology staff needs to be
considered.
Even patient instability may be considered an organisational
factor if one considers the grade of medical staff involved in
the early management of these patients. As shown earlier,
consultant involvement was variable (especially out of
hours) and junior medical staff may be more reticent than
consultants to move potentially unstable patients to the CT
scanner. Furthermore, the location of the CT scanner may
change the threshold for making the clinical decision that
the patient is stable enough to scan; it is clearly easier and
safer if the CT scanner is close to the emergency department
rather than in a remote area.
NICE gives guidance on the timing of CT scan after head
injury17. The guidance states that in those circumstances
described earlier:
fi rst hour after admission and some patients were not scanned
until several hours after admission. While this may be less
of a concern for patients with mild head injuries it may well
be that those with moderate to severe head injuries have
delays to recognition and management of remediable lesions.
Unfortunately, as can be seen from Figure 41, delays to CT
scanning were present across all categories of head injury
severity. Thirty-two patients with severe head injuries had to wait
more than two hours for this investigation to be performed.
The emergency medicine clinicians’ reasons for any delays to
CT head scanning are shown in Table 81.
Table 81. Reasons why there was a delay to a CT head scan
Number of patients %
Patient not stable 22 29.3
Awaiting radiology staff 28 37.3
Awaiting access to CT 17 22.7
Awaiting suitable medical staff 3 4.4
Other 5 6.7
Total 75
CHAPTER 8 - Head injury management
0
10
20
30
40
50
60
70
80
15 13-14 09-12 04-08 03 Not recorded
Glasgow Coma Score
Num
ber o
f pat
ient
s YesNoInsufficient data
Figure 42. Timeliness of CT scan by Glasgow Coma Score (advisors’ opinion)

101
“CT imaging of the head should be performed (i.e. imaging
carried out and results analysed) within one hour of the
request having been received by the radiology department.”
The practice demonstrated in this dataset fell well short of that
guidance. As a result there is the potential for delays in both
diagnosis and subsequent management of reversible pathology.
Advisor assessment of investigation of head injury
The advisors assessed whether a head CT scan was a
necessary part of each patient’s management. Table 82
shows these data and makes the point that there was
general agreement between the clinical decisions and the
advisors’ opinions. However, in 23/539 cases it was thought
that a CT scan was performed unnecessarily. Also in 24/220
cases a CT scan was indicated although this was not
performed: and it was felt that the lack of CT scanning may
have missed potentially treatable pathology.
Table 82. Advisors’ opinion on the necessity of a head CT scan
CT necessary
CT scan
Yes No Subtotal Insuffi cient data
Total
Yes 516 23 539 10 549
No 24 196 220 26 246
Total 540 219 759 36 795
In addition to the need for CT scanning, the advisors were
also asked to consider whether this was performed in a
timely fashion. Figure 42 shows this opinion analysed by
severity of head injury. Overall, the advisors believed that
one in four CT scans (103/412) were not performed in a
Head
injury manag
ement
timely fashion. Patients with severe head injuries, whose
management is most time critical, did not appear to have
more timely investigations. Again it should be noted that
the main reasons for delay were organisational, rather than
patient related, factors.
Interpretation of CT scans
Accurate interpretation of the CT scan is essential. Tables
83 and 84 show the grade and specialty of clinicians
involved. The majority of images were reported by
consultant radiologists. These data were taken from the A&E
questionnaire and most likely refl ect the fi nal report of the
CT scan. Most investigations performed, particularly out of
hours, had a provisional report written in the notes by a more
junior doctor.
Table 83. Grade of clinician interpreting the CT scan
Number of patients %
Consultant 196 59.9
NCCG 1 <1
SpR 37 11.3
SpR1/2 7 2.1
SpR3 85 26.0
SHO 1 <1
Subtotal 327
Not answered 24
Total 351
8
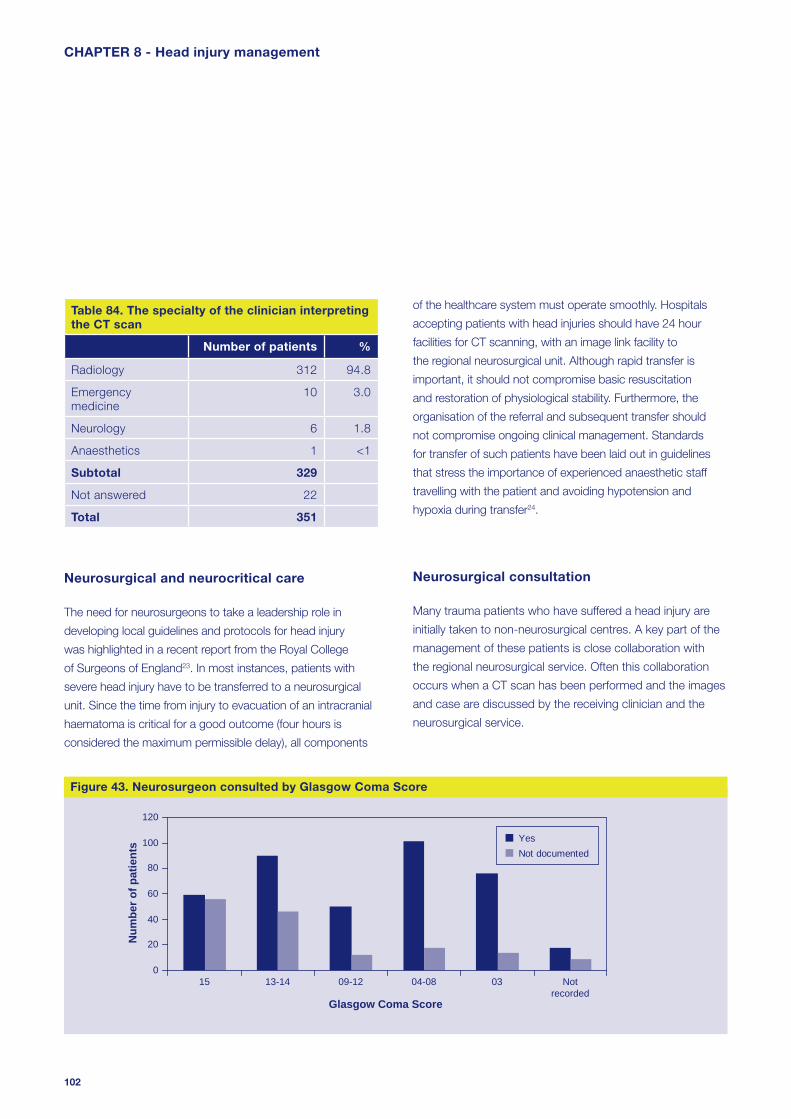
102
of the healthcare system must operate smoothly. Hospitals
accepting patients with head injuries should have 24 hour
facilities for CT scanning, with an image link facility to
the regional neurosurgical unit. Although rapid transfer is
important, it should not compromise basic resuscitation
and restoration of physiological stability. Furthermore, the
organisation of the referral and subsequent transfer should
not compromise ongoing clinical management. Standards
for transfer of such patients have been laid out in guidelines
that stress the importance of experienced anaesthetic staff
travelling with the patient and avoiding hypotension and
hypoxia during transfer24.
Neurosurgical consultation
Many trauma patients who have suffered a head injury are
initially taken to non-neurosurgical centres. A key part of the
management of these patients is close collaboration with
the regional neurosurgical service. Often this collaboration
occurs when a CT scan has been performed and the images
and case are discussed by the receiving clinician and the
neurosurgical service.
Table 84. The specialty of the clinician interpreting the CT scan
Number of patients %
Radiology 312 94.8
Emergency medicine
10 3.0
Neurology 6 1.8
Anaesthetics 1 <1
Subtotal 329
Not answered 22
Total 351
Neurosurgical and neurocritical care
The need for neurosurgeons to take a leadership role in
developing local guidelines and protocols for head injury
was highlighted in a recent report from the Royal College
of Surgeons of England23. In most instances, patients with
severe head injury have to be transferred to a neurosurgical
unit. Since the time from injury to evacuation of an intracranial
haematoma is critical for a good outcome (four hours is
considered the maximum permissible delay), all components
CHAPTER 8 - Head injury management
0
20
40
60
80
100
120
15 13-14 09-12 04-08 03 Notrecorded
Glasgow Coma Score
Num
ber o
f pat
ient
s YesNot documented
Figure 43. Neurosurgeon consulted by Glasgow Coma Score

103
Figure 43 shows data on whether there was discussion with
the neurosurgical service. In the majority of cases where a
patient suffered a head injury, a neurosurgical consultation
was performed. However, it was noted that 44/271 (16.2%)
patients with moderate or severe head injuries had no
evidence of neurosurgical involvement. Within this group
of 44 patients it is possible that consultation was not
undertaken due to the extent of head and/or other injuries
leading to the conclusion that death was inevitable.
As part of the peer review process, advisors were asked
whether a neurosurgical consultation was a necessary part of
each individual case. Of the 155 cases where there was no
evidence of neurosurgical involvement the advisors felt that
this should have occurred in 28 cases (18.1%).
Head
injury manag
ement
Location of neurosurgical support
Figure 44 shows the location of the neurosurgical service in
relation to the admission location. More patients received
offsite neurosurgical support than onsite.
These data suggest that 197/365 (54.0%) patients who
required neurosurgical involvement were taken to hospitals
that may not have had the necessary infrastructure (on site
neurosurgical expertise) to meet their needs. Given the
time critical nature of neurosurgical intervention in traumatic
brain injury this had the potential to introduce delays
into defi nitive management, which may affect outcome.
Although we accept that in many circumstances taking
the patient directly to a neurosurgical centre may be more
appropriate, consideration of the pattern and severity of
injuries and the likely services required should be taken into
account when the prehospital clinicians are transporting
the severely injured patient to hospital. However, it does
appear that direct admission to a trauma centre compared to
secondary transfer is associated with a better outcome25 and
neurosurgeons and ambulance trusts should agree protocols
on this aspect of care.
0
10
20
30
40
50
60
15 13-14 09-12 04-08 03 Not recorded
Glasgow Coma Score
OnsiteOffsiteNot documented
Num
ber o
f pat
ient
s
Figure 44. Location of consulted neurosurgeon
8

104
Case study 5
A young patient was admitted to hospital after sustaining
a head injury. Admission GCS was 5. CT head
scanning revealed a large intracerebral haemorrhage,
cerebral oedema and midline shift. Referral was made
to the regional neurosurgical centre at 01:15. The
neurosurgical SpR stated that there were no beds in the
ICU and advised that the patient be referred to another
neurosurgical centre. After some diffi culty in contacting
the on call neurosurgeon, the patient was discussed
with the neurosurgical SpR at a second centre. This
occurred at 02:15. The neurosurgical SpR stated that
they had beds available and would be prepared to take
the patient but that the opinion of whether transfer
should occur should be made by the local neurosurgical
centre that had no capacity to take the patient. A further
telephone call was made to the local neurosurgical
centre at 02:30 who felt that as they had no capacity
they could not comment on the patient care. At 03:00
a second telephone call was made to the second
neurosurgical centre and at that point the neurosurgical
SpR requested that hard copies of the CT be sent to
him. Six more telephone calls occurred over the next
few hours between the initial hospital and three different
neurosurgical centres. By 06:30 the patient, who was
still in the emergency department, had fi xed and dilated
pupils and it was believed that death was the inevitable
outcome. The patient was admitted to ICU and after
a period of family discussion ventilatory support was
withdrawn. At no time was brain stem death confi rmed
or considered. Organ donation, either heart beating or
non-heart beating, was never discussed.
CHAPTER 8 - Head injury management
Time to neurosurgical consultation
The availability of onsite neurosurgical support may affect
time to consultation and intervention. In 14 cases it was not
known if the consultation was on or offsite. These data are
shown in Table 85.
Table 85. Time (hours) to neurosurgical consultation
All (%) Onsite (%) Offsite (%)
≤ 1 26 10.2 15 13.6 8 6.2
>1≤2 56 22.1 24 21.8 30 23.1
>2≤3 54 21.3 20 18.2 30 23.1
>3≤4 32 12.6 7 6.4 24 18.5
>4≤5 21 8.3 5 4.6 7 5.4
>5≤6 14 5.5 13 11.8 8 6.2
>6≤12 28 11.0 10 9.1 17 13.1
>12 23 9.1 16 14.6 6 4.6
Total 254 110 130
Neurocritical care capacity
The supply of emergency neurosurgical beds in the UK is
limited. A recent survey revealed that only 43 neurosurgical
intensive care beds are available for an overall estimated
population of 63.6 million26. This shortfall can lead to delays
in patient transfer, and is symptomatic of larger resource and
workload issues for neurosurgery in the UK27. These larger
resource problems have many implications for head injury
care, including delays obtaining a neurosurgical opinion at
night, or at the weekend.
One consequence of this lack of capacity in neurosurgical
critical care beds is that some patients may stay in their
‘local’ critical care unit rather than be transferred to the
neurosurgical centre. This may have an adverse effect on
patient outcome. In a recent study it was shown that patients
with severe head injury who were treated only in non-
neurosurgical centres had a 26% increase in mortality and a
2.15-fold increase (95% CI 1.77-2.60) in the odds of death
adjusted for case mix compared with patients treated at a
neurosurgical centre28. This suggests that transfer to, and
treatment in, a neurosurgical centre is an important part of
the management plan for patients with severe head injury.

105
Within this current study there were many, albeit less
extreme, instances of diffi culties in contacting the
neurosurgeon on call, lack of willingness to accept patients
with severe head injuries, lack of capacity in neurosurgical
centres and clear lack of protocols to smooth the process of
care between the local centres and the neurosurgical centre.
Neurosurgical procedures
The number of patients who undergo major neurosurgical
procedures each year following a head injury is also unclear. A
fi gure of around 4,000 patients per year for the UK as a whole
has been quoted29, but this may an overestimate. Hospital
Episode Statistics data for the 2000/2001 annual dataset indicate
that 398 patients in England underwent an operation to drain
the extradural space (OPCS code A40) and 2,048 patients
underwent an operation to drain the subdural space (OPCS
code A41)30. These fi gures do not include a number of other
neurosurgical procedures possible after head injury (including burr
hole for chronic subdural haematoma or insertion of intracranial
pressure monitors), and include some patients with a non-head
injury diagnosis. Thus, the routine data available does not allow
for a precise fi gure of neurosurgical volume after head injury for
England and Wales, but points to a fi gure in the low thousands.
Table 86. Type of surgery performed
Number of patients %
Evacuation of subdural haematoma 20 17.5
Evacuation of extradural haematoma
22 19.3
Evacuation of intracerebral haematoma / contusion
7 6.1
Insertion of intracranial pressure bolt only
48 42.1
Elevation of fracture 7 6.1
Decompressive craniectomy 5 4.4
Other 5 4.4
Total 114
Head
injury manag
ement
Table 86 shows that 114 patients had a surgical procedure
as a consequence of head trauma (23% of the head injured
patients). The majority of this activity (48 cases) involved the
insertion of an intracranial pressure (ICP) monitoring device,
with no further surgery in the fi rst 72 hours. A further 54
operations were related to the evacuation of traumatic space
occupying lesions or decompressive craniectomy.
Grade of operating surgeon
Table 87 shows the grade of clinician performing the surgery.
Only 15.8% of interventions were documented as being
performed by consultants.
Table 87. Grade of surgeon performing the surgery
Number of patients %
Consultant 12 15.8
SpR 56 73.7
SHO 8 10.5
Subtotal 76
Not documented 38
Total 114
This was a lower level of consultant involvement than has
been seen in past NCEPOD studies31,32. Given the volume
of surgery performed annually as a result of head trauma29
this potentially represents a substantial amount of surgery
performed by doctors in training. However, the insertion of
an intracranial pressure monitor is generally performed at the
bedside and is likely to be an appropriate procedure to be
delegated to junior neurosurgical staff with suffi cient training.
8

106
Time to neurosurgical intervention
Table 89 shows time to surgery analysed by whether the
patient required a secondary transfer to another site to have
this surgery performed.
Table 89. Time to surgery (hours)
Onsite Transferred
% %
≤ 4 22 66.7 6 14.0
>4 ≤ 8 9 27.3 23 53.5
>8 ≤ 12 2 6.0 4 9.3
>12 0 0 10 23.3
Subtotal 33 43
Not recorded 23 15
Total 56 58
The requirement for a secondary transfer signifi cantly
increased the time to surgical intervention. Indeed, only
6/43 patients requiring transfer had neurosurgery within
the fi rst four hours after injury. Intensive head injury care
begins at the scene of the accident. It includes protecting
the airway and cerebral circulation which may involve the
urgent removal of clots, but may also (or only) require the
insertion of pressure monitors to guide longer-term therapy.
Rapid surgery is crucial for patients with intracerebral
haematomas requiring evacuation, where every moment’s
delay jeopardises eventual outcome, but is less vital for
patients requiring intracerebral pressure monitoring as part
of the overall intensive care management of diffuse brain
injury. For this reason, despite surgery occurring after four
hours in 11/33 (33.3%) of onsite patients and 37/43 (86.0%)
of transferred patients, these operations were considered
For this reason Table 88 shows the grade of surgeon for the
cases excluding insertion of an ICP monitor.
Table 88. Grade of surgeon excluding insertion of an ICP monitor
Number of patients %
Consultant 9 18.8
SpR 38 79.2
SHO 1 2.1
Subtotal 48
Not recorded 18
Total 66
Even when these more minor procedures have been
excluded only 18.8% (9/48) of operations were documented
as being performed by a consultant.
During expert and advisor group meetings to discuss the
fi ndings in this study the issue of consultant neurosurgical
involvement generated signifi cant discussion. Whilst the
insertion of an intracranial pressure monitor may well be
within the remit of appropriately trained junior staff, most
major neurosurgical procedures were being performed by
these same staff in training.
The system of junior staff care is also changing: European
Working Time Directive, Modernising Medical Careers and
the Hospital at Night project have signifi cantly changed the
level of junior staff experience and support from that available
in previous years.
Given this discussion, it is felt that the low level of direct
consultant involvement in the management of patients who
require major neurosurgical procedures is undesirable and
that a much higher input is required.
CHAPTER 8 - Head injury management

107
timely in 68/81 (84.0%). Of the 16% of cases where it was
felt that surgery was not performed in a timely manner, 10/13
required evacuation of clots or craniectomies where delays
are undesirable and have a negative impact on outcome
(Table 90).
This delay is in keeping with a recent study which showed
that the mean transfer time to a neurosurgical centre for
patients with an extradural haematoma and subdural
haematoma was 5.25 and 6 hours respectively33.
Clearly these delays may affect outcome and this again
raises the issue of transfer to an appropriate hospital in
the fi rst instance and reconfi guration of trauma services
for regions.
Table 90. Timeliness of neurosurgery
Number of patients %
Yes 68 84.0
No 13 16.0
Subtotal 81
Insuffi cient data 33
Total 114
Head
injury manag
ement
Overall assessment of management of head injured patients
The advisors were asked to assess the overall management
of the patient using the grading system detailed in the
methods section (Table 91).
Table 91. Overall assessment of head injury management
Number of patients
%
Good practice 205 41.6
Room for improvement clinical 80 16.2
Room for improvement organisational 114 23.1
Room for improvement clinical and organisational
46 9.3
Less than satisfactory 25 5.1
Insuffi cient data 23 4.7
Total 493
Less than half the patients (205/493) were thought to have
received a standard of care that could be described as good
practice. In 240/493 (48.7%) cases it was thought that there
was room for improvement in organisational and /or clinical
aspects of care. Of concern were the 25/493 (5.1%) cases
where it was thought that patient management was less
than satisfactory, signifying a signifi cant problem in the
care process.
8

108
CHAPTER 8 - Head injury management
Head trauma is very common in the severely injured
patient and has a negative impact on outcome.
Secondary insults (hypoxia, hypercapnia and
hypotension) are common and these are known to
worsen eventual outcome (higher mortality and more
severe disability).
The prehospital management of the airway and
ventilation was inadequate in 14.3% and 10.6% of cases
respectively.
In a small number of cases steroids are being used in
the routine management of the head injured patient,
despite evidence that this therapy may cause harm.
One in fi ve patients who required a head CT scan did
not have this performed in a timely fashion.
Delays in CT scanning were primarily due to
organisational factors rather than patient factors.
More than half of the patients who required neurosurgical
advice or input were taken to hospitals where there was
no onsite neurosurgical service.
Only 6/43 (14.0%) patients who required a secondary
transfer to access neurosurgical services had an
operation within four hours of injury.
There were delays to neurosurgery in 13/81 (16.0%)
cases. Most of these cases were evacuation of traumatic
space occupying lesions.
Key fi ndings Only 9/48 (18.8%) patients who had major neurosurgical
procedures as a result of trauma were operated on by
consultant surgeons.
Less than half of the severely injured patients who
suffered head trauma received a standard of care that
was judged to be good practice.
109
Head
injury manag
ement
References
1. Teasdale GH. J Neurol Neurosurg Psychiatry 1995; 58:
855-887
2. Rose J, Valtonen S, Jennett B. Avoidable factors
contributing to death after head injury. BMJ 1977; 2:
615-8
3. Jennett B, Carlin J. Preventable mortality and morbidity
after head injury. Injury 1978; 10: 31-9
4. Rockswold GL, Leonard PR, Nagib MG. Analysis of
management in thirty-three closed head injury patients
who ‘talked and deteriorated’. Neurosurgery 1987; 21:
51-5
5. Mendelow AD, Karma MZ, Paul KS, Fuller GA, Gillingham
FJ. Extradural haematoma: effect of delayed treatment.
BMJ 1979; I: 1240-2
6. Klauber MR, Marshall LF, Luerssen TG, Frankowski
R, Tabaddor K, Eisenberg HM. Determinants of head
injury mortality: importance of the low risk patient.
Neurosurgery 1989; 24: 31-6
7. O’Sullivan MG, Gray WP, Buckley TF. Extradural
haematoma in the Irish Republic: an analysis of 82 cases
with emphasis on delay. Br J Surg 1990; 77: 1391-4
8. Brain Trauma Foundation, American Association of
Neurological Surgeons, Joint Section on Neurotrauma
and Critical Care. Guidelines for the management of
severe head injury. J. Neurotrauma 1996; 13: 641-734
9. The management of acute head injury: seminar papers.
London: DHSS 1983
Prehospital assessment of neurological status should be
performed in all cases where head injury is apparent or
suspected. This should be performed using the Glasgow
Coma Scale. Pupil size and reactivity should also be
recorded. (Ambulance trusts)
A pre-alert should be made for all trauma patients with
a GCS less than or equal to 8, to ensure appropriately
experienced professionals are available for their
treatment and to prepare for imaging. (Ambulance trusts)
Patients with severe head injury require early defi nitive
airway control and rapid delivery to a centre with onsite
neurosurgical service. This implies regional planning
of trauma services, including prehospital physician
involvement, and reconfi guration of services. (Ambulance
and hospital trusts)
Patients with severe head injury should have a CT head
scan performed as soon as possible after admission
and within one hour of arrival at hospital. (Trauma team
leader and radiology heads)
All patients with moderate or severe head injury
should have case and CT fi ndings discussed with a
neurosurgical service. (Trauma team lead)
All patients with severe head injury should be transferred
to a neurosurgical/critical care centre irrespective of the
requirement for surgical intervention. (Strategic health
authorities, hospital trusts, trauma team leaders)
Consultant presence should be increased at operations
requiring major neurosurgery. (Hospital trusts)
Recommendations
8

110
19. Brain Trauma Foundation, American Association of
Neurological Surgeons, Joint Section on Neurotrauma
and Critical Care. Guidelines for the management of
severe head injury. J. Neurotrauma 1996; 13: 641-734
20. Chestnut RM, Marshall LF, Klauber MR et al. The role
of secondary brain injury in determining outcome from
severe head injury. J Trauma. 1993; 34(2):216-22
21. Dunham CM, Barraco RD, Clark DE, et al.; EAST
Practice Management Guidelines Work Group. Guidelines
for emergency tracheal intubation immediately after
traumatic injury. J Trauma 2003; 55:162-197
22. Edwards P, Arango M, Balica L, et al. CRASH
trial collaborators. Final results of MRC CRASH, a
randomised placebo-controlled trial of intravenous
corticosteroid in adults with head injury-outcomes at 6
months. Lancet. 2005; 365(9475):1957-9
23. The Royal College of Surgeons of England. Report of
the working party on the management of head injuries.
London: RCS, 1999
24. Working party of the Neuroanaesthesia Society and
Association of Anaesthetists. Recommendations for
the transfer of patients with acute head injuries to
neurosurgical units. Neuroanaesthesia Society of Great
Britain and Ireland and the Association of Anaesthetists
of Great Britain and Ireland, 1996
25. Sampalis JS, Denis R, Fréchette P, Brown R, Fleiszer
D, Mulder D. Direct transport to tertiary trauma centers
versus transfer from lower level facilities: impact on
mortality and morbidity among patients with major
trauma. 1997 Aug;43(2):288-295
26. Crimmins DW, Palmer JD. Snapshot view of emergency
neurosurgical head injury care in Great Britain and
Ireland. J Neurol Neurosurg Psychiatry 2000; 68: 8-13
10. Guidelines for initial management after head injury in
adults. Suggestions from a group of neurosurgeons. BMJ
1984 288: 983-5
11. Report of the Working Party on Head Injuries. London:
Royal College of Surgeons of England Commission on
the Provision of Surgical Services; 1986
12. Bartlett J, Kett-White R, Mendelow AD, Miller JD, Pickard
J, Teasdale G. Recommendations from the Society of
British Neurological Surgeons. Br J Neurosurg 1998;
12(4): 349-52
13. The Royal College of Radiologists. Making the best
use of a department of clinical radiology: guidelines for
Doctors. 4th Ed. London; The College; 1998
14. Royal College of Surgeons of England. Report of the
Working Party on the Management of Patients with Head
Injuries. London: The College; 1999
15. Working Party of the British Paediatric Association and
British Association of Paediatric Surgeons, Joint Standing
Committee in Childhood Accidents. Guidelines on the
Management of Head Injuries in Childhood. London:
British Paediatric Association; 1991
16. Scottish Intercollegiate Guidelines Network: Early
Management of Patients with a head injury. 2007.
– http://www.sign.ac.uk/guidelines/fulltext/46/index.html
17. National Institute for Health and Clinical Excellence.
Managing head injury: updated NICE guidelines.2007.
– http://www.nice.org.uk/page.aspx?o=455350
18. Chi JH, Knudson MM, Vassar MJ, et al. Prehospital
hypoxia affects outcome in patients with traumatic brain
injury: a prospective multicenter study. J Trauma. 2006
Nov; 61(5):1134-41
CHAPTER 8 - Head injury management

111
27. Ashkan K, Edwards RJ, Bell BA. Crisis in resources: a
neurosurgical perspective. Br J Neurosurg 2001; 15:
342-6
28. Patel HC, Bouamra O, Woodford M, King AT, Yates
DW, Lecky FE. Trends in head injury outcome from
1989 to 2003 and the effect of neurosurgical care:
an observational study. Lancet. 2005; 29-Nov
4;366(9496):1538-44
29. Safe Neurosurgery 2000. A Report from the Society of
British Neurological Surgeons. Nelson MJ, SBNS, 35-43
Lincoln’s Inn Fields, London
30. Hospital Episode Statistics. 2000/2001. Department
of Health
31. Abdominal Aortic Aneurysm: A service in need of
surgery? National Confi dential Enquiry into Patient
Outcome and Death. 2005. http://www.ncepod.org.uk
32. Who Operates When II? National Confi dential Enquiry
into Patient Outcome and Death. 2005.
http://www.ncepod.org.uk
33. Leach P, Childs C, Evans J, Johnston N, Protheroe
R, King A.Transfer times for patients with extradural
and subdural haematomas to neurosurgery in Greater
Manchester. Br J Neurosurg. 2007 Feb; 21(1):11-5
Head
injury manag
ement
8

112
The injuries sustained by children differ from those of adults
and consequently there are signifi cant differences in their
post-trauma management. In particular, the incidence of
head trauma is more common in the paediatric population.
The defi nitions of neonates, infants and children differed
between hospitals. The maximum age of a neonate as
defi ned by the departments surveyed varied between 1 and
24 months. The maximum age of infants varied from 12 to
60 months. Two thirds of departments (110/183; 60.1%)
Organisational data
Injury remains a leading cause of death in childhood. In the
UK three million children present to emergency departments
each year following injury. The majority of attendances at
emergency departments are due to moderate or minor
injuries. The absolute numbers of severe injuries are low and
these patients present to a number of different hospitals.
Therefore it is more diffi cult to maintain specifi c clinical skills
in the management of severe trauma in children.
CHAPTER 9 - Paediatric care
0
10
20
30
40
50
60
70
80
90
100
Yes, resident Yes, available Neither Not answered
Num
ber o
f site
s
Hospital
A&E department
Figure 45. Availability of an advanced paediatric life support provider resident or 24 hours a day
0
20
40
60
80
100
120
140
160
180
Paediatric Anaesthetist Paediatrician Paediatric Surgeon
Num
ber o
f hos
pita
ls
Yes No Not answered
Figure 46. Availability of paediatric specialties at hospitals that accept paediatric patients

113
defi ned children as being up to 16 years of age, but 9.8%
(18/183) had a higher maximum age; the oldest being 19
years of age.
An Advanced Paediatric Life Support (APLS) provider was
resident or available 24 hours a day in 79.8% of hospitals
(Figure 45).
Protocols
It is recommended that protocols for the management of
paediatric cases should be in place1. One hundred and fi fty
fi ve (84.7%) of the 183 sites for which an organisational
questionnaire was returned to NCEPOD had up to date
guidelines for the management of paediatric trauma. Of the
160 hospitals (87.4%) which accepted children for defi nitive
care, 23 (14.4%) did not have up to date guidelines for the
management of children.
Thirteen out of 22 (59.1%) sites that did not admit children
for defi nitive care had a bypass protocol in place in order to
reduce the likelihood of a severely injured child being brought
to the hospital.
If non-accidental injury is suspected in children, up to
date guidelines on the management and referral of these
patients should be in place. One hundred and seventy six
(96.2%) hospitals had up to date guidelines on referral and
management of suspected non-accidental injury in children.
Facilities and staffi ng in hospitals accepting children for defi nitive care
It was recommended in the Better Care for the Severely
Injured Patient Report2 that “any hospital receiving and caring
for the severely injured child must have on-site support from
paediatrics’ and paediatric anaesthetists”.
Paed
iatric care
As Figure 46 illustrates, the majority of hospitals accepting
paediatric patients had a specialist in paediatric anaesthesia
and a consultant paediatrician; 70.6% (113/160) and 98.8%
(158/160) respectively. Guidelines do not specify the need
for a paediatric surgical consultant at all hospitals accepting
children. Only 23.8% (38/160) of hospitals accepting children
for defi nitive care have a paediatric surgical consultant,
suggesting that the transfer of patients to these sites for
surgery is often necessary.
The Royal College of Surgeons of England guidelines
also recommend that hospitals admitting children have a
full range of appropriate resuscitation equipment2. Of the
emergency departments at these hospitals 149/160 (93.2%)
had a listed and checked mobile equipment kit to assist in
the resuscitation of children.
It is recommended that emergency departments receiving
children should have a children’s nurse available at all times.
A Registered Sick Children’s Nurse (RSCN) was available at
146/160 (91.3%) of hospitals accepting children. However,
only 22 of these 146 hospitals (15.1%) had cover 24 hours a
day, 7 days a week.
Clearly there are diffi culties in providing all necessary staff for
the comprehensive management of the paediatric trauma
patient. The data above shows problems with paediatric
anaesthetic support and paediatric surgical support in
some centres. This is in the context of the centralisation
of many specialised paediatric services including surgery,
neurosurgery and paediatric intensive care medicine.
Some hospitals have acknowledged this fact by the use of
protocols to avoid admitting severely injured children. The
use of such protocols and close working within a network to
provide trauma care to children is required.
9

114
Most of the data analyses in the previous chapters were
repeated for this small subset of patients. Only in a very few
cases did the analysis show any different patterns from the
whole sample. The bulk of this report is therefore applicable
to both adults and children and the analysis will not be
presented again for this group.
Clinical data
Age range
There were 68 patients included in the study who were aged
16 years of age or less.
CHAPTER 9 - Paediatric care
0
20
40
60
80
100
120
140
0-5 6-10 11-15 16-20 21-25 26-30 31-35 36-40 41-45 46-50 51-55 56-60 61-65 66-70 71-75 76-80 81-85 86-90 91-95
Age (years)
Num
ber o
f pat
ient
s
Figure 47. Age range of patient sample
0
10
20
30
40
50
Good practiceimprovement -
clinical
Room forimprovement -
clinical
Room forimprovement -organisational
Room forimprovement -
clinical andorganisational
Less thansatisfactory
Insufficient data
Perc
enta
ge o
f pat
ient
s in
dat
a se
t
>16 years≤16 years
Figure 48. Overall assessment of care (advisors’ view)

115
Overall assessment of care
Figure 48 shows overall assessment of care for the paediatric
sample compared with the adult sample. There was little
difference between the two groups.
Grade of fi rst reviewer/team leader
Figure 49 shows grade of fi rst reviewer/team leader analysed
by age of patient. In comparison with the adult data, it was
encouraging that there was more consultant involvement
in the initial management, but still worth noting that a
consultant was the fi rst reviewer in only 54% of cases.
Trauma team response
A trauma response was documented in the notes in 69% of
≤16 year olds, slightly higher than the overall data (58%).
Paed
iatric care
Appropriateness of initial response
Table 92 shows advisor assessment of appropriateness of
initial hospital response.
Table 92. Appropriateness of initial response depending on patient age
>16 years ≤16 years
Number of patients
Number of patients
% %
Yes 548 86.4 53 88.3
No 86 13.6 7 11.7
Subtotal 634 60
Insuffi cient data 89 8
Total 723 68
Outcome at 72 hours
Six out of 68 paediatric cases (8.8%) were deceased at 72
hours post injury.
>16 years≤16 years
0
10
20
30
40
50
60
Consu
ltant
NCCGSpR
3
SpR 1/
2SpR SHO
Nurse
Other
Grade of clinician
Perc
enta
ge o
f pat
ient
s in
dat
aset
Figure 49. Grade of fi rst reviewer/team leader
9

116
CHAPTER 9 - Paediatric care
All recommendations in this report apply equally to
severely injured children.
All sites accepting children for defi nitive trauma
management should have protocols for their
management in place. These protocols should be
regularly reviewed and updated. (Hospital trusts)
All hospitals should have up to date guidelines on the
management and referral of suspected non-accidental
injury in children. (Hospital trusts)
Hospitals should use standard, universal defi nitions
for neonates, infants and children. (Royal College of
Paediatrics and Child Health)
Each receiving unit should have up to date guidelines for
children which recognise the paediatric skills available on
site and their limitations and include agreed guidelines
for communication and transfer with specialised
paediatric services within the local clinical network.
(Strategic health authorities and hospital trusts)
An Advanced Paediatric Life Support (APLS) (or
equivalent) trained consultant and a Registered Sick
Children’s Nurse (RSCN) or an APLS trained nurse
should be involved in the immediate management of all
severely injured children. (Hospital trusts)
If a hospital does not admit children for defi nitive care
then a bypass protocol should be in place. (Hospital and
ambulance trusts)
Recommendations
68/795 (8.6%) cases were aged 16 or less.
Only 54% of cases had consultant staff involved in the
immediate management.
The pattern of assessment of overall care was similar to
adults with less than half the cases judged as receiving
care classifi ed as good practice.
Advanced Paediatric Life Support (APLS) trained staff
were not resident or available 24 hours in 20.2% of
hospitals.
Only 22 out of 146 hospitals had Registered Sick
Children’s Nurse cover 24 hours a day, 7 days a week.
Key fi ndings

117
References
1. Services for Children in Emergency departments. Royal
College of Paediatrics and Child Health. 2007
www.rcpch.ac.uk/health-services/emergen-care
2. The Royal College of Surgeons of England and the British
Orthopaedic Society. Better Care for the Severely Injured.
2000
Paed
iatric care9

118
Many studies that have reported on the quality of transfer
of patients with head injuries have identifi ed major problems
with resuscitation and transfer, including: delays; missed
injuries; poor airway management; hypotension; hypoxia;
and, the quality of medical escort8-12.
As a result of these concerns, in 1996, the Association
of Anaesthetists of Great Britain and Ireland produced
guidelines surrounding the transfer of head injured patients13.
The main recommendations were:
• There should be a designated consultant at both
the referring and receiving hospitals who have
overall responsibility for the transfer of patients.
• Local guidelines should be in existence and should
be consistent with national guidelines.
• Resuscitation and stabilisation of the patient must
be achieved before transfer.
• Only in exceptional circumstances should a
patient with altered conscious level be transferred
unintubated.
• The doctor accompanying the patient must be of
sufficient experience and have received supervised
training in the transfer of patients with head
injuries.
• There must be a means of communication to both
the dispatching hospital and the receiving hospital.
Introduction
Most patients with severe injuries are admitted to hospitals
that are geographically closest to the location of the incident
where the injuries were sustained. Consequently, early
management of the patient occurs at centres that may not
have the facilities or resources suitable for the appropriate
care of the severely injured.
The lack of available appropriate care may result in the
transfer to a site with more appropriate facilities. Some
ambulance trusts have a policy of bypassing local hospitals
to larger trauma centres to obviate the need for later transfer.
However, little data supports the fact that such a ‘bypass’
policy is used with any frequency. In 1997, it was estimated
that more than 11,000 patients in the UK with critical
illnesses required transfer annually1.
An example of such a situation is the head injury patient.
Approximately 2,200 patients are admitted annually to
hospital with head injuries2. Of these, 3 – 5% are transferred
to regional neurosurgical units for further management.
It has been well recognised that the outcome of patients
who require a transfer because of a mismatch between
the patient’s needs and the available resources at the initial
place of admission have a better eventual outcome if that
transfer is performed by dedicated transport teams3-6.
However, despite extensive literature highlighting this, in
2002 the Intensive Care Society commented that ‘many
critically ill patients are transferred between hospitals in an
ad hoc manner by inexperienced trainees with little formal
supervision and potentially serious complications can
occur’7.
CHAPTER 10 - Transfers

119
The Intensive Care Society produced guidelines for the
transport of the Critically Ill Patient in 199714 and then
further refi ned these recommendations in 200215. The
recommendations include the following; there should be
‘regular meetings of relevant consultants, senior nurses,
ambulance providers, bed bureaux managers and
commissioners to develop admission and discharge and
referral policies and transport protocols, to ensure available
resources to enable timely and safe transfers and to develop
assurance programmes’.
It was hoped that compliance and subsequent audit of these
guidelines, combined with the wider acceptance of the
principles and uptake of the Advanced Trauma Life Support
(ATLS) approach in the management of patients, would
result in an improvement in the quality of transfer. Despite
these recommendations, later audits of transfers still revealed
inadequacies11-15.
Results
Only transfers within 72 hours of arrival at hospital were
included in the study.
Protocols for secondary transfer
Only 126 of the 183 (68.9%) hospitals involved in the
management of patients with severe injuries had protocols
for the secondary transfer of patients despite numerous
recommendations mandating such protocols.
Transfers
Number of secondary transfers
Of the 795 patients admitted to hospitals with severe injuries,
194 patients underwent a secondary transfer (24.4%).
Eight of these were retrievals with the remaining 186 being
transfers conducted by the original admitting hospital.
Effect of mode of initial transport system on secondary transfers
Patients brought to the initial hospital by helicopter were
less likely to undergo secondary transfer. Seven out of
59 (11.9%) patients who arrived at the fi rst hospital by
helicopter required a secondary transfer within 72 hours of
arrival compared with 112/440 (25.5%) patients brought to
hospital by road ambulance. The use of helicopters facilitates
admission of the severely injured patient to the correct facility
initially, thereby reducing subsequent transfers and speeding
up defi nitive care.
10

120
Arrangement of transfers
A consultant arranged the transfer in only 49 of 137 (35.8%)
cases reported by clinicians on the A&E questionnaire.
From the casenotes provided to NCEPOD, the grade of
the clinician arranging the transfer could only be identifi ed
in 87/194 (44.8%) cases. A consultant was responsible for
arranging 39/87 (44.8%) of these transfers (Figure 50).
CHAPTER 10 - Transfers
0
10
20
30
40
50
60
CON NCCG SpR3 SpR 1/2 SpR unknown SHO Other Notrecorded
Num
ber o
f pat
ient
s
Figure 50. Grade of clinician organising transfer
Table 93. Grade of clinician receiving the transfer
Number of patients %
Consultant 14 18.4
NCCG 2 2.6
SpR 3 2 2.6
SpR 1/2 1 1.3
SpR undefi ned 46 60.5
SHO 10 13.2
Other 1 1.3
Subtotal 76
Not documented 118
Total 194
The documentation of the grade of clinician receiving the
patient was equally poorly documented. In 118/194 cases
(60.8%) it could not be determined who received the patient.
Only 14 cases were documented as being received by
consultants (Table 93).
The standards and guidelines for the Transport of the
Critically Ill Patient9 recommends that “each hospital should
have a designated consultant available 24 hours a day to
organise, supervise and where necessary undertake all
inter-hospital transfers” and that the decision to transfer
a patient “must be made by a consultant in intensive
care in discussion with consultant colleagues”. This is not

121
happening. The lack of documented consultant input is a
concern. Either local guidelines exist which obviate the need
for consultant involvement or the process of care, including
transfers, is being managed and delivered by staff in training.
Accompanying staff
Recommendations state that a minimum of two attendants
should be present for the transfer9.
Of the 194 transfers only 35 (18.0%) had a documented
second attendant and 3 (1.5%) a third attendant.
In 155/194 cases notifi ed to NCEPOD, the grade of the
accompanying person was not documented. In the 39/194
cases where specialty was documented, an anaesthetist
or critical care specialist accompanied 36 of the cases.
The published recommendations mandate that one of the
attendants should be competent in intensive care medicine,
anaesthesia or another acute specialty in order to be able to
manage any signifi cant airway complication.
Transfers
Reason for transfer
The reasons for transfer were mainly for specialist
management of injuries (172/194; 88.7%). Six patients were
transferred due to lack of critical care facilities at the initial
hospital. Other reasons cited for transfers were because of
lack of local facilities (primarily lack of imaging facilities).
The transfers for specialist care are detailed in Figure 51.
Of the 172 cases transferred for specialist treatment, the
majority were transferred for neurosurgical care – 106/172
(61.6%). Six (3.5%) patients were transferred to paediatric
units. Eighteen (10.5%) patients were transferred for burns/
plastic surgery input and 7 (4.1%) for the management of
cardiothoracic injuries.
While it is essential to transfer patients if the appropriate
care is not available at the initial receiving hospital, it must
be remembered that this will inevitably incur delays in the
time to defi nitive management. In cases where there is a
time critical injury e.g. neurosurgical operation for expanding
intracranial haematoma, this type of care may not allow
0
20
40
60
80
100
120
Neuros
urgery
Burns/p
lastic
s
Paedia
trics
Spinal/
neuro
logy
Cardiot
horac
ics/th
oracic
surge
ry
Orthop
aedic
sLiv
erOthe
r
Not rec
orded
Specialty
Num
ber o
f pat
ient
s
Figure 51. Specialty to which the patients were transferred
10

122
Appropriateness of transfer
Ninety one out of the 194 (46.9%) transfers were considered
appropriate by the advisors and 17 (8.8%) transfers
were considered inappropriate. There were insuffi cient or
incomplete data to comment and classify the remainder of
the transfers.
The reasons identifi ed for the inappropriateness of the
transfers included:
• transfers with unsurvivable injuries (burns case),
• failure of closer centre to accept the patient and,
therefore, a longer and delayed transfer was
needed,
• failures in effective communication between
hospitals, and
• missed injuries.
the optimal outcome. Given these clinical considerations
and the constraints of staffi ng in a time of changing training
and working hours, it is probably time to consider carefully
which hospitals receive severely injured patients and to plan
a proper regional trauma service. Patient transport services
and the role of doctors in prehospital care must be an
integral part of any plans to change trauma services. Both of
these plans must occur in parallel as part of a wider trauma
care network12.
Timeliness of transfer
Figure 52 shows information on timeliness of transfer. Where
it could be assessed there were delays in 26.4% (34/129) of
all transfers and 50% (4/8) of retrievals.
CHAPTER 10 - Transfers
0
1020
3040
50
6070
8090
100
Transfer Retrieval
Num
ber o
f pat
ient
s YesNo
Figure 52. Delay in transfer/retrieval

123
Transfers
Case study 6
A young patient had a severe brain injury following a
fall. The patient had a GCS of 3 at presentation with
unresponsive pupils and a compound skull fracture
with brain matter exuding from the ear. The patient was
transferred to a neurosurgical unit but certifi ed brain
dead shortly after arrival.
Case study 7
An elderly patient tripped while intoxicated. A Glasgow
Coma Score of 3 was recorded in the ambulance. At the
receiving hospital it was recoded as 8. The hospital was
unable to perform a CT head scan therefore the patient
was transferred to the local neurosurgical hospital. The
transfer was performed without securing the airway. At
the neurosurgical hospital the patient was transferred
to CT still with an unprotected airway. Intubation was
subsequently performed after CT scanning.In addition, there were some concerns over the transfer of a
number of patients who had sustained a head injury. From
the records available six patients with a Glasgow Coma
Score of less than 10 were transferred without intubation.
The recommendations on the transfer of patients with head
injuries7 state that only in exceptional circumstances should
a patient with a signifi cantly altered conscious level requiring
transfer not be sedated, intubated and ventilated.
This review gives a picture of a haphazard arrangement for
the secondary transfer of severely injured patients. It is of
great concern that one in four patients required secondary
transfer to receive defi nitive care and this must be a major
criticism of the current arrangements for the management
of severely injured patients. There were defi ciencies in local
protocols, use of national guidelines, consultant oversight
and documentation.
Furthermore, avoidance of transfers by the initial direct
transport of the severely injured patient to a centre with
the appropriate facilities should be considered. This would
need regional planning of all aspects of the trauma service
including the prehospital emergency services.
10

124
CHAPTER 10 - Transfers
A clear record of the grade and specialty of all
accompanying staff involved in the transfer or retrieval
of severely injured patients should be made and this
documentation should accompany the patient on
transfer. (Trauma team leader)
There should be standardised transfer documentation of
the patients’ details, injuries, results of investigations and
management with records kept at the dispatching and
receiving hospitals. (Trauma team leader, Department of
Health)
Published guidelines must be adhered to and audits
performed of the transfers and protocols. (Hospital
trusts)
Local networks should develop protocols for the
transfer of severely injured patients suitable for regional
requirements. (Hospital trusts)
The number of transfers may be decreased if
appropriate arrangements are made for cross cover in
specialties, e.g. interventional radiology, between trusts.
(Hospital trusts)
Recommendations
There was a lack of adherence to the numerous
recommendations and guidelines that exist regarding the
transfer of critically ill and severely injured patients.
The arrangements for the secondary transfer of severely
injured patients were haphazard.
One in four severely injured patients required a
secondary transfer to receive defi nitive care.
The use of a helicopter system reduced the need for
secondary transfers compared to a road ambulance
system.
The documentation of transfers was almost uniformly
poor.
Despite the limited information available from the
poor documentation, there was an apparent lack of
consultant input into the arrangement and conduct of
secondary transfers.
This study of a three month period suggests that there
are approximately 800 transfers annually for severe
trauma and that the situation of ‘many critically ill
patients are transferred between hospitals in an ad
hoc manner by inexperienced trainees with little formal
supervision and potentially serious complications can
occur’ is correct. There does not appear to have been
any signifi cant change in the last fi ve years.
Key fi ndings
125
References
1. Mackenzie PA, Smith EA, Wallace PG. Transfer of adults
between intensive care units in the United Kingdom:
postal survey. BMJ. 1997 May 17; 314(7092):1455-6
2 Mendelow et al. Risks of intracranial haematoma in head
Injured Adults. BMJ 1983; 287:1173
3. McMonagle MP et al. Anz J Surg 2007; 77: 241 – 246
4. Deane SA et al. Anz J Surg 1990; 60: 441-446
5. Strobos J. Ann Emerg Med 1991; 20: 302-310
6. Clemmer TP Crit Care Med 2000; 28: 265-266)
7. Intensive Care Society. Guidelines for transport of the
critically ill adult. London: Intensive Care Society 2002
8. Dunn LT. Secondary insults during the intra hospital
transfer of head injured patients: an audit of transfers in
the Mersey Region. Injury 1997; 28:427-31
9. Gentleman D. Causes and effects of systemic
complications among severely head-injured patients
transferred to a neurosurgery unit. Int Surg 1992;
77:297-302
10. Gentleman D et al. Audit of transfer of unconscious head
injured patients to a neurosurgical unit. Lancet 1990;
335:330-4
11. Have ATLS and national transfer guidelines improved
the quality of resuscitation and transfer of head-injured
patients? Injury 2003 34:834-838
12. Knowles PR et al. Meeting the standards for interhospital
transfer of adults with severe head injury in the United
Kingdom. Anaesthesia. 1999 Mar; 54(3):283-8
Transfers
13. AAGBI Recommendations for the transfer of patients
with head injuries to neurosurgical injuries. 1996
14. Intensive Care Society. Guidelines for transport of the
critically ill adult. London: Intensive care Society 1997
15. Stevenson A et al. Emergency department organisation
of critical care transfers in the UK. Emerg Med J. 2005
Nov; 22(11):795-8
10
126
patients. This relationship between volume, quality of care
and outcome in trauma has been in the literature for some
years2,3. This suggests that there is a need to integrate and
concentrate major trauma in fewer centres, thus giving a
better quality of care.
The incidence of severe trauma defi ned by an injury severity
score of 16 or more is estimated to be four per million
per week in the UK4; a lower prevalence than in the USA.
Burdett-Smith et al estimated that there are between 10,000
and 10,600 patients suffering multiple injuries in the UK
each year5. Given the above estimates, the average acute
hospital in the UK is not likely to be called upon to treat
more than one severely injured patient each week. Such low
numbers suggest that some acute hospitals may have too
little experience to give these patients their best chance of
optimum outcome. Adequate experience in the defi nitive
management of such diffi cult problems is hard to acquire
without reorganisation of trauma services. Furthermore, it is
almost certainly unrealistic to expect every hospital to have
the necessary staff and services to be able to provide the
standard of care required 24 hours per day, 7 days per week.
Results
In this study, 795 patients with a verifi ed injury severity score
of 16 or more were identifi ed over a 12 week period. Table
94 shows data concerning the number of severely injured
patients seen by each emergency department in the 12
week study period.
Introduction
Almost all of the evidence of the effectiveness of
improvements in the organisation of trauma care services
comes from developed countries. In most cases, the better
organisation comes in the form of two related activities:
(1) planning of integrated systems for trauma
management; and
(2) verifi cation of trauma services through
hospital inspections.
Verifi cation applies to a review of individual facilities as
regards their provision of a variety of items, including
human resources (e.g. availability of personnel with certain
qualifi cations), physical resources (equipment and supplies)
and administrative and organisational functions, such as
quality improvement, audit (including outcome comparisons)
and implementation of protocols (e.g. Advanced Trauma
Life Support (ATLS). The American College of Surgeons has
made signifi cant progress in this area1.
The planning of systems for trauma management implies
several integrated functions. This includes regional
designation of those hospitals able to fulfi l the roles of trauma
centres at varying levels of complexity; ranging from large
urban trauma centres to small rural hospitals and clinics.
It also implies the planning of mobile emergency medical
services, prehospital triage (to determine which patients
should go to which types of designated facilities), transfer
criteria and transfer arrangements between hospitals.
Much of the data collected in this study pertains to the fi rst
category above (verifi cation). However, the incidence of major
trauma in the UK is actually quite low and this has a direct
bearing on the ability to provide high quality care to trauma
CHAPTER 11 - Incidence of trauma and organisation of trauma services

127
Table 94. Number of patients seen per hospital
Number of hospitals
1-2 48
3-4 29
5-6 29
7-8 14
9-10 3
11-12 6
13-14 3
15-16 2
17-18 2
19-20 1
> 20 4
Total 141
Incidence o
f trauma and
o
rganisatio
n of traum
a services
0
10
20
30
40
50
60
70
Good practice Room forimprovement -
clinical
Room forimprovement -organisational
Room forimprovement -
clinical andorganisational
Less thansatisfactory
Insufficient data
Perc
enta
ge o
f gro
up
1-56-1011-20>20
Figure 53. Number of patients per hospital vs. advisors’ overall assessment
Only 12 emergency departments treated more than one
severely injured patient per week during the study period and
many departments only treated one to two patients in the
whole 12 week study period.
During the study, 243 patients were admitted initially to
hospitals that reported 1-5 patients in the study, 226 patients
to hospitals that admitted 6-10 patients, 197 patients to
hospitals that admitted 11-20 patients to the study and 129
patients to hospitals that admitted more than 20 patients to
the study. Figure 53 illustrates the advisors’ assessment of
overall care analysed by number of patients included
in the study.
It can be seen that the high volume hospitals (>20 patients in
the study) were assessed as providing a higher percentage
of good practice and a lower percentage of all other
categories, including insuffi cient data (Figure 53).
11

128
of care within current institutions but must also take into
account the regional organisation of trauma services.
A number of reports have suggested regionalisation of
trauma care7-10 over the last two decades but with little
impact on service provision. Changing the provision of
trauma services is urgently required11.
This report has highlighted major defi ciencies in the
management of the severely injured patient. Many of these
defi ciencies were organisational and should not be taken as
a comment on the ability or willingness of individual clinicians
to provide a high standard of care.
These data have highlighted defi ciencies or problems in the
following areas:
Trauma team and trauma response (page 51-55)
One in fi ve hospitals did not have a trauma team.
Only three out of fi ve severely injured patients are met by a
trauma team.
Consultant involvement (page 55-58)
A consultant was the trauma team leader/fi rst reviewer in
only one in four cases.
Consultants were involved in the initial care of four out of 10
patients presenting during daytime but only one out of 10
patients presenting at night.
One in three patients were not seen by a consultant whilst in
the emergency department.
Discussion
The low number of severely injured patients in this study is in
keeping with the literature previously referenced. However,
these present fi gures are somewhat lower and this may
refl ect several factors:
1. Although the study was well publicised and NCEPOD
local reporters attempted to collect all cases, it may well
be that not all severely injured patients were included in
the study.
2. All patients in this study were scored by NCEPOD staff,
and patients who were identifi ed as severely injured by
the participating centre but who subsequently had an
injury severity score (ISS) <16 were excluded from the
study.
3. The incidence of severe trauma appears to be falling in
England and Wales, presumably due to education or
public health measures and factors such as better vehicle
and road design.
Despite recent improvements, it appears that the outcome
from severe trauma in the UK remains poorer than in
other developed countries. Furthermore, it appears that
the improvements in mortality for severely injured patients
occurred between 1989 and 1994 and that no signifi cant
change occurred between 1994 and 20006. This study also
showed that consultant involvement increased from 29% to
40% over 1989-1994 but did not increase further up to the
year 2000.
It may be that the benefi ts of an Advanced Trauma Life
Support (ATLS) approach have delivered maximum
improvements for the severely injured patient within the
current system of trauma care and that further improvements
in outcome for patients who have suffered major trauma
cannot be delivered by focusing only on improving the quality
CHAPTER 11 - Incidence of trauma and organisation of trauma services
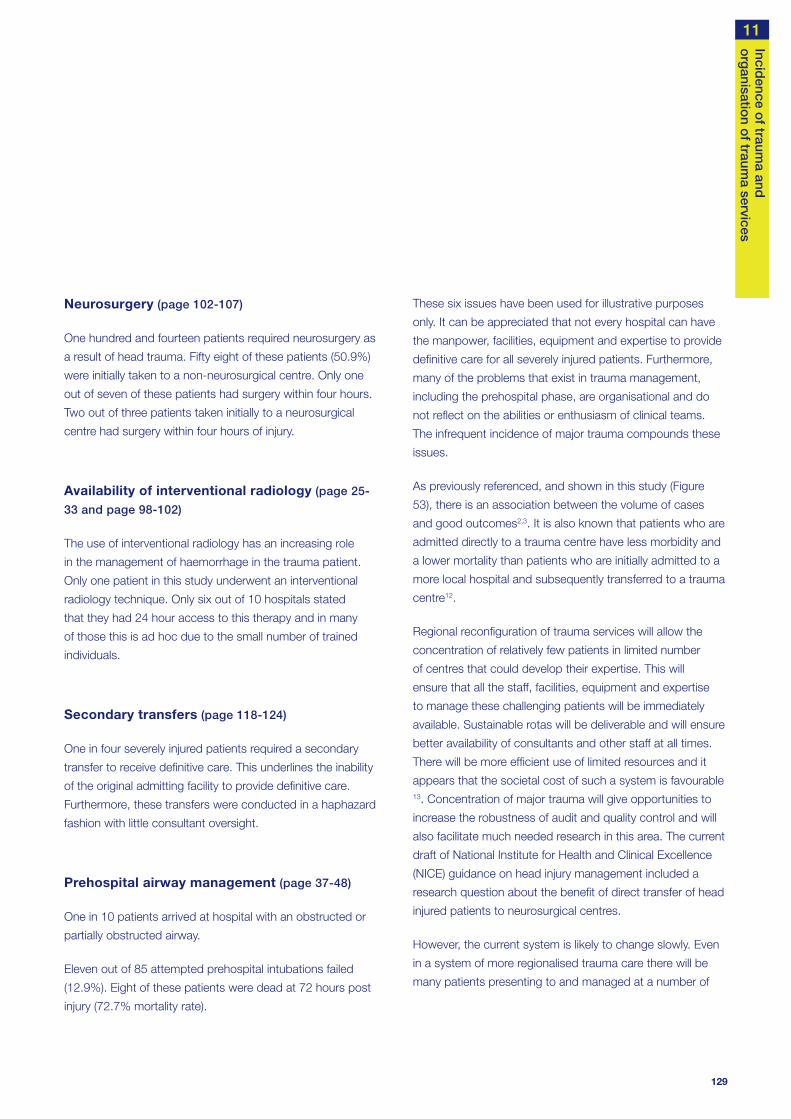
129
Neurosurgery (page 102-107)
One hundred and fourteen patients required neurosurgery as
a result of head trauma. Fifty eight of these patients (50.9%)
were initially taken to a non-neurosurgical centre. Only one
out of seven of these patients had surgery within four hours.
Two out of three patients taken initially to a neurosurgical
centre had surgery within four hours of injury.
Availability of interventional radiology (page 25-
33 and page 98-102)
The use of interventional radiology has an increasing role
in the management of haemorrhage in the trauma patient.
Only one patient in this study underwent an interventional
radiology technique. Only six out of 10 hospitals stated
that they had 24 hour access to this therapy and in many
of those this is ad hoc due to the small number of trained
individuals.
Secondary transfers (page 118-124)
One in four severely injured patients required a secondary
transfer to receive defi nitive care. This underlines the inability
of the original admitting facility to provide defi nitive care.
Furthermore, these transfers were conducted in a haphazard
fashion with little consultant oversight.
Prehospital airway management (page 37-48)
One in 10 patients arrived at hospital with an obstructed or
partially obstructed airway.
Eleven out of 85 attempted prehospital intubations failed
(12.9%). Eight of these patients were dead at 72 hours post
injury (72.7% mortality rate).
These six issues have been used for illustrative purposes
only. It can be appreciated that not every hospital can have
the manpower, facilities, equipment and expertise to provide
defi nitive care for all severely injured patients. Furthermore,
many of the problems that exist in trauma management,
including the prehospital phase, are organisational and do
not refl ect on the abilities or enthusiasm of clinical teams.
The infrequent incidence of major trauma compounds these
issues.
As previously referenced, and shown in this study (Figure
53), there is an association between the volume of cases
and good outcomes2,3. It is also known that patients who are
admitted directly to a trauma centre have less morbidity and
a lower mortality than patients who are initially admitted to a
more local hospital and subsequently transferred to a trauma
centre12.
Regional reconfi guration of trauma services will allow the
concentration of relatively few patients in limited number
of centres that could develop their expertise. This will
ensure that all the staff, facilities, equipment and expertise
to manage these challenging patients will be immediately
available. Sustainable rotas will be deliverable and will ensure
better availability of consultants and other staff at all times.
There will be more effi cient use of limited resources and it
appears that the societal cost of such a system is favourable 13. Concentration of major trauma will give opportunities to
increase the robustness of audit and quality control and will
also facilitate much needed research in this area. The current
draft of National Institute for Health and Clinical Excellence
(NICE) guidance on head injury management included a
research question about the benefi t of direct transfer of head
injured patients to neurosurgical centres.
However, the current system is likely to change slowly. Even
in a system of more regionalised trauma care there will be
many patients presenting to and managed at a number of
Incidence o
f trauma and
o
rganisatio
n of traum
a services11

130
Research Network (TARN) is a well-established process and
outcome audit in trauma care, which was originally derived
from the methods used in the American Major Trauma
Outcome Study (MTOS). TARN data is used in three ways to
close the cycle of trauma audit:
1) To highlight individual cases where unexpected outcomes
occur (either good or bad). This allows multidisciplinary
trauma audit meetings to focus on the particular
cases that are most likely to contain the lessons for
improvement.
2) Four times a year the Quarterly Report focuses on
a particular specialist area of trauma management
– comparing performance with standards set by the
Royal College of Surgeons Trauma Committee and also
benchmarking performance of one hospital against the
rest of the UK. This information usually forms the basis
for a departmental or multidisciplinary trauma audit
meeting.
3) Comparisons of outcome between hospitals can be
made, and are publicly available to purchasers and
service users through the Healthcare Commission
website, along with case mix data by hospital. This allows
the identifi cation of ‘outliers’ with either very good or very
poor trauma outcomes, allowing potential causes to be
identifi ed.
TARN is a voluntary system, funded by subscription from
participating hospitals. It has data from about 50% of UK
hospitals; with about one third participating at any one time.
The database collected by TARN now contains about
200,000 patient records, so it can also be used for various
types of research and to look at long-term trends in trauma
outcomes14-17.
different hospitals within a region. All hospitals within a
region have a major part to play in the management of the
injured patient.
Under the current system where there is little regionalisation,
the role of the district general hospital is crucial. All hospitals
have a major role in the initial management, stabilisation, and
identifi cation of injuries and provision of defi nitive care where
possible. Too often the district general hospitals perceive
their role to be solely the organisation of secondary transfer
to an ‘ivory tower’. This can result in the focus of care being
the transfer rather than the immediate management of the
unstable patient.
Trauma audit
The care of the severely injured patient requires a
multidisciplinary team, often working across more than
one hospital. This is different from most other types of
medical care (where usually only one specialist is involved)
and means that special arrangements have to be made to
develop a system that coordinates the complex interactions
between the different individuals involved in trauma care. To
show whether or not these arrangements are working well,
a robust audit system is required – ideally evaluating both
processes and outcomes. A key part of a trauma system is
the multidisciplinary trauma audit meeting, where all those
involved in trauma care can meet to discuss both individual
patient management and the overall performance of the
trauma system. This type of audit is more effective if the
data presented for discussion allows comparisons with other
hospitals (benchmarking) to occur.
Trauma audit follows this benchmarking pattern in America,
Germany, Scandinavia and Australia. In the USA, trauma
outcome audit has become a mandatory requirement for
trauma centre status. In the UK, the Trauma Audit and
CHAPTER 11 - Incidence of trauma and organisation of trauma services

131
In this study, 183 hospitals returned an organisational
questionnaire. Of these 183 hospitals, only 77 (42.1%)
participated in, and provided data to, TARN.A system should be initiated for identifying these
patients so that the demand on the health service can
be properly quantifi ed and resources appropriate to that
demand be made available. (Department of Health)
Given the relatively low incidence of severe trauma
in the UK, it is unlikely that each individual hospital
can deliver optimum care to this challenging group of
patients. Regional planning for the effective delivery of
trauma services is therefore essential. (Strategic health
authorities, hospital trusts)
Given the importance of evaluation of processes and
outcomes in the trauma patient, all units providing
treatment for severely injured patients should contribute
to the Trauma Audit Research Network. (Hospital trusts)
There should be a system of designation and verifi cation
of each hospital with regards to their function as
a trauma centre, in a similar fashion to the system
instituted by the American College of Surgeons.
(Strategic health authorities, Royal College of Surgeons)
Recommendations
129/141 (91.5%) hospitals in this study dealt with a
severely injured patient less often than once per week.
High volume hospitals (>20 severely injured patients in
this study) deliver a higher percentage of care assessed
as good practice.
Only 77/183 (42.1%) hospitals participate in TARN.
Key fi ndings
Incidence o
f trauma and
o
rganisatio
n of traum
a services11

132
12. Sampalis JS, Denis R, Fréchette P, Brown R, Fleiszer
D, Mulder D. Direct transport to tertiary trauma centers
versus transfer from lower level facilities: impact on
mortality and morbidity among patients with major
trauma. J Trauma. 1997 Aug; 43(2):288-95
13. Durham R, Pracht E, Orban B, Lottenburg L, Tepas J,
Flint L. Evaluation of a mature trauma system. Ann Surg.
2006; 243(6):775-83
14. Lecky FE, Woodford M, Bouamra O, Yates DW. Lack of
change in trauma care in England and Wales since 1994.
Emergency Medical Journal 2002; 19:0-3
15. Patel HC, Woodford M, King AT, Yates DW, Lecky FE.
Trends in head injury outcome from 1989 to 2003 and
the effect of neurosurgical care: an observational study
on behalf of the Trauma Audit & Research Network. The
Lancet 2005; 366: 1538-44
16. Dark P, Woodford M, Vail A, Mackway-Jones K, Yates D,
Lecky F. Systolic hypertension and the response to blunt
trauma in infants and children. Resuscitation 2002; 54:
245-253
17. Henderson K, Coats TJ, Hassan TB, Brohi K. Audit of
time to emergency trauma laparotomy. Br J Surg 2000;
87: 472-476
References
1. www.facs.org/trauma/verifi cationhosp.html
2. Nathens AB, Jurkovich GJ, Maler RV et al. Relationship
between trauma centre volume and outcomes. JAMA
2001; 285: 1164-71
3. MacKenzie EJ et al. A national evaluation of the effect of
trauma centre care on mortality NEJM 2006; 354: 366-
378
4. Gorman et al. The epidemiology of major injuries in
Mersey and North Wales. Injury. 1995 26; 1 51-54
5. Burdett-Smith P, Airey GM, and Franks AJ. Improvement
in trauma survival in Leeds. Injury. 1995 26; 7.455-458.
6. Lecky FE, Woodford M, Bouamra O, Yates DW. Lack of
change in trauma care in England and Wales since 1994.
Emerg Med J. 2002 Nov; 19(6):520-3
7. Commission on the Provision of Surgical Services. The
Management of Patients with Major Injuries. The Royal
College of Surgeons of England; 1988
8. The Management of Skeletal Trauma in the United
Kingdom. British Orthopaedic Association. London; 1992
9. The Care of Severely Injured Patients in the United
Kingdom. British Orthopaedic Association. London; 1997
10. The Royal College of Surgeons of England and the British
Orthopaedic Society. Better Care for the Severely Injured.
2000
11. http://www.healthcareforlondon.nhs.uk/framework_for_
action.asp
CHAPTER 11 - Incidence of trauma and organisation of trauma services

133
MTOS Major Trauma Outcome Study
NCCG Non consultant career grade
NHS National Health Service
NICE National Institute for Health
and Clinical Excellence
OPCS Offi ce of Population, Censuses and Surveys
PaCO2 Partial pressure of Carbon Dioxide
PaO2 Partial pressure of Oxygen
PRF Patient report form
RCS Royal College of Surgeons of England
RSCN Registered sick children’s nurse
RTC Road traffi c collision
SHO Senior house offi cer
SIGN Scottish Intercollegiate Guidelines Network
SpCO2 Saturation of peripheral Carbon Dioxide
SpO2 Saturation of peripheral Oxygen
SpR Specialist registrar
TARN Trauma Audit Research Network
A&E Accident and Emergency
ABC Airway, breathing, circulation
ABG Arterial blood gas
APLS Advanced paediatric life support
ATLS Advanced trauma life support
AVPU Alert, verbal, pain, unresponsive
CT Computed tomography
DPL Diagnostic peritoneal lavage
FAST Focussed Assessment with Sonography
for Trauma
GCS Glasgow coma score / scale
ICP Intracranial pressure
ICU Intensive care unit
ISS Injury severity score
IV Intra venous
JRCALC Joint Royal Colleges Ambulance
Liaison Committee
kPa Kilo Pascals
mmHg Millimetres of Mercury
APPENDIX A - Glossary
Glo
ssaryA

134
Injury Severity Score
The Injury Severity Score (ISS) is an anatomical scoring
system that provides an overall score for patients with
multiple injuries. Each injury is assigned an Abbreviated
Injury Scale (AIS) score and is allocated to one of six body
regions (Head, Face, Chest, Abdomen, Extremities (including
Pelvis), External). Only the highest AIS score in each body
region is used. The three most severely injured body regions
have their score squared and added together to produce the
ISS score.
An example of the ISS calculation is shown below:
Region Injury
Description AIS
Square Top
Three
Head & Neck Cerebral Contusion 3 9
Face No Injury 0
Chest Flail Chest 4 16
Abdomen
Minor Contusion of
Liver Complex
Rupture Spleen
2
5 25
Extremity Fractured femur 3
External No Injury 0
Injury Severity Score: 50
The ISS score takes values from 0 to 75. If an injury is
assigned an AIS of 6 (unsurvivable injury), the ISS score
is automatically assigned to 75. The ISS score correlates
linearly with mortality, morbidity, hospital stay and other
measures of severity.
Tables and information taken from http://www.trauma.org/
scores/ais.html and http://www.trauma.org/scores/iss.html
Abbreviated Injury Scale
The Abbreviated Injury Scale (AIS) is an anatomical scoring
system fi rst introduced in 1969. Injuries are ranked on a scale
of 1 to 6, with 1 being minor, 4 severe and 6 an unsurvivable
injury. This represents the ‘threat to life’ associated with
an injury and is not meant to represent a comprehensive
measure of severity. The AIS is not an injury scale, in that the
difference between AIS1 and AIS2 is not the same as that
between AIS4 and AIS5.
AIS Score Injury
1 Minor
2 Moderate
3 Serious
4 Severe
5 Critical
6 Unsurvivable
APPENDIX B - Injury severity score

135
The Glasgow Coma Scale and Coma Score (GCS)
For clarity the Glasgow Coma Scale and Glasgow Coma
Score are described below.
The Glasgow Coma Scale provides a framework for
describing the state of a patient in terms of three aspects
of responsiveness: eye opening, verbal response, and best
motor response, each stratifi ed according to increasing
impairment. In the fi rst description of the Scale for general
use, the motor response had only fi ve options, with no
demarcation between ‘normal’ and ‘abnormal’ fl exion.
The distinction between these movements can be diffi cult
to make consistently and is rarely useful in monitoring
an individual patient but is relevant to prognosis and is,
therefore, part of an extended six option scale used to
classify severity in groups of patients.
The Glasgow Coma Score is an artifi cial index; obtained by
adding scores for the three responses. The notation for the
score was derived from the extended scale, incorporating
the distinction between normal and abnormal fl exion
movements, producing a total score of 15. This score can
provide a useful single fi gure summary and a basis for
systems of classifi cation, but contains less information than
a description separately of the three responses.
The three responses of the coma scale, not the total score,
should therefore be of use in describing, monitoring and
exchanging information about individual patients.
Table Glasgow Coma Scale and Score (Adults)
Feature Scale responsesScore
notation
Eye
opening
Spontaneous
To speech
To pain
None
4
3
2
1
Verbal
response
Orientated
Confused conversation
Words (inappropriate)
Sounds (incomprehensible)
None
5
4
3
2
1
Best motor
response
Obey commands
Localise pain
Flexion - Normal
- Abnormal
Extend
None
6
5
4
3
2
1
Total coma score 3/15 - 15/15
APPENDIX C - Adult and paediatric Glasgow Coma Scale
Ad
ult and p
aediatric
Glasg
ow
Co
ma S
caleC

136
Communication with the infant or child’s caregivers is
required to establish the best usual verbal response. A
‘grimace’ alternative to verbal responses should be used
in pre-verbal or intubated patients.
Best Grimace Response (5)
5. Spontaneous normal facial/oro-motor activity
4. Less than usual spontaneous ability or only response
to touch stimuli
3. Vigorous grimace to pain
2. Mild grimace to pain
1. No response to pain
Best Motor Response (6)
6. Obeys commands or performs normal
spontaneous movements
5. Localises to painful stimuli or withdraws to touch
4. Withdrawal to painful stimuli
3. Abnormal fl exion to pain
2. Abnormal extension to pain
1. No motor response to pain
Paediatric Glasgow Coma Scale
The paediatric version of the Glasgow Coma Scale is
modifi ed from the Adult Glasgow Coma Scale to take into
account of problems assessing the Best Verbal Response in
pre-verbal patients.
It is composed of three parameters: Best Eye Response,
Best Verbal Response and Best Motor Response. The
defi nition of these parameters is given below.
Best Eye Response (4)
4. Eyes open spontaneously
3. Eye opening to verbal command
2. Eye opening to pain
1. No eye opening
Best Verbal Response (5)
5. Alert, babbles, coos, words or sentences to usual ability
4. Less than usual ability and/or spontaneous irritable cry
3. Cries inappropriately
2. Occasionally whimpers and/or moans
1. No vocal response
APPENDIX C - Adult and paediatric Glasgow Coma Scale

137
Classifi cation of severity of head injury using GCS
Whilst the individual components of the Glasgow Coma
Scale should be used in communication about individual
patients the use of the aggregate Glasgow Coma Score can
be useful for describing patient populations.
The use of the aggregate score does allow the severity of
head injury to be classifi ed into the following categories:
Minor GCS 15
Mild GCS 13-14
Moderate GCS 9-12
Severe GCS 3-8
These classifi cations allow easy description of a head injured
population and are used within this text.
For some data presentation patients with GCS equal to
3 have been separated out from the rest of the severe
head injury group (GCS 4-8). This has been done to help
understand that data more easily as it is know that patients
with GCS equal to 3 have a much poorer prognosis than the
rest of the severe head injured group.
Ad
ult and p
aediatric
Glasg
ow
Co
ma S
caleC

138
APPENDIX D - An example of an excellent Patient Report Form (PRF)

139
An exam
ple o
f an excellent P
atient Rep
ort F
orm
(PR
F)
D

140
As defi ned in Better Care for the Severely Injured. A Report
from the Royal College of Surgeons of England and the
British Orthopaedic Society. 2000
The Required Facilities at the Major Acute Hospitals (Level 1)
• A 24-hour resuscitative trauma team, led by a
consultant with current ATLS® certification or
equivalent, must be in place.
• A 24-hour, fully staffed A&E department,
supported by on-call A&E consultants,
supported by specialist registrars.
• ICU beds and trauma beds on the same site
as the A&E department.
• On-site 24-hour X-ray and CT scanning
with appropriate staffing and immediate
reporting facilities.
• The equivalent of four to eight whole-time
consultants exclusively dealing with
orthopaedic trauma.
• A dedicated trauma theatre and daily
consultant orthopaedic trauma lists.
• A helicopter pad close to the A&E department
is mandatory. There should be no additional
secondary journey by road. The helicopter landing
site should allow landing throughout the 24 hours.
• There must be on-site departments of:
• Orthopaedic trauma
• Neurosurgery
• General and vascular surgery
• Plastic surgery
• Cardiothoracic or thoracic surgery
• Head & neck surgery
• Urology
• Anaesthesia with intensive care
• Interventional radiology
• Paediatric surgery
• Intensive care beds for children
• A named consultant director of trauma.
APPENDIX E - Level 1 trauma care

141
TrustCases
identifi ed
Organisational questionnaire
returned
Aintree Hospitals NHS Trust Yes Yes
Airedale NHS Trust Yes Yes
Ashford & St Peter’s Hospital NHS Trust Yes Yes
Barking, Havering and Redbridge Hospitals NHS Trust Yes Yes
Barnet and Chase Farm Hospitals NHS Trust No Yes
Barnsley Hospital NHS Foundation Trust Yes Yes
Barts and The London NHS Trust Yes Yes
Basildon & Thurrock University Hospitals NHS FoundationTrust Yes Yes
Basingstoke & North Hampshire Hospitals NHS Foundation Trust Yes Yes
Bedford Hospital NHS Trust Yes Yes
Birmingham Childrens Hospital NHS Trust Yes Yes
Blackpool, Fylde and Wyre Hospitals NHS Trust Yes Yes
Bolton Hospitals NHS Trust Yes Yes
Bradford Teaching Hospitals NHS Foundation Trust Yes Yes
Brighton and Sussex University Hospitals NHS Trust Yes Yes
Bro Morgannwg NHS Trust Yes Yes
Bromley Hospitals NHS Trust Yes Yes
Buckinghamshire Hospitals NHS Trust No Yes
Burton Hospitals NHS Trust Yes Yes
Calderdale & Huddersfi eld NHS Trust Yes No
Cambridge University Hospitals NHS Foundation Trust Yes Yes
Cardiff and Vale NHS Trust Yes Yes
Carmarthenshire NHS Trust Yes Yes
Central Manchester/Manchester Childrens Univ Hosps NHST Yes Yes
Ceredigion & Mid Wales NHS Trust Yes Yes
Chelsea & Westminster Healthcare NHS Trust Yes No
APPENDIX F - Participation
Particip
ation
F

142
TrustCases
identifi ed
Organisational questionnaire
returned
Chesterfi eld Royal Hospital NHS Foundation Trust Yes Yes
City Hospitals Sunderland NHS Foundation Trust Yes Yes
Conwy & Denbighshire NHS Trust Yes Yes
Countess of Chester Hospital NHS Foundation Trust Yes Yes
County Durham and Darlington Acute Hospitals NHS Trust Yes Yes
Craigavon Area Hospital Group Trust Yes Yes
Dartford & Gravesham NHS Trust Yes Yes
Derby Hospitals NHS Foundation Trust Yes Yes
Doncaster and Bassetlaw Hospitals NHS Foundation Trust Yes Yes
Dorset County Hospital NHS Foundation Trust Yes Yes
Down Lisburn Health & Social Services Trust No Yes
Dudley Group of Hospitals NHS Trust Yes Yes
Ealing Hospital NHS Trust Yes Yes
East & North Hertfordshire NHS Trust Yes Yes
East Cheshire NHS Trust Yes Yes
East Kent Hospitals NHS Trust Yes Yes
East Lancashire Hospitals NHS Trust No No
East Sussex Hospitals NHS Trust Yes Yes
Epsom and St Helier University Hospitals NHS Trust Yes Yes
Essex Rivers Healthcare NHS Trust Yes Yes
Frimley Park Hospitals NHS Trust Yes Yes
Gateshead Health NHS Trust No Yes
George Eliot Hospital NHS Trust Yes Yes
Gloucestershire Hospitals NHS Foundation Trust Yes Yes
Good Hope Hospital NHS Trust Yes No
Guy’s & St Thomas’ NHS Foundation Trust Yes Yes
APPENDIX F - Participation
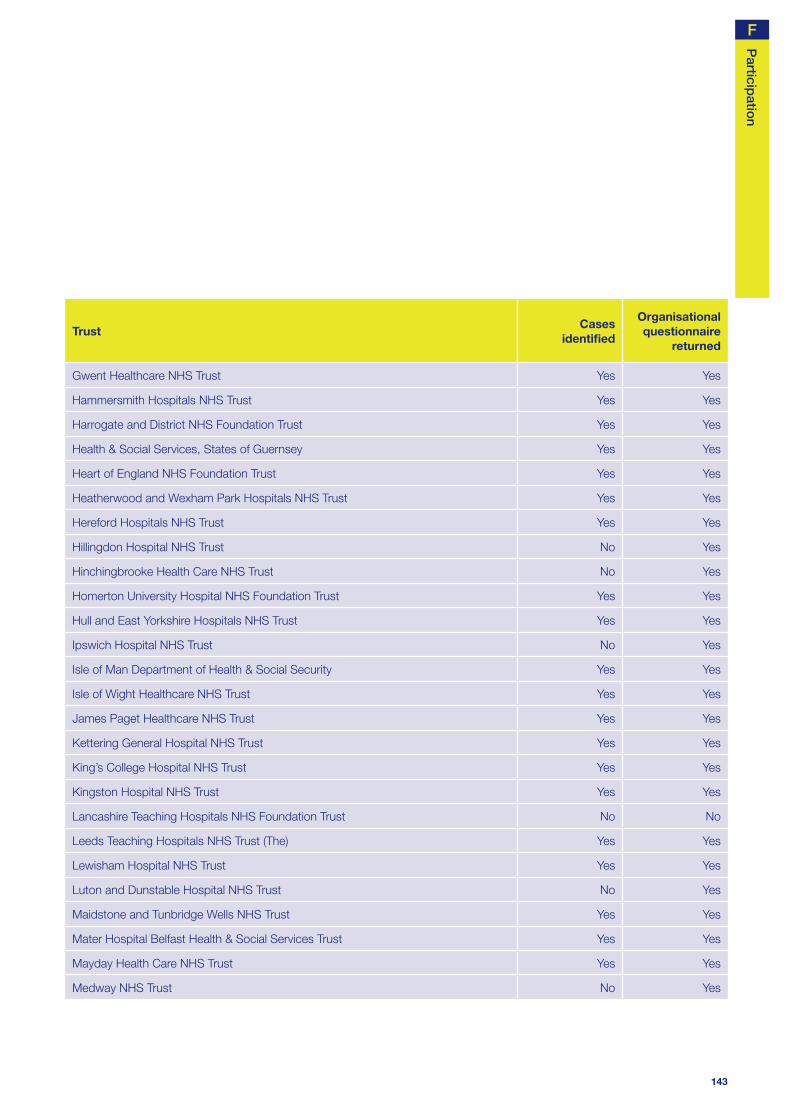
143
Particip
ation
TrustCases
identifi ed
Organisational questionnaire
returned
Gwent Healthcare NHS Trust Yes Yes
Hammersmith Hospitals NHS Trust Yes Yes
Harrogate and District NHS Foundation Trust Yes Yes
Health & Social Services, States of Guernsey Yes Yes
Heart of England NHS Foundation Trust Yes Yes
Heatherwood and Wexham Park Hospitals NHS Trust Yes Yes
Hereford Hospitals NHS Trust Yes Yes
Hillingdon Hospital NHS Trust No Yes
Hinchingbrooke Health Care NHS Trust No Yes
Homerton University Hospital NHS Foundation Trust Yes Yes
Hull and East Yorkshire Hospitals NHS Trust Yes Yes
Ipswich Hospital NHS Trust No Yes
Isle of Man Department of Health & Social Security Yes Yes
Isle of Wight Healthcare NHS Trust Yes Yes
James Paget Healthcare NHS Trust Yes Yes
Kettering General Hospital NHS Trust Yes Yes
King’s College Hospital NHS Trust Yes Yes
Kingston Hospital NHS Trust Yes Yes
Lancashire Teaching Hospitals NHS Foundation Trust No No
Leeds Teaching Hospitals NHS Trust (The) Yes Yes
Lewisham Hospital NHS Trust Yes Yes
Luton and Dunstable Hospital NHS Trust No Yes
Maidstone and Tunbridge Wells NHS Trust Yes Yes
Mater Hospital Belfast Health & Social Services Trust Yes Yes
Mayday Health Care NHS Trust Yes Yes
Medway NHS Trust No Yes
F

144
TrustCases
identifi ed
Organisational questionnaire
returned
Mid Cheshire Hospitals NHS Trust Yes Yes
Mid Staffordshire General Hospitals NHS Trust Yes Yes
Mid Yorkshire Hospitals NHS Trust Yes Yes
Mid-Essex Hospital Services NHS Trust No Yes
Milton Keynes General NHS Trust Yes Yes
Newcastle upon Tyne Hospitals NHS Foundation Trust Yes Yes
Newham Healthcare NHS Trust Yes No
Norfolk & Norwich University Hospital NHS Trust Yes Yes
North Bristol NHS Trust Yes Yes
North Cheshire Hospitals NHS Trust Yes Yes
North Cumbria Acute Hospitals NHS Trust Yes No
North East Wales NHS Trust No Yes
North Glamorgan NHS Trust No No
North Middlesex University Hospital NHS Trust Yes Yes
North Tees and Hartlepool NHS Trust Yes Yes
North West London Hospitals NHS Trust Yes Yes
North West Wales NHS Trust No Yes
Northampton General Hospital NHS Trust Yes Yes
Northern Devon Healthcare NHS Trust Yes Yes
Northern Lincolnshire & Goole Hospitals Trust Yes Yes
Northumbria Healthcare NHS Trust Yes Yes
Nottingham University Hospitals NHS Trust Yes Yes
Oxford Radcliffe Hospital NHS Trust Yes Yes
Pembrokeshire & Derwen NHS Trust Yes Yes
Pennine Acute Hospitals NHS Trust (The) Yes Yes
Peterborough & Stamford Hospitals NHS Foundation Trust Yes Yes
APPENDIX F - Participation

145
Particip
ation
TrustCases
identifi ed
Organisational questionnaire
returned
Plymouth Hospitals NHS Trust Yes Yes
Pontypridd & Rhondda NHS Trust No Yes
Poole Hospital NHS Trust No No
Portsmouth Hospitals NHS Trust Yes Yes
Princess Alexandra Hospital NHS Trust No No
Queen Elizabeth Hospital NHS Trust Yes Yes
Queen Mary’s Sidcup NHS Trust Yes Yes
Royal Berkshire NHS Foundation Trust Yes Yes
Royal Bournemouth and Christchurch Hospitals NHS Trust Yes Yes
Royal Cornwall Hospitals NHS Trust Yes Yes
Royal Devon and Exeter NHS Foundation Trust Yes Yes
Royal Free Hampstead NHS Trust Yes Yes
Royal Group of Hospitals & Dental Hospitals & Maternity Hosp Yes Yes
Royal Liverpool & Broadgreen University Hospitals NHS Trust Yes Yes
Royal Liverpool Children’s NHS Trust Yes Yes
Royal Surrey County Hospital NHS Trust Yes Yes
Royal United Hospital Bath NHS Trust Yes Yes
Royal West Sussex NHS Trust Yes No
Royal Wolverhampton Hospitals NHS Trust (The) Yes Yes
Salford Royal Hospitals NHS Trust Yes Yes
Salisbury Foundation NHS Trust Yes Yes
Sandwell and West Birmingham Hospitals NHS Trust Yes Yes
Scarborough and North East Yorkshire Health Care NHS Trust Yes Yes
Sheffi eld Children’s NHS Foundation Trust Yes No
Sheffi eld Teaching Hospitals NHS Foundation Trust Yes Yes
Sherwood Forest Hospitals NHS Trust Yes No
F
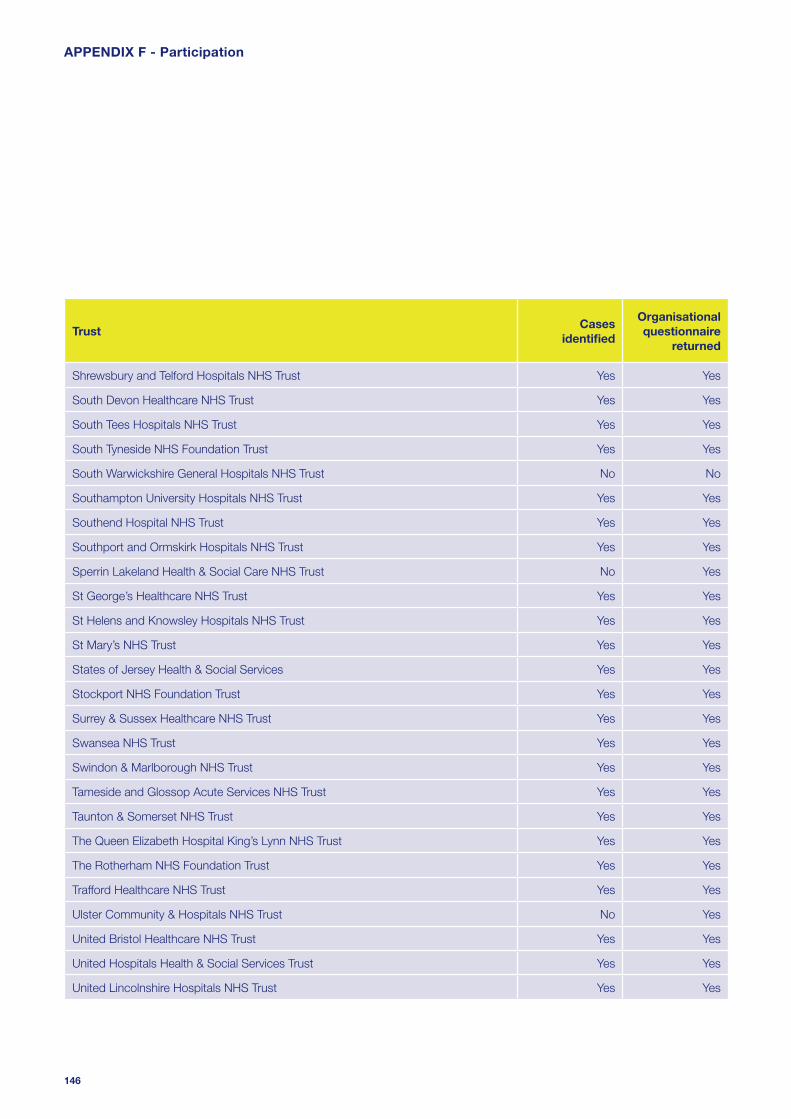
146
TrustCases
identifi ed
Organisational questionnaire
returned
Shrewsbury and Telford Hospitals NHS Trust Yes Yes
South Devon Healthcare NHS Trust Yes Yes
South Tees Hospitals NHS Trust Yes Yes
South Tyneside NHS Foundation Trust Yes Yes
South Warwickshire General Hospitals NHS Trust No No
Southampton University Hospitals NHS Trust Yes Yes
Southend Hospital NHS Trust Yes Yes
Southport and Ormskirk Hospitals NHS Trust Yes Yes
Sperrin Lakeland Health & Social Care NHS Trust No Yes
St George’s Healthcare NHS Trust Yes Yes
St Helens and Knowsley Hospitals NHS Trust Yes Yes
St Mary’s NHS Trust Yes Yes
States of Jersey Health & Social Services Yes Yes
Stockport NHS Foundation Trust Yes Yes
Surrey & Sussex Healthcare NHS Trust Yes Yes
Swansea NHS Trust Yes Yes
Swindon & Marlborough NHS Trust Yes Yes
Tameside and Glossop Acute Services NHS Trust Yes Yes
Taunton & Somerset NHS Trust Yes Yes
The Queen Elizabeth Hospital King’s Lynn NHS Trust Yes Yes
The Rotherham NHS Foundation Trust Yes Yes
Trafford Healthcare NHS Trust Yes Yes
Ulster Community & Hospitals NHS Trust No Yes
United Bristol Healthcare NHS Trust Yes Yes
United Hospitals Health & Social Services Trust Yes Yes
United Lincolnshire Hospitals NHS Trust Yes Yes
APPENDIX F - Participation

147
Particip
ation
TrustCases
identifi ed
Organisational questionnaire
returned
Univ. Hospital of South Manchester NHS Foundation Trust Yes Yes
University College London Hospitals NHS Foundation Trust No Yes
University Hospital Birmingham NHS Foundation Trust Yes Yes
University Hospital of North Staffordshire NHS Trust No No
University Hospitals Coventry and Warwickshire NHS Trust Yes Yes
University Hospitals of Leicester NHS Trust Yes Yes
University Hospitals of Morecambe Bay NHS Trust Yes Yes
Walsall Hospitals NHS Trust Yes No
West Hertfordshire Hospitals NHS Trust No No
West Middlesex University Hospital NHS Trust No No
West Suffolk Hospitals NHS Trust Yes Yes
Whipps Cross University Hospital NHS Trust Yes Yes
Whittington Hospital NHS Trust Yes Yes
Winchester & Eastleigh Healthcare NHS Trust Yes Yes
Wirral Hospital NHS Trust Yes Yes
Worcestershire Acute Hospitals Yes Yes
Worthing and Southlands Hospitals NHS Trust Yes Yes
Wrightington, Wigan & Leigh NHS Trust Yes Yes
Yeovil District Hospital NHS Foundation Trust Yes Yes
York Hospitals NHS Trust Yes Yes
Trusts are listed that were expected to participate.
F

148
APPENDIX G - Corporate structure
Dr M Clements Royal College of Physicians
Dr A Nicholson Royal College of Radiologists
Mr B Rees Royal College of Surgeons of England
Mr M Parker Royal College of Surgeons of England
Mr D Mitchell Faculty of Dental Surgery, Royal
College of Surgeons of England
Dr S Lishman Royal College of Pathologists
Ms S Panizzo Patient Representative
Mrs M Wang Patient Representative
Observers
Mrs C Miles Institute of Healthcare Management
Dr R Palmer Coroners’ Society of England
and Wales
Mrs H Burton Scottish Audit of Surgical Mortality
Mrs E Stevenson National Patient Safety Agency
The National Confi dential Enquiry into Patient Outcome
and Death (NCEPOD) is an independent body to which a
corporate commitment has been made by the Medical and
Surgical Colleges, Associations and Faculties related to its
area of activity. Each of these bodies nominates members on
to NCEPOD’s Steering Group.
Steering Group as at 21st November 2007
Dr D Whitaker Association of Anaesthetists
of Great Britain and Ireland
Mr T Bates Association of Surgeons
of Great Britain & Ireland
Dr S Bridgman Faculty of Public Health Medicine
Dr P Cartwright Royal College of Anaesthetists
Dr P Nightingale Royal College of Anaesthetists
Dr B Ellis Royal College of General Practitioners
Ms M McElligott Royal College of Nursing
Prof D Luesley Royal College of Obstetricians
and Gynaecologists
Mrs M Wishart Royal College of Ophthalmologists
Dr I Doughty Royal College of Paediatrics
and Child Health
Dr R Dowdle Royal College of Physicians
Professor T Hendra Royal College of Physicians
Dr M Armitage Royal College of Physicians

149
Co
rpo
rate structure
Clinical Co-ordinators
The Steering Group appoint a Lead Clinical Co-ordinator for
a defi ned tenure. In addition there are seven Clinical Co-
ordinators who work on each study. All Co-ordinators are
engaged in active academic/clinical practice (in the NHS)
during their term of offi ce.
Lead Clinical Co-ordinator Mr I C Martin (Surgery)
Clinical Co-ordinators Dr D G Mason (Anaesthesia)
Dr J Stewart (Medicine)
Professor S B Lucas (Pathology)
Dr G Findlay (Intensive Care)
Dr D Mort (Medicine)
Mr S Carter (Surgery)
Mr M Lansdown (Surgery)
Dr K Cleary National Patient Safety Agency
NCEPOD is a company, limited by guarantee and a
registered charity, managed by Trutees.
Trustees
Chairman Professor T Treasure
Treasurer Mr G T Layer
Professor M Britton
Professor J H Shepherd
Mr M A M S Leigh
Dr D Justins
Company Secretary Dr M Mason
G

Designed and produced by Interface, Bristol. Telephone 0117 923 2235
Published November 2007 by the National Confi dential Enquiry
into Patient Outcome and Death (2007)
4-8 Maple Street, London W1T 5HD
T 020 7631 3444
F 020 7631 4443
W www.ncepod.org.uk
ISBN 0-9539240-8-4
A company limited by guarantee Company no. 3019382
Registered Charity no. 1075588
This report can be found on the NCEPOD web site www.ncepod.org.uk