Trash to treasure: Effectiveness of a denitrification ...
23
1 Trash to treasure: Effectiveness of a denitrification-based microbial fuel cell for degradation of wastewater sludge Xiaoxuan Yang 1 , Joe Vallino 2 1 Grinnell College 1115 8 th Avenue, Grinnell, Iowa 50112 USA 2 The Ecosystems Center: Semester in Environmental Science Marine Biological Laboratory Woods Hole, Massachusetts 02543 USA 2015 Fall Semester
Transcript of Trash to treasure: Effectiveness of a denitrification ...
1
Trash to treasure: Effectiveness of a
denitrification-based microbial fuel cell for
degradation of wastewater sludge
Xiaoxuan Yang1, Joe Vallino
2
1Grinnell College
1115 8th Avenue, Grinnell, Iowa 50112 USA
2The Ecosystems Center: Semester in Environmental Science
Marine Biological Laboratory
Woods Hole, Massachusetts 02543 USA
2015 Fall Semester
2
Abstract
Microbial fuel cells (MFCs) convert the energy stored in chemical bonds in organic
compounds to electrical energy achieved through the catalytic reactions by
microorganisms. Due to the promise of sustainable energy production from organic waste
and simultaneous wastewater treatment, electricity generation using a two-chambered
MFC was examined using acetate solution and local brewery waste grain. The MFCs
were run with either aerobic or anaerobic cathodes, which were supplied with augmented
nitrate solution. The maximum power density generated by aerobic MFC was
48.5mW/m2
at a dilution rate of 12.8 d-1
. In the brewery waste grain treatment, the
aerobic MFC generated at most 16.4μW/m2 at a dilution rate of 3.2 d
-1. Using either
acetate or brewery waste grain, the aerobic MFCs generated power density more than
2800 times higher than that of the coupled denitrification MFCs. The nitrate-based MFCs
generated a maximum power density of 0.46μW/m2 during beer’s waste treatment and
1.3mW/m2 during acetate treatment.
Introduction
Fossil fuels have supported the industrialization and economic growth during the past
century. However, energy-generating systems based on the fossil fuels have also
increased greenhouse gases emission and contributed to climate change (Marland et al.
2003). Since fossil fuels cannot indefinitely sustain a global economy, we are inevitably
facing a global energy crisis. To augment the insufficient availability and to alleviate
greenhouse gas emission of oil and natural gas, Microbial Fuel Cells (MFC) have
emerged in recent years as a promising technology (Logan et al. 2006). MFC represents
the newest approach for generating electricity from biomass using bacteria. MFCs work
by using metabolic energy from microorganisms to oxidize organic matter in the anodic
chamber. Energy rich electrons from biodegradation of organic matter are absorbed by
the anode and are transported to the cathode through an external circuit, generating
current.
MFC can generate electricity by oxidizing processed waste with high organic carbon as
substrates while simultaneously accomplish inorganic nitrogen reduction. Increasing
concerns still arise regarding high anthropogenic nitrogen loading in the environment,
due to its severe impacts on the eutrophic level of water bodies and on human and animal
health. Advanced wastewater treatments mitigate nitrogen through biochemical
conversion from nitrate to inert nitrogen gas (N2). Recent studies have shown that MFCs
can provide the necessary reducing power for denitrification to take place (Virdis et al.
2010). In cathodic chambers, autotrophic denitrification may occur, leading to nitrate
removal with concomitant electricity production. This would be a sustainable solution to
reducing nitrate concentration because no nitrogen is released. Other types of MFC
3
cathode systems, such as platinum cathode with oxygen reduction or a hexacyanoferrate
solution have also been studied to generate electricity from reduced organic matter
(Clauwaert et al. 2009; Rabaey et al. 2005). However, comparison between cathode
systems such as nitrate-based cathode and aerobic cathode still needed further
examination.
In this study, we investigated the performance of MFCs on treating synthetic acetate
wastewater and brewery grains using an MFC system via nitrate-based and aerobic-based
cathodes. Studies have shown that acetate is a preferred aqueous substrate for electricity
generation in MFCs by anaerobic bacteria such as Geobacter species (Liu et al. 2005).
Consequently, we used acetate media as the feed to the anodic chambers, as given by the
reaction.
Anodic reaction:
5
2CH3COO
- + 5H2O ⇀ 5CO2 + 171
2H+ + 20𝑒−
For the cathode, we considered both anaerobic and aerobic half-reactions, as given by
Cathodic reaction:
Nitrate-based cathode: 4NO3-
+ 24H+ + 20𝑒− ⇀ 2N2 + 12H2O
Aerobic cathode: O2 + 4H+ + 4𝑒− ⇀ 2H2O
The overall reaction is the break down of the acetate to carbon dioxide in the anodic
chamber. For nitrate-based cathodes, bacteria may retrieve electrons and reduce nitrate
toward nitrogen gas (N2). For aerobic cathodes, oxygen serves as the electron acceptor
producing water as the final product.
To investigate MFC performance with more realistic waste materials, we also used
processed grains from a local microbrewery, Cape Cod Beer. Brewery waste consists of
starch, protein and sugar (Speece 1996). Local beer brewery wastewater has not
previously been examined as a substrate for power generation in an MFC, despite its
food-derived nature of the organic matter and the lack of high concentrations of
inhibitory substances—for example, ammonia in animal waste (Feng et al. 2008).
During the project, we continuously recorded the voltage of all four MFCs, and the
performance of the MFCs for power generation was evaluated in terms of maximum
power densities at different flow rates. We also measured nitrite (NO2-), nitrate (NO3
-)
and ammonium (NH4+) to determine the nitrogen speciation in cathode chamber and the
potential of denitrification for those MFC’s operated with an anaerobic cathode. To
investigate the degradation of organic matter in anodic chambers, we measured dissolved
4
organic carbon (DOC), dissolved inorganic carbon (DIC) and particulate organic carbon
and nitrogen (POC/PON). We also used MFCs with aerobic cathodes to determine if they
produced more power in the presence of aeration than the nitrate-based cathodes.
Methods
MFC construction
Four duel chamber cells were assembled using PVC (polyvinyl chloride) tubes fittings
with a 685 mL dual-chamber working volume (Figs. 1 and 2). Each chamber was made
from 5 cm diameter Tee-shaped PVC fittings with 2.5 cm diameter side port, which was
connected to 2.5 cm diameter universal joint. A treaded “clean-out” fitting was used on
the top of anodic and cathodic chambers. The top of each Tee-shaped PVC tubes had
1/8’’ tubing to four 1/8” NPT pipe threads to connect electrodes, influent port, sampling
port and effluent port with luer-lok to 1/8’’ NPT pipe threads. A 2’’ PVC plug was
installed on the bottom of each MFC. The anodic and cathodic chambers were separated
at the universal joint by a proton exchange membrane (PEM, Nafion 117, FuelCells Etc,
College Station, TX), allowing protons to move across to the cathode. Plain weave
carbon fiber mesh (5cmx5cm, Jamestown distributors, Bristol, RI) was treated at 450 C
for an hour in a muffle furnace. Carbon cloth with 0.3 mg/cm² (40% Platinum) on Vulcan
(LLGDE, FuelCells Etc, College Station, TX) was cut into squares 5 cm by 5 cm. Both
carbon mesh and carbon cloth was attached to titanium anode and cathode 1/8” rods
using epoxy adhesive (AA-CARB 61, Atom Adhesives, Providence, RI), respectively.
MFCs were soaked in deionized water prior to use. MFC#1 and #2 were set up as closed
circuit where anode and cathode were connected to an A/D input device (WTAIN-M,
Weeder Technologies, Fort Walton Beach, FL). The induced voltage was measured
across a Bourns 3296 potentiometer with 25 turns to adjust the resistance from 0Ω to
1000Ω. MFC#3 and #4 were set up as open circuit (i.e., anode and cathode connected to
A/D converter without load).
MFC operation
A minimal base growth medium containing (per L) KH2PO4, 3.1g; K2HPO4, 5g; NaCl,
0.5g; MgSO47H2O, 0.2g; CaCl22H2O, 0.015g; and trace metals, 1mL where used for
both the anode and cathode (Thygesen et al. 2011; Rabaey et al. 2005). We added (per L)
CH3COONa, 0.82g and NH4Cl, 0.032 g to the base medium in one media bottle
connected to anodic chambers as the acetate-augmented solution. The other media bottle
connected to cathodic chambers was augmented with (per L) NaHCO3, 2.02 g and KNO3,
1.62 g as the nitrate solution. The media for the anode was filter sterilized (0.2 m) into
autoclaved 20 L media bottle. Both feeding bottles were continuously sparged with N2 air
to maintain an anaerobic environment. All gases were passed through sterile 0.2 m
filters.
5
The anodes of the MFCs were inoculated with 30 mL solution from an existing anaerobic
digester and 10 mL each from saltwater and fresh water Winogradsky columns. New
culture media was drawn in only when MFC’s were sampled. As the voltages stabilized,
a continuous flow of growth medium was fed into the MFCs at 110 mL d-1
, producing a
dilution rate (D) of 0.32 d-1
. The dilution rate was increased 10 fold and then another 4
fold to a dilution rate of 3.2 d-1
to examine MFC performance under high loads and
growth rates. For acetate solution, we further increased the dilution rate to 12.8 d-1
to
investigate maximum power generation. We started to sparge air to the cathodes of
MFC#2 and #4 on day 15 while MFC#1 and #3 were maintained with nitrate-based
cathodes.
Beer brewery wastewater
Brewer’s grain waste was collected from a microbrewery, Cape Cod Beer (Hyannis,
MA). The freshly processed grains were compressed to drain the liquid. Around 15 L of
waste was further soaked and washed with hot tap water to generate a fluid volume of 18
L in total. The liquid was then filtered through a 300 m sieve, but was not sterilized.
Analytical methods
20 mL DOC sample was collected and acidified by 100 L 50% phosphoric acid after
filtration (25 mm ashed) and stored in a refrigerator. POC and PON content of the
samples were collected by filtering 20 mL to 60 mL solution collected from anodic
chambers. The ashed filters (GF/F 25 mm diameter) were dried in the oven for three days
before storage. DIC and methane (CH4) were measured by collecting no less than 5 mL
of solution from the anodic chambers into a syringe for instant analysis with a final
volume of 5 mL. 15 mL of air was then drawn into the DIC and CH4 syringes, shaked
with the stopcock stopped. 0.2 mL HCl was injected into the headspace gas and the water
from the syringe was ejected, leaving around 10mL of gas in the syringe. A 20 mL NH4+
sample was collected for NH4+ analysis. The sample was filtered (25 mm diameter) and
was preserved by adding 20 L 5N HCl before storage in the refrigerator. A 20 mL NO3-
and NO2- sample was collected with filtration (GF/F 25 mm diameter) and was stored in
the freezer for further analysis.
DOC samples were analyzed on an Aurora 1030 total organic carbon analyzers
(Osburn&St-Jean 2007). POC and PON content of the samples were determined by
combusting particulate material retained on small (25 mm diameter) glass fiber filters in
the Thermo Scientific 2000. The gas in the headspace of a DIC and CH4 syringe was
steadily injected into Gas Chromatography (GC-14A). NH4+ was measured using
phenol-hypochlorite method by Solarzano (1969) and Strickland and Parsons (1972) on a
6
Shimadzu 1601 spectrophotometer. The concentration of each water sample was
determined using the equation of the best-fit line to the points of an ammonium standard
curve (concentration vs. absorbance) for 0 M, 0.5 M, 1 M, 5 M, 10 M, 50 M, and
100 M NH4+ standard solutions. The standard solutions were created using a 10,000 M
NH4Cl stock solution. NO3- and NO2
- were determined using the cadmium reduction
method on a flow injection analyzer (Foreman 2010). The Lachat instrument’s associated
computer program determined the concentration of each water sample using the equation
of the best-fit line to the points of a nitrate standard curve (concentration vs. absorbance)
for 0 M, 0.5 M, 1 M, 2 M, 5 M, 10 M, 25 M, and 50 M NO3- - standard
solutions, along with a 50 M NO2- solution. Any 10 mL sample that read over 100 M
NO3- was diluted accordingly and run through the Lachat instrument again to confirm an
accurate reading.
Power curve generation
Voltage (V) was measured using a A/D converter and used to calculate the current (I)
depending on the measured voltage (V) and calculated current (I): P=V×I. Voltage
stabilization was reached before switching to another resistance in order to measure the
maximum power generated at a steady state. Power was normalized by the cross sectional
area of the anode (5cmx5cm). Power density curves were conducted at D=3.2 d-1
and
D=12.8 d-1
for acetate treatment and at D=0.32 d-1
and D=3.2 d-1
for beer waste.
Results
Voltage
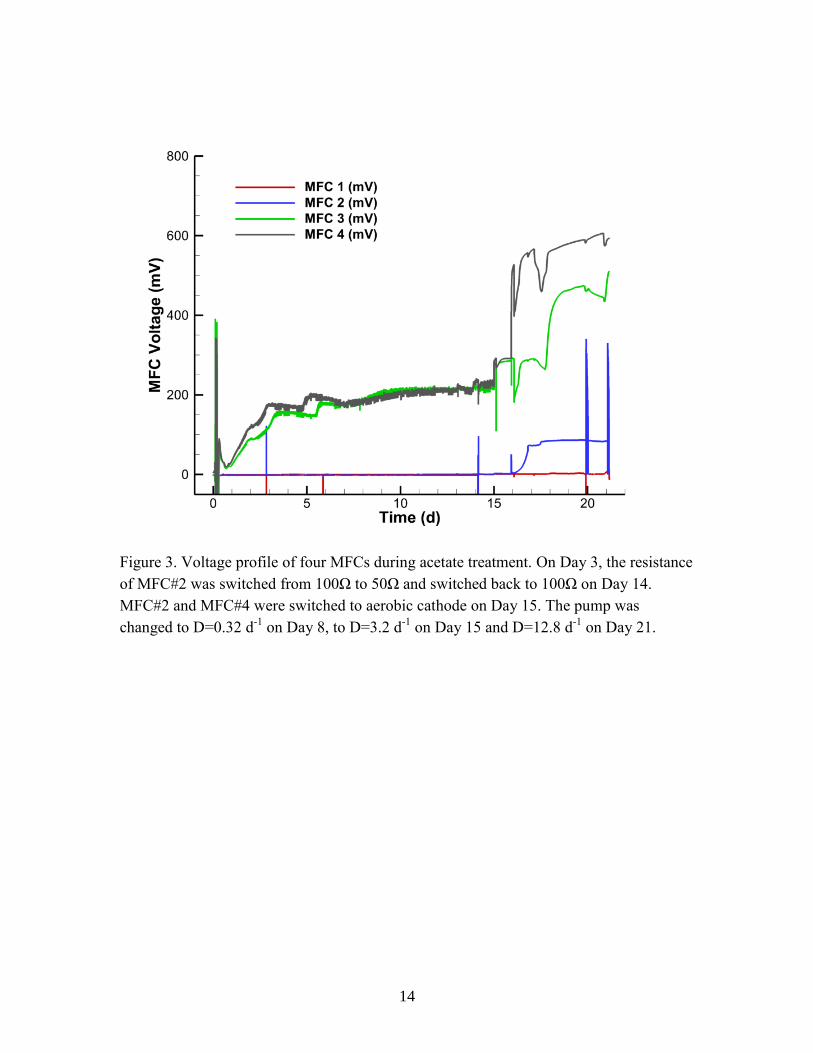
Open circuit MFCs had higher voltage values compared to closed circuit MFCs due to the
absence of loads. Since we started aeration on closed circuit MFC#2 and open circuit
MFC#4 from Day 15, we observed a substantial increase in both cells (Fig.2). Voltage of
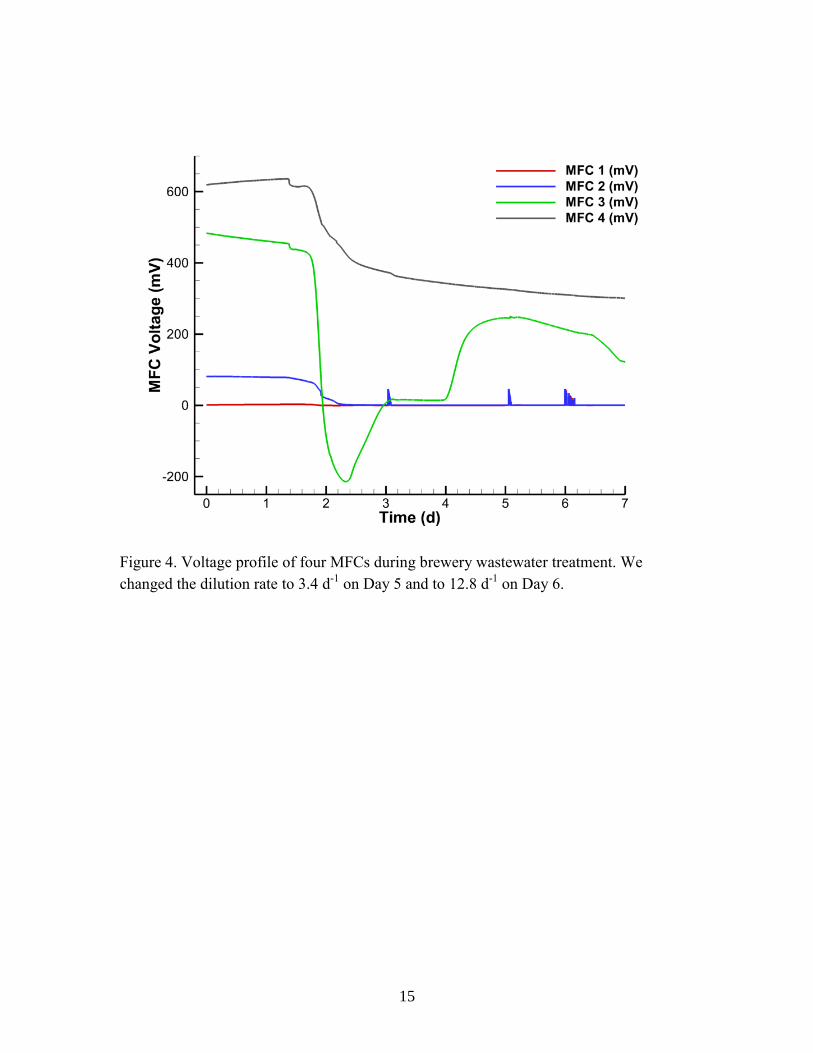
both closed and open circuit MFCs dropped at least 50% after we switched the anode
feeding solution from acetate solution to processed brewery wastewater (Fig.4).
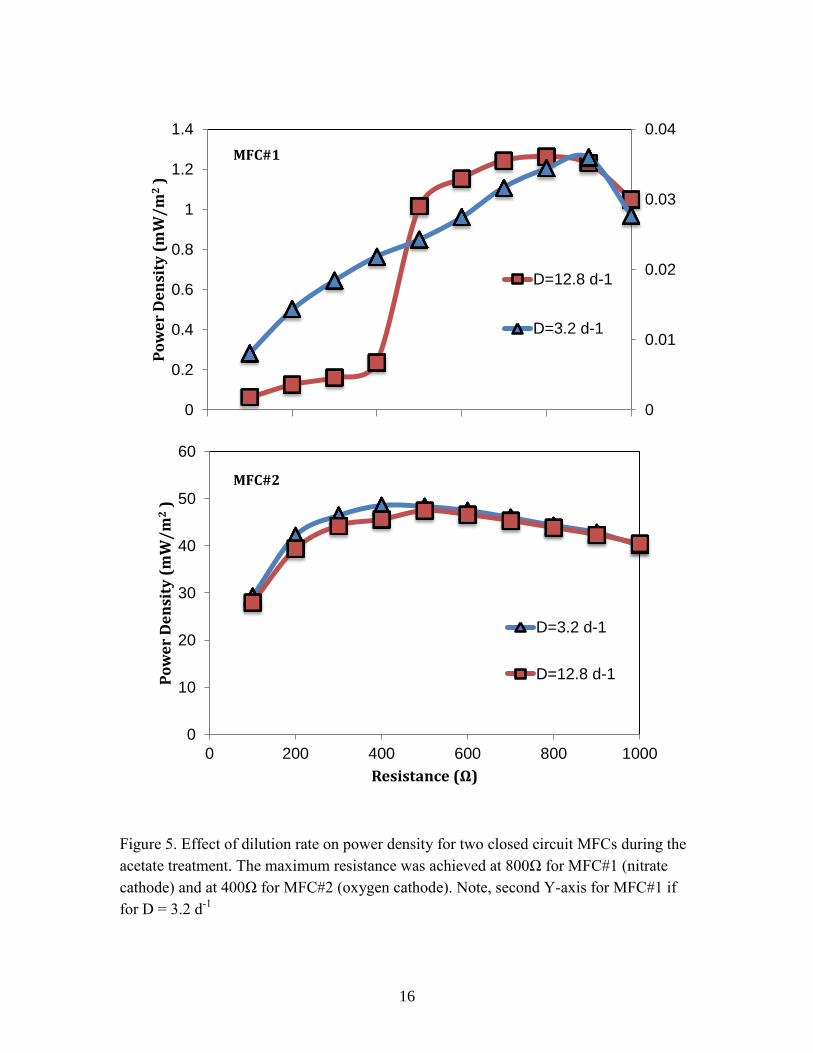
MFCs power output at higher flow rates
At lower flow rate of acetate supply (D=3.2 d-1
), the maximum power density obtained
from a power curve, measured by varying the external resistance (100Ω-1000Ω), was
36.0μW/m2 and 48.5mW/m
2 for anaerobic and aerated MFCs, respectively (Fig.5).
Higher flow rate increased power generation from the anaerobic coupled-denitrification
MFC while not having much impact on the aerobic MFC (Fig.5). The maximum power
density increased to 1263μW/m2, nearly 35 times the power output for the nitrate-based
MFC at low dilution rate (D=3.2 d-1
). However, the maximum power density decreased
slightly from to 48.5mW/m2
to 47.4mW/m2 for aerated MFC under increased dilution rate
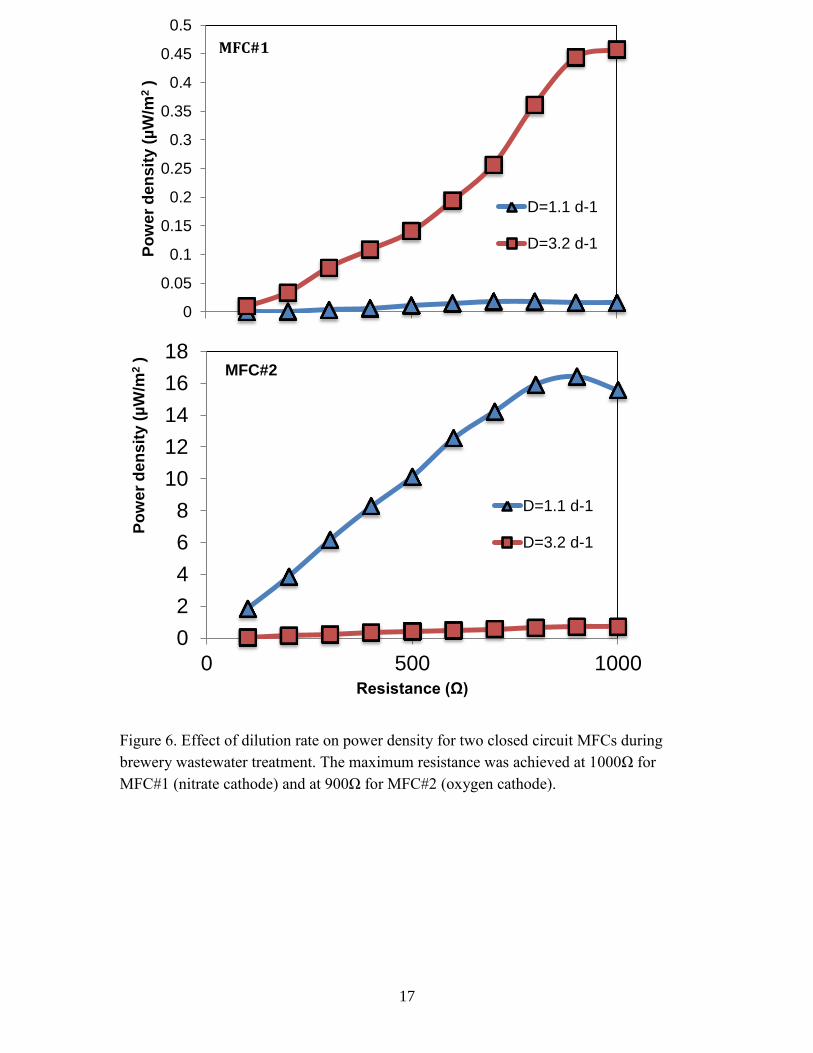
(Fig.6). Similarly, for brewery waste, higher flow rate increased the power generation of
7
nitrate-based MFC but decreased the power generation of aerobic MFC (Fig.6). The
highest power generation at a high dilution rate of 3.2 d-1
was 0.46μW/m2 for the
anaerobic coupled-denitrification MFC and 0.72 μW/m2 for the aerobic MFC. At a lower
dilution rate of 1.1 d-1
, the anaerobic coupled-denitrification MFC generated 0.019
μW/m2 and the aerobic MFC generated 16.4μW/m
2 at maximum.
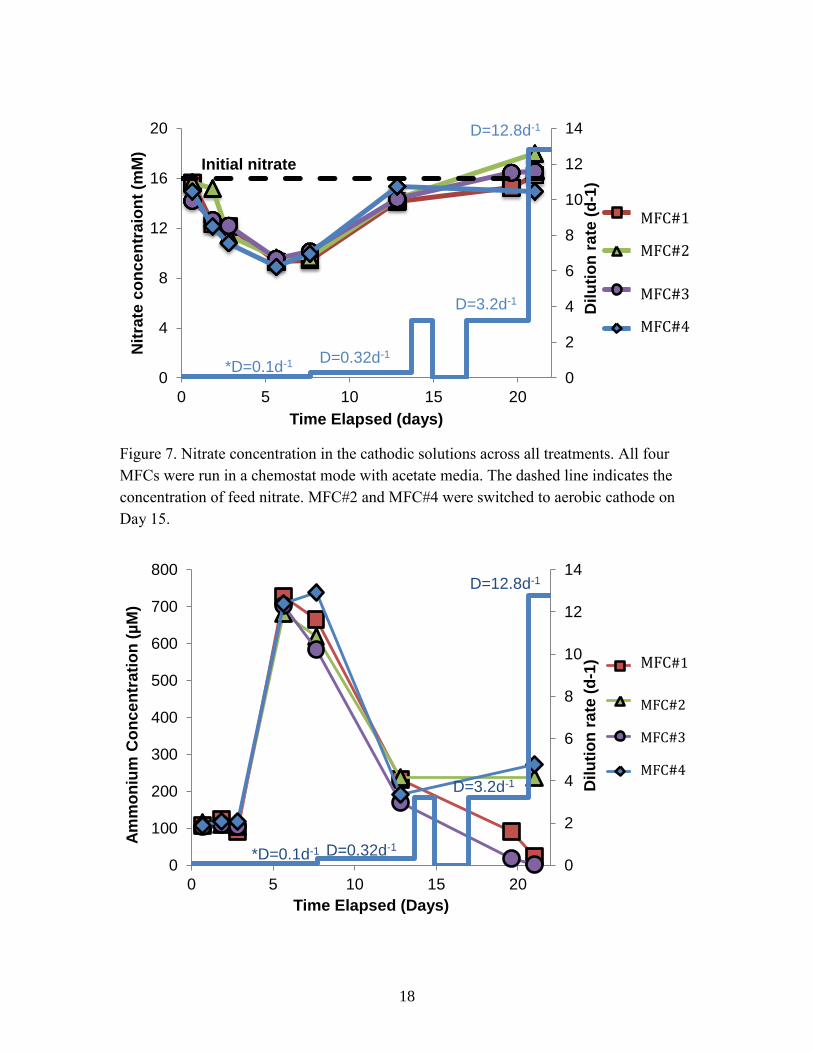
Nitrate reduction
Nitrate reduction, or potential denitrification, in the cathodic chamber was analyzed in all
four MFCs operated in different modes. Nitrate reduction was similar in all treatments,
showing an almost 40% loss of nitrate by the end of the fed-batch mode (Fig.7). We saw
a gradual increase in NH4+ concentration, possibly resulted from nitrate reduction around
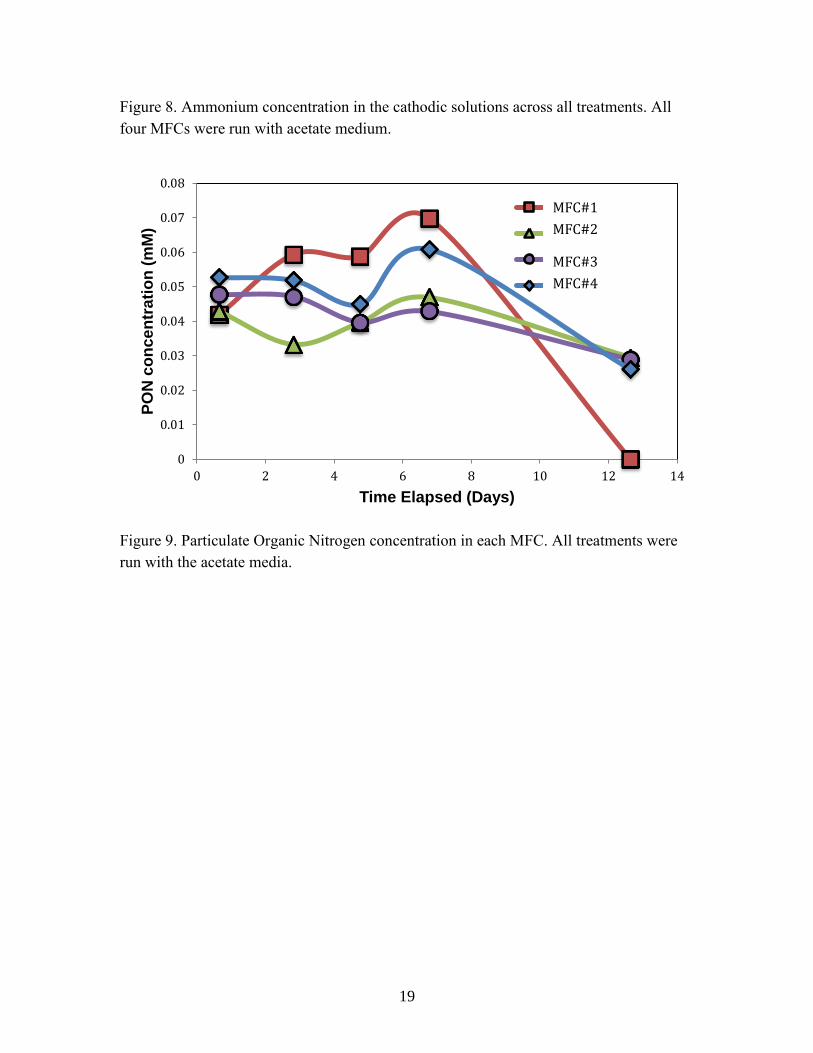
Day 6 (Fig.8). We observed a small increase in PON at around the same period of time,
corresponding to the large decrease of NO3- as well (Fig.9). Once we started continuous
flow, NO3- concentration increased because of high supply of nitrate solution. NH4
+
concentration in nitrate-based MFCs decreased to almost zero by the end of the
experiment. In oxygen-based MFCs, NH4+ concentration decreased to around 250 μM,
because flow of nitrate media to MFCs #2 and #4 was stopped once cathode with aerated
starting on day 15. We did not detect any nitrite in any of the treatments over time.
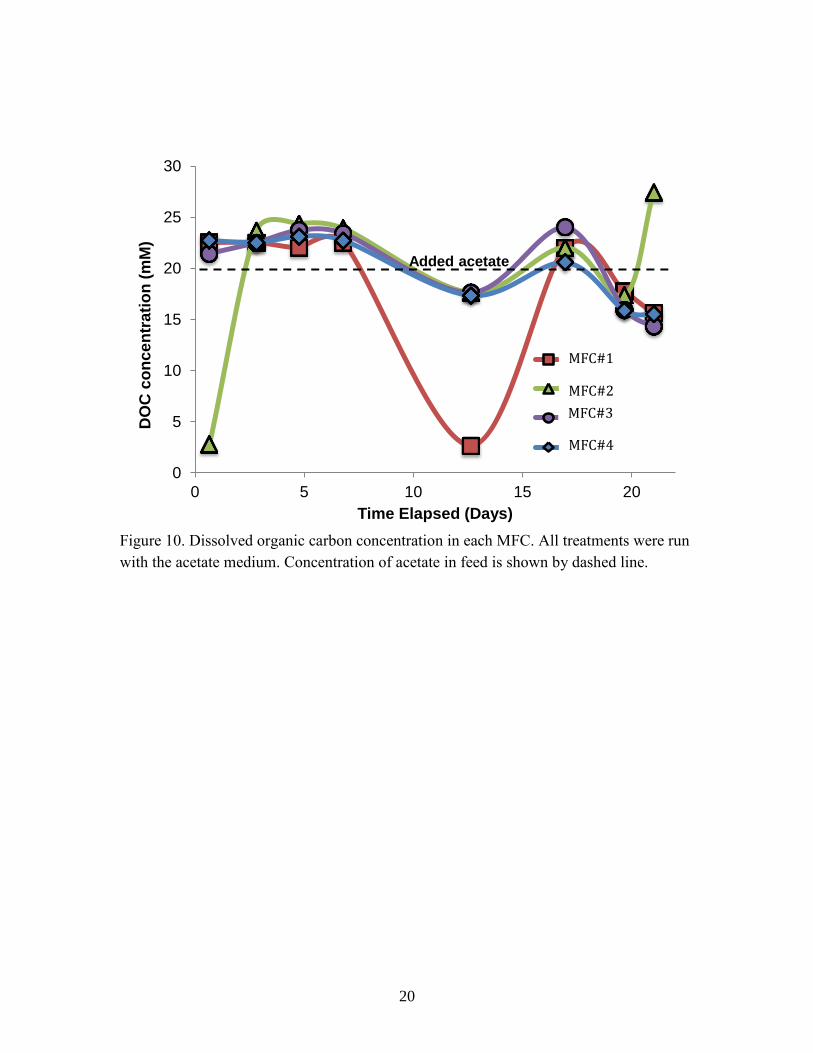
Degradation of acetate
DOC content was consistent in both the coupled-denitrification MFCs and aerobic MFCs
(Fig.10). In comparison to original acetate concentration in the feeding solution, we did
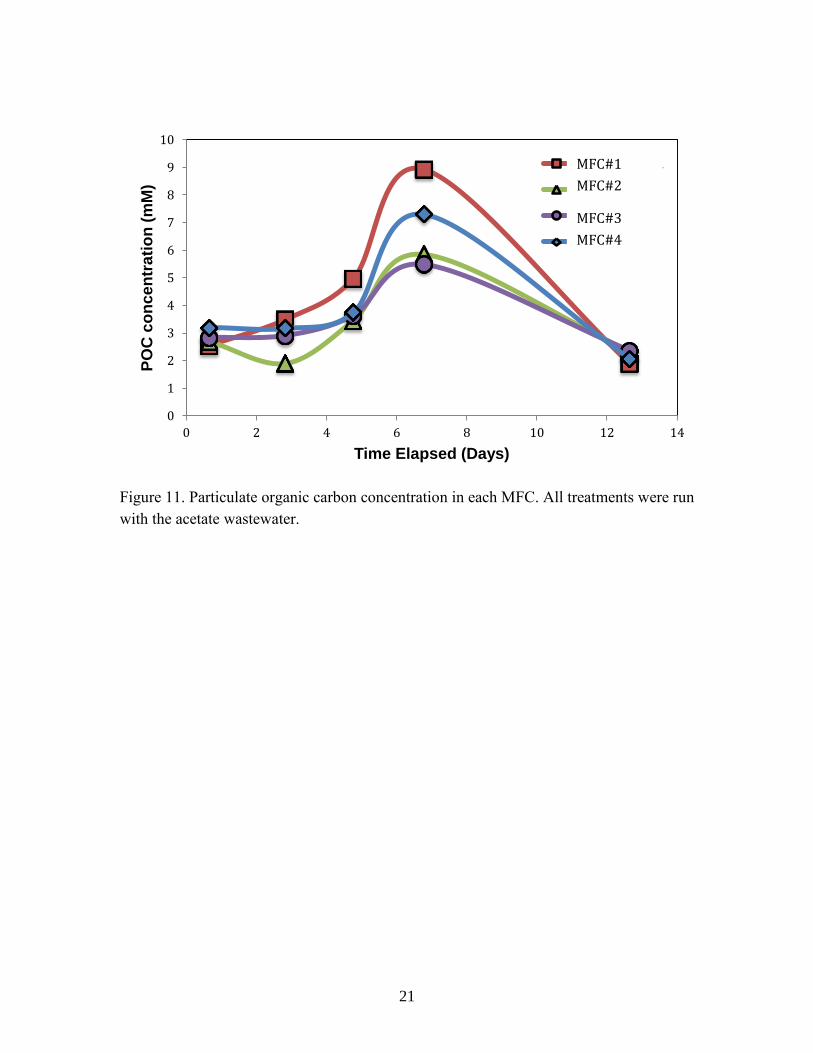
not observe a steep decline of acetate. We observed a small increase of POC,
corresponding to the slight decline of acetate between Day 6 and Day 13 (Fig.11).
DIC and Methane
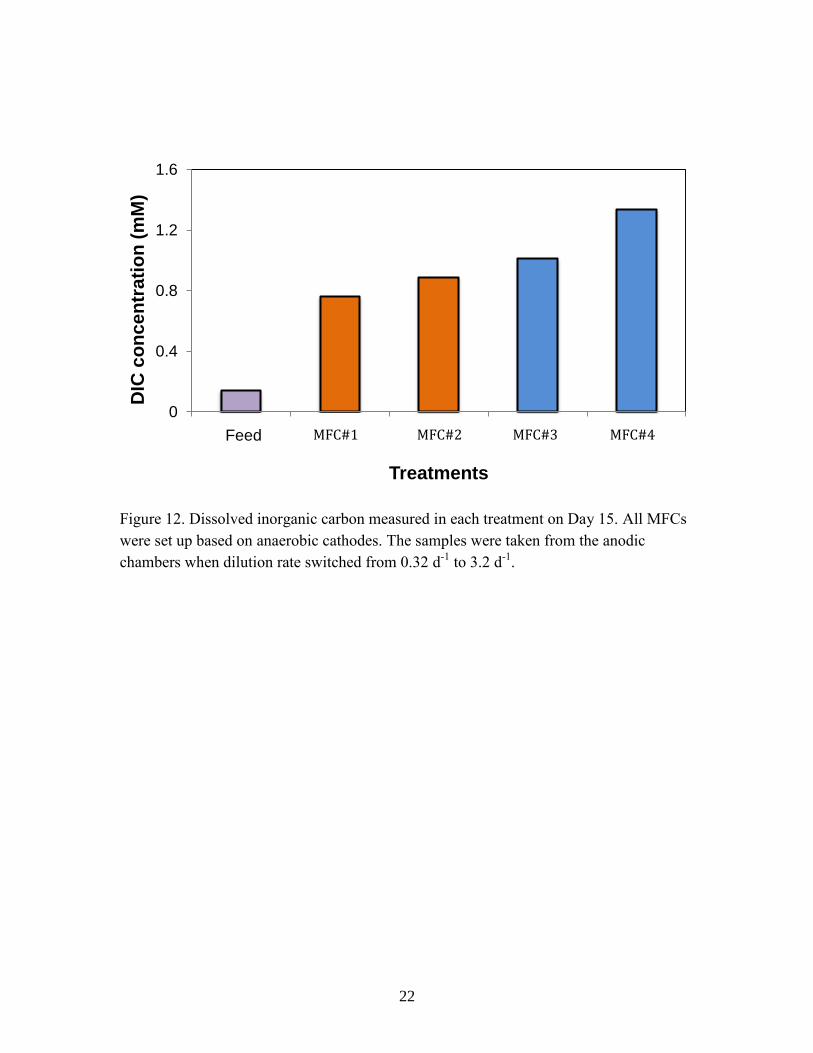
We measured DIC and found all MFCs produced DIC in their anodic chamber (Fig.12).
Oxygen-based MFCs had higher DIC concentration than nitrate-based MFCs. We found
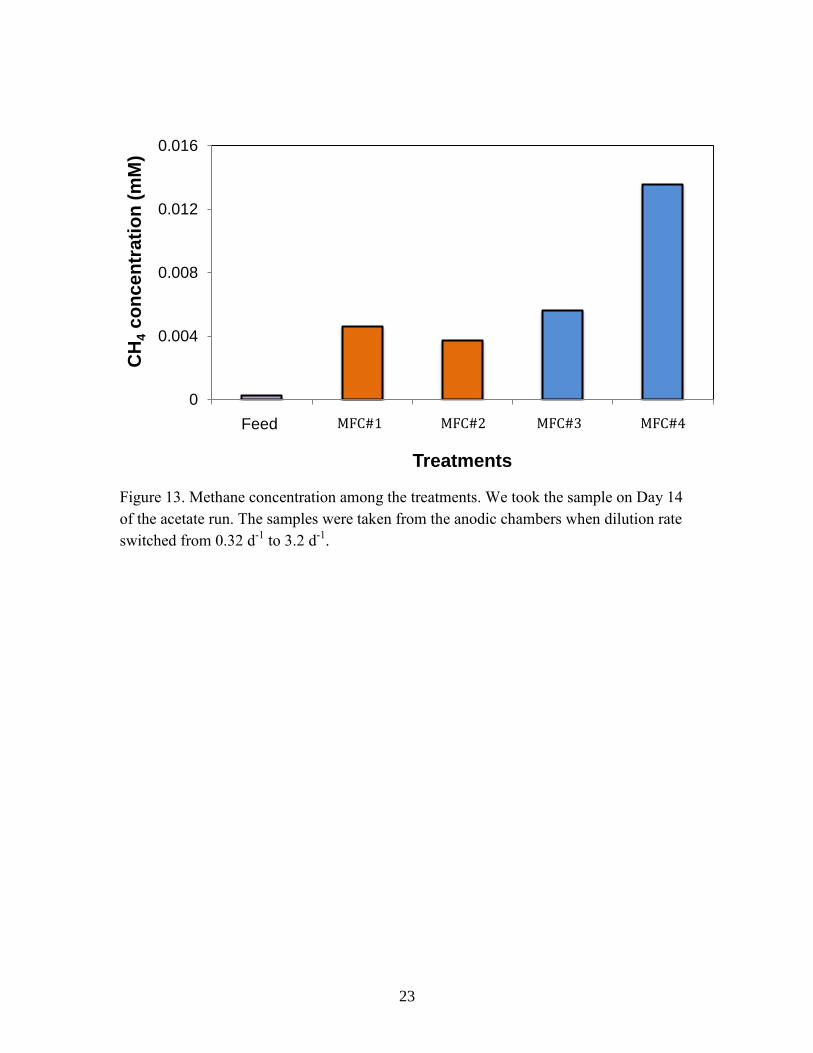
an increase in methane in all treatments in comparison to the feeding solution (Fig.13).
Discussion
Closed circuit vs. Open circuit MFCs
Bacteria gain energy by transferring electrons from reduced substrates with low electron
affinity, such as acetate, to an electron acceptor with a high affinity, such as oxygen.
When the cell circuit was open to preclude the use of anode as an electron acceptor, we
were able to determine the maximum potential from the open circuit MFCs. Closed
circuit MFCs had a lower voltage due to the presence of the loads. Given the use of
acetate, an inoculum derived from an anaerobic reactor, the most likely metabolisms
during fed-batch mode in open-circuit MFCs were methanogenesis (Kim et al. 2007). We
8
can confirm the presence of methanogenesis in the open-circuits MFCs (#’s 3 and 4) by
seeing more methane production in those MFCs compared to closed-circuits MFCs (#’s 1
and 2) (Fig. 13). As bacteria started to grow and form a biofilm on the electodes, the
voltage increased accordingly in all MFCs (Fig.3). Open circuit MFCs show maximum
attainable voltage, but when a load is placed on the MFC, the realized voltage depends on
the density and organization of the microbial biofilm for transferring electrons to or from
the electrodes. When we switched the organic matter from acetate solution to brewery
waste, both the attainable and realized voltages dropped significantly (Fig.4).
Power generation
The maximum power produced by the brewery wastewater was lower than that achieved
using acetate solution. We did not analyze the compounds contained in the brewery
wastewater. The positive voltage generated from brewery wastewater showed that
brewery wastewater can be effectively treated using MFCs, but that achievable power
densities will depend on wastewater composition and buffering capacity, which require
further investigation. Previous studies showed that power generated in various MFCs
systems range widely as a function of the inoculum, substrate, and reactor, from less than
1 mW/m2 with lactate and pure cultures of S. putrefacians to 3600 mW/m
2 with glucose
and an unidentified mixed culture (Kim et al. 2002; Rabaey et al. 2003). Most results
with carbon electrodes generally report power generation rates between 10 and 100
mW/m2 (Bond et al. 2002; Bond&Loveley 2003). In comparison to the literature, the
maximum power density (48.5 mW/m2) generated from acetate solution by aerated MFCs
in this project was in a lower range. The higher flow increased power from the coupled
denitrification MFCs, but did not have much of an impact on the aerobic MFC. This may
suggest that the bacteria behaved more active due to a faster supply of organic matter or
nitrate in the coupled denitrification MFCs. It might also suggest that bacteria had a faster
response to the change of nutrient supply under aerobic conditions.
Denitrification
There was no direct evidence showing that the closed circuit MFC facilitated
denitrification since there is no obvious difference between open circuit and closed circuit
MFCs nitrate and ammonium concentrations (Figs. 7 and 8). Under fed-batch mode, we
observed a drop in nitrate concentration across all treatments. However, only around 10%
of reduced NO3- was converted to NH4
+, suggesting that there might be other
intermediate nitrogen molecules produced from nitrate reduction, such as N2. We suspect
that bacteria might have reacted with labile carbon from the carbon mesh or PVC to
conduct single cell denitrification, instead of using the electrons from anodic chambers.
Degradation of organic matter
9
DOC measurement did not directly suggest any significant utilization of acetate in the
closed versus open circuit MFCs. In previous studies, substrate removal was nearly
complete (>99% removal for acetate) with acetate feed concentration of 1-10 mM (Liu et
al. 2005). In that study, the maximum current was reported to reach 1.10 mfor the
acetate-fed anode. By calculating an acetate feed of 0.145 mmol /d, we would get a
21.2% theoretical acetate removal based on the electron transfer, which is lower than the
reported value (>99%). In comparison, we added 20 mM acetate solution, which was
higher than previous studies. As a consequence, the removal may be even relatively
smaller compared to the original concentration.
Calculation for acetate degradation and denitrification
Theoretically, we can estimate the surface area needed to deplete the acetate by using the
standard-state free energy of reaction for acetate oxidation to CO2 and water (ΔGo) and
total acetate content calculated from flow rates and concentration. By multiplying these
values together, we get a total power generation of 0.11W from the added acetate. In
order to oxidize the total acetate content, we would need 2.27 m2 of the aerobic cathode
with a 400Ω load and 3056 m2 of the nitrate-based cathode with a 900Ω load at D=3.2
d-1
. Oxygen as catholytes, therefore, is more economically efficient for real life
application.
The denitrification process can be assessed by calculations in addition to our
observations. The current production gave us an accurate measurement of the amount of
electrons that pass through the external circuit. To evaluate the ideal denitrification
process, we can estimate transferred electrons by converting the current to the coulomb
unit. By calculating the theoretical electron transfer from the measured current (0.04 mA)
at a dilution rate of 12.8 d-1
during the acetate wastewater treatment, we can conclude that
the current can only provide 17.91 mol e-/d, accounted for 0.02% nitrate reduction,
which is below our level of precision form measuring nitrate. In a similar manner, if we
use the current (0.86 mA) generated using aerobic MFCs with acetate wastewater at a
dilution rate of 12.8 d-1
to calculate electron transfer, the current would consume
5.18×10⁻¹¹
mol e-/s of acetate. The rate of acetate addition is calculated to be 43.5
mmol/d. So we would expect the bacteria to be accounted for 0.218% consumption of the
input. Since we added 10mM, we would get 9.98 mM acetate in the effluent, which is
below our instruments level of precision to detect. If we calculate theoretical acetate
consumption using aerobic MFCs, the bacteria would only be accounted for 0.01%
consumption of the total acetate input, which is also below instruments level of precision
to detect.
Conclusions

10
We successfully generated power using both aerobic and nitrate-based MFCs. As we
varied the flow rate of the feed and resistance values, we found that the maximum power
generation from nitrate-based MFCs was 0.46μW/m2 and 1.3mW/m
2 using beer’s waste
and acetate respectively. The maximum power generation from aerobic MFCs was more
than 2800 times power than nitrate-based MFCs—16.4μW/m2 and 48.5mW/m
2 using
beer’s waste and acetate, respectively. We did not observe a reasonable decline of DOC
in anodic chambers or denitrification in cathodic chambers, potentially due to the
detection limit of the instruments. Future experiments can be conducted using a lower
concentration of acetate and nitrate in the feed to verify the results from this project. We
can also apply the MFCs to other types of organic waste for real-life application.
Acknowledgements
We would like to thank Rich McHorney, Aliza Ray, Brecia Douglas and Hannah Kuhns
for their assistance in the lab. We would also like to thank Dr. Ken Foreman and the other
scientists of the Ecosystem Center at the Marine Biological Laboratory for their advice to
the project and dedication to the Semester in Environmental Science program.
11
Literature cited
Bond, D. R., Holmes, D. E., Tender, L. M., & Lovley, D. R. 2002. Electrode-reducing
microorganisms that harvest energy from marine sediments.Science, 295(5554), 483-485.
Bond, D. R., & Lovley, D. R. 2003. Electricity production by Geobacter sulfurreducens
attached to electrodes. Applied and environmental microbiology, 69(3), 1548-1555.
Clauwaert, P., Desloover, J., Shea, C., Nerenberg, R., Boon, N., & Verstraete, W. 2009.
Enhanced nitrogen removal in bio-electrochemical systems by pH control. Biotechnology
letters, 31(10), 1537-1543.
Clauwaert, P., Rabaey, K., Aelterman, P., De Schamphelaire, L., Pham, T. H., Boeckx,
P., ... & Verstraete, W. 2007. Biological denitrification in microbial fuel
cells. Environmental Science & Technology, 41(9), 3354-3360.
Feng, Y., Wang, X., Logan, B. E., & Lee, H. 2008. Brewery wastewater treatment using
air-cathode microbial fuel cells. Applied microbiology and biotechnology, 78(5),
873-880.
Foreman, K. 2010. Lachat flow injection analyzer (FIA) for measuring nitrate. Semester
in Environmental Science Methods Handbook. Marine Biological Laboratory
Kim, J. R., Jung, S. H., Regan, J. M., & Logan, B. E. 2007. Electricity generation and
microbial community analysis of alcohol powered microbial fuel cells. Bioresource
technology, 98(13), 2568-2577.
Kim, H. J., Park, H. S., Hyun, M. S., Chang, I. S., Kim, M., & Kim, B. H. 2002. A
mediator-less microbial fuel cell using a metal reducing bacterium, Shewanella
putrefaciens. Enzyme and Microbial Technology, 30(2), 145-152.
Liu, H., Cheng, S., & Logan, B. E. 2005. Production of electricity from acetate or
butyrate using a single-chamber microbial fuel cell. Environmental science &
technology, 39(2), 658-662.
Logan, B. E., Hamelers, B., Rozendal, R., Schröder, U., Keller, J., Freguia, S., ... &
Rabaey, K. 2006. Microbial fuel cells: methodology and technology. Environmental
science & technology, 40(17), 5181-5192.
12
Marland, G., Boden, T. A., Andres, R. J., Brenkert, A. L., & Johnston, C. A. 2003.
Global, regional, and national fossil fuel CO2 emissions. Trends: A compendium of data
on global change, 34-43.
Osburn, C. L., & St‐Jean, G. 2007. The use of wet chemical oxidation with high‐
amplification isotope ratio mass spectrometry (WCO‐IRMS) to measure stable isotope
values of dissolved organic carbon in seawater. Limnology and Oceanography:
Methods, 5(10), 296-308.
Rabaey, K., Lissens, G., Siciliano, S. D., & Verstraete, W. 2003. A microbial fuel cell
capable of converting glucose to electricity at high rate and efficiency. Biotechnology
letters, 25(18), 1531-1535.
Rabaey, K., Ossieur, W., Verhaege, M., & Verstraete, W. 2005. Continuous microbial
fuel cells convert carbohydrates to electricity. Water Science & Technology, 52(1),
515-523.
Solorzano, L. 1969. Determination of Ammonia in Natural Waters by the
Phenolhypochlorite Method. Limnology and oceanography, 14(5), 799-801.
Strickland, J. D. H., & Parsons, T. R. 1972. A practical handbook of Seawater Analysis.
Ottawa. Fisheries Research Board of Canada, 2nd
. Ed.
Thygesen, A., Marzorati, M., Boon, N., Thomsen, A. B., & Verstraete, W. 2011.
Upgrading of straw hydrolysate for production of hydrogen and phenols in a microbial
electrolysis cell (MEC). Applied microbiology and biotechnology, 89(3), 855-865.
Virdis, B., Rabaey, K., Rozendal, R. A., Yuan, Z., & Keller, J. 2010. Simultaneous
nitrification, denitrification and carbon removal in microbial fuel cells. Water
research, 44(9), 2970-2980.
13
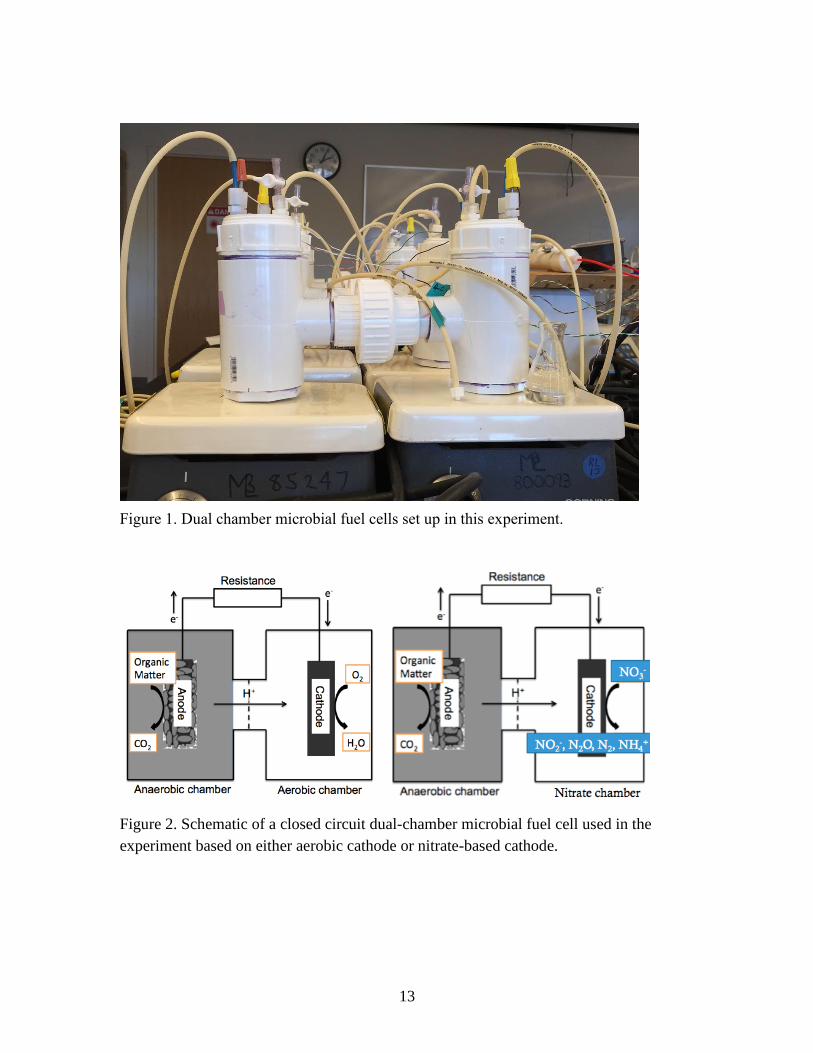
Figure 1. Dual chamber microbial fuel cells set up in this experiment.
Figure 2. Schematic of a closed circuit dual-chamber microbial fuel cell used in the
experiment based on either aerobic cathode or nitrate-based cathode.
14
Figure 3. Voltage profile of four MFCs during acetate treatment. On Day 3, the resistance
of MFC#2 was switched from 100Ω to 50Ω and switched back to 100Ω on Day 14.
MFC#2 and MFC#4 were switched to aerobic cathode on Day 15. The pump was
changed to D=0.32 d-1
on Day 8, to D=3.2 d-1
on Day 15 and D=12.8 d-1
on Day 21.
15
Figure 4. Voltage profile of four MFCs during brewery wastewater treatment. We
changed the dilution rate to 3.4 d-1
on Day 5 and to 12.8 d-1
on Day 6.
16
Figure 5. Effect of dilution rate on power density for two closed circuit MFCs during the
acetate treatment. The maximum resistance was achieved at 800Ω for MFC#1 (nitrate
cathode) and at 400Ω for MFC#2 (oxygen cathode). Note, second Y-axis for MFC#1 if
for D = 3.2 d-1
0
0.01
0.02
0.03
0.04
0
0.2
0.4
0.6
0.8
1
1.2
1.4
0 200 400 600 800 1000
Po
we
r D
en
sity
(m
W/
m2 )
D=12.8 d-1
D=3.2 d-1
MFC#1
0
10
20
30
40
50
60
0 200 400 600 800 1000
Po
we
r D
en
sity
(m
W/
m2 )
Resistance (Ω)
D=3.2 d-1
D=12.8 d-1
MFC#2
17
Figure 6. Effect of dilution rate on power density for two closed circuit MFCs during
brewery wastewater treatment. The maximum resistance was achieved at 1000Ω for
MFC#1 (nitrate cathode) and at 900Ω for MFC#2 (oxygen cathode).
0
0.05
0.1
0.15
0.2
0.25
0.3
0.35
0.4
0.45
0.5
0 500 1000
Po
we
r d
en
sit
y (
µW
/m2 )
D=1.1 d-1
D=3.2 d-1
MFC#1
0
2
4
6
8
10
12
14
16
18
0 500 1000
Po
we
r d
en
sit
y (
µW
/m2 )
Resistance (Ω)
D=1.1 d-1
D=3.2 d-1
MFC#2
18
Figure 7. Nitrate concentration in the cathodic solutions across all treatments. All four
MFCs were run in a chemostat mode with acetate media. The dashed line indicates the
concentration of feed nitrate. MFC#2 and MFC#4 were switched to aerobic cathode on
Day 15.
*D=0.1d-1 D=0.32d-1
D=3.2d-1
D=12.8d-1
0
2
4
6
8
10
12
14
0
4
8
12
16
20
0 5 10 15 20
Dilu
tio
n r
ate
(d
-1)
Nit
rate
co
nce
ntr
aio
nt
(mM
)
Time Elapsed (days)
Closed circuit#1
Closed circuit#2
Open circuit#1
Open circuit#2
Initial nitrate
MFC#1
MFC#2
MFC#3
MFC#4
*D=0.1d-1 D=0.32d-1
D=3.2d-1
D=12.8d-1
0
2
4
6
8
10
12
14
0
100
200
300
400
500
600
700
800
0 5 10 15 20
Dilu
tio
n r
ate
(d
-1)
Am
mo
niu
m C
on
ce
ntr
ati
on
(µ
M)
Time Elapsed (Days)
Closed circuit#1
Closed circuit#2
Open circuit#1
Open circuit#2
MFC#1
MFC#2
MFC#3
MFC#4
19
Figure 8. Ammonium concentration in the cathodic solutions across all treatments. All
four MFCs were run with acetate medium.
Figure 9. Particulate Organic Nitrogen concentration in each MFC. All treatments were
run with the acetate media.
0
0.01
0.02
0.03
0.04
0.05
0.06
0.07
0.08
0 2 4 6 8 10 12 14
PO
N c
on
ce
ntr
ati
on
(m
M)
Time Elapsed (Days)
Closed circuit#1
Closed circuit#2
Open circuit#1
Open circuit#2
MFC#1
MFC#2
MFC#3
MFC#4
20
Figure 10. Dissolved organic carbon concentration in each MFC. All treatments were run
with the acetate medium. Concentration of acetate in feed is shown by dashed line.
0
5
10
15
20
25
30
0 5 10 15 20
DO
C c
on
ce
ntr
ati
on
(m
M)
Time Elapsed (Days)
Closed circuit#1
Closed circuit#2
Open circuit#1
Open circuit#2
Added acetate
MFC#1
MFC#2
MFC#3
MFC#4
21
Figure 11. Particulate organic carbon concentration in each MFC. All treatments were run
with the acetate wastewater.
0
1
2
3
4
5
6
7
8
9
10
0 2 4 6 8 10 12 14
PO
C c
on
ce
ntr
ati
on
(m
M)
Time Elapsed (Days)
Closed circuit#1
Closed circuit#2
Open circuit#1
Open circuit#2
MFC#1
MFC#2
MFC#3
MFC#4
22
Figure 12. Dissolved inorganic carbon measured in each treatment on Day 15. All MFCs
were set up based on anaerobic cathodes. The samples were taken from the anodic
chambers when dilution rate switched from 0.32 d-1
to 3.2 d-1
.
0
0.4
0.8
1.2
1.6
Carboy ClosedCircuit#1
ClosedCircuit#2
OpenCircuit#1
OpenCircuit#2
DIC
co
nc
en
tra
tio
n (
mM
)
Treatments
Feed MFC#1 MFC#2 MFC#3 MFC#4
23
Figure 13. Methane concentration among the treatments. We took the sample on Day 14
of the acetate run. The samples were taken from the anodic chambers when dilution rate
switched from 0.32 d-1
to 3.2 d-1
.
0
0.004
0.008
0.012
0.016
Carboy ClosedCircuit#1
ClosedCircuit#2
OpenCircuit#1
OpenCircuit#2
CH
4 c
on
ce
ntr
ati
on
(m
M)
Treatments
Feed MFC#1 MFC#2 MFC#3 MFC#4