Transwester 3Q 2010
9
Q3:10 Transwestern Outlook northern virginia 3rd quarter 2010 Positive O fce Absorption and Vacancy’s Cyclical Decline Continu e; E ective Rent Decline Easing Te Northern Virginia ofce market is stabilizing, by several metrics, setting the stage or recovery by 2012 market-wide – sooner in select submarkets: • Net absorp tio n has been po sit ive during the last two quarters – driv en by job growth and government leasing. • Over all v acan cy h as e dge d down fro m o ne year ag o. • e rat e o f e ectiv e r ent dec line is eas ing . • Lessthan 900,000SF of space isunder constructionan d7 6% ofi tis preleased. How ever, the vacancy rate remains elevat ed, putting down ward pressure on ren ts. Eect ive ren ts declined 4.8% durin g the past nine mo nths, as landlor dscontinue tou segenero usconcessio npackagestoattracttenant s. Yetrentdeclinesappeartobeeasingcomparedto2009.Vacancyisexpected todecline overthe nexttwo years,asp re-leasedprojectsdeliver tothe market andGSAleaseslargeblocksofspace. Tird Quarter 2010 Market Highlights: • Net absorption: 318, 000 SFi nth e3rd qua rter ,423,000SF YTD , compared t o 360, 00 0 SF in all of 2009. • Overall vacancy rate: 13.4%,down from13.8%a tmid-yearand 13.5% one year ago. • Direct vacancy rate: 12.2%,upfrom11.9%oneyearago. • Sublease space: Decreasedby338,000S F .Subleasespacerepr esentsjust 1.2% of t he in ve ntory . • Pipeline (U/C and U/R): 804,000SF,downfrom1.6millionSFone year ago. • Pipeline pre-lease rate:76%,upfrom27%ayearago. • Rents: Down4.8%thr ough3rdqua rter2010,compa redtodeclining 6.7% in a ll o f 200 9. • Investment sales: $612million ($239/SF) through3rdq uarter2010, compare dto $296 mill ion inthecom para ble period last year .
-
Upload
david-captain -
Category
Documents
-
view
221 -
download
0
Transcript of Transwester 3Q 2010
8/7/2019 Transwester 3Q 2010
http://slidepdf.com/reader/full/transwester-3q-2010 1/9
Q3:10
Transwestern Outlook
northern virginia
3rd quarter 2010
Positive Ofce Absorption and Vacancy’s Cyclical
Decline Continue; Eective Rent Decline Easing
Te Northern Virginia ofce market is stabilizing, by several metrics, setting
the stage or recovery by 2012 market-wide – sooner in select submarkets:
• Netabsorptionhasbeenpositiveduringthelasttwoquarters–driven
by job growth and government leasing.
• Overallvacancyhasedgeddownfromoneyearago.
• erateofeectiverentdeclineiseasing.
• Lessthan900,000SFofspaceisunderconstructionand76%ofitis
preleased.
However, the vacancy rate remainselevated, puttingdownwardpressur
on rents. Eective rents declined 4.8% during thepast nine months, a
landlordscontinuetousegenerousconcessionpackagestoattracttenants
Yetrentdeclinesappeartobeeasingcomparedto2009.Vacancyisexpecte
todeclineoverthenexttwoyears,aspre-leasedprojectsdelivertothemarke
andGSAleaseslargeblocksofspace.
Tird Quarter 2010 Market Highlights:
• Net absorption: 318,000SFinthe3rdquarter,423,000SFYTD,
comparedto360,000SFinallof2009.
• Overall vacancy rate: 13.4%,downfrom13.8%atmid-yearand13.5%
one year ago.
• Direct vacancy rate: 12.2%,upfrom11.9%oneyearago.
• Sublease space: Decreasedby338,000SF.Subleasespacerepresentsjust
1.2%oftheinventory.
• Pipeline (U/C and U/R): 804,000SF,downfrom1.6millionSFone
year ago.
• Pipeline pre-lease rate:76%,upfrom27%ayearago.
• Rents:Down4.8%through3rdquarter2010,comparedtodeclining
6.7%inallof2009.
• Investment sales:$612million($239/SF)through3rdquarter2010,
comparedto$296millioninthecomparableperiodlastyear.
8/7/2019 Transwester 3Q 2010
http://slidepdf.com/reader/full/transwester-3q-2010 2/9
8/7/2019 Transwester 3Q 2010
http://slidepdf.com/reader/full/transwester-3q-2010 3/9
Transwestern Outlook
northern virginia
q3:2010
3rd quarter 2010
providingtherequiredsecuritysetbacks.eagencywillbebackllingspace tobe vacated byRaytheon,as thiscompany relocates toitsnew
headquartersontheformerAOLcampus.
eDepartmentofDefenseJointMedicalCommandlease,coupledwith
Northrop Grumman’s purchase of 334,000 SF for occupancy at 2980
FairviewParkDrivebroughtthedirectvacancyrateinMerrieldfrom
13.3%atmid-year 2010 to8.5% atSeptember 2010.Notably,Northrop
GrummanwillberelocatingitsheadquartersfromLosAngelestoFairfax
County.
Government leas ing activity increased to 31% o all lease deals inkedin Northern Virginia during 2009,comparedto21%during2008,and
7%in2007.Comparably,leasingfromprofessionalbusinessesincreasedto
49%in2009,from42%in2008,butisdownfrom63%in2007.
We expect the share o government lea sing to remain high in 2010 and
into 2011, as non-government tenants remain less certain about budgets
untiltheeconomyrms.However,privatecompanieswiththebudgetand
need shouldcontinuetotakelargeblocksofClassAspaceinaquality
locationothemarketasdiscountsonrentareoered.
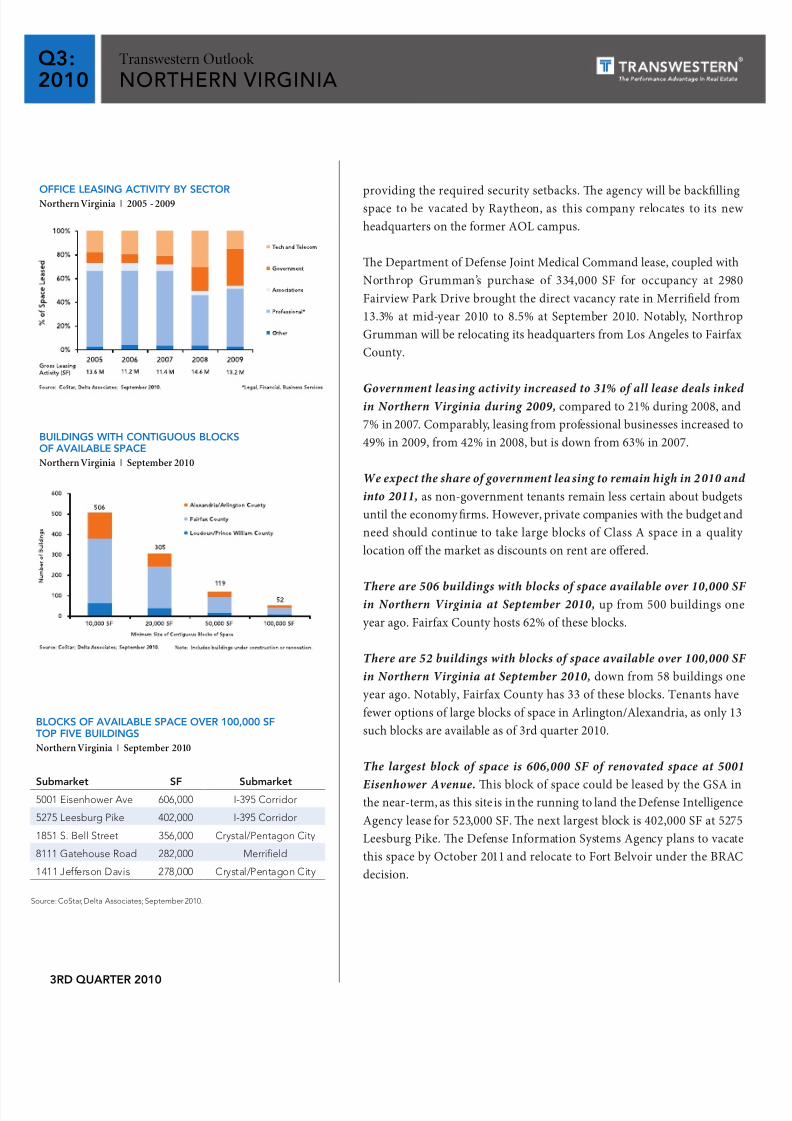
here are 506 buildings with blocks o space available over 10,000 SFin Northern Virginia at September 2010,upfrom500buildingson
yearago.FairfaxCountyhosts62%oftheseblocks.
here are 52 buildings with blocks o space available over 100,000 SF
in Northern Virginia at September 2010,downfrom58buildingson
yearago.Notably,FairfaxCountyhas33oftheseblocks.Tenantshave
feweroptionsoflargeblocksofspaceinArlington/Alexandria,asonly13
suchblocksareavailableasof3rdquarter2010.
he largest block o space is 606,000 SF o renovated space at 5001
Eisenhower Avenue.isblockofspacecouldbeleasedbytheGSAinthenear-term,asthissiteisintherunningtolandtheDefenseIntelligenc
Agencyleasefor523,000SF.enextlargestblockis402,000SFat5275
LeesburgPike.eDefenseInformationSystemsAgencyplanstovacate
thisspacebyOctober2011andrelocatetoFortBelvoirundertheBRAC
decision.
buiLdiNGs with coNtiGuous bLocksoF avaiLabLe space
Northern Virginia | September 2010
oFFice LeasiNG activity by sector
Northern Virginia | 2005 - 2009
bLocks oF avaiLabLe space over 100,000 sFtop Five buiLdiNGs
Northern Virginia | September 2010
sm sF sm5001 Eisenhower Ave 606,000 I-395 Corridor
5275 Leesburg Pike 402,000 I-395 Corridor
1851 S. Bell Street 356,000 Crystal/Pentagon City
8111 Gatehouse Road 282,000 Merrifeld
1411 Jeerson Davis 278,000 Crystal/Pentagon City
Source: CoStar, Delta Associates; September 2010.
8/7/2019 Transwester 3Q 2010
http://slidepdf.com/reader/full/transwester-3q-2010 4/9
Transwestern Outlook
northern virginia
q3:2010
3rd quarter 2010
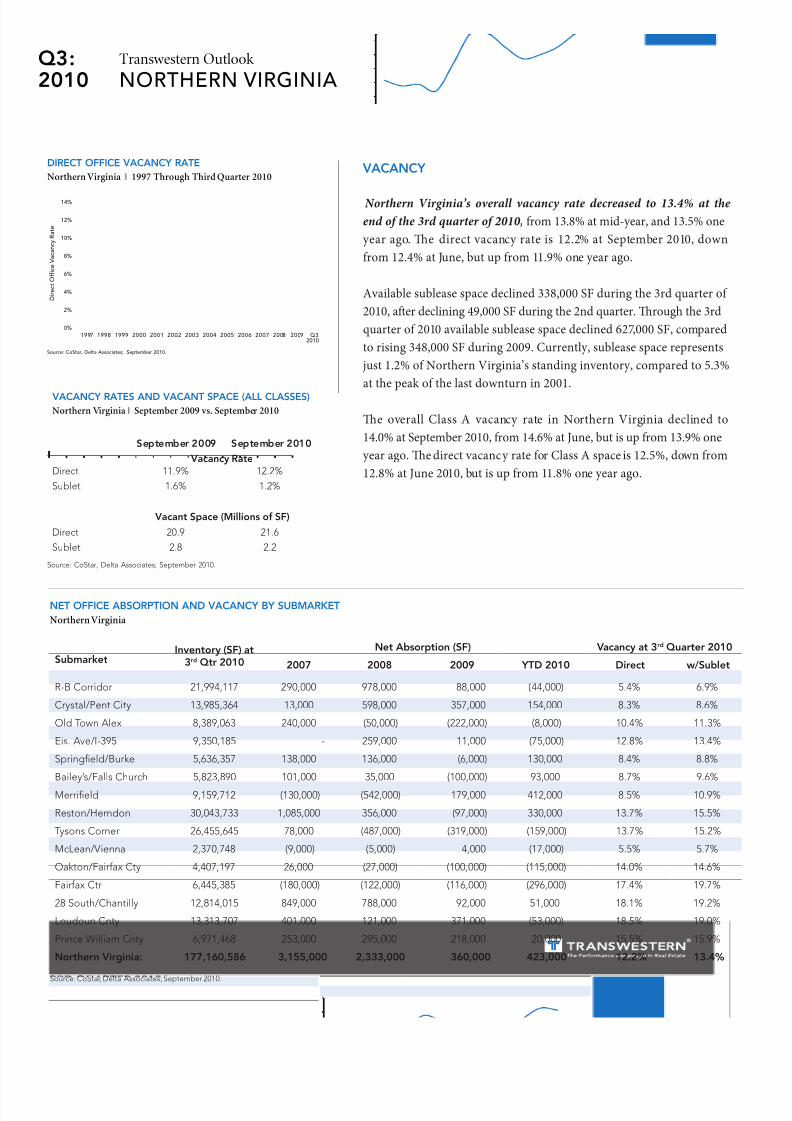
Net oFFice absorptioN aNd vacaNcy by subMarket
Northern Virginia
sminn (sF)
3 q 2010
N an (sF) vn 3 q 2010
2007 2008 2009 ytd 2010 d /sl
R-B Corridor 21,994,117 290,000 978,000 88,000 (44,000) 5.4% 6.9%
Crystal/Pent City 13,985,364 13,000 598,000 357,000 154,000 8.3% 8.6%
Old Town Alex 8,389,063 240,000 (50,000) (222,000) (8,000) 10.4% 11.3%
Eis. Ave/I-395 9,350,185 - 259,000 11,000 (75,000) 12.8% 13.4%
Springfeld/Burke 5,636,357 138,000 136,000 (6,000) 130,000 8.4% 8.8%
Bailey’s/Falls Church 5,823,890 101,000 35,000 (100,000) 93,000 8.7% 9.6%
Merrifeld 9,159,712 (130,000) (542,000) 179,000 412,000 8.5% 10.9%
Reston/Herndon 30,043,733 1,085,000 356,000 (97,000) 330,000 13.7% 15.5%
Tysons Corner 26,455,645 78,000 (487,000) (319,000) (159,000) 13.7% 15.2%
McLean/Vienna 2,370,748 (9,000) (5,000) 4,000 (17,000) 5.5% 5.7%
Oakton/Fairax Cty 4,407,197 26,000 (27,000) (100,000) (115,000) 14.0% 14.6%
Fairax Ctr 6,445,385 (180,000) (122,000) (116,000) (296,000) 17.4% 19.7%
28 South/Chantilly 12,814,015 849,000 788,000 92,000 51,000 18.1% 19.2%
Loudoun Cnty 13,313,707 401,000 121,000 371,000 (53,000) 18.5% 19.0%
Prince William Cnty 6,971,468 253,000 295,000 218,000 20,000 15.5% 15.9%
Nn vgn: 177,160,586 3,155,000 2,333,000 360,000 423,000 12.2% 13.4%
Source: CoStar, Delta Associates; September 2010.
vacaNcy
Northern Virginia’s overall vacancy rate decreased to 13.4% at the
end o the 3rd quarter o 2010, from13.8%atmid-year,and13.5%one
year ago.e direct vacancyrateis 12.2%atSeptember2010,down
from12.4%atJune,butupfrom11.9%oneyearago.
Availablesubleasespacedeclined338,000SFduringthe3rdquarterof
2010,aerdeclining49,000SFduringthe2ndquarter.roughthe3rd
quarterof2010availablesubleasespacedeclined627,000SF,compared
torising348,000SFduring2009.Currently,subleasespacerepresents
just1.2%ofNorthernVirginia’sstandinginventory,comparedto5.3%
atthepeakofthelastdownturnin2001.
e overallClass A vacancy rate inNorthern Virginia declined to
14.0%atSeptember2010,from14.6%atJune,butisupfrom13.9%one
yearago.edirectvacancyrateforClassAspaceis12.5%,downfrom
12.8%atJune2010,butisupfrom11.8%oneyearago.
vacaNcy rates aNd vacaNt space (aLL cLasses)
Northern Virginia | September 2009 vs. September 2010
sm 2009 sm 2010
vn rDirect 11.9% 12.2%
Sublet 1.6% 1.2%
vn s (Mlln f sF)
Direct 20.9 21.6
Sublet 2.8 2.2
Source: CoStar, Delta Associates; September 2010.
direct oFFice vacaNcy rate
Northern Virginia | 1997 Through Third Quarter 2010
0%
2%
4%
6%
8%
10%
12%
14%
1997 1998 1999 2000 2001 2002 2003 2004 2005 2006 2007 2008 2009 Q32010
D i r e c t O f f i c e V a c a n c y R a t e
Source: CoStar, Delta Associates; September 2010.

8/7/2019 Transwester 3Q 2010
http://slidepdf.com/reader/full/transwester-3q-2010 5/9
q3:2010
Transwestern Outlook
northern virginia
3rd quarter 2010
Tere were no groundbreakings during the 3rd quarter o 2010, ae
two projects started during the 2nd quarter. Developersstartedo
448,000SFintwoprojectsduringthepastninemonths.During2009
groundbreakingstotaled447,000SFonthreeprojects–wellbelowth
10-yearannualaverageof4.8millionSF.
We expect uture groundbreakings in the Springeld submarket give
the close proximity to Fort Belvoir, whereover19,000governmen
workerswilltransferbySeptember2011undertheBRACdecision
Of note, Corporate OceProperties Trust (COPT) plans to sta
constructiononocespaceinthenear-terminSpringeldtomee
thedemand generatedby BRAC. During the4th quarterof 2010COPT plansto break groundon240,000 SFon the15-acre plot
PatriotRidge.
esecurityrequirements enforced underBRAC have encourage
somedeveloperstochangeplans.Forinstance,PetersonCompani
originally planneda 76-acre site along Rt. 28 South/Chantilly fo
residential, but with the change in housing market conditions an
increaseddemandforsecureocespace,thecompanyisnowplanning
todevelop1.2millionSFofsecuredocespaceonthisparcel.
Weexpectlimitedspecgroundbreakingsduringthebalanceof201
and into 2011, as direct vacancy remains elevated in many submarket
However,weexpectsomegroundbreakingstooccurlatein2010an
2011forthosedevelopersarmedwithcashinselectwell-positione
submarkets–suchasSpringeldandtheRCBCorridor.
Tere was one notable oce delivery during the 3rd quarter o 2010
comparedtoonedeliveryduringthe2ndquarter.A32,000SFprojec
at4500PondWayinPrinceWilliamCountydeliveredduringthe3r
quarterwith notenantsin place.Duringthe2nd quarter, a17,00
SFprojectat112W.WashingtonStreetinLoudounCountydelivere
10%pre-leased.During2009,ocedeliveriestotaled3.4millionS
andcameonlineat23%pre-leased.
Te outer suburbs o Loudoun and Prince William Counties hold the
highest direct vacancy rates in Northern Virginia,at18.5%and15.5%,
respectively.OnlyArlingtonandAlexandriaholdvacancyratesbelow
theNorthernVirginiaaverageof12.2%.
coNstructioN
Tere is 804,000 SF o oce space under construction or renovation in
Northern Virginia at September 2010, downfrom1.6millionSFone
year ago.
76% o the space under construction is pre-leased at September 2010, comparedto27%oneyearago.ecurrentpre-leaserateisabovethe
10-yearaveragepre-leaserateof55%.Pre-leaserateshaveincreased,as
construction starts onspecprojectshaveceased,which shouldallow
demandtograduallycatchuptosupply.
Te RCB Corridor has the greatest amount o space under construction
at mid-year 2010. Tis submarket has 709,000 SF in the pipeline at a
73% pre-lease rate.
oFFice coNstructioN starts
Northern Virginia | 1998 Through Third Quarter 2010
oFFice space u/c or u/r
Northern Virginia | September 2010
sm sF % p-L
Rosslyn, Courthouse, Ballston 709,000 73%
Springfeld/Huntington/I-95 95,000 100%
tl: 804,000 76%
Source: CoStar, Delta Associates; September 2010.
direct oFFice vacaNcy rate
Northern Virginia | September 2010
0
2,000
4,000
6,000
8,000
10,000
12,000
1998 1999 2000 2001 2002 2003 2004 2005 2006 2007 2008 2009 2010*
S q u a
r e
F e e t
i n
0 0 0 ' s
Source: CoStar, Delta Associates; September 2010.
10-Year Annual Average = 4.8 Million SF
*Through 3rd quarter 2010.
8/7/2019 Transwester 3Q 2010
http://slidepdf.com/reader/full/transwester-3q-2010 6/9

8/7/2019 Transwester 3Q 2010
http://slidepdf.com/reader/full/transwester-3q-2010 7/9
q3:2010
Transwestern Outlook
northern virginia
3rd quarter 2010
LaNd saLes
Tere were no notable oce land sales during the 3rd quarter
o 2010, comparedtoonenotabledealduringthe2ndquarter.
Skanskapurchased 1.0acre at 1716WilsonBoulevard inthe
RCB Corridor for $10.0 million during the 2nd quarter. A
127,000SF spec oce project isplanned for thissite– with
groundbreakingscheduledforyear-end2010.During2009,one
dealclosedwhenCatonHillPropertiespurchased7.6acresat
2730KillarneyDriveinPrinceWilliamCountyfor$3.0million
duringthe4thquarter.
We anticipate land sales will be limited during the remainder
o 2010, givenmodestdemandandlimiteddevelopmentcredit
availability,making it dicult for developers to achieve the
necessary returns in order to make new deals work. Until
buildingsalespricesequalorexceedreplacementcost,wedo
not look or a lot o land sales action.
NortherN virGiNia oFFice Market outLook
Te Northern Virginia oce market will experience stableconditions during the 4th quarter o 2010. Conditionsshould
starttoslowlyimproveduring2011as20,400newjobsare
added to this substate.
Leasing. Non-government tenants are starting to grab large
blocksofspacewherediscountsareoffered.Theamountof
tenantsseekingspacewillincreaseoverthenext12monthsas
theeconomyimprovesandmoreblocksofspaceareremoved
from the market. GSA has also been active in removing
blocksofspacefromthemarketandshouldcontinuetodo
sowith anticipated lease announcements expected duringthe4thquarter.
Vacancy.Weexpectvacancytodeclineoverthenexttwoyearto 11.6% bySeptember 2012, asNorthern Virginia’s pipelin
has been signicantly reduced and demand is picking u
pace.Althoughweexpectvacancytodeclineoverthenext2
months,vacancywillremainelevatedatSeptember2012when
comparedtothecyclicallowof8.9%during2005.Giventh
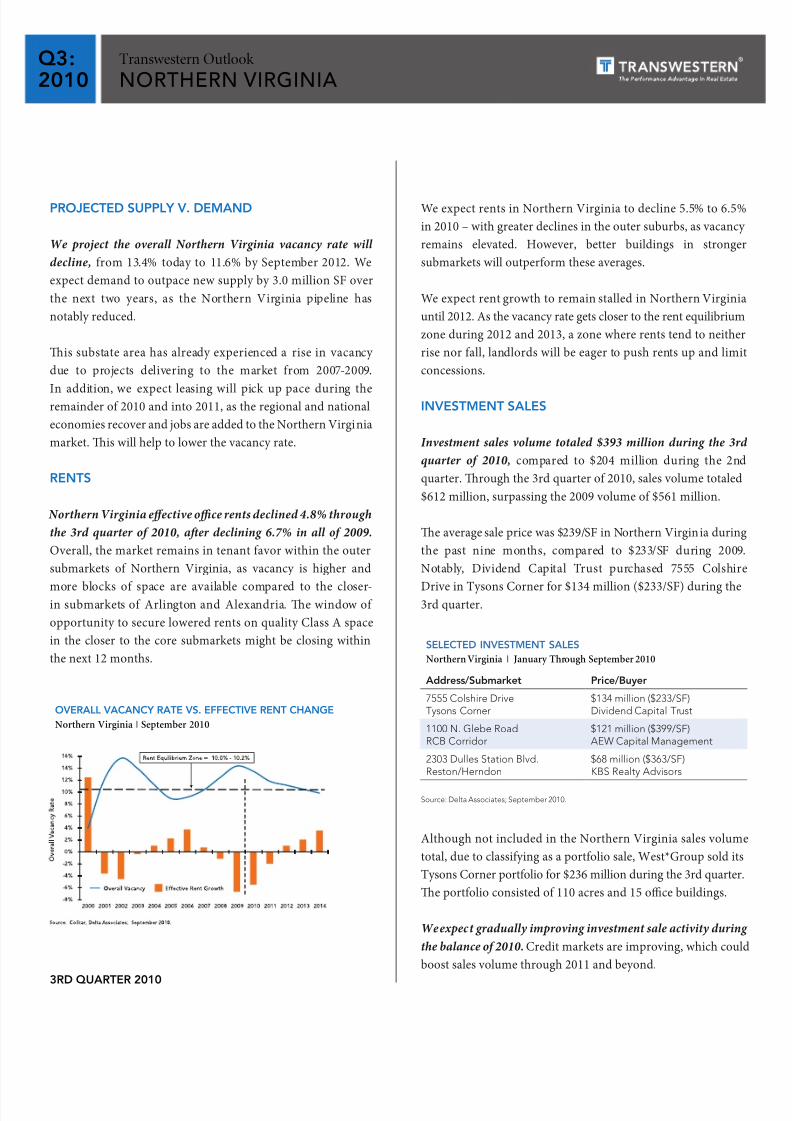
elevatedvacancy,rentsshoulddecline5.5%to6.5%in2010,wit
concessionoeringsremaininggenerous.However,weexpe
selectsubmarketswith superiorsupply/demandfundamenta
tostartclosingthedoortothesedealsoverthenext12month
Rents.Weexpectrentstocontinueunderpressurethrough201market-wide.By2012rentsshouldbegintheircyclicalincreas
– sooner in select submarkets.
Te Northern Virginia oce market remains a strong player i
the intermediate and long-run due to a low pipeline combine
with a concentration o deense agencies and contractor
Northern Virginia also should continue to attract som
District tenants with its competitive buildings at lower rent
especially at Metro-served locations.
8/7/2019 Transwester 3Q 2010
http://slidepdf.com/reader/full/transwester-3q-2010 8/9
Transwestern Outlook
northern virginia
q3:2010
3rd quarter 2010
Flex/Industrial Vacancy Rates Edge Down;Rents Remain Under Pressure
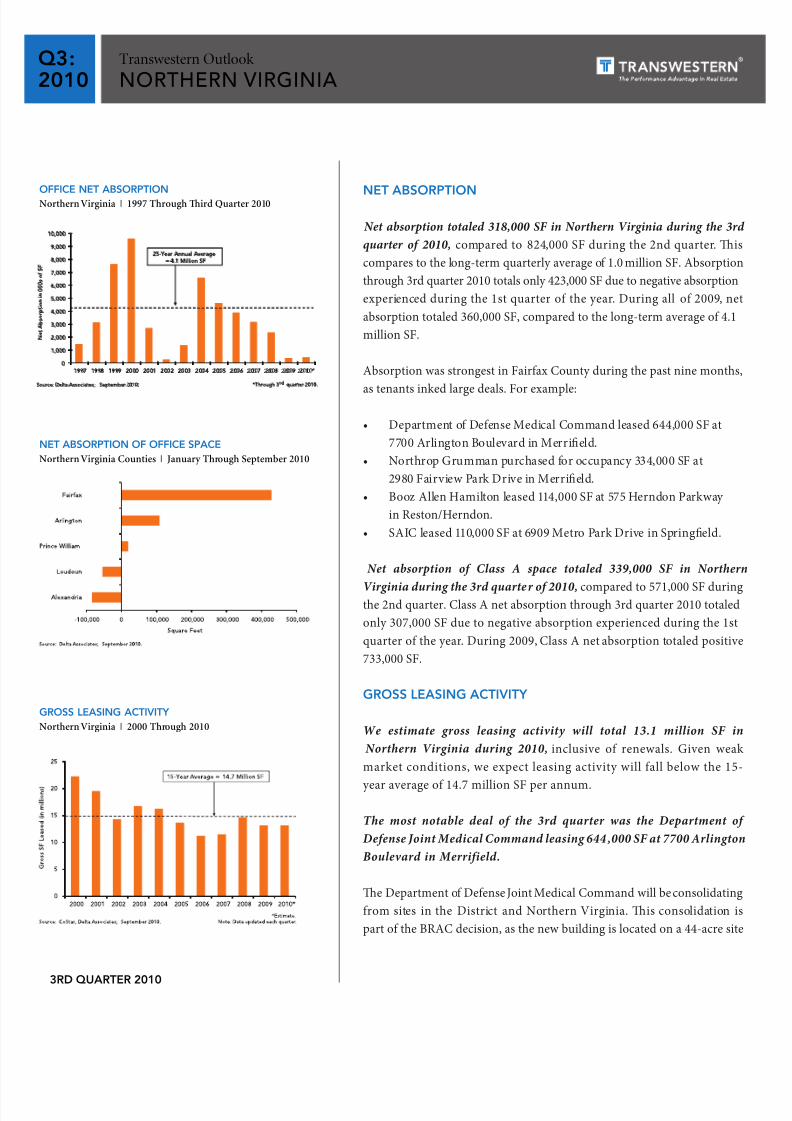
Net absorptioN
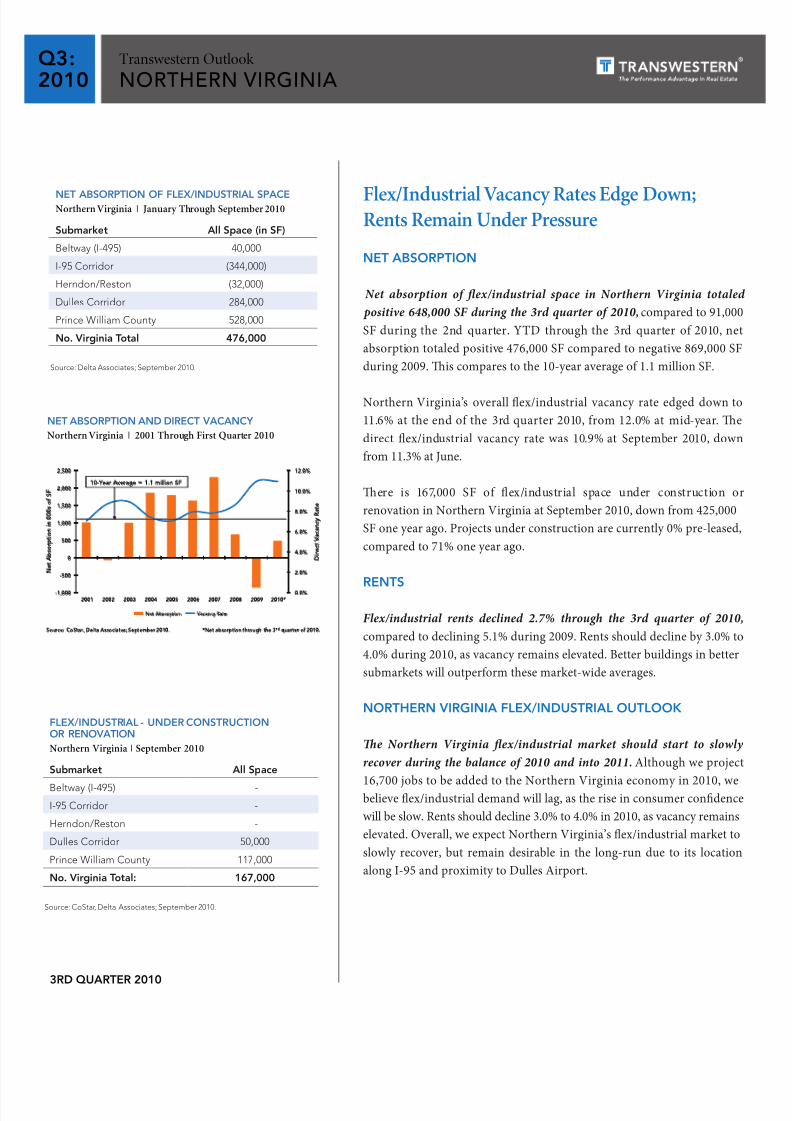
Net absorption o fex/industrial space in Northern Virginia totaled
positive 648,000 SF during the 3rd quarter o 2010, comparedto91,000
SFduringthe 2nd quarter. YTD throughthe 3rdquarterof2010,ne
absorptiontotaledpositive476,000SFcomparedtonegative869,000SF
during2009.iscomparestothe10-yearaverageof1.1millionSF.
NorthernVirginia’s overallex/industrial vacancyrateedgeddownto
11.6% at theendofthe 3rdquarter2010,from12.0%atmid-year.e
direct ex/industrial vacancyratewas10.9%at September 2010, down
from11.3%atJune.
ere is 167,000 SF of ex/industrial space under construction o
renovationinNorthernVirginiaatSeptember2010,downfrom425,000
SFoneyearago.Projectsunderconstructionarecurrently0%pre-leased
comparedto71%oneyearago.
reNts
Flex/industrial rents declined 2.7% through the 3rd quarter o 2010,
comparedtodeclining5.1%during2009.Rentsshoulddeclineby3.0%to
4.0%during2010,asvacancyremainselevated.Betterbuildingsinbetter
submarketswilloutperformthesemarket-wideaverages.
NortherN virGiNia FLex/iNdustriaL outLook
Te Northern Virginia fex/industrial market should start to slowly
recover during the balance o 2010 and into 2011.Althoughweprojec
16,700jobstobeaddedtotheNorthernVirginiaeconomyin2010,webelieveex/industrialdemandwilllag,astheriseinconsumercondenc
willbeslow.Rentsshoulddecline3.0%to4.0%in2010,asvacancyremains
elevated.Overall,weexpectNorthernVirginia’sex/industrialmarketto
slowly recover, but remain desirable in the long-run due to its location
alongI-95andproximitytoDullesAirport.
Net absorptioN oF FLex/iNdustriaL spaceNorthern Virginia | January Through September 2010
sm all s (n sF)
Beltway (I-495) 40,000
I-95 Corridor (344,000)
Herndon/Reston (32,000)
Dulles Corridor 284,000
Prince William County 528,000
N. vgn tl 476,000
Source: Delta Associates; September 2010.
Net absorptioN aNd direct vacaNcy
Northern Virginia | 2001 Through First Quarter 2010
FLex/iNdustriaL - uNder coNstructioNor reNovatioN
Northern Virginia | September 2010
sm all s
Beltway (I-495) -
I-95 Corridor -
Herndon/Reston -
Dulles Corridor 50,000
Prince William County 117,000
N. vgn tl: 167,000
Source: CoStar, Delta Associates; September 2010.
0.0%
2.0%
4.0%
6.0%
8.0%
10.0%
12.0%
-1,000
-500
0
500
1,000
1,500
2,000
2,500
2001 2002 2003 2004 2005 2006 2007 2008 2009 2010*
D i r e c t V a c a n c y R a t e
N e t A b s o r p t i o n
i n 0 0 0 s o f S F
Net A bsor pt ion V acancy Rate
10-Year Average = 1.1 million SF
Source: CoStar,Delta Associates; September 2010. *Net absorption through the 3rd quarter of 2010.
8/7/2019 Transwester 3Q 2010
http://slidepdf.com/reader/full/transwester-3q-2010 9/9
Transwestern Outlook Outlook is published quarterly by Delta Associates, the ResearchAfliate o Transwestern Commercial Services, the Washington/
Baltimore metropolitan area’s largest ull service real estate
frm. Every eort has been made to ensure accuracy; however,
Transwestern Commercial Services is not responsible or any
errors or omissions.
q3:2010
Transwestern Outlook
northern virginia
reGioNaL headquarters6700RockledgeDriveSuite400ABethesda,MD20817301.896.9000
washiNGtoN, dc1700KStreet,NWSuite600
Washington,DC20006202.775.7000
NortherN virGiNia8614WestwoodCenterDriveSuite800Vienna,VA22182703.821.0040
baLtiMore-washiNGtoN corridor8820Columbia100Parkway
Suite310Columbia,MD21045301.621.8800
www.transwestern.net
deLta associates500MontgomeryStreetSuite600Alexandria,VA22314703.836.5700
www.DeltaAssociates.com