Transversal Activity Report Activity Report 2014 4 FOREWORD AFROSAI-E plays a facilitative role in...
68
Transversal Activity Report 2014 Presented at the AFROSAI-E Governing Board meeting in Cape Town, May 2015
-
Upload
duongkhanh -
Category
Documents
-
view
214 -
download
0
Transcript of Transversal Activity Report Activity Report 2014 4 FOREWORD AFROSAI-E plays a facilitative role in...
Transversal Activity Report
2014 Presented at the AFROSAI-E Governing Board meeting in Cape Town, May 2015

Transversal Activity Report 2014
2
Contents
FOREWORD ............................................................................................................................................. 4
EXECUTIVE SUMMARY ............................................................................................................................ 5
CHAPTER 1 .............................................................................................................................................. 8
INTRODUCTION ....................................................................................................................................... 8
INSTITUTIONAL CAPACITY BUILDING FRAMEWORK (ICBF) .................................................................... 9
The new SAI-Performance Measurement Framework (SAI-PMF) ................................................ 10
AFROSAI-E DEVELOPMENT TOOLS ........................................................................................................ 10
CHAPTER 2 ............................................................................................................................................ 12
METHODOLOGY .................................................................................................................................... 12
CHAPTER 3 ............................................................................................................................................ 14
SAIS ASSESSMENT AGAINST THE FIVE DOMAINS IN ICBF ..................................................................... 14
Averages for the domains within ICBF .............................................................................................. 14
Performance on domains from 2010 to 2014 .................................................................................. 19
CHAPTER 4 ............................................................................................................................................ 21
SAIS ASSESSMENT AGAINST THE STRATEGIC IMPERATIVES ................................................................. 21
CHAPTER 5 ............................................................................................................................................ 24
Strategic imperatives related to the five domains in ICBF.................................................................... 24
Performance along six strategic imperatives: ................................................................................... 24
Independence of SAIs ................................................................................................................... 24
Human Resources ......................................................................................................................... 26
Quality Assurance ......................................................................................................................... 30
Performance Audit ........................................................................................................................ 34
Use of IT in Audit ........................................................................................................................... 36
Communication ............................................................................................................................. 39
GENERAL PERFORMANCE OF THE SAIs ................................................................................................. 40
New focus areas ................................................................................................................................ 40
Timeliness and audit coverage ......................................................................................................... 42
Size and composition of audit staff................................................................................................... 43
Financial Resourcing of SAIs .............................................................................................................. 43
CONCLUSIONS ....................................................................................................................................... 45
Progress seen in the strategic areas for 2014 ................................................................................... 45

3 FOREWORD
APPENDICES .......................................................................................................................................... 49
Appendix 1: AFROSAI-E INSTITUTIONAL CAPACITY BUILDING FRAMEWORK (ICBF): A GENERIC
FORMAT OF THE INSTITUTIONAL PERSPECTIVE ............................................................................... 50
Appendix 2: Country Level Presentations 2014 ................................................................................ 52
Angola .............................................................................................................................................. 53
Botswana .................................................................................................................................... 53
Eritrea.......................................................................................................................................... 54
Ethiopia ....................................................................................................................................... 54
Ghana ........................................................................................................................................... 55
Kenya ........................................................................................................................................... 56
Lesotho ........................................................................................................................................ 56
Liberia ......................................................................................................................................... 57
Malawi ......................................................................................................................................... 57
Mauritius ..................................................................................................................................... 58
Mozambique ............................................................................................................................... 58
Namibia ....................................................................................................................................... 59
Nigeria ......................................................................................................................................... 59
Rwanda ........................................................................................................................................ 60
Seychelles ................................................................................................................................... 60
Sierra Leone ............................................................................................................................... 61
South Africa ................................................................................................................................ 61
South Sudan ................................................................................................................................ 62
Sudan ........................................................................................................................................... 62
Swaziland .................................................................................................................................... 63
Tanzania ...................................................................................................................................... 63
Uganda ......................................................................................................................................... 64
Zambia ......................................................................................................................................... 64
Zimbabwe ................................................................................................................................... 65
Appendix 3: Quality Assurance Questions – average for all countries per question........................ 66
Appendix 4: Quality assurance questions compared to quality assurance visits ............................. 67
Appendix 5: Number of auditors in the region ................................................................................. 68
Transversal Activity Report 2014
4
FOREWORD
AFROSAI-E plays a facilitative role in empowering member Supreme Audit Institutions (SAIs) to
optimize their audit performance through sharing information and supporting them toward better
performance in executing their mandates. The desire is to make a difference in the performance of
SAIs through supporting them in their capacity building interventions.
During the 2006 Governing Board meeting the Auditors General adopted the Institutional Capacity
Building Framework (ICBF) as a self-assessment guidance tool to member SAIs as well as a
benchmark for regional development that would assist the member SAIs to reach the level of audit
performance necessary to fulfill their mandates. The ICBF is used by the SAIs to report on own
performance. It also provides the opportunity to consolidate the performance of member SAIs on a
regional level. The ambition to improve and consolidate the performance of the SAIs is reflected in
the targets set for the strategic imperatives in the AFROSAI-E Corporate Plan for 2010 to 2014. These
targets are continually reviewed based on the results from the Transversal Activity Reports.
However, the goal is that as many SAIs as possible will reach level 3 and above of the ICBF.
The ICBF is now a well-accepted and understood tool in the region. Its adoption by the AFROSAI-E
Auditors General has stimulated a spirit of constructive competition amongst the SAIs with a positive
impact on the development activities in the region. Whilst the challenges are ambitious it is certainly
within the capability of all SAIs to continue improving their performance and thus facilitate public
service accountability throughout the region. The progress made by SAIs is visible and will eventually
demonstrate the impact of their work in the years ahead by means of improved accountability,
transparency and governance in the region’s public sector. It is with great joy and pride that the six
strategic imperative set at the beginning of the strategic period have been achieved satisfactorily.
However, there are still development gaps that we believe will be addressed in the next strategic
period of 2015-2019.
For the first time in the history of the Transversal Activity Report this year’s report was prepared by
a team of two resource persons, Dr Wilfred Marube of SAI Kenya and Mr Lawrence Z.E. Chinkhunda
from SAI Malawi and Mr Gorden Amon Kandoro, the AFROSAI-E Senior Manager responsible for
institutional strengthening and capacity building who was the team leader.
This Transversal Activity Report was presented at the AFROSAI-E governing board meeting in Cape
Town, South Africa in May 2014. Time was given for comments from the SAIs until the end of June
2015.
Wessel Pretorius
Chief Executive Officer
AFROSAI-E Secretariat

5 EXECUTIVE SUMMARY
EXECUTIVE SUMMARY
This transversal activity report for 2014 is compiled from the self-assessments by 23 out of the 25
member-SAIs in the AFROSAI-E region. Both the surveys questionnaire and this activity report is
premised on the Institutional Capacity Building Framework (ICBF) with focus on the strategic
imperatives that agree upon by the Governing Board.
The response rate for 2014 was 92% meaning that 23 out of the 25 member countries responded to
the survey. The results presented in this report are primarily based on the responses provided by the
23 member SAIs. However, the results are moderated by quality assurance support visit reviews by
the Secretariat to eleven member SAIs, as well as the 2014 AFROSAI-E Integrated Annual Report.
This year is the last of AFROSAI-E’s five-year contemporary strategic plan ending December 2014.
Based on the achievement of 2.5 level and above of the ICBF, it is concluded that most the targeted
development targets set in 2009 have been achieved. The critical step needed is the establishment
of mechanisms to maintain and ensure continuous achievement of higher levels of development in
the next strategic cycle to enable the region to achieve the overall target.
Although remarkable progress has been made the overall objective position of 70% of the member-
SAIs achieving level three and above of the ICBF has not been achieved. There are still weak areas
that require further developments. For example, the alignment of the strategic and
operational/business planning level and the ability of SAIs to clearly link operations to their strategic
plans still require attention. However, in our view this observation raises several questions because
there are different dimensions and reasons that can be used to explain the differences. For instance,
in the domain of independence and the legal framework of SAIs the weak link has been observed to
be in the slow progress in operationalizing SAIs’ legal frameworks that include among others the
setting up of robust follow-up of audit recommendations mechanisms and annual reporting on SAIs’
performance in the public arena.
The improvements observed in this report also highlighted a further need to develop communication
strategies; strategies for planning and managing financial and human resources; the development of
quality assurance strategies; the continued development of performance audit; and developing
processes to enhance timeliness in reporting.
Although the human resource imperative ratings have improved compared with the previous period,
the report observes that the human resource division/unit as a strategic partner and facilitator of
the SAI’s development requires further alignment with other SAI functions. For example, on
operational levels these weaknesses are observed in the lack of effective appraisal systems,
ineffective deployment and use of time recording systems as tools for performance management.

Transversal Activity Report 2014
6
Another weak link was on whether or not there is specific management and leadership development
programmes in place that encourage the professionalization of the various SAI disciplines.
Conclusions
Considering the overall observations and analysis of the self-assessments the following
conclusions have been made:
Independence
In the AFROSAI-E member SAIs should focus more towards the attainment of financial and
administrative independence under appropriate oversight without the involvement of the
executives. As such SAIs are encouraged to use UN resolutions to lobby both the executive and
legislatives structures in their respective countries to obtain and maintain independence. Secondly,
the Secretariat should assist SAIs to operationalise their independence by developing a regional
toolkit with a framework to guide them on how to influence the development and implementation
of primary and secondary legislations.
Human Resources
SAIs and the Secretariat should continue to develop and implement human resource management
tools like organizational development policies/plans, performance management systems and time
recording systems to assist in the achievement of higher development levels. Secondly, SAIs should
continue to focus on the establishment of management and leadership development programme to
improve the capacity of their management teams. Thirdly, SAIs should also start to invest in the
professionalization of their staff in order to ensure the development of capable organisations.
Communication
Communication is a cross cutting issue in any organization which should be treated as a strategic
channel for the implementation of the SAI’s development goals. Given the important value of
communication it is recommended that robust external and internal communication policies and
strategies be developed, implemented and monitored at senior management level of the SAI.
Quality Assurance
This is an area that needs to be focused continuously given that the quality control aspects for the
audit disciplines are evolving. For example, quality control aspects of especially HR, management
and communication – apart from the audit disciplines – are also necessary to focus before the SAI
can achieve quality audit services. Quality Assurance is a continuous activity and there is still a need
to focus on the quality assurance issues in the different parts and on the different levels of the SAIs

7 EXECUTIVE SUMMARY
Performance Audit
Together with continuous training and development of performance auditors there should be
deliberate prioritization in the development and implementation of quality control management
systems focusing on the audit review skills necessary for performance auditing and enhancing
recruitment, training and retention for auditors and managers with a wide mix of different
professional backgrounds.
Use of IT in Audit
There has been satisfactory progress in the development of this imperative. However, there is still
room to develop this imperative even in the next strategic period. As such there is need for
development not only in the area of knowledge and skills for IT auditing but also in the innovative
and creative use of the same. It is also clear that there should be an intensive focus on the
development and implementation of comprehensive IT strategies and IT support systems that are
aligned with the IT development landscape.

Transversal Activity Report 2014
8
CHAPTER 1
INTRODUCTION
The Lima declaration (ISSAI 1) of 1977 endorsed at the INCOSAI meeting in Lima, Peru, provides a
strong foundation for supreme audit institutions (SAIs). Subsequent standards have been developed
since then, focusing on different areas. Of late, a set of new internationally agreed standards for SAIs
have been developed and continue to be developed. The development of International Standards
for Supreme Audit Institutions (ISSAIs) is a result of cooperation between INTOSAI member SAIs
through the Professional Standards Committee, and endorsements at the triennial International
Congress of SAIs (INCOSAI) where each attending member has one vote. These standards are built
on the expectation that member SAIs would adapt and adopt them based on their unique context
and legislative realities of their environments. In the AFROSAI-E environment an Institutional
Capacity Building Framework (ICBF) was developed for the same purpose to assist in the effective
implementation of the ISSAIs. As the number of international standards increase the AFROSAI-E
institutional capacity building framework is continuously amended to align with these ISSAIs. This
Transversal Activity Report has its starting point in the AFROSAI-E Institutional Capacity Building
Framework.
The AFROSAI-E Institutional Capacity Framework was developed to help SAIs enhance their capacity
through operationalizing and adopting the various ISSAIs. It summarizes the different standards and
regulations into key areas a SAI needs to focus on to succeed in its operations and development. It is
put together from an organizational perspective rather than from the specifications made in the
standards. The purpose is to assist the SAIs in identifying their strengths and weaknesses to be able
to allocate the resources in an efficient and effective way.
This transversal activity report is part of capacity building through the ICBF framework. It gives a
cross sectional and longitudinal view on how SAIs have performed and progressed with the ICBF
framework the last twelve month reporting period. The report aims to facilitate the analysis by
providing the members of AFROSAI-E with information from an institutional perspective on the
status of their development and that of the public sector auditing in the region through self-
assessments made by the member SAIs. This provides a platform for broad comparison within the
region and could be of benefit for benchmarking among members SAIs as well as use by AFROSAI-E
development partners and other key stakeholders including the donor community.
The activity report is further an important instrument for the governing board and its executive
secretariat to monitor the development in the region against agreed objectives and activities in the
corporate plan. AFROSAI-E’s enabling role to better support its members in the execution of their
mandates, is as well enhanced by the information provided in the activity report.
9 Institutional capacity building framework (ICBF)
INSTITUTIONAL CAPACITY BUILDING FRAMEWORK (ICBF)
The AFROSAI-E Board adopted at its annual meeting in 2006 an institutional capacity building
framework as a basis for the development and the strategic planning of the regional organization.
The framework has its roots in a capability model developed in 2001 and updated in 20051. The
Institutional Capacity Building Framework consists of five development levels, level 1 to 5, and five
institutional development areas or domains: Independence and Legal Framework, Organization and
Management, Human Resources, Audit Standards and Methodology and finally Communication and
Stakeholder Management. Each domain contains a number of elements as shown in appendix 1.
The ICBF is primarily a tool for the SAI to support its endeavors to reach level 3 and beyond in the
best possible way and not only an instrument for assessment as most of the other capacity building
models. The objective is to help the SAI focus on how it can improve its results and thereby its
position in relation to its counterparts in the INTOSAI community. Thus, the ICBF can be used as a
tool to improve the performance of a SAI. The idea is to enhance the possibilities to develop the SAI
in its different branches in parallel. That is; the different lines of business and objectives in the
institution (strategic management, core business and corporate services) can be linked to support
each other. This is especially important when it comes to the linkages to the strategic plan. Different
divisions’ operational plans and practices are as well linked to the overall strategic plan and the idea
of where the SAI is heading in its work.
Further, in the ICBF, the institutional perspective in a SAI is based on, and consists of, the following
five areas or domains as shown in Table 1:
Independence and legal framework
Organization and management
Human resources
Audit standards and methodology
Communication and stakeholder management
An illustration of the development levels of the institutional capacity building framework (ICBF) is
presented in table 1. Each domain in the framework is composed of a number of issues or topics,
here called elements (see appendix 1). These are seen as the elements needed to build a sustainable
institution. The elements in the framework are common for all levels, although the quality differs. A
guideline has been developed to assist the SAIs to assess their position in accordance with the
indicators developed for each element in the Framework, to help the SAIs to position themselves on
the right development level.
1 AFROSAI-E: A good practice guide to enhance the independence of Supreme Audit Institutions (SAIs) in
English-Speaking African countries, 2005.

Transversal Activity Report 2014
10
Institutional Capacity Building Framework (ICBF)
INSTITUTIONAL PERSPECTIVE D
EVEL
OP
MEN
T LE
VEL
Independence
and
Legal Framework
Organization
and
Management
Human
Resources
Audit Standards
and
Methodology
Communication
and
Stakeholder
Management
Level 5 ------------------------------------------OPTIMI ZED LE VEL ----------------------------------------------------
Level 4 ------------------------------------------MANAGE D LE VEL ------------------------------------------------------
Level 3 ------------------------------------------EST ABL I SHE D LE VEL -------------------------------------------------
Level 2 ------------------------------------------DEVELOPI NG LE VEL --------------------------------------------------
Level 1 ------------------------------------------FOUNDI NG LE VEL -----------------------------------------------------
Table 1: The five levels and the institutional perspective on each level in the AFROSAI-E institutional capacity building
framework
The five domains are divided into five development levels which include; the founding level; the
developing level; the established level; the managed level; and the optimized level (See Table 1).
Further each level has indicators that require to be fulfilled before the SAI can claim to have
achieved the said level of development. Currently, in the AFROSAI-E region, this is achieved through
a self-assessment questionnaire which members SAIs are expected to respond to annually.
The new SAI-Performance Measurement Framework (SAI-PMF)
On a similar dimension AFROSAI-E participated in the development of a new assessment tool kit –
Performance Measurement Framework (SAI-PMF) – for measuring the performance of SAIs. The
development of this tool is being spearheaded by the INTOSAI Development Initiative (IDI) in
cooperation with selected member SAIs from the INTOSAI community. Of significance though is the
fact that the SAI-PMF has a lot of similarities with the ICBF and is partly based on this work made in
AFROSAI-E. The current draft version of the SAI-PMF is in the pilot phase of its development and will
be presented for endorsement in 2016 during the International Congress of Supreme Audit
Institutions (ICOSAI) conference.
In the meantime, the ICBF will remain parallel with the development of SAI-PMF. Efforts are already
underway to align the ICBF to the SAI-PMF version in line with the requirements of ISSAI 12. As a
self-assessment tool, the ICBF is expected to complement the SAI-PMF and will provide a simplified
version of the same for the SAIs in the region. As such, in the aligned version the ICBF will continue
to provide a good tool for sustainable follow-ups in the AFROSAI-E region.
AFROSAI-E DEVELOPMENT TOOLS
In supporting the development of SAIs in the region, the AFROSAI-E Secretariat produces different
kinds of developmental capacity building tools. The work comprise the development of course
11 AFROSAI-E DEVELOPMENT TOOLS
materials, delivery of workshops and support visits of different types, like quality assurance review
visits or management development program (MDP) rollout and follow-up visits. The Secretariat’s
work also involves the development of different materials like manuals, guidelines and other tools
developed and provided for the region. The following tools and guidance materials were developed
and launched during 2014:
The regularity audit e-learning module;
Exposure Draft of the Performance Audit Manual;
Guidance on Report Writing;
Exposure Draft on Audit of Fraud and Corruption (second draft);
Exposure Draft on Forensic Auditing; and
Guideline on Audit of Environmental Impact Assessment (EIA) Studies.
During the 2014 Governing Board in Addis Ababa, AFROSAI-E in partnership with the Swedish
National Audit Office launched the Executive Leadership Development Programme (ELDP). This
programme’s main goal is to support the establishment of professional, relevant and competent top
executive teams at SAIs in the region to lead their organisations towards full compliance with
international standards for public sector auditing. The recruitment process for the first group to
participate in this programme will commence in 2015. Details of this programme are addressed in
the 2014 AFROSAI-E Integrated Annual Report.
Further, as part of its institutional development support the Secretariat assisted four SAIs to
customize and rollout the Management Development Programme (MDP). In addition, two regional
workshops were delivered to assist those SAIs that were at different levels of rolling out the
programme at the SAI level. To further strengthen and build the pool of regional MDP champions, a
third Facilitation Skills workshop was held. A more detailed presentation of the production can be
found in the AFROSAI-E’s Integrated Annual Report for the year 2014.
The development of SAIs in the region is not only based on resource persons from the member SAIs,
but is also materially dependent on support from institutional partners. AFROSAI-E is working with
experts from its institutional partners together with member SAIs who are willing to support their
counterparts at regional and bilateral events. In view of the need to strengthen this model of
working relationships, AFROSAI-E is organizing resource persons into different networks in order to
enable the building of capacity within the different strategic imperatives
Transversal Activity Report 2014
12
CHAPTER 2
METHODOLOGY
This report has been derived from the 2014 self-assessment survey feedback received from member
SAIs, based on the five ICBF domains. This report provides a broad overview on how the region has
progressed and developed based on the ICB frame work. Suffice to say that the AFROSAI-E corporate
plan came to an end in December 2014, and therefore this report will reveal how the SAIs have
developed on within the five ICBF domains and the six strategic imperatives for this strategic period
under review.
The questions used in the survey are aligned to the ICBF framework, ISSAIs and best practices.
Lessons learnt from previous surveys were also captured and helped shape the questions to be used
in this survey. It must be appreciated that the survey is based on self-assessment and thus could be a
product of perceptions on performance by the individual SAIs. However, to mitigate on this, the ICBF
guide was shared with various SAIs to help them internalize the application in order to come up with
a more objective judgment on their ranking. Further, the validity of the results could also be
compromised by the possibility of different people answering the questions over the years 2010 to
2014. Moreover, the averaging of the questions under each domain and imperative for period under
review may also blur the true development level of the SAI. To mitigate against these weaknesses,
results of the eleven quality assurance support visits by the Secretariat were used to interpret and
develop conclusions under each domain and strategic imperatives.
Response rates
Over the years the numbers of countries responding to the survey have varied. For instance, in the
year 2011, 20 of the then 23 AFROSAI-E members responded to the survey, while in the year 2012 it
was 21, and in 2013 it was 24 out of the 24 members SAIs. In 2014 we had 23 out of 25 members
SAIs responding (See Table 2).
Year Number of SAIs who responded
2006 12
2007 13
2008 17
2009 22
2010 23
2011 20
2012 21
2013 24
2014 23
Table 2: Number of SAIs responding to the survey over the years 2006-2014
13 METHODOLOGY
The 25th member (SAI Sudan) was accepted during the 2014 Governing Board meeting in Addis
Ababa, Ethiopia. A 92% response rate is a positive trend as members have been forthcoming in
providing us with required feedback. As can be seen in the table that, since 2006, the number of
SAIs responding have more than doubled.
Structure of the report
Over the 2010-2014 strategic period, the AFROSAI-E Institutional Capacity Building Framework and
its six strategic imperatives were used as the basis for structuring this report. The data is presented
in two forms, that is, aggregated averages on clustered responses from SAIs and a more detailed
analysis on key issues on the six strategic imperatives. These strategic imperatives are derived from
the five domains in the ICBF framework. Thereafter the report moves into conclusions and
recommendations.

Transversal Activity Report 2014
14
CHAPTER 3
SAIS ASSESSMENT AGAINST THE FIVE DOMAINS IN ICBF
Introduction
The survey as earlier mentioned was based on the five domains and depicts how various SAIs are
performing in the region against the Institutional Capacity Framework. This will be looked at in
terms of regional performance as a whole, and individual SAI performance against each of the
domains. The individual SAI performance is captured in appendix 2.
Averages for the domains within ICBF
The self-assessment on the domains ranges from level 0-5. As can be observed from the results of
the self-assessment, SAIs are doing well towards achieving the target on independence and Legal
framework. Generally speaking, on average over the last five year period there has been a marginal
movement towards the targeted level 3. More work still needs to be done in Organization and
Management, Human Resources, Audit Standards and Methodology and Communication &
Stakeholder Management, as we strive to get the SAIs to level three in those domains.
Figure 1: Average self-assessed level for the region - Comparison between domains years 2010, 2011, 2012
2013 and 2014.
It is necessary to depict how SAIs self-evaluation across the five domains and how they compare
with each other. This would help individual SAIs make decisions on benchmarking and other forms of
SAI to SAI engagement as a way of fostering improved performance. This is shown in the figures
below addressing each domain separately.
Independence and legal framework
This domain addresses itself to criteria that include among others: constitutional and legal
framework; financial/managerial/administrative autonomy and appropriate human, financial and
0.00
1.00
2.00
3.00
4.00
5.00
Independence &
Legal Framework
Organization &
Management
Human Resources Audit Standards &
Methodology
Communication &
Stakeholder
Management
DOMAINS
2010 2011 2012 2013 2014
15 SAIS ASSESSMENT AGAINST THE FIVE DOMAINS IN ICBF
material resources; independence of Head of SAI and staff of SAI; SAI has a broadly sufficient
mandate; have mandate and discretion to discharge its function through access to information; have
mandate and discretion to discharge its function through discretion of selection of audit topics;
there is freedom to decide on content, timing of audit reports and to publish and disseminate them;
have mandate to a direct submission of reports to Parliament; effective follow up mechanisms on
recommendations; SAI reporting on its activities and use of resources; Parliament or an oversight
body appoints the SAIs external auditors.
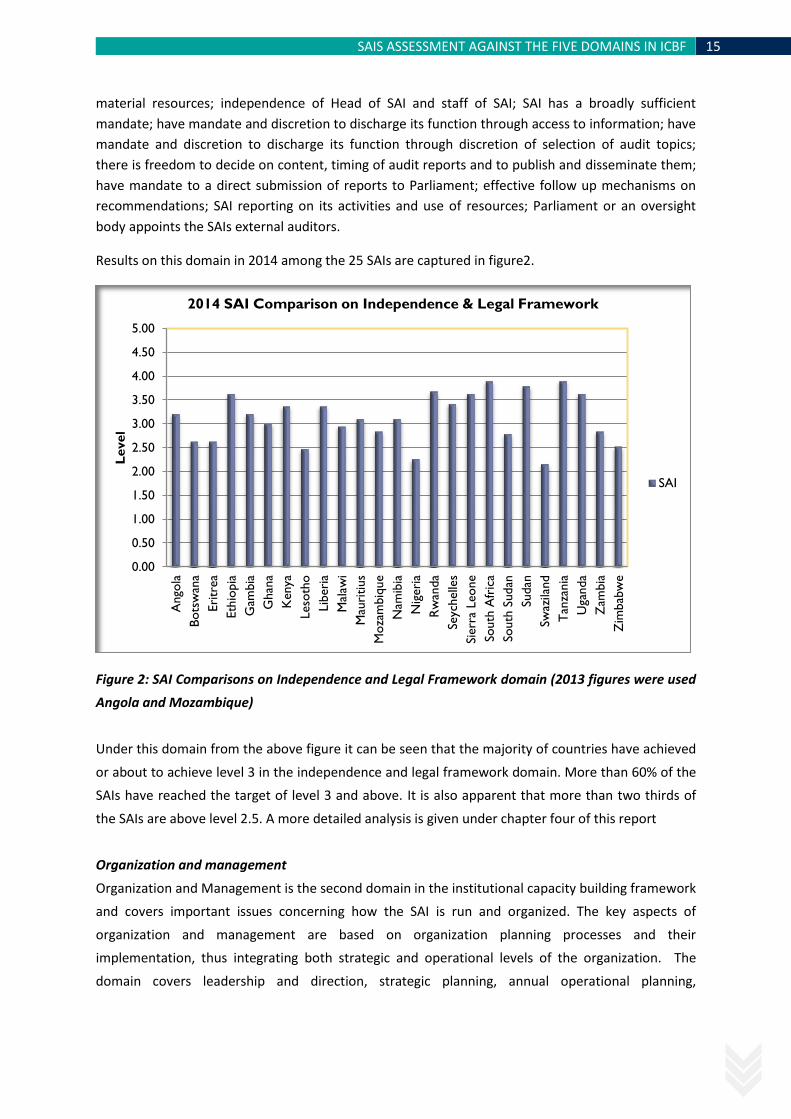
Results on this domain in 2014 among the 25 SAIs are captured in figure2.
Figure 2: SAI Comparisons on Independence and Legal Framework domain (2013 figures were used
Angola and Mozambique)
Under this domain from the above figure it can be seen that the majority of countries have achieved
or about to achieve level 3 in the independence and legal framework domain. More than 60% of the
SAIs have reached the target of level 3 and above. It is also apparent that more than two thirds of
the SAIs are above level 2.5. A more detailed analysis is given under chapter four of this report
Organization and management
Organization and Management is the second domain in the institutional capacity building framework
and covers important issues concerning how the SAI is run and organized. The key aspects of
organization and management are based on organization planning processes and their
implementation, thus integrating both strategic and operational levels of the organization. The
domain covers leadership and direction, strategic planning, annual operational planning,
0.00
0.50
1.00
1.50
2.00
2.50
3.00
3.50
4.00
4.50
5.00
Ango
la
Bots
wan
a
Eri
trea
Eth
iopia
Gam
bia
Ghan
a
Kenya
Leso
tho
Lib
eri
a
Mal
awi
Mau
ritius
Moza
mbiq
ue
Nam
ibia
Nig
eri
a
Rw
anda
Seyc
helle
s
Sierr
a Leone
South
Afr
ica
South
Sudan
Sudan
Swaz
iland
Tan
zania
Uga
nda
Zam
bia
Zim
bab
we
Level
2014 SAI Comparison on Independence & Legal Framework
SAI
Transversal Activity Report 2014
16
organization of the SAI, internal control system, use of resources and code of ethics and its
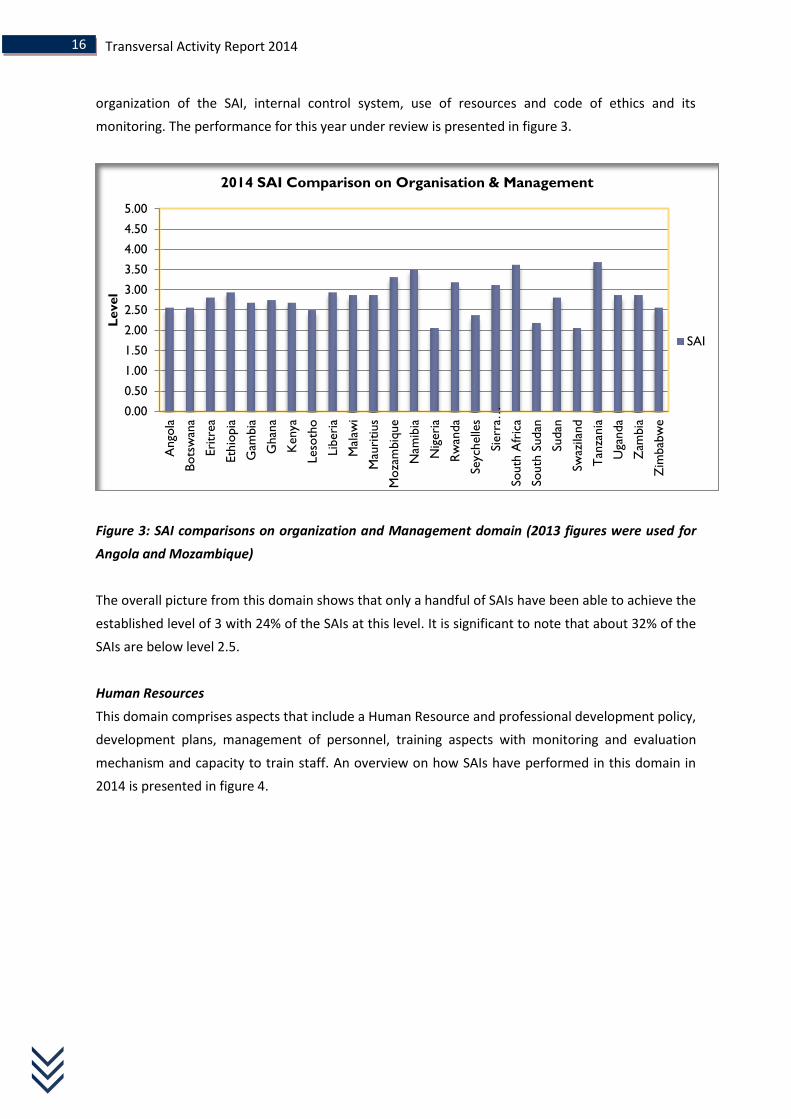
monitoring. The performance for this year under review is presented in figure 3.
Figure 3: SAI comparisons on organization and Management domain (2013 figures were used for
Angola and Mozambique)
The overall picture from this domain shows that only a handful of SAIs have been able to achieve the
established level of 3 with 24% of the SAIs at this level. It is significant to note that about 32% of the
SAIs are below level 2.5.
Human Resources
This domain comprises aspects that include a Human Resource and professional development policy,
development plans, management of personnel, training aspects with monitoring and evaluation
mechanism and capacity to train staff. An overview on how SAIs have performed in this domain in
2014 is presented in figure 4.
0.00
0.50
1.00
1.50
2.00
2.50
3.00
3.50
4.00
4.50
5.00
Ango
la
Bots
wan
a
Eri
trea
Eth
iopia
Gam
bia
Ghan
a
Kenya
Leso
tho
Lib
eri
a
Mal
awi
Mau
ritius
Moza
mbiq
ue
Nam
ibia
Nig
eri
a
Rw
anda
Seyc
helle
s
Sierr
a…
South
Afr
ica
South
Sudan
Sudan
Swaz
iland
Tan
zania
Uga
nda
Zam
bia
Zim
bab
we
Level
2014 SAI Comparison on Organisation & Management
SAI

17 SAIS ASSESSMENT AGAINST THE FIVE DOMAINS IN ICBF
Figure 4: SAI comparisons on Human Resources domain (2013 figures were used for Angola and
Mozambique)
It may be observed that Human Resources is still a challenge as majority of the SAIs are below level
2.5, with only 24% being at level 3 and above; and 40% below level 2.5.
Audit standards and methodology
This domain has the following key elements that include: SAIs developed and implemented annual
audit plans, audit manuals that are aligned and compliant with international standards linked to a
training programme and reviewed and updated regularly, quality control measures and quality
assurance, audit techniques such as electronic working papers and Computer Assisted Audit
Techniques (CAATS), implementation of the SAI communication strategy for the audit process with
the auditees, SAI communication with relevant experts, professional bodies, relevant journals,
internal audit and other public sector audit institutions; SAI reporting ensuring of follow up of
previous recommendations, user friendly and standardised structures of reports with materiality
considerations.
In 2014, SAIs in the region performed on this domain as presented in figure 5.
0.00
0.50
1.00
1.50
2.00
2.50
3.00
3.50
4.00
4.50
5.00
Ango
la
Bots
wan
a
Eri
trea
Eth
iopia
Gam
bia
Ghan
a
Kenya
Leso
tho
Lib
eri
a
Mal
awi
Mau
ritius
Moza
mbiq
ue
Nam
ibia
Nig
eri
a
Rw
anda
Seyc
helle
s
Sierr
a Leone
South
Afr
ica
South
Sudan
Sudan
Swaz
iland
Tan
zania
Uga
nda
Zam
bia
Zim
bab
we
Level
2014 SAI Comparison on Human Resources
SAI

Transversal Activity Report 2014
18
Figure 5: SAI comparisons on Audit Standards and methodology domain (2013 figures were used
for Angola and Mozambique)
From the figures above it can be observed that SAIs still need to do more within the domain of audit
standards and methodology. For instance only 16% (4 SAIs) of the SAIs are at level 3 and above while
12 (48%) are at level 2.5 and above. However, it should be noted that the region has come a long
way in terms of implementing ISSAIs since 2010 although they still acknowledge that more still
needs to be done especially in the setting up of quality control management systems, monitoring of
the same systems, computirising working papers and use of CAATs in the audit processes.
Communication and stakeholder management
This domain focuses on aspects such as communication policy and strategy covering internal and
external communication, channels of communication between SAI and Parliament, PAC and judiciary
and other stakeholders like Ministry of Finance and other oversight bodies, promotion of the SAI via
engagement with the media, public, academic institutions and international community and
organizations; communication audit performance and results. The performance among the 25 SAIs
on this domain is summarized in figure 6.
0.00
0.50
1.00
1.50
2.00
2.50
3.00
3.50
4.00
4.50
5.00
Ango
la
Bots
wan
a
Eri
trea
Eth
iopia
Gam
bia
Ghan
a
Kenya
Leso
tho
Lib
eri
a
Mal
awi
Mau
ritius
Moza
mbiq
ue
Nam
ibia
Nig
eri
a
Rw
anda
Seyc
helle
s
Sierr
a Leone
South
Afr
ica
South
Sudan
Sudan
Swaz
iland
Tan
zania
Uga
nda
Zam
bia
Zim
bab
we
Level
2014 SAI Comparison on Audit Standards & Methodology
SAI

19 SAIS ASSESSMENT AGAINST THE FIVE DOMAINS IN ICBF
Figure 6: SAI comparisons on Communication & Stakeholder Management domain (2013 figures
were used for Angola and Mozambique)
The communication and stakeholder management domain also shows that majority of the SAIs are
yet to get to level 3 in the ICBF framework. Only 4 (16%) of the SAIs are at level 3 and above 13 (
52%) of the SAIs are at level 2.5 and above. There has been marked improvement in this domain as
SAIs are acknowledging the need for setting communication effective systems and structures to
ensure both internal and external seamless communication. However, it must be pointed out that in
this domain several SAIs are still to set up robust communication channels that demonstrate their
value and benefits to their publics.
The differences on how the SAIs have performed will be revealed in details when we address the
individual domains and the strategic imperatives in our subsequent presentations.
Performance on domains from 2010 to 2014
During the strategic period (2010-2014) the target was that SAIs in the region would strive to reach
level 3 of the ICBF framework. The targeted level was that 40% of the SAIs would attain level three
and above during this period under review. Table 3 depicts the trend from 2010 to 2014
0.00
0.50
1.00
1.50
2.00
2.50
3.00
3.50
4.00
4.50
5.00
Ango
la
Bots
wan
a
Eri
trea
Eth
iopia
Gam
bia
Ghan
a
Kenya
Leso
tho
Lib
eri
a
Mal
awi
Mau
ritius
Moza
mbiq
ue
Nam
ibia
Nig
eri
a
Rw
anda
Seyc
helle
s
Sierr
a Leone
South
Afr
ica
South
Sudan
Sudan
Swaz
iland
Tan
zania
Uga
nda
Zam
bia
Zim
bab
we
Level
2014 SAI Comparison on Communication & Stakeholder
Management
SAI

Transversal Activity Report 2014
20
Number of SAIs in the region on level 3 and 4 in the years 2010, 2011, 2012,2013 and 2014
2010 Year 2011 Year 2012 Year 2013 Year 2014
Level 3
Level 4
Level 3
Level 4
Level 3
Level 4 Level3 Level 4 Level 3 Level 4
Independence 11 0 11 0 12 0 12 0 15 0
Organization & Management
8 0 11 0 8 0 9 0 6
0
Human Resources
9 0 6 0 7 0 7 0 6
0
Audit Standards & Methodology
6 0 3 1 4 0 6 0 4
0
Communication & Stakeholder Management
6 1 5 0 3 0 4 0
4
0
Table 3: Comparison between the number of SAIs on level 3 and 4 in the years 2010, 2011, 2012, 2013 and 2014 all 25
countries included (2013 figures were used for Angola and Mozambique)
As can be observed from Table 3 above there has been a good number of SAIs that have reached
level 3 and above in the independence and Legal Framework. For instance, 15 (60%) SAIs reporting
that they are at level 3 and above. On the other hand there is no significant difference in the
number of SAIs who report that they are now at level 3 on organization and Management, with the
numbers dropping from 9 (36%) the previous year to 6 ( 24%) in 2014. A similar marginal drop is
noted in Human Resources from 28% in 2013 to 24% in 2014. Moreover, Audit Standards and
Methodology has seen a drop from 24% to 12% for 2013 and 2014 respectively. On
Communications & Stakeholders Management, there was no movement over the last two years.
There are various reasons that explain the movement of the ratings under each of the domains
which will be discussed under the strategic imperatives evaluations in the following chapter.
To enable us get more precise information on the development on the above domains, we shall look
at the performance of strategic imperatives in the next chapter.

21 CHAPTER 4
CHAPTER 4
SAIS ASSESSMENT AGAINST THE STRATEGIC IMPERATIVES
Introduction
Following the AFROSAI-E governing board annual meeting of 2006, the following strategic
imperatives were identified for the corporate plan for 2007 – 2009 and also adopted for the just
ended corporate plan (2010 – 2014):
Independence of the SAI
Human resource practices and management development
Communication and stakeholder management
Quality assurance
Performance auditing
Use of information technology in auditing
These strategic imperatives are key to capacity building in the AFROSAI-E region. Three of these
imperatives, that is, Human Resources, Communication & Stakeholder Management and
Independence are also part of the five domains in the ICBF framework. Other imperatives include
quality assurance, performance audit and use of IT in audit. These last three imperatives are based
on elements mainly but not exclusively within the Audit Standards and Methodology.
A glance at the imperatives over the years starting from 2010 to 2014 shows how the region has
performed over this period as shown in the figure 7 below. This has been made possible by
computing averages on the six imperatives as shown on figure 7.
Figure 7: Comparison between the average numbers of the six strategic imperatives for SAIs participating in surveys in the years 2010, 2011, 2012, 2013 and 2014 (based on 25 countries but note that 2013 figures were used for Angola and Mozambique).
The graph shows marginal increases across all six imperatives over the five years. Despite the slight
increase in the score, it is worth noting that five imperatives comprising Human Resources,
Communication, Quality assurance, Performance audit and use of IT in audit are still below the
regional target of level 3. This possible reasons for this will be explained under each imperative.
0.00
1.00
2.00
3.00
4.00
5.00
Independence Human
Resources
Communication Quality
assurance
Performance
audit
Use of IT in
audit
STRATEGIC IMPERATIVES
2010 2011 2012 2013 2014

Transversal Activity Report 2014
22
Monitoring the strategic imperatives
The table below shows the percentage number of SAIs that had achieved level three in these
targeted six strategic imperatives from 2009 to 2014.
Comparison to the strategic imperatives on level 3 in the corporate plan for 2012-2014 - estimated position for 2009 in percentage on level 3 - the calculated positions for 2009, 2010, 2011, 2012, 2013 and 2014 based on the
surveys on level 3 - targeted position for 2014 in the corporate plan (2010-2014) on level 3
STRATEGIC IMPERATIVES
Estimated position in 2009; % of
23 SAIs
Calculated position in 2009; % of
22 SAIs
Calculated position in 2010; % of
23 SAIs
Calculated position in 2011; % of 20
SAIs
Calculated position in
2012; % of 21 SAIs
Calculated position in 2013; % of
24 SAIs
Calculated position in 2014 % of
25 SAIs
Targeted position in 2014; % of 25
SAIs
Independence of the SAI
20% 63% 48% 45% 50% 50%
56% 40%
Human Resource practices and management development
10% 27% 39% 25% 25% 29%
24% 35%
Communication and stakeholder management
10% 41% 30% 15% 13% 17% 16%
40%
Quality assurance 5% 41% 39% 10% 8% 8.3% 20%
60%
Performance auditing
25% 45% 35% 20% 13% 25% 20%
60%
Use of Information Technology (IT) in auditing
20% 23% 13% 15% 13% 13%
12%
40%
Table 4: Positions on level 3 in percentage for the strategic imperatives in the corporate plan for 2010-2014. Year 2009 is
estimated, years 2010-2014 are calculated based on the activity report survey. Year 2009 was first estimated when the
decision about the strategic imperatives was made, then calculated from the self-assessments gathered for the year.
Year 2014 presents the targeted position (level 3) for the strategic imperatives presented in the corporate plan for 2010-
2014. (The percentages were calculated from the SAIs that responded and figures for Angola and Mozambigue were
estimated based on 2013 data)
During the start of the strategic period in 2009, AFROSAI-E set up specific targets on each of the six
imperatives indicating the percentage number of SAIs that should have achieved level 3 in those
strategic imperatives. As noted from the table above, the targets ranged from 40% to 60 % of the
SAIs. Taking note that December 2014 was the end of the strategic period, when the targets set out
in 2009 were set, it would be helpful to examine how far AFROSAI-E has been able to help SAIs
enhance their capacity in those six imperatives. As observed, 60% of SAIs are at level 3 on
independence of the SAI against a set target of 40%. Human Resources practices and management
development has 24% of the SAIs at level 3 and above against a target of 35% of them. On
Communication and Stakeholder Management, 16% of the SAIs are at level 3 and above against a
target of 60%. This is a drop from 2013, where 17% of the SAIs were at level 3. Quality assurance has
20% at level 3 and above against a target of 60%, a remarkable improvement from 8.3% in 2013.

23
Performance audit has 20% of the SAIs at level 3 and above against a target of 60%, while use of IT in
audit has 12% at level 3 and above against a target of 40%. By and large, apart from the first
imperative of independence, the other strategic imperatives were not on target as per the 2014
targets. Perhaps this could be a pointer to some of the challenges being experienced by SAIs or the
targets set appear to have been overambitious?
A clearer indication on how the SAIs performed on the imperatives in 2014 is shown in figure 8. It
should be noted that despite the exact level 3 and above targets not being met, the majority of SAIs
are at level 2.5 and above across all the imperatives. This is notably on independence (88%), Human
Resources (64%), Communication (52%), Quality Assurance (56%) and performance audit (64%).
However, as can be seen figure 8, use of IT in audit is still a challenge as only 32% of the SAIs are at
level 2.5 and above. .
Figure 8: Comparison between the percentages of the SAIs that have reached level 3 and above and the percentages of
the SAIs that have reached level 2.5 or above (Based on all 25 SAIs in the region except that for Angola and Mozambique
estimated positions were used based on 2013 figures)
Based on the figures of level 2.5 and above it can be concluded that the 2009 targets were to a great
extend achieved. In the next chapter each of the imperative is further interrogated so as to get
more in depth information on what worked well and not worked well within these imperatives
towards the achievement of level 3 and above of the ICBF.
40%
35%
40%
60% 60%
40%
60%
24%
16% 20% 20%
12%
88%
64%
52% 56%
64%
32%
0%
10%
20%
30%
40%
50%
60%
70%
80%
90%
100%
Independence HumanResources
Communication Qualityassurance
Performanceaudit
Use of IT inaudit
Achievements against Targeted Development Level
Target Dev Level
3 and above
2.5 and above

Transversal Activity Report 2014
24
CHAPTER 5
Strategic imperatives related to the five domains in ICBF
Introduction
Our foregoing discussions have dwelt on aggregated numbers for domains and strategic imperatives.
This has some inherent weaknesses as some interesting observations from some questions are not
captured. An examination on how these questions have been answered will help provide a more
balanced view on the SAIs development. The focus of this chapter will be on particular aspects of the
strategic imperatives where SAIs are not performing well, hence affecting the attainment of the
targeted level 3 established level. However, in some instances we shall point out areas where
particular SAIs excelled. Each of the strategic imperatives will be handled separately as indicated in
subsequent presentation in this chapter.
Performance along six strategic imperatives:
Independence of SAIs Details on this imperative were discussed in chapter two following the description of the
independence domain. We acknowledge, however, that Independence is the foundation of SAIs as
declared in the Lima and Mexico declarations (ISSAIs 1&10) and thus it is important to closely
analyse some key independence principles. Figure 9 below captures some key questions under this
imperative.
Figure 9: How SAIs responded in terms of their operationalised independence against key
questions.
0%20%
40%60%
80%100%
The executive does not take part in the preparation of the
SAI's budget appropriation or the final decision on the SAI's
budget
The SAI decides upon all human resource matters
(recruitment, remuneration, promotion etc)
The SAI has an effective follow-up mechanism on SAI
performance audit recommendations as well as those made by
the legislature
The SAI submits an annual report on its own performance to
Parliament and other key stakeholders
The Parliament or another oversight body appoints the SAI's
external auditors
60%
52%
60%
40%
48%
40%
48%
40%
60%
52%
2014 Independence & Legal Framework Detailed Strategic Imperative
Analysis
3 and above
Below 3

25 Strategic imperatives related to the five domains in ICBF
Despite the overall indicators showing that most SAIs are at level 3 in the independence and legal
framework domain the following observations derived from figure 9 are important to consider:
SAIs that indicated that they are at level 3 and above in determining their budgets include,
for example, Ethiopia, Rwanda, Sierra Leone, South Africa, South Sudan, Sudan, Tanzania,
Uganda and Zambia which is only 40% of the SAIs. 60% are below level 3, that is, the SAIs do
not independently determine and decide on their budget. The SAIs indicated that the
executive arm of their governments and not their national assemblies are still in control of
the determination their final budget figures before approval by their National Assemblies.
When it comes to administrative independence it can be observed that 52% of the SAIs are
below level 3 in making decisions on human resources matters such as recruitment,
remuneration and promotion. However, we have 48% of SAIs have sufficient administrative
independence of level 3 and above and these include, for example, Ethiopia, Kenya, Liberia,
Rwanda, Seychelles, Sierra Leone, South Africa, South Sudan, Sudan, Tanzania and Uganda.
Based on findings of quality assurance reviews carried out in 11 SAIs in 2014, it is our
considered view that more still need to be done for the regional SAIs to achieve sufficient
administrative independence.
Another observation is that 60% of the SAIs are below level 3 in ensuring that the SAI has an
effective follow-up mechanism on SAI audit recommendations as well as those made by the
legislature. However, some SAIs indicated that they are at level 3 and above and they
include Ghana, Malawi, Namibia, Rwanda, Sierra Leone, South Africa, Sudan, Tanzania and
Uganda. A robust follow-up mechanism for audit recommendations would ensure that
government is made to account fully for gaps identified during audits.
When it comes to submission of the SAI’s own performance report annually a significant
number of SAIs comprising 40% are at below level 3. In other words we still have a number
of SAIs that are not adequately reporting on their own performance to Parliament and other
key stakeholders by way of publishing their annual performance report. Examples, of those
SAIs that responded that they were at level 3 and above include: Ethiopia, The Gambia,
Ghana, Kenya, Liberia, Malawi, Mauritius, Rwanda, Seychelles, Sierra Leone, South Africa,
Sudan, Tanzania, Uganda and Zambia. However, from this group of SAIs it was not clear how
many of the same SAIs publish the same performance reports.
It is encouraging to note that more than half of the SAIs have Parliament or another
oversight body appointing external auditors to audit their annual financial statements. SAIs
that are at level 3 and above comprise Ethiopia, The Gambia, Ghana, Kenya, Malawi,
Rwanda, Seychelles, Sierra Leone, South Africa, South Sudan, Tanzania, Uganda and
Transversal Activity Report 2014
26
Zimbabwe. But, there is still 48% of SAIs who are auditing their own annual financial
statements.
The above observations reveal that the main challenges facing SAIs is the operationalization of their
independence, mostly financial autonomy and administrative independence.
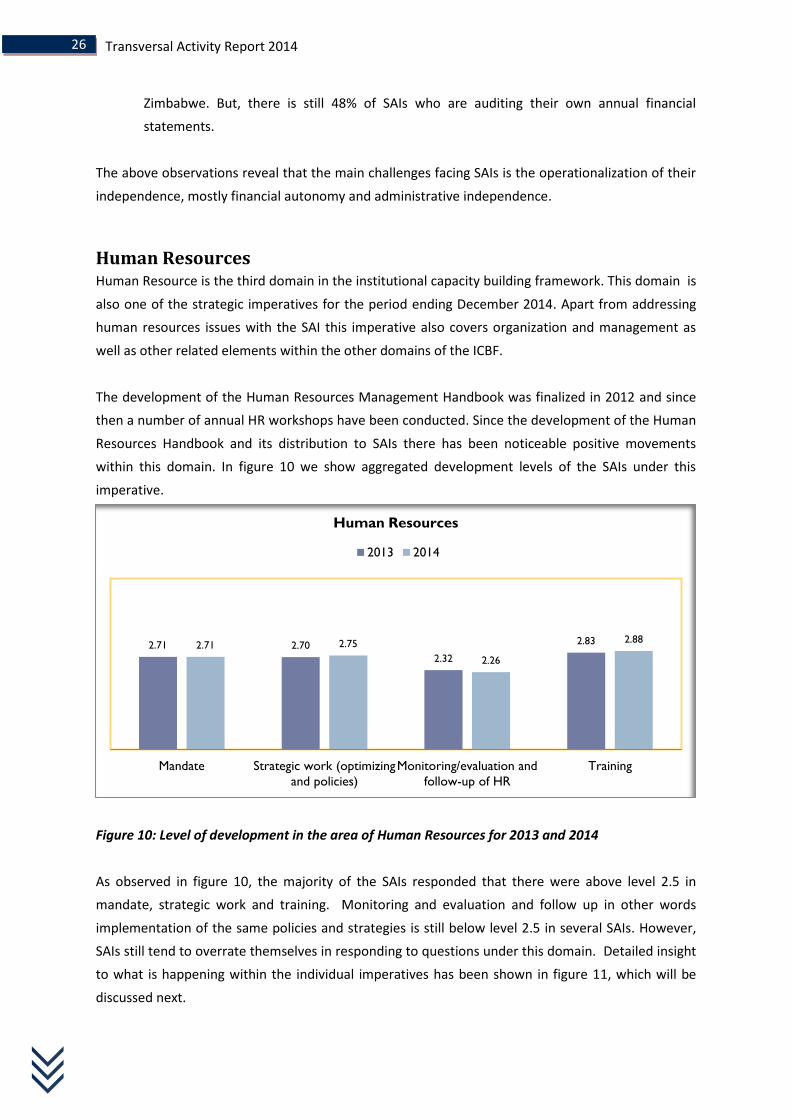
Human Resources Human Resource is the third domain in the institutional capacity building framework. This domain is
also one of the strategic imperatives for the period ending December 2014. Apart from addressing
human resources issues with the SAI this imperative also covers organization and management as
well as other related elements within the other domains of the ICBF.
The development of the Human Resources Management Handbook was finalized in 2012 and since
then a number of annual HR workshops have been conducted. Since the development of the Human
Resources Handbook and its distribution to SAIs there has been noticeable positive movements
within this domain. In figure 10 we show aggregated development levels of the SAIs under this
imperative.
Figure 10: Level of development in the area of Human Resources for 2013 and 2014
As observed in figure 10, the majority of the SAIs responded that there were above level 2.5 in
mandate, strategic work and training. Monitoring and evaluation and follow up in other words
implementation of the same policies and strategies is still below level 2.5 in several SAIs. However,
SAIs still tend to overrate themselves in responding to questions under this domain. Detailed insight
to what is happening within the individual imperatives has been shown in figure 11, which will be
discussed next.
2.71 2.70
2.32
2.83 2.71 2.75
2.26
2.88
Mandate Strategic work (optimizing
and policies)
Monitoring/evaluation and
follow-up of HR
Training
Human Resources
2013 2014

27 Strategic imperatives related to the five domains in ICBF
Figure 11: Analysis of selected questions under the Human Resources Strategic Imperative for 2014
60% of SAIs are below level 3 in implementing a monitoring and evaluation system of the different
aspects of training and results achieved. SAIs that are at level 3 and above in this area include
Eritrea, Ghana, Malawi, Rwanda, Sierra Leone, South Africa, Sudan, Tanzania and Zimbabwe.
When it comes to the SAIs managing their performance appraisal systems in accordance with
international standards and good practices, 56% of them responded that they were below level 3.
On the other hand, 44% of the of the SAIs responded that they were at level 3 and above and they
include; Kenya, Malawi, Mauritius, Rwanda, Seychelles, Sierra Leone, South Africa, South Sudan,
Tanzania and Zambia. Again there appears that some SAIs were assessing themselves higher than
what an independent quality assurance review would indicate. However, it is encouraging to observe
that SAIs responded that setting up of robust and effective performance management systems was
fundamental for the effective development of their human resources.
When responding to the question of establishing human resource policies including provisions of
remuneration of staff based on performance, a few SAIs responded that there were at level 3 and
above. For example only seven SAIs responded that they had achieved level 3 and above and these
include; Malawi, Namibia, Rwanda, Sierra Leone, South Africa, South Sudan and Tanzania. The
majority of SAI responded that they were at below level 3. This observation has also been noted on
the independence domain that most SAIs had no full control of recruitment and remuneration of
staff in their SAIs. As such it may be logical that 68% of SAIs are below level 3 in implementing a
monitoring and evaluation system of the various aspects of the Human Resource development
policies.
0% 10% 20% 30% 40% 50% 60% 70% 80% 90% 100%
The SAI has implemented a Human Resource policy in line with bestpractice including provisions for remuneration of staff based on
performance
The SAI has implemented a monitoring and evaluation system of thedifferent aspects of a Human Resource development policy
The SAI is managing its performance appraisal system in accordancewith international standards and good practice
The SAI has implemented a monitoring and evaluation system of thedifferent aspects of training and results achieved
64%
68%
56%
60%
36%
32%
44%
40%
2014 Detailed Analysis of some selected questions on development of
Human Resources
(Not Implemented) Below 3 (Implemented)3 and above

Transversal Activity Report 2014
28
Further, analysis in terms of the functions that HR is responsible over as to their coordinative and
facilitative roles within the SAI reveals the need for more work to be done to reach the desired
levels. For example, two selected questions provide some insight into what is happening in SAIs.
These are captured in figure 12 with the main focus being in two areas of time recording systems
and organization development strategies.
Figure 12: SAI that have put in place effective time recording systems and organization
development policies
It should be noted that 68% of the SAIs are below level 3 in implementing a time recording system to
enable reporting on cost of staff. SAIs that indicated they are above level 3 and above in this area
include, for example, Eritrea, Mauritius, Namibia, Seychelles, South Africa and South Sudan. Further,
from the general questions SAIs were asked to rate themselves on whether they cost their audits.
From the responses only 32% of the SAIs responded that they were above level 3 in implementing a
time recording system enabling reporting on costs of staff and audits and these include, for instance,
Ghana, Malawi, Rwanda, South Africa, Sudan, Tanzania, Uganda, Zambia and Zimbabwe are at level
3 and above. However, results of the quality assurance support visits in this area showed that most
SAIs still need to set up effective time recording systems that would enable the costing of audits.
Another important point to consider is that 56% of the SAIs responded that they were below level 3
in terms of having implemented an organizational development plan or policies. SAIs that were at
level 3 and above include Ethiopia, Ghana, Kenya, Malawi, Mozambique, Namibia, Sierra Leone,
South Africa, Tanzania and Zimbabwe. However, when compared against the results of quality
0% 10% 20% 30% 40% 50% 60% 70% 80% 90%100%
The SAI has an organizational development(OD) plan/policy in place
The SAI has implemented a time recordingsystem, which enables reporting on costs of
staff
56%
68%
44%
32%
2014:SAIs that have Effective Time Recording Systems and
Organisation Development Policies
(Not fully implemented) Below 3
(Fully implemented) 3 and above

29 Strategic imperatives related to the five domains in ICBF
assurance support visits this assessment seem to be in line with the SAIs’ assessments. Another
important dimension under this domain is the development of managers within member SAIs
Management Development
Management development is one of the important factors that affect the transformation of a SAI’s
capacity to capability. After realizing the leadership and management gaps that was present in SAIs
AFROSAI-E and IDI cooperated in designing and implementing the Management Development
Programme (MDP) in 2009. This programme has become part of the AFROSAI-E capacity building
tools in SAIs. Figure 13 shows the development levels of SAIs in terms of setting up structures and
programmes for the development of their managers.
Figure 13: Developments in the area of Management Development for 2013 and 2014
As can be seen in figure 13 there has been progress in the development of clear mandates,
organizational cultures, programme systems and procedures and audit related management
development. Although the development level of SAIs within the planning dimension is still below
level several 3, SAIs responded that they have set localized MDPs for development of their current
and future managers.
The foregoing developments on human resource and management development could be an
indication that the presence of a Management Development Programme is important to enhance
performance in this strategic imperative. Results from the 2014 survey a show that 52% of SAIs have
some MDP in place whilst 48% still need more assistance in to develop their managers as is shown in
figure 14.
3.23 3.06
2.38 2.64
3.04 3.33
2.96
2.47 2.71
2.92
Mandate Organizational
Culture
Planning Programs/Systems Audit Related
Management
Management Development
2013 2014

Transversal Activity Report 2014
30
Figure 14: Presence of a specific management development programme
As shown in figure 14, 52% of the SAIs are below level 3 in the implementation of a specific
management development programmes in accordance with international standards and good
practice. For instance, SAIs that responded being at level 3 and above comprise Eritrea, Ethiopia,
Malawi, Namibia, Nigeria, Rwanda, South Africa, Tanzania, Uganda, Zambia and Zimbabwe.
However, considering the results of quality assurance support visits in some of the countries
mentioned there were no specific evidence produced during the reviews to prove the existence of
specific management development programmes within some of the countries.
Quality Assurance Quality assurance is one of the strategic imperatives that can be looked upon as an area of strategic
focus within the domain of audit standards and methodology and the other four domains. The fairly
low score (24%) for quality assurance shown in table 4 has been analysed further. As can be seen,
the average score given is only 24% of the SAIs – the same if all 25 SAIs are taken into consideration
– had passed level 3. The score is compiled out of a number of questions. Development levels of the
SAIs on this imperative since 2012 to 2014 is summarized in figure 15.
52%
48%
The SAI has a specific management development program (MDP) in
place in accordance with international standards and good practice
(No) Below 3
(Yes) 3 and above

31 Strategic imperatives related to the five domains in ICBF
These questions cover different parts of quality aspects including quality in IT and questions about
peer reviews. However, the IT issues are part of the strategic imperative of Use of IT in Audit and
have thus been taken into consideration within two of the imperatives. This has pulled down the
result for quality assurance in a noticeable way. Recalculating the numbers by taking out the
questions2 for quality concerning IT will thereby give a higher score on quality assurance, which
better corresponds to the efforts put into this imperative.
In figure 15 there is a notable improvement on the number of SAIs on level three and above on
quality assurance levels in 2014, with 24% of the SAIs on level 3 and above. This can be explained by
the significant drop on the number of SAIs on level 2.5 and above with 56% of the SAIs on this level
down from 67% in 2013.
From the questionnaire the questions on quality and mainly on quality control and not on quality
assurance have been extracted. In figures 16 and 17 the scores on quality control measures in place
for regularity audit and performance audit can be seen.
The result shows that 58% of the SAIs have implemented quality control measures for regularity
audit and 46% of the SAIs for performance audit. The number is an average from four key questions
on quality control for both regularity audit and performance audit.
2 The questions for the quality assurance imperative and the changes are attached in appendix 3
25%
63%
17%
67%
24%
56%
0%
10%
20%
30%
40%
50%
60%
70%
Percentage of SAIs on level 3 and
above
Percentage of SAIs on level 2.5 and
above
Quality assurance levels based on assorted questions
2012
2013
2014
Figure 15: Quality Assurance Level calculated on a subset of the original quality assurance questions in the self-assessment questionnaire. The percentage is based on the number of SAIs, taken all 25 into consideration, that have reached level 3 and higher or respectively level 2.5 or higher[note that estimates were used for Angola and Mozambique based on 2013 figures].

Transversal Activity Report 2014
32
In order to improve the quality of the actual audits well-developed quality control systems need to
be in place. Part of such systems require the development and implementation of robust quality
control measures for the SAIs to be able to continuously follow up on the improvements, identify
possible gaps, strengths and weaknesses and design strategies that address the gaps and
weaknesses.
Eleven quality assurance reviews visits were made by the AFROSAI-E secretariat during 2014.
Comparing the rating for 10 key issues – as another subset of questions in the self-assessment
questionnaire3 – with the rating in the quality assurance reviews, the tendency to rate oneself higher
than an external reviewer would is seen. However, it must also be said that the majority of the
ratings are on the same level for the self-assessment and the external reviews. Table 5 shows a
comparison between the ratings done by the eleven SAIs and results of quality assurance support
visits reports by AFROSAI-E.
SELF ASSESSED LEVELS OF 11 SAIS COMPARED WITH THE RESULTS OF QA REPORTS 2014
Table 5: A number of 11 SAIs in the region were subject to quality assurance visits by AFROSAI-E during 2014. The table
shows the difference between the maturity level in accordance to the quality assurance report on the one hand and the
SAIs own self assessed rating in the self-assessment questionnaire for 2014.
The result in table 5 shows that the insight and understanding of the actual development stage in
the SAIs on a general level corresponds well to what is interpreted from an external perspective,
thus providing an opportunity for a better prerequisite for further development. This result is also in
line with the aforementioned interpretation of the stabilization for the scoring on the aggregated
general level for the domains and strategic imperatives; though one needs to note that there are still
some few SAIs that tend to overrate themselves.
3 The questions compared with the quality assurance visits are attached in appendix 4
Comparison between the SAIs self assessed level on a number of relevant questions in the questionnaire and the SAI’s level according to the QA reports for year 2014
QUESTION 1 2 3 4 5 6 7 8 9 10 Total %
Self assessed level is higher than in QA report
5 4 3 1 1 3 1 1 2 3 24 23%
Self assessed level is equal to QA report
5 6 7 9 8 7 9 8 8 8 75 75%
Self assessed level is lower than in QA report
0 0 0 0 1 0 0 1 0 0 2 2%

33 Strategic imperatives related to the five domains in ICBF
Looking at quality assurance from the perspective of regularity audit from 2012 to 2014, the results
over the years are shown in figure 16.
Figure 16: Quality assurance from the perspective of regularity audit
From the figure 16 it is apparent that SAIs have improved in the development of manuals and quality
control measures but more needs to be done in follow –up of recommendations, where there has
been a significant drop from 2013 at level 2.33 to level 2.26 in 2014. This is similar to the
observations made when discussing the independence imperative, where most SAIs did not have
follow-up of audit recommendation mechanisms in place. A detailed analysis relating to the
development of quality control aspects in regularity audits is given in Figure 17
Figure 17: Quality assurance from the perspective of regularity audit
3.43
2.99 2.65
2.44
3.54
2.95 2.69
2.33
3.57
3.04 2.79
2.26
Mandate Manual Quality Control Follow-Up
Main aspects of Regularity Audit
2012 2013 2014
0% 20% 40% 60% 80% 100%
The SAI reports to Parliament on the
implementation status of the PAC
recommendations
The SAI has an overall annual audit plan coveringactivity plans for regularity audits
56%
36%
44%
64%
Quality Control Aspects in Regularity Audit
(No) Below 3
(Yes) 3 and above

Transversal Activity Report 2014
34
Figure 17 above shows the development of quality control and assurancein the the regularity audit
discipline. 64% of the SAI responded that they have developed and implemented an overall annual
planning mechanism for planning and executing regularity audits that is monitored at the top
management level. However, when it concerns the monitoring of PAC recommendations only 44%
responded that they have a mechanism in place.
The developments and quality assurance perspective for performance audit will be discussed with
performance audit which is an independent strategic imperative.
Performance Audit The performance audit strategic imperative can also be seen as a focal point within the domain for
audit standards and methodology as mentioned earlier. There has been evident development of
performance audit in the region as seen by the increase in the number of performance auditors and
performance audit reports issued in the region. For example, figure 18 shows the results of
development levels of SAIs within this imperative from 2012 to 2014.
Figure 18: Four dimensions of how far the development of Performance Audit has come. The dimensions are based on different clusters of the performance audit questions in the self-assessment questionnaire for 2014 (23 responding SAIs)
The performance on this imperative as shown in figures 18 above show that while there is a
notable improvement on the manuals and quality control and mandate with scores being above
level 2.5, setting up of effective follow-up mechanism and monitoring the effective implementation
of quality control measures still remain a challenge over the period under review as the average
score is far away below level 2.5.
A more detailed presentation on the challenging areas in this imperative is detailed in figure 19.
3.29 2.69 2.54
1.81
3.38
2.59 2.44 1.85
3.38 2.67 2.52
2.08
Mandate Manual Quality Control Follow-Up mechanism of
recommendations
Performance Audit
2012 2013 2014

35 Strategic imperatives related to the five domains in ICBF
Figure 19: Quality Control in Performance Audit: Detailed analysis of three selected questions
40% of the SAIs responded that they had achieved level 3 and above when it comes to implementing
quality control measures for performance audit in the area of planning and specifying type of
reviews, their nature and scope. These SAIs include Botswana, Kenya, Lesotho, Malawi, Namibia,
Rwanda, South Africa, Tanzania and Uganda.
When it comes to definition of roles and responsibilities in performance audit, 64% of the SAIs are
below level 3. The ones above level 3 comprising 36% of the SAIs are among others Ethiopia, Kenya,
Lesotho, Malawi, Rwanda, Sierra Leone, South Africa, Tanzania and Uganda.
32% of the SAIs have achieved level 3 and above on implementing quality control measures like
policies and procedures for performance audit. Examples of such SAIs are Ethiopia, Kenya, Lesotho,
Malawi, Rwanda, South Africa, Tanzania and Uganda. This an important achievement though there is
still have more SAIs that are at below level 3. This may be attributed to the fact that performance
audit is still relatively new in the region compared to regularity audit. There is, therefore, need for
more developemt interventions by both SAIs and the Secretariat to ensure full development and
implementation of ISSAI compliant performance audit quality control measures.
Looking at the responses on some key questions on performance audit imperative shows how
different SAIs responded across the set of questions as shown in table 6.
0% 10% 20% 30% 40% 50% 60% 70% 80% 90%100%
The SAI has implemented quality control measures for
performance audit when it comes to SAI policy and
procedures
The SAI has implemented quality control measures for
performance audit when it comes to definition of roles and
responsibilities
The SAI has implemented quality control measures for
performance audit when it comes to specification and
planning of type of review, including nature, scope and
frequency
68%
64%
60%
32%
36%
40%
DETAILED ANALYSIS ON SELECTED QUESTIONS RELATING TO THE DEVELOPMENT OF PERFORMENCE AUDIT
(No) Below 3
(Yes) 3 and above

Transversal Activity Report 2014
36
Comparison of the response pattern to key questions on performance audit
QUESTIONS Yes No n/a-n/r
N % N % N %
The performance audit reports are issued and made public 16 73% 4 18% 2 9%
The SAI submits performance audit reports for tabling in parliament
14 64% 5 23% 3 13%
The SAI support the preparations and deliberations of performance audit reports in parliamentary committees and participate on a management level in meetings all as agreed with PAC
14 64% 5 23% 3 13%
Table 6: Comparison of the response pattern to key questions on performance audit (based on the 23 responding SAIs)
It is understood that timespan for carrying out and finalizing a performance audit report is important
as it will depict how long it has taken from a pre-study to the publishing of the actual report as well
as affect the quality and relevance of the findings in the report. Thus, it is important to see a
comparative analysis of how the SAIs responded in this area in the Table 7.
It encouraging that more than 50% of the SAIs now take up to one year to finalise and publish a
performance audit. On the other hand we have 6(24%) SAIs responding that they take between one
and above 3 years to complete and publish a performance audit. The delay to finalise performance
audits may be attributed to shortage of skilled and experienced auditors, lack of financial resources
as well as inadequate management support due to capacity constraints.
For the strategic period under review, the targeted number of fulltime performance auditors in the
region by December 2014 was set at 500. It is encouraging that in the feedback from SAIs there were
498 fulltime performance auditors. Clearly, the target in the number of auditors has been achieved
and what remains is the setting up of systems and structures for ensuring improved quality,
timeliness and frequency of performance audits carried out in the region.
Use of IT in Audit The strategic imperative on IT in audit falls under the audit standards and methodology domain but
is an independent strategic imperative. However, it is also cross cutting among all the other
2014 Time for performance audit reports from the start of a pre-study to the AG’s signature
TIME SPAN NUMBER OF SAIs
Up to 1 year 13
Between 1 and 1,5 years 3
Between 2 and 3 years 1
Above 2
Not applicable 6
Table 7: Time for finalization of performance audit reports [note that estimates were used for Angola and
Mozambique based on 2013 figures].

37 Strategic imperatives related to the five domains in ICBF
domains. This is an emerging area as the AFROSAI-E secretariat consults and engages with SAIs in the
region. The special focus here is the implementation of IT tools such as electronic working papers
and computer assisted audit techniques (CAATS) among others.
First, related to audit of IT, there was a general question that required SAIs to indicate the platform
used by their country to run the government’s Integrated Financial Management Information
System (IFMIS). This information is detailed in figure 20.
Fig 20: IFMIS platform used in countries of the 25 member SAIs
The assessment of government IFMIS in the region as shown in figure 20 reveals that 40% (11) of
the countries use Oracle platform, 8% (2) use SAP and 16% (4) are on EPICOR whereas 32% did not
rate their country IFMIS platform. This information is important to secretariat for designing and
delivering IT capacity building solutions in the region.
The development levels in the IT imperative scored marginal movements. For example, in figure 21
during the 2010-2014 strategic period; the assessed three years 2012 to 2014 posted a steady
incremental developments of IT in audits in members SAIs.
40%
8% 16%
32%
4%
What platform does the government integrated financial management
system (IFMIS) run on?
ORACLE
SAP
EPICOR
OTHER
NOT RATED

Transversal Activity Report 2014
38
Figure 21: Development levels in IT, carrying out of IT audits and use of IT tools in audits
As observed from figure 21 there is a gradual but steady rise on all three aspects of this strategic
imperative. Apart from IT tools used in audits which is approaching level 2.5, IT strategy and IT
audits are yet to get to level 2.5. Although there is encouraging movement under this imperative
more still needs to be done by SAIs in leveraging IT in their audits given the innovative opportunities
that IT development can afford to SAIs in developing countries. This can be seen if we focus on
analyzing developments within areas of selecting questions as shown in figure 22.
Figure 22: Use of IT/IS in audit in 2014: Development levels for four selected questions
From figure 22, there is an indication that 52% of the SAIs are at level 3 and above in the use of
Computer Assisted Audit Techniques (CAATS). SAI that responded that there are at level 3 and above
include Botswana, Ethiopia, Mauritius, Namibia, Rwanda, Seychelles, South Africa, Tanzania,
Uganda, Zambia and Zimbabwe. However, it should be noted that based on quality assurance
2.34 2.34
1.87 2.21
2.39
1.92
2.39 2.47
1.89
IT strategy IT tools used in audits IT audits
IT in Audit
2012 2013 2014
0% 10% 20% 30% 40% 50% 60% 70% 80% 90%100%
The SAI has developed an IT/IS audit strategy forits IT/IS audits
The SAI has an IT support function with at leastone (1) IT person for evety 30 staff members
The SAI is using tools such as electronic working
papers
The SAI is using tools such as computer assistedaudit techniques (CAATS)
60%
64%
60%
52%
40%
36%
40%
48%
IT Development levels based on selected questions
Below 3 (No)
3 and Above (Yes)

39 Strategic imperatives related to the five domains in ICBF
support visits under this area, some of the countries appear to have over assessed themselves given
the evidence contained in the particular quality assurance reports sent to the SAIs
On the other hand, 40% of the SAIs responded that they were at level 3 and above in the use of
electronic working papers. Among these SAIs are Botswana, Ethiopia, Mauritius, Namibia, Rwanda,
South Africa, Swaziland, Tanzania and Uganda. Again some SAIs under this group appear to have
over rated themselves as still more needs to be done before they get to level three
64% of the SAIs indicated that they were below level 3 in having an IT support function with at least
one IT person for every 30 staff members. SAIs that responded that they were at level 3 and above
include, for example, Eritrea, Ethiopia, Kenya, Liberia, Malawi, South Africa, Namibia, Tanzania and
Zambia.
Communication
Communication is the fifth domain in the ICBF and the sixth strategic imperative described in this
report. Performance in this strategic imperative over the last two years is shared in figure 21.
Figure 23: Development levels within the communication & stakeholders’ management strategic
imperative 2013 and 2014
As noted from figure 21, we have all the key aspects of communication being responded to as at
level 2.5 and above especially for the year 2013 and 2014. This is partly attributed to such key
interventions like the SAI/PAC rollout programme and the regional communication workshops. It
appears there is awareness among SAIs that communication is fundamental in their development.
Such developments are encouraging as it provides the necessary impetus for SAIs to achieve the
targeted level 3 of the ICBF. However, based on the results of quality assurance support visits
assessment there is a general tendency to overate themselves under this domain. This has been
corroborated by SAIs who commented that there is more that need to be done to develop and
3.19
2.74 2.66
3.08 2.96 2.67
3.35
2.65 2.63
3.08 3.00
2.58
Mandate Strategies/policies Practicies (regular,channels and ad hoc)
Internalcommunicaiton
system
User friendliness Promotion of SAI
Communication
2013 2014

Transversal Activity Report 2014
40
implement communication, policies/ strategies and systems in the area of internal communication,
media communication and communication with the legislature.
Detailed development on identified challenging areas is captured to enable the appreciation of the
required developments to achieve level 3 and above. Figure 23 has this information.
Figure 23: Detailed analysis of selected questions within the communication and stakeholder
management strategic imperative
68% of SAIs are below level 3 in participating in workshops and seminars to promote the SAI via
academic institutions. 32% of the SAIs which include Kenya, Mauritius, South Sudan, Tanzania,
Uganda and Zambia indicated that they had achieved level 3 and above.
However, only 48% of the SAIs have achieved level 3 and above when it comes to implementing their
own communication policies and strategies. 52% responded that they were at level 2 and below.
Interestingly, the same has been observed under the HR imperatives in terms of none
implementation of HR plans, policies and procedures. It appears SAIs are facing challenges when it
comes to monitoring the implementation of their own policies and procedures.
GENERAL PERFORMANCE OF THE SAIs
New focus areas In the 2014 questionnaire, questions were also included to gather baseline information on new focus
areas. There are six new focus areas, namely, audit of performance information, audit of budgets,
audit of extractive industries, professionalization programme, development of SAI innovation
frameworks, and the executive leadership development programme that could provide details on
the six new top strategic imperatives. The details of the responses are provided in figure 24
0% 10% 20% 30% 40% 50% 60% 70% 80% 90%100%
The SAI has implemented a communication policy andstrategy based on stakeholder analysis (including
prioritization)
The SAI has implemented a communication policy andstrategy based on GAP analysis considerations
The SAI has implemented participation inworkshops/seminars to promote the SAI via academic
institutions
52%
52%
68%
48%
48%
32%
DETAILED ANALYSIS OF SELECTED QUESTIONS UNDER COMMUNICATION & STAKEHOLDER MANAGEMENT DETAILED ANALYSIS
(No) Below 3
(Yes) 3 and above

41 GENERAL PERFORMANCE OF THE SAIs
Figure 24: New focus areas for SAI development
On an institutional perspective, SAIs specified high demand for the building of adequate capacity in
the area of leadership development, innovation and professionalization of accountancy in the public
sector. Figure 24 show the details with the highest needs being in the development of innovation
frameworks as part of SAIs’ organizational development initiatives.
When it relates to carrying out audits in various subject areas within the SAI’s mandate we observed
material interest being raised by SAIs for the development of necessary capacity. For instance, in
figure 24, we noted that 24% of the SAIs responded that they were at level 3 and above in carrying
out audits of performance information. Majority of the SAIs, that is, 76% of them, are below level 3.
Some of the SAIs with level 3 and above responses on performance information include; Malawi,
Rwanda, South Africa, Sudan, Tanzania and Uganda.
On whether the SAI carries out audits of the budget, 60% of the SAIs indicated a general response of
level 3 and above but with comments be raised regarding absence of mandate for the SAIs to audit
the budget process. This area may need awareness interventions to help SAI promote and prioritise
the audit of the budgets processes and execution, monitoring and reporting.
There is a high demand on the audit of extractive industries among SAIs. However, comments were
raised as to the need for building adequate capacity and selection of critical sectors that will
demonstrate value and benefits of SAIs. Currently, only a small number of SAIs carry out audits of
extractive industries on a limited basis as shown by responses of 20% of the SAIs indicating that they
are at level 3 and above.
0% 10% 20% 30% 40% 50% 60% 70% 80% 90% 100%
The SAI carries out audits of extractive industries
The SAI carries out audits of the budget(s)
The SAI carries out audits of performance information
The SAI has identified the need for the establishment
public sector professional accountancy organisation for
the training of public sector accountancs and auditors
The SAI has identified the need for the development and
implementation of a SAI innovation framework based on
the use of IT has strategic area, audit innovation and…
The SAI has identified, designed and implemented a
leadership development programme targeting all levels of
its management.
80%
40%
76%
56%
76%
60%
20%
60%
24%
44%
24%
40%
ASSESSMENT OF NEW FOCUS AREAS
3 and above (Yes)
Below 3 (No)

Transversal Activity Report 2014
42
Timeliness and audit coverage Timeliness in the submission of audit reports and coverage of audits have been identified as needing
improvement during the strategic period under review. Although the questions used in the surveys
during this strategic period were not directly related to ICBF framework, they were used because it
was found important to include the questions in the survey for purposes of interpreting the status of
development in the region.
Time for tabling audit reports is not only dependent on the date of submission of the reports to the
legislature but it also paints a picture of how well the public financial management system works as
well as how the SAI itself works. As such the parameters have been expanded to ensure
compatibility with the requirements of PEFA indicators on the scope, nature and follow-up of
external audits4. According to the PEFA indicator number 26, level C, twelve months is the limit for
audit reports to be submitted to the legislature.
Figure 25: Regularity audits completed on time versus those that did not comply in 2014
As has been observed since the 2011 activity report there has been incremental improvement in
timeliness of submission of audits reports by SAIs in the region. For example, for the year 2014 of
the 14963 audits; 11929 (80%) audits were completed and finalized within the prescribed legal
timeframes against non-compliance of 3034 (20%) as shown in figure 25. The reasons for none
compliance were various, for instance; shortage of staff and funds, non-submission of the financial
statements by auditees, late submission by the same and others. On the other hand, SAIs also
44
The indicator was developed by PEFA, a multi-agency partnership sponsored by among others the World Bank, the European Commission and DFID; PEFA – Public Expenditure and Financial Accountability
0 2000 4000 6000 8000 10000 12000 14000
Please state the number of financial (regularity) auditscompleted during 2014
Please state the number of financial (regularity) audits notcompleted in the prescribed timeframe
%age # of Reg Audits not completed in prescribed time overReg. Audits Completed in 2014
12459
3205
26%
Regularity Audits Not completed within prescribed time vs completed
No. of Audits

43 GENERAL PERFORMANCE OF THE SAIs
attributed the reasons for not attainment of 100% audit coverage to budgetary and staff constraints;
and capacity limitations as well limiting legislative instruments.
Size and composition of audit staff
Over the period 2009 to 2014 the region has experienced increases in the number of its auditors. As
can be seen in figure 26, the majority of audit staff in SAIs within the three audit streams were
about 93% of them being regularity auditors, while 5% of them are performance auditors and
approximately 2% of them being IT auditors. This can be explained by the historical realities of
auditing being regularity/ financial in the region. Of course, the challenge is to grow the number of
auditors in the other audit disciplines.
Figure 26: The number of regularity, performance and IT auditors in the region
As noted from the above graph, there is a steady increase in the number of regularity auditors over
the years, with a slight drop in 2014 that can be explained by SAI Nigeria who lowered their 2014
figures after revision. The number of performance auditors is increasing at a fairly steady rate over
the years with the number of IT auditors lagging behind. As earlier noted, the number of
performance and IT auditors are still few as compared to regularity auditors. To reach level 3, a SAI
has to have a performance audit unit of at least 10 performance auditors, while for IT, it is not
defined. In smaller SAIs, the numbers might be lower so long as it is a significant percentage of the
total number of auditors. Detailed information about individual SAIs is disclosed in appendix 5.
Financial Resourcing of SAIs Financial resourcing of most SAIs in the region is still dependent on government budgetary
allocations with the executive wielding great influence on the size, amount and classification of their
budgets. Out of the 23 SAIs who responded to the survey, three SAIs did not submit information
about their own as well as their countries’ national budgets figures. The total of the national budgets
of the 20 countries who responded amounts to an equivalent figure of US$293,3 billion. The total of
0
3000
6000
9000
12000
2009 2010 2011 2012 2013 2014
IT Auditors 57 134 132 204 228 221
Performance Auditors 253 384 332 375 465 494
Regularity Auditors 4677 8095 8366 8522 9409 9231
Num
ber
of A
uditors
COMPOSITION OF AUDITORS IN THE REGION - TREND 2009 -2014

Transversal Activity Report 2014
44
the SAI budgets in these countries amount to $595,8 million representing an average 0.00203%
against the total national budget. A well-resourced SAI such as South Africa has a ratio of 0.0002
against their national budget. It can therefore be concluded that a ratio of 0.0002% could be
accepted as a regional benchmark. Using this benchmark as a mid-point the results of the survey can
be presented as follows in table 8;
Number of
Countries
Percentage of SAI Budget as a
Ratio of the National Budget
Benchmark Ratio Deviation from the
Benchmark
10 0.001 0.002 -0.001
4 0.002 0.002 -
2 0.003 0.002 +0.001
3 0.004 0.002 +0.002
1 0.011 0.002 +0.009
Table 8: Comparison of 20 SAI budgets as percentages of national budgets against the 0.002% benchmark
As can be seen in table 8 during the 2014 financial year the calculated ratio of the SAIs budgets
compared with the national budgets show that 10 (50%) of the SAIs has a ratio of 0.001% below the
0.002% benchmark. Only four (20%) SAIs achieved the 0.002% benchmark of a well-resourced SAI.
The other 6 (30%) SAIs had their budgets above the benchmark. It important to note that our further
analysis reveal that those SAIs who were on or above the benchmark also included in the budgets
abnormal items like construction of office buildings and acquisition of capital equipment like vehicles
which are generally considered to be once off budget items. It can generally be concluded that a big
number of SAIs (above 50%) in the region are under-funded. As such strategies need to be
developed to close the funding gaps. This would assist SAIs to achieve their development goals
within a shorter period. This was also corroborated by comments from the SAIs who pointed out
that lack of operational financial independence in most SAIs significantly limits their ability to
effectively fund strategic development projects.

45 CONCLUSIONS
CHAPTER 6
CONCLUSIONS The AFROSAI-E Institutional Capacity Development Framework (ICBF) covers the different elements
that have to be taken into consideration when establishing and developing a sustainable SAI. The
framework is divided into five domains, which all have a number of elements and five development
levels. The different domains are covered by the questionnaire that was sent out to the member
SAIs in the region. When compiling the report some of the elements have been highlighted and
others have been left out. The objective is to analyse and discuss in more detail the key outstanding
issues observed in this year’s survey, so as to paint a clearer picture of areas that still need more
attention beyond 2014.
Generally, the results in this year’s report show that the responses are being stabilized. This in turn
shows that the self-awareness of the situation also is interpreted in a more consistent way between
the years, which is good. This enhances the possibility to prepare for development in a more
efficient and effective way. However, there are still some areas; though few, where SAIs over rated
themselves, especially in the area of organization and management, human resources and
communication.
Progress seen in the strategic areas for 2014
In the previous activity report, there was a feeling that there should be a broad alignment between
the strategic and operational levels. The improvements observed in the previous year also
highlighted the need to develop communication strategies; the need to develop strategies for
planning and managing financial and human resources; the need to develop quality assurance
strategies; the need to develop performance audit; and the need to analyze the reasons for deficient
timeliness in reporting. It is satisfying to note that there has been further good improvement in this
year’s report. Generally, it is concluded that there has been good progress in the member SAIs
during the strategic period under review.
Compared with 2013, the work of SAIs on the strategic and operational levels reveal that the weak
link seems to be on the operational/business planning level; and the ability of SAIs to clearly link the
operations to their strategic plans. In our view this observation raises several different questions
because there are different dimensions and reasons that can be used to explain the differences. For
instance, in the domain of independence and the legal framework of SAIs the weak link has been
observed to be in the slow progress in operationalizing SAIs’ legal framework that include the setting
up of robust follow-up of audit recommendations mechanisms and annual reporting on SAIs’
performance in the public arena.
Early on during this strategic period it has been observed that on a strategic level, SAIs were well
developed but there was a gap between the strategic level and the operational level . In most SAIs
the challenge is on the implementation of the strategic plans. In our view this gap still need to be

Transversal Activity Report 2014
46
closed. However, it is accepted that there are different explanations on the reasons for this gap
which may include; lack of effective monitoring and evaluation mechanisms on the implementation
of what has been planned; strategic and operational plans that do not communicate effectively with
each other; cultural factors aspects such as the manner in which superiors communicate with
subordinates and vice versa can explain the possible dysfunctional communication between
managers and their subordinates. Thus, we emphasise the importance of appreciating that good
internal communication at the strategic level is as important as the need for both managers and
organizational staff to understand what to do in the rest of the organization. This may require the
establishment of comprehensive management and leadership development programmes that
addresses both the development of the organizational systems and structures as well management.
Consequently, the recommendations on communication and management development raised in
the previous year are still relevant.
CONCLUSIONS AND WAY FORWARD
The observations and conclusuions in this report are focused on assisting SAIs achieve their desired
development levels in view of the 2010-2014 strategic imperatives and the new 2015-2019
imperatives. It should be observed that the 2014 activity report just like the 2013 report also
addresses the need for SAIs to ensure alignment between their strategic and operational level
goals. As such all efforts required to drive the development of SAIs towards full achievement of level
three and above of the ICBF need to be continuous and in line with realities of the developmental
needs of each SAI.
As discussed in this report, the targeted goals that were set for this period were generally achieved
although there are still areas that require further development. On the other hand, if we look closely
into the underlying understanding of the different strategic imperatives, development is seen within
several lenses. Further, it is also seen that taking the SAIs that have reached the level of 2.5 or higher
the SAIs in the region seem to be heading towards the stipulated target.
Independence
Just like in the previous year, independence is the domain that shows the most stable figures. While
the area of legislative independence has experienced encouraging development, SAIs still have some
challenges in operationalizing their independence. Some of the challenges noted include; the area of
financial independence, recruitment and remuneration of staff, involvement of the executive in the
budgetary process, weak follow-up of audit recommendations mechanism, non-production and
failure to publish the SAI’s annual performance report.
The need to become independent from the executive is the most obvious. SAIs should, thus continue
to work for independence in practice and not only in legislation by lobbying both their primary and
47 CONCLUSIONS
secondary stakeholders. This is specifically important in relation to the executive. There may be need
to develop a toolkit in the region that would assist SAIs in this endeavor.
Human Resources
Human resource is the most important resource of any organization and as such the development of
the same cannot be overemphasized. The main focus of this imperative is the development and
implementation of effective policies and plans that are well aligned with strategic plans and with
best practices. Consequently, the development and establishment of performance management
systems that include talent management is fundamental in order to accelerate the achievement of
higher productivity levels for both the SAI and staff.
In this report it was observed that human resource as a strategic partner and facilitator of the SAI is
not well linked to other functions of the SAI. These weaker links however concern the human
resources management on an operational level like the lack of effective appraisal systems and
systems that encourages the staff to find, use, manage and share information, knowledge and skills.
Another weak link was on whether or not there is are specific management and leadership
development programmes in place that encourages the professionalization of the various SAI
disciplines. Thus, SAIs and the Secretariat should continue to develop and implement human
resource management tools to assist in the achievement of higher development levels. Secondly,
SAIs should continue to focus on the establishment of management and leadership development
programme to improve the capacity of their managers. Thirdly, SAIs also start to invest in the
professionalization of their staff in order to ensure the development of capable organisations.
Communication
Communication is crucial for the wellbeing of the SAI as it affects how the other four domains of the
ICBF are executed. This report shows that most SAIs are yet to effectively implement their
communication policies and strategies. It is however reassuring to note that most of the SAIs have
developed communication policies but the challenge is in the implementation. The following insights
are thus put forward;
Communication is always a crucial issue and the results in this year’s report show that in
relation to parliament especially the communication concerning reporting on own
performance and as part of that includes reporting on follow-up of recommendations needs
to be put into focus. There is need to further develop the external communication with
parliament (PAC) by capacitating the communication functions/units of SAIs.
The development of internal communication between the different organizational levels
should continue to be a focal area as means of ensuring better alignment of the strategic
and operational levels of staff. Consequently, SAIs should continue to prioritise the

Transversal Activity Report 2014
48
establishment of robust organizational communication structures and human relations to
ensure effective internal communication.
Quality Assurance
Setting up of robust quality control measures in the SAI assures and enhances the credibility and
reputation of the SAI’s audit services to its different stakeholders. It follows that the continuous
monitoring of the SAI’s quality control management system is important. On aggregate the
development level of quality assurance, though there has been good improvement, still needs to be
prioritized in the region. In other words, this is an area that needs to be focused continuously given
that the quality control aspects for the audit disciplines are evolving. For example, quality control
aspects of especially management and communication – apart from the audit disciplines – are also
necessary to focus before the SAI can achieve quality audit services. Quality Assurance is a
continuous work and there is still a need to focus on the quality assurance issues in the different
parts and levels of the SAIs
Performance Audit
Performance audit is a relatively new discipline, especially for some of the countries in the regions
and thus still needs to be an area of focus for further development. There has been significant
progress in the development of performance audit in the region in this strategic period. In terms of
achievement, there is better understanding and interest in performance audit now compared to
when the strategic imperative was set. However, the performance audit discipline still needs a lot of
support and education. Together with continuous training and development of performance
auditors there should be deliberate prioritization in the development and implementation of quality
control management systems focusing on the audit review skills necessary for performance auditing
and enhancing recruitment, training and retention for auditors and managers with a wide mix of
different professional backgrounds.
Use of IT in Audit The use of IT in audit has been known to drive innovation and creativity in the delivery of audit
services. Although there has been progress in the development of this imperative there is still more
room to develop this imperative even in the next strategic period. As such, there is still need for
development not only in the area of knowledge and skills for auditing but as well as in the innovative
and creative use of the same. Further, that there should be prioritized focus on the development
and implementation of comprehensive IT strategies and IT support systems that are in tune with the
IT development landscape.

49 APPENDICES
APPENDICES
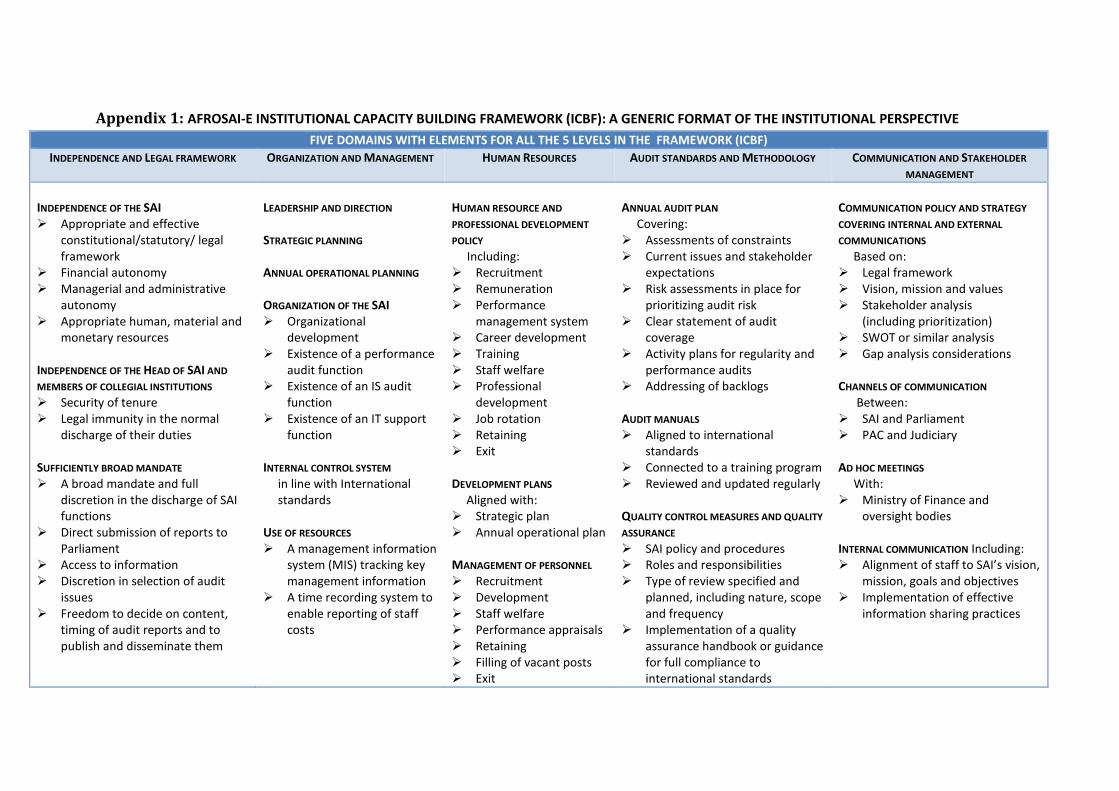
Appendix 1: AFROSAI-E INSTITUTIONAL CAPACITY BUILDING FRAMEWORK (ICBF): A GENERIC FORMAT OF THE INSTITUTIONAL PERSPECTIVE FIVE DOMAINS WITH ELEMENTS FOR ALL THE 5 LEVELS IN THE FRAMEWORK (ICBF)
INDEPENDENCE AND LEGAL FRAMEWORK ORGANIZATION AND MANAGEMENT HUMAN RESOURCES AUDIT STANDARDS AND METHODOLOGY COMMUNICATION AND STAKEHOLDER
MANAGEMENT
INDEPENDENCE OF THE SAI Appropriate and effective
constitutional/statutory/ legal framework
Financial autonomy Managerial and administrative
autonomy Appropriate human, material and
monetary resources INDEPENDENCE OF THE HEAD OF SAI AND
MEMBERS OF COLLEGIAL INSTITUTIONS Security of tenure Legal immunity in the normal
discharge of their duties SUFFICIENTLY BROAD MANDATE A broad mandate and full
discretion in the discharge of SAI functions
Direct submission of reports to Parliament
Access to information Discretion in selection of audit
issues Freedom to decide on content,
timing of audit reports and to publish and disseminate them
LEADERSHIP AND DIRECTION STRATEGIC PLANNING ANNUAL OPERATIONAL PLANNING ORGANIZATION OF THE SAI Organizational
development Existence of a performance
audit function Existence of an IS audit
function Existence of an IT support
function INTERNAL CONTROL SYSTEM
in line with International standards
USE OF RESOURCES A management information
system (MIS) tracking key management information
A time recording system to enable reporting of staff costs
HUMAN RESOURCE AND
PROFESSIONAL DEVELOPMENT
POLICY Including: Recruitment Remuneration Performance
management system Career development Training Staff welfare Professional
development Job rotation Retaining Exit DEVELOPMENT PLANS
Aligned with: Strategic plan Annual operational plan MANAGEMENT OF PERSONNEL Recruitment Development Staff welfare Performance appraisals Retaining Filling of vacant posts Exit
ANNUAL AUDIT PLAN Covering: Assessments of constraints Current issues and stakeholder
expectations Risk assessments in place for
prioritizing audit risk Clear statement of audit
coverage Activity plans for regularity and
performance audits Addressing of backlogs AUDIT MANUALS Aligned to international
standards Connected to a training program Reviewed and updated regularly
QUALITY CONTROL MEASURES AND QUALITY
ASSURANCE SAI policy and procedures Roles and responsibilities Type of review specified and
planned, including nature, scope and frequency
Implementation of a quality assurance handbook or guidance for full compliance to international standards
COMMUNICATION POLICY AND STRATEGY
COVERING INTERNAL AND EXTERNAL
COMMUNICATIONS Based on: Legal framework Vision, mission and values Stakeholder analysis
(including prioritization) SWOT or similar analysis Gap analysis considerations
CHANNELS OF COMMUNICATION Between: SAI and Parliament PAC and Judiciary AD HOC MEETINGS With: Ministry of Finance and
oversight bodies INTERNAL COMMUNICATION Including: Alignment of staff to SAI’s vision,
mission, goals and objectives Implementation of effective
information sharing practices

51 APPENDICES
INDEPENDENCE AND LEGAL FRAMEWORK ORGANIZATION AND MANAGEMENT HUMAN RESOURCES AUDIT STANDARDS AND METHODOLOGY COMMUNICATION AND STAKEHOLDER
MANAGEMENT
EFFECTIVE FOLLOW UP MECHANISM
at the SAI on its recommendations SAIS REPORTING ON ITS OWN ACTIVITIES AND
USE OF RESOURCES OVERSIGHT AND ACCOUNTABILITY
The Parliament or an oversight body appoints the SAI’s external auditors
CODE OF ETHICS
and its monitoring
TRAINING ASPECTS WITH MONITORING AND
EVALUATION MECHANISMS For: New entrants Management
development On the job training Secondments to other
SAIs Audit/accounting
qualifications Coaching and
mentoring process CAPACITY TO TRAIN ITS STAFF To: use information develop knowledge develop skill
QUALITY ASSURANCE PROCESSES
PERFORMED BY OTHERS AUDIT IT-TECHNIQUES
Such as: Electronic working papers Computer assisted audit
techniques (CAATS) IMPLEMENTATION OF THE SAI COMMUNICATION STRATEGY
for the audit process with the auditees
COMMUNICATION With: Relevant experts Professional bodies Relevant journals Internal audit Other public sector audit
institutions SAI REPORTING
Should include: Follow up on previous
recommendations Standard structure of reports,
user-friendly with materiality considerations
PROMOTION OF THE SAI Via: Engagement with:
> Media > The public > Academic institutions > International community and
organizations Use of effective information
sharing practices AUDIT PERFORMANCE AND RESULTS
Such as: Audit coverage of expenditure Number of signed and issued or
published performance audit reports
Number of/percentage of performance auditors in relation to total audit staff
Integration of IS audit in regularity and performance audit
Coverage of IS audit Time for submission of the
annual audit report to Parliament from the beginning of the year
Time for implementation of the recommendations
Key stakeholders view on the benefit of the audit
Appendix 2: Country Level Presentations 2014
Appendix 2 shows the development levels in accordance with the institutional
capacity building framework (ICBF) within the AFROSAI-E region. The values
are based on annual self-assessment questionnaires for the four years from
2010 to 2014.

53 APPENDICES
Angola
Botswana
0.00
1.00
2.00
3.00
4.00
5.00
Independence &
Legal Framework
Organization &
Management
Human
Resources
Audit
Methodology &
Standards
Communication &
Stakeholder
Management
Angola based on 2013 data
2010 2011 2012 2013 2014
0.00
1.00
2.00
3.00
4.00
5.00
Independence &
Legal Framework
Organization &
Management
Human
Resources
Audit
Methodology &
Standards
Communication &
Stakeholder
Management
Botswana
2010 2011 2012 2013 2014

Transversal Activity Report 2014
54
Eritrea
Ethiopia
0.00
1.00
2.00
3.00
4.00
5.00
Independence &
Legal Framework
Organization &
Management
Human
Resources
Audit
Methodology &
Standards
Communication &
Stakeholder
Management
Eritrea
2010 2011 2012 2013 2014
2.59 2.73 2.48 2.56 2.45
2.95 3.00 2.73 2.71 2.72
3.63
2.94 2.73 2.74
2.50
0.00
1.00
2.00
3.00
4.00
5.00
Independence &
Legal Framework
Organization &
Management
Human Resources Audit Methodology
& Standards
Communication &
Stakeholder
Management
Ethiopia
2010 2011 2012 2013 2014

55 APPENDICES
Gambia
Ghana
0.00
1.00
2.00
3.00
4.00
5.00
Independence &
Legal Framework
Organization &
Management
Human
Resources
Audit
Methodology &
Standards
Communication &
Stakeholder
Management
Gambia
2010 2011 2012 2013 2014
0.00
1.00
2.00
3.00
4.00
5.00
Independence &
Legal Framework
Organization &
Management
Human
Resources
Audit
Methodology &
Standards
Communication &
Stakeholder
Management
Ghana
2010 2011 2012 2013 2014

Transversal Activity Report 2014
56
Kenya
Lesotho
0.00
1.00
2.00
3.00
4.00
5.00
Independence &
Legal Framework
Organization &
Management
Human
Resources
Audit
Methodology &
Standards
Communication &
Stakeholder
Management
Kenya
2010 2011 2012 2013 2014
0.00
1.00
2.00
3.00
4.00
5.00
Independence &
Legal Framework
Organization &
Management
Human
Resources
Audit
Methodology &
Standards
Communication &
Stakeholder
Management
Lesotho
2010 2011 2012 2013 2014

57 APPENDICES
Liberia
Malawi
0.00
1.00
2.00
3.00
4.00
5.00
Independence &
Legal Framework
Organization &
Management
Human
Resources
Audit
Methodology &
Standards
Communication &
Stakeholder
Management
Liberia
2010 2011 2012 2013 2014
0.00
1.00
2.00
3.00
4.00
5.00
Independence &
Legal Framework
Organization &
Management
Human
Resources
Audit
Methodology &
Standards
Communication &
Stakeholder
Management
Malawi
2010 2011 2012 2013 2014

Transversal Activity Report 2014
58
Mauritius
Mozambique
0.00
1.00
2.00
3.00
4.00
5.00
Independence &
Legal Framework
Organization &
Management
Human
Resources
Audit
Methodology &
Standards
Communication &
Stakeholder
Management
Mauritius
2010 2011 2012 2013 2014
0.00
1.00
2.00
3.00
4.00
5.00
Independence &
Legal Framework
Organization &
Management
Human
Resources
Audit
Methodology &
Standards
Communication &
Stakeholder
Management
Mozambique based on 2013 data
2010 2011 2012 2013 2014

59 APPENDICES
Namibia
Nigeria
0.00
1.00
2.00
3.00
4.00
5.00
Independence &
Legal Framework
Organization &
Management
Human
Resources
Audit
Methodology &
Standards
Communication &
Stakeholder
Management
Namibia
2010 2011 2012 2013 2014
0.00
1.00
2.00
3.00
4.00
5.00
Independence &
Legal Framework
Organization &
Management
Human
Resources
Audit
Methodology &
Standards
Communication &
Stakeholder
Management
Nigeria
2010 2011 2012 2013 2014

Transversal Activity Report 2014
60
Rwanda
Seychelles
0.00
1.00
2.00
3.00
4.00
5.00
Independence &
Legal Framework
Organization &
Management
Human
Resources
Audit
Methodology &
Standards
Communication &
Stakeholder
Management
Rwanda
2010 2011 2012 2013 2014
0.00
1.00
2.00
3.00
4.00
5.00
Independence &
Legal Framework
Organization &
Management
Human
Resources
Audit
Methodology &
Standards
Communication &
Stakeholder
Management
Seychelles
2010 2011 2012 2013 2014

61 APPENDICES
Sierra Leone
South Africa
0.00
1.00
2.00
3.00
4.00
5.00
Independence &
Legal Framework
Organization &
Management
Human
Resources
Audit
Methodology &
Standards
Communication &
Stakeholder
Management
Sierra Leone
2010 2011 2012 2013 2014
0.00
1.00
2.00
3.00
4.00
5.00
Independence &
Legal Framework
Organization &
Management
Human
Resources
Audit
Methodology &
Standards
Communication &
Stakeholder
Management
South Africa
2010 2011 2012 2013 2014

Transversal Activity Report 2014
62
South Sudan
Sudan
0
1
2
3
4
5
Independence &
Legal Framework
Organization &
Management
Human Resources Audit
Methodology &
Standards
Communication &
Stakeholder
Management
South Sudan
2010 2011 2012 2013 2014
0.00
1.00
2.00
3.00
4.00
5.00
Independence &
Legal
Framework
Organization &
Management
Human
Resources
Audit
Methodology &
Standards
Communication
& Stakeholder
Management
Sudan
2010
2011
2012
2013
2014

63 APPENDICES
Swaziland
Tanzania
0.00
1.00
2.00
3.00
4.00
5.00
Independence &
Legal Framework
Organization &
Management
Human
Resources
Audit
Methodology &
Standards
Communication &
Stakeholder
Management
Swaziland
2010 2011 2012 2013 2014
0.00
1.00
2.00
3.00
4.00
5.00
Independence &
Legal Framework
Organization &
Management
Human
Resources
Audit
Methodology &
Standards
Communication &
Stakeholder
Management
Tanzania
2010 2011 2012 2013 2014

Transversal Activity Report 2014
64
Uganda
Zambia
0.00
1.00
2.00
3.00
4.00
5.00
Independence &
Legal Framework
Organization &
Management
Human
Resources
Audit
Methodology &
Standards
Communication &
Stakeholder
Management
Uganda
2010 2011 2012 2013 2014
0.00
1.00
2.00
3.00
4.00
5.00
Independence &
Legal Framework
Organization &
Management
Human
Resources
Audit
Methodology &
Standards
Communication &
Stakeholder
Management
Zambia
2010 2011 2012 2013 2014

65 APPENDICES
Zimbabwe
0.00
1.00
2.00
3.00
4.00
5.00
Independence &
Legal Framework
Organization &
Management
Human
Resources
Audit
Methodology &
Standards
Communication &
Stakeholder
Management
Zimbabwe
2010 2011 2012 2013 2014
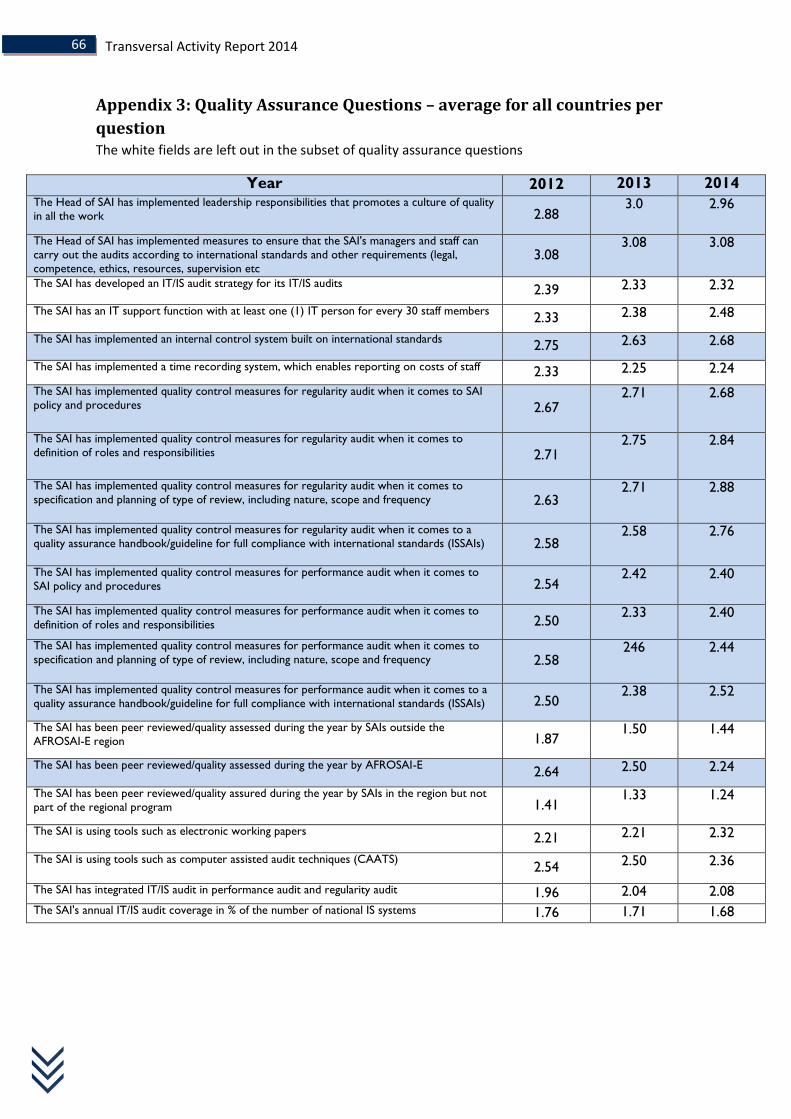
Transversal Activity Report 2014
66
Appendix 3: Quality Assurance Questions – average for all countries per
question The white fields are left out in the subset of quality assurance questions
Year 2012 2013 2014 The Head of SAI has implemented leadership responsibilities that promotes a culture of quality
in all the work 2.88 3.0 2.96
The Head of SAI has implemented measures to ensure that the SAI's managers and staff can
carry out the audits according to international standards and other requirements (legal,
competence, ethics, resources, supervision etc 3.08
3.08 3.08
The SAI has developed an IT/IS audit strategy for its IT/IS audits 2.39 2.33 2.32
The SAI has an IT support function with at least one (1) IT person for every 30 staff members 2.33 2.38 2.48
The SAI has implemented an internal control system built on international standards 2.75 2.63 2.68
The SAI has implemented a time recording system, which enables reporting on costs of staff 2.33 2.25 2.24
The SAI has implemented quality control measures for regularity audit when it comes to SAI
policy and procedures 2.67 2.71 2.68
The SAI has implemented quality control measures for regularity audit when it comes to
definition of roles and responsibilities 2.71 2.75 2.84
The SAI has implemented quality control measures for regularity audit when it comes to
specification and planning of type of review, including nature, scope and frequency 2.63 2.71 2.88
The SAI has implemented quality control measures for regularity audit when it comes to a
quality assurance handbook/guideline for full compliance with international standards (ISSAIs) 2.58 2.58 2.76
The SAI has implemented quality control measures for performance audit when it comes to
SAI policy and procedures 2.54 2.42 2.40
The SAI has implemented quality control measures for performance audit when it comes to
definition of roles and responsibilities 2.50 2.33 2.40
The SAI has implemented quality control measures for performance audit when it comes to
specification and planning of type of review, including nature, scope and frequency 2.58 246 2.44
The SAI has implemented quality control measures for performance audit when it comes to a
quality assurance handbook/guideline for full compliance with international standards (ISSAIs) 2.50 2.38 2.52
The SAI has been peer reviewed/quality assessed during the year by SAIs outside the
AFROSAI-E region 1.87 1.50 1.44
The SAI has been peer reviewed/quality assessed during the year by AFROSAI-E 2.64 2.50 2.24
The SAI has been peer reviewed/quality assured during the year by SAIs in the region but not
part of the regional program 1.41 1.33 1.24
The SAI is using tools such as electronic working papers 2.21 2.21 2.32
The SAI is using tools such as computer assisted audit techniques (CAATS) 2.54 2.50 2.36
The SAI has integrated IT/IS audit in performance audit and regularity audit 1.96 2.04 2.08
The SAI's annual IT/IS audit coverage in % of the number of national IS systems 1.76 1.71 1.68

67 APPENDICES
Appendix 4: Quality assurance questions compared to quality assurance visits
Questions compared to the seven quality assurance reviews in year 2014. Comparisons between the reviews and the result from the survey shown in table 5 in the report.
1. The auditor general is appointed, reappointed or removed by a process that ensures the independence from the executive
2. Financial independence from the executive
3. The SAI submits an annual report on its own performance to parliament and other key stakeholders
4. The SAI has implemented an annual operational plan based on: - a strategic plan - assessments of risks in the environment and expectations from stakeholders The SAI has implemented a system for monitoring and evaluating the annual operational plan
5. The SAI has implemented a human resource policy in line with best practice, including provisions for: a)recruitment of staff based on best practice criteria b) remuneration of staff based on performance c) mechanisms to retain qualified staff d) performance appraisal/management system e) career development f) training g) professional development of staff h) job rotation practices The SAI has implemented a monitoring and evaluation system of the different aspects of a human resource development policy
6. The SAI has implemented training programmes for: - new entrants - management - on-the-job training - professional qualifications
7. The SAI has implemented quality control measures and quality assurance for regularity auditing when it comes to: a) SAI policy and procedures b) definition of roles and responsibilities c) specification and planning of type of review, including nature, scope and frequency d) a quality assurance handbook/guideline for full compliance with international standards (ISSAIs) Similar for performance audit
8. The SAI has implemented a communication policy and strategy based on: - the legal framework - the SAI's vision, mission and values - stakeholder analysis (including prioritisation, a SWOT or similar analysis) - GAP analysis considerations
9. The SAI is continually optimising its organisation
10. The SAI's regularity audit manual is implemented when it comes to: a) alignment to international standards (ISSAIs) b) connection to a training programme c) regular reviewing and updating

Appendix 5: Number of auditors in the region Number and percentage of the total number of regularity, performance and IS auditors 2011-2014 [note that estimates were used for Angola and Mozambique based on 2013 figures].
COUNTRY SAI Regularity auditors Performance auditors IS auditors
2011 2012 2013 2014 2011 2012 2013 2014 2011 2012 2013 2014
N % N % N % N % N % N % N % N % N % N % N % N %
Angola - - - - 124 98% 124 98% - - - - - - 0 0% - - - - 3 2% 3 2%
Botswana 109 81% 99 82% 124 87% 63 78% 21 16% 16 13% 14 10% 14 17% 5 4% 5 5% 5 3% 4 5%
Eritrea 74 100% 56 98% 56 98% 45 88% n/a - 0 0% - 5 10% n/a 0% 1 2% 1 2% 1 2%
Ethiopia - - - - 197 80% 215 80% - - - - 49 20% 45 20% - - - - - - 0 0%
Gambia 42 100% - - 37 97% 37 84% n/a - - - - 6 14% n/a 0% - - 1 3% 1 2%
Ghana 1184 95% 1318 97% 1268 96% 1268 96% 43 3% 32 2% 37 3% 33 3% 13 1% 18 1% 18 1% 18 1%
Kenya 707 91% 608 93% 723 94% 731 93% 15 2% 30 5% 34 4% 40 5% 8 1% 14 2% 10 2% 15 2%
Lesotho 131 88% 112 86% 105 85% 123 87% 18 12% 18 14% 18 15% 18 13% 0 0% - - - - 0 0%
Liberia - - 241 90% 244 84% 227 91% - - 12 4% 26 9% 22 9% - - 23 6% 22 7% 0 0%
Malawi 125 94% 160 86% 190 86% 136 84% 8 6% 15 8% 15 7% 12 7% 0 0% 10 6% 15 7% 13 8%
Mauritius 150 93% 138 92% 150 93% 148 93% 12 7% 12 8% 11 7% 12 8% 0 0% 0 0% - - 0 0%
Mozambique 173 97% 173 97% 116 94% 173 96% 6 3% 6 3% 7 6% 7 4% 0 0% - - - - 0 0%
Namibia 64 83% 55 83% 52 80% 52 80% 13 17% 11 7% 13 20% 13 20% 0 0% 0 0% - - 0 0%
Nigeria 1741 100% 1748 99% 1781 99% 806 97% - - 20 1% 24 1% 22 3% - - 7 0% 2 0.1& 0 0%
Rwanda 82 94% 80 92% 111 91% 99 88% 5 6% 7 8% 11 9% 11 10% 0 0% 0 0% - - 2 2%
Seychelles 20 77% 22 79% 25 78% 25 81% 6 23% 5 18% 5 16% 5 16% - - 1 3% 2 6% 1 3%
Sierra Leone 113 90% 111 89% 111 89% 111 89% 12 10% 14 11% 14 11% 14 11% 0 0% 0 0% - - 0 0%
South Africa 2349 93% 2219 93% 2403 92% 2400 92% 83 3% 77 3% 74 3% 65 3% 82 3% 98 4% 123 5% 123 5%
South Sudan - - 30 100% 112 100% 90 90% - - n/a - - - 10 10% - - n/a - - - 0 0%
Sudan 792 95% 30 4% 16 2%
Swaziland 63 83% 84 84% 72 82% 66 87% 13 17% 16 16% 16 18% 10 13% 0 0% 0 0% - - 0 0%
Tanzania 516 94% 585 95% 597 95% 722 95% 20 4% 16 3% 24 4% 31 4% 11 2% 12 2% 4 0.6% 4 1%
Uganda 227 89% 315 91% 267 85% 313 88% 26 10% 27 8% 37 12% 36 10% 2 1% 3 1% 9 3% 8 2%
Zambia 312 94% 236 90% 255 91% 299 93% 13 4% 17 7% 17 6% 17 5% 7 2% 7 3% 8 3% 7 2%
Zimbabwe 184 89% 132 82% 132 85% 166 89% 18 9% 24 15% 19 12% 16 9% 4 2% 5 3% 5 3% 5 3%