Transportation/Air Quality Conformity Determination
34
Transportation/Air Quality Conformity Determination ORANGE COUNTY TRANSPORTATION COUNCIL (OCTC) Orange County Portion of the NY-NJ-CT PM2.5 Maintenance Area and the Poughkeepsie, NY Ozone Non-Attainment Area AUGUST 10, 2021
Transcript of Transportation/Air Quality Conformity Determination

Transportation/Air Quality Conformity Determination
ORANGE COUNTY TRANSPORTATION COUNCIL
(OCTC)
Orange County Portion of the NY-NJ-CT PM2.5 Maintenance Area and the Poughkeepsie, NY Ozone Non-Attainment Area
AUGUST 10, 2021

i
DISCLAIMER
The preparation of this report has been financed in part through grant[s] from the Federal Highway Administration and Federal Transit Administration, U.S. Department of Transportation, under the State Planning and Research Program, Section 505 [or Metropolitan Planning Program, Section 104(f)] of Title 23, U.S. Code. The contents of this report do not necessarily reflect the official views or policy of the U.S. Department of Transportation.
TITLE VI STATEMENT
The Orange County Transportation Council (OCTC) is committed to compliance with Title VI of the Civil Rights Act of 1964, the Civil Rights Restoration Act of 1987, and related non-discrimination rules and statutes. OCTC assures that no person or group(s) of persons shall, on the grounds of race, color, age, disability, national origin, gender, or income status, be excluded from participation in, be denied the benefits of, or be otherwise subjected to discrimination under all programs, services, or activities receiving Federal financial assistance and administered by the OCTC.
OCTC CONTACT INFORMATION
c/o Orange County Planning Department 124 Main Street Goshen, NY 10924 Phone: (845) 615-3840 Fax: (845) 291-2533 Email: [email protected] Website: www.orangecountygov.com/octc

ii
TABLE OF CONTENTS
table of Contents ........................................................................................................................................................... ii
1 Introduction ...................................................................................................................................................... 1
2 Background ....................................................................................................................................................... 1
2.1 Fine Particulate Matter ................................................................................................................................ 1
2.2 Ozone ........................................................................................................................................................... 2
3 Interagency Consultation & Coordination ........................................................................................................ 3
4 Format .............................................................................................................................................................. 3
5 Latest Planning Assumptions ............................................................................................................................ 3
5.1 Population, Housing, Employment and Travel Data .................................................................................... 4
5.1.1 Population ................................................................................................................................................ 4
5.1.2 Employment ............................................................................................................................................. 4
5.1.3 Housing Units ........................................................................................................................................... 5
5.1.4 Households .............................................................................................................................................. 5
5.2 Special Generators ....................................................................................................................................... 5
5.2.1 Stewart International Airport .................................................................................................................. 5
5.2.2 Commuter Stations and Park and Ride Lots ............................................................................................ 6
5.3 Transit Operating Policies ............................................................................................................................ 6
5.4 Transit Service Levels ................................................................................................................................... 6
5.5 Transportation Control Measures ................................................................................................................ 6
5.6 Key Assumptions .......................................................................................................................................... 6
5.6.1 Demographics .......................................................................................................................................... 6
5.6.2 Transportation System............................................................................................................................. 7
5.6.3 Transportation Projects ........................................................................................................................... 7
5.6.4 Projects Evaluated with an “Off-model” Process .................................................................................... 7
5.6.5 Planning Assumptions “Lock-in” Date ..................................................................................................... 7
6 Latest Emissions Model .................................................................................................................................... 8
6.1 OCTC Travel Demand Model ........................................................................................................................ 8
6.1.1 Transportation Analysis Zones (TAZs) ...................................................................................................... 8
6.1.2 Analysis Years .......................................................................................................................................... 9
6.1.3 Trip Generation ........................................................................................................................................ 9
6.1.4 Trip Distribution ..................................................................................................................................... 10
6.1.5 External Trips ......................................................................................................................................... 10
6.1.6 Trip Assignment ..................................................................................................................................... 11

iii
6.1.7 Trip Calibration and Validation .............................................................................................................. 11
6.2 MOVES2014A ............................................................................................................................................. 12
6.2.1 MOVES2014a Inputs .............................................................................................................................. 12
6.2.2 Population Data ..................................................................................................................................... 13
6.2.3 Inspection and Maintenance data/other Input files .............................................................................. 13
6.2.4 Development of Data Specific Average Speed Distribution................................................................... 13
6.2.5 Development of the Highway Performance Monitoring System Vehicle Type by Year (HPMSVTypeYear) ................................................................................................................................................ 13
6.2.6 MOVES2014 Results ............................................................................................................................... 14
7 Consistency with the OCTC Long Range Transportation Plan (LRTP) ............................................................. 15
8 Identification of Exempt, Non-exempt, and Regionally Significant Projects .................................................. 16
8.1 Project Listing ............................................................................................................................................. 16
9 Timely Implementation of TCMs .................................................................................................................... 16
10 Documentation of Interagency Consultation Requirements.......................................................................... 17
11 Public Involvement ......................................................................................................................................... 17
12 Results of Emissions Analyses ........................................................................................................................ 17
12.1 Methodology .............................................................................................................................................. 17
12.2 Regional Analysis ........................................................................................................................................ 17
12.3 Conclusions ................................................................................................................................................ 18
13 Evidence of MPO Resolutions ......................................................................................................................... 18
Conformity Determination Statement ........................................................................................................................ 19
Additional Information ............................................................................................................................................ 19
Appendix A – MOVES Emissions Results .................................................................................................................... 20
Appendix B – Off-Model Emissions Results ............................................................................................................... 21
Appendix C – PONA Conformity Statement ............................................................................................................... 22
Appendix D – Public Comment ................................................................................................................................... 29
Appendix E – Supporting Resolution .......................................................................................................................... 30

1
1 INTRODUCTION
The US Environmental Protection Agency (EPA) requires that transportation/air quality conformity be demonstrated by Metropolitan Planning Organizations (MPOs) in air quality non-attainment and maintenance areas whenever transportation projects that may impact air quality are planned and programmed. The Orange County Transportation Council (OCTC) is the MPO for Orange County responsible for ensuring that federal transportation funding (highway and transit) is programmed through a locally driven, comprehensive planning process, involving the development of a 25-year Long-Range Transportation Plan (LRTP), a Transportation Improvement Program (TIP), and a Unified Planning Work Program (UPWP).
Orange County is part of the NY-NJ-CT air quality maintenance area for fine particulate matter (PM2.5) along with New York City, Long Island, Westchester and Rockland Counties. Those areas are part of the New York Metropolitan Transportation Council (NYMTC), which is the MPO for New York City, Long-Island, Westchester, Rockland and Putnam Counties. Orange County is also part of the Poughkeepsie, NY 1997 ozone nonattainment area comprised of Dutchess, Orange and Putnam Counties. Dutchess County is the planning boundary of the Dutchess County Transportation Council (DCTC), which is the MPO for Dutchess County.
All air quality non-attainment and maintenance areas are subject to the transportation conformity process, which requires transportation and air quality officials to coordinate and ensure that transportation projects do not affect an area's ability to reach its EPA clean air goals. EPA regulations require transportation conformity to be demonstrated for the entire nonattainment or maintenance area whenever significant changes occur to transportation projects and/or transportation plans that might significantly affect air quality. OCTC is issued this conformity determination for 30-days of public review and comment on June 16, 2021 in response to the updates of the NYMTC and DCTC Metropolitan Transportation Plans (MTPs). These actions necessitate the need to reevaluate transportation/air quality conformity for the entire New York portion of the NY-NJ-CT PM2.5 maintenance area and the Poughkeepsie, NY Ozone Nonattainment Area (PONA) in accordance with the EPA regulation 40 CFR Part 93 Subpart A.
2 BACKGROUND
2.1 FINE PARTICULATE MATTER
Fine particulate matter is a mixture of microscopic solids and liquid droplets suspended in the air equal to or less than 2.5 micrometers (about one-thirtieth the diameter of a human hair) in size. This fine particulate matter, also called PM2.5, can be emitted directly (such as smoke from a fire, or as a component of automobile exhaust) or be formed indirectly in the air from power plant, industrial and mobile source gas emissions such as sulfur dioxide and nitrogen oxides.
The health effects associated with exposure to fine particulate matter may be significant. Scientific studies have shown a strong relationship between elevated fine particulate matter and decreased lung function, asthma attacks, as well as certain cardiovascular problems such as heart attacks and cardiac arrhythmia (as indicated by increased hospital admissions, emergency room visits, absences from school or work, and restricted activity days). While fine particulate matter is unhealthy for anyone to breathe, people with already compromised heart or lung function, as well as older adults and children, are particularly at risk.
2
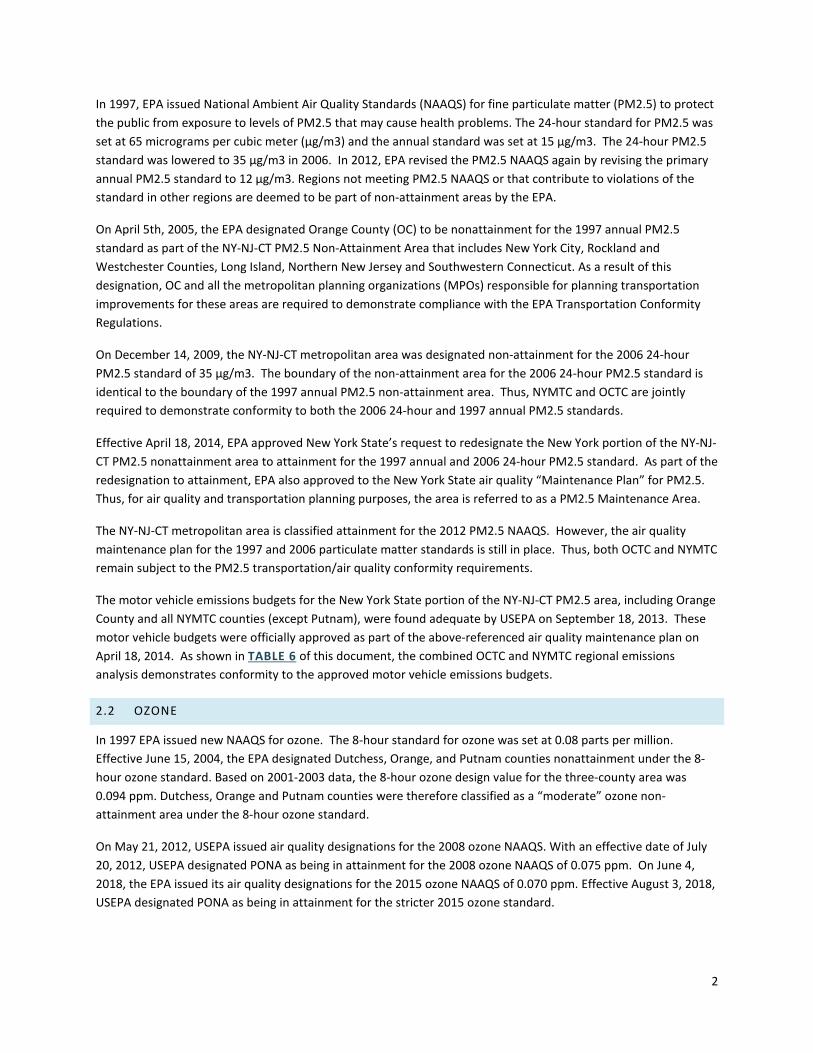
In 1997, EPA issued National Ambient Air Quality Standards (NAAQS) for fine particulate matter (PM2.5) to protect the public from exposure to levels of PM2.5 that may cause health problems. The 24-hour standard for PM2.5 was set at 65 micrograms per cubic meter (µg/m3) and the annual standard was set at 15 µg/m3. The 24-hour PM2.5 standard was lowered to 35 µg/m3 in 2006. In 2012, EPA revised the PM2.5 NAAQS again by revising the primary annual PM2.5 standard to 12 µg/m3. Regions not meeting PM2.5 NAAQS or that contribute to violations of the standard in other regions are deemed to be part of non-attainment areas by the EPA.
On April 5th, 2005, the EPA designated Orange County (OC) to be nonattainment for the 1997 annual PM2.5 standard as part of the NY-NJ-CT PM2.5 Non-Attainment Area that includes New York City, Rockland and Westchester Counties, Long Island, Northern New Jersey and Southwestern Connecticut. As a result of this designation, OC and all the metropolitan planning organizations (MPOs) responsible for planning transportation improvements for these areas are required to demonstrate compliance with the EPA Transportation Conformity Regulations.
On December 14, 2009, the NY-NJ-CT metropolitan area was designated non-attainment for the 2006 24-hour PM2.5 standard of 35 µg/m3. The boundary of the non-attainment area for the 2006 24-hour PM2.5 standard is identical to the boundary of the 1997 annual PM2.5 non-attainment area. Thus, NYMTC and OCTC are jointly required to demonstrate conformity to both the 2006 24-hour and 1997 annual PM2.5 standards.
Effective April 18, 2014, EPA approved New York State’s request to redesignate the New York portion of the NY-NJ-CT PM2.5 nonattainment area to attainment for the 1997 annual and 2006 24-hour PM2.5 standard. As part of the redesignation to attainment, EPA also approved to the New York State air quality “Maintenance Plan” for PM2.5. Thus, for air quality and transportation planning purposes, the area is referred to as a PM2.5 Maintenance Area.
The NY-NJ-CT metropolitan area is classified attainment for the 2012 PM2.5 NAAQS. However, the air quality maintenance plan for the 1997 and 2006 particulate matter standards is still in place. Thus, both OCTC and NYMTC remain subject to the PM2.5 transportation/air quality conformity requirements.
The motor vehicle emissions budgets for the New York State portion of the NY-NJ-CT PM2.5 area, including Orange County and all NYMTC counties (except Putnam), were found adequate by USEPA on September 18, 2013. These motor vehicle budgets were officially approved as part of the above-referenced air quality maintenance plan on April 18, 2014. As shown in TABLE 6 of this document, the combined OCTC and NYMTC regional emissions analysis demonstrates conformity to the approved motor vehicle emissions budgets.
2.2 OZONE
In 1997 EPA issued new NAAQS for ozone. The 8-hour standard for ozone was set at 0.08 parts per million. Effective June 15, 2004, the EPA designated Dutchess, Orange, and Putnam counties nonattainment under the 8-hour ozone standard. Based on 2001-2003 data, the 8-hour ozone design value for the three-county area was 0.094 ppm. Dutchess, Orange and Putnam counties were therefore classified as a “moderate” ozone non-attainment area under the 8-hour ozone standard.
On May 21, 2012, USEPA issued air quality designations for the 2008 ozone NAAQS. With an effective date of July 20, 2012, USEPA designated PONA as being in attainment for the 2008 ozone NAAQS of 0.075 ppm. On June 4, 2018, the EPA issued its air quality designations for the 2015 ozone NAAQS of 0.070 ppm. Effective August 3, 2018, USEPA designated PONA as being in attainment for the stricter 2015 ozone standard.

3
On November 29, 2018, USEPA issued guidance (EPA-420-B-18-050, November 2018) for the South Coast II Court Decision that addresses how transportation conformity determinations can be made in areas that were non-attainment or maintenance for the 1997 ozone NAAQS when the 1997 ozone NAAQS was revoked, but designated attainment for the 2008 ozone NAAQS in EPA’s original designations for this NAAQS (May 21, 2012).
As noted previously, the sections below document compliance with the conformity requirements for the Orange County and New York State portion of the NY-NJ-CT PM2.5 area. The transportation conformity documentation for the PONA is in APPENDIX C.
3 INTERAGENCY CONSULTATION & COORDINATION
As part of EPA’s Transportation Conformity Regulations, interagency consultation and coordination are required. The NYS Interagency Consultation Group (ICG) is comprised of representatives from the U.S. Department of Transportation (Federal Highway and Transit Administrations), EPA – Region 2, NYS Department of Environmental Conservation (NYSDEC), the NYS Department of Transportation-Environmental Science Bureau (NYSDOT-ESB), OCTC, DCTC and NYMTC. The group provides multi-agency guidance concerning the conformity process, as well as concurrence on the assumptions and methodology used to forecast vehicle miles traveled (VMT) and vehicular speeds with the OCTC Travel Demand Model.
Generally, these outputs (VMT and vehicular speeds) form the basis for the “regional emissions analysis” using the EPA’s Motor Vehicle Emissions Simulator (MOVES), version 2014a to calculate vehicle emissions and the air quality impact of non-exempt projects in the OCTC Transportation Improvement Program (TIP) for Federal Fiscal Years (FFY) 2020-2024 and 2045 Long Range Transportation Plan (LRTP).
4 FORMAT
The format of this conformity determination follows the required subject matter that must be addressed pursuant to EPA transportation conformity regulations.
5.0 Latest Planning Assumptions
6.0 Latest Emissions Model
7.0 Consistency with each Metropolitan Transportation Plan
8.0 Identification of Exempt/Non-Exempt & Regionally Significant Projects
9.0 Timely Implementation of Transportation Control Measures (TCM)
10.0 Documentation of Interagency Consultation Requirements
11.0 Public Involvement
12.0 Results of Emissions Analysis
13.0 Evidence of MPO resolutions
5 LATEST PLANNING ASSUMPTIONS
Federal and State regulations require that a conformity determination be based on the latest planning assumptions available at the time the regional emissions analysis begins, as outlined in 40 CRF §93.110. Specifically, information on demographic data, transit operating policies, transit service levels, transportation control measures and other key assumptions used to forecast vehicle miles traveled (VMT) and vehicular speeds by

4
functional classification must be the latest information that is available. The VMT forecasts for Orange County are calculated with Caliper TransCAD modeling software based on assumptions involving future housing and employment in Orange County, the vehicular trips generated by the assumptions, and planned future transportation improvements.
The planning assumptions were developed by the Orange County Planning Department and presented to the MPO on May 11, 2021 with no objections.
5.1 POPULATION, HOUSING, EMPLOYMENT AND TRAVEL DATA
In order to accurately depict existing traffic conditions and forecast future VMT, travel demand models rely on population, housing, employment and travel data to measure how the transportation system envisioned in a Transportation Improvement Program and/or Metropolitan Transportation Plan will operate in the future. The OCTC Travel Demand Model (OC TDM) does this by first incorporating important characteristics of the existing transportation system such as road network, intersection and road capacities, traffic control devices, posted speeds and functional classification for a base year. Then housing and employment data are incorporated along with trip generation rates and trip length frequency parameters to model current travel patterns. These travel characteristics are used to forecast future traffic conditions and future travel demand based upon increases in housing, employment, vehicular trips and the likely routes people will take from place to place.
The OC TDM was updated from a 2010 to a 2017 base year. Housing and employment projections were made for each analysis year being evaluated (i.e. 2025, 2035, 2045, and 2050) as part of PM2.5 Conformity based on historic growth trends in the county. These projections are used to forecast future VMT in the OC TDM. Overall, the projections used to demonstrate conformity are consistent with Orange County 2013-2017 American Community Survey (ACS) Estimates for population and housing, and New York Metropolitan Transportation Council (NYMTC) Best Practice Model (BPM) 2055 Socioeconomic & Demographic Forecasts . TABLE 1 shows the projections for Orange County.
Documentation on the development of the population, housing, and employment forecasts is available by request.
5.1.1 POPULATION
Population information from the ACS 5-Year Estimates (2013-2017) was used as the base year source. Forecasts were derived based on population cohort model and verified using building permit data and population growth trends from (2000-2018) as the basis for determining the population and housing forecasts in the OC TDM future analysis years.
Population Cohort Model is [Total Population + Births – Deaths + Migration]
5.1.2 EMPLOYMENT
Employment information from InfoUSA inventory of businesses for 2017 was the primary source and adjusted based on multiple sources including the LEHD Origin-Destination Employment Statistics (LODES), ACS, and the USDA National Agricultural Statistics Service. NYMTC’s BPM 2055 Socioeconomic and Demographic (SED) Forecasts growth rate for Orange County were the basis for determining the employment forecasts in the OC TDM for future analysis years.

5
5.1.3 HOUSING UNITS
Total Housing Units are based on 2017 ACS 5-Year Estimates, while Housing Unit forecasts were derived based on historical trends from the Census Bureau's Building Permit Survey, current zoning and land use regulations and future assumptions of housing growth in Orange County using the following formula and adjusted as needed to meet the assumptions for the area.
Total Housing Units + [Housing Gain – Housing Loss]
5.1.4 HOUSEHOLDS
Households and occupancy rates from the 2017 ACS 5-Year Estimates were used as a check for reasonableness for the housing and population data.
TABLE 1. DEMOGRAPHIC FORECASTS FOR ORANGE COUNTY
OC SED Forecasts 2017 2025 2035 2045 2050 % Annual
Growth % Total Growth
Population 378,174 396,313 433,295 468,310 484,820 0.85% 28.20% Employment 167,696 172,488 178,751 184,349 187,197 0.35% 11.63% Households 126,460 135,080 146,575 159,047 165,676 0.94% 31.00%
Housing Units 141,493 150,089 162,861 176,719 184,084 0.91% 30.10%
5.2 SPECIAL GENERATORS
A special generator is a land use that generates trip-making behavior (for example, airports and amusement parks) that is different from typical commuter behavior or one that does not typically contain population or employment data, such as a park and ride, and therefore needs to be treated differently from other land uses within the model.
Sources of information on possible special generators were investigated as part of the model development process, including Shopping Malls/Centers, Colleges, Hospitals and Medical Centers, Stewart International Airport, and Commuter Stations and Park and Ride Locations. The modeling team concluded that Shopping Malls/Centers, including Woodbury Common Premier Outlets, Colleges, Hospitals and Medical Centers were sufficiently accounted for in the employment and home-based-other purposes, and therefore were not included as special generators.
There were two special generators categories included in the OC TDM: Stewart International Airport and Commuter and Park and Ride locations.
5.2.1 STEWART INTERNATIONAL AIRPORT
Stewart International Airport has fluctuated considerably over time, with both increases and decreases in passengers. The best estimates of 2017 enplanements are from the FAA, indicating 224,000 enplanements in 2017. The West of Hudson Transit Access Study identified a year/daily factor of 1/365. This is a result of high usage both on the weekends and during an average weekday. This translates into average weekday boardings of 614 passengers, which have been included in the input SED data for use as a special generator.

6
5.2.2 COMMUTER STATIONS AND PARK AND RIDE LOTS
There are fourteen (14) park and ride lots within Orange County that serve CoachUSA, Shortline and NJ Transit buses. The park and ride lots were included as special generators within the model. Data on the number of park and ride patrons observed each of these lots collected during October 2018 were used to estimate the demand at each of these lots.
5.3 TRANSIT OPERATING POLICIES
Coach USA/Shortline/Hudson Transit, MTA-MetroNorth Railroad, Newburgh-Beacon Bus Company, Middletown Transit, Monroe Bus Company, and the Village of Kiryas Joel provide the majority of mass transit services in Orange County along with eight municipal dial-a-bus operators. According to Journey-to-Work information from the 2017 ACS 5-year estimates, 5.4% of commuter travel in Orange County had a mass transit component, with a majority of this travel involving vehicular trips to and from Orange County park and ride lots. Thus, park and ride lots are included in the OC TDM as trip generators. Regional and inter-municipal transit services are also incorporated into the OC Model through traffic analysis zone trip generation.
5.4 TRANSIT SERVICE LEVELS
The OC TDM does not incorporate significant changes in travel attributable to increased future transit service in Orange County. Significant changes in economic and/or environmental conditions together with steep increases in fuel costs that may significantly impact vehicular travel are not forecasted as part of future development scenarios.
5.5 TRANSPORTATION CONTROL MEASURES
No Transportation Control Measures (TCMs) are identified for Orange County as part of the applicable New York (NYS) State Implementation Plan (SIP). Therefore, the TCM implementation conformity criteria do not apply. There are also no transportation projects in the OCTC LRTP and TIP that will interfere with the timely implementation of TCMs in other areas.
5.6 KEY ASSUMPTIONS
5.6.1 DEMOGRAPHICS
Birth and death rates are presumed to stay the same, while migration rate is assumed net positive from 2018 – 2050 based on housing opportunities. A slightly higher net gain is applied to reflect the flight from New York City after COVID-19 from 2020 – 2025, and a slight net positive gain is assumed from 2026 – 2050 based on estimates of the Components of Population Change for 2010 – 2018 in Orange County, NY.
Orange County added an average of 985.7 units per year from 2010-2019, or 2857 total units. OC assumed building permit will see an increase of 1,500 units/year from 2020 – 2025 to meet housing needs for the population and higher net migration due to COVID-19. Most housing units will be multi-family around the Town of Palm Tree, with some single-family units, especially near the towns of Wallkill, Monroe, and Newburgh. After 2025 housing units are held at a constant of 1,200 units per year. The occupancy rate is held at a constant of 90% and the average household size of 2.86 will remain constant through 2050 based on historic trends and the average rate over the last decade.

7
Orange County’s total employment is assumed to see a lagged near-term growth rate of 5% in employment from 2017-2020 due to COVID-19 Pandemic and Regional Population and Employment Trends, with long-term trends unaffected by COVID and reflect regional employment and population trends for Orange County.
5.6.2 TRANSPORTATION SYSTEM
The OC Model further assumes that the regional transportation network will retain its ability to adjust to changes in travel demand. This assumes that future transportation funding rates will be maintained and that technological advances in Intelligent Transportation Systems (ITS) will further improve the efficiency of the transportation system.
5.6.3 TRANSPORTATION PROJECTS
The Conformity process requires that the overall set of investments contained in the MPO’s fiscally constrained MTP and TIP conform to the mobile source emissions budgets in the SIP. There are currently no regionally significant transportation projects included in the OCTC 2020-2024 TIP that are coded as a planning assumption in the OC TDM.
5.6.4 PROJECTS EVALUATED WITH AN “OFF-MODEL” PROCESS Local emission factors generated by the Motor Vehicle Emissions Simulator (MOVES), version 2014a were applied to the averted trip VMT to estimate the total emissions reductions achieved by the program as indicated in the emissions calculations detailed in the appendix of this document. Kiryas Joel Park & Ride Expansion (PIN 876142): Currently, a substantial number of people from Kiryas Joel commute to NYC using express bus service. Most of these commuters use the existing 112 space Park and Ride located near the intersection of Bakertown Rd and County Route 105. Originally, this facility was planned to be expanded by 95 spaces and was deemed to be exempt for transportation/air quality purposes. Due to the high demand for express bus services and associated parking, the number of parking spaces in the expansion was increased to 200. It now exceeds the regionally significant threshold for park and ride projects of 100 spaces indicated in the conformity regulation 6 NYCRR Part 240.6(h)(2). The reduction in emissions attributable to averted trips as a consequence of increased park and ride capacity was estimated with off-model MOVES2014a emissions factors. See Appendix B for the OCTC off-model emissions results
5.6.5 PLANNING ASSUMPTIONS “LOCK-IN” DATE
The Clean Air Act requires that transportation investments be based on the most recent information that is available in order to protect public health over the long-term. Therefore, conformity determinations must be based upon the most recent planning assumptions in force at the time the conformity analysis begins.
Based on consultation with the New York State Interagency Consultation Group (NYSICG) and as per 40 CFR § 93.110(a), all assumptions were locked in as of April 1, 2021 when OCTC began the regional emissions analysis.

8
6 LATEST EMISSIONS MODEL
The overall goal of transportation conformity is to ensure that transportation projects and the transportation system as a whole do not create new air quality violations or exacerbate existing violations. Travel demand modeling provides a means of quantifying vehicle miles traveled (VMT) and average vehicular speeds by functional classification of roadway. These outputs are utilized to calculate vehicular emissions using the Motor Vehicle Emissions Simulator (MOVES) Model, version 2014a with MariaDB, to be consistent with NYMTC, as recommended by the USEPA during consultation with New York State Interagency Consultation Group (ICG).
6.1 OCTC TRAVEL DEMAND MODEL
The OC TDM was updated in March 2021, including updating TAZs to better align with census boundaries, updating the base year from 2010 to 2017, and the transition of platforms from PTV Visum to Caliper TransCAD. The traditional gravity modeling process incorporated within the TransCAD software was utilized to forecast future travel demand and the impact of transportation projects in the OCTC LRTP and TIP on air emissions. The OC TDM incorporates housing, employment, highway, along with trip generation information to depict existing travel patterns. Trips are distributed and assigned to the least time travel paths between traffic analysis zones. Using the trip generation and trip length parameters of the calibrated base year model, future travel conditions, VMT and vehicular emissions were forecasted using projected increases in housing, employment and vehicle trips in OC for each analysis year being evaluated.
Detailed descriptions of the Model Development and Validation Process for the OC TDM are available by request.
6.1.1 TRANSPORTATION ANALYSIS ZONES (TAZS)
The OC TDM revised TAZ system for Orange County include:
• To provide a more accurate and complete source for data for trip generation. • To enable validation against Census Transportation Planning Products (CTPP) for work trips. • To allow for more meaningful visualizations of both input and output model data. • To extend the model area to include the entire county, including zones along the southeastern edge
that represent Harriman State Park. • To provide consistency with GIS data available from the Orange County GIS system and other publicly
available data sources.
The new TAZ system was developed by aggregating Census Block geography into the desirable TAZ geography. Census Blocks were examined and allocated to TAZs by balancing a number of criteria including:
• Following barriers such as roadways and natural and man-made boundaries. • Maintaining homogeneous land use types. • Establish TAZs with similar levels of activity (i.e., sum of household and employment should be
approximately the same). • Matching jurisdictional or planning area boundaries where possible.
The Census Block layer was used as the lowest level of geography, from which higher levels of geography (e.g., TAZs, Municipalities and Districts) were derived, creating 23 municipalities and five districts as aggregations of TAZs. Information on processing SED data at various levels of geography can be found in the following section. The final TAZ system consists of 534 zones numbered sequentially from 1 to 534.

9
All demographic, and some feature data (including Census demographics, InfoUSA employment point data, school locations and other local features) were tagged with Census Block IDs and, where appropriate, aggregated up to Block Groups, Tracts, TAZs, Municipalities and Districts.
6.1.2 ANALYSIS YEARS
Consistent with 40 CFR Part 93 and 6 NYCRR Part 240, PM2.5 and NOX emissions were forecasted for the years 2025, 2035, 2045, and 2050, complying with the federal and New York State requirements for PM2.5 non-attainment and maintenance areas with motor vehicle emissions budgets that:
• the first analysis year be no more than five years from the year in which the conformity determination is being made
• the attainment years and any air quality milestone years for the 2006 24-hour PM2.5 standard are analyzed
• consecutive analysis years be no more than ten years apart • the horizon year of each affected MPO’s LRTP be incorporated into the regional emissions analysis.
Analysis year 2025 meets the requirement that the first analysis year be no more than five years from the date the conformity determination is being made. The year 2025 is also the final milestone year in the PM2.5 Maintenance Plan. The year 2045 corresponds to the horizon year of the OCTC LRTP update and the year 2050 is the horizon year of NYMTC’s MTP. Lastly, the year 2035 was analyzed to satisfy the conformity requirement that consecutive analysis years be no more than ten years apart.
6.1.3 TRIP GENERATION
Trip generation is the means of quantifying the number and type of trips to and from each TAZ in the OC TDM based upon the type and amount of land use activity therein. Essentially, the purpose of trip generation is to have the model accurately reflect the average trip making characteristics of people within a specific timeframe.
The OCTDM uses a unique data driven approach to trip generation with Location-based services (LBS) data collected passively from mobile devices are becoming an increasingly valuable source of information about travel patterns. Linear regression models were developed from the LBS data that predict the number of trips originating or ending at each zone based on the socioeconomic characteristics of the zone. The 2018 LOCUS expanded person trip tables were developed for Orange County as well as all adjacent counties, and New York City (NYC) counties for external travel.
The LBS data also allows us to impute the home-location of a trip maker, as such, trip purposes can be broken down by direction. The following trip purposes were used in the estimation of the internal models:
• Home to work/school—H2W • Work/school to home—W2H • Home to other—H2O • Other to home—O2H • Non-home based—NHB.
The models are not structured in a production-attraction format; instead, the origin and destination of each trip purpose are estimated separately. Within each regression model, the dependent variables are the number of trips originating or number of trips ending at a census tract, and the independent variables or the predictors are the SED

10
data. Data from each census tract serve as separate datapoints within each regression model. The models are estimated by the five different trip purposes as well as by four different time periods resulting in a set of 20 models for trip origins and another set of 20 models for trip destinations for a total of 40 models. The time periods are:
• AM Peak—6AM to 9AM. • Midday—9AM to 2PM. • PM Peak—2PM to 6PM. • Off Peak—6PM to 6AM.
A linear regression model was used with a zero intercept, the assumption being that if there are no population or jobs within a zone, it should produce zero trips. The structure of the linear regression models for each trip purpose-time period combination is shown below where the β is the model coefficient for each socioeconomic variable and x is the specific socioeconomic variables. The products of these two terms are summed across all the different socioeconomic variables to get the total number of trips originating at a zone. A similar model structure is used for the trips ending at a zone.
The socioeconomic data that were retained in the model were total population, group quarter population, households by three income categories, and employment by seven employment categories.
6.1.4 TRIP DISTRIBUTION
The trip origins and trip destinations for each time period and purpose are matched using a gravity model. The gravity model generates a zone-to-zone OD matrix by time period and trip purpose, distributing trips to each zone pair proportionally to the number of trip origins in a zone, the number of trip destinations in a zone, and the impedance provided by a calibrated friction factor matrix for that zone pair.
Trip length frequencies have been compared to observed LBS data frequencies. Intrazonal impedances are calculated based on network distance to the nearest zone and included in the gravity model to assign a certain portion of trips as intrazonal trips.
6.1.5 EXTERNAL TRIPS
Orange County is situated in a central location bordered by three different States. The vicinity of Orange County to the New York City area means that there are many trips to/from that area. The location of Orange County as well as the relatively small area of the county (relative to standard MPO or statewide models), make external travel a crucial component of the model. Roughly 40% of trips within the region are external trips.
External trips can be classified into three distinct categories:
• Internal to External trip or IE trip—where the trip origin is inside Orange County and the trip destination is outside.
• External to Internal trip or EI trip—where the trip origin is outside Orange County, and the trip destination is inside.

11
• External to External trip or EE trip—where both the trip origin and the trip destination falls outside Orange County, but the trip passes through Orange County.
For the purposes of this model, each of these three different types were treated separately.
6.1.5.1 IE AND EI TRIPS
The first step in getting the external trip table ready for estimation is to assign external trips to external gateways. This assignment is done manually based on the external census tract and its vicinity to an external gateway. After all the external trips are assigned to gateways, the total number of trips at each gateway are compared to the counts to ensure that the assignment process is reasonable. This assignment procedure produces a complete set of external trip tables which identifies the number of trips to/from each external station to/from each internal census tract within Orange County.
The complete set of external trip tables are then matched with the counts at each external gateway using an iterative proportional fitting or Frataring approach. The counts are of vehicles, and the LBS trips are person trips, so the trip tables are first converted from person trips to vehicle trips using an average occupancy rate of 1.67 from NHTS 2017. The resulting trip tables are Fratared to match with the counts. The Frataring process produces the final set of external trip tables that are used for model estimation.
The external model trip generation approach is similar to the internal model trip generation. The primary difference is that only the trip end within Orange County is modeled. For IE trips, the linear regression model predicts the number of trip origins by zone and for EI trips, the linear regression model predicts the number of trip ends by zone. The external models are estimated by time of day resulting in four IE models for trip origins and four EI models for trip destinations.
6.1.5.2 EE TRIPS
The total of EE trips by time period is treated as in input into the model. The EE trips are then distributed across the external gateways based on the distribution of the EE trips by time period calculated from the Fratared LBS trip table. The distribution of EE trips is kept consistent across years, but the total number of trips by time period is treated as an input into the model. For forecast years, the totals can be grown based on the growth in Orange County SED, or by the growth in EI and IE trips.
6.1.6 TRIP ASSIGNMENT
The Orange County model uses equilibrium traffic assignment for all time periods, which assumes all travelers use the fastest possible route between origin and destination when considering the effects of congestion. Congested travel times are modeled in the Orange County model using the Bureau of Public Roads (BPR) volume delay equation, which relates the volume to capacity ratio (V/C Ratio) to increased travel time.
6.1.7 TRIP CALIBRATION AND VALIDATION
The model counts and VMT of links with counts were compared to the count database. Model results were compared to observed data by facility type, at an area type geography (urban suburban, rural), and at predefined screenlines. The comparisons were made by taking ratios of modeled to observed data, where data were available, and using a term known as Percentage Root Mean Square Error (%RMSE) is a standard way to measure the error of a model in predicting quantitative data. It is the standard deviation of the residuals (prediction errors). Residuals are a measure of how far from the regression line data points are, as defined in 2011 Travel Model Improvement

12
Program Travel Model Validation and Reasonableness Checking Manual—Second Edition (Cambridge Systematics, Inc., 2010).
6.2 MOVES2014A
MOVES is the EPA’s state of the science model for estimating emissions from all on-road vehicles including cars, trucks, motorcycles and buses. It incorporates substantial recent emissions test data and accounts for changes in vehicle technology and regulations as well as improved understanding of in-use emissions levels and the factors that influence mobile source emissions. Per the federal transportation conformity determination and associated EPA guidance, all regional emissions analyses in every State (except California) are required to be based on the MOVES model. EPA released the MOVES2014a was used in the OCTC regional emissions analysis.
MOVES can be run in either the inventory mode or the emission rate mode. The inventory mode calculates a total emissions inventory based on vehicle miles of travel and vehicle population data that are input by the user. The emission rate mode produces a look-up table of emission rates including emissions per unit of distance for running emissions, rate per profile for evaporative processes, and rate per vehicle for starts and extended idle processes.
Per EPA guidance, an MPO may select either method to conduct regional emissions analyses. OCTC chose to use the emissions inventory mode to analyze the OCTC travel demand model output for each conformity analysis year. The inventory mode was used because OCTC is only required to perform a limited number of MOVES runs and the OCTC planning boundary is limited to one county. Use of the inventory mode also requires substantially less post-processing of MOVES output data, instead relying on code and algorithms that are already built into the model by EPA.
6.2.1 MOVES2014A INPUTS
The specific MOVES2014ainputs and parameters used in the OCTC regional emissions analysis, both in the inventory mode and the emissions rate mode are described below:
• Domain/Scale: The county scale option was selected. • Calculation Type: The “emissions inventory” calculation mode was used to evaluate the impact of the
OCTC Travel Demand Model Output. • Time Spans: The time aggregation level is set to “hour.” • Geographic Bounds: The county scale option was selected. • County Data Manager Inputs: The following county-specific MOVES input data bases as received from
NYSDOT ESB on March 3, 2021 were used in the regional emissions analysis: AVFT, monthVMTFraction, dayVMTFraction, fuelSupply, hourVMTFraction, IMCoverage, rampFraction, sourceTypeAgeDistribution, sourceTypeYear, sourceTypePopulation, fuelFormulation, Temp/humidity – zoneMonthHour, and
• OCTC-specific roadTypeDistribution, averageSpeedDistribution and hpmsVTypeVMT input data bases were developed, as seen in TABLE 2.

13
TABLE 3. OCTC ANNUAL HMPS VMT DATA
HPMS Vehicle Type
HPMS VMT
2017 2025 2035 2045 2050
10 14,063,123 15,305,030 16,430,191 17,694,224 18,332,919 25 4,093,777,927 4,455,297,424 4,782,831,807 5,150,792,076 5,336,716,389 40 30,164,399 32,828,202 35,241,591 37,952,852 39,322,808 50 110,238,384 119,973,481 128,793,418 138,701,954 143,708,575 60 94,326,248 102,656,153 110,202,993 118,681,302 122,965,252
Total 4,342,570,082 4,726,060,291 5,073,500,000 5,463,822,408 5,661,045,944
6.2.2 POPULATION DATA
• Population data for 2017 was developed by NYSDEC and provided by NYSDOT.
• Population data for 2025, 2035, 2045, and 2050 was developed for each source type based on OCTC VMT data. The OCTC VMT for 2017 was and the OCTC VMT growth factors for 2025, 2035, 2040, and 2045 from OCTC VMT 2017 were applied to 2017 NYSDEC Source type population to obtain population data for years 2025, 2035, 2040, and 2045.
6.2.3 INSPECTION AND MAINTENANCE DATA/OTHER INPUT FILES
• Inspection and Maintenance files provided by NYSDOT for future years 2025, 2035, 2040, and 2045 were used.
• MOVES2014_NY_LEV database provided by NYSDOT was used for all scenario year runs.
• Fuelusagefraction: the MOVES defaults were used for fuelusagefraction in calendar (analysis) years 2025, 2035, 2045, and 2050.
6.2.4 DEVELOPMENT OF DATA SPECIFIC AVERAGE SPEED DISTRIBUTION
• Average speed distribution data was developed for the years 2025, 2035, 2045, and 2050 based on the OC TDM outputs. For each time period (AM, MD, PM, and Off-Peak) in each year, an avgSpeedDistribution table (Road Type, AvgSpeedBin, Vehicle Hours Travelled, Vehicle Hours Travelled Ratio) was summarized. Assuming all source types have the same avgSpeedFraction, and weekday and weekend also have the same avgSpeedFraction, AvgSpeedDistribution for each year that was developed.
6.2.5 DEVELOPMENT OF THE HIGHWAY PERFORMANCE MONITORING SYSTEM VEHICLE TYPE BY YEAR (HPMSVTYPEYEAR)
Highway Performance Monitoring System (HPMS) estimates of vehicle miles traveled (VMT) shall be considered the primary measure of VMT within the portion of the nonattainment or maintenance area and for the functional classes of roadways included in HPMS, for urban areas which are sampled on a separate urban area basis. For areas with network-based travel models, a factor (or factors) may be developed to reconcile and calibrate the network-based travel model estimates of VMT in the base year of its validation to the HPMS estimates for the same period, as seen in TABLE 3. These factors may then be applied to model estimates of future VMT. In this

14
factoring process, consideration is given to differences between HPMS and network-based travel models, such as differences in the facility coverage of the HPMS and the modeled network description.
TABLE 4. HPMS VMT RECONCILIATION - 2017 BASE YEAR
Functional Classification (FC)
FHWA FC NYS FC MOVES
RT HPMS DVMT Model DVMT Factor Adjusted Model DVMT
Interstate 1 1 &11 2 & 4 3,799,000 4,237,988 0.896 3,799,000 Highway 2 2 & 12 2 & 4 1,499,000 1,381,117 1.085 1,499,000 Principal Arterial 3 14 3 & 5 1,024,000 3,098,738 0.330 1,024,000 Minor Arterial 4 6 & 16 3 & 5 2,087,000 410,574 5.083 2,087,000 Major Collector 5 7 & 17 3 & 5 1,465,000 945,856 1.549 1,465,000 Minor Collector 6 8 & 18 3 & 5 162,000 462,613 0.350 162,000 Local Streets 7 9 & 19 3 & 5 1,854,000 513,515 3.610 1,854,000 Total 11,890,000 11,050,402 1.076 11,890,000
MOVES requires that VMT data be consistent with data collected as part of the HPMS program. This was done using the following procedure:
• Total Base year VMT was calculated using the formula: Total BaseYearVMT (from Traffic Demand Model for each year) = Sum of all Months {[ ( Sum of AM Peak Hour VMT from Traffic Demand Model ) * AM Period Factor + ( Sum of MD Hourly VMT from Traffic Demand Model ) * MD Period Factor + ( Sum of PM Peak Hour VMT from Traffic Demand Model ) * PM Period Factor + ( Sum of NT Hourly VMT from Traffic Demand Model ) * NT Period Factor ] * Monthly Adjustment Factor*Days per Month}.
• Determine the Fraction of each MOVES Source Type using the formula: Fraction of each MOVES Source type = ( VMT of each MOVES Source Type from NYSDEC default input data ) / ( Total VMT for all MOVES Source Types from NYSDEC default input data).
• Calculate the VMT of each MOVES Source type using the formula: VMT of each MOVES Source Type (from Traffic Demand Model data) = Total BaseYearVMT (from Traffic Demand Model, from step 1) * Fraction of each MOVES Source type (from NYSDEC default input data, from step 2).
• Calculate HPMS Base Year VMT using the formula: HPMSBaseYearVMT = sum of VMT of all MOVES source types (from Step 3) falling into the corresponding HPMS category.
6.2.6 MOVES2014 RESULTS
The results of the MOVES2014a runs were summarized using the following formulas and procedures:
• Weekday/Weekend hourly emissions for each pollutant and each month = Sum of the raw hourly emissions (directly from MOVES output) for all source types, all road types, and all processes by pollutantID, by monthID, by dayID, and by hourID.
• Estimate the numbers of weekday/weekend days for each month. • Total emissions of each pollutant at each hour for each month = Weekday /Weekend hourly emission of
each pollutant for each month (from Step 1) * number of weekdays/weekend days for each month (from Step 2).

15
• Total emissions of each pollutant for each month = sum of total emissions of each pollutant for all 24 hours for both weekdays and weekends for each month (from Step 3).
• Total emissions of each pollutant for each year = sum of total emissions of each pollutant for each month for all 12 months (from Step 4).
These model inputs include the latest existing and future emissions control programs included in NYSDEC’s statewide mobile source emission inventory, and the latest MOVES2014 input assumptions for the existing and future vehicle fleets traveling on roadways in Orange County as of the date the regional emissions began on April 1, 2021. The MOVES inputs, outputs, run specs, and VMT and speed distribution files are available from the NYSDOT Environmental Science Bureau or OCTC staff.
7 CONSISTENCY WITH THE OCTC LONG RANGE TRANSPORTATION PLAN (LRTP)
The Transportation Improvement Program (TIP) is a requirement of Federal legislation promulgated by the US Department of Transportation. The most recent federal transportation legislation is entitled the Fixing America’s Surface Transportation Act, or the FAST Act. In addition to the TIP, this legislation requires that MPOs produce a Long-Range Transportation Plan (LRTP), and a Unified Planning Work Program (UPWP). The transportation projects proposed in the OCTC 2020-2024 TIP adhere to the goals and objectives of the OCTC LRTP and FAST Act as listed below:
• Support the economic vitality of the metropolitan area, especially by enabling global competitiveness, productivity and efficiency
• Increase the safety and security of the transportation system for motorized and non-motorized users • Increase accessibility and mobility options available to people and for freight • Protect and enhance the environment, promote energy conservation, and improve quality of life • Promote consistency of transportation improvements and State and Local planned growth and economic
patterns • Enhance the integration and connectivity of the transportation system, across and between modes, for
people and freight • Promote efficient system management and operation; and • Emphasize the preservation of the existing transportation system. • Improve the resiliency and reliability of the transportation system and reduce or mitigate storm water
impacts of surface transportation. • Enhance travel and tourism.
Generally, the projects in the OCTC 2020-2024 TIP can be categorized into six areas:
1. Replacement and rehabilitation of existing highway and transit infrastructure and facilities; 2. Safety improvements; 3. Mobility enhancements promoting alternative travel modes; 4. Operations and systems management increasing the efficiency of the existing transportation system; 5. Studies identifying potential transportation improvements; and 6. Capacity projects expanding highway and transit infrastructure and services.
Thus, the projects in the OCTC 2020-2024 TIP are consistent with the policies in the OCTC LRTP and FAST Act.
16
On August 10, 2005 the Safe, Accountable Efficient Transportation Equity Act: A Legacy for Users (SAFETEA-LU) was signed into law. SAFETEA-LU amended the State Implementation Plan (SIP) requirements for transportation conformity in CAA section 176(c)(4)(D). Consistent with SAFETEA-LU, USEPA revised 40 CFR 51.390 to only require state transportation conformity SIPs to address three sections of the USEPA Conformity Rule: 40 CFR Part 93.105 (consultation procedures); 40 CFR Part 93.122 (written commitments to implement control measures that are not contained in the transportation plan or Transportation Improvement Program (TIP); and 40 CFR Part 93.125(c) (written commitments to implement mitigation measures).
On October 3, 2013 the New York State Department of Environmental Conservation submitted a SIP revision that addressed the three provisions of the USEPA Transportation Conformity Rule required by CAA section 176(c)(4)(D). The SIP revision was approved by USEPA, effective September 29, 2014.
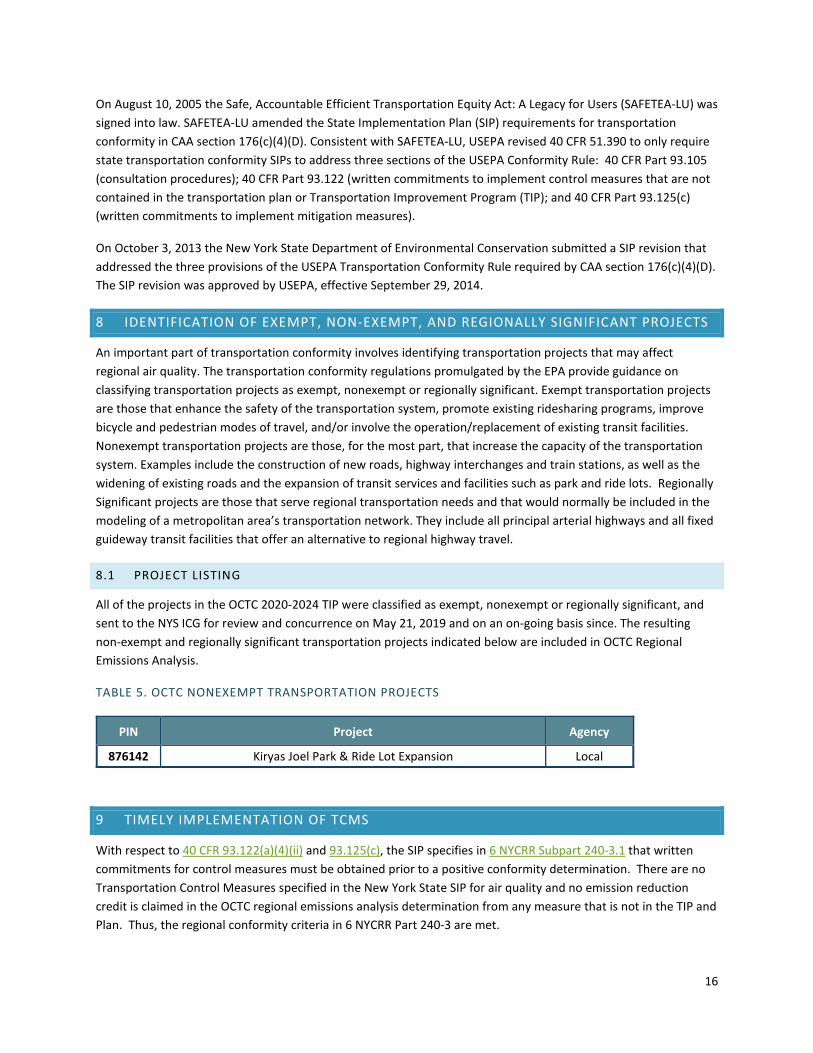
8 IDENTIFICATION OF EXEMPT, NON-EXEMPT, AND REGIONALLY SIGNIFICANT PROJECTS
An important part of transportation conformity involves identifying transportation projects that may affect regional air quality. The transportation conformity regulations promulgated by the EPA provide guidance on classifying transportation projects as exempt, nonexempt or regionally significant. Exempt transportation projects are those that enhance the safety of the transportation system, promote existing ridesharing programs, improve bicycle and pedestrian modes of travel, and/or involve the operation/replacement of existing transit facilities. Nonexempt transportation projects are those, for the most part, that increase the capacity of the transportation system. Examples include the construction of new roads, highway interchanges and train stations, as well as the widening of existing roads and the expansion of transit services and facilities such as park and ride lots. Regionally Significant projects are those that serve regional transportation needs and that would normally be included in the modeling of a metropolitan area’s transportation network. They include all principal arterial highways and all fixed guideway transit facilities that offer an alternative to regional highway travel.
8.1 PROJECT LISTING
All of the projects in the OCTC 2020-2024 TIP were classified as exempt, nonexempt or regionally significant, and sent to the NYS ICG for review and concurrence on May 21, 2019 and on an on-going basis since. The resulting non-exempt and regionally significant transportation projects indicated below are included in OCTC Regional Emissions Analysis.
TABLE 5. OCTC NONEXEMPT TRANSPORTATION PROJECTS
PIN Project Agency
876142 Kiryas Joel Park & Ride Lot Expansion Local
9 TIMELY IMPLEMENTATION OF TCMS
With respect to 40 CFR 93.122(a)(4)(ii) and 93.125(c), the SIP specifies in 6 NYCRR Subpart 240-3.1 that written commitments for control measures must be obtained prior to a positive conformity determination. There are no Transportation Control Measures specified in the New York State SIP for air quality and no emission reduction credit is claimed in the OCTC regional emissions analysis determination from any measure that is not in the TIP and Plan. Thus, the regional conformity criteria in 6 NYCRR Part 240-3 are met.
17
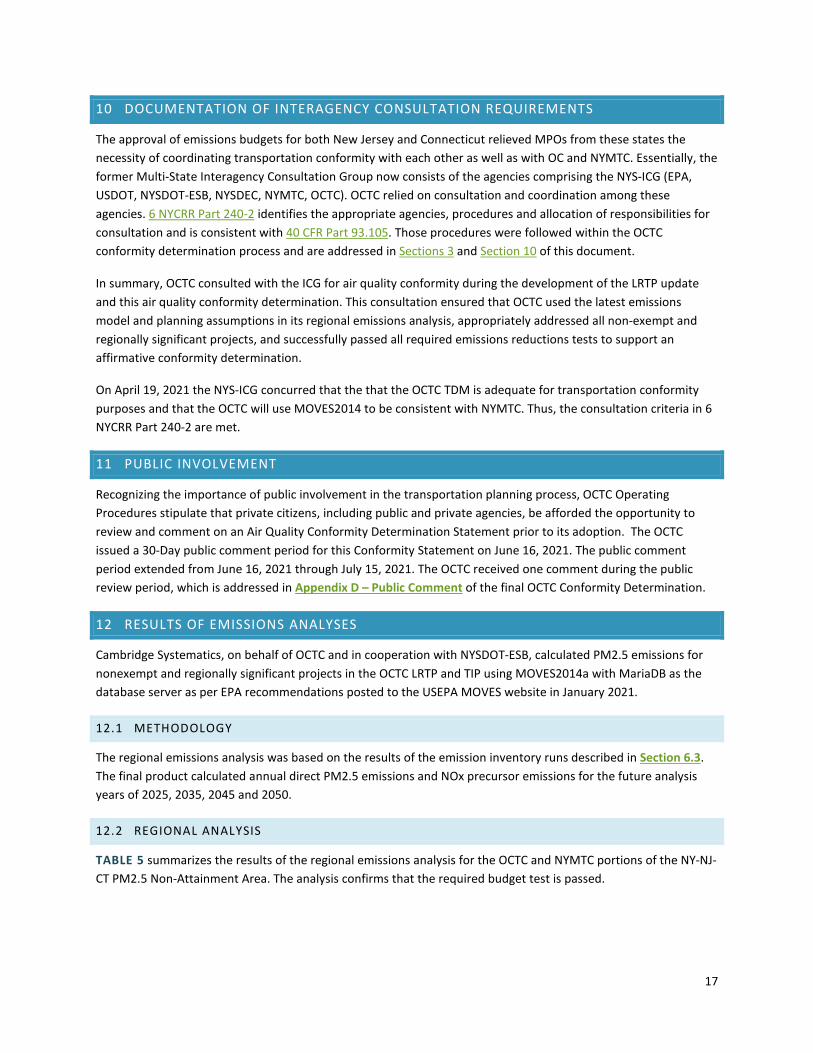
10 DOCUMENTATION OF INTERAGENCY CONSULTATION REQUIREMENTS
The approval of emissions budgets for both New Jersey and Connecticut relieved MPOs from these states the necessity of coordinating transportation conformity with each other as well as with OC and NYMTC. Essentially, the former Multi-State Interagency Consultation Group now consists of the agencies comprising the NYS-ICG (EPA, USDOT, NYSDOT-ESB, NYSDEC, NYMTC, OCTC). OCTC relied on consultation and coordination among these agencies. 6 NYCRR Part 240-2 identifies the appropriate agencies, procedures and allocation of responsibilities for consultation and is consistent with 40 CFR Part 93.105. Those procedures were followed within the OCTC conformity determination process and are addressed in Sections 3 and Section 10 of this document.
In summary, OCTC consulted with the ICG for air quality conformity during the development of the LRTP update and this air quality conformity determination. This consultation ensured that OCTC used the latest emissions model and planning assumptions in its regional emissions analysis, appropriately addressed all non-exempt and regionally significant projects, and successfully passed all required emissions reductions tests to support an affirmative conformity determination.
On April 19, 2021 the NYS-ICG concurred that the that the OCTC TDM is adequate for transportation conformity purposes and that the OCTC will use MOVES2014 to be consistent with NYMTC. Thus, the consultation criteria in 6 NYCRR Part 240-2 are met.
11 PUBLIC INVOLVEMENT
Recognizing the importance of public involvement in the transportation planning process, OCTC Operating Procedures stipulate that private citizens, including public and private agencies, be afforded the opportunity to review and comment on an Air Quality Conformity Determination Statement prior to its adoption. The OCTC issued a 30-Day public comment period for this Conformity Statement on June 16, 2021. The public comment period extended from June 16, 2021 through July 15, 2021. The OCTC received one comment during the public review period, which is addressed in Appendix D – Public Comment of the final OCTC Conformity Determination.
12 RESULTS OF EMISSIONS ANALYSES
Cambridge Systematics, on behalf of OCTC and in cooperation with NYSDOT-ESB, calculated PM2.5 emissions for nonexempt and regionally significant projects in the OCTC LRTP and TIP using MOVES2014a with MariaDB as the database server as per EPA recommendations posted to the USEPA MOVES website in January 2021.
12.1 METHODOLOGY
The regional emissions analysis was based on the results of the emission inventory runs described in Section 6.3. The final product calculated annual direct PM2.5 emissions and NOx precursor emissions for the future analysis years of 2025, 2035, 2045 and 2050.
12.2 REGIONAL ANALYSIS
TABLE 5 summarizes the results of the regional emissions analysis for the OCTC and NYMTC portions of the NY-NJ-CT PM2.5 Non-Attainment Area. The analysis confirms that the required budget test is passed.

18
TABLE 6. REGIONAL EMISSIONS ANALYSIS SUMMARY (MOTOR VEHICLE EMISSIONS BUDGET TEST)
Annual PM2.5 New York Metropolitan PM2.5 Maintenance Area Emission Budget Test Results in Tons Per Year
Analysis Year 2025 2035 2045 2050
SIP Budget 3,291.09 3,291.09 3,291.09 3,291.09
OCTC Emissions 62.74 45.01 43.70 44.65 NYMTC Emissions 577.42 290.17 203.92 256.95
TOTAL OCTC+NYMTC Emissions: 640.16 335.18 247.62 301.60
Conclusion Pass Pass Pass Pass
Annual NOx New York Metropolitan PM2.5 Maintenance Area Emission Budget Test Results in Tons Per Year
Analysis Year 2025 2035 2045 2050
SIP Budget 51,260.81 51,260.81 51,260.81 51,260.81 OCTC Emissions 1,627.87 983.42 930.93 938.45
NYMTC Emissions 18,015.48 9,528.30 8,104.92 10,404.30 TOTAL OCTC+NYMTC
Emissions: 19,643.35 10,511.72 9,035.85 11,342.75
Conclusion Pass Pass Pass Pass
12.3 CONCLUSIONS
The results of the combined OCTC and NYMTC regional emissions analyses indicate that on-road emissions associated with the update of the NYMTC TIP and LRTs are less than the approved motor vehicle emissions budgets in the New York State Implementation Plan for PM2.5 in the New York Metropolitan Area.
Therefore, transportation conformity for the current OCTC and update of the NYMTC TIPs and LRTPs have been demonstrated for the entire New York State portion of the NY-NJ-CT PM2.5 Maintenance Area in accordance with the EPA and NYSDEC transportation conformity regulations. Both the OCTC and NYMTC TIPs continue to conform to the existing New York State Implementation Plan for air quality (SIP).
13 EVIDENCE OF MPO RESOLUTIONS
The final MPO resolution approving this conformity determination will be included in Appendix E of the final documentation after adoption.

19
TABLE 7: MPO ACTIONS IN CONFORMITY ANALYSIS
MPO Product MPO Approval Date FHWA/FTA Approval NYMTC LRTP September 9, 2021* September 30, 2021* NYMTC LRTP conformity update August 19, 2021* September 30, 2021* NYMTC 2020-2024 TIP conformity August 19, 2021* September 30, 2021* OCTC LRTP November 26, 2019 January 7, 2020 OCTC LRTP conformity update August 10, 2021* September 30, 2021* OCTC 2020-2024 TIP conformity August 10, 2021* September 30, 2021* DCTC LRTP July 30, 2021* September 30, 2021* DCTC LRTP Conformity Update November 27, 2019 September 30, 2021* DCTC 2020-2024 TIP Conformity November 27, 2019 September 30, 2021*
*anticipated approval date
CONFORMITY DETERMINATION STATEMENT
The results of the regional emissions analysis demonstrate that the OCTC 2020-2024 Transportation Improvement Program (TIP) and Long Range Transportation Plan (LRTP) 2045 conform to the New York State Implementation Plan (SIP) for air quality.
ADDITIONAL INFORMATION
The conformity document and regional emissions analysis for the OC portion of the NY-NJ-CT PM2.5 Non-Attainment Area can be found at the OCTC website: http://www.orangecountygov.com/octc
All detailed emissions files are available by request from the OC Department of Planning by contacting Lauren Burns at (845) 615-3840 or emailing [email protected].

20
APPENDIX A
MOVES EMISSIONS CALCULATIONS
REGIONAL EMISSIONS ANALYSIS RESULTS: OCTC 2020-2024 TIP & LRTP (JUNE 2021)
Data Source Year VMT
Pollutant NOx PM2.5 - Total (X+B+T)
PM2.5 - Exhaust Total
PM2.5 - Brakewear
PM2.5 - Tirewear
pollutantID 3 110 116 117
Travel Model
2017 4,342,570,082 grams/Year 2,875,990,069 123,426,127 99,775,136 17,015,198 6,635,793 Tons/Year 3,170.20 136.05 109.98 18.76 7.31
2025 4,726,060,291 grams/Year 1,477,142,233 56,929,369 37,850,852 12,544,968 6,533,548 Tons/Year 1,628.25 62.75 41.72 13.83 7.20
2035 5,073,500,000 grams/Year 892,232,060 40,829,235 19,800,205 13,949,650 7,079,381 Tons/Year 983.51 45.01 21.83 15.38 7.80
2045 5,463,822,407 grams/Year 844,585,339 39,647,382 16,055,219 15,796,618 7,795,544 Tons/Year 930.99 43.70 17.70 17.41 8.59
2050 5,661,045,943 grams/Year 851,404,470 40,501,824 15,822,473 16,604,257 8,075,094 Tons/Year 938.50 44.65 17.44 18.30 8.90
Note: Tons = US Short Tons

21
APPENDIX B
OCTC OFF-MODEL EMISSIONS RESULTS NOx
Year OCTC NOx Minus off-model Total 2025 1628.25 -0.38 1,627.87 2035 983.51 -0.09 983.42 2045 930.99 -0.06 930.93 2050 938.50 -0.05 938.45
PM2.5 Year OCTC PM2.5 Minus off-model Total 2025 62.75 -0.01 62.74 2035 45.01 0.00 45.01 2045 43.70 0.00 43.70 2050 44.65 0.00 44.65

22
APPENDIX C – PONA CONFORMITY STATEMENT
TRANSPORTATION CONFORMITY DETERMINATION STATEMENT (1997 POUGHKEEPSIE OZONE NON-ATTAINMENT AREA)
JUNE 2021
Dutchess County Transportation Council (DCTC) 85 Civic Center Plaza, Suite 107 Poughkeepsie, NY 12601 Phone: (845) 486-3600 | Email: [email protected] Web: http://www.dutchessny.gov/pdctc.htm New York Metropolitan Transportation Council (NYMTC) 25 Beaver Street, Suite 201 New York, NY 10004 Phone: (212) 383-7200 | Email: [email protected] Web: http://www.nymtc.org Orange County Transportation Council (OCTC) 124 Main Street Goshen, NY 10924 Phone: (845) 615-3840 | Email: [email protected] Web: https://www.orangecountygov.com/octc
23
ABOUT THE DCTC, NYMTC, & OCTC
The Dutchess County Transportation Council (DCTC), Orange County Transportation Council (OCTC), and New York Metropolitan Transportation Council (NYMTC), serve as the designated Metropolitan Planning Organizations (MPOs) for Dutchess, Orange, and Putnam Counties. In accordance with the provisions set forth in the current federal transportation law – the Fixing America’s Surface Transportation (FAST) Act – and 23 U.S.C. 134 and 49 U.S.C. 5303, the DCTC, OCTC, and NYMTC are tasked with carrying out a cooperative and comprehensive multimodal transportation planning process in their respective metropolitan planning areas. Federal transportation law requires that a U.S. Census-designated Urbanized Area be represented by an MPO, which is responsible for ensuring that federal highway and transit dollars are committed through a locally driven, comprehensive planning process.
PURPOSE
This Transportation Conformity Determination Statement for the DCTC, OCTC, and NYMTC Metropolitan Transportation Plans (MTPs) and Transportation Improvement Programs (TIPs) was prepared jointly by the DCTC, OCTC, and NYMTC, with the following agencies contributing towards its completion:
• Federal Highway Administration (FHWA) • Federal Transit Administration (FTA) • Environmental Protection Agency (EPA) • NYS Department of Environmental Conservation (NYSDEC) • NYSDOT-Environmental Science Bureau • NYSDOT-Region 8 (Hudson Valley)
EXECUTIVE SUMMARY
As part of their transportation planning processes, the DCTC, OCTC, and NYMTC completed a modified transportation conformity process for their MTPs and TIPs, which was prompted by DCTC’s and NYMTC’s adoption of new MTPs (note: OCTC’s current MTP was completed in 2019). This report documents that the new and/or current MTPs and TIPs of the three MPOs meet the federal transportation conformity requirements in 40 CFR Part 93.
Clean Air Act (CAA) section 176(c) (42 U.S.C. 7506(c)) requires that federally funded or approved highway and transit activities are consistent with (“conform to”) the purpose of the State Implementation Plan (SIP). Conformity to the purpose of the SIP means that transportation activities will not cause or contribute to new air quality violations, worsen existing violations, or delay timely attainment of the relevant National Ambient Air Quality Standards (NAAQS) or any interim milestones. 42 U.S.C. 7506(c)(1), the EPA’s transportation conformity rule, establishes the criteria and procedures for determining whether MTPs, TIPs, and federally supported highway and transit projects conform to the SIP and 40 CFR Parts 51.390 and 93.
On February 16, 2018, the United States Court of Appeals for the District of Columbia Circuit in South Coast Air Quality Mgmt. District v. EPA (“South Coast II,” 882 F.3d 1138) held that transportation conformity determinations must be made in areas that were either nonattainment or maintenance for the 1997 ozone NAAQS and attainment for the 2008 ozone NAAQS when the 1997 ozone NAAQS was revoked. These conformity determinations are required in these areas after February 16, 2019. The Poughkeepsie Ozone Nonattainment Area was in an attainment status at the time of the 1997 ozone NAAQS revocation on April 6, 2015 and was also designated

24
attainment for the 2008 ozone NAAQS on May 21, 2012. Therefore, per the South Coast II decision, this conformity determination is being made for the 1997 ozone NAAQS.
This conformity determination was completed consistent with CAA requirements, existing associated regulations at 40 CFR Parts 51.390 and 93, and the South Coast II decision, according to EPA’s Transportation Conformity Guidance for the South Coast II Court Decision issued on November 29, 2018.
TRANSPORTATION CONFORMITY PROCESS
The concept of transportation conformity was introduced in the Clean Air Act (CAA) of 1977, which included a provision to ensure that transportation investments conform to a State implementation plan (SIP) for meeting the Federal air quality standards. Conformity requirements were made substantially more rigorous in the CAA Amendments of 1990. The transportation conformity regulations that detail implementation of the CAA requirements were first issued in November 1993, and have been amended several times. The regulations establish the criteria and procedures for transportation agencies to demonstrate that air pollutant emissions from metropolitan transportation plans, transportation improvement programs and projects are consistent with (“conform to”) the State’s air quality goals in the SIP. This document has been prepared for State and local officials who are involved in decision making on transportation investments.
Transportation conformity is required under CAA Section 176(c) to ensure that federally supported transportation activities are consistent with (“conform to”) the purpose of a State’s SIP. Transportation conformity establishes the framework for improving air quality to protect public health and the environment. Conformity to the purpose of the SIP means Federal Highway Administration (FHWA) and Federal Transit Administration (FTA) funding and approvals are given to highway and transit activities that will not cause new air quality violations, worsen existing air quality violations, or delay timely attainment of the relevant air quality standard, or any interim milestone.
POUGHKEEPSIE OZONE NONATTAINMENT AREA
Effective June 15, 2004, the EPA designated Dutchess, Orange, and Putnam County to be a nonattainment area under the 8-hour ozone standard. Based on 2001-2003 data, the 8-hour ozone design value for the Poughkeepsie Ozone Nonattainment Area was 0.094 ppm. Dutchess, Orange and Putnam County were therefore classified as a Moderate Ozone Nonattainment Area under the 8-hour ozone standard.
On May 21, 2012, the EPA issued its air quality designations for the 2008 ozone NAAQS. With an effective date of July 20, 2012, the EPA designated the Poughkeepsie Area (i.e. Dutchess, Orange, and Putnam County) as being in attainment for the 2008 ozone NAAQS of 0.075 ppm.
On June 4, 2018, the EPA issued its air quality designations for the 2015 ozone NAAQS of 0.070 ppm. Effective August 3, 2018, the EPA designated the Poughkeepsie Area (i.e. Dutchess, Orange, Putnam, and Ulster County) as being in attainment for the stricter 2015 ozone standard.
Air quality data from the most recent three years indicates that the Poughkeepsie area has maintained a 3-year ozone design value of 0.069 ppm for the 4th highest 8-hour average, which continues to meet the 2015 NAAQS.
METROPOLITAN TRANSPORTATION PLANS (MTPS)
The MTP serves as the strategic, long-range multimodal transportation plan for a Metropolitan Planning Area. Spanning no less than a 20-year horizon, the MTP must address the ten planning factors in the FAST Act and be fiscally constrained. In attainment areas, the MTP is updated every five years, while in nonattainment areas it is
25
updated every four years. Below is a summary of the three MTP’s that cover the Poughkeepsie 1997 Ozone Nonattainment Area.
DUTCHESS COUNTY TRANSPORTATION COUNCIL MTP
The DCTC’s new MTP, Moving Dutchess Forward, will supersede the current MTP, Moving Dutchess 2, which was adopted in 2016. The new MTP has a 2045 planning horizon and focuses on four key goals: 1) Preparing a transportation system that can anticipate and adapt to changes, 2) Providing safe and convenient access for all people, 3) Promoting smart transportation and land use policies, and 4) Making transformative investments. The MTP includes an analysis of future trends and their affect on transportation (e.g. demographic and economic changes, climate change, technology, etc.), and an assessment of barriers to safety, reliability, and access to basic needs. The MTP included extensive outreach and was informed by feedback from the public. To focus its investment on addressing identified barriers, the MTP recommends specific transformative projects and a series of transformative packages – though the focus is on system preservation. The MTP recommendations support the projects pursued in the TIP and planning studies supported in the annual Unified Planning Work Program (UPWP).
ORANGE COUNTY TRANSPORTATION COUNCIL MTP
The OCTC’s current MTP, LRTP 2045, was adopted in 2019, and uses a 2045 planning horizon year. The MTP incorporates a technical analysis of demographic and transportation data, a regional vision established by the Orange County Comprehensive Plan update, and specific performance targets. It was supported by an extensive public outreach process, along with transportation agency input to create its goals, objectives, and strategies. The MTP also outlines agency planning and funding outlooks (especially for federal funding) and lays out the OCTC goals and recommendations for the next 25 years. The MTP includes a fiscally constrained investment plan to preserve and improve the transportation system in the near and long term. LRTP 2045 also supports the projects pursued in the near-term TIP period, the post TIP period, and the planning studies supported in the UPWP.
NEW YORK METROPOLITAN TRANSPORTATION COUNCIL MTP
NYMTC’s new MTP, Moving Forward-Your Region, Connected, will supersede the current MTP, Plan 2045, which was adopted in 2017. The new MTP covers all modes of ground transportation including highways, roads and bridges, streets, rail and bus transit, bicycle and pedestrian facilities, movement of goods, and special needs transportation. In addition, it addresses key transportation activities such as operations and management of the transportation system, safety, security, and regional finances. The MTP will serve as a blueprint to help support sustainable growth and guide federal funding for transportation investment in the greater New York City region. The MTP was developed collaboratively with NYMTC member agencies, other stakeholders, and members of public. As with the DCTC and OCTC, NYMTC’s MTP supports the projects pursued in its TIP and the planning studies supported in its UPWP.
TRANSPORTATION IMPROVEMENT PROGRAMS (TIPS)
The three TIPs of the DCTC, OCTC, and NYMTC serve as the prioritized listings of federally funded transportation projects in Dutchess, Orange, and Putnam County, and they are developed and adopted by each MPO as part of their metropolitan transportation planning process. The TIPs identify capital and non-capital surface transportation projects or project phases that are proposed for funding under 23 U.S.C. and 49 U.S.C. Chapter 53. At a minimum, each TIP must be updated at least once every four years and approved by the MPO and Governor. In New York, the

26
TIP update cycle coincides with the update cycle for the Statewide Transportation Improvement Program (STIP), which is typically done every three years.
The FAST Act requires that MPOs develop their TIPs in cooperation with the State and all affected public transportation operators. The TIPs must contain projects that are consistent with current MTPs and reflect the investment priorities established by each MPO. Each TIP must also include, to the maximum extent practicable, a description of the anticipated effect of the TIP on achieving the performance targets established in the MTPs, linking investment priorities to those performance targets.
TRANSPORTATION CONFORMITY DETERMINATION
Per the court’s decision in South Coast II, beginning February 16, 2019, a transportation conformity determination for the 1997 ozone NAAQS will be needed in 1997 ozone NAAQS nonattainment and maintenance areas identified by EPA for certain transportation activities, including updated or amended metropolitan MTPs and TIPs. Once USDOT makes its 1997 ozone NAAQS conformity determination for the DCTC, OCTC, and NYMTC TIPs, conformity will be required no less frequently than every four years. This conformity determination not only addresses transportation conformity for the 1997 Ozone Nonattainment standard for the new DCTC and NYMTC MTPs, but also the current MTP for OCTC, and the current TIPs of the DCTC, NYMTC, and OCTC.
OVERVIEW
On November 29, 2018, EPA issued Transportation Conformity Guidance for the South Coast II Court Decision (EPA-420-B-18-050, November 2018) that addresses how transportation conformity determinations can be made in areas that were nonattainment or maintenance for the 1997 ozone NAAQS when the 1997 ozone NAAQS was revoked, but designated attainment for the 2008 ozone NAAQS in EPA’s original designations for this NAAQS (May 21, 2012).
The transportation conformity regulation at 40 CFR 93.109 sets forth the criteria and procedures for determining conformity. The conformity criteria for MTPs and TIPs include the following: latest planning assumptions (93.110), latest emissions model (93.111), consultation (93.112), transportation control measures (93.113(b) and (c), and emissions budget and/or interim emissions (93.118 and/or 93.119).
For the 1997 ozone NAAQS areas, transportation conformity for MTPs and TIPs for the 1997 ozone NAAQS can be demonstrated without a regional emissions analysis, per 40 CFR 93.109(c). This provision states that the regional emissions analysis requirement applies one year after the effective date of EPA’s nonattainment designation for a NAAQS and until the effective date of revocation of such NAAQS for an area. The 1997 ozone NAAQS revocation was effective on April 6, 2015, and the South Coast II court upheld the revocation. As no regional emission analysis is required for this conformity determination, there is no requirement to use the latest emissions model, budget, or interim emissions tests.
Therefore, transportation conformity for the 1997 ozone NAAQS for the MTPs and TIPs can be demonstrated by showing the remaining requirements in Table 1 in 40 CFR 93.109 have been met. These include the following requirements that are addressed in Section 2.4 of EPA’s guidance:
1. Latest planning assumptions (93.110) 2. Consultation (93.112) 3. Transportation Control Measures (93.113) 4. Fiscal constraint (93.108)

27
LATEST PLANNING ASSUMPTIONS
The use of latest planning assumptions in 40 CFR 93.110 of the conformity rule generally apply to regional emissions analysis. In the 1997 ozone NAAQS areas, the use of latest planning assumptions requirement applies to assumptions about Transportation Control Measures (TCMs) in an approved SIP.
As per previous ICG guidance, and as documented in previous conformity determination statements for the Poughkeepsie Ozone Nonattainment Area, no TCMs are identified for Dutchess, Orange, or Putnam County as part of the applicable State Implementation Plan (SIP). Therefore, the TCM implementation conformity criterion does not apply to these MPOs. In addition, no recommendations in the new or current MTPs, or current TIPs, of the DCTC, NYMTC, and OCTC will interfere with the timely implementation of TCMs in other areas.
CONSULTATION REQUIREMENTS
The consultation requirements in 40 CFR 93.112 were addressed both for interagency consultation and public consultation. As per Regulations (6 NYCRR) Part 240, interagency consultation was conducted with the NYSDEC, NYSDOT, FHWA, FTA and USEPA. Representatives of these agencies comprise the Interagency Consultation Group (ICG) for air quality conformity in New York State.
The statewide process for addressing the South Coast II decision began with a conference call December 20, 2018 that included federal, state, and MPO representatives. Interagency consultation was conducted consistent with the New York State Transportation Conformity SIP, as codified in Chapter 6 of the New York Codes Rules.
To assess the possible air quality impacts of projects programmed in the MTPs and TIPs, the DCTC, OCTC, and NYMTC identified those projects that could be classified as ‘non-exempt’ (i.e. may have adverse emissions impacts). These are typically road projects that change capacity by at least one travel lane, or transit projects that change capacity on a fixed route system. These types of projects require close monitoring to ensure that they do not worsen regional air quality.
Although most all of the projects in the MTPs and TIPs are ‘exempt,’ the DCTC, OCTC and Putnam County portion of the NYMTC TIP includes one ‘non-exempt’ project: PIN 876142: Kiryas Joel Park & Ride Lot Expansion – Village of Kiryas Joel, Orange County.
This conformity document was provided in draft form to the ICG on June 1, 2021, as part of the interagency review process. It also followed the same format and process used for previous conformity determinations that were done for the DCTC, OCTC, and NYMTC.
Public consultation will be conducted consistent with planning rule requirements in 23 CFR 450. As per their bylaws/procedures, the DCTC, OCTC, and NYMTC held public comment periods for this transportation conformity statement. The public will be provided an opportunity to review and comment on the draft conformity determination and supporting documentation during each MPO’s comment period.
The DCTC, OCTC, and NYMTC will hold their 30-Day comment periods from June 16, 2021 through July 15, 2021. The comment period for the draft conformity statement will effectively conclude on July 15, 2021 and any comments received by the three MPOs will be summarized in the final document.
TIMELY IMPLEMENTATION OF TCMS
There are no TCMs in the SIP for the Poughkeepsie, NY 1997 ozone nonattainment area.

28
FISCAL CONSTRAINT
Transportation conformity requirements in 40 CFR 93.108 state that MTPs and TIPs must be fiscally constrained consistent with USDOT’s metropolitan planning regulations at 23 CFR part 450. The DCTC, NYMTC, and OCTC MTPs, as well as their TIPs, are fiscally constrained, as demonstrated in their respective documents.
CONCLUSION
The conformity determination process completed for the MTPs and TIPs of the DCTC, OCTC, and NYMTC demonstrates that they meet the Clean Air Act and Transportation Conformity rule requirements for the 1997 ozone NAAQS. The signed resolutions adopting this conformity determination will be included in the final documentation.

29
APPENDIX D – PUBLIC COMMENT
The Orange County Transportation Council (OCTC) held a 30-day public comment period from June 16, 2021 through July 15, 2021 for the draft Transportation Conformity Determination. One public comment was received for the draft Transportation Conformity Determination.
Name: Burt Thelander Email: [email protected] Submission Date: 6/27/2021 Comment: I am a member of the Pathways Committee, a group of OC citizens/OC Parks/OC
Planning/OC Tourism/OC not for profits that is promoting non motorized transportation options within OC. I am also very concerned about the impact of fossil fuel transportation options upon our climate change crisis, and believe we must take immediate action to mitigate the impact of cars/trucks/buses that use gasoline/diesel fuel. My review of the above report finds brief mention of the need to promote non motorized transportation options such as trails to reduce use of vehicles and reduce congestion within OC and surrounding communities. Please continue to promote funding of transportation options such as the Chester to Salisbury Mills rail trail, improving the Heritage Trail, and seeking other rail trail development options within OC to reduce our use of fossil fuel options. Please also collaborate with other counties such as Ulster, Sullivan, Rockland to promote non motorized transportation options. Thank you for listening.
Response: Dear Mr. Thelander Thank you for your comment. The OCTC recognizes the importance of a non-motorized transportation network in Orange County and surrounding counties to mitigate congestion and reduce the negative impacts of mobile-source pollution; outlined in the goals, strategies, and objectives on the following policy documents: Long Range Transportation Plan, 2020-2024 TIP Narrative, and Mid Hudson Valley Transportation Management Area (TMA) Congestion Management Process (CMP). Please note, the purpose of the Air Quality/Transportation Conformity Determination document is to ensure that transportation projects in OCTC’s 2020-2024 Transportation Improvement Program (TIP) and 2019 Long Range Transportation Plan (LRTP) do not affect an area's ability to reach its EPA clean air goals in Orange County’s portion of the Poughkeepsie-Newburgh Ozone Non-Attainment Area and the Maintenance Area for Fine Particulate Matter (PM 2.5). The results of the regional emissions analysis demonstrate that the OCTC 2020-2024 Transportation Improvement Program (TIP) and Long Range Transportation Plan (LRTP) 2045 conform to the New York State Implementation Plan (SIP) for air quality, as is stated in the Conformity Statement on page 19 of this document.

30
APPENDIX E – SUPPORTING RESOLUTION*
*to be updated with signed resolution post adoption