Transportation & The Canadian economy - comt.ca · PDF filecontinues to be a major focus of...
32
TRANSPORTATION & THE ECONOMY October 2014 Final Report of the PPSC Task Force on Transportation and the Economy
-
Upload
nguyenthien -
Category
Documents
-
view
213 -
download
0
Transcript of Transportation & The Canadian economy - comt.ca · PDF filecontinues to be a major focus of...

TRANSPORTATION & THE ECONOMY
October 2014
Final Report of the
PPSC Task Force on
Transportation and the
Economy

1
Message from the Task Force In September 2013, the Canadian Council of Ministers Responsible for Transportation and Highway Safety endorsed a Vision for Transportation in Canada.
In support of this vision, transportation officials from across the country have collaborated to analyse the importance of transportation networks to the economy, the critical role they play in economic development and growth, as well as quality of life. The Task Force on Transportation and the Economy has structured this report to outline the case for governments across Canada to continue making strategic investments in maintaining and expanding our transportation infrastructure. The report outlines:
The impact of transportation investments on productivity;
A high-level description of Canada’s core transportation infrastructure;
The importance of connectivity and mobility to economic activity in all regions of the country; and,
Some challenges that are particular to our far north.
“In 2030, Canada will continue to maintain, promote and enhance safe, competitive, viable and sustainable transportation networks that enhance economic prosperity and quality of life.”

2
Executive Summary Canada’s transportation networks form the literal backbone of the country’s economy. In our smallest towns and our biggest cities, Canadians depend on transportation to participate in the global marketplace. This report adds to the growing body of government research that connects infrastructure to economic growth. More specifically, it makes the straightforward argument that transportation – across all modes – makes a positive contribution to our provincial-territorial and national economies. Transportation infrastructure is a big part of this story. Across the country governments are pursuing significant infrastructure projects (see appendix for examples), for which economic outcomes are top of mind. The right infrastructure allows us to fulfill our economic potential by connecting disparate regions, moving people and goods safely and efficiently, and accessing new economic opportunities. Building and maintaining effective transportation systems has real benefits. Productivity continues to be a major focus of public policy – one in which transportation plays a vital role. Moving goods and people as efficiently as possible reduces the cost of doing business. The transportation industry supports hundreds of thousands of Canadian jobs, and contributes billions in GDP across all modes. The success of this industry is supported by the efforts of all jurisdictions to harmonize regulations and improve road safety conditions across the country. Governments’ approach to coordinating vehicle weights and dimensions policy, and to embrace innovative approaches to planning and financing projects, is critical to the effective functioning of our transportation networks, and to supporting economic growth. Resource development is a priority that cannot be realized without greater access to many remote and northern communities – not just for industrial purposes, but to provide communities with the goods and services they need to thrive. Pressure is rising to provide Canadians and their businesses with multimodal transportation options that meet their needs and keep them internationally competitive. Effective transportation systems provide a much needed advantage in attracting talent and investment, but also for capitalizing on new opportunities, like the Canada-European Union Comprehensive Economic and Trade Agreement (CETA). As Canadian governments work together to achieve the Strategic Vision for Transportation, the message of this report bears repeating: transportation makes a positive economic contribution. Strong transportation systems lead to a stronger economy.

3
The Global Context: The “New Normal”
Transportation enables domestic and international trade. The movement of goods, people and services across borders, and the mobility of passengers and workers overseas simply cannot occur without transportation routes, networks and infrastructure. Indeed, the future success of Canada’s economy and transportation system will depend on its ability to respond to a dynamic global landscape and take advantage of new opportunities. Key features of the global landscape are presented below. While this report explores global economic drivers through a transportation lens, there are also a number of relevant overarching themes:
Supporting the transportation system in an environmentally sustainable manner, especially as world markets for “green” consumer and industrial products and services, including fuel-efficient vehicles, alternative fuel vehicles, and greener modes of transportation continue to grow;
Balancing the need to move goods and people efficiently with the need to understand and assess potential threats to the transportation system in order to ensure those movements are safe and secure; and
Understanding the impact of demographic change on the economy, as global population expansion and urbanization increases demand for essential resources, including transportation, and aging western populations require new transportation approaches and solutions.
Key Elements of the “New Normal”
1. Emerging Markets: While the U.S. has been Canada’s key trading partner in the past, and will continue to be important, the BRICs (i.e., Brazil, Russia, India and China) and the “breakout” nations (e.g., Indonesia, South Korea, and Turkey) account for a rising share of world output and are experiencing population growth, urbanization and growing affluence. Furthermore, the establishment of new trading blocs and partnerships, including the successful conclusion of a Canada-European Union Comprehensive Economic and Trade Agreement (CETA), increased bilateral commercial ties with China and India, and deeper ties with Latin America, could create more market opportunities for Canadian trade, investments, tourism and technology transfer. This could in turn support long-run growth and development in Canada.

4
2. Slow Growth: A sluggish global recovery, financially-constrained consumers, and ongoing fiscal austerity will continue to exert strong pressures on current and future economic activity. The pressure to reduce supply chain costs will intensify across all transportation modes, a trend that will also be driven by growing production input costs, including land, labour, capital and energy. The success of Canada’s current and future industrial development will greatly depend, among other things, on the nation’s ability to implement advanced technologies. Regulatory regimes must be nimble enough to balance technological advancement with the high standards of safety and efficiency that Canadians have come to expect from their transportation system.
3. Demand for Resources:
Intensified competition for energy and other natural resources, along with technological advancement, are leading to greater interest in exploration and extraction opportunities in the north, including environmentally sensitive onshore and offshore areas. Changing ice conditions and longer shipping seasons could lead to increased Arctic shipping traffic.
Canada’s Top 5 Import Destinations (2009-2013): 1. U.S. = 52.1% ($247.8B) 2. China = 11.1% ($52.7B) 3. Mexico = 5.6% ($26.7B) 4. Germany = 3.2% ($15.4B) 5. Japan = 2.9% ($13.7B) Source: Statistics Canada (NAICS 11-91)
Canada’s Top 5 Export Destinations (2009-2013): 1. U.S. = 75.9% ($358.1B) 2. China = 4.3% ($20.5B) 3. U.K. = 3.0% ($14B) 4. Japan = 2.3% ($10.6B) 5. Mexico = 1.1% ($5.4B) Source: Statistics Canada (NAICS 11-91)
BRIC Nations: Brazil Russia India China
Canada’s Top 5 Trading Partners

5
These increased activity levels are leading to demands for infrastructure and services (e.g., port facilities, search and rescue patrol, and environmental protection) that will support economic development opportunities in the north. Rising production in Canada’s oil sands region is driving an increased need to transport oil products from northern Alberta to markets in the rest of Canada, south of the border, and overseas. The development and growing export of conventional and unconventional energy to new high-growth markets and to mature established markets will contribute to increased movement of hazardous goods within Canada. This will require appropriate policies with new safety measures and community and environmental support.
4. Industrial Change: Lean supply chains rely heavily on low transportation costs to reduce inventory needs and support just-in-time inventory. In a high oil price and labour cost environment, U.S. and European firms could be more likely to source components from Mexico and Eastern Europe, respectively, rather than from China or other distant offshore locations. A re-shoring of some production back to North America is expected, especially as manufacturing goes increasingly digital (e.g., 3D printing) and U.S. and overseas manufacturers take advantage of North America’s shale gas and oil boom. For years, Canadian employers, including transportation and logistics companies, have repeatedly reported difficulties attracting and retaining sufficient numbers of skilled and qualified workers at all levels, driven in part by the pace of technological advancement. Canada’s freight and passenger labour force is aging rapidly and will continue to shrink in size with continued worker retirements. Transportation jobs of the 21st century will need more specialized education and training, especially given the continued integration of computers and software into transportation equipment and infrastructure services. Recruitment, retention, training and compensation will continue to preoccupy Canadian corporate leaders and senior public policy makers.
MEXICO’S NORTHERN ECONOMIC CORRIDOR
NAFTA links 450M people and $17T worth of goods and services. In 2011, Mexico’s export trade with the U.S. and Canada was $254B (71%) and $23B (6.5%) respectively. Import trade was $161B (57%) and $25B (9%).
Mexico developed its Northern Economic Corridor (NEC) national strategy to coordinate transportation infrastructure and logistics planning in seven northern states (Tamaulipas, Nuevo Leon, Coahuila, Chihuahua, Durango, Zacatecas and Sinaloa). The NEC links the Gulf of Mexico with the port of Mazatlán on the Pacific, as well as three major land ports of entry along the US border.
The strategic objective for the NEC is to promote economic development along the corridor and within Mexico by integrating multi-modal infrastructure investments (marine, rail, road) with manufacturing and distribution investments in key centres. In 2013, a new 136-mile segment of the Route 40 highway opened connecting Mazatlán with Durango. The 12 year project cost $2.3B.The new Mazatlán-Durango highway connection reduces driving time from Mazatlán to San Antonio, Texas from 18 to 12 hours, potentially opening up a new gateway for goods moving between Asia and North America. Since 1994, Mexico has negotiated 12 free trade agreements involving 44 countries representing 70% of global GDP. Since 2002, Mexico has also made investments over $2.3B on NEC Infrastructure. As Mexico’s global trade increases, manufacturing and distribution investments along the NEC will also increase, thereby having additional trade, traffic and infrastructure implications (i.e., highways, port-of-entry, rail capacity) for all NAFTA partners.

6
Transportation Infrastructure Drives Productivity
What is productivity? Productivity refers to the level of output (goods and services) created per unit of input (labour and capital) used in production. Productivity is essential to the long-term health of the Canadian economy. Economic growth depends on the private sector’s ability to increase output while maintaining the level of inputs. Increasing productivity is a primary goal: a more productive firm is a more competitive firm. This maxim translates to the broader economy: a more productive economy is a more competitive economy. Why is it important? At an economy-wide level, productivity growth is a key source of economic growth and quality of life. According to the Conference Board of Canada, “productivity is the single most important determinant of a country’s per capita income over the long-term. Countries that are innovative and able to adapt to the ebb and flow of the new global economy boast high productivity and thus a superior standard of living.”1
Enhancing Canada’s productivity has been an important focus of many research institutions, policy-makers and politicians across the country in recent years. Canada’s “productivity gap” relative to the United States is the subject of numerous papers, media articles, report cards, studies and speeches from all points on the political spectrum. Meanwhile, governments are exploring potential solutions within the context of this heightened focus.
PRODUCTIVITY ADVANTAGE:
THE UNITED STATES INTERSTATE SYSTEM
At over 76,000 km, the U.S. Interstate Highway System is undoubtedly a competitive advantage of the American economy. Since its inception over 50 years ago, the interstate system has delivered significant productivity gains. According to the U.S. Department of Transportation and the Federal Highway Administration the average annual industry production cost savings between 1950 and 1989 was 18 cents for every dollar invested in the road system. The Economist cites the U.S. Interstate as the model for China’s current infrastructure building boom and notes its success in lowering business costs across more than 35 industries. Though highway-related productivity gains have slowed since the completion of the system in the 1980s, the U.S. interstate represents the literal groundwork of America’s economic success.

7
It is widely understood that increasing productivity is a complex and multi-faceted challenge. However, there is a growing consensus that public infrastructure has a significant role to play. In 2009, Statistics Canada estimated that after accounting for private sector contributions, on average, 50 per cent of Canada’s multi-factor productivity growth between 1962 and 2006 was from public infrastructure.2 Transportation infrastructure is a major part of this story. Not only because of its positive contribution to productivity growth, but also because ongoing transportation challenges are tied to the productivity problem, as a key element of the business environment. The Canada West Foundation recently commented that “traffic is slowly strangling our cities. It’s the time wasted in traffic that could have been put to more productive use. It’s the late deliveries, the missed appointments, and the margin of error needed to cover the risks of either.”3 Dealing with these challenges is critical. The federal, provincial and territorial governments are committed to continually improving transportation networks to foster productivity and create a globally competitive business climate. How does transportation infrastructure improve productivity? Improving productivity all comes down to reducing the cost of doing business and, thus, enabling greater output (i.e., GDP growth). Statistics Canada estimates that each dollar of public infrastructure investment can reduce business costs by, on average, 11 cents (27 cents for manufacturing costs).4 The Victoria Transport Policy Institute explains transportation’s role in the process like this: “Increasing transport system efficiency provides productivity gains that filter through the economy in various ways. For example, reduced shipping costs may increase business profits, reduce retail prices, improve service quality (more frequent deliveries), allow tax increases, or a combination of these. Even modest efficiency gains can provide significant benefits.” 5
8
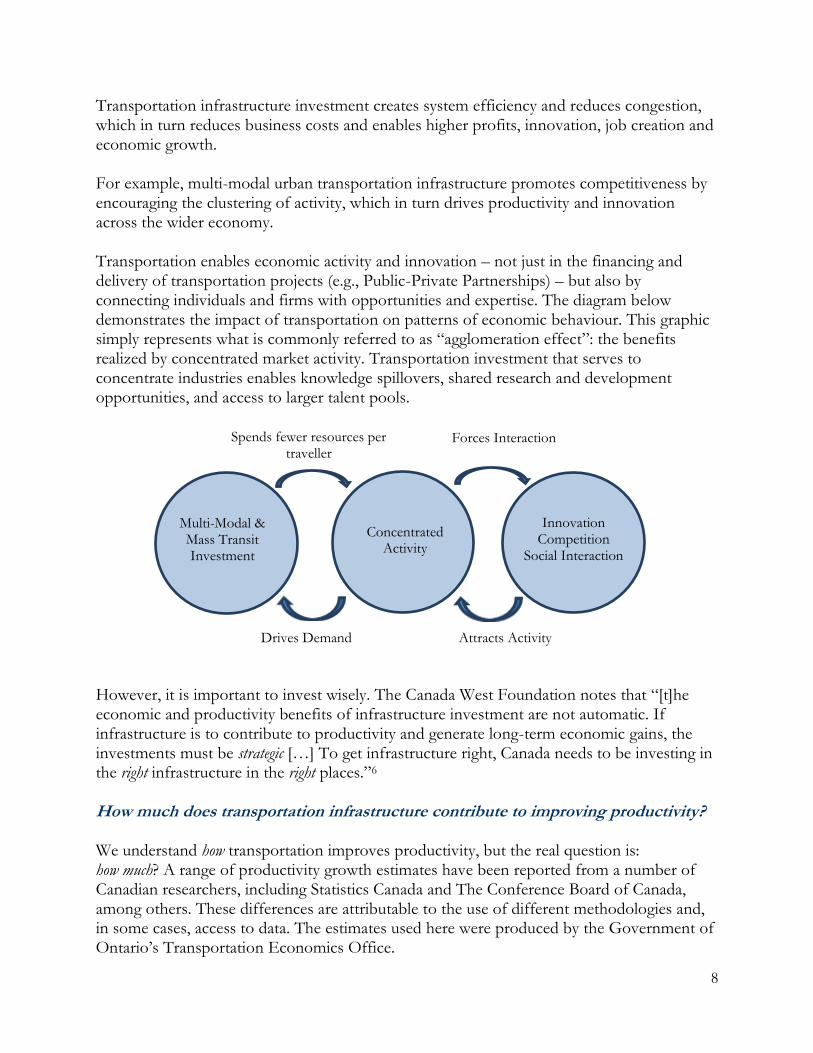
Transportation infrastructure investment creates system efficiency and reduces congestion, which in turn reduces business costs and enables higher profits, innovation, job creation and economic growth. For example, multi-modal urban transportation infrastructure promotes competitiveness by encouraging the clustering of activity, which in turn drives productivity and innovation across the wider economy. Transportation enables economic activity and innovation – not just in the financing and delivery of transportation projects (e.g., Public-Private Partnerships) – but also by connecting individuals and firms with opportunities and expertise. The diagram below demonstrates the impact of transportation on patterns of economic behaviour. This graphic simply represents what is commonly referred to as “agglomeration effect”: the benefits realized by concentrated market activity. Transportation investment that serves to concentrate industries enables knowledge spillovers, shared research and development opportunities, and access to larger talent pools. However, it is important to invest wisely. The Canada West Foundation notes that “[t]he economic and productivity benefits of infrastructure investment are not automatic. If infrastructure is to contribute to productivity and generate long-term economic gains, the investments must be strategic […] To get infrastructure right, Canada needs to be investing in the right infrastructure in the right places.”6 How much does transportation infrastructure contribute to improving productivity? We understand how transportation improves productivity, but the real question is: how much? A range of productivity growth estimates have been reported from a number of Canadian researchers, including Statistics Canada and The Conference Board of Canada, among others. These differences are attributable to the use of different methodologies and, in some cases, access to data. The estimates used here were produced by the Government of Ontario’s Transportation Economics Office.
Innovation Competition
Social Interaction
Spends fewer resources per traveller
Forces Interaction
Drives Demand Attracts Activity
Multi-Modal & Mass Transit Investment
Concentrated Activity

9
97 104 111 118 125 132 139 146 153
2000 2005 2010 2015 2020 2025 2030
Labour productivity
Labour productivity without transportation infrastructure
In Ontario alone the data suggests that, on average, investments in public transportation infrastructure contribute 5 per cent (0.11 percentage points) of annual provincial GDP growth.7 In other words, for every GDP increase of $100, $5 of that is attributable to transportation infrastructure. On average this annual contribution to growth adds $372 million to the provincial economy.8 The cumulative effect of this contribution over time is significant. The figure below demonstrates the importance of transportation infrastructure by showing Ontario’s labour productivity index with and without transportation infrastructure investments from 2002 to 2030.
Using 2002 as a base year, the figure demonstrates the gap in labour productivity growth that would occur without transportation infrastructure (red line). There is a two percentage point gap in 2010 (the last year for which data are available). This gap is expected to grow to seven percentage points by 2030. Transportation infrastructure’s contribution to productivity compounds over time, making it a smart long-term investment in the future of our economy. Ontario and some other Canadian jurisdictions are working collaboratively to share their methodologies and productivity analyses. Any results of this collaboration will be shared as they become available. This evidence clearly indicates the important role that sustained investment in transportation infrastructure continues to play. However, new infrastructure is not the only solution to improving Canada’s productivity performance. Asset management can maximize the benefits provided by infrastructure and provide opportunities to achieve cost savings by spotting deterioration early on and taking action to rehabilitate or renew the asset.
Ontario’s labour productivity index with and without transportation infrastructure 2002-2030 9(2002=100)

10
Good asset management is important for all orders of government. It results in informed and strategically sound decisions that optimize investments and take into account the potential impact of other factors, such as climate change (e.g., damage due to extreme weather). Ongoing efforts to harmonize transportation regulations across jurisdictions also have a significant impact on productivity. For example, the work of the National Task Force on Vehicle Weights and Dimensions Policy continues to support the competitiveness of the Canadian trucking industry. Since the development of the national memorandum of understanding (MOU) in 1988, harmonized truck sizes and weight limits have reduced the trucking sector’s impact on highway infrastructure and reduced transportation costs. Based on analyses conducted in 1988 and 1993, the economic impact of changes under the MOU result in yearly savings in truck transportation costs of $180 to $300 million. The majority of these savings are passed on to shippers through reduced rates.10 The process of harmonization continues to be a priority for governments across the country. Ministers Responsible for Transportation and Highway Safety are currently considering new amendments to the Vehicle Weights and Dimensions Policy MOU, as well as updates to the National Safety Code (NSC), that will harmonize commercial truck inspections, improve fuel efficiency, reduce GHG emissions, allow for increased cargo, and provide greater flexibility to shippers travelling across jurisdictions. These forthcoming measures will continue the legacy and further improve the safety of Canadian communities and the efficient movement of goods across jurisdictions, and internationally.

11
Core Economic Infrastructure: The Case for Transportation
Canada’s infrastructure deficit is estimated at over $170 billion11. This deficit represents the need for investment across a variety of infrastructure categories, from transportation to water and wastewater to disaster mitigation. Investing in maintaining and expanding Canada’s core economic infrastructure is a priority across the country. But what is core economic infrastructure? Or, perhaps more importantly, what should Canadians expect from it? Given all that we know about the economic potential of public infrastructure and the importance of effective transportation to economic growth, we can begin to unpack the criteria for “core economic infrastructure” at a high level. Core economic infrastructure should:
Promote economic growth: Infrastructure should contribute to economic growth by increasing output, supporting industry and stimulating trade and investment.
Support job creation: Infrastructure should create employment opportunities for Canadians, both directly through construction and indirectly through increased economic activity.
ECONOMIC CONTRIBUTION
BY MODE AIR TRANSPORTATION12 - $34.9B – GDP contribution - 405,000 – direct, indirect jobs - $4.7B – personal income - $1.1B – corporate profits - $7B – annual tax revenue PUBLIC TRANSIT13 - $10B – GDP contribution - 70,000 – direct, indirect jobs - 2.4M tonnes – annual GHG
emission reductions - $115M – annual health care savings RAIL TRANSPORTATION14 - 60,000 – direct, indirect jobs - $950M – annual tax revenue - 70% – surface goods transported
by rail MARINE TRANSPORTATION15 - $25B – annual GDP contribution
of port authorities - 250,000 – direct, indirect jobs - $10B – personal income - $2.2B – annual tax revenues HIGHWAY TRANSPORTATION16 - $65B – annual trucking industry
revenue - 400,000 – direct, indirect jobs - 90% – consumer and food
products transported on highways BORDER INFRASTRUCTURE17 - $645.7B – annual Can-U.S. trade - 1 in 7 – Canadian jobs depend on
bilateral trade - 6% – cost of border delays on
manufactured goods

12
Increase productivity: Infrastructure should reduce the cost of doing business, allowing the private sector to increase its output.
Generate income: Infrastructure should result in increased personal income, corporate profits, and government revenues, or reduce their expenditures.
Enhance quality of life: Infrastructure should provide Canadians with greater access to economic and social opportunities while helping to achieve societal objectives, like environmental sustainability.
This is not an exhaustive list of criteria – arriving at one is not the goal. The aim here is to simply articulate, at a high-level, expectations of core infrastructure and understand how transportation can (and does) deliver on them. Applying this lens to the multimodal transportation systems Canadians use every day can lead to a better understanding of how intricately transportation is tied to Canada’s economic health and future.
CHINA’S CORE INFRASTRUCTURE
China has become the most aggressive infrastructure investor in the world. From 1992 to 2011 China invested, on average, 8.5 per cent of national GDP in expanding its core infrastructure, compared to 2.6 per cent in both the U.S. and EU. The country is moving forward with planned expansion across a number of transportation modes, including:
54% increase in railways to 120,000 km by 2015
157% increase in expressways to 139,000 km by 2020
62% increase in airports to over 240 by 2020
132% increase in container terminal capacity by 2020
Though China is at a different stage in its development than Canada – nation building through infrastructure – the country is quickly moving toward a new phase. In its 2011 Five Year Plan, China announced its intention to support “higher-quality growth” through infrastructure, with an emphasis on moving China up the value chain. The Five Year Plan predicts seven per cent annual GDP growth for the period up to 2015. This is a strong message to the rest of the world about the competition they face from China, and the importance of core transportation infrastructure to the economic success of one of the world’s largest economies.

13
Connecting Canadians and Improving Mobility Canada is one of the largest and most diverse nations in the world. There are tremendous differences in geography, climate, community size and the spatial relationship between communities. Each distinct community, whether it is a large city or a small town, depends on transportation to connect it to the global marketplace and support the day-to-day lives of Canadians. The success of a transportation network can be gauged by how well it connects people to opportunity, both social and economic, and to goods and services. Modern transportation networks need to facilitate economic growth, be safe and efficient, and provide some measure of equitable access for all Canadians. Accessibility Accessibility is not limited to the physical accessibility of the transportation network, although this can be an important consideration. Other factors that influence accessibility include perception of safety, service availability (cost and frequency), and travel speed. These accessibility factors do not exist in isolation. To achieve the strategic vision, transportation planning is moving toward a more coordinated approach. In fact, the Urban Transportation Task Force (UTTF) of the PPSC addressed this issue in a recent report: “Coordinated Corridor Management.” This report highlighted a number of Canadian examples where urban corridors were designed to enable safe and comfortable access for all modes of transportation, to increase the accessibility of transportation options to effectively move people.18 The UTTF report highlights some recent successes; however significant investment is needed to improve transportation accessibility across the spectrum of Canadian communities. This is equally true for large urban centres dealing with issues of congestion, as well for some northern and remote communities not yet connected by year-round transportation access.
THE TEN-T NETWORK:
CONNECTING EUROPE
In 2013 the EU announced the TEN-T core network project – a €26 billion (CAD$39 billion) infrastructure investment from 2014 to 2020, to be cost shared with member states. The goal of the project is to replace the existing transportation patchwork with a robust, modern, multi-modal transportation network that improves the connectivity between all 28 member states. “The aim is to ensure that progressively, and by 2050, the great majority of Europe's citizens and businesses will be no more than 30 minutes' travel time from this comprehensive network.” The TEN-T network will connect:
94 main European ports with rail and road links
38 key airports with rail connections to major cities
15,000 km of railway line upgraded to high speed
35 cross border projects to reduce bottlenecks
Improving the connectivity and mobility of people and goods across the EU is critical to the long-term economic strength and competitiveness of the single European market. With these investments the EU has signaled the importance of transportation to overcoming the Great Recession and the financial crisis that followed.
14
Economy The major Canadian railways, the St. Lawrence Seaway and the Trans-Canada Highway are examples of historical transportation connectivity that provided the economic foundation for the betterment of Canadian society. Strategic transportation infrastructure investments are necessary to support trade related industries such as trucking, agriculture, and manufacturing. These infrastructure investments are critical in supporting the supply chain for moving goods to market. These industries perform double duty by creating local jobs and supporting the growth of other economies by connecting them with goods and services that cannot be bought or sourced locally. Efficient transportation hubs, such as marine ports, airports and land-based ports of entry facilitate economic activity by connecting Canadian communities to the global supply chain. Coordination and planning between governments, such as the Manitoba and federal governments’ coordinated investment in the Pembina-Emerson Port of Entry (POE), ensure the viability of important trade corridors like the Mid Continental Trade and Transportation Corridor. Similarly, the Global Transportation Hub in Regina serves to support the supply chain, both domestically and globally. Society When people are making decisions on where to live, good jobs are not the only factor. People are looking for communities where they can improve their quality of life. Although many Canadian cities already provide their citizens with a variety of transportation options, challenges remain. Canadians living in major cities are subject to long, costly commute times. Much has been written about the economic cost of congestion, but the social cost is also high. Canadians’ quality of life is undermined by punishing commutes, which simultaneously damage the environment. Effective planning and investment is required to coordinate transportation and land use to help Canadian cities overcome these challenges. This will require support for public and active transportation infrastructure such as transit, cycling and walking paths, as well as road, rail and air infrastructure. An integrated approach makes several transportation options possible, allowing people to choose the option that is most suited for the type of trip they are making, thus improving overall mobility.

15
Transportation: Economic Enabler of the North The nation’s strategic vision for transportation identifies a critical interdependence between Canada’s economic prosperity and transportation infrastructure that connects natural resources to international markets. In addition to maintaining existing infrastructure to respond successfully to global pressures, bold investments are necessary to construct basic infrastructure in resource-rich areas where little or no infrastructure currently exists. The abundant petroleum and mineral resources identified in Canada’s north are a prime example. Many northern communities are not accessible year round. Lack of access is a challenge for resource development, but also a challenge for communities in need of services and supplies. Jurisdictions are collaborating across Canada to identify best practice transportation solutions for rural, northern, and remote communities, but the lack of infrastructure remains a problem. The Mackenzie Valley corridor in the Northwest Territories is a case in point. An economic analysis prepared for the Northwest Territories’ Department of Transportation estimates that strategic investments in a Mackenzie Valley all-weather highway are vital to support growth in the hydrocarbon sector for the next five to six decades. Strong commitments to continue investing in basic northern infrastructure are necessary before Canada can fully realize the benefits of the region’s economic potential and secure its competitive edge in the global marketplace. Innovative investment partnerships between government and industry could help make this a reality. Government and industry are currently combining their efforts to implement road improvement projects, enhancing northern access by extending the operating seasons of key winter road corridors. Longer seasonal access enables large, industrial resupply and equipment mobilization across the region. It also ensures northern communities have access to the things they need, like diesel fuel and dry and non-perishable goods. Year-round transportation access is an achievable goal with huge economic potential. Natural resource endowments in the provinces and the territories present an opportunity to significantly grow the northern economy and improve the quality of life of northern Canadians. Transportation infrastructure is the key to unlocking this potential.

16
Embracing the “New Normal”
Governments across Canada are planning for and investing in their transportation networks within a context of global change. The opening section of this report identifies key elements of the “new normal,” which will continue to influence transportation decision-makers. These elements present a unique set of challenges and opportunities to creating a modern, 21st century multimodal transportation system that meets the diverse needs of all Canadians and provides a strong foundation for economic growth. 1. Emerging Markets: Canada is poised on the edge of a new era in global trade. The
Comprehensive Economic and Trade Agreement with the European Union will provide greater access to a $17 trillion market of 500 million people. Our transportation networks must continue to provide vital links to the U.S. and EU but it must also connect with rapidly growing economies in Asia and Latin America.
2. Slow Growth: The legacy of the Great Recession is still being felt by Canadians and their governments. Though fiscal balance will be achieved across the country in the near-term, this pursuit increases competition for already scarce resources. Competing for these resources is a priority.
Focusing on making smart, evidence-based transportation investments will generate long-term benefits for Canadians.
3. Demand for Resources: Canada’s abundant natural resources are hugely important to its economic success, especially given the increasing global demand for energy. Transportation is key to reaching these resources and getting them to world markets.
Accessing and safely moving Canada’s natural resources in an environmentally sustainable manner is a priority.
4. Industrial Change: Demand for transportation infrastructure and services could grow as North America expects a re-shoring of production and an increase in digital manufacturing. The transportation sector must be able to compete for top talent. Transportation jobs of the 21st century will require specialized education in greater use of technology.
Modern, efficient, and safe transportation networks will position Canada to succeed in this new global context. Transportation creates jobs, attracts investment, and enhances private sector productivity. Governments understand this and are responding to the need for new transportation infrastructure across the country. Strategic investments in critical transportation infrastructure contribute to improving the fiscal health of our governments and to sustaining our economic strength during periods of slow growth.
17
Maintaining the consistency of public investment is particularly important. Long-term, predictable funding supports transportation planning and asset management. A best-practice approach to investment and planning will help achieve maximum returns on public investments. There is much success to be gained from working together as governments. This Task Force supports an ongoing dialogue on the importance of transportation to the Canadian economy. Continuing this conversation will allow us to achieve our shared objectives and provide Canada with a long-term competitive advantage.

A1
Appendix I: Canadian Transportation Project Highlights
British
Columbia
The Roberts Bank Rail Corridor (RBRC)
Project Description: The RBRC is an important 70-km stretch of rail network connecting Canada’s largest container facility and a major coal terminal at Roberts Bank with the North American rail network. With the future increases in train and vehicle traffic, the at-grade rail crossings present a major challenge to rail operation efficiency and road network efficiency for the surrounding communities.
Overview: A comprehensive corridor study, Roberts Bank Rail Corridor: Road/Rail Interface Study, was completed in February 2007 to prioritize the most beneficial locations for investment in road-rail grade separations. The study identified 9 grade separations in Delta, Surrey, and City and Township of Langley for implementation in 2014.
The study was a collaborative effort among Transport Canada, British Columbia Ministry of Transportation, South Coast British Columbia Transportation Authority (TransLink), the Vancouver Fraser Port Authority, and the Greater Vancouver Gateway Council, as well as stakeholder consultations with five municipalities and four railway companies.
Investment: A cost-sharing arrangement of $307M among BC Ministry of Transportation, Transport Canada, Vancouver Fraser Port Authority, TransLink, Municipalities (Delta, Surrey, and City and Township of Langley), railways (BCRC, CN, CP, BNSF).
Expected Impacts: When completed, the 9 grade-separation crossings will provide significant relief to road users in the communities, while enhancing rail operations and accommodating anticipated growth in import and export along the corridor. These crossings are also critical to advancing BC’s Pacific Gateway initiative and associated economic benefits.
Economic benefits associated with trade flows from Roberts Bank port facilities are estimated at $2.7B in provincial GDP ($1.9B over existing conditions).

A2
Alberta
Calgary and Edmonton Ring
Roads Overview: The intention of a ring road is to encourage free-flowing traffic for trips longer than 5 km, by spacing intersections only where the ring road is connected with major routes. This approach reduced congestion by minimizing start-and-stop traffic, and in turn increases the reliability of the route for commuters and transporters, saving both time and money.
Ring roads also allow for better connectivity within the community. People in surrounding communities are better able to get into and around the city, businesses have a larger pool of accessible candidates available when searching for specific skills and knowledge.
Ring roads also encourage adjacent business development, especially at intersections. This clustering benefits the businesses that establish along the route as the cost for one to interact with another is reduced. In Calgary, CN recently opened their new 680 acre facility, located near Stoney Trail. CN promotes their facility and the surrounding area as a place for their customers to locate.
Achieved Results: In Edmonton, communities have seen positive real estate shifts due to the proximity of the ring road to bus and light rail transit.
Project Description: In Alberta, ring roads are used to connect four legs of level one highways surrounding major urban centres. Both of the following connections are in the final phase of planning/construction:
Anthony Henday Drive ring road connects Highway 2 and Highway 16 in Edmonton;
Stoney Trail ring road connects Highway 2 and Highway 1 in Calgary.

A3
Project Description: The majority of the project is comprised of new highway infrastructure:
Four-lane highway from Highway 11 to Highway 1 east;
Eleven interchanges;
Four intersections;
Service roads as required to facilitate local access;
Four new flyovers over the existing
railway tracks; and
Twinning of Highway 6 south of
Regina between the existing four
lane section and the proposed
bypass.
Overview: The Regina bypass project is an initiative of the Government of Saskatchewan, involving the planning and delivery of a free flow, high speed, four-lane divided highway corridor through the Regina region. The existing highway infrastructure around Regina is inadequate for current levels of traffic demand, provides a severe impediment to traffic flow, and places a major restriction on commercial and population growth.
Expected Impacts:
Decrease roads approaching or exceeding congestion by up to 22%.
Increase average speeds by 2.2%.
Save between $2M and $3M annually in property damage, personal injury and fatalities.
Reduce cumulative travel time by 4.2%.
Save 161.5 million litres of fuel over 30 years.
Reduce GHG emissions by 0.6%, carbon monoxide (CO) by 22 megatonnes, hydrocarbon (HC) by 390 tonnes, and mono-nitrogen oxide (NOx) by 79 tonnes over 30 years.
Create 9,500 jobs.
Increase emergency response speed through Regina on the east side.
Improve access to the airport in southern Saskatchewan.
Saskatchewan
Regina Bypass
Investment: Saskatchewan is exploring the delivery of the project as a potential public-private partnership.

A4
Overview: Investments are targeted to support improvements to the seamlessness of Manitoba’s key trade corridors, including to the United States, the Canadian east and west, and the Churchill Arctic Gateway. A particular focus is to facilitate the direct connection of CentrePort Canada—Manitoba’s 20,000 acre inland port situated in the Winnipeg Capital Region—to strategic trade corridors in all directions. As well, a key objective is to improve the reliability and fluidity of Provincial Trunk Highway 75 to the United States, to allow the continued flow of over $18 billion in trade through the Pembina-Emerson border crossing.
Investment: Trade Corridors to the United States - $680 million investment
• Improve Highway 75 to US interstate flood standards
• Improve southwest Winnipeg Perimeter Highway with interstate standard interchanges
• Upgrade Highway 10 from Flin Flon to the US Trade Corridors to Canadian Provinces - $500 million investment
• Improve Trans-Canada Highway east and west of Winnipeg
• Extension of CentrePort Canada Way expressway to Trans-Canada Highway
• Improvements to Yellowhead Highway (Highway 16) Northern Roads - $225 million investment
• Upgrade Highway 6 from Winnipeg to northern Manitoba
Project Description: As part of a government commitment to core infrastructure of $5.5 billion, more than $3.7 billion will be invested in roads, highways and bridges over the next five years to better link communities into—and strengthen—Manitoba’s major trade corridors.
Expected Impacts: According to the Conference Board of Canada, Manitoba’s overall $5.5 billion core infrastructure investment commitment—of which $3.7 is targeted to transportation infrastructure—will represent a boost of $6.3 billion to the provincial economy, and of $5.4 billion to exports. Specific projects will provide varying supply chain efficiencies. For example, extension of CentrePort Canada Way to the Trans-Canada Highway will yield an anticipated $161 million in direct user benefits over the life of the asset.
Manitoba
Trade Gateway Infrastructure Investment

A5
Ontario
Brampton Züm Bus Rapid Transit
Project Description: Brampton Züm is a bus rapid transit service that provides fast and direct service across the City of Brampton. The project is delivered in two phases:
Phase I (completed) – Züm is currently operating along Queen Street, Main Street and Steeles Avenue;
Phase II – Service will be launched along additional corridors (expected completion date: 2016).
Investment: Transportation infrastructure investment of approximately $285 M shared between the federal government, Ontario and the City of Brampton ($95M each from federal and provincial governments and the City of Brampton)*.
Anticipated Annual $ Benefit (year 2022):
Type of Benefit Value of Benefit ($M)
Travel Time Savings
Wait times reduced from 9 to 3.2 minutes
Travel speed increased from 17.6 to 25 kph
53.65
Vehicle Operating and Accident Cost Savings
18% increase in overall ridership decreases single occupant vehicle use and associated costs, including accidents (public transit is approximately 20 times safer than private vehicle travel)
Annual reduction in vehicle kilometres travelled = 18 M
8.69
GHG and Other Emissions Cost Savings
Annual reduction in CO2 emissions = 4,280 tonnes
0.51
Cross-sector Benefits
Connecting key commercial and industrial corridors and encouraging higher density mixed use development
1.19
Total Benefit 64.05 Note: the City of Brampton has identified that they have also contributed additional funds of $20 million beyond
their public commitment of $95 million, for a total contribution of $115 million.
Achieved Results:
As of 2011, Züm has achieved an 18% increase in overall Brampton Transit ridership
In 2013, travel time from Downtown Brampton to York University had been reduced 42 percent during the AM peak period from 2007 levels.
A6
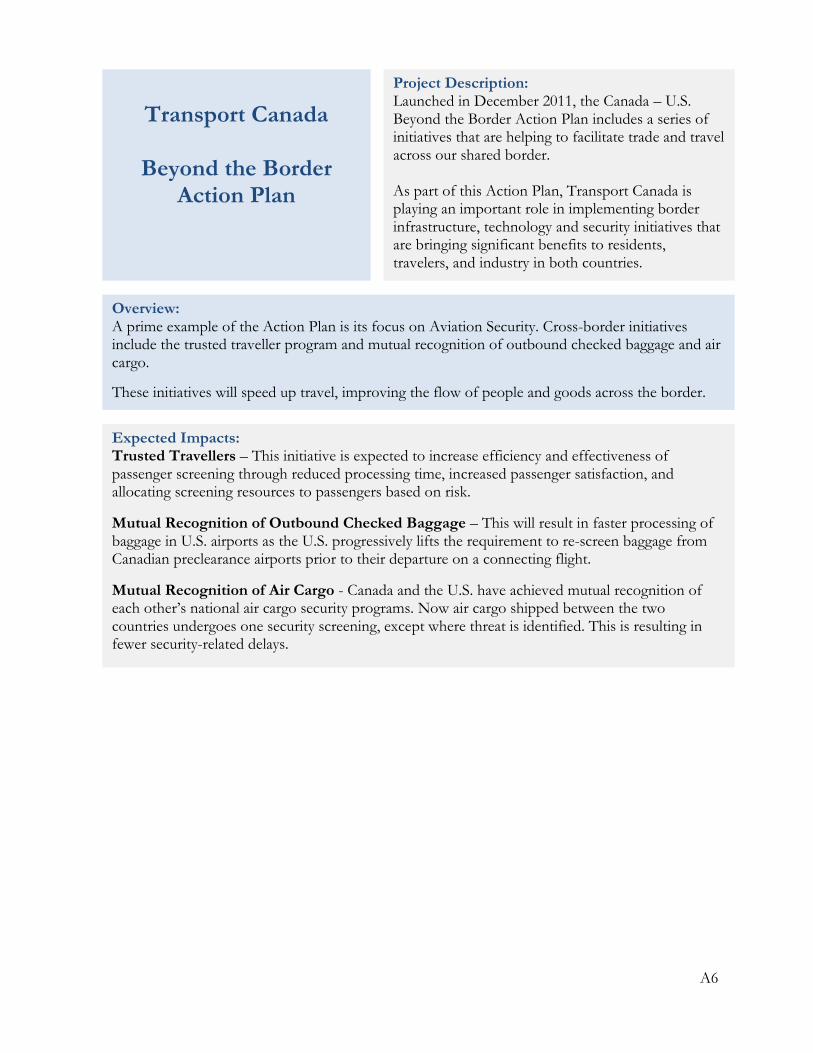
Transport Canada
Beyond the Border
Action Plan
Project Description: Launched in December 2011, the Canada – U.S. Beyond the Border Action Plan includes a series of initiatives that are helping to facilitate trade and travel across our shared border. As part of this Action Plan, Transport Canada is playing an important role in implementing border infrastructure, technology and security initiatives that are bringing significant benefits to residents, travelers, and industry in both countries.
Overview: A prime example of the Action Plan is its focus on Aviation Security. Cross-border initiatives include the trusted traveller program and mutual recognition of outbound checked baggage and air cargo.
These initiatives will speed up travel, improving the flow of people and goods across the border.
Expected Impacts: Trusted Travellers – This initiative is expected to increase efficiency and effectiveness of passenger screening through reduced processing time, increased passenger satisfaction, and allocating screening resources to passengers based on risk.
Mutual Recognition of Outbound Checked Baggage – This will result in faster processing of baggage in U.S. airports as the U.S. progressively lifts the requirement to re-screen baggage from Canadian preclearance airports prior to their departure on a connecting flight.
Mutual Recognition of Air Cargo - Canada and the U.S. have achieved mutual recognition of each other’s national air cargo security programs. Now air cargo shipped between the two countries undergoes one security screening, except where threat is identified. This is resulting in fewer security-related delays.

A7
Overview The government proposes a vision for the future of public transportation by implementing those actions:
Integrating transportation planning into decisions regarding land-use. All significant proposals for land development must include public transportation;
Submitting a proposal to review public transportation governance in the Greater Montréal and Québec areas to better integrate and coordinate users’ travel;
Simplifying the current rules governing assistance programs for public transportation for transit operating authorities, so that projects can be implemented faster;
Allowing carpooling in certain reserved lanes to improve traffic flows and provide access to public transportation to a greater number of citizens;
Strengthening regional public transportation leadership through decentralization initiatives facilitating the implementation of services adapted to the environment, so as to enhance transportation services for users outside large urban centres; and,
Promoting universal accessibility to public transportation services so that persons with disabilities or reduced mobility can travel without constraints.
Project Description: The government has adopted a responsible and innovative approach on public and land transportation of people, which involves the whole transportation industry. The approach focuses on the needs of all users, including persons with disabilities or reduced mobility. It is intended for all Quebecers, regardless of their place of residence. The approach includes measures supporting the development of public transportation, energy independence, and GHG reductions.
Expected Impacts: The Action Plan is aiming to increase the service offer of public transportation services by 2020.
Investment:
The Programme d’aide gouvernementale au transport collectif des personnes has a budget of $778.5M for 2014 and a total of $3.5B for the 2014-2019 period.
The Programme d’aide aux immobilisations en transport en commun de la Société de financement des infrastructures locales (SOFIL) has a budget of $120.8M for 2014 and a total of $983.1M for the 2014-2019 period.
The Programme d’aide gouvernementale à l’amélioration des services en transport collectif (support the service offer in rural and urban areas): $135.3M in 2014-2015;
The Programme d’aide gouvernementale en transport adapté aux personnes handicapées (paratransit): $89.7M in 2014-2015;
The Programme de subventions aux véhicules collectifs accessibles (vehicles designed and manufactured to be accessible by wheelchair): $1.5M for the 2014-2019 period.
Québec
Action Plan on Public and
Land Transportation

A8
Project Description: In October 2012, the Government of New Brunswick completed major improvements to Route 1. The Route 1 Gateway Project involved the construction of 55 kilometres of new four-lane highway and selected upgrades along existing sections of Route 1. The entire 240 kilometres of highway from St. Stephen to River Glade is now a divided, four-lane highway. Route 1 serves as a major trade corridor between Atlantic Canada and the Eastern U.S. It is the most direct link to a new border facility in St. Stephen – Calais which is Atlantic Canada’s busiest international land border crossing. The project was a public private partnership comprised of two contracts with the province in March 2010. Dexter Developer General Partnership was responsible for the design/build portion of the work, while Transfield Dexter Gateway Services Ltd. is responsible for the ongoing operation, maintenance and rehabilitation of the highway until 2040.The project was completed on budget and nearly a year ahead of schedule, exemplifying the effectiveness of the public-private partnership and the innovations and efficiencies that were worked into the construction management plan. Eighty-five per cent of the labour was sourced in New Brunswick. At peak construction, about 700 jobs were created.
Investment: The provincial and federal governments cost shared the $540-million major improvements through the Gateway and Border Crossing Fund and the Provincial-Territorial Base Funding Agreements.
Expected Impacts: The highway is expected to promote long-term economic growth in the region and enhance multi-modal connections to many of Atlantic Canada's seaports, rail network and international airports, facilitating international trade through this crucial part of the Atlantic Gateway and Trade Corridor. It will improve overall highway safety, reduce vehicle collisions, reduce travel times, reduce vehicle emissions, and foster economic growth in the region.
New Brunswick
Route 1
Highway Project

A9
Overview: The main runway at HSIA was only 8,800 feet in length. A fully-loaded Boeing 747-400 freighter, the standard bearer of international all-cargo air services, requires a runway of 10,500 feet. HSIA was at a distinct competitive disadvantage in attracting international all-cargo air services due to the shorter length of its main runway. In essence, the extension puts the HSIA in a favourable position to retain the air cargo services it currently has and attract additional air cargo services to more international destinations.
Project Description: The Halifax Stanfield International Airport (HSIA) contributes $1.26B annually to Nova Scotia’s economy.
The airport plays a key role in the ability of the province to retain and attract new business, and grow tourism and trade. A total of 12,040 jobs (equal to 2.7% of Nova Scotia’s total employment) are attributable to the airport community. Lengthening of the main runway at HSIA from 8,800 feet to 10,500 feet enhances the Airport’s ability to retain and attract air cargo service.
Investment: Approximately $28M in total cost shared between the provincial government ($5M), federal government ($9M), and the Halifax International Airport Authority ($14M).
Expected Impacts: The main runway extension at HSIA has significantly enhanced the Airport’s ability to attract and retain international all-cargo air services. In turn, this gives increased global market access for many Nova Scotia exporters and importers, particularly exporters in the seafood industry. Such air cargo services are particularly important to Nova Scotia’s seafood producers, who serve a variety of markets throughout Europe and Asia. For Nova Scotia seafood products, the benefits include reduced mortality rates, increased product value and enhanced reputation in international markets.
Nova Scotia
Halifax Stanfield
International Airport Runway Extension

A10
Project Description: The Provincial Government has developed a ten year plan to improve the efficiency, access and safety of critical areas along PEI’s section of the Trans-Canada Highway. PEI’s vision aligns with the economic goals of the province and with an overall economic vision for Canada. Twelve areas have been identified for upgrades and improved realignments. Three highlighted projects:
1. Bonshaw to New Haven – $16M investment to realign a 6.2 km section of the highway between Charlottetown and the Confederation Bridge;
2. Cornwall – expected $50M construction project of a perimeter highway that will move Route 1 to bypass Cornwall where population growth and urbanization presents capacity and safety concerns;
3. Tryon to Crapaud – expected $18M realignment of Route 1 only kilometers from the Confederation Bridge.
Overview: Route 1 is the primary trade link in PEI extending from the Confederation Bridge in Borden through to the capital city of Charlottetown, to Wood Islands ferry service. Built in the 1950’s, this essential road became part of Canada’s National Highway System in 1988. Forming the foundation of the Island’s road network, the main means of transportation on PEI, the highway accommodates up to 3100 trucks per day carrying the vast majority of the Island’s $870M worth of exports in 2012.
Investment: The vision will cost approximately $120M and take 10 years to complete.
Expected Impacts: These investments will have lasting impacts on the local and national economy as goods and services will be able to move in a more efficient and safer manner to markets throughout Eastern North America and into ports such as Halifax, destined for markets around the world.
Prince Edward Island
Trans-Canada
Highway Improvement

A11
Investment: The construction of these seven highways was achieved through a total investment of $294.5M.
Project Description: The series of arterial, ring and bypass roads in and around the St. John’s CMA are now nearing completion, with just two sections of road remaining to be completed in 2015 and 2017. This series of seven highways has improved safety and access in and out of the St. John’s area; linking major developments in the area to the Trans-Canada Highway and reduced travel time and cost.
Overview: Since the initial St. John’s Census Metropolitan Area Regional Plan of 1966, the province has constructed seven roads on the Northeast Avalon to improve traffic flows in and around the capital:
1. The Harbour Arterial – Opened in 1978 at a cost of $46.4M
2. Manuals Access Road – Opened in 1985 at a cost of $11.7M
3. The Outer Ring Road – Opened in multiple phases from 1998 throughout 2003 at a cost of $68.2 M
4. Conception Bay South Bypass – Total cost $48.4M
5. The Torbay Bypass from the east boundary of the City of St. John’s to Flatrock – Opened in 2011 at a cost of $23.9M
6. The Bifurcation Road/East-West Arterial – Total cost approximately $67.8M
7. The Goulds Bypass – Total cost approximately $28.1M
Achieved Results: With the completion of these access, ring and bypass roads the Province has provided highway access from the Trans-Canada Highway to the Port of St. John’s (Harbour Arterial), the St. John’s International Airport (Outer Ring Road), major industrial parks, major residential areas, and the towns and cities surrounding the capital city of St. John’s. This reduces the time for people who commute to work in the region as well as the time to move freight from the port to industrial parks and major retail centers. It has also diverted traffic off of city roads, improving traffic flow in and out of the St. John’s area. This regional highway network has improved safety and increased access to goods, services and employment.
Newfoundland & Labrador
St. John’s Census Metropolitan (CMA) Area Arterial, Ring and
Bypass Roads

A12
Investment: Since 2008/09 three quarters of the work on the Campbell highway was funded through the Federal Building Canada Fund. Phase 1 – $ 29.8 million - complete Phase 2 – $33.7 million – in progress Phase 3 – $61 million (estimate only) – not approved
Project Description: The purpose of the Campbell Highway Reconstruction Project is to provide a modern, safe and reliable transportation corridor through southeastern Yukon, in order to address community needs and support continued economic growth in the region. The project involves upgrading 180 kms of existing narrow, gravel surfaced highway to a BST surfaced road. The improvement will enhance local mobility and support traffic requirements for mineral exploration and sustained heavy hauling in addition to regular traffic.
Overview: Over the 2005 – 2007 timeframe, mineral exploration expenditures in Yukon escalated from $40 million to $140 million, and as a result, several mineral rich deposits were discovered along the Campbell Highway. In response the Yukon government studied the existing road and concluded that the highway could not safely accommodate additional haulage. The Campbell Highway Reconstruction Project was approved in 2008 to accommodate a 90km/hr all-season design standard for heavy traffic. Phase 1 – 2007/08 – 2013/14: Reconstruct select segments between Km 10-114 - Complete. Phase 2 – 2013/14 – 2016/17: Finalize reconstruction between Km 10-114 – In progress. Phase 3 – 2017/18 – unknown - Reconstruction Km 114 – 190 - Anticipated, not approved.
Expected Impacts: Economic Development: The main objectives are to support community transport and regional economic development opportunities. It will also address prospective needs for mineral concentrate haulage and the trucking of inbound mining supplies. Road developments do not ensure that mining developments will occur; however, they have a positive impact on the financial performance potential of the mining sector in the region. Safety and Efficiency: These investments will have a lasting impact by allowing the movement of goods and people in a more safe, efficient and reliable manner.
Yukon
Campbell Highway Reconstruction

A13
Investment: Since 2000, the governments of Canada and the Northwest Territories have strategically and successfully invested more than $120 million in permanent structures and grade improvements along the Mackenzie Valley winter road.
Project Description: The Mackenzie Valley Highway from Wrigley to Tuktoyaktuk is a cornerstone of the Government of the Northwest Territories’ plan for present and future economic development.
Overview: The present Mackenzie Valley Winter Road is a temporary snow and ice solution for investors, petroleum producers, and community residents alike. The permanent solution to year-round access is an all-weather highway spanning the length of the Mackenzie Valley corridor, the location of unprecedented amounts of oil, gas, and other natural resources to support of Canada’s economic advantage and the well-being of Canadians.
Expected Impacts: An all-weather link through the Mackenzie Valley to the Arctic coast will produce substantial benefits at the national, regional, and local levels, as the project is the foundation for economic development, enabling natural resource exploration, while also reinforcing Canadian sovereignty objectives.
7,785 one-time jobs in the NWT and 6,297 one-time jobs in the rest of Canada during the period of construction
128 permanent jobs during operation
Additional $1.5 billion in Gross Domestic Product
$15.7 million in additional disposable annual income
20% increase in tourism
Northwest Territories
Mackenzie Valley Highway

A14
WORKS CITED 1 Conference Board of Canada ( 2014). How Canada Performs: A Report Card on Canada. Accessed
February 2014 at: http://www.conferenceboard.ca/hcp/details/economy/measuring-productivity-canada.aspx
2 Gu, W. and R. Macdonald (2009). “The Impact of Public Infrastructure on Canadian Multifactor Productivity Estimates. Statistics Canada.
3 Vander Ploeg, C.G. and M. Holden. (2013). “At the Intersection. The Case for Sustained and Strategic Public Infrastructure Investment.” Canada West Foundation.
4 Gu and Macdonald, 2009. 5 Litman, T. (2010). “Evaluating Transportation Economic Development Impacts.” Victoria
Transport Policy Institute. 6 Vander Ploeg and Holden, 2013 7 Ontario Ministry of Transportation, Transportation Economics Office Calculations 8 Ontario Ministry of Transportation, Transportation Economics Office Calculations (CA$2002) 9 Ontario Ministry of Transportation, Transportation Economics Office Calculations, based on
average Ontario labour productivity growth rates and transportation infrastructure investments
from 1988-2010.
10 Council of Ministers Responsible for Transportation and Highway Safety (2008). “Harmonization of Transportation Policies and Regulations: Context, Progress and Initiatives in the Motor Carrier Sector.”
11 Federation of Canadian Municipalities (2012). “Canadian Infrastructure Report Card.” Accessed January 2014 at: http://www.fcm.ca/Documents/reports/Canadian_Infrastructure_Report_Card_EN.pdf
12 Gill, V. and R.N. Raynor (2013). “Growing Canada’s Economy: A New National Air Transportation Policy.” Conference Board of Canada.
13 Canadian Urban Transit Association (2010). “Issue Paper 35, Measuring Success: The Economic Impact of Transit Investment in Canada.”
14 Railway Association of Canada. Accessed February 2014 at: http://www.railcan.ca/education/facts
15 Association of Canadian Port Authorities. Accessed February 2014 at: http://www.acpa-ports.net/industry/industry.html
16 Canadian Trucking Alliance. Accessed February 2014 at: http://www.cantruck.ca/iMISpublic/Content/NavigationMenu2/CTAIndustry/TruckinginCanada/default.htm
17 Government of Canada. “Canada’s Economic Action Plan: Bilateral Relations – Canada-U.S. Trade and Investment.” Accessed January 2014 at: http://actionplan.gc.ca/en/page/bbg-tpf/bilateral-relations-canada-us-trade-and-investment
18 Stillar, A. et al (2013). “Coordinated Corridor Management: Improving Efficiency on Canada’s Urban Multimodal Transportation Corridors.” A report of the Urban Transportation Task Force of the Policy Planning and Support Committee: http://www.comt.ca/english/UTTF%20Corridor%20Management.pdf.