Transportation Systems Management & Operations (TSM&O): A
23
Transportation Systems Management & Operations (TSM&O): A Capability Improvement Workshop
Transcript of Transportation Systems Management & Operations (TSM&O): A

Transportation Systems Management & Operations (TSM&O):
A Capability Improvement Workshop
TSM&O
An integrated program to optimize the performance of existing roadway infrastructure through the implementation of specific systems and services that preserve capacity, improve reliability and safety, and improve the environment.

3
Transportation Systems Management and Operations
Challenge Congestion and unreliability increasing with economy
and population growth Major capacity limits: costs and impacts, timing & scale Reduce emissions and energy impacts
Opportunity Unexploited potential of aggressive TSM&O applied to
existing roadways – to improve mobility (multimodal), safety, and environment
Short-run, low cost potential
Approach Key barriers not $$ or technology – rather: policy,
process and institutional arrangements

Portland • Livability and sustainability leader • Strong transit / bike/ped / land use
planning reputation • Committed to making best use of modes
and existing roadway networks (freeway and arterial)
• Portland has strong base to build on • What are next steps – to improve
effectiveness (on a continuing basis)?
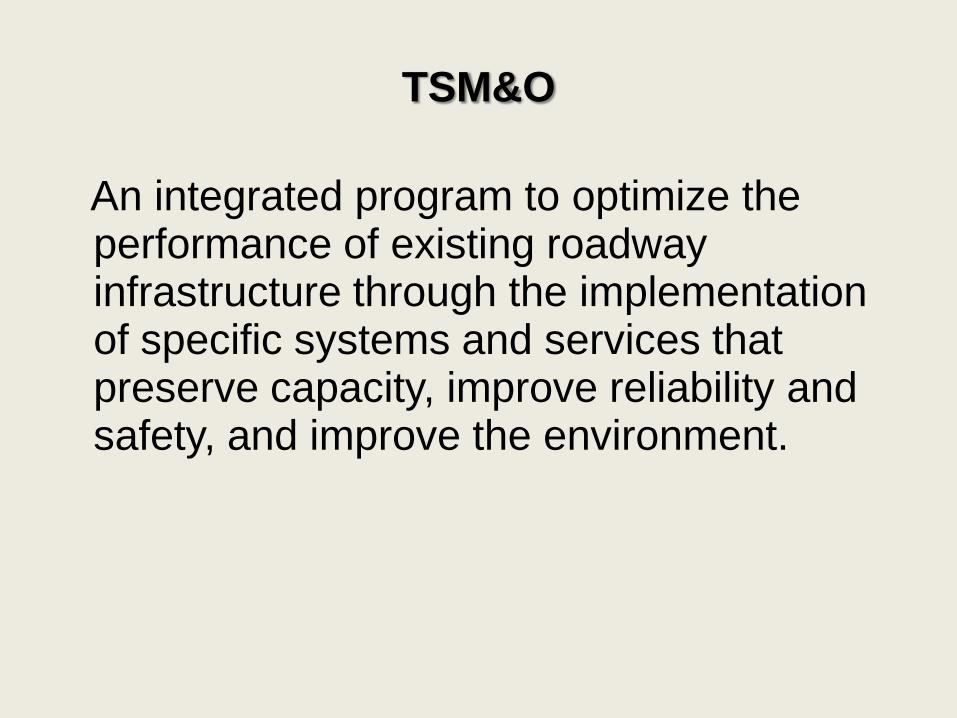
Congestion Increasing Again (Portland)
System Performance
2010 2008
Congested Travel (% of peak VMT)
68
65
Congested System (% of lane-miles)
50
48
Total Fuel Consumed (1000 gallons)
10,931
9,868
Total Delay (1000s of person-hours)
41,743
40,172
Total Cost ($ millions)
850
803
Note impact of projected future increasing population/vehicles

Unmanaged Traffic Impacts with Limited Capacity Options
TSM&O Strategies and GHG Reductions
0
100
200
300
400
500
600
700
800
900
1000
0 5 10 15 20 25 30 35 40 45 50 55 60 65 70 75 80 85 90
Average Speed (mph)
CO
2(g
/mi)
Real-world activitySteady-state activity
congestion mitigation
speed management
traffic smoothing

Increasing Knowledge about Causes of Congestion
Majority of delay/most unreliability due to “non-recurring” events NOT addressed by new capacity
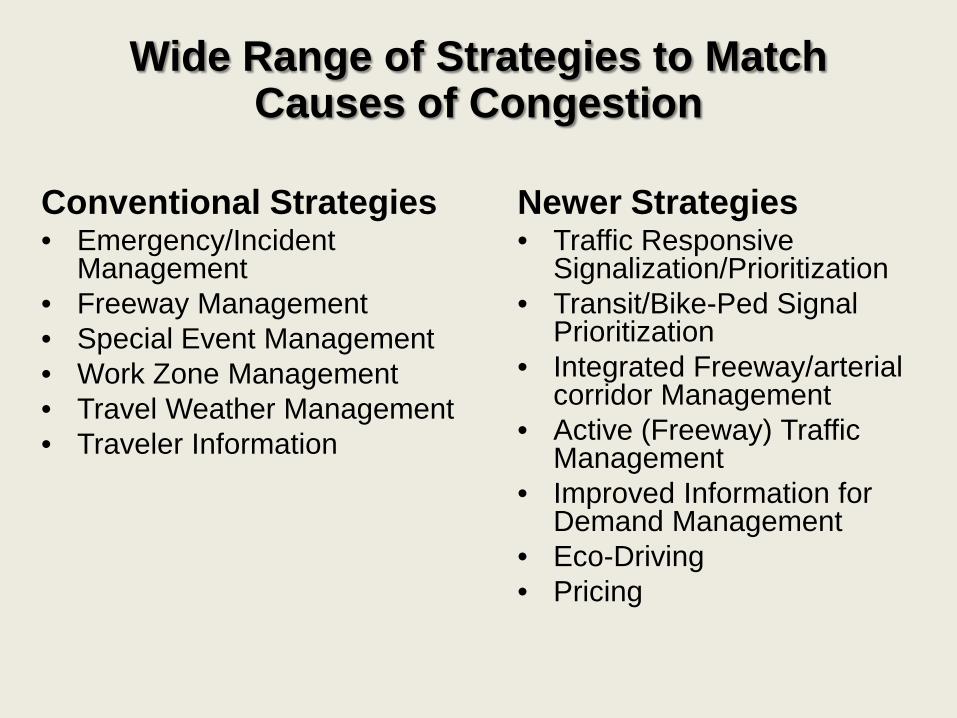
Wide Range of Strategies to Match Causes of Congestion
Conventional Strategies • Emergency/Incident
Management • Freeway Management • Special Event Management • Work Zone Management • Travel Weather Management • Traveler Information
Newer Strategies • Traffic Responsive
Signalization/Prioritization • Transit/Bike-Ped Signal
Prioritization • Integrated Freeway/arterial
corridor Management • Active (Freeway) Traffic
Management • Improved Information for
Demand Management • Eco-Driving • Pricing

TSM&O Strategies
Potential Delay Reduction (plus improved reliability)
Flow control/ramp metering 7-8%
Traffic responsive signals 10-12%
Incident management 10-15%
Work zone traffic management 3-4%
Weather information 2-3%
Traveler information 1-2%
Active Traffic Management 15%
Pricing 20%
Unexploited Transportation Service Potential?
How can transportation agencies capitalize on the potential of TSM&O best practice – and beyond?

But we’re doing it……… Substantial Difference between Average and
Best Practice
80
60
40
20
0 Ave
rage
Red
uct
ion
in
Inci
den
t D
ura
tion
(%
)
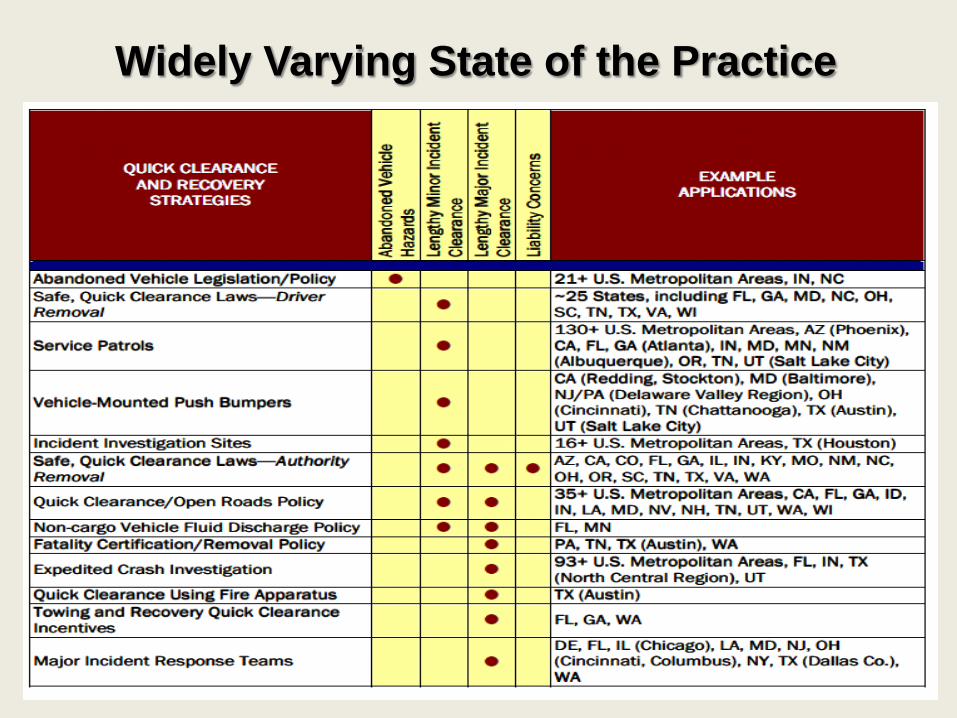
Widely Varying State of the Practice

Key Differentiators (Effective TSM&O)
• Regions, states at very different levels of effective utilization of TSM&O
• National research (TRB, AASHTO, FHWA): the most effective TSM&O requires specific business processes & institutional structures
• No area is the best at everything – research indentified key dimensions and levels of capability for improving capabilities
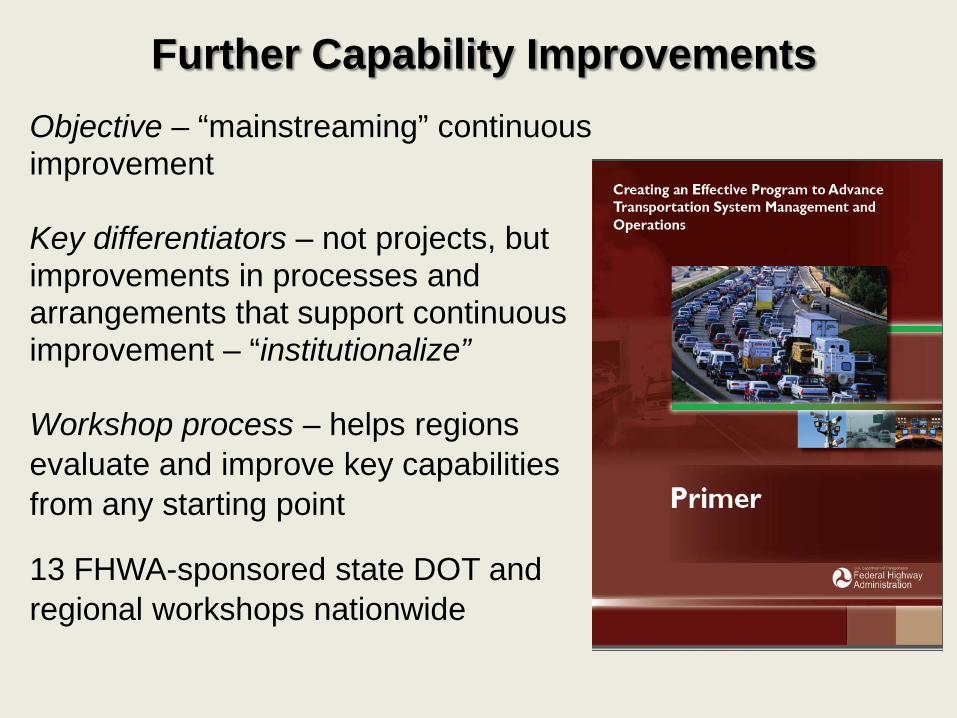
Objective – “mainstreaming” continuous improvement Key differentiators – not projects, but improvements in processes and arrangements that support continuous improvement – “institutionalize” Workshop process – helps regions evaluate and improve key capabilities from any starting point 13 FHWA-sponsored state DOT and regional workshops nationwide
Further Capability Improvements
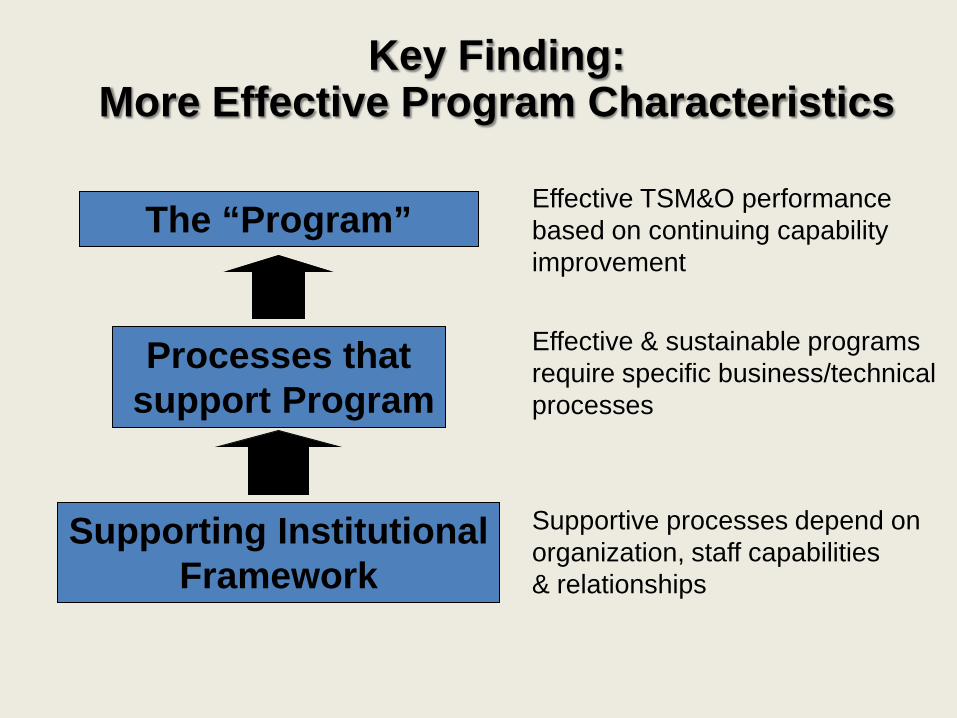
The “Program”
Processes that support Program
Supporting Institutional Framework
Effective TSM&O performance based on continuing capability improvement
Supportive processes depend on organization, staff capabilities & relationships
Effective & sustainable programs require specific business/technical processes
Key Finding:
More Effective Program Characteristics
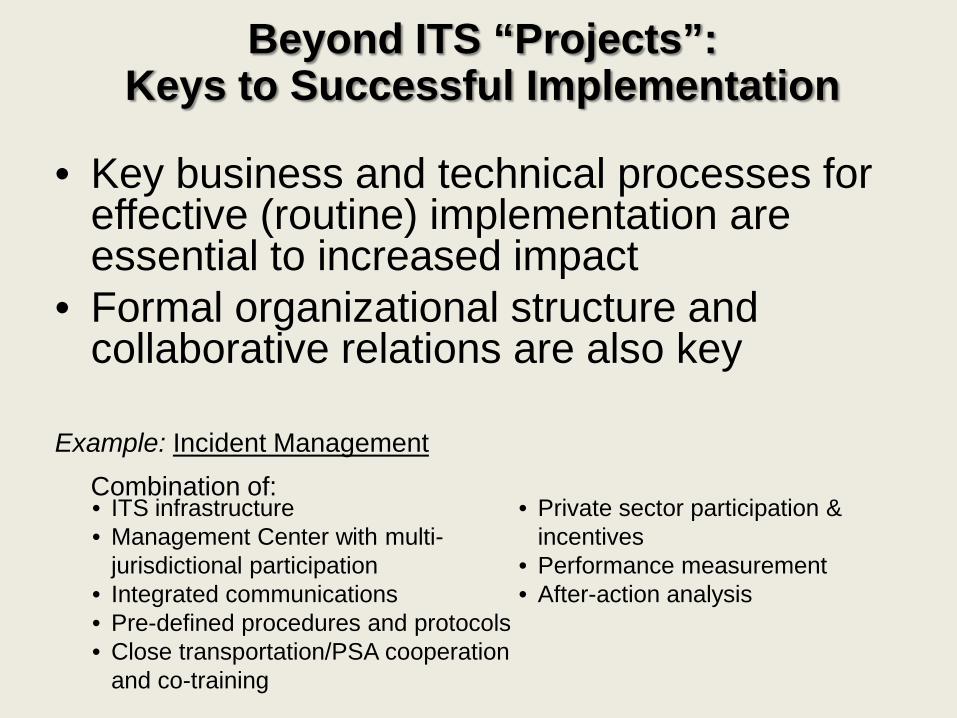
Beyond ITS “Projects”: Keys to Successful Implementation
• Key business and technical processes for effective (routine) implementation are essential to increased impact
• Formal organizational structure and collaborative relations are also key
Example: Incident Management Combination of:
• ITS infrastructure • Management Center with multi-
jurisdictional participation • Integrated communications • Pre-defined procedures and protocols • Close transportation/PSA cooperation
and co-training
• Private sector participation & incentives
• Performance measurement • After-action analysis
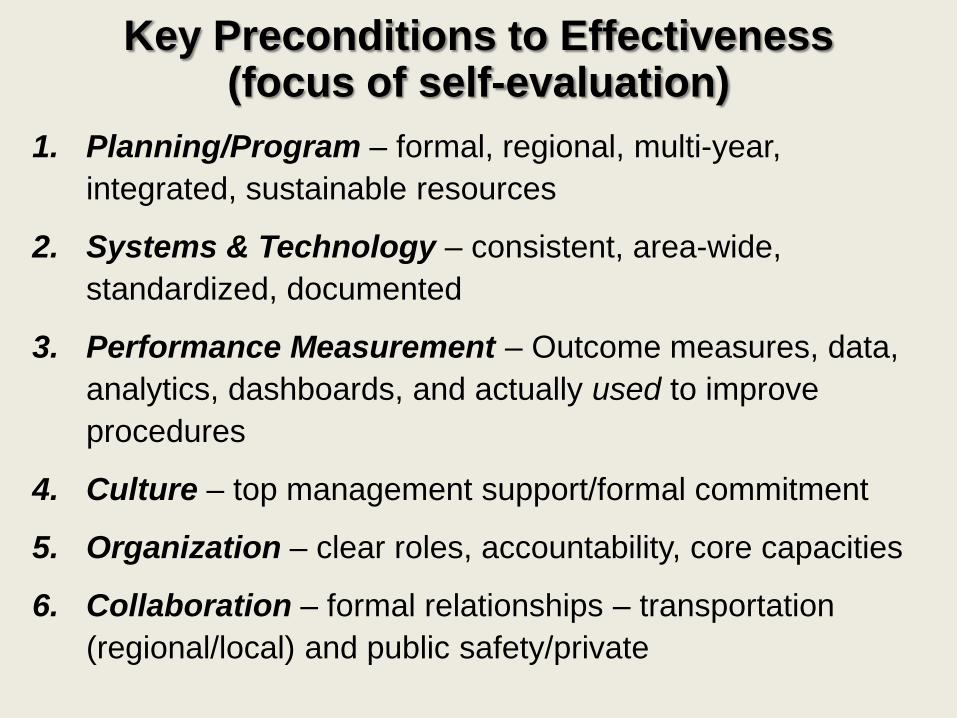
Key Preconditions to Effectiveness (focus of self-evaluation)
1. Planning/Program – formal, regional, multi-year, integrated, sustainable resources
2. Systems & Technology – consistent, area-wide, standardized, documented
3. Performance Measurement – Outcome measures, data, analytics, dashboards, and actually used to improve procedures
4. Culture – top management support/formal commitment
5. Organization – clear roles, accountability, core capacities
6. Collaboration – formal relationships – transportation (regional/local) and public safety/private

Capability Levels (for each dimension)
Where does the region stand For each dimension?
LEVEL 1
Performed• Activities &
relationships ad hoc• Champion-driven
LEVEL 2
Managed• Processes developing• Staff training• Limited accountability
LEVEL 3
Integrated• Process documented• Performance measured• Organization/
partners aligned• Program budgeted
LEVEL 4
Optimized• Performance-based
improvement• Formal program• Formal partnerships
Most Agencies Today
Goal for the Future
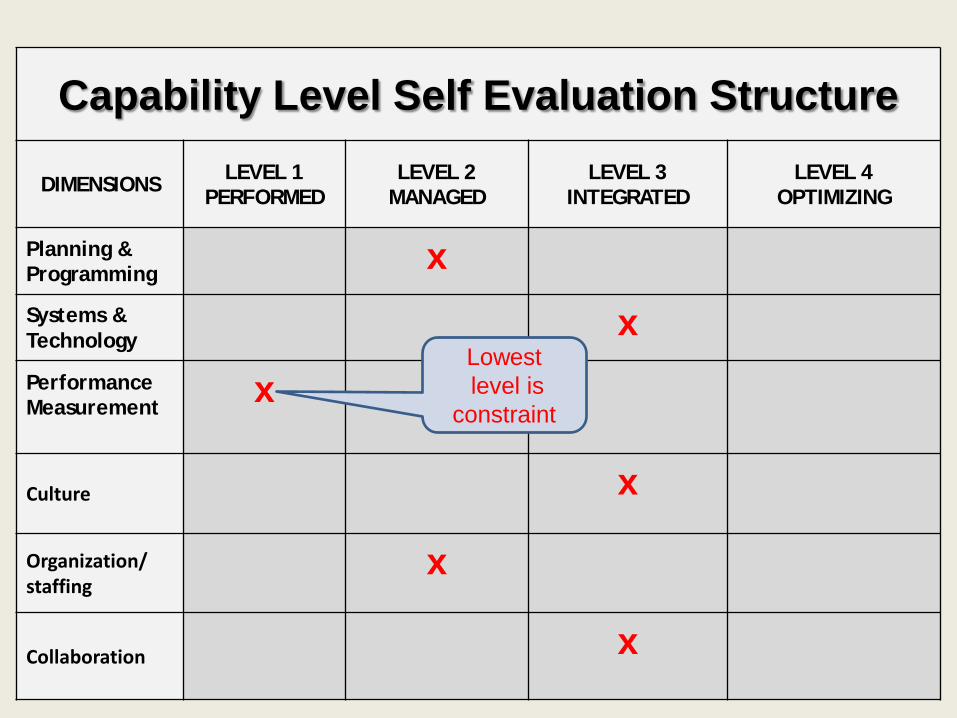
Capability Level Self Evaluation Structure
DIMENSIONS LEVEL 1
PERFORMED LEVEL 2
MANAGED LEVEL 3
INTEGRATED LEVEL 4
OPTIMIZING
Planning & Programming
x Systems & Technology x Performance Measurement
x
Culture x
Organization/ staffing
x
Collaboration x
Lowest level is
constraint
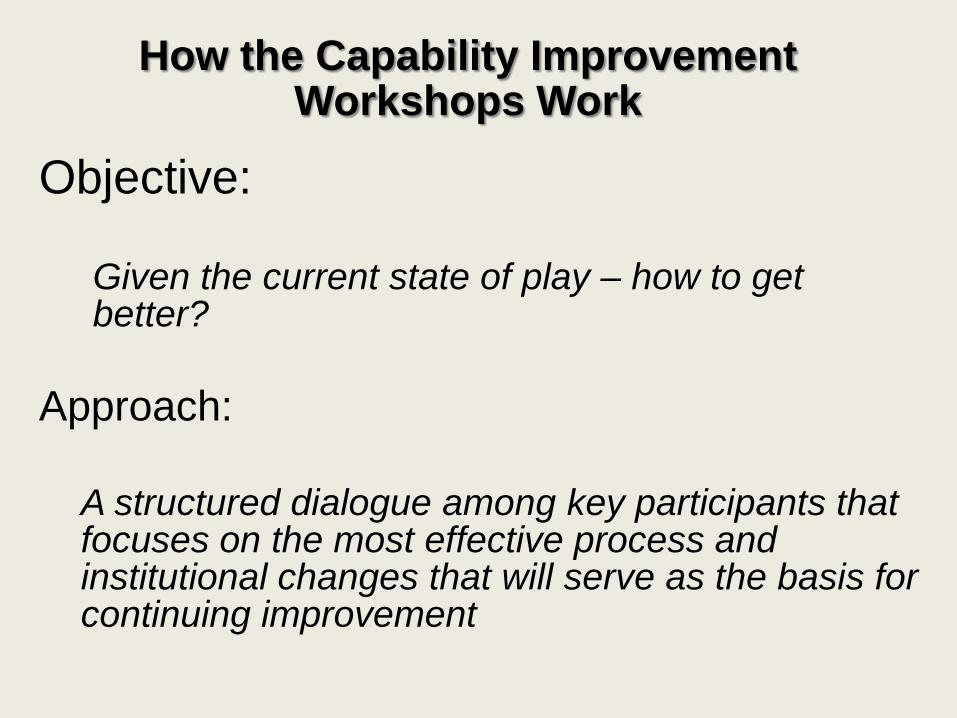
How the Capability Improvement Workshops Work
Objective:
Given the current state of play – how to get better?
Approach:
A structured dialogue among key participants that focuses on the most effective process and institutional changes that will serve as the basis for continuing improvement

CAPABILITY LEVEL DEFINTIONS FOR SELF-EVALUATION OF CURRENT STATE OF PLAY IN THE REGION
DIMENSIONS LEVEL 1
PERFORMED LEVEL 2
MANAGED LEVEL 3
INTEGRATED LEVEL 4
OPTIMIZING
Business Processes
Each jurisdiction doing its own thing according to individual priorities and capabilities
Consensus regional approach developed regarding TSM&O goals, deficiencies, B/C, networks, strategies and common priorities
Regional program integrated into jurisdictions’ overall multimodal transportation plans with related staged program
TSM&O integrated into jurisdictions’ multi-sectoral plans and programs, based on a formal continuing planning processes
Performance Measurement
Some outputs measured and reported by some jurisdictions
Output data used directly for after-action debriefings and improvements; data easily available and dashboarded
Outcome measures identified (networks, modes, impacts) and routinely utilized for objective-based program improvements
Performance measures reported internally for utilization and externally for accountability and program justification
Criteria that Define Levels of Capability (2 of 6 dimensions shown)
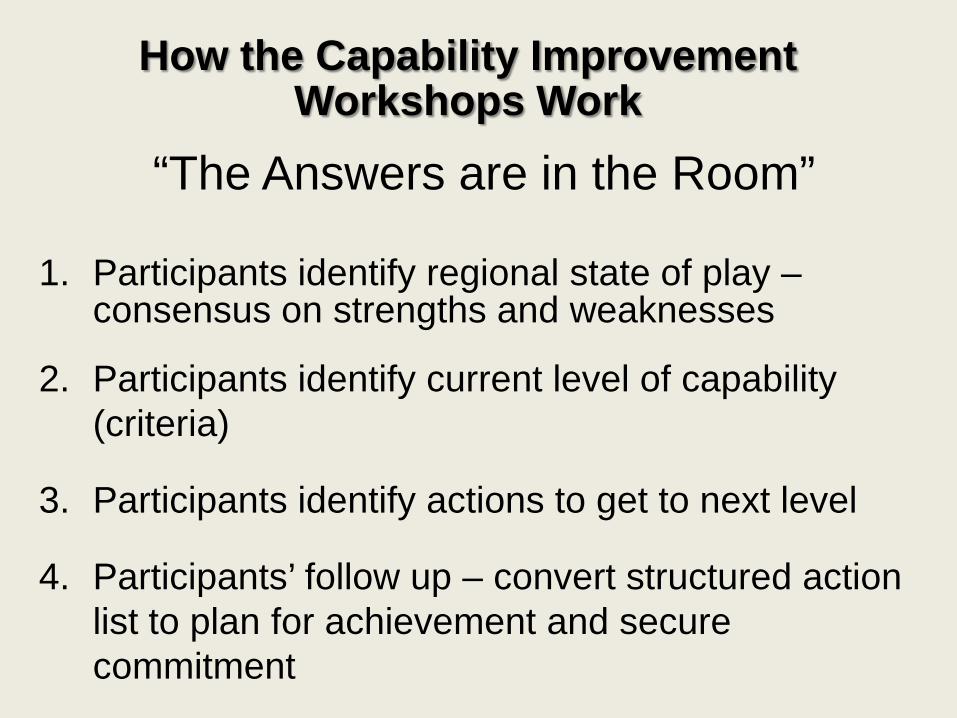
How the Capability Improvement Workshops Work
“The Answers are in the Room” 1. Participants identify regional state of play –
consensus on strengths and weaknesses
2. Participants identify current level of capability (criteria)
3. Participants identify actions to get to next level
4. Participants’ follow up – convert structured action list to plan for achievement and secure commitment
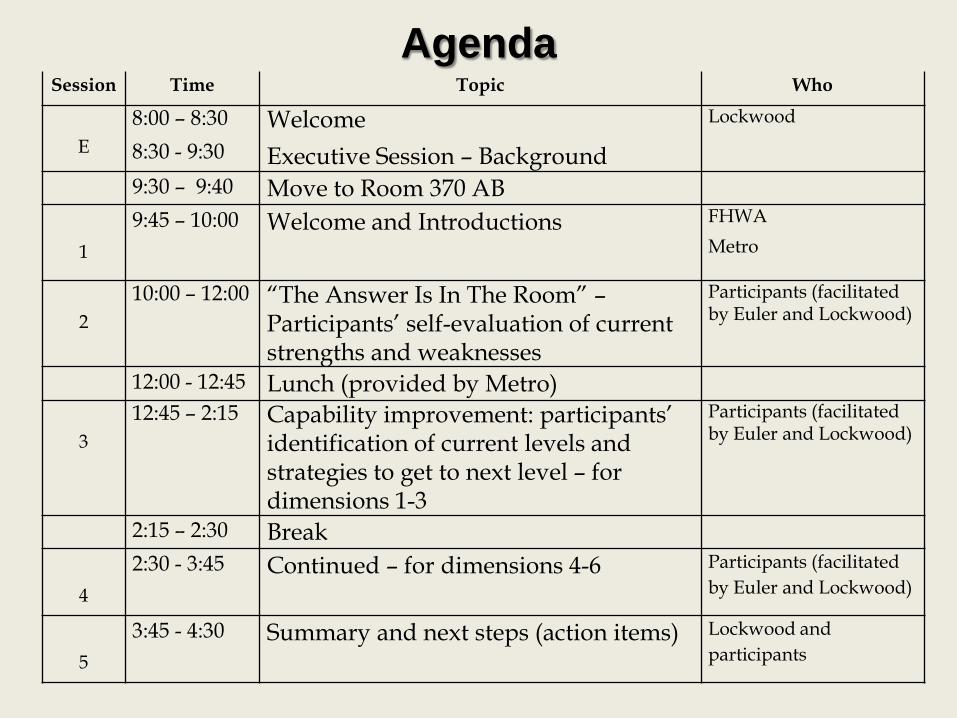
Agenda Session Time Topic Who
E
8:00 – 8:30 8:30 - 9:30
Welcome Executive Session – Background
Lockwood
9:30 – 9:40 Move to Room 370 AB
1 9:45 – 10:00 Welcome and Introductions FHWA
Metro
2
10:00 – 12:00 “The Answer Is In The Room” – Participants’ self-evaluation of current strengths and weaknesses
Participants (facilitated by Euler and Lockwood)
12:00 - 12:45 Lunch (provided by Metro)
3 12:45 – 2:15 Capability improvement: participants’
identification of current levels and strategies to get to next level – for dimensions 1-3
Participants (facilitated by Euler and Lockwood)
2:15 – 2:30 Break
4 2:30 - 3:45 Continued – for dimensions 4-6 Participants (facilitated
by Euler and Lockwood)
5 3:45 - 4:30 Summary and next steps (action items) Lockwood and
participants